5 dr nevin q&a presentation townsville health forum march 2016
TRANSCRIPT
Justification for the trials The report of the mefloquine/tafenoquine trial noted that “concerns about adverse effects” made the prevention of malaria problematic “in soldiers who travel to malaria endemic areas”. No specific safety benefit of mefloquine over doxycycline was articulated at the time of the study to justify its use. Only in later published accounts of the mefloquine/doxycycline trial was it articulated that cases of malaria “believed to have resulted from poor compliance” with doxycycline “provided the stimulus to look at other chemoprophylactic options for soldiers in East Timor”.
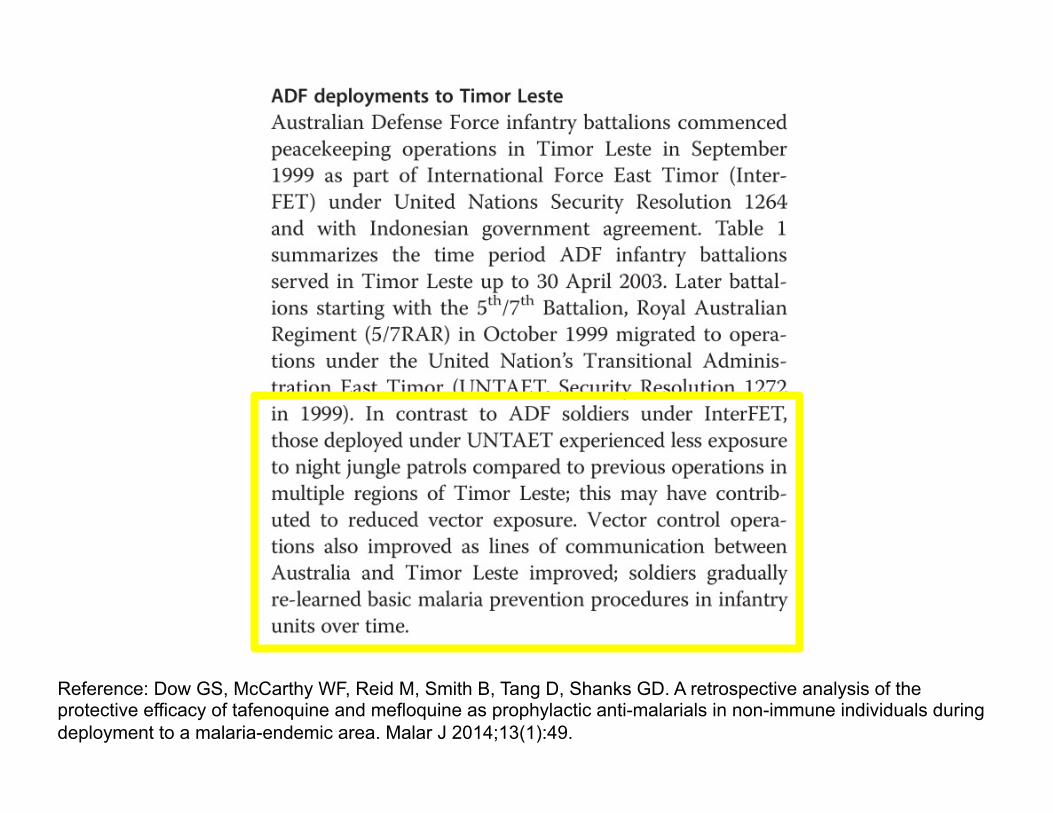
Reference: Dow GS, McCarthy WF, Reid M, Smith B, Tang D, Shanks GD. A retrospective analysis of the protective efficacy of tafenoquine and mefloquine as prophylactic anti-malarials in non-immune individuals during deployment to a malaria-endemic area. Malar J 2014;13(1):49.
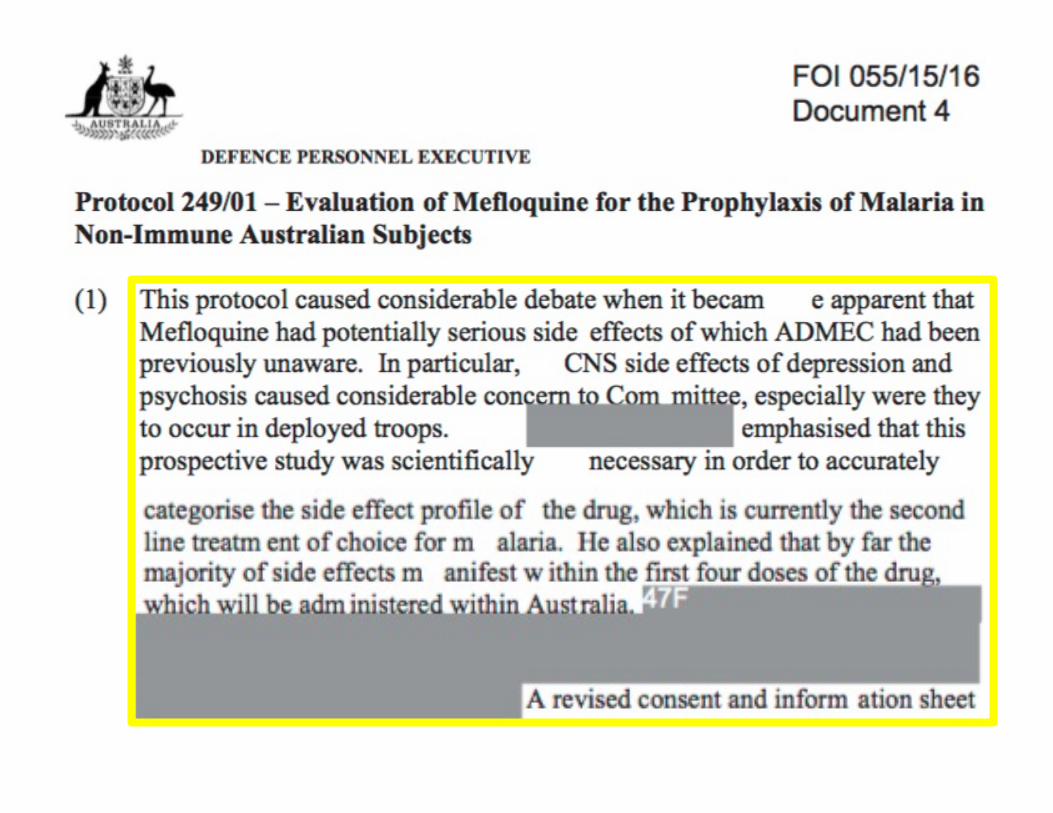
Adequacy of Ethical Oversight There is evidence ADMEC members did not know of mefloquine’s side effects at the time of the tafenoquine trial. Specifically, ADMEC documents revealed that after the tafenoquine trial there was: “…considerable debate when it became apparent that [m]efloquine had potentially serious side effects of which ADMEC had been previously unaware [emphasis added]. In particular, CNS [Central Nervous System] side effects of depression and psychosis caused considerable concern to [the] Committee, especially were they to occur in deployed troops”.

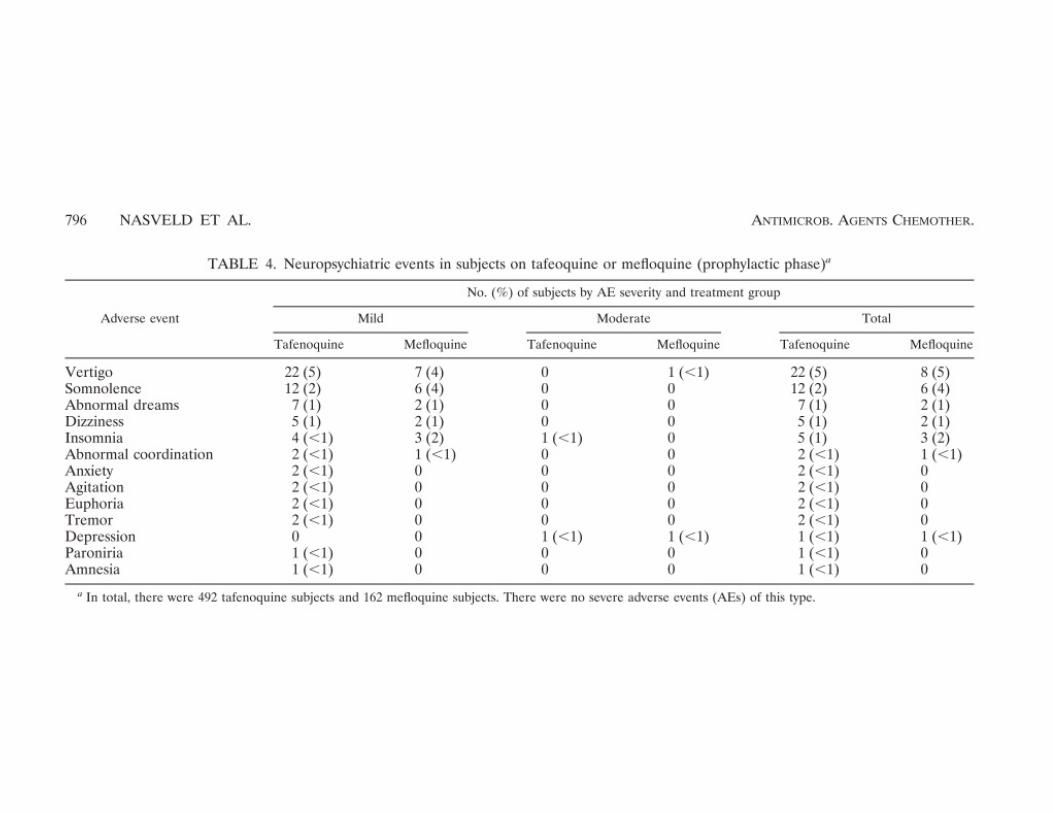
Claims of increased safety of tafenoquine In contrast to ADF claims, the AMI mefloquine/tafenoquine trials revealed a higher incidence of side effects from tafenoquine than mefloquine. Tafenoquine is more neurotoxic than mefloquine
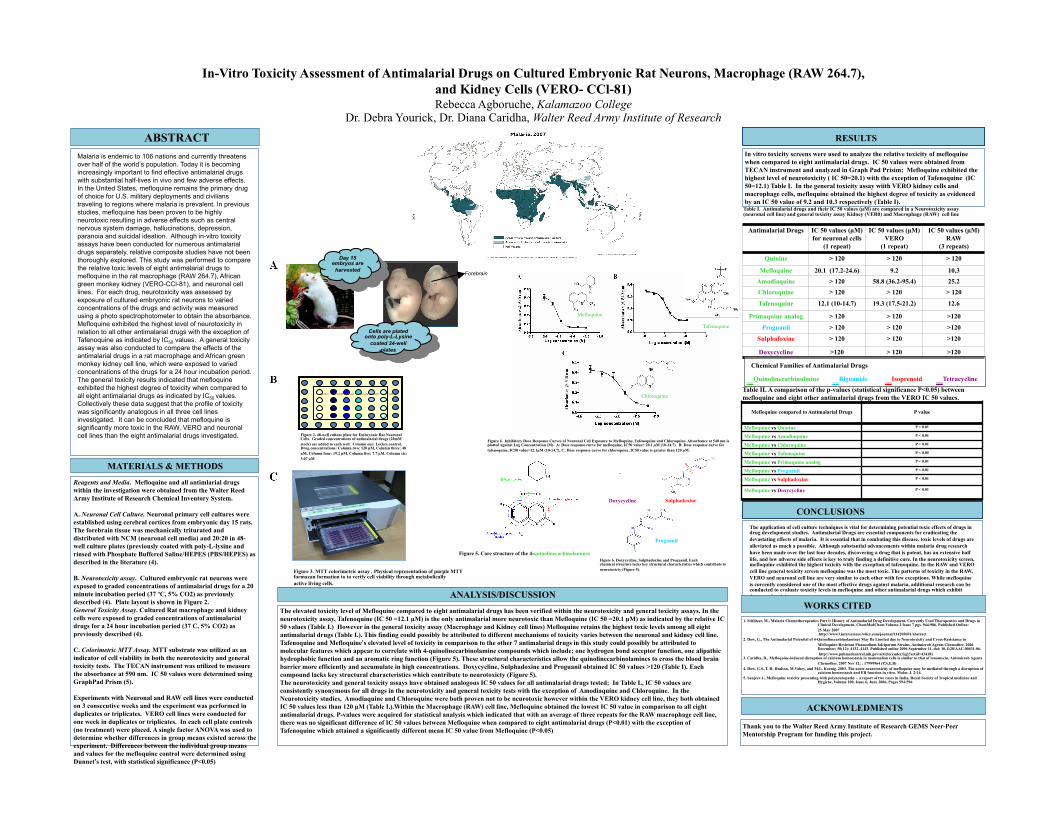
In-Vitro Toxicity Assessment of Antimalarial Drugs on Cultured Embryonic Rat Neurons, Macrophage (RAW 264.7), and Kidney Cells (VERO- CCl-81) Rebecca Agboruche, Kalamazoo College
Dr. Debra Yourick, Dr. Diana Caridha, Walter Reed Army Institute of Research
ABSTRACT Malaria is endemic to 106 nations and currently threatens over half of the world’s population. Today it is becoming increasingly important to find effective antimalarial drugs with substantial half-lives in vivo and few adverse effects. In the United States, mefloquine remains the primary drug of choice for U.S. military deployments and civilians traveling to regions where malaria is prevalent. In previous studies, mefloquine has been proven to be highly neurotoxic resulting in adverse effects such as central nervous system damage, hallucinations, depression, paranoia and suicidal ideation. Although in-vitro toxicity assays have been conducted for numerous antimalarial drugs separately, relative composite studies have not been thoroughly explored. This study was performed to compare the relative toxic levels of eight antimalarial drugs to mefloquine in the rat macrophage (RAW 264.7), African green monkey kidney (VERO-CCl-81), and neuronal cell lines. For each drug, neurotoxicity was assessed by exposure of cultured embryonic rat neurons to varied concentrations of the drugs and activity was measured using a photo spectrophotometer to obtain the absorbance. Mefloquine exhibited the highest level of neurotoxicity in relation to all other antimalarial drugs with the exception of Tafenoquine as indicated by IC50 values. A general toxicity assay was also conducted to compare the effects of the antimalarial drugs in a rat macrophage and African green monkey kidney cell line, which were exposed to varied concentrations of the drugs for a 24 hour incubation period. The general toxicity results indicated that mefloquine exhibited the highest degree of toxicity when compared to all eight antimalarial drugs as indicated by IC50 values. Collectively these data suggest that the profile of toxicity was significantly analogous in all three cell lines investigated. It can be concluded that mefloquine is significantly more toxic in the RAW, VERO and neuronal cell lines than the eight antimalarial drugs investigated.
Reagents and Media. Mefloquine and all antimlarial drugs within the investigation were obtained from the Walter Reed Army Institute of Research Chemical Inventory System. A. Neuronal Cell Culture. Neuronal primary cell cultures were established using cerebral cortices from embryonic day 15 rats. The forebrain tissue was mechanically triturated and distributed with NCM (neuronal cell media) and 20:20 in 48-well culture plates (previously coated with poly-L-lysine and rinsed with Phosphate Buffered Saline/HEPES (PBS/HEPES) as described in the literature (4). B. Neurotoxicity assay. Cultured embryonic rat neurons were exposed to graded concentrations of antimalarial drugs for a 20 minute incubation period (37 ºC, 5% CO2) as previously described (4). Plate layout is shown in Figure 2. General Toxicity Assay. Cultured Rat macrophage and kidney cells were exposed to graded concentrations of antimalarial drugs for a 24 hour incubation period (37 C, 5% CO2) as previously described (4). C. Colorimetric MTT Assay. MTT substrate was utilized as an indicator of cell viability in both the neurotoxicity and general toxicity tests. The TECAN instrument was utilized to measure the absorbance at 590 nm. IC 50 values were determined using GraphPad Prism (5). Experiments with Neuronal and RAW cell lines were conducted on 3 consecutive weeks and the experiment was performed in duplicates or triplicates. VERO cell lines were conducted for one week in duplicates or triplicates. In each cell plate controls (no treatment) were placed. A single factor ANOVA was used to determine whether differences in group means existed across the experiment. Differences between the individual group means and values for the mefloquine control were determined using Dunnet’s test, with statistical significance (P<0.05)
RESULTS
Control 120µM 48 µM 19.2 µM 7.7µM 3.1 µM
Antimalarial Drugs IC 50 values (µM) for neuronal cells
(1 repeat)
IC 50 values (µM) VERO
(1 repeat)
IC 50 values (µM) RAW
(3 repeats)
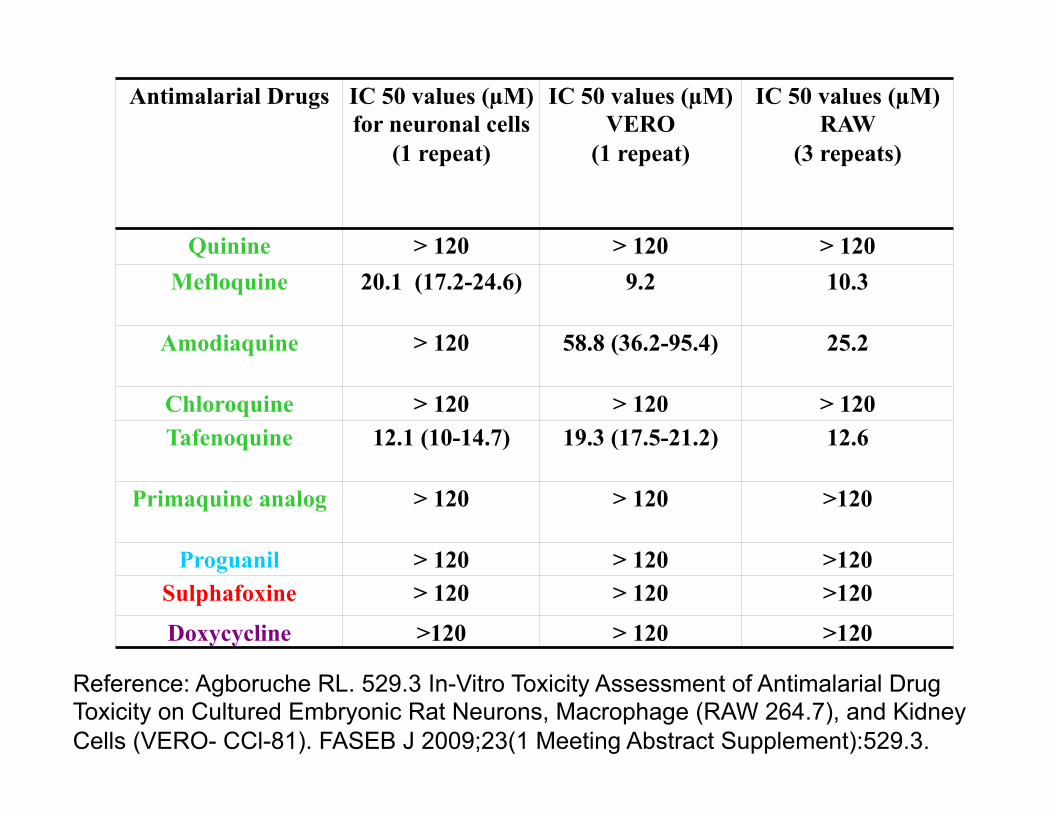
Quinine > 120 > 120 > 120
Mefloquine 20.1 (17.2-24.6) 9.2 10.3 Amodiaquine > 120 58.8 (36.2-95.4) 25.2 Chloroquine > 120 > 120 > 120
Tafenoquine 12.1 (10-14.7) 19.3 (17.5-21.2) 12.6
Primaquine analog > 120 > 120 >120
Proguanil > 120 > 120 >120
Sulphafoxine > 120 > 120 >120
Doxycycline >120 > 120 >120
Table I. Antimalarial drugs and their IC 50 values (µM) are compared in a Neurotoxicity assay (neuronal cell line) and general toxicity assay Kidney (VER0) and Macrophage (RAW) cell line
Figure 2. 48-well culture plate for Embryonic Rat Neuronal Cells. Graded concentrations of antimalarial drugs (20mM stock) are added to each well. Column one: Lockes control, Drug concentrations: Column two: 120 µM, Column three: 48 µM, Column four: 19.2 µM, Column five: 7.7 µM, Column six: 3.07 µM
ANALYSIS/DISCUSSION The elevated toxicity level of Mefloquine compared to eight antimalarial drugs has been verified within the neurotoxicity and general toxicity assays. In the neurotoxicity assay, Tafenoquine (IC 50 =12.1 µM) is the only antimalarial more neurotoxic than Mefloquine (IC 50 =20.1 µM) as indicated by the relative IC 50 values (Table I.) However in the general toxicity assay (Macrophage and Kidney cell lines) Mefloquine retains the highest toxic levels among all eight antimalarial drugs (Table I.). This finding could possibly be attributed to different mechanisms of toxicity varies between the neuronal and kidney cell line. Tafenoquine and Mefloquine’s elevated level of toxicity in comparison to the other 7 antimalarial drugs in this study could possibly be attributed to molecular features which appear to correlate with 4-quinolinecarbinolamine compounds which include; one hydrogen bond acceptor function, one alipathic hydrophobic function and an aromatic ring function (Figure 5). These structural characteristics allow the quinolinecarbinolamines to cross the blood brain barrier more efficiently and accumulate in high concentrations. Doxycycline, Sulphadoxine and Proguanil obtained IC 50 values >120 (Table I). Each compound lacks key structural characteristics which contribute to neurotoxicty (Figure 5). The neurotoxicity and general toxicity assays have obtained analogous IC 50 values for all antimalarial drugs tested; In Table I., IC 50 values are consistently synonymous for all drugs in the neurotoxicity and general toxicity tests with the exception of Amodiaquine and Chloroquine. In the Neurotoxicity studies, Amodiaquine and Chloroquine were both proven not to be neurotoxic however within the VERO kidney cell line, they both obtained IC 50 values less than 120 µM (Table I.).Within the Macrophage (RAW) cell line, Mefloquine obtained the lowest IC 50 value in comparison to all eight antimalarial drugs. P-values were acquired for statistical analysis which indicated that with an average of three repeats for the RAW macrophage cell line, there was no significant difference of IC 50 values between Mefloquine when compared to eight antimalarial drugs (P<0.01) with the exception of Tafenoquine which attained a significantly different mean IC 50 value from Mefloquine (P<0.05)
CONCLUSIONS The application of cell culture techniques is vital for determining potential toxic effects of drugs in drug development studies. Antimalarial Drugs are essential components for eradicating the devastating effects of malaria. It is essential that in combating this disease, toxic levels of drugs are alleviated as much a possible. Although substantial advancements within malaria drug research have been made over the last four decades, discovering a drug that is potent, has an extensive half life, and low adverse side effects is key to truly finding a definitive cure. In the neurotoxicity screen, mefloquine exhibited the highest toxicity with the exception of tafenoquine. In the RAW and VERO cell line general toxicity screen mefloquine was the most toxic. The patterns of toxicity in the RAW, VERO and neuronal cell line are very similar to each other with few exceptions. While mefloquine is currently considered one of the most effective drugs against malaria, additional research can be conducted to evaluate toxicity levels in mefloquine and other antimalarial drugs which exhibit degrees of toxicity.
WORKS CITED 1. Schlitzer, M., Malaria Chemotherapeutics Part I: History of Antimalarial Drug Development, Currently Used Therapeutics and Drugs in
Clinical Development, ChemMedChem Volume 2 Issue 7 pgs. 944-986, Published Online: 25 May 2007
http://www3.interscience.wiley.com/journal/114269691/abstract 2. Dow, G., The Antimalarial Potential of 4-Quinolinecarbinolamines May Be Limited due to Neurotoxicity and Cross-Resistance in
Mefloquine-Resistant Plasmodium falciparum Strains, Antimicrob Agents Chemother. 2006 December; 50(12): 4132–4143. Published online 2006 September 11. doi: 10.1128/AAC.00631-06.
http://www.pubmedcentral.nih.gov/articlerender.fcgi?artid=434181 3. Caridha, D., Mefloquine-induced disruption of calcium homeostasis in mammalian cells is similar to that of ionomycin, Antimicrob Agents
Chemother. 2007 Nov 12; : 17999964 (P,S,E,B) 4. Dow, G.S.,T. H. Hudson, M.Vahey, and M.L. Koenig. 2003. The acute neurotoxicity of mefloquine may be mediated through a disruption of
calcium homeostasis and ER function in vitro. Malar. J. 2:14. 5. Sanjeev J., Mefloquine toxicity presenting with polyneuropathy – a report of two cases in India, Royal Society of Tropical medicine and
Hygiene, Volume 100, Issue 6, June 2006, Pages 594-596
Mefloquine compared to Antimalarial Drugs
P value
Mefloquine vs Quinine P < 0.01
Mefloquine vs Amodiaquine P < 0.01
Mefloquine vs Chloroquine P < 0.01
Mefloquine vs Tafenoquine P < 0.05
Mefloquine vs Primaquine analog P < 0.01
Mefloquine vs Proguanil P < 0.01
Mefloquine vs Sulphadoxine P < 0.01
Mefloquine vs Doxycycline P < 0.01
Table II. A comparison of the p-values (statistical significance P<0.05) between mefloquine and eight other antimalarial drugs from the VERO IC 50 values.
In vitro toxicity screens were used to analyze the relative toxicity of mefloquine when compared to eight antimalarial drugs. IC 50 values were obtained from TECAN instrument and analyzed in Graph Pad Prisim; Mefloquine exhibited the highest level of neurotoxicity ( IC 50=20.1) with the exception of Tafenoquine (IC 50=12.1) Table I. In the general toxicity assay wiith VERO kidney cells and macrophage cells, mefloquine obtained the highest degree of toxicity as evidenced by an IC 50 value of 9.2 and 10.3 respectively (Table I).
Cells are plated onto poly-L-Lysine
coated 24-well plates
MATERIALS & METHODS
Forebrain
Figure 3. MTT colorimetric assay . Physical representation of purple MTT formazan formation to to verify cell viability through metabolically active living cells.
Figure 5. Core structure of the 4-quinolinecarbinolamines
Day 15 embryos are
harvested
Figure 4. Inhibitory Dose Response Curves of Neuronal Cell Exposure to Mefloquine, Tafenoquine and Chloroquine. Absorbance at 540 nm is plotted against Log Concentration (M). A: Dose response curve for mefloquine, IC50 value= 20.1 µM (10-14.7). B: Dose response curve for tafenoquine, IC50 value=12.1µM (10-14.7). C: Dose response curve for chloroquine ,IC50 value is greater than 120 µM.
ACKNOWLEDMENTS
Thank you to the Walter Reed Army Institute of Research GEMS Neer-Peer Mentorship Program for funding this project.
Mefloquine
Tafenoquine
Chloroquine
Doxycycline
Sulphadoxine
Figure 6. Doxycycline, Sulphadoxine and Proguanil. Each chemical structure lacks key structural characteristics which contribute to neurotoxicty (Figure 5).
Proguanil
__Quinolinecarbinolmine __Biguanide __Tetracycline __Isoprenoid Chemical Families of Antimalarial Drugs
Antimalarial Drugs IC 50 values (µM) for neuronal cells
(1 repeat)
IC 50 values (µM) VERO
(1 repeat)
IC 50 values (µM) RAW
(3 repeats)
Quinine > 120 > 120 > 120 Mefloquine 20.1 (17.2-24.6) 9.2 10.3
Amodiaquine > 120 58.8 (36.2-95.4) 25.2
Chloroquine > 120 > 120 > 120 Tafenoquine 12.1 (10-14.7) 19.3 (17.5-21.2) 12.6
Primaquine analog > 120 > 120 >120
Proguanil > 120 > 120 >120 Sulphafoxine > 120 > 120 >120
Doxycycline >120 > 120 >120
Reference: Agboruche RL. 529.3 In-Vitro Toxicity Assessment of Antimalarial Drug Toxicity on Cultured Embryonic Rat Neurons, Macrophage (RAW 264.7), and Kidney Cells (VERO- CCl-81). FASEB J 2009;23(1 Meeting Abstract Supplement):529.3.