4.8 sand filters bmp summary fact sheets - city of...
TRANSCRIPT

4.8 Sand Filters BMP Summary Fact Sheets
Description: Multi-chamber structure designed to treat storm water runoff through filtration, using a sediment forebay, a sand bed as its primary filter media and, typically, an underdrain collection system. It can be configured as either a surface or subsurface facility. In sand filter systems, storm water pollutants are removed primarily through filtration with some additional treatment from gravitational settling and adsorption.
IMPORTANT CONSIDERATIONS
STORMWATER MANAGEMENT SUITABILITY
DESIGN CRITERIA: • A sediment chamber that contains 20 percent of the water
quality volume is required as a pretreatment device. • The underdrain system must be designed so that runoff
exits the facility within design duration assuming 50 percent of the underdrain capacity is lost due to clogging.
• Maximum contributing drainage area is 10 acres. • No runoff should enter the filter’s sand bed until the
upstream drainage area is completely stabilized. • The filtration media surface must be sized using Darcy’s
equation with an average filtration rate of 1.75 inches/hour. • Maximum ponding depth for water quality storm is 24 inches
with an additional 36 inches for more severe storm events. • The filter media must be designed to drain and re-aerate
between storm events. • The top of the filter media must be flat. ADVANTAGES/BENEFITS: • Normally used in highly impervious areas. • Good retrofit capability. • Can be located underground with limited surface space. • Larger units can be used to partially attenuate runoff peaks. DISADVANTAGES/LIMITATIONS: • High maintenance burden. • Typically needs to be combined with other controls to
provide water quantity control. • Not recommended for areas with high sediment content in
storm water or clay/silt runoff areas. • Relatively costly. • Possible odor problems. • Infiltration and internal water storage techniques are
allowed. MAINTENANCE CONSIDERATIONS: • Inspect for clogging – rake debris screen and first inch of
sand. • Remove sediment from forebay/chamber when more than 1
foot of storage is lost. • Sediment, topsoil, and 3 inches of filter material must be
removed after the allowable drawdown time is exceeded by 25 percent.
• Entire filter material and underdrain system must be replaced if removal of 3 inches of media does not restore filtration rate.
L = Low M = Moderate H = High
H 1-inch, 6-hr Water Quality Protection M 1-yr, 24-hr Channel Protection Volume M Peak Attenuation Control for 10-yr, 6-hr Storm M Peak Attenuation Control for 25-yr, 6-hr storm
Sand filter facilities are highly effective in controlling pollution removal for the 1-inch, 6-hour storm and can be designed to control the volume of the 1-yr, 24-hr storm and a portion of peak attenuation for larger storm events.
IMPLEMENTATION CONSIDERATIONS
L Land Requirements H Capital Cost H Maintenance Cost H Maintenance Considerations
PRIMARY POLLUTANT REMOVAL PROCESSES
• Filtration
POLLUTANT REMOVAL RATES
Effectiveness Detention
Time Media Depth
Max. PIndex
Pollutant Removal
Rates Optimal
Efficiency 2.0 days 2.5
feet 50
ppm 85% TSS 70% TP
Standard Efficiency
1.0 days 2.0 feet
50 ppm
70% TSS 35% TP
TSS-only Efficiency
2.0 days 2.5 feet
N/A 85% TSS

Charlotte-Mecklenburg BMP Design Manual July 1, 2013
4.8.1
4.8 Sand Filters 4.8.1 General Description Sand filters are structural storm water controls that capture and temporarily store storm water runoff and pass it through a filter bed of sand. Most sand filter systems consist of two-chambers. The first chamber, the sediment forebay, removes floatables and heavy sediments. The second chamber, the filtration chamber, removes additional pollutants and finer sediments by filtering the runoff through a sand bed. The filtered runoff is collected by an underdrain and discharged. Sand filters can be used on development sites where the use of other controls may be precluded. There are two primary sand filter types, the surface sand filter and the underground sand filter: Surface Sand Filter – The surface sand filter is a ground level open air facility that consists of a sediment forebay and a filter bed chamber. Surface sand filters can be designed as an excavation, with earthen embankments, or as a concrete or block structure. A surface sand filter facility consists of a two-chamber open-air structure, which is located at ground-level. The first chamber is the sediment chamber while the second chamber houses the sand filter bed. Flow enters the sedimentation chamber where settling of larger sediment particles occurs. Runoff is then discharged from the sedimentation chamber through a perforated standpipe into the filtration chamber. After passing through the filter bed, runoff is collected by a perforated pipe and gravel underdrain system. Figure 4.8.1 and 4.8.2 illustrate a typical surface sand filter. Underground Sand Filter – The underground sand filter is located in a vault, and is intended primarily for extremely space limited and high density areas. The underground sand filter is a two-chamber system with an optional third chamber for peak or volume attenuation and to collect and combine the filtered runoff with overflow runoff. The initial chamber is a sedimentation chamber that temporarily stores runoff and utilizes the storage area to capture sediment. The sedimentation chamber is separated from the sand filter chamber by a submerged wall that protects the filter bed from oil, trash, and large particle sediment. The filter bed should be a minimum of 2.0 feet or 2.5 feet deep depending upon design selected, and may have a protective screen of gravel or permeable geotextile to limit clogging. The sand filter chamber also includes an underdrain system with inspection and clean out wells. Perforated drain pipes under the sand filter bed extend into the downstream system or the optional third chamber that collects filtered runoff. Flows beyond the filter capacity are diverted through an overflow weir. Underground sand filters are typically constructed on-line, but can be constructed off-line. For off-line construction, the overflow between the second and third chambers may not be required. The underground vault must be tested for water tightness prior to placement of filter layers. Figure 4.8.5 illustrates a typical underground sand filter.
Figure 4.8.1 Surface Sand Filter

Charlotte-Mecklenburg BMP Design Manual July 1, 2013
4.8.2
Figure 4.8.2 Schematic of Surface Sand Filter
Source: Center for Watershed Protection

Charlotte-Mecklenburg BMP Design Manual July 1, 2013
4.8.3
Figure 4.8.3 Schematic of Underground Sand Filter Source: Center for Watershed Protection
4.8.2 Storm Water Management Suitability Sand filter systems are designed primarily for storm water quality and will typically need to be used in conjunction with another structural control to provide downstream channel protection and peak discharge control. Under certain circumstances, filters can provide runoff quantity control, particularly for smaller storm events and large filters. It is important to ensure that a sand filter facility is designed to safely bypass high flows by either preventing the high flows from entering the facility or by ensuring that the high flows do not create erosive conditions if they enter the facility. Water Quality Control (WQv) In sand filter systems, storm water pollutants are removed through a combination of gravitational settling, filtration, and adsorption. The filtration process removes suspended solids and particulates, biochemical oxygen demand (BOD), fecal coliform bacteria, and other pollutants. Surface sand filters with a grass cover have opportunities for bacterial decomposition as well as vegetation uptake of pollutants, particularly nutrients. Channel Protection (CPv) For smaller sites, a sand filter may be designed to capture the entire channel protection volume CPv in either an off- or on-line configuration. Given that a sand filter system is typically designed to completely

Charlotte-Mecklenburg BMP Design Manual July 1, 2013
4.8.4
drain over 1 to 2 days, the requirement of controlling the 1-year, 24-hour storm runoff volume could be met. For larger sites or where only the WQv is diverted to the sand filter facility, another structural control must be used to provide CPv volume control. Peak Attenuation Control (Qp) In most cases, another structural control must be used in conjunction with a sand filter system to reduce the post-development peak flow to pre-development levels (detention) if needed. However, if designed with sufficient volume (stage), the peak attenuation control for the 10- and/or 25-year, 6-hour storms may be controlled by the sand filter facility. Sand filter facilities must provide flow diversion or be designed to safely pass extreme storm flows and protect the filter bed and facility. A maximum ponding depth of 5 feet above the filter media must be maintained during all storm events greater than the 1-inch, 6-hour storm event, up to the 50-year, 6-hour storm. 4.8.3 Pollutant Removal Capabilities Three sand filter designs have been developed for application in the Mecklenburg County area. The optimal efficiency design has the capability to remove 85% of the total suspended solids and 70% of the total phosphorus load. The standard efficiency design has the capability to remove 70% of the total suspended solids and 35% of the total phosphorus load. The TSS-only design has the capability to remove 85% of the total suspended solids and 0% of the total phosphorus loads. All of these designs assume urban post-development runoff conditions that has been observed in the Mecklenburg County area and that the facilities are sized, designed, constructed, and maintained in accordance with the appropriate recommended specifications contained in this manual. The design pollutant removal rates are derived from sampling data and computations completed for the development of this manual. In a situation where a removal rate is not deemed sufficient, additional controls may be put in place at the given site in a series or treatment train approach. See section 4.8.4 for a discussion of design variables and appropriate pollutant removal rates for specific designs. 4.8.4 Planning and Design Criteria The following criteria are to be considered minimum standards for the design of sand filters. Items listed in Section 4.1.4.A through 4.1.4.H. are requirements and must be addressed in the design. Items listed in Section 4.1.4.I. are recommendations and are optional. A. Design Requirements Following is a list of design requirements that must be followed in the design of sand filters. • Following are the design values that are required for the three sand filter designs that are available for
application in Mecklenburg County. The appropriate minimum design values and associated pollutant removal rates for each of the design are given in Table 4.8.1.
Table 4.8.1 Design Values and Pollution Removal Rates
Threshold Minimum Detention Time
Minimum Media Depth
Maximum PIndex
Pollution Removal Rate
Optimal Efficiency
2.0 days
2.5 feet
50 ppm
85% TSS 70% TP
Standard Efficiency
1.0 days
2 feet
50 ppm
70% TSS 35% TP
TSS-only Efficiency
2.0 days
2.5 feet
N/A
85% TSS

Charlotte-Mecklenburg BMP Design Manual July 1, 2013
4.8.5
• A sediment chamber is required as a pretreatment device for all sand filters. The sedimentation
chamber storage area must be sized to hold 20 percent of the water quality volume.
• For above ground sand filters, the sedimentation chamber bottom elevation must be above the top of the filter media elevation.
• Sand filters require a sand filter media with a gravel and perforated pipe underdrain system. The
underdrain system must not limit outflow more than the filter media and must be designed so that runoff exits the facility within the design duration. The underdrain system (pipe capacity and orifice capacity) must be designed assuming that 50 percent of the capacity is lost due to clogging.
• The underdrain collection system should be equipped with 6-inch minimum perforated Schedule 40 or
stronger PVC pipe or double wall HDPE pipe. Perforations shall be per AASHTO M278 for PVC pipe, AASHTO M252 for double wall HDPE pipe, or be 3/8-inch in diameter spaced 3 inches on center along 4 longitudinal rows that are spaced 90° apart. The pipes shall have a minimum slope of 0.5% and a maximum spacing of 10 feet on center.
• An internal water storage (IWS) system is allowed, provided that the filter media and underdrain
system are designed per requirements, specifications and calculations for infiltration provided in Chapter 18 of the NCDENR Stormwater BMP Manual. If IWS is used, the WQv should infiltrate the soil within 48 hours.
• Cleanouts of 6-inch solid PVC must be provided for every 50 linear feet of underdrain, at all bends,
and ends of the system for maintenance purposes. The top of the cleanouts should extend 6 inches above the top of filter and have a watertight, vandal proof cap. At least one cleanout shall be installed as an emergency drain that is flush with the top of filter and have a 6-inch threaded extension pipe. The furthest cleanout from the outlet must have the minimum required filter media depth.
• Underdrain pipes must be placed in the bottom of a 12-inch minimum gravel layer. The gravel shall
be #57 washed stone and must provide a minimum of 4 inches of cover over the pipe(s). • The top of the sand filter media must be protected. Washed sod, filter fabric with number 2 stone on
top, or a 1-inch thick debris screen should be used to prevent large floatables from clogging the system.
• The maximum contributing drainage area for a surface sand filter is 10 acres. The maximum
drainage area for a perimeter sand filter is 2 acres. The maximum drainage area for an underground sand filter is 5 acres.
• Sand filter systems are designed for intermittent flow and must be allowed to drain and re-aerate
between rainfall events. They must not be used on sites with a continuous flow from groundwater, sump pumps, or other sources.
• No runoff should enter the filter’s sand bed until the upstream drainage area is completely stabilized
and site construction if completed. Any disturbed areas within the drainage area must be identified and stabilized. Filtration controls must only be constructed after the construction site is stabilized.
• The filtration media surface area should be sized using Darcy’s equation using an average filtration
rate of 1.75 inches/hour.
Af= (WQv)(df) / [(k)(hf + df)(tf)] where: Af = surface area of sand filter media (ft2)

Charlotte-Mecklenburg BMP Design Manual July 1, 2013
4.8.6
WQv = water quality control volume (ft3) df = filter bed depth (2.0’ or 2.5’ per design) k = coefficient of permeability of filter media (3.5 ft/day) hf = average height of water above filter bed (1.0’ maximum) tf = design filter bed drain time (days) • Maximum ponding depth for the water quality storm event is 24 inches with an additional 36 inches
for more severe storm events. • All embankments shall be designed per the North Carolina Dam Safety Law of 1967, if applicable,
and designed according to the requirements in Section 4.0.6 of this manual • The top of a sand filter must be flat.
• For underground sand filters, the minimum distance from the top of sand to the inside top of the
structure is 5 feet. B. Physical Specifications/Geometry Figure 4.8.4 illustrates the various components of a sand filter.
Figure 4.8.4 Surface Sand Filter Volumes Source: Claytor and Schueler, 1996
The filter media consists of a 2.0 to 2.5 feet layer of clean washed medium sand (meeting ASTM C33 concrete sand specifications ) on top of the gravel and underdrain system. A 1-inch thick debris screen must be placed on top of the sand filter media to prevent large floatables from clogging the system. Permeable filter fabric is placed both above and below the sand bed to prevent clogging of the sand filter and the underdrain system. A proper fabric selection with equal pore-openings is critical. Figure 4.8.5 illustrates a typical media cross section. The structure of the surface sand filter may be constructed of impermeable media such as concrete, or through the use of excavations and earthen embankments. When constructed with earthen walls/embankments, filter fabric should be used to line the bottom and side slopes of the structures before installation of the underdrain system and filter media.

Charlotte-Mecklenburg BMP Design Manual July 1, 2013
4.8.7
Figure 4.8.5 Typical Sand Filter Media Cross Sections Source: Claytor and Schueler, 1996
C: Pretreatment/Inlets
• Pretreatment of runoff in a sand filter system is provided by the sedimentation chamber.
• Inlets to surface sand filters must be provided with energy dissipators. Exit velocities from the
sedimentation chamber must be sheet flow to prevent filter media erosion. • Figure 4.8.9 shows a typical inlet pipe from the sedimentation basin to the filter media basin for the
surface sand filter.
D. Outlet Structures Outlet pipe must be provided from the underdrain system to the facility discharge. Due to the slow rate of filtration, outlet protection is generally unnecessary (except for emergency overflows and spillways). If all storms are being routed through the outlet, outlet protection may be required. E. Emergency Spillway An emergency or bypass spillway must be included in the sand filter to safely pass flows that exceed the design storm flows. The spillway prevents filter water levels from overtopping the internal baffle walls or embankments in a manner that can cause structural damage to the filter media or other surrounding features. F. Maintenance Access Adequate access must be provided for all sand filter systems for inspection and maintenance, including the appropriate equipment and vehicles. Access grates to the filter bed must be included in a perimeter and underground sand filter design. The access location must be spaced so that all underground locations are within 25 feet from surface access. Facility designs must enable maintenance personnel to easily replace upper layers of the filter media. See appropriate jurisdiction’s land development standards manual for the width of the required easement (PCCE or SDE).

Charlotte-Mecklenburg BMP Design Manual July 1, 2013
4.8.8
G. Safety Features Surface sand filter facilities can be fenced to restrict access from non-approved personnel. H. Landscaping Surface filters can be designed with a grass cover to aid in pollutant removal and prevent clogging. The grass must be capable of withstanding frequent periods of inundation and drought. I. Design Recommendations In addition to the design requirements and variables, following are some design recommendations that should be considered for sand filter design. • Sand filter systems are generally applied to land uses with a high percentage of impervious surfaces.
Sites with less than 50% imperviousness or high clay/silt sediment loads must not use a sand filter unless additional pretreatment is considered to reduce the potential clogging and failure of the filter bed.
• Surface sand filters are generally used in an off-line configuration where the water quality volume
(WQv) is diverted to the filter facility through the use of a flow diversion structure and flow splitter. In many cases, storm water flows greater than the WQv are diverted to other controls or downstream using a diversion structure or flow splitter.
• Perimeter sand filters are typically sited along the edge, or perimeter, of an impervious area such as a
parking lot. • For a surface sand filter, a 2-foot separation is recommended between the bottom of the sand filter
and the elevation of the seasonally high water table. 4.8.5 Design Procedures Following are the design procedures to be used for the design of sand filters.
Step 1 Using the BMP Selection Matrix presented at the beginning of Chapter 4 determine if the development site and conditions are appropriate for the use of a sand filter facility.
Step 2 Consider any special site-specific design conditions and check to determine if there are
any additional restrictions and/or surface water or watershed requirements that may apply.
Step 3 Compute water quality volume (WQv) using equations 3.2 and 3.3 – WQv = 1.0RvA/12. Step 4 Compute site hydrologic parameters using the SCS procedures and/or computer models
that use the SCS procedures. Step 5 Compute water quality peak flow (WQp) using equation 3.4 for a modified curve number
and the SCS hydrograph procedures with a 1-inch, 6-hr, balanced storm event. Step 6 Compute channel protection volume (CPv) using the SCS method and a 1-yr, 24-hr storm
event. Estimate approximate storage volume for channel protection.

Charlotte-Mecklenburg BMP Design Manual July 1, 2013
4.8.9
Step 7 Size flow diversion structure, if needed, to divert the water quality volume to the sand
filter. Step 8 Compute the release rates for the water quality control and channel protection volume
control.
Step 9 Compute pretreatment volume (if included in the design). The sedimentation chamber should be sized to contain 20 percent of the WQv.
Step 10 Size filtration basin chamber The filter area is sized using the following equation (based on Darcy’s Law): A r = (WQv) (df) / [(k) (hr + df) (tf)]
where: A r = surface area of filter bed (ft2) WQv = Water Quality Protection Volume (or total Volume to be infiltrated) df = filter bed depth (designer selects either 24 inches or 30 inches) k = coefficient of permeability of filter media (ft/day) (use 3.5 ft/day for sand) hf = average height of water above filter bed (ft) (1/2 hmax, which varies based on
site but hmax is typically < 1 foot) tf = design filter bed drain time (days) (designer selects either 27 or 51 hours,
which is 24 or 48 hours beyond the center of the water quality storm event, 3 hours)
Set preliminary dimensions of filtration basin chamber and sedimentation chamber.
Step 11 Derive stage-discharge and stage-storage relations for the sand filter. Assume that
discharge occurs for headwater depths at the elevation of the top of the filter media and higher. A zero discharge should be assumed at the elevation of the top of filter media.
Step 12 Route flows through sand filter facility and adjust design of facility to meet all design
criteria. Step 13 Design inlets, pretreatment facilities, underdrain system, and outlet structures Step 14 Compute overflow weir sizes 4.8.6 Inspection and Maintenance Requirements Specific maintenance inspections and requirements are contained in Chapter 7 of the Administrative Manual.

Charlotte-Mecklenburg BMP Design Manual July 1, 2013
4.8.10
4.8.7 Design Form Design Procedure Form: Sand Filters
SAND FILTER FEASIBILITY 1. Is the use of a sand filter appropriate? 2. Confirm local design criteria and applicability. PRELIMINARY HYDROLOGIC CALCULATIONS 3. Compute, WQv water quality volume requirements Compute Runoff Coefficient, Rv Compute WQv volume requirements 4. Compute site hydrologic input parameters Development Conditions Area CN (SCS curve number) Adjusted CN (SCS curve number adjusted for 1-inch storm event) Time of concentration 5. Compute WQp peak flow 6. Compute CPv (channel protection volume) Compute S (maximum retention) Compute 1-yr, 24-hr total rainfall depth Compute qd (runoff volume for 1-year, 24-hour storm event) Compute CPv 7. Size flow diversion structure 8. Compute release rates Compute WQv release rate Compute CPv release rate SAND FILTER DESIGN 9. Compute sedimentation chamber volume Volpre = (0.20)(WQv) 10. Size filtration bed chamber Compute area from Darcy’s Law 11. Develop stage-storage and stage-discharge relationships 12. Route Flows through sand filter 13. Design inlets and underdrain system, 14. Compute overflow weir sizes Compute overflow – Orifice equation Weir from sedimentation chamber – Weir equation Weir from filtration chamber – Weir equation 15. Assess Maintenance Access and Safety Features
NOTES: Rv = ______ WQv = ______ acre-ft
Pre-developed Post-developed ______ acres ______ acres ______ ______ ______ ______ ______ hours ______ hours WQp = ______ cfs
S = ______
Rainfall Depth = ______ inches qd = ______ inches CPv =__ acre-ft
Release Rate = ______ cfs Release Rate = ______ cfs
Volpre = ______ acre-ft
Ar = ______ft2 L = ______ft W = ______ft
Elev Area. (ft2) Volume. (ft3)
Acc. Vol. (ft3)
Q (cfs)
Q =______cfs Length = ______ft Length = ______ft
Notes

Charlotte-Mecklenburg BMP Design Manual July 1, 2013
4.8.11
4.8.8 Sand Filter Design Example #1
The following design example is for a sand filter facility designed to control the 1-inch, 6-hour for water quality purposes, 1-year, 24-hour for channel protection purposes, and 10-year 6-hour for flood control purposes following the design procedures given in section 4.8. In this design example, the channel protection volume (CPV) is required to be held for a minimum of 24 hours from the center of the rainfall event (as is the requirement for projects within Mecklenburg County and the six Towns); however, the user should note that within the City of Charlotte, the channel protection volume (CPV) is required to be held for a minimum of 48 hours from the center of the rainfall event. Figure 4.8.6 shows the site plan for the development and base hydrologic data that will be used in the design example.
Figure 4.8.6 Example Site Plan for Sand Filter Design The following steps illustrate how to use the design procedures given in section 4.8 to design a sand filter facility that will be acceptable for the design criteria given in this manual.

Charlotte-Mecklenburg BMP Design Manual July 1, 2013
4.8.12
Step 1 BMP Feasibility For the purposes of this design example, assume that a sand filter design is feasible. Step 2 Confirm Design Criteria The design criteria contained in Section 4.1 of the manual apply to this design. Step 3 Compute Water Quality Volume (WQv)
• Compute Runoff Coefficient, Rv, using (Schueler’s Method) Equation 3.1
Rv = 0.05 + 0.009(I) = 0.05 + (79.2)(0.009) = 0.76
• Compute Water Quality Volume, WQv, using Equation 3.2
WQv = 1.0RvA/12 = (1.0 inches)(0.76)(2.93 acre)(1foot/12 inches) = 0.19 ac-ft
• Convert Water Quality Volume, WQv to inches of runoff using Equation 3.3 WQv = 1.0(Rv) = 1.0(0.76) = 0.76 inches
Step 4 Compute Site Hydrologic Input Parameters The site contains 2.93 acres and is proposed to be re-developed to 79.2 percent imperviousness. Using SCS hydrologic procedures, the following data can be determined for the example development site. For pre-developed conditions, an assumption that the site was 50% forest in good hydrologic condition and 50% pasture in good hydrologic condition is required. The site consists of 15% hydrologic type B soils and 85% hydrologic type C soils. The pre-developed topography drains in two directions and includes two sub-basins. The post-developed topography drains in one direction. The pre-developed weighted curve number is: CNweighted = (0.5)(0.15)(61) + (0.5)(0.85)(74) + (0.5)(0.15)(55) + (0.5)(0.85)(70) = 69.9 Use 70 The post-developed weighted curve number is (based on 79 percent impervious from site plan): CNweighted = (0.21)(0.15)(61) + (0.21)(0.85)(74) + (0.79)(98) = 92.6 Use 93 The modified post-developed curve number for application with the 1-inch, 6-hour storm event, using Equation 3.4 is: CNweighted = 1000/[10 + 5P + 10WQv – 10(WQv
2 + 1.25 WQvP)0.5] CNweighted = 1000/[10 + 5(1.0) + 10(0.76) – 10{(0.762 + (1.25)(0.76)(1.0)}0.5]
= 97.7 Use 98
Charlotte-Mecklenburg BMP Design Manual July 1, 2013
4.8.13
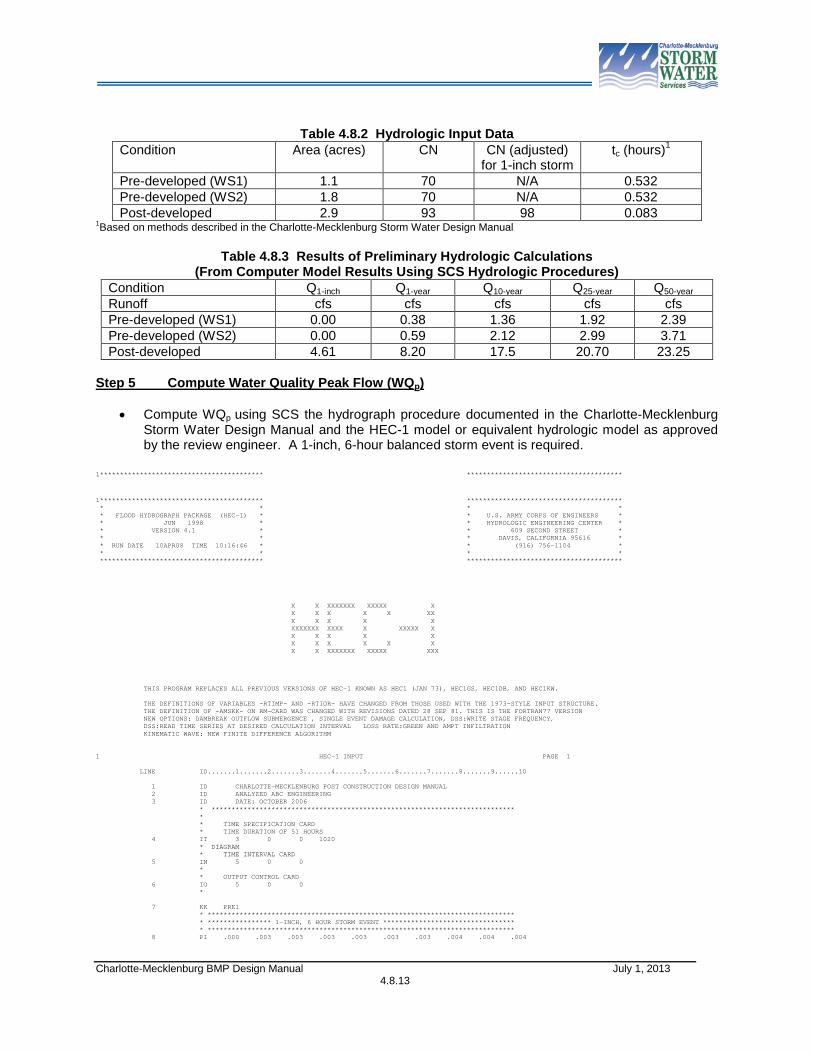
Table 4.8.2 Hydrologic Input Data Condition
Area (acres) CN CN (adjusted) for 1-inch storm
tc (hours)1
Pre-developed (WS1) 1.1 70 N/A 0.532 Pre-developed (WS2) 1.8 70 N/A 0.532 Post-developed 2.9 93 98 0.083
1Based on methods described in the Charlotte-Mecklenburg Storm Water Design Manual
Table 4.8.3 Results of Preliminary Hydrologic Calculations (From Computer Model Results Using SCS Hydrologic Procedures)
Condition Q1-inch Q1-year Q10-year Q25-year Q50-year Runoff cfs cfs cfs cfs cfs Pre-developed (WS1) 0.00 0.38 1.36 1.92 2.39 Pre-developed (WS2) 0.00 0.59 2.12 2.99 3.71 Post-developed 4.61 8.20 17.5 20.70 23.25
Step 5 Compute Water Quality Peak Flow (WQp)
• Compute WQp using SCS the hydrograph procedure documented in the Charlotte-Mecklenburg Storm Water Design Manual and the HEC-1 model or equivalent hydrologic model as approved by the review engineer. A 1-inch, 6-hour balanced storm event is required.
1***************************************** ***************************************
1***************************************** *************************************** * * * * * FLOOD HYDROGRAPH PACKAGE (HEC-1) * * U.S. ARMY CORPS OF ENGINEERS * * JUN 1998 * * HYDROLOGIC ENGINEERING CENTER * * VERSION 4.1 * * 609 SECOND STREET * * * * DAVIS, CALIFORNIA 95616 * * RUN DATE 10APR08 TIME 10:16:46 * * (916) 756-1104 * * * * * ***************************************** *************************************** X X XXXXXXX XXXXX X X X X X X XX X X X X X XXXXXXX XXXX X XXXXX X X X X X X X X X X X X X X XXXXXXX XXXXX XXX THIS PROGRAM REPLACES ALL PREVIOUS VERSIONS OF HEC-1 KNOWN AS HEC1 (JAN 73), HEC1GS, HEC1DB, AND HEC1KW. THE DEFINITIONS OF VARIABLES -RTIMP- AND -RTIOR- HAVE CHANGED FROM THOSE USED WITH THE 1973-STYLE INPUT STRUCTURE. THE DEFINITION OF -AMSKK- ON RM-CARD WAS CHANGED WITH REVISIONS DATED 28 SEP 81. THIS IS THE FORTRAN77 VERSION NEW OPTIONS: DAMBREAK OUTFLOW SUBMERGENCE , SINGLE EVENT DAMAGE CALCULATION, DSS:WRITE STAGE FREQUENCY, DSS:READ TIME SERIES AT DESIRED CALCULATION INTERVAL LOSS RATE:GREEN AND AMPT INFILTRATION KINEMATIC WAVE: NEW FINITE DIFFERENCE ALGORITHM 1 HEC-1 INPUT PAGE 1 LINE ID.......1.......2.......3.......4.......5.......6.......7.......8.......9......10 1 ID CHARLOTTE-MECKLENBURG POST CONSTRUCTION DESIGN MANUAL 2 ID ANALYZED ABC ENGINEERING 3 ID DATE: OCTOBER 2006 * **************************************************************************** * * TIME SPECIFICATION CARD * TIME DURATION OF 51 HOURS 4 IT 3 0 0 1020 * DIAGRAM * TIME INTERVAL CARD 5 IN 5 0 0 * * OUTPUT CONTROL CARD 6 IO 5 0 0 * 7 KK PRE1 * ***************************************************************************** * **************** 1-INCH, 6 HOUR STORM EVENT ********************************* * ***************************************************************************** 8 PI .000 .003 .003 .003 .003 .003 .003 .004 .004 .004

Charlotte-Mecklenburg BMP Design Manual July 1, 2013
4.8.14
9 PI .004 .004 .004 .004 .004 .005 .005 .005 .005 .006 10 PI .007 .007 .007 .008 .008 .009 .009 .010 .011 .012 11 PI .013 .019 .022 .025 .039 .050 .108 .188 .075 .043 12 PI .028 .023 .020 .014 .012 .011 .010 .009 .009 .008 13 PI .008 .007 .007 .007 .006 .005 .005 .005 .005 .005 14 PI .004 .004 .004 .004 .004 .004 .004 .004 .003 .003 15 PI .003 .003 .003 .000 * ***************************************************************************** 16 KM EAST PRE-DEVELOPED CONDITIONS 17 KO 5 0 0 0 21 18 BA .0018 19 LS 0 69.9 0 20 UD 0.319 21 KK PRE2 22 KM WEST PRE-DEVELOPED CONDITIONS 23 KO 5 0 0 0 21 24 BA .0028 25 LS 0 69.9 0 26 UD 0.319 27 KK COMB1 28 KO 5 0 0 0 21 29 HC 2 30 KK POST1 31 KM POST-DEVELOPED CONDITIONS - ENTIRE DRAINAGE AREA 32 KM ADJUSTED CURVE NUMBER 33 KO 3 0 0 0 21 34 BA .0046 35 LS 0 97.7 0 36 UD 0.050 37 ZZ 1***************************************** *************************************** * * * * * FLOOD HYDROGRAPH PACKAGE (HEC-1) * * U.S. ARMY CORPS OF ENGINEERS * * JUN 1998 * * HYDROLOGIC ENGINEERING CENTER * * VERSION 4.1 * * 609 SECOND STREET * * * * DAVIS, CALIFORNIA 95616 * * RUN DATE 10APR08 TIME 10:16:46 * * (916) 756-1104 * * * * * ***************************************** *************************************** CHARLOTTE-MECKLENBURG POST CONSTRUCTION DESIGN MANUAL ANALYZED ABC ENGINEERING DATE: OCTOBER 2006 HYDROGRAPH AT STATION POST1 TOTAL RAINFALL = 1.00, TOTAL LOSS = .24, TOTAL EXCESS = .76 1 RUNOFF SUMMARY FLOW IN CUBIC FEET PER SECOND TIME IN HOURS, AREA IN SQUARE MILES PEAK TIME OF AVERAGE FLOW FOR MAXIMUM PERIOD BASIN MAXIMUM TIME OF OPERATION STATION FLOW PEAK AREA STAGE MAX STAGE + 6-HOUR 24-HOUR 72-HOUR HYDROGRAPH AT + PRE1 0. 5.00 0. 0. 0. .00 HYDROGRAPH AT + PRE2 0. 4.95 0. 0. 0. .00 2 COMBINED AT + COMB1 0. 5.15 0. 0. 0. .00 HYDROGRAPH AT + POST1 5. 3.20 0. 0. 0. .00 *** NORMAL END OF HEC-1 ***
Note that the previous HEC-1 model output using the SCS method indicates that the runoff volume is 0.79 inches which is within an acceptable range (0.03 inches deviation from 0.76 inches) of the Schueler method runoff volume results using Equation 3-2.
Step 6 Compute Channel Protection Volume (CPv)
• Compute maximum soil retention using SCS methods shown in the Charlotte-Mecklenburg Storm Water Design Manual. Note that the CN value used is the original site CN value, not the adjusted CN value used during the water quality runoff volume computation.
S = 1000/CN-10 = 1000/93.0 – 10 = 0.75 inches

Charlotte-Mecklenburg BMP Design Manual July 1, 2013
4.8.15
Compute total runoff for the 1-year, 24-hour storm event. Total rainfall depth is 2.58 inches. Qd = (P-0.2S)2/(P+0.8S) = [2.58 – (0.2)(0.75)]2/[2.58 + (0.8)(0.75)] = 1.86 inches Compute watershed runoff CSv = (1.86 inches)(2.93 acres)(1 foot/12 inches) = 0.45 acre-feet
• Estimate Approximate Storage Volume
The designer has elected to direct all storm events into the sand filter facility. The maximum ponding depth for the 1-inch, 6-hour storm event must be less than 24 inches. The maximum ponding depth for the 1-year, 24-hour and 10-year, 6-hour storm event must be less than 5 feet. In order to achieve the pollutant removal goals of the Post Construction Ordinance, the sand filter must hold the Water Quality Volume for a minimum of 2.0 days above and within the filter media. The design requirements include a filter media thickness of 2.5 feet and an underdrain system thickness of 1.0 feet. The Channel Protection Volume is required to be held within the sand filter for a minimum of 24 hours beyond the center of the design storm event rainfall. The center of rainfall is at hour twelve, therefore, the time of interest for assessing the Channel Protection Volume is hour thirty-six (24 hours plus 12 hours). The “Static Method” can be used as an initial estimate which sets the storage volume equal to the runoff volume, assumes that the storage volume fills instantaneously and empties through the outlet structures including the filter media, orifices, and weirs. In the case of the sand filter facility, the outlet structure for the Water Quality Volume is based on the filter media. The outlet structure for the Channel Protection Volume may be based on a combination of the filter media and an overflow weir and/or orifice structure. Using the Static Method that sets the storage volume equal to the runoff volume, the sand filter facility requires 0.19 acre-ft storage to hold the Water Quality Volume. The sand filter facility requires 0.45 acre feet storage to hold the total Channel Protection Volume. These values can be used as estimates to develop approximate storage volumes and grading plans, but routing computations must be performed to complete the design.
Step 7 Size Flow Diversion Structure This design example does not include a flow diversion structure (refer to Section 4.8.9 for example of flow diversion structure design. Step 8 Compute Release Rates for Water Quality Control and Channel Protection
Volume The following outlet hydraulic computations are performed using the Static Method. Routing computations must be performed to refine the design. The routing computations must show that a minimum of 5 percent of the runoff volume is held within the storage volume after the design duration time beyond the center of rainfall.
• Compute the release rate for water quality control.
The water quality control volume (WQv) is to be released over a 2.0 day period beyond the center of rainfall (48 hours plus 3 hours). Release rate = (0.19 ac-ft x 43560 ft2/acre)/(51.0 hrs x 3,600 sec/hr) = 0.045 cfs

Charlotte-Mecklenburg BMP Design Manual July 1, 2013
4.8.16
• Compute the release rate for channel protection volume.
The channel protection volume (CPv) is to be released over a 24-hour period beyond the center of rainfall (24 hours plus 12 hours). Release rate = (0.45 ac-ft x 43560 ft2/acre)/(36 hrs x 3,600 sec/hr) = 0.151 cfs
Step 9 Compute Sedimentation Chamber Volume The sedimentation chamber storage area above the filter media must be sized to hold 20 percent of the water quality volume in order to remove trash and large sediment particles. Sediment Chambervol = (0.19 acre-feet)(43,560sq ft/acre)(0.20) = 1,655 ft3 For the underground configuration, a six foot depth is effective in providing storage volume for the sedimentation chamber (five feet of headwater storage above the top of sand filter plus one foot below the top of sand filter for sediment and trash storage). A sedimentation chamber 331 ft2 (1,655 ft3/5 feet) in area will meet the requirements for pre-treatment. Later routing computations indicate that additional storage is necessary to control the 1-year, 24-hour storm event, so the sedimentation chamber size is increased. Step 10 Compute Sand Filter Area to Treat Water Quality Volume Size the sand filter ponding/filter area based on Darcy’s equation. Assume that all of the filter media capacity is effective and that no surface area is ineffective due to clogging. A design value of 1.75 inch/hour (3.5 foot/day) for the coefficient of permeability of the filter media is required. The detention time is 2 days beyond the center of rainfall for the 6-hour storm (48 hours plus 3 hours is 51 hours).
Af = (WQv)(df)/[(k)(hf+df)(tf)] where: Af = surface area of filter bed (ft2) df = filter bed depth (ft)
k = coefficient of permeability of filter media (ft/day) hf = average height of water above filter bed (ft) tf = design filter bed drain time (days)
Af = (0.19 acre-ft)(43560 sf/ac)(2.5 ft)) (3.5 ft/day)(0.5ft+2.5ft)(2.125 days) = 927.3 sq ft Use 30 foot by 30 foot sand filter
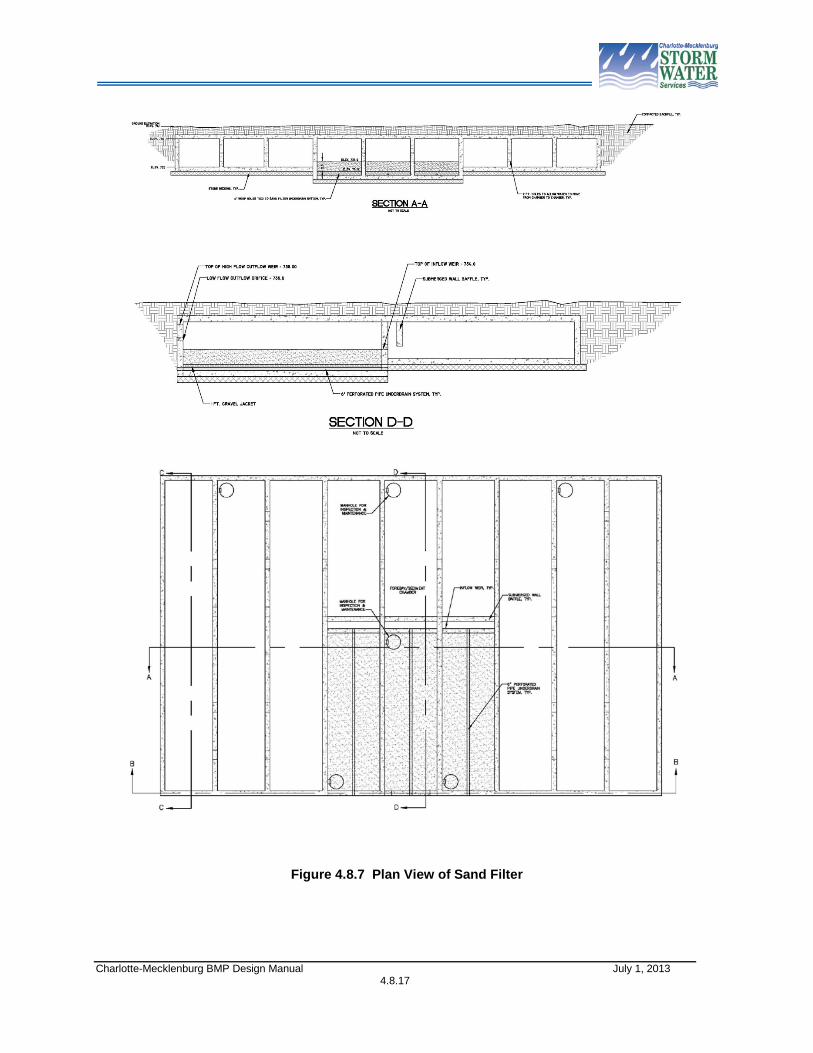
Step 11a Develop Sand Filter Storage-Elevation Table Figure 4.8.6 shows the sand filter location on site, Figure 4.8.7 shows cross-sections and the plan view of the sand filter and Table 4.8.4 shows the storage-elevation data that was developed for this example. Note that the storage volumes presented result from an iterative process of routing three design storm events through the facility; the 1-inch, 6-hour, 1-year, 24-hour, and 10-year, 6-hour storm events. The 50-year storm event is routed through the facility to ensure that the facility and surrounding buildings area not impacted. Also, note that storage volume below the top of the sand filter in the sedimentation chamber is ignored in the routing computations. Runoff does not leave that storage volume with a positive outflow.
Charlotte-Mecklenburg BMP Design Manual July 1, 2013
4.8.17
Figure 4.8.7 Plan View of Sand Filter

Charlotte-Mecklenburg BMP Design Manual July 1, 2013
4.8.18
Table 4.8.4 Sand Filter Storage-Elevation Data Elevation Area (sf) Area (ac) Avg. Area
(ac) Height (ft) Inc vol (ac-
ft) Acc vol (ac-
ft) 734 5,826 0.134 0.000 735 5,826 0.134 0.134 1.0 0.134 0.134 736 5,826 0.134 0.134 1.0 0.134 0.268 737 5,826 0.134 0.134 1.0 0.134 0.402 738 5,826 0.134 0.134 1.0 0.134 0.536 739 5,826 0.134 0.134 1.0 0.134 0.670
Step 11b Develop Stage-Discharge for Sand Filter Media The 1-inch, 6-hour storm event and portions of the more severe storm events will flow through the filter media. The outflow conditions for the filter media must be assessed in order to derive the relation for the stage-discharge and in order to perform routing computations. The routing must be performed for the storage area above the filter media, and not the area within the filter media. Therefore, all of the computations are based on elevation above the top of the filter media. Outflow when runoff is below the top of the filter media is ignored and assumed to be zero when the depth of flow is equal to the top of media. The percentage of the filter media that is assumed to be clogged during the surface area computation procedure (0 percent) should be considered when computing the outflow conditions. Af = (WQv)(df)/[(k)(hf+df)(tf)]
WQv/tf = Qo = Af (k)(hf+df)/(df)) where: Af = surface area of filter bed (ft2) df = filter bed depth (ft)
k = coefficient of permeability of filter media (ft/day) hf = average height of water above filter bed (ft)
At elevation 739, five feet above the top of filter media Qo = (900ft2)[(3.5ft/day)(5ft+2.5ft)]/(2.5 ft) = 9,450 cf/day = 0.109 cfs At elevation 738, four feet above the top of filter media Qo = (900ft2)[(3.5ft/day)(4ft+2.5ft)]/(2.5 ft) = 8,190 cf/day = 0.095 cfs At elevation 737, three feet above the top of filter media Qo = (900ft2)[(3.5ft/day)(3ft+2.5ft)]/(2.5 ft) = 6,930 cf/day = 0.080 cfs
At elevation 736, two feet above the top of filter media Qo = (900ft2)[(3.5ft/day)(2ft+2.5ft)]/(2.5 ft) = 5,670 cf/day = 0.066 cfs At elevation 735, one foot above the top of filter media Qo = (900ft2)[(3.5ft/day)(1ft+2.5ft)]/(2.5 ft) = 4,410 cf/day = 0.051 cfs
Charlotte-Mecklenburg BMP Design Manual July 1, 2013
4.8.19
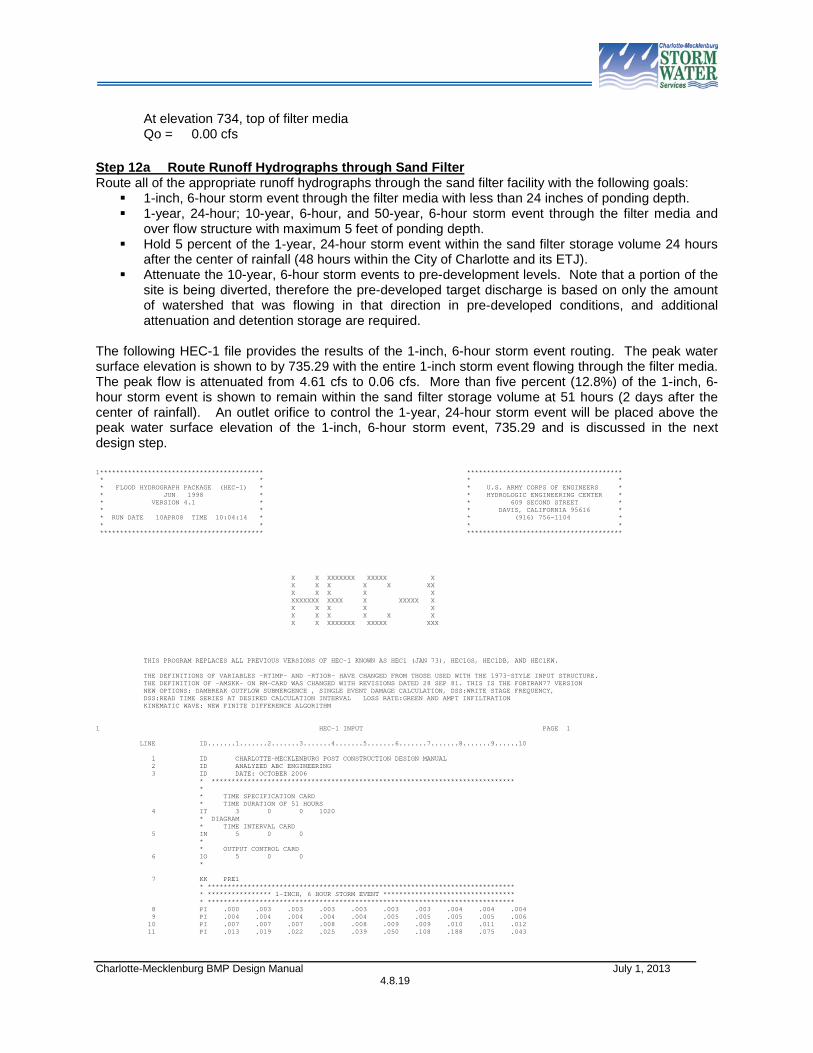
At elevation 734, top of filter media Qo = 0.00 cfs
Step 12a Route Runoff Hydrographs through Sand Filter Route all of the appropriate runoff hydrographs through the sand filter facility with the following goals:
1-inch, 6-hour storm event through the filter media with less than 24 inches of ponding depth. 1-year, 24-hour; 10-year, 6-hour, and 50-year, 6-hour storm event through the filter media and
over flow structure with maximum 5 feet of ponding depth. Hold 5 percent of the 1-year, 24-hour storm event within the sand filter storage volume 24 hours
after the center of rainfall (48 hours within the City of Charlotte and its ETJ). Attenuate the 10-year, 6-hour storm events to pre-development levels. Note that a portion of the
site is being diverted, therefore the pre-developed target discharge is based on only the amount of watershed that was flowing in that direction in pre-developed conditions, and additional attenuation and detention storage are required.
The following HEC-1 file provides the results of the 1-inch, 6-hour storm event routing. The peak water surface elevation is shown to by 735.29 with the entire 1-inch storm event flowing through the filter media. The peak flow is attenuated from 4.61 cfs to 0.06 cfs. More than five percent (12.8%) of the 1-inch, 6-hour storm event is shown to remain within the sand filter storage volume at 51 hours (2 days after the center of rainfall). An outlet orifice to control the 1-year, 24-hour storm event will be placed above the peak water surface elevation of the 1-inch, 6-hour storm event, 735.29 and is discussed in the next design step. 1***************************************** *************************************** * * * * * FLOOD HYDROGRAPH PACKAGE (HEC-1) * * U.S. ARMY CORPS OF ENGINEERS * * JUN 1998 * * HYDROLOGIC ENGINEERING CENTER * * VERSION 4.1 * * 609 SECOND STREET * * * * DAVIS, CALIFORNIA 95616 * * RUN DATE 10APR08 TIME 10:04:14 * * (916) 756-1104 * * * * * ***************************************** *************************************** X X XXXXXXX XXXXX X X X X X X XX X X X X X XXXXXXX XXXX X XXXXX X X X X X X X X X X X X X X XXXXXXX XXXXX XXX THIS PROGRAM REPLACES ALL PREVIOUS VERSIONS OF HEC-1 KNOWN AS HEC1 (JAN 73), HEC1GS, HEC1DB, AND HEC1KW. THE DEFINITIONS OF VARIABLES -RTIMP- AND -RTIOR- HAVE CHANGED FROM THOSE USED WITH THE 1973-STYLE INPUT STRUCTURE. THE DEFINITION OF -AMSKK- ON RM-CARD WAS CHANGED WITH REVISIONS DATED 28 SEP 81. THIS IS THE FORTRAN77 VERSION NEW OPTIONS: DAMBREAK OUTFLOW SUBMERGENCE , SINGLE EVENT DAMAGE CALCULATION, DSS:WRITE STAGE FREQUENCY, DSS:READ TIME SERIES AT DESIRED CALCULATION INTERVAL LOSS RATE:GREEN AND AMPT INFILTRATION KINEMATIC WAVE: NEW FINITE DIFFERENCE ALGORITHM 1 HEC-1 INPUT PAGE 1 LINE ID.......1.......2.......3.......4.......5.......6.......7.......8.......9......10 1 ID CHARLOTTE-MECKLENBURG POST CONSTRUCTION DESIGN MANUAL 2 ID ANALYZED ABC ENGINEERING 3 ID DATE: OCTOBER 2006 * **************************************************************************** * * TIME SPECIFICATION CARD * TIME DURATION OF 51 HOURS 4 IT 3 0 0 1020 * DIAGRAM * TIME INTERVAL CARD 5 IN 5 0 0 * * OUTPUT CONTROL CARD 6 IO 5 0 0 * 7 KK PRE1 * ***************************************************************************** * **************** 1-INCH, 6 HOUR STORM EVENT ********************************* * ***************************************************************************** 8 PI .000 .003 .003 .003 .003 .003 .003 .004 .004 .004 9 PI .004 .004 .004 .004 .004 .005 .005 .005 .005 .006 10 PI .007 .007 .007 .008 .008 .009 .009 .010 .011 .012 11 PI .013 .019 .022 .025 .039 .050 .108 .188 .075 .043

Charlotte-Mecklenburg BMP Design Manual July 1, 2013
4.8.20
12 PI .028 .023 .020 .014 .012 .011 .010 .009 .009 .008 13 PI .008 .007 .007 .007 .006 .005 .005 .005 .005 .005 14 PI .004 .004 .004 .004 .004 .004 .004 .004 .003 .003 15 PI .003 .003 .003 .000 * ***************************************************************************** 16 KM EAST PRE-DEVELOPED CONDITIONS 17 KO 5 0 0 0 21 18 BA .0018 19 LS 0 69.9 0 20 UD 0.319 21 KK PRE2 22 KM WEST PRE-DEVELOPED CONDITIONS 23 KO 5 0 0 0 21 24 BA .0028 25 LS 0 69.9 0 26 UD 0.319 27 KK COMB1 28 KO 5 0 0 0 21 29 HC 2 30 KK POST1 31 KM POST-DEVELOPED CONDITIONS - ENTIRE DRAINAGE AREA 32 KM ADJUSTED CURVE NUMBER 33 KO 3 0 0 0 21 34 BA .0046 35 LS 0 97.7 0 36 UD 0.050 1 HEC-1 INPUT PAGE 2 LINE ID.......1.......2.......3.......4.......5.......6.......7.......8.......9......10 37 KK WQRTE 38 KO 3 0 0 0 21 39 KM ROUTE HYDROGRAPH THROUGH THE SAND FILTER CHAMBER 40 KM TWO ELEVATIONS - 734 FOR SEDIMENTATION CHAMBER, 730.5 FOR BOTTOM OF SAND FILT 41 KM THEREFORE GETTING ALL OF SEDIMENTATION CHAMBER EFFECTIVE FOR ATTENUATION 42 KM WITH THE EXCEPTION OF 1 FOOT FOR SEDIMENT STORAGE 43 RS 1 ELEV 734 44 SV 0 .134 .167 .201 .268 .401 .535 .669 45 SE 734 735 735.25 735.5 736 737 738 739 46 SQ 0 .044 .051 .055 .058 .066 .080 .095 47 SE 734 734.5 735 735.25 735.5 736 737 738 48 ZZ 1***************************************** *************************************** * * * * * FLOOD HYDROGRAPH PACKAGE (HEC-1) * * U.S. ARMY CORPS OF ENGINEERS * * JUN 1998 * * HYDROLOGIC ENGINEERING CENTER * * VERSION 4.1 * * 609 SECOND STREET * * * * DAVIS, CALIFORNIA 95616 * * RUN DATE 10APR08 TIME 10:04:14 * * (916) 756-1104 * * * * * ***************************************** *************************************** CHARLOTTE-MECKLENBURG POST CONSTRUCTION DESIGN MANUAL ANALYZED ABC ENGINEERING DATE: OCTOBER 2006 *** *** *** *** *** *** *** *** *** *** *** *** *** *** *** *** *** *** *** *** *** *** *** *** *** *** *** *** *** *** *** *** *** ************** * * 30 KK * POST1 * * * ************** HYDROGRAPH AT STATION POST1 TOTAL RAINFALL = 1.00, TOTAL LOSS = .24, TOTAL EXCESS = .76 1 RUNOFF SUMMARY FLOW IN CUBIC FEET PER SECOND TIME IN HOURS, AREA IN SQUARE MILES PEAK TIME OF AVERAGE FLOW FOR MAXIMUM PERIOD BASIN MAXIMUM TIME OF OPERATION STATION FLOW PEAK AREA STAGE MAX STAGE + 6-HOUR 24-HOUR 72-HOUR HYDROGRAPH AT + PRE1 0. 5.00 0. 0. 0. .00 HYDROGRAPH AT + PRE2 0. 4.95 0. 0. 0. .00 2 COMBINED AT + COMB1 0. 5.15 0. 0. 0. .00 HYDROGRAPH AT + POST1 5. 3.20 0. 0. 0. .00 ROUTED TO + WQRTE 0. 5.80 0. 0. 0. .00 + 735.29 6.15 *** NORMAL END OF HEC-1 ***
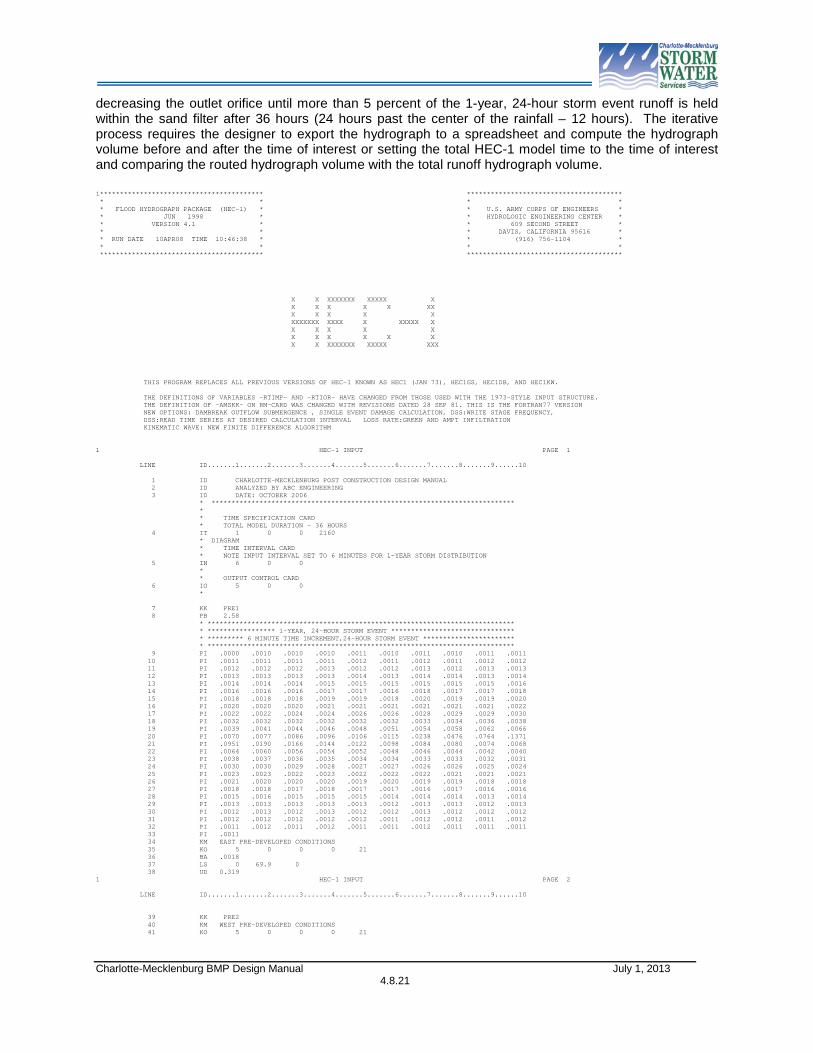
The following HEC-1 file provides the results of an iterative process to control the 1-year, 24-hour storm event routing. The iterative process included increasing the storage volume above the sand filter and
Charlotte-Mecklenburg BMP Design Manual July 1, 2013
4.8.21
decreasing the outlet orifice until more than 5 percent of the 1-year, 24-hour storm event runoff is held within the sand filter after 36 hours (24 hours past the center of the rainfall – 12 hours). The iterative process requires the designer to export the hydrograph to a spreadsheet and compute the hydrograph volume before and after the time of interest or setting the total HEC-1 model time to the time of interest and comparing the routed hydrograph volume with the total runoff hydrograph volume. 1***************************************** *************************************** * * * * * FLOOD HYDROGRAPH PACKAGE (HEC-1) * * U.S. ARMY CORPS OF ENGINEERS * * JUN 1998 * * HYDROLOGIC ENGINEERING CENTER * * VERSION 4.1 * * 609 SECOND STREET * * * * DAVIS, CALIFORNIA 95616 * * RUN DATE 10APR08 TIME 10:46:38 * * (916) 756-1104 * * * * * ***************************************** *************************************** X X XXXXXXX XXXXX X X X X X X XX X X X X X XXXXXXX XXXX X XXXXX X X X X X X X X X X X X X X XXXXXXX XXXXX XXX THIS PROGRAM REPLACES ALL PREVIOUS VERSIONS OF HEC-1 KNOWN AS HEC1 (JAN 73), HEC1GS, HEC1DB, AND HEC1KW. THE DEFINITIONS OF VARIABLES -RTIMP- AND -RTIOR- HAVE CHANGED FROM THOSE USED WITH THE 1973-STYLE INPUT STRUCTURE. THE DEFINITION OF -AMSKK- ON RM-CARD WAS CHANGED WITH REVISIONS DATED 28 SEP 81. THIS IS THE FORTRAN77 VERSION NEW OPTIONS: DAMBREAK OUTFLOW SUBMERGENCE , SINGLE EVENT DAMAGE CALCULATION, DSS:WRITE STAGE FREQUENCY, DSS:READ TIME SERIES AT DESIRED CALCULATION INTERVAL LOSS RATE:GREEN AND AMPT INFILTRATION KINEMATIC WAVE: NEW FINITE DIFFERENCE ALGORITHM 1 HEC-1 INPUT PAGE 1 LINE ID.......1.......2.......3.......4.......5.......6.......7.......8.......9......10 1 ID CHARLOTTE-MECKLENBURG POST CONSTRUCTION DESIGN MANUAL 2 ID ANALYZED BY ABC ENGINEERING 3 ID DATE: OCTOBER 2006 * **************************************************************************** * * TIME SPECIFICATION CARD * TOTAL MODEL DURATION - 36 HOURS 4 IT 1 0 0 2160 * DIAGRAM * TIME INTERVAL CARD * NOTE INPUT INTERVAL SET TO 6 MINUTES FOR 1-YEAR STORM DISTRIBUTION 5 IN 6 0 0 * * OUTPUT CONTROL CARD 6 IO 5 0 0 * 7 KK PRE1 8 PB 2.58 * ***************************************************************************** * ***************** 1-YEAR, 24-HOUR STORM EVENT ******************************* * ********* 6 MINUTE TIME INCREMENT,24-HOUR STORM EVENT *********************** * ***************************************************************************** 9 PI .0000 .0010 .0010 .0010 .0011 .0010 .0011 .0010 .0011 .0011 10 PI .0011 .0011 .0011 .0011 .0012 .0011 .0012 .0011 .0012 .0012 11 PI .0012 .0012 .0012 .0013 .0012 .0012 .0013 .0012 .0013 .0013 12 PI .0013 .0013 .0013 .0013 .0014 .0013 .0014 .0014 .0013 .0014 13 PI .0014 .0014 .0014 .0015 .0015 .0015 .0015 .0015 .0015 .0016 14 PI .0016 .0016 .0016 .0017 .0017 .0016 .0018 .0017 .0017 .0018 15 PI .0018 .0018 .0018 .0019 .0019 .0018 .0020 .0019 .0019 .0020 16 PI .0020 .0020 .0020 .0021 .0021 .0021 .0021 .0021 .0021 .0022 17 PI .0022 .0022 .0024 .0024 .0026 .0026 .0028 .0029 .0029 .0030 18 PI .0032 .0032 .0032 .0032 .0032 .0032 .0033 .0034 .0036 .0038 19 PI .0039 .0041 .0044 .0046 .0048 .0051 .0054 .0058 .0062 .0066 20 PI .0070 .0077 .0086 .0096 .0106 .0115 .0238 .0476 .0764 .1371 21 PI .0951 .0190 .0166 .0144 .0122 .0098 .0084 .0080 .0074 .0068 22 PI .0064 .0060 .0056 .0054 .0052 .0048 .0046 .0044 .0042 .0040 23 PI .0038 .0037 .0036 .0035 .0034 .0034 .0033 .0033 .0032 .0031 24 PI .0030 .0030 .0029 .0028 .0027 .0027 .0026 .0026 .0025 .0024 25 PI .0023 .0023 .0022 .0023 .0022 .0022 .0022 .0021 .0021 .0021 26 PI .0021 .0020 .0020 .0020 .0019 .0020 .0019 .0019 .0018 .0018 27 PI .0018 .0018 .0017 .0018 .0017 .0017 .0016 .0017 .0016 .0016 28 PI .0015 .0016 .0015 .0015 .0015 .0014 .0014 .0014 .0013 .0014 29 PI .0013 .0013 .0013 .0013 .0013 .0012 .0013 .0013 .0012 .0013 30 PI .0012 .0013 .0012 .0013 .0012 .0012 .0013 .0012 .0012 .0012 31 PI .0012 .0012 .0012 .0012 .0012 .0011 .0012 .0012 .0011 .0012 32 PI .0011 .0012 .0011 .0012 .0011 .0011 .0012 .0011 .0011 .0011 33 PI .0011 34 KM EAST PRE-DEVELOPED CONDITIONS 35 KO 5 0 0 0 21 36 BA .0018 37 LS 0 69.9 0 38 UD 0.319 1 HEC-1 INPUT PAGE 2 LINE ID.......1.......2.......3.......4.......5.......6.......7.......8.......9......10 39 KK PRE2 40 KM WEST PRE-DEVELOPED CONDITIONS 41 KO 5 0 0 0 21

Charlotte-Mecklenburg BMP Design Manual July 1, 2013
4.8.22
42 BA .0028 43 LS 0 69.9 0 44 UD 0.319 45 KK COMB1 46 KO 5 0 0 0 21 47 HC 2 48 KK POST 49 KM POST-DEVELOPED CONDITIONS - ENTIRE DRAINAGE AREA 50 KO 3 0 0 0 21 51 BA .0046 52 LS 0 92.6 0 53 UD 0.050 54 KK WQRTE 55 KO 5 0 0 0 21 56 KM ROUTE HYDROGRAPH THROUGH THE SAND FILTER CHAMBER 57 KM TWO ELEVATIONS - 734 FOR SEDIMENTATION CHAMBER, 730.5 FOR BOTTOM OF SAND FILT 58 KM THEREFORE GETTING ALL OF SEDIMENTATION CHAMBER EFFECTIVE FOR ATTENUATION 59 KM WITH THE EXCEPTION OF 1 FOOT FOR SEDIMENT STORAGE 60 KM 5-INCH ORIFICE AT 735.5, 8 FOOT WEIR AT 738 61 RS 1 ELEV 734 62 SV 0 .134 .167 .201 .268 .401 .535 .669 63 SE 734 735 735.25 735.5 736 737 738 739 64 SQ 0 .044 .051 .055 .058 .420 .826 1.088 37.300 65 SE 734 734.5 735 735.25 735.5 736 737 738 739 66 ZZ 1***************************************** *************************************** * * * * * FLOOD HYDROGRAPH PACKAGE (HEC-1) * * U.S. ARMY CORPS OF ENGINEERS * * JUN 1998 * * HYDROLOGIC ENGINEERING CENTER * * VERSION 4.1 * * 609 SECOND STREET * * * * DAVIS, CALIFORNIA 95616 * * RUN DATE 10APR08 TIME 10:46:38 * * (916) 756-1104 * * * * * ***************************************** *************************************** CHARLOTTE-MECKLENBURG POST CONSTRUCTION DESIGN MANUAL ANALYZED BY ABC ENGINEERING DATE: OCTOBER 2006 *** *** *** *** *** *** *** *** *** *** *** *** *** *** *** *** *** *** *** *** *** *** *** *** *** *** *** *** *** *** *** *** *** ************** * * 48 KK * POST * * * ************** 50 KO OUTPUT CONTROL VARIABLES 52 LS SCS LOSS RATE STRTL .16 INITIAL ABSTRACTION CRVNBR 92.60 CURVE NUMBER RTIMP .00 PERCENT IMPERVIOUS AREA HYDROGRAPH AT STATION POST TOTAL RAINFALL = 2.58, TOTAL LOSS = .76, TOTAL EXCESS = 1.82 1 RUNOFF SUMMARY FLOW IN CUBIC FEET PER SECOND TIME IN HOURS, AREA IN SQUARE MILES PEAK TIME OF AVERAGE FLOW FOR MAXIMUM PERIOD BASIN MAXIMUM TIME OF OPERATION STATION FLOW PEAK AREA STAGE MAX STAGE + 6-HOUR 24-HOUR 72-HOUR HYDROGRAPH AT + PRE1 0. 12.35 0. 0. 0. .00 HYDROGRAPH AT + PRE2 1. 12.35 0. 0. 0. .00 2 COMBINED AT + COMB1 1. 12.35 0. 0. 0. .00 HYDROGRAPH AT + POST 8. 12.02 1. 0. 0. .00 ROUTED TO + WQRTE 0. 13.02 0. 0. 0. .00 + 736.04 13.15 *** NORMAL END OF HEC-1 ***
First, note that the runoff volume is computed to be 1.82 inches which is the same runoff volume computed using the standard SCS formulas presented in step 4 of this example. Second, note that the more than 5 percent of the runoff volume is held within the BMP storage volume at 36 hours. A spreadsheet summary indicates that the total runoff volume held within the BMP is 36.6 percent. The peak water surface elevation in the BMP is 736.04. The additional amount held is due to the additional storage volume that is needed to provide peak flow attenuation that is determined in Step 12b.

Charlotte-Mecklenburg BMP Design Manual July 1, 2013
4.8.23
Step 12b Calculate Q10 Release Rate and Water Surface Elevation(s) The next step of the design process is to design the sand filter to be used to achieve the peak attenuation goals for the 10-year, 6-hour storm event. This process is similar to previous examples in that the design is iterative. A stage-storage-discharge relations is developed assuming an outflow orifice and/or weir and storage area. The storm event is routed through the storage volume, and the outflow peak discharge is compared to the pre-development peak discharge for the 10-year, 6-hour storm event; 1.3 cfs. In addition, the peak stage for the 10-year, 6-hour storm events must be less than 5 feet above the top of the filter media. The following HEC-1 output files illustrate the results of the iterative process for the 10-year storm event. A 5-inch orifice and an 8-foot weir that are installed at elevations 735.5 and 738.0, respectively attenuate the post-developed discharge to the appropriate value for the 10-year, 6-hour storm event. The TAPE21 file indicates that the peak discharge for the 10-year, 6-hour storm event is 1.08 cfs with a peak stage of 737.98 which is less than the pre-developed target release rate of 1.36 cfs. Note that the peak stage is 3.98 feet above the top of the sand filter media. The 3.98 feet ponding depth is less than the allowable 5 feet depth. Intermediate steps are not presented. 1***************************************** *************************************** * * * * * FLOOD HYDROGRAPH PACKAGE (HEC-1) * * U.S. ARMY CORPS OF ENGINEERS * * JUN 1998 * * HYDROLOGIC ENGINEERING CENTER * * VERSION 4.1 * * 609 SECOND STREET * * * * DAVIS, CALIFORNIA 95616 * * RUN DATE 10APR08 TIME 10:57:28 * * (916) 756-1104 * * * * * ***************************************** *************************************** X X XXXXXXX XXXXX X X X X X X XX X X X X X XXXXXXX XXXX X XXXXX X X X X X X X X X X X X X X XXXXXXX XXXXX XXX THIS PROGRAM REPLACES ALL PREVIOUS VERSIONS OF HEC-1 KNOWN AS HEC1 (JAN 73), HEC1GS, HEC1DB, AND HEC1KW. THE DEFINITIONS OF VARIABLES -RTIMP- AND -RTIOR- HAVE CHANGED FROM THOSE USED WITH THE 1973-STYLE INPUT STRUCTURE. THE DEFINITION OF -AMSKK- ON RM-CARD WAS CHANGED WITH REVISIONS DATED 28 SEP 81. THIS IS THE FORTRAN77 VERSION NEW OPTIONS: DAMBREAK OUTFLOW SUBMERGENCE , SINGLE EVENT DAMAGE CALCULATION, DSS:WRITE STAGE FREQUENCY, DSS:READ TIME SERIES AT DESIRED CALCULATION INTERVAL LOSS RATE:GREEN AND AMPT INFILTRATION KINEMATIC WAVE: NEW FINITE DIFFERENCE ALGORITHM 1 HEC-1 INPUT PAGE 1 LINE ID.......1.......2.......3.......4.......5.......6.......7.......8.......9......10 1 ID CHARLOTTE-MECKLENBURG POST CONSTRUCTION DESIGN MANUAL 2 ID ANALYZED BY ABC ENGINEERING 3 ID DATE: OCTOBER 2006 * **************************************************************************** * * TIME SPECIFICATION CARD * COMPUTATION DURATION SET TO 6 HOURS 4 IT 1 0 0 360 * DIAGRAM * TIME INTERVAL CARD 5 IN 5 0 0 * * OUTPUT CONTROL CARD 6 IO 5 0 0 * 7 KK PRE1 * ***************************************************************************** * ***************** 10-YEAR, 6-HOUR STORM EVENT ******************************* * ***************************************************************************** 8 PI .000 .011 .011 .012 .012 .012 .012 .013 .013 .013 9 PI .014 .014 .015 .015 .016 .016 .017 .018 .018 .023 10 PI .024 .025 .026 .027 .029 .036 .039 .042 .045 .049 11 PI .054 .079 .089 .103 .161 .201 .395 .590 .275 .177 12 PI .112 .095 .084 .057 .051 .047 .043 .040 .038 .030 13 PI .028 .027 .025 .024 .023 .019 .018 .017 .017 .016 14 PI .016 .015 .015 .014 .014 .013 .013 .013 .012 .012 15 PI .012 .011 .011 .000 16 KM EAST PRE-DEVELOPED CONDITIONS 17 KO 5 0 0 0 21 18 BA .0018 19 LS 0 69.9 0 20 UD 0.319 21 KK PRE2 22 KM WEST PRE-DEVELOPED CONDITIONS 23 KO 5 0 0 0 21

Charlotte-Mecklenburg BMP Design Manual July 1, 2013
4.8.24
24 BA .0028 25 LS 0 69.9 0 26 UD 0.319 27 KK COMB1 28 KO 5 0 0 0 21 29 HC 2 30 KK POST 31 KM POST-DEVELOPED CONDITIONS - ENTIRE DRAINAGE AREA 32 KO 3 0 0 0 21 33 BA .0046 34 LS 0 92.6 0 35 UD 0.050 1 HEC-1 INPUT PAGE 2 LINE ID.......1.......2.......3.......4.......5.......6.......7.......8.......9......10 36 KK WQRTE 37 KO 5 0 0 0 21 38 KM ROUTE HYDROGRAPH THROUGH THE SAND FILTER CHAMBER 39 KM TWO ELEVATIONS - 734 FOR SEDIMENTATION CHAMBER, 730.5 FOR BOTTOM OF SAND FILT 40 KM THEREFORE GETTING ALL OF SEDIMENTATION CHAMBER EFFECTIVE FOR ATTENUATION 41 KM WITH THE EXCEPTION OF 1 FOOT FOR SEDIMENT STORAGE 42 KM 5-INCH ORIFICE AT 735.5, 8 FOOT WEIR AT 738 43 RS 1 ELEV 734 44 SV 0 .134 .167 .201 .268 .401 .535 .669 45 SE 734 735 735.25 735.5 736 737 738 739 46 SQ 0 .044 .051 .055 .058 .420 .826 1.088 37.300 47 SE 734 734.5 735 735.25 735.5 736 737 738 739 48 ZZ 1***************************************** *************************************** * * * * * FLOOD HYDROGRAPH PACKAGE (HEC-1) * * U.S. ARMY CORPS OF ENGINEERS * * JUN 1998 * * HYDROLOGIC ENGINEERING CENTER * * VERSION 4.1 * * 609 SECOND STREET * * * * DAVIS, CALIFORNIA 95616 * * RUN DATE 10APR08 TIME 10:57:28 * * (916) 756-1104 * * * * * ***************************************** *************************************** CHARLOTTE-MECKLENBURG POST CONSTRUCTION DESIGN MANUAL ANALYZED BY ABC ENGINEERING DATE: OCTOBER 2006 1 RUNOFF SUMMARY FLOW IN CUBIC FEET PER SECOND TIME IN HOURS, AREA IN SQUARE MILES PEAK TIME OF AVERAGE FLOW FOR MAXIMUM PERIOD BASIN MAXIMUM TIME OF OPERATION STATION FLOW PEAK AREA STAGE MAX STAGE + 6-HOUR 24-HOUR 72-HOUR HYDROGRAPH AT + PRE1 1. 3.52 0. 0. 0. .00 HYDROGRAPH AT + PRE2 2. 3.52 0. 0. 0. .00 2 COMBINED AT + COMB1 3. 3.52 1. 1. 1. .00 HYDROGRAPH AT + POST 17. 3.18 1. 1. 1. .00 ROUTED TO + WQRTE 1. 4.15 0. 0. 0. .00 + 737.98 4.17 *** NORMAL END OF HEC-1 ***
Step 13 Design Inlets and Underdrain System Inlet conveyance system design is not included in this design example. Standards for conveyance system design are covered in the Charlotte-Mecklenburg Storm Water Design Manual. The underdrain system must be designed to meet two design goals; the underdrain capacity must be greater than the filter media capacity, and the capacity must drain the runoff volume from the system within design duration (2.125 days for this example). The design must assume that 50 percent of the underdrain system (perforations and pipe system capacity) is lost due to clogging. Design specifications require the underdrain system to be a 6-inch perforated PVC pipe with 3/8-inch perforations spaced 3 inches on center, along 4 longitudinal rows spaced 90° apart. Minimum underdrain slope is 0.5 percent.

Charlotte-Mecklenburg BMP Design Manual July 1, 2013
4.8.25
The length, slope, number of pipes, spacing, etc. is configured per design requirements. Based upon the required area for the sand filter BMP (927 ft2) the approximate dimensions of the sand filter area is selected to be 30 feet wide by 30 feet in length (approximately 927 ft2). The design process uses a trial and error process. The capacity of the perforations and pipe (assuming 50 percent of the system is clogged) are computed. The computed underdrain capacity is checked relative to the filter media capacity to ensure that the filter media is the controlling outflow condition. The computed underdrain capacity if compared to the static outflow discharge that ensures the runoff within the system leaves within 51 hours. Compute minimum drawdown discharge Water quality volume = (0.19 ac-ft)(43,560ft3/ac ft) = 8,276 ft3 Drawdown = 8,276 ft3/[(51 hours)(3,600sec/hour)] = 0.045 cfs Compute perforation capacity Since the maximum underdrain spacing is 10 feet on center and the sand filter area is 30 feet wide by 30 feet in length, three parallel underdrain pipes (6-inch diameter PVC) 30 feet in length were selected. For the calculations below, the length of pipe containing holes was reduced by 1 foot per cleanout to account for fittings. Number of perforations = (3 pipes)(4 rows/ft)(30 – 2) ft/pipe)(4 holes/row) = 1,344 holes 50 percent of perforations = 672 holes Capacity of one hole = CA(2gh)0.5 = (0.6)(3.1416)[(3/8in)(1/24)]2[(64.4)(5.0ft)]0.5 = 0.0083 cfs Total capacity = (0.0083 cfs)(672) = 5.58 cfs The perforations capacity (5.58 cfs) is greater than the filter media capacity (0.051 cfs, computed in step 11b) and the minimum drawdown capacity requirement (0.045 cfs computed in this step). Therefore the design is acceptable. Note that the headwater depth used to determine the filter media capacity is 1.0 feet, the average headwater depth above the filter media for the water quality storm event. The drawdown computation is also based on the water quality volume. The headwater depth for the perforations is also based on the same average headwater elevations, 1 feet above the filter media, or 5.0 feet above the perforations. Compute underdrain pipe capacity For 6-inch PVC underdrain pipe at 0.005 ft/ft slope: Capacity of pipe = (1.49/n)(A)(A/P)0.67(S)0.5
= (1.49/0.013)(0.1963 ft2)(0.125 ft)0.67(0.005)0.5
= 0.40 cfs Fifty percent assuming clogging = 0.20 cfs The underdrain pipe capacity (0.20 cfs) is greater than the filter media capacity (0.051 cfs, computed in step 11b) and the minimum drawdown capacity requirement (0.045 cfs computed in this step). Therefore the design is acceptable. Step 14 Design Overflow Weir The final step is to route the 50-year, 6-hour storm event through the sand filter facility to ensure that a minimum of 6-inches of freeboard is provided and that a maximum of 5 feet of depth is over the sand filter media. An eight (8) foot weir at 738.0 is proposed as the emergency overflow. The peak stage is 738.25 which is 4.25 feet above the filter media (less than 5 feet) and therefore meets design standards. The following HEC-1 output file illustrates the results.

Charlotte-Mecklenburg BMP Design Manual July 1, 2013
4.8.26
1***************************************** *************************************** * * * * * FLOOD HYDROGRAPH PACKAGE (HEC-1) * * U.S. ARMY CORPS OF ENGINEERS * * JUN 1998 * * HYDROLOGIC ENGINEERING CENTER * * VERSION 4.1 * * 609 SECOND STREET * * * * DAVIS, CALIFORNIA 95616 * * RUN DATE 10APR08 TIME 11:10:20 * * (916) 756-1104 * * * * * ***************************************** *************************************** X X XXXXXXX XXXXX X X X X X X XX X X X X X XXXXXXX XXXX X XXXXX X X X X X X X X X X X X X X XXXXXXX XXXXX XXX THIS PROGRAM REPLACES ALL PREVIOUS VERSIONS OF HEC-1 KNOWN AS HEC1 (JAN 73), HEC1GS, HEC1DB, AND HEC1KW. THE DEFINITIONS OF VARIABLES -RTIMP- AND -RTIOR- HAVE CHANGED FROM THOSE USED WITH THE 1973-STYLE INPUT STRUCTURE. THE DEFINITION OF -AMSKK- ON RM-CARD WAS CHANGED WITH REVISIONS DATED 28 SEP 81. THIS IS THE FORTRAN77 VERSION NEW OPTIONS: DAMBREAK OUTFLOW SUBMERGENCE , SINGLE EVENT DAMAGE CALCULATION, DSS:WRITE STAGE FREQUENCY, DSS:READ TIME SERIES AT DESIRED CALCULATION INTERVAL LOSS RATE:GREEN AND AMPT INFILTRATION KINEMATIC WAVE: NEW FINITE DIFFERENCE ALGORITHM 1 HEC-1 INPUT PAGE 1 LINE ID.......1.......2.......3.......4.......5.......6.......7.......8.......9......10 1 ID CHARLOTTE-MECKLENBURG POST CONSTRUCTION DESIGN MANUAL 2 ID ANALYZED BY ABC ENGINEERING 3 ID DATE: OCTOBER 2006 * **************************************************************************** * * TIME SPECIFICATION CARD * MODEL DURATION 6 HOURS 4 IT 1 0 0 360 * DIAGRAM * TIME INTERVAL CARD 5 IN 5 0 0 * * OUTPUT CONTROL CARD 6 IO 5 0 0 * 7 KK PRE1 * ***************************************************************************** * ***************** 50-YEAR, 6-HOUR STORM EVENT ******************************* * ***************************************************************************** 8 PI .000 .016 .016 .016 .017 .017 .018 .018 .019 .019 9 PI .020 .020 .021 .022 .022 .023 .024 .025 .026 .031 10 PI .032 .033 .035 .037 .039 .049 .053 .056 .061 .066 11 PI .073 .103 .116 .133 .209 .260 .513 .749 .356 .231 12 PI .145 .124 .109 .077 .069 .063 .058 .054 .051 .040 13 PI .038 .036 .034 .033 .031 .026 .025 .024 .023 .023 14 PI .022 .021 .021 .020 .019 .019 .018 .018 .017 .017 15 PI .017 .016 .016 .000 16 KM EAST PRE-DEVELOPED CONDITIONS 17 KO 5 0 0 0 21 18 BA .0018 19 LS 0 70.0 0 20 UD 0.319 21 KK PRE2 22 KM WEST PRE-DEVELOPED CONDITIONS 23 KO 5 0 0 0 21 24 BA .0028 25 LS 0 70.0 0 26 UD 0.319 27 KK COMB1 28 KO 5 0 0 0 21 29 HC 2 30 KK POST 31 KM POST-DEVELOPED CONDITIONS - ENTIRE DRAINAGE AREA 32 KO 3 0 0 0 21 33 BA .0046 34 LS 0 93.0 0 35 UD 0.050 1 HEC-1 INPUT PAGE 2 LINE ID.......1.......2.......3.......4.......5.......6.......7.......8.......9......10 36 KK WQRTE 37 KO 5 0 0 0 21 38 KM ROUTE HYDROGRAPH THROUGH THE SAND FILTER CHAMBER 39 KM TWO ELEVATIONS - 734 FOR SEDIMENTATION CHAMBER, 730.5 FOR BOTTOM OF SAND FILT 40 KM THEREFORE GETTING ALL OF SEDIMENTATION CHAMBER EFFECTIVE FOR ATTENUATION 41 KM WITH THE EXCEPTION OF 1 FOOT FOR SEDIMENT STORAGE 42 KM 5-INCH ORIFICE AT 735.5, 8 FOOT WEIR AT 738 43 RS 1 ELEV 734 44 SV 0 .134 .167 .201 .268 .401 .535 .669 45 SE 734 735 735.25 735.5 736 737 738 739 46 SQ 0 .044 .051 .055 .058 .420 .826 1.088 37.300 47 SE 734 734.5 735 735.25 735.5 736 737 738 739 48 ZZ 1***************************************** *************************************** * * * *

Charlotte-Mecklenburg BMP Design Manual July 1, 2013
4.8.27
* FLOOD HYDROGRAPH PACKAGE (HEC-1) * * U.S. ARMY CORPS OF ENGINEERS * * JUN 1998 * * HYDROLOGIC ENGINEERING CENTER * * VERSION 4.1 * * 609 SECOND STREET * * * * DAVIS, CALIFORNIA 95616 * * RUN DATE 10APR08 TIME 11:10:20 * * (916) 756-1104 * * * * * ***************************************** *************************************** CHARLOTTE-MECKLENBURG POST CONSTRUCTION DESIGN MANUAL ANALYZED BY ABC ENGINEERING DATE: OCTOBER 2006 RUNOFF SUMMARY FLOW IN CUBIC FEET PER SECOND TIME IN HOURS, AREA IN SQUARE MILES PEAK TIME OF AVERAGE FLOW FOR MAXIMUM PERIOD BASIN MAXIMUM TIME OF OPERATION STATION FLOW PEAK AREA STAGE MAX STAGE + 6-HOUR 24-HOUR 72-HOUR HYDROGRAPH AT + PRE1 2. 3.50 0. 0. 0. .00 HYDROGRAPH AT + PRE2 4. 3.50 1. 1. 1. .00 2 COMBINED AT + COMB1 6. 3.50 1. 1. 1. .00 HYDROGRAPH AT + POST 23. 3.18 2. 2. 2. .00 ROUTED TO + WQRTE 10. 3.32 1. 1. 1. .00 + 738.25 3.32 *** NORMAL END OF HEC-1 ***
Table 4.8.5 Summary of Controls Provided Control Element Type/Size of
Control Stor. (ac-ft)
Peak Elev. (MSL)
Disc. (cfs)
Remarks
Water Quality Extended Detention
(WQv-ed)
Sand filter media at 734.0
0.176 735.29 0.05 Entire 1-inch, 6-hour storm event is routed through sand
filter media Channel Protection
(CPv) Sand filter media at
734.0 and 5-inch orifice at 735.5
0.281 736.04 0.43 Portion of the 1-year, 24-hour storm event is routed through the sand filter and a portion is
routed through the 5-inch orifice outlet
Flood Protection (Q10)
Sand filter media at 734.0 and 5-inch orifice at 735.5
0.542 737.98 1.08 Same orifice control was designed for the 1-year, 24-hour and the 10-year, 6-hour
storm events Emergency Overflow
(Q50) Sand filter media at 734.0, 5-inch orifice at 735.5, and 8-foot
weir at 738.0
0.717 738.25 10.16 Less than 5 feet of headwater depth on sand filter media.
Step 15 Assess Maintenance Access and Safety Features The filter media and sedimentation chamber must be accessible from the surface in order to provide regular maintenance without significant access challenges. All areas of both chambers must be within 25 feet of an access location from the surface that is large enough for personnel to enter in order to remove trash, debris, sediment, etc. In addition, the sand filter media must be accessible in order to facilitate complete replacement when the sand filter ponds runoff without filtration.

Charlotte-Mecklenburg BMP Design Manual July 1, 2013
4.8.28
4.8.9 Sand Filter Design Example #2
The following design example presents a different design approach for the same site presented in Section 4.8.8. Instead of implementing a stand-alone sand filter facility, the different design approach implements a combination of a sand filter facility and above ground extended dry detention basin designed to control the 1-inch, 6-hour for water quality purposes, 1-year, 24-hour for channel protection purposes, and 10-year 6-hour for flood control purposes following the design procedures given in section 4.8. The 1-inch, 6-hour storm event and portions of the 1-year, 24-hour and 10-year, 6-hour storm events are diverted to the sand filter. The additional flow that is not directed to the sand filter of the 1-year, 24-hour and 10-year, 6-hour storm events is diverted to an above-ground extended dry detention basin. In this design example, the channel protection volume (CPV) is required to be held for a minimum of 24 hours from the center of the rainfall event (as is the requirement for projects within Mecklenburg County and the six Towns); however, the user should note that within the City of Charlotte, the channel protection volume (CPV) is required to be held for a minimum of 48 hours from the center of the rainfall event. The combination of these two BMP’s do not meet the goals of the post-construction ordinance; 85% TSS and 70% TP removal, so they are being presented for illustrative purposes only. For an actual site design case, additional BMPs within the treatment train would be added so that the post-construction goals are met. A grassed swale combined with a bioretention facility would supplement the two BMP presented in the example to meet the post-construction ordinance goals. Methods to compute the pollutant removal of BMPs in series are presented in Section 4.0. Figure 4.8.9 shows the site plan for the development and base hydrologic data that will be used in the design example.
Figure 4.8.9 Example Site Plan for Sand Filter Design

Charlotte-Mecklenburg BMP Design Manual July 1, 2013
4.8.29
The following steps illustrate how to use the design procedures given in section 4.8 to design a sand filter facility that is acceptable for the design criteria given in this manual. Step 1 BMP Feasibility For the purposes of this design example, assume that a sand filter design is feasible. Step 2 Confirm Design Criteria The design criteria contained in Section 4.1 of the manual apply to this design. Step 3 Compute Water Quality Volume (WQv)
• Compute Runoff Coefficient, Rv, using (Schueler’s Method) Equation 3.1
Rv = 0.05 + 0.009(I) = 0.05 + (79.2)(0.009) = 0.76
• Compute Water Quality Volume, WQv, using Equation 3.2
WQv = 1.0RvA/12 = (1.0 inches)(0.76)(2.93 acre)(1foot/12 inches) = 0.19 ac-ft
• Convert Water Quality Volume, WQv to inches of runoff using Equation 3.3 WQv = 1.0(Rv) = 1.0(0.76) = 0.76 inches
Step 4 Compute Site Hydrologic Input Parameters The site contains 2.93 acres and is proposed to be re-developed to 79.2 percent imperviousness. Using SCS hydrologic procedures, the following data can be determined for the example development site. For pre-developed conditions, an assumption that the site was 50% forest in good hydrologic condition and 50% pasture in good hydrologic condition is required. The site consists of 15% hydrologic type B soils and 85% hydrologic type C soils. The pre-developed topography drains in two directions and includes two sub-basins. The post-developed topography drains in one direction. The pre-developed weighted curve number is: CNweighted = (0.5)(0.15)(61) + (0.5)(0.85)(74) + (0.5)(0.15)(55) + (0.5)(0.85)(70) = 69.9 Use 70 The post-developed weighted curve number is (based on 79 percent impervious from site plan): CNweighted = (0.21)(0.15)(61) + (0.21)(0.85)(74) + (0.79)(98) = 92.6 Use 93 The modified post-developed curve number for application with the 1-inch, 6-hour storm event, using Equation 3.4 is: CNweighted = 1000/[10 + 5P + 10WQv – 10(WQv
2 + 1.25 WQvP)0.5] CNweighted = 1000/[10 + 5(1.0) + 10(0.76) – 10{(0.762 + (1.25)(0.76)(1.0)}0.5]
= 97.7 Use 98

Charlotte-Mecklenburg BMP Design Manual July 1, 2013
4.8.30
Table 4.8.6 Hydrologic Input Data Condition
Area (acres) CN CN (adjusted) for 1-inch storm
tc (hours)1
Pre-developed (WS1) 1.1 70 N/A 0.532 Pre-developed (WS2) 1.8 70 N/A 0.532 Post-developed 2.9 93 98 0.083
1Based on methods described in the Charlotte-Mecklenburg Storm Water Design Manual
Table 4.8.7 Results of Preliminary Hydrologic Calculations (From Computer Model Results Using SCS Hydrologic Procedures)
Condition Q1-inch Q1-year Q10-year Q25-year Q50-year Runoff cfs cfs cfs cfs cfs Pre-developed (WS1) 0.00 0.38 1.36 1.92 2.39 Pre-developed (WS2) 0.00 0.59 2.12 2.99 3.71 Post-developed 5.38 8.20 17.50 20.70 23.25
Step 5 Compute Water Quality Peak Flow (WQp)
• Compute WQp using SCS the hydrograph procedure documented in the Charlotte-Mecklenburg Storm Water Design Manual and the HEC-1 model. A 1-inch, 6-hour balanced storm event is required.
1***************************************** *************************************** * * * * * FLOOD HYDROGRAPH PACKAGE (HEC-1) * * U.S. ARMY CORPS OF ENGINEERS * * JUN 1998 * * HYDROLOGIC ENGINEERING CENTER * * VERSION 4.1 * * 609 SECOND STREET * * * * DAVIS, CALIFORNIA 95616 * * RUN DATE 10APR08 TIME 10:16:46 * * (916) 756-1104 * * * * * ***************************************** *************************************** X X XXXXXXX XXXXX X X X X X X XX X X X X X XXXXXXX XXXX X XXXXX X X X X X X X X X X X X X X XXXXXXX XXXXX XXX THIS PROGRAM REPLACES ALL PREVIOUS VERSIONS OF HEC-1 KNOWN AS HEC1 (JAN 73), HEC1GS, HEC1DB, AND HEC1KW. THE DEFINITIONS OF VARIABLES -RTIMP- AND -RTIOR- HAVE CHANGED FROM THOSE USED WITH THE 1973-STYLE INPUT STRUCTURE. THE DEFINITION OF -AMSKK- ON RM-CARD WAS CHANGED WITH REVISIONS DATED 28 SEP 81. THIS IS THE FORTRAN77 VERSION NEW OPTIONS: DAMBREAK OUTFLOW SUBMERGENCE , SINGLE EVENT DAMAGE CALCULATION, DSS:WRITE STAGE FREQUENCY, DSS:READ TIME SERIES AT DESIRED CALCULATION INTERVAL LOSS RATE:GREEN AND AMPT INFILTRATION KINEMATIC WAVE: NEW FINITE DIFFERENCE ALGORITHM 1 HEC-1 INPUT PAGE 1 LINE ID.......1.......2.......3.......4.......5.......6.......7.......8.......9......10 1 ID CHARLOTTE-MECKLENBURG POST CONSTRUCTION DESIGN MANUAL 2 ID ANALYZED ABC ENGINEERING 3 ID DATE: OCTOBER 2006 * **************************************************************************** * * TIME SPECIFICATION CARD * TIME DURATION OF 51 HOURS 4 IT 3 0 0 1020 * DIAGRAM * TIME INTERVAL CARD 5 IN 5 0 0 * * OUTPUT CONTROL CARD 6 IO 5 0 0 * 7 KK PRE1 * ***************************************************************************** * **************** 1-INCH, 6 HOUR STORM EVENT ********************************* * ***************************************************************************** 8 PI .000 .003 .003 .003 .003 .003 .003 .004 .004 .004 9 PI .004 .004 .004 .004 .004 .005 .005 .005 .005 .006 10 PI .007 .007 .007 .008 .008 .009 .009 .010 .011 .012 11 PI .013 .019 .022 .025 .039 .050 .108 .188 .075 .043

Charlotte-Mecklenburg BMP Design Manual July 1, 2013
4.8.31
12 PI .028 .023 .020 .014 .012 .011 .010 .009 .009 .008 13 PI .008 .007 .007 .007 .006 .005 .005 .005 .005 .005 14 PI .004 .004 .004 .004 .004 .004 .004 .004 .003 .003 15 PI .003 .003 .003 .000 * ***************************************************************************** 16 KM EAST PRE-DEVELOPED CONDITIONS 17 KO 5 0 0 0 21 18 BA .0018 19 LS 0 69.9 0 20 UD 0.319 21 KK PRE2 22 KM WEST PRE-DEVELOPED CONDITIONS 23 KO 5 0 0 0 21 24 BA .0028 25 LS 0 69.9 0 26 UD 0.319 27 KK COMB1 28 KO 5 0 0 0 21 29 HC 2 30 KK POST1 31 KM POST-DEVELOPED CONDITIONS - ENTIRE DRAINAGE AREA 32 KM ADJUSTED CURVE NUMBER 33 KO 3 0 0 0 21 34 BA .0046 35 LS 0 97.7 0 36 UD 0.050 37 ZZ 1***************************************** *************************************** * * * * * FLOOD HYDROGRAPH PACKAGE (HEC-1) * * U.S. ARMY CORPS OF ENGINEERS * * JUN 1998 * * HYDROLOGIC ENGINEERING CENTER * * VERSION 4.1 * * 609 SECOND STREET * * * * DAVIS, CALIFORNIA 95616 * * RUN DATE 10APR08 TIME 10:16:46 * * (916) 756-1104 * * * * * ***************************************** *************************************** CHARLOTTE-MECKLENBURG POST CONSTRUCTION DESIGN MANUAL ANALYZED ABC ENGINEERING DATE: OCTOBER 2006 HYDROGRAPH AT STATION POST1 TOTAL RAINFALL = 1.00, TOTAL LOSS = .24, TOTAL EXCESS = .76 1 RUNOFF SUMMARY FLOW IN CUBIC FEET PER SECOND TIME IN HOURS, AREA IN SQUARE MILES PEAK TIME OF AVERAGE FLOW FOR MAXIMUM PERIOD BASIN MAXIMUM TIME OF OPERATION STATION FLOW PEAK AREA STAGE MAX STAGE + 6-HOUR 24-HOUR 72-HOUR HYDROGRAPH AT + PRE1 0. 5.00 0. 0. 0. .00 HYDROGRAPH AT + PRE2 0. 4.95 0. 0. 0. .00 2 COMBINED AT + COMB1 0. 5.15 0. 0. 0. .00 HYDROGRAPH AT + POST1 5. 3.20 0. 0. 0. .00 *** NORMAL END OF HEC-1 ***
Note that the previous HEC-1 model output using the SCS method indicates that the runoff volume is 0.76 inches which agrees with the Schueler method runoff volume results using Equation 3-2.
Step 6 Compute Channel Protection Volume (CPv)
• Compute maximum soil retention using SCS methods shown in the Charlotte-Mecklenburg Storm Water Design Manual. Note that the CN value used is the original site CN value, not the adjusted CN value used during the water quality runoff volume computation.
S = 1000/CN-10 = 1000/93.0 – 10 = 0.75 inches
Compute total runoff for the 1-year, 24-hour storm event. Total rainfall depth is 2.58 inches.

Charlotte-Mecklenburg BMP Design Manual July 1, 2013
4.8.32
Qd = (P-0.2S)2/(P+0.8S) = (2.58 – 0.2*0.75)2/(2.58 + 0.8*0.75) = 1.86 inches Compute watershed runoff CPv = (1.86 inches)(2.93 acres)(1 foot/12 inches) = 0.45 acre-feet
• Estimate Approximate Storage Volume
The designer has elected to direct the entire Water Quality Volume (WQv) into the sand filter. A portion of the channel protection volume (CPv) and the flood control event; 1-year, 24-hour and 10-year, 6-hour storm events; respectively, will be diverted into the sand filter. The remainder of the channel protection volume and flood control event will be diverted to a downstream extended dry detention basin. For the sand filter, the maximum ponding depth for the 1-inch, 6-hour storm event must be less than 24 inches. For the sand filter, the maximum ponding depth for the 1-year, 24-hour and 10-year, 6-hour storm event must be less than 5 feet. In order to limit the cost of constructing an underground chamber for the sand filter, the standard efficiency sand filter design is selected. The standard efficiency sand filter design requires the Water Quality Volume (WQv) to be held for a minimum of 1.0 day above and within the filter media beyond the center of the rainfall design storm event (24 hours plus 3 hours = 27 hours). The design requirements include a filter media thickness of 2.0 feet and an underdrain system thickness of 1.0 feet. The Channel Protection Volume (CPv) is required to be held within the combination of the sand filter and extended dry detention for a minimum of 24 hours beyond the center of the design storm event rainfall. The center of rainfall is at hour twelve, therefore, the time of interest for assessing the Channel Protection Volume (CPv) is hour thirty-six (24 hours plus 12 hours). The “Static Method” can be used as an initial estimate which sets the storage volume equal to the runoff volume, assumes that the storage volume fills instantaneously and empties through the outlet structures including the filter media, orifices, and weirs. In the case of the sand filter facility, the outlet structure for the Water Quality Volume (WQv) is based on the filter media. The outlet structure for the Channel Protection Volume (CPv) may be based on a combination of the filter media and an overflow weir and/or orifice structure. Using the Static Method, the sand filter facility requires 0.19 acre-feet to hold the Water Quality Volume (WQv). The extended dry detention facility requires approximately 0.26 acre-feet (0.45 – 0.19; Channel Protection Volume (CPv) less the Water Quality Volume diverted to the sand filter) to meet the goals of controlling the Channel Protection Volume (CPv). These values can be used as estimates to develop approximate storage volumes and grading plans, but routing computations must be performed to complete the design.
Step 7 Compute Diversion Structure Geometry All flows less than the peak flow computed for the 1-inch, 6-hour storm event are desired to be diverted into the sand filter facility. Storm events most intense or larger than the 1-inch, 6-hour storm event are desired to be directed away from the sand filter area into the downstream extended dry detention basin. For the development site, the watershed is almost entirely impervious and is drained by closed pipe systems. Therefore, the diversion facility will intercept the contributing watershed in a pipe system structure and divert the low flows into the sand filter through a low flow orifice. A weir wall which overtops for more intense or larger storm events based on the low flow orifice headwater depth directs the additional discharge to the downstream extended dry detention facility. Figure 4.8.10 illustrates the diversion structure geometry.

Charlotte-Mecklenburg BMP Design Manual July 1, 2013
4.8.33
Figure 4.8.10 Diversion Structure Geometry
Based on an assumed weir height of 2 foot and a length of 4 feet, a low flow orifice is sized to direct the peak discharge for the 1-inch, 6-hour storm event with a headwater less than the weir height to the sand filter. Flow that overtops the weir will not enter the sand filter and flow directly to the downstream extended dry detention basin.
• Use orifice equation to compute cross-sectional area and diameter of orifice to divert flow to sand filter.
• Q = CA(2gh)0.5, for Q = 5.38 cfs, h = 2.0 ft – ½ diameter of orifice, and C = discharge coefficient = 0.6
• Try 13.2 inch orifice • Solve for A: A = 5.38 cfs / [0.6((2)(32.2 ft/s2)(2.0-(13.2/24)))0.5] = 0.93 ft2 • With A = πd2/4, d = 1.09 = 13.0 inches, say OK • Use 13.2 inch orifice
Develop stage-discharge relations for a 13.2 inch orifice combined with a 2 foot high weir, 4 feet in length. Invert of the 13.2 inch orifice is 735.0 in a manhole structure upstream from the sand filter with top of filter media elevation of 734.0. Table 4.8.8 illustrates the results of hydraulic computations for the diversion structure
Table 4.8.8 Diversion Structure Hydraulic Results
Elevation Discharge into
sand filter (cfs)
Discharge into extended detention
(cfs) Total flow (cfs)
735.00 0.00 0.00 0.00 735.50 1.54 0.00 1.54 736.00 3.07 0.00 3.07 736.50 4.46 0.00 4.46 737.00 5.51 0.00 5.51
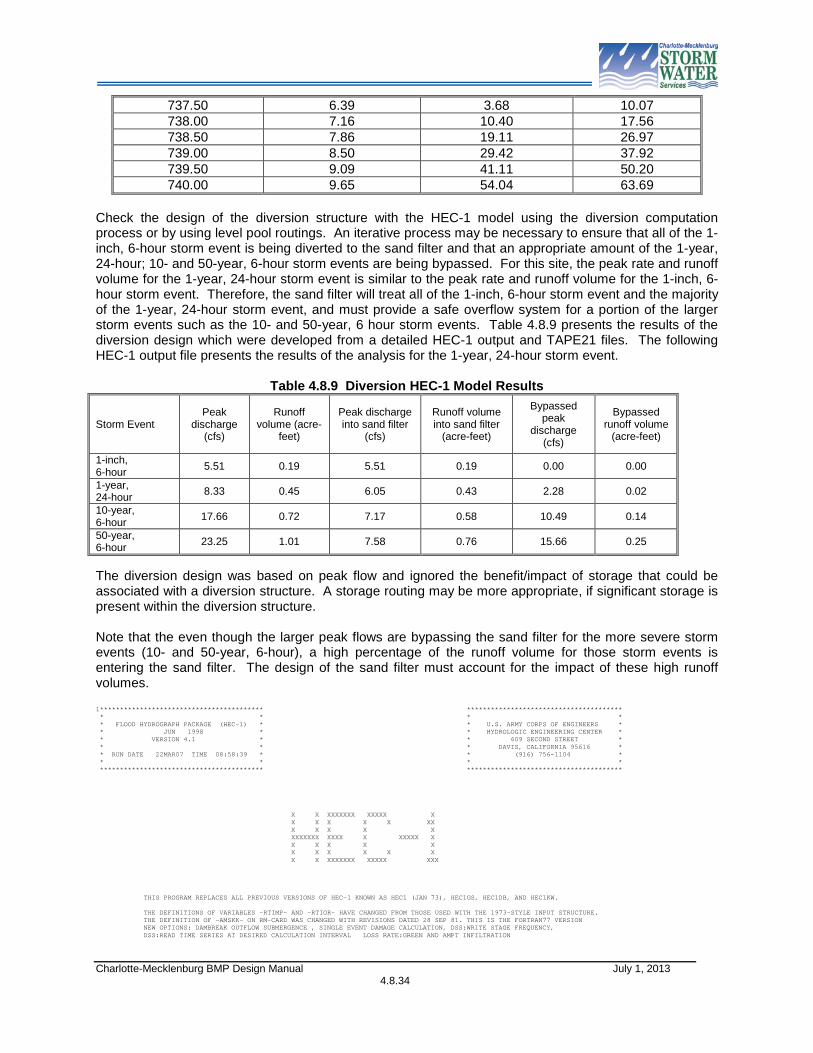
Charlotte-Mecklenburg BMP Design Manual July 1, 2013
4.8.34
737.50 6.39 3.68 10.07 738.00 7.16 10.40 17.56 738.50 7.86 19.11 26.97 739.00 8.50 29.42 37.92 739.50 9.09 41.11 50.20 740.00 9.65 54.04 63.69
Check the design of the diversion structure with the HEC-1 model using the diversion computation process or by using level pool routings. An iterative process may be necessary to ensure that all of the 1-inch, 6-hour storm event is being diverted to the sand filter and that an appropriate amount of the 1-year, 24-hour; 10- and 50-year, 6-hour storm events are being bypassed. For this site, the peak rate and runoff volume for the 1-year, 24-hour storm event is similar to the peak rate and runoff volume for the 1-inch, 6-hour storm event. Therefore, the sand filter will treat all of the 1-inch, 6-hour storm event and the majority of the 1-year, 24-hour storm event, and must provide a safe overflow system for a portion of the larger storm events such as the 10- and 50-year, 6 hour storm events. Table 4.8.9 presents the results of the diversion design which were developed from a detailed HEC-1 output and TAPE21 files. The following HEC-1 output file presents the results of the analysis for the 1-year, 24-hour storm event.
Table 4.8.9 Diversion HEC-1 Model Results
Storm Event Peak
discharge (cfs)
Runoff volume (acre-
feet)
Peak discharge into sand filter
(cfs)
Runoff volume into sand filter
(acre-feet)
Bypassed peak
discharge (cfs)
Bypassed runoff volume
(acre-feet)
1-inch, 6-hour 5.51 0.19 5.51 0.19 0.00 0.00
1-year, 24-hour 8.33 0.45 6.05 0.43 2.28 0.02
10-year, 6-hour 17.66 0.72 7.17 0.58 10.49 0.14
50-year, 6-hour 23.25 1.01 7.58 0.76 15.66 0.25
The diversion design was based on peak flow and ignored the benefit/impact of storage that could be associated with a diversion structure. A storage routing may be more appropriate, if significant storage is present within the diversion structure. Note that the even though the larger peak flows are bypassing the sand filter for the more severe storm events (10- and 50-year, 6-hour), a high percentage of the runoff volume for those storm events is entering the sand filter. The design of the sand filter must account for the impact of these high runoff volumes. 1***************************************** *************************************** * * * * * FLOOD HYDROGRAPH PACKAGE (HEC-1) * * U.S. ARMY CORPS OF ENGINEERS * * JUN 1998 * * HYDROLOGIC ENGINEERING CENTER * * VERSION 4.1 * * 609 SECOND STREET * * * * DAVIS, CALIFORNIA 95616 * * RUN DATE 22MAR07 TIME 08:58:39 * * (916) 756-1104 * * * * * ***************************************** *************************************** X X XXXXXXX XXXXX X X X X X X XX X X X X X XXXXXXX XXXX X XXXXX X X X X X X X X X X X X X X XXXXXXX XXXXX XXX THIS PROGRAM REPLACES ALL PREVIOUS VERSIONS OF HEC-1 KNOWN AS HEC1 (JAN 73), HEC1GS, HEC1DB, AND HEC1KW. THE DEFINITIONS OF VARIABLES -RTIMP- AND -RTIOR- HAVE CHANGED FROM THOSE USED WITH THE 1973-STYLE INPUT STRUCTURE. THE DEFINITION OF -AMSKK- ON RM-CARD WAS CHANGED WITH REVISIONS DATED 28 SEP 81. THIS IS THE FORTRAN77 VERSION NEW OPTIONS: DAMBREAK OUTFLOW SUBMERGENCE , SINGLE EVENT DAMAGE CALCULATION, DSS:WRITE STAGE FREQUENCY, DSS:READ TIME SERIES AT DESIRED CALCULATION INTERVAL LOSS RATE:GREEN AND AMPT INFILTRATION
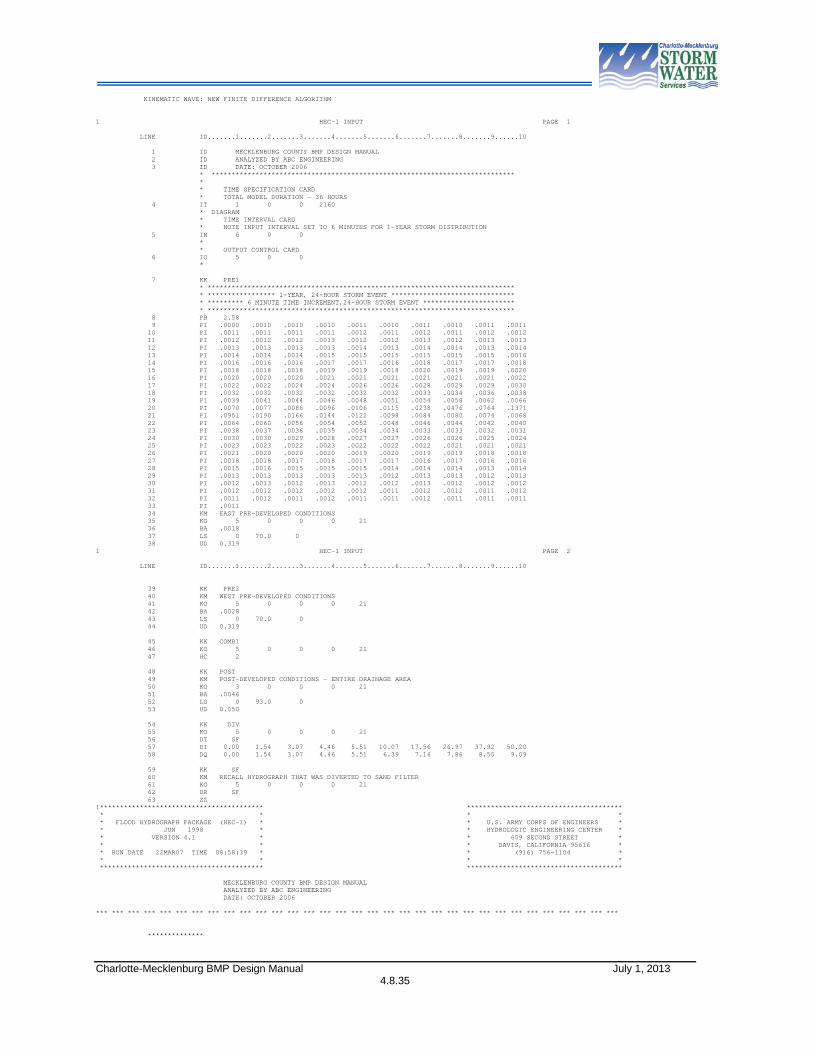
Charlotte-Mecklenburg BMP Design Manual July 1, 2013
4.8.35
KINEMATIC WAVE: NEW FINITE DIFFERENCE ALGORITHM 1 HEC-1 INPUT PAGE 1 LINE ID.......1.......2.......3.......4.......5.......6.......7.......8.......9......10 1 ID MECKLENBURG COUNTY BMP DESIGN MANUAL 2 ID ANALYZED BY ABC ENGINEERING 3 ID DATE: OCTOBER 2006 * **************************************************************************** * * TIME SPECIFICATION CARD * TOTAL MODEL DURATION - 36 HOURS 4 IT 1 0 0 2160 * DIAGRAM * TIME INTERVAL CARD * NOTE INPUT INTERVAL SET TO 6 MINUTES FOR 1-YEAR STORM DISTRIBUTION 5 IN 6 0 0 * * OUTPUT CONTROL CARD 6 IO 5 0 0 * 7 KK PRE1 * ***************************************************************************** * ***************** 1-YEAR, 24-HOUR STORM EVENT ******************************* * ********* 6 MINUTE TIME INCREMENT,24-HOUR STORM EVENT *********************** * ***************************************************************************** 8 PB 2.58 9 PI .0000 .0010 .0010 .0010 .0011 .0010 .0011 .0010 .0011 .0011 10 PI .0011 .0011 .0011 .0011 .0012 .0011 .0012 .0011 .0012 .0012 11 PI .0012 .0012 .0012 .0013 .0012 .0012 .0013 .0012 .0013 .0013 12 PI .0013 .0013 .0013 .0013 .0014 .0013 .0014 .0014 .0013 .0014 13 PI .0014 .0014 .0014 .0015 .0015 .0015 .0015 .0015 .0015 .0016 14 PI .0016 .0016 .0016 .0017 .0017 .0016 .0018 .0017 .0017 .0018 15 PI .0018 .0018 .0018 .0019 .0019 .0018 .0020 .0019 .0019 .0020 16 PI .0020 .0020 .0020 .0021 .0021 .0021 .0021 .0021 .0021 .0022 17 PI .0022 .0022 .0024 .0024 .0026 .0026 .0028 .0029 .0029 .0030 18 PI .0032 .0032 .0032 .0032 .0032 .0032 .0033 .0034 .0036 .0038 19 PI .0039 .0041 .0044 .0046 .0048 .0051 .0054 .0058 .0062 .0066 20 PI .0070 .0077 .0086 .0096 .0106 .0115 .0238 .0476 .0764 .1371 21 PI .0951 .0190 .0166 .0144 .0122 .0098 .0084 .0080 .0074 .0068 22 PI .0064 .0060 .0056 .0054 .0052 .0048 .0046 .0044 .0042 .0040 23 PI .0038 .0037 .0036 .0035 .0034 .0034 .0033 .0033 .0032 .0031 24 PI .0030 .0030 .0029 .0028 .0027 .0027 .0026 .0026 .0025 .0024 25 PI .0023 .0023 .0022 .0023 .0022 .0022 .0022 .0021 .0021 .0021 26 PI .0021 .0020 .0020 .0020 .0019 .0020 .0019 .0019 .0018 .0018 27 PI .0018 .0018 .0017 .0018 .0017 .0017 .0016 .0017 .0016 .0016 28 PI .0015 .0016 .0015 .0015 .0015 .0014 .0014 .0014 .0013 .0014 29 PI .0013 .0013 .0013 .0013 .0013 .0012 .0013 .0013 .0012 .0013 30 PI .0012 .0013 .0012 .0013 .0012 .0012 .0013 .0012 .0012 .0012 31 PI .0012 .0012 .0012 .0012 .0012 .0011 .0012 .0012 .0011 .0012 32 PI .0011 .0012 .0011 .0012 .0011 .0011 .0012 .0011 .0011 .0011 33 PI .0011 34 KM EAST PRE-DEVELOPED CONDITIONS 35 KO 5 0 0 0 21 36 BA .0018 37 LS 0 70.0 0 38 UD 0.319 1 HEC-1 INPUT PAGE 2 LINE ID.......1.......2.......3.......4.......5.......6.......7.......8.......9......10 39 KK PRE2 40 KM WEST PRE-DEVELOPED CONDITIONS 41 KO 5 0 0 0 21 42 BA .0028 43 LS 0 70.0 0 44 UD 0.319 45 KK COMB1 46 KO 5 0 0 0 21 47 HC 2 48 KK POST 49 KM POST-DEVELOPED CONDITIONS - ENTIRE DRAINAGE AREA 50 KO 3 0 0 0 21 51 BA .0046 52 LS 0 93.0 0 53 UD 0.050 54 KK DIV 55 KO 5 0 0 0 21 56 DT SF 57 DI 0.00 1.54 3.07 4.46 5.51 10.07 17.56 26.97 37.92 50.20 58 DQ 0.00 1.54 3.07 4.46 5.51 6.39 7.16 7.86 8.50 9.09 59 KK SF 60 KM RECALL HYDROGRAPH THAT WAS DIVERTED TO SAND FILTER 61 KO 5 0 0 0 21 62 DR SF 63 ZZ 1***************************************** *************************************** * * * * * FLOOD HYDROGRAPH PACKAGE (HEC-1) * * U.S. ARMY CORPS OF ENGINEERS * * JUN 1998 * * HYDROLOGIC ENGINEERING CENTER * * VERSION 4.1 * * 609 SECOND STREET * * * * DAVIS, CALIFORNIA 95616 * * RUN DATE 22MAR07 TIME 08:58:39 * * (916) 756-1104 * * * * * ***************************************** *************************************** MECKLENBURG COUNTY BMP DESIGN MANUAL ANALYZED BY ABC ENGINEERING DATE: OCTOBER 2006 *** *** *** *** *** *** *** *** *** *** *** *** *** *** *** *** *** *** *** *** *** *** *** *** *** *** *** *** *** *** *** *** *** **************

Charlotte-Mecklenburg BMP Design Manual July 1, 2013
4.8.36
* * 48 KK * POST * * * ************** TOTAL RAINFALL = 2.58, TOTAL LOSS = .73, TOTAL EXCESS = 1.85 RUNOFF SUMMARY FLOW IN CUBIC FEET PER SECOND TIME IN HOURS, AREA IN SQUARE MILES PEAK TIME OF AVERAGE FLOW FOR MAXIMUM PERIOD BASIN MAXIMUM TIME OF OPERATION STATION FLOW PEAK AREA STAGE MAX STAGE + 6-HOUR 24-HOUR 72-HOUR HYDROGRAPH AT + PRE1 0. 12.35 0. 0. 0. .00 HYDROGRAPH AT + PRE2 1. 12.35 0. 0. 0. .00 2 COMBINED AT + COMB1 1. 12.35 0. 0. 0. .00 HYDROGRAPH AT + POST 8. 12.02 1. 0. 0. .00 DIVERSION TO + SF 6. 12.02 1. 0. 0. .00 HYDROGRAPH AT + DIV 2. 12.02 0. 0. 0. .00 HYDROGRAPH AT + SF 6. 12.02 1. 0. 0. .00 *** NORMAL END OF HEC-1 ***
Step 8 Compute Release Rates for Water Quality Control and Channel Protection
Volume The following outlet hydraulic computations are performed using the Static Method. Routing computations must be performed to refine the design. The routing computations must show that a minimum of 5 percent of the runoff volume is held within the storage volume after the design duration time beyond the center of rainfall.
• Compute the release rate for water quality control.
The Water Quality Volume (WQv) is to be released over a 1.0 day period beyond the center of rainfall (24 hours plus 3 hours). Release rate = (0.19 ac-ft x 43560 ft2/acre)/(27.0 hrs x 3,600 sec/hr) = 0.085 cfs
• Compute the release rate for Channel Protection Volume (CPv).
The Channel Protection Volume (CPv) is to be released over a 24-hour period beyond the center of rainfall (24 hours plus 12 hours). Release rate = (0.26 ac-ft x 43560 ft2/acre)/(36 hrs x 3,600 sec/hr) = 0.087 cfs
Step 9 Compute Sedimentation Chamber Volume The sedimentation chamber storage area above the filter media must be sized to hold 20 percent of the Water Quality Volume (WQv) in order to remove trash and large sediment particles. Sediment Chambervol = (0.19 acre-feet)(43,560sq ft/acre)(0.20) = 1,655 ft3 For the underground configuration, a three foot depth is effective in providing storage volume for the sedimentation chamber (two feet of headwater storage above the top of sand filter plus one foot below the top of sand filter for sediment and trash storage). A sedimentation chamber 828 ft2 (1,655 ft3/2 feet) in area will meet the requirements for pre-treatment. Note that in the previous sand filter example shown in Section 4.8.8. the sedimentation chamber was increased in size in order to control the Channel Protection

Charlotte-Mecklenburg BMP Design Manual July 1, 2013
4.8.37
Volume (CPv) and provide attenuation for the 10-year, 6-hour storm event. For this example, the combination of the sand filter and above-ground detention will allow the underground sedimentation chamber size to not be increased as much because the 1-year, 24-hour storm event is controlled with the above-ground extended dry detention facility. Step 10 Compute Sand Filter Area to Treat Water Quality Volume Size the sand filter ponding/filter area based on Darcy’s equation. Assume that all of the filter media capacity is effective and that no surface area is ineffective due to clogging. A value of 1.75 inch/hour (3.5 ft/day) for the coefficient of permeability of the filter media is required. The detention time is one day beyond the center of rainfall for the 6-hour storm (24 hours plus 3 hours is 27 hours)
Af = (WQv)(df)/[(k)(hf+df)(tf)] Where: Af = surface area of filter bed (ft2) df = filter bed depth (ft)
k = coefficient of permeability of filter media (ft/day) hf = average height of water above filter bed (ft) tf = design filter bed drain time (days)
Af = (0.19 acre-ft)(43560 sf/ac)(2.0 ft) [(3.5ft/day)(1.0ft+2.0ft)(1.13 days)] = 1,395.1 sq ft Use 38 foot by 38 foot sand filter
Step 11a Develop Sand Filter Storage-Elevation Table Figure 4.8.9 shows the sand filter and extended dry detention location on site, Figure 4.8.11 shows the plan view of the sand filter, Figure 4.8.12 shows the plan view of the extended dry detention. Table 4.8.10 shows the storage-elevation data for the sand filter. Table 4.8.11 shows the storage-elevation data for the extended dry detention. Note that the storage volumes presented for the sand filter do not result from an iterative process of routing three design storm events through the facility; the 1-inch, 6-hour, 1-year, 24-hour, and 10-year, 6-hour storm events. The sand filter storage volumes presented are direct results of sedimentation chamber size and filter media foot print size computations because the other design requirements; 10-year, 6-hour storm event peak attenuation is provided by diverting to a downstream BMP facility. A portion of the 50-year storm event is routed through the facility to ensure that the facility and surrounding buildings area not impacted. Also, note that storage volume below the top of the sand filter in the sedimentation chamber is ignored in the routing computations. Storm water runoff does not discharge from that storage volume with a positive outflow.

Charlotte-Mecklenburg BMP Design Manual July 1, 2013
4.8.38
Figure 4.8.11 Plan View of Sand Filter
Figure 4.8.12 Plan View of Extended Dry Detention

Charlotte-Mecklenburg BMP Design Manual July 1, 2013
4.8.39
Table 4.8.10 Sand Filter Storage-Elevation Data
Elevation Area (sf) Area (ac) Avg. Area (ac) Height (ft) Inc vol (ac-
ft) Acc vol (ac-
ft) 734 2,272 0.052 0.000
734.5 2,272 0.052 0.052 0.5 0.026 0.026 735 2,272 0.052 0.052 0.5 0.026 0.052
735.5 2,272 0.052 0.052 0.5 0.026 0.078 736 2,272 0.052 0.052 0.5 0.026 0.104
736.5 2,272 0.052 0.052 0.5 0.026 0.130 737 2,272 0.052 0.052 0.5 0.026 0.156
Table 4.8.11 Extended Dry Detention Storage-Elevation Data
Elevation Area (sf) Area (ac) Avg. Area (ac) Height (ft) Inc vol (ac-
ft) Acc vol (ac-
ft) 734 3,500 0.080 0.000 735 3,500 0.080 0.080 1.0 0.080 0.080 736 3,500 0.080 0.080 1.0 0.080 0.160 737 3,500 0.080 0.080 1.0 0.080 0.240 738 3,500 0.080 0.080 1.0 0.080 0.320 739 3,500 0.080 0.080 1.0 0.080 0.400
Step 11b Develop Stage-Discharge for Sand Filter Media The 1-inch, 6-hour storm event and portions of the more severe storm events will flow through the filter media. The filter media flow conditions must be assessed in order to derive the relation for the stage-discharge and in order to perform routing computations. The routing must be performed for the storage area above the filter media, and not the area within the filter media. Therefore, all of the computations are based on elevation above the top of the filter media. Outflow when runoff is below the top of the filter media is ignored and assumed to be zero when the depth of flow is equal to the top of media. The percentage of the filter media that is assumed to be clogged during the surface area computation procedure (0 percent) should be considered when computing the outflow conditions. Af = (WQv)(df)/[(k)(hf+df)(tf)]
WQv/tf = Qo = Af (k)(hf+df)/(df)) where: Af = surface area of filter bed (ft2) df = filter bed depth (ft)
k = coefficient of permeability of filter media (ft/day) hf = average height of water above filter bed (ft)
At elevation 737, three feet above the top of filter media Qo = (1,444ft2)[(3.5ft/day)(3.0ft+2.0ft)]/(2.0 ft) = 12,635.0 cf/day = 0.146 cfs
At elevation 736, two feet above the top of filter media Qo = (1,444ft2)[(3.5ft/day)(2.0ft+2.0ft)]/(2.0 ft) = 10.108.0 cf/day = 0.117 cfs

Charlotte-Mecklenburg BMP Design Manual July 1, 2013
4.8.40
At elevation 735, one foot above the top of filter media Qo = [(1,444ft2)[(3.5ft/day)(1.0ft+2.0ft)]/(2.0 ft) = 7,581 cf/day = 0.088 cfs At elevation 734, top of filter media Qo = 0.00 cfs
Step 12a Route Runoff Hydrographs through Sand Filter Route all of the appropriate runoff hydrographs through the sand filter facility with the following goals:
1-inch, 6-hour storm event through the filter media with less than 24 inches of ponding depth. Ensure that the 1 day detention time design requirement is being met by holding 5 percent of the 1-inch, 6-hour runoff volume within the storage volume.
1-year, 24-hour; 10-year, 6-hour, and 50-year, 6-hour storm event through the filter media and over flow structure with maximum 5 feet of ponding depth.
Hold 5 percent of the 1-year, 24-hour storm event within the sand filter and/or extended dry detention storage volume 24 hours after the center of rainfall.
Attenuate the 10-year, 6-hour storm events to pre-development levels. Note that a portion of the site is being diverted, therefore the pre-developed target discharge is based on only the amount of watershed that was flowing in that direction in pre-developed conditions, and additional attenuation and detention storage are required.
The following HEC-1 file provides the results of the first iteration of the 1-inch, 6-hour storm event routing. The peak water surface elevation is shown to by 736.90 with the entire 1-inch storm event flowing through the filter media. The routed peak water surface elevation is 2.90 feet which is greater than the allowable 2.0 feet. The peak flow is attenuated from 5.51 cfs to 0.14 cfs. Three (3.1%) percent of the 1-inch, 6-hour storm event is shown to remain within the sand filter storage volume at 27 hours (1day after the center of rainfall). Therefore, additional iterations are necessary to reduce the peak stage while increasing the attenuation benefits so that the design goal of holding 5% of the runoff volume at 27 hours is met. The revisions that are implemented during the iterations are to increase the storage area by increasing the sedimentation chamber while leaving the outflow through the sand filter at the same value. 1***************************************** *************************************** * * * * * FLOOD HYDROGRAPH PACKAGE (HEC-1) * * U.S. ARMY CORPS OF ENGINEERS * * JUN 1998 * * HYDROLOGIC ENGINEERING CENTER * * VERSION 4.1 * * 609 SECOND STREET * * * * DAVIS, CALIFORNIA 95616 * * RUN DATE 10APR08 TIME 15:22:55 * * (916) 756-1104 * * * * * ***************************************** *************************************** X X XXXXXXX XXXXX X X X X X X XX X X X X X XXXXXXX XXXX X XXXXX X X X X X X X X X X X X X X XXXXXXX XXXXX XXX THIS PROGRAM REPLACES ALL PREVIOUS VERSIONS OF HEC-1 KNOWN AS HEC1 (JAN 73), HEC1GS, HEC1DB, AND HEC1KW. THE DEFINITIONS OF VARIABLES -RTIMP- AND -RTIOR- HAVE CHANGED FROM THOSE USED WITH THE 1973-STYLE INPUT STRUCTURE. THE DEFINITION OF -AMSKK- ON RM-CARD WAS CHANGED WITH REVISIONS DATED 28 SEP 81. THIS IS THE FORTRAN77 VERSION NEW OPTIONS: DAMBREAK OUTFLOW SUBMERGENCE , SINGLE EVENT DAMAGE CALCULATION, DSS:WRITE STAGE FREQUENCY, DSS:READ TIME SERIES AT DESIRED CALCULATION INTERVAL LOSS RATE:GREEN AND AMPT INFILTRATION KINEMATIC WAVE: NEW FINITE DIFFERENCE ALGORITHM 1 HEC-1 INPUT PAGE 1 LINE ID.......1.......2.......3.......4.......5.......6.......7.......8.......9......10 1 ID CHARLOTTE-MECKLENBURG POST CONSTRUCTION DESIGN MANUAL 2 ID ANALYZED BY ABC ENGINEERING 3 ID DATE: OCTOBER 2006 * **************************************************************************** * * TIME SPECIFICATION CARD * TOTAL MODEL DURATION - 27 HOURS * 24 HOURS AFTER CENTER OF 6 HOUR RAINFALL

Charlotte-Mecklenburg BMP Design Manual July 1, 2013
4.8.41
4 IT 1 0 0 1620 * DIAGRAM * TIME INTERVAL CARD 5 IN 5 0 0 * * OUTPUT CONTROL CARD 6 IO 5 0 0 * 7 KK PRE1 * ***************************************************************************** * **************** 1-INCH, 6 HOUR STORM EVENT ********************************* * ***************************************************************************** 8 PI .000 .003 .003 .003 .003 .003 .003 .004 .004 .004 9 PI .004 .004 .004 .004 .004 .005 .005 .005 .005 .006 10 PI .007 .007 .007 .008 .008 .009 .009 .010 .011 .012 11 PI .013 .019 .022 .025 .039 .050 .108 .188 .075 .043 12 PI .028 .023 .020 .014 .012 .011 .010 .009 .009 .008 13 PI .008 .007 .007 .007 .006 .005 .005 .005 .005 .005 14 PI .004 .004 .004 .004 .004 .004 .004 .004 .003 .003 15 PI .003 .003 .003 .000 * ***************************************************************************** 16 KM EAST SUB-BASIN PRE-DEVELOPED CONDITIONS 17 KO 5 0 0 0 21 18 BA .0018 19 LS 0 69.9 0 20 UD 0.319 21 KK PRE2 22 KM WEST SUB-BASIN PRE-DEVELOPED CONDITIONS 23 KO 5 0 0 0 21 24 BA .0028 25 LS 0 69.9 0 26 UD 0.319 27 KK COMB1 28 KO 5 0 0 0 21 29 HC 2 30 KK POST1 31 KM POST-DEVELOPED CONDITIONS - ENTIRE DRAINAGE AREA 32 KO 3 0 0 0 21 33 BA .0046 34 LS 0 97.7 0 35 UD 0.050 1 HEC-1 INPUT PAGE 2 LINE ID.......1.......2.......3.......4.......5.......6.......7.......8.......9......10 36 KK DIV 37 KO 5 0 0 0 21 38 DT SF 39 DI 0.00 1.54 3.07 4.46 5.51 10.07 17.56 26.97 37.92 50.20 40 DQ 0.00 1.54 3.07 4.46 5.51 6.39 7.16 7.86 8.50 9.09 41 KK SF 42 KM RECALL HYDROGRAPH THAT WAS DIVERTED TO SAND FILTER 43 KO 5 0 0 0 21 44 DR SF 45 KK SFROU 46 KO 3 0 0 0 21 47 KM ROUTE DIVERTED HYDROGRAPH THROUGH THE SAND FILTER FACILITY 48 KM NO OVERFLOW STRUCTURE INCLUDED IN STAGE-DISCHARGE; ALL FLOW THROUGH FILTER ME 49 RS 1 ELEV 734 50 SV 0 .026 .052 .078 .104 .130 .156 51 SE 734 734.5 735 735.5 736 736.5 737 52 SQ 0.00 0.073 0.088 0.102 0.117 0.132 0.146 53 SE 734 734.5 735 735.5 736 736.5 737 54 ZZ 1***************************************** *************************************** * * * * * FLOOD HYDROGRAPH PACKAGE (HEC-1) * * U.S. ARMY CORPS OF ENGINEERS * * JUN 1998 * * HYDROLOGIC ENGINEERING CENTER * * VERSION 4.1 * * 609 SECOND STREET * * * * DAVIS, CALIFORNIA 95616 * * RUN DATE 10APR08 TIME 15:22:55 * * (916) 756-1104 * * * * * ***************************************** *************************************** CHARLOTTE-MECKLENBURG POST CONSTRUCTION DESIGN MANUAL ANALYZED BY ABC ENGINEERING DATE: OCTOBER 2006 HYDROGRAPH AT STATION POST1 TOTAL RAINFALL = 1.00, TOTAL LOSS = .24, TOTAL EXCESS = .76 1 RUNOFF SUMMARY FLOW IN CUBIC FEET PER SECOND TIME IN HOURS, AREA IN SQUARE MILES PEAK TIME OF AVERAGE FLOW FOR MAXIMUM PERIOD BASIN MAXIMUM TIME OF OPERATION STATION FLOW PEAK AREA STAGE MAX STAGE + 6-HOUR 24-HOUR 72-HOUR HYDROGRAPH AT + PRE1 0. 4.87 0. 0. 0. .00 HYDROGRAPH AT + PRE2 0. 5.78 0. 0. 0. .00 2 COMBINED AT + COMB1 0. 5.52 0. 0. 0. .00 HYDROGRAPH AT

Charlotte-Mecklenburg BMP Design Manual July 1, 2013
4.8.42
+ POST1 5. 3.18 0. 0. 0. .00 DIVERSION TO + SF 5. .00 0. 0. 0. .00 HYDROGRAPH AT + DIV 0. .00 0. 0. 0. .00 HYDROGRAPH AT + SF 5. 3.18 0. 0. 0. .00 ROUTED TO + SFROU 0. 4.72 0. 0. 0. .00 + 736.90 5.10 *** NORMAL END OF HEC-1 ***
The following HEC-1 file provides the results of the additional iterations of the 1-inch, 6-hour storm event routing to result in a peak water surface elevation less than 2 feet and to hold more than 5% of the runoff in the BMP at 27 hours. The peak water surface elevation is shown to by 735.94 with the entire 1-inch storm event flowing through the filter media. The peak flow is attenuated from 5.51 cfs to 0.14 cfs. Approximately ten (9.6%) percent of the 1-inch, 6-hour storm event is shown to remain within the sand filter storage volume at 27 hours (1 day after the center of rainfall). The sand filter footprint cannot be reduced because the size must meet the footprint requirements derived by the Darcy equation. Therefore, the sand filter footprint remains as 38 feet by 38 feet. The sedimentation chamber is increased from a footprint area of 828 square feet to 2,070 square feet, an increase of 150 percent. The resulting sedimentation chamber holds 4,140 cubic feet which is 50 percent of the Water Quality Volume (WQv), not 20 percent that is required by the design specifications. 1***************************************** *************************************** * * * * * FLOOD HYDROGRAPH PACKAGE (HEC-1) * * U.S. ARMY CORPS OF ENGINEERS * * JUN 1998 * * HYDROLOGIC ENGINEERING CENTER * * VERSION 4.1 * * 609 SECOND STREET * * * * DAVIS, CALIFORNIA 95616 * * RUN DATE 10APR08 TIME 16:26:12 * * (916) 756-1104 * * * * * ***************************************** *************************************** X X XXXXXXX XXXXX X X X X X X XX X X X X X XXXXXXX XXXX X XXXXX X X X X X X X X X X X X X X XXXXXXX XXXXX XXX THIS PROGRAM REPLACES ALL PREVIOUS VERSIONS OF HEC-1 KNOWN AS HEC1 (JAN 73), HEC1GS, HEC1DB, AND HEC1KW. THE DEFINITIONS OF VARIABLES -RTIMP- AND -RTIOR- HAVE CHANGED FROM THOSE USED WITH THE 1973-STYLE INPUT STRUCTURE. THE DEFINITION OF -AMSKK- ON RM-CARD WAS CHANGED WITH REVISIONS DATED 28 SEP 81. THIS IS THE FORTRAN77 VERSION NEW OPTIONS: DAMBREAK OUTFLOW SUBMERGENCE , SINGLE EVENT DAMAGE CALCULATION, DSS:WRITE STAGE FREQUENCY, DSS:READ TIME SERIES AT DESIRED CALCULATION INTERVAL LOSS RATE:GREEN AND AMPT INFILTRATION KINEMATIC WAVE: NEW FINITE DIFFERENCE ALGORITHM 1 HEC-1 INPUT PAGE 1 LINE ID.......1.......2.......3.......4.......5.......6.......7.......8.......9......10 1 ID CHARLOTTE-MECKLENBURG POST CONSTRUCTION DESIGN MANUAL 2 ID ANALYZED BY ABC ENGINEERING 3 ID DATE: OCTOBER 2006 * **************************************************************************** * * TIME SPECIFICATION CARD * TOTAL MODEL DURATION - 27 HOURS * 24 HOURS AFTER CENTER OF 6 HOUR RAINFALL 4 IT 1 0 0 1620 * DIAGRAM * TIME INTERVAL CARD 5 IN 5 0 0 * * OUTPUT CONTROL CARD 6 IO 5 0 0 * 7 KK PRE1 * ***************************************************************************** * **************** 1-INCH, 6 HOUR STORM EVENT ********************************* * ***************************************************************************** 8 PI .000 .003 .003 .003 .003 .003 .003 .004 .004 .004 9 PI .004 .004 .004 .004 .004 .005 .005 .005 .005 .006 10 PI .007 .007 .007 .008 .008 .009 .009 .010 .011 .012 11 PI .013 .019 .022 .025 .039 .050 .108 .188 .075 .043 12 PI .028 .023 .020 .014 .012 .011 .010 .009 .009 .008 13 PI .008 .007 .007 .007 .006 .005 .005 .005 .005 .005 14 PI .004 .004 .004 .004 .004 .004 .004 .004 .003 .003 15 PI .003 .003 .003 .000 * *****************************************************************************

Charlotte-Mecklenburg BMP Design Manual July 1, 2013
4.8.43
16 KM EAST SUB-BASIN PRE-DEVELOPED CONDITIONS 17 KO 5 0 0 0 21 18 BA .0018 19 LS 0 69.9 0 20 UD 0.319 21 KK PRE2 22 KM WEST SUB-BASIN PRE-DEVELOPED CONDITIONS 23 KO 5 0 0 0 21 24 BA .0028 25 LS 0 69.9 0 26 UD 0.319 27 KK COMB1 28 KO 5 0 0 0 21 29 HC 2 30 KK POST1 31 KM POST-DEVELOPED CONDITIONS - ENTIRE DRAINAGE AREA 32 KO 3 0 0 0 21 33 BA .0046 34 LS 0 97.7 0 35 UD 0.050 1 HEC-1 INPUT PAGE 2 LINE ID.......1.......2.......3.......4.......5.......6.......7.......8.......9......10 36 KK DIV 37 KO 5 0 0 0 21 38 DT SF 39 DI 0.00 1.54 3.07 4.46 5.51 10.07 17.56 26.97 37.92 50.20 40 DQ 0.00 1.54 3.07 4.46 5.51 6.39 7.16 7.86 8.50 9.09 41 KK SF 42 KM RECALL HYDROGRAPH THAT WAS DIVERTED TO SAND FILTER 43 KO 5 0 0 0 21 44 DR SF 45 KK SFROU 46 KO 3 0 0 0 21 47 KM ROUTE DIVERTED HYDROGRAPH THROUGH THE SAND FILTER FACILITY 48 KM NO OVERFLOW STRUCTURE INCLUDED IN STAGE-DISCHARGE; ALL FLOW THROUGH FILTER ME 49 RS 1 ELEV 734 50 SV 0 .041 .083 .123 .162 .201 .240 51 SE 734 734.5 735 735.5 736 736.5 737 52 SQ 0.00 0.073 0.088 0.102 0.117 0.132 0.146 53 SE 734 734.5 735 735.5 736 736.5 737 54 ZZ 1***************************************** *************************************** * * * * * FLOOD HYDROGRAPH PACKAGE (HEC-1) * * U.S. ARMY CORPS OF ENGINEERS * * JUN 1998 * * HYDROLOGIC ENGINEERING CENTER * * VERSION 4.1 * * 609 SECOND STREET * * * * DAVIS, CALIFORNIA 95616 * * RUN DATE 10APR08 TIME 16:26:12 * * (916) 756-1104 * * * * * ***************************************** *************************************** CHARLOTTE-MECKLENBURG POST CONSTRUCTION DESIGN MANUAL ANALYZED BY ABC ENGINEERING DATE: OCTOBER 2006 1 RUNOFF SUMMARY FLOW IN CUBIC FEET PER SECOND TIME IN HOURS, AREA IN SQUARE MILES PEAK TIME OF AVERAGE FLOW FOR MAXIMUM PERIOD BASIN MAXIMUM TIME OF OPERATION STATION FLOW PEAK AREA STAGE MAX STAGE + 6-HOUR 24-HOUR 72-HOUR HYDROGRAPH AT + PRE1 0. 4.87 0. 0. 0. .00 HYDROGRAPH AT + PRE2 0. 5.78 0. 0. 0. .00 2 COMBINED AT + COMB1 0. 5.52 0. 0. 0. .00 HYDROGRAPH AT + POST1 5. 3.18 0. 0. 0. .00 DIVERSION TO + SF 5. .00 0. 0. 0. .00 HYDROGRAPH AT + DIV 0. .00 0. 0. 0. .00 HYDROGRAPH AT + SF 5. 3.18 0. 0. 0. .00 ROUTED TO + SFROU 0. 5.42 0. 0. 0. .00 + 735.94 5.73 *** NORMAL END OF HEC-1 ***
The following HEC-1 file provides the results of an iterative process to control the 1-year, 24-hour storm event routing. The design process is iterative and is performed in concert with the design process for

Charlotte-Mecklenburg BMP Design Manual July 1, 2013
4.8.44
peak flow attenuation for the 10-year, 6-hour storm event. The initial goal is to minimize the storage within the sand filter and maximize the storage within the extended dry detention basin because the relative cost of the underground sand filter is expected to be much greater than the above ground extended dry detention basin. However, some of the first iterations resulted in a conclusion that the flood control attenuation benefits of the extended dry detention basin could be maximized but the overall site flood controls were still not met. In other words, reducing the extended dry detention outflow to near zero would still not meet the pre-development target rates because the sand filter outflow was higher than pre-developed rates. Therefore, additional flood control must be provided by the storage volume above the sand filter to supplement the flood control benefits of the extended dry detention basin. The iterative process included increasing the storage volume above the sand filter and decreasing the outlet orifice until more than 5 percent of the 1-year, 24-hour storm event runoff is held within the sand filter after 36 hours (24 hours past the center of the rainfall – 12 hours). The iterative process requires the designer to export the hydrograph to a spreadsheet and compute the hydrograph volume before and after the time of interest or setting the total HEC-1 model time to the time of interest and comparing the routed hydrograph volume with the total runoff hydrograph volume. The design goal to control the 1-year, 24-hour storm event for 24 hours past the center of rainfall is complex because of the two BMPs that are designed to perform as parallel facilities. To assess if the design goal is met, several different checks must be performed. The first design check is straight-forward and is focused on the sand filter facility. The majority of runoff volume for the 1-year, 24-hour storm event is diverted to the sand filter. The diverted hydrograph includes most of the smaller peak flows because higher flows are diverted to the extended dry detention basin. Determining if the 1-year, 24-hour storm event is controlled for the design duration is assessed by comparing the sand filter inflow hydrograph (diverted hydrograph) to the sand filter outflow hydrograph. The entire site 1-year, 24-hour hydrograph should not be used in the comparison. The second check is more complex and requires checking of the combined outflows for the sand filter and extended dry detention basin with the entire site post-development hydrograph. 1***************************************** *************************************** * * * * * FLOOD HYDROGRAPH PACKAGE (HEC-1) * * U.S. ARMY CORPS OF ENGINEERS * * JUN 1998 * * HYDROLOGIC ENGINEERING CENTER * * VERSION 4.1 * * 609 SECOND STREET * * * * DAVIS, CALIFORNIA 95616 * * RUN DATE 11APR08 TIME 10:00:52 * * (916) 756-1104 * * * * * ***************************************** *************************************** X X XXXXXXX XXXXX X X X X X X XX X X X X X XXXXXXX XXXX X XXXXX X X X X X X X X X X X X X X XXXXXXX XXXXX XXX THIS PROGRAM REPLACES ALL PREVIOUS VERSIONS OF HEC-1 KNOWN AS HEC1 (JAN 73), HEC1GS, HEC1DB, AND HEC1KW. THE DEFINITIONS OF VARIABLES -RTIMP- AND -RTIOR- HAVE CHANGED FROM THOSE USED WITH THE 1973-STYLE INPUT STRUCTURE. THE DEFINITION OF -AMSKK- ON RM-CARD WAS CHANGED WITH REVISIONS DATED 28 SEP 81. THIS IS THE FORTRAN77 VERSION NEW OPTIONS: DAMBREAK OUTFLOW SUBMERGENCE , SINGLE EVENT DAMAGE CALCULATION, DSS:WRITE STAGE FREQUENCY, DSS:READ TIME SERIES AT DESIRED CALCULATION INTERVAL LOSS RATE:GREEN AND AMPT INFILTRATION KINEMATIC WAVE: NEW FINITE DIFFERENCE ALGORITHM 1 HEC-1 INPUT PAGE 1 LINE ID.......1.......2.......3.......4.......5.......6.......7.......8.......9......10 1 ID CHARLOTTE-MECKLENBURG POST CONSTRUCTION DESIGN MANUAL 2 ID ANALYZED BY ABC ENGINEERING 3 ID DATE: OCTOBER 2006 * **************************************************************************** * * TIME SPECIFICATION CARD * TOTAL MODEL DURATION - 27 HOURS * 24 HOURS AFTER CENTER OF 6 HOUR RAINFALL 4 IT 1 0 0 1620 * DIAGRAM * NOTE INPUT INTERVAL SET TO 6 MINUTES FOR 1-YEAR STORM DISTRIBUTION 5 IN 6 0 0 * * OUTPUT CONTROL CARD 6 IO 5 0 0

Charlotte-Mecklenburg BMP Design Manual July 1, 2013
4.8.45
* 7 KK PRE1 8 PB 2.58 * ***************************************************************************** * ***************** 1-YEAR, 24-HOUR STORM EVENT ******************************* * ********* 6 MINUTE TIME INCREMENT,24-HOUR STORM EVENT *********************** * ***************************************************************************** 9 PI .0000 .0010 .0010 .0010 .0011 .0010 .0011 .0010 .0011 .0011 10 PI .0011 .0011 .0011 .0011 .0012 .0011 .0012 .0011 .0012 .0012 11 PI .0012 .0012 .0012 .0013 .0012 .0012 .0013 .0012 .0013 .0013 12 PI .0013 .0013 .0013 .0013 .0014 .0013 .0014 .0014 .0013 .0014 13 PI .0014 .0014 .0014 .0015 .0015 .0015 .0015 .0015 .0015 .0016 14 PI .0016 .0016 .0016 .0017 .0017 .0016 .0018 .0017 .0017 .0018 15 PI .0018 .0018 .0018 .0019 .0019 .0018 .0020 .0019 .0019 .0020 16 PI .0020 .0020 .0020 .0021 .0021 .0021 .0021 .0021 .0021 .0022 17 PI .0022 .0022 .0024 .0024 .0026 .0026 .0028 .0029 .0029 .0030 18 PI .0032 .0032 .0032 .0032 .0032 .0032 .0033 .0034 .0036 .0038 19 PI .0039 .0041 .0044 .0046 .0048 .0051 .0054 .0058 .0062 .0066 20 PI .0070 .0077 .0086 .0096 .0106 .0115 .0238 .0476 .0764 .1371 21 PI .0951 .0190 .0166 .0144 .0122 .0098 .0084 .0080 .0074 .0068 22 PI .0064 .0060 .0056 .0054 .0052 .0048 .0046 .0044 .0042 .0040 23 PI .0038 .0037 .0036 .0035 .0034 .0034 .0033 .0033 .0032 .0031 24 PI .0030 .0030 .0029 .0028 .0027 .0027 .0026 .0026 .0025 .0024 25 PI .0023 .0023 .0022 .0023 .0022 .0022 .0022 .0021 .0021 .0021 26 PI .0021 .0020 .0020 .0020 .0019 .0020 .0019 .0019 .0018 .0018 27 PI .0018 .0018 .0017 .0018 .0017 .0017 .0016 .0017 .0016 .0016 28 PI .0015 .0016 .0015 .0015 .0015 .0014 .0014 .0014 .0013 .0014 29 PI .0013 .0013 .0013 .0013 .0013 .0012 .0013 .0013 .0012 .0013 30 PI .0012 .0013 .0012 .0013 .0012 .0012 .0013 .0012 .0012 .0012 31 PI .0012 .0012 .0012 .0012 .0012 .0011 .0012 .0012 .0011 .0012 32 PI .0011 .0012 .0011 .0012 .0011 .0011 .0012 .0011 .0011 .0011 33 PI .0011 34 KM EAST SUB-BASIN PRE-DEVELOPED CONDITIONS 35 KO 5 0 0 0 21 36 BA .0018 37 LS 0 69.9 0 38 UD 0.319 1 HEC-1 INPUT PAGE 2 LINE ID.......1.......2.......3.......4.......5.......6.......7.......8.......9......10 39 KK PRE2 40 KM WEST SUB-BASIN PRE-DEVELOPED CONDITIONS 41 KO 5 0 0 0 21 42 BA .0028 43 LS 0 69.9 0 44 UD 0.319 45 KK COMB1 46 KO 5 0 0 0 21 47 HC 2 48 KK POST1 49 KM POST-DEVELOPED CONDITIONS - ENTIRE DRAINAGE AREA 50 KO 3 0 0 0 21 51 BA .0046 52 LS 0 92.6 0 53 UD 0.050 54 KK DIV 55 KO 5 0 0 0 21 56 DT SF 57 DI 0.00 1.54 3.07 4.46 5.51 10.07 17.56 26.97 37.92 50.20 58 DI 63.69 59 DQ 0.00 1.54 3.07 4.46 5.51 6.39 7.16 7.86 8.50 9.09 60 DQ 9.65 61 KK EDROU 62 KO 3 0 0 0 21 63 KM ROUTE BYPASSED HYDROGRAPH THROUGH THE DOWNSTREAM EXTENDED DRY DETENTION 64 KM DESIGN TARGET IS HOLDING COMBINED SAND FILTER AND EXTENDED DRY DETENTION OUTF 65 KM FOR 24 HOURS BEYOND THE CENTER OF THE RAINFALL 66 RS 1 ELEV 730 67 SV 0 .080 .160 .240 .320 68 SE 730 730.5 731 731.5 732 69 SQ 0.00 0.24 0.38 9.68 26.57 70 SE 730 730.5 731 731.5 732 71 KK SF 72 KM RECALL HYDROGRAPH THAT WAS DIVERTED TO SAND FILTER 73 KO 5 0 0 0 21 74 DR SF 75 KK SFROU 76 KO 3 0 0 0 21 77 KM ROUTE DIVERTED HYDROGRAPH THROUGH THE SAND FILTER FACILITY 78 KM NO OVERFLOW STRUCTURE INCLUDED IN STAGE-DISCHARGE; ALL FLOW THROUGH FILTER ME 79 RS 1 ELEV 734 80 SV 0 .041 .083 .123 .162 .201 .240 .282 .323 .364 81 SV .391 0.404 82 SE 734 734.5 735 735.5 736 736.5 737 737.5 738 738.5 83 SE 738.85 739 84 SQ 0.00 0.073 0.088 0.102 0.117 0.132 0.146 0.386 0.626 1.107 85 SQ 1.333 6.706 86 SE 734 734.5 735 735.5 736 736.5 737 737.5 738 738.5 1 HEC-1 INPUT PAGE 3 LINE ID.......1.......2.......3.......4.......5.......6.......7.......8.......9......10 87 SE 738.85 739 88 KK COMBO 89 KO 3 0 0 0 21 90 KM COMBINATION OF SAND FILTER OUTFLOW AND EXTENDED DRY DETENTION OUTFLOW 91 HC 2 92 ZZ 1***************************************** *************************************** * * * *

Charlotte-Mecklenburg BMP Design Manual July 1, 2013
4.8.46
* FLOOD HYDROGRAPH PACKAGE (HEC-1) * * U.S. ARMY CORPS OF ENGINEERS * * JUN 1998 * * HYDROLOGIC ENGINEERING CENTER * * VERSION 4.1 * * 609 SECOND STREET * * * * DAVIS, CALIFORNIA 95616 * * RUN DATE 11APR08 TIME 10:00:52 * * (916) 756-1104 * * * * * ***************************************** *************************************** CHARLOTTE-MECKLENBURG POST CONSTRUCTION DESIGN MANUAL ANALYZED BY ABC ENGINEERING DATE: OCTOBER 2006 1 RUNOFF SUMMARY FLOW IN CUBIC FEET PER SECOND TIME IN HOURS, AREA IN SQUARE MILES PEAK TIME OF AVERAGE FLOW FOR MAXIMUM PERIOD BASIN MAXIMUM TIME OF OPERATION STATION FLOW PEAK AREA STAGE MAX STAGE + 6-HOUR 24-HOUR 72-HOUR HYDROGRAPH AT + PRE1 0. 12.35 0. 0. 0. .00 HYDROGRAPH AT + PRE2 1. 12.35 0. 0. 0. .00 2 COMBINED AT + COMB1 1. 12.35 0. 0. 0. .00 HYDROGRAPH AT + POST1 8. 12.02 1. 0. 0. .00 DIVERSION TO + SF 6. 12.02 1. 0. 0. .00 HYDROGRAPH AT + DIV 2. 12.02 0. 0. 0. .00 ROUTED TO + EDROU 0. 12.13 0. 0. 0. .00 + 730.13 12.13 HYDROGRAPH AT + SF 6. 12.02 1. 0. 0. .00 ROUTED TO + SFROU 0. 13.85 0. 0. 0. .00 + 737.31 13.92 2 COMBINED AT + COMBO 0. 13.65 0. 0. 0. .00 *** NORMAL END OF HEC-1 ***
Step 12b Calculate Q10 Release Rate and Water Surface Elevation(s) The next step of the design process is to design the sand filter and extended dry detention to be used to achieve the peak attenuation goals for the 10-year, 6-hour storm event. This process is similar to previous examples in that the design is iterative. A stage-storage-discharge relations is developed assuming an outflow orifice and/or weir and storage area. The storm event is routed through the storage volume, and the outflow peak discharge is compared to the pre-development peak discharge for the 10-year, 6-hour storm event; 3.48 cfs. In addition, the peak stage for the 10-year, 6-hour storm events must be less than 5 feet above the top of the filter media. The following HEC-1 output files illustrate the results of the iterative process for the 10-year storm event where both the sand filter and extended dry detention basin attenuation benefits are maximize. The sand filter uses a 0.15 foot weir that is installed at elevation 737.0, 3 feet above the sand filter media to attenuate the post-developed discharge to the appropriate value for the 10-year, 6-hour storm event. The extended dry detention basin uses a 4-inch diameter orifice at the invert of the basin. The TAPE21 file indicates that the peak discharge for the 10-year, 6-hour storm event is 1.62 cfs with a peak stage of 738.83 for the sand filter and 730.83 for the extended dry detention basin. Note that the peak stage is 4.83 feet above the top of the sand filter media. The 4.83 feet ponding depth is less than the allowable 5 feet depth. Also note that the peak stage in the extended dry detention basin is only 0.83 feet because of the minimal opportunity for benefit for flood attenuation from the extended dry detention basin because the majority of the hydrograph is diverted into the sand filter. Intermediate steps are not presented. 1***************************************** *************************************** * * * * * FLOOD HYDROGRAPH PACKAGE (HEC-1) * * U.S. ARMY CORPS OF ENGINEERS * * JUN 1998 * * HYDROLOGIC ENGINEERING CENTER *

Charlotte-Mecklenburg BMP Design Manual July 1, 2013
4.8.47
* VERSION 4.1 * * 609 SECOND STREET * * * * DAVIS, CALIFORNIA 95616 * * RUN DATE 11APR08 TIME 10:07:46 * * (916) 756-1104 * * * * * ***************************************** *************************************** X X XXXXXXX XXXXX X X X X X X XX X X X X X XXXXXXX XXXX X XXXXX X X X X X X X X X X X X X X XXXXXXX XXXXX XXX THIS PROGRAM REPLACES ALL PREVIOUS VERSIONS OF HEC-1 KNOWN AS HEC1 (JAN 73), HEC1GS, HEC1DB, AND HEC1KW. THE DEFINITIONS OF VARIABLES -RTIMP- AND -RTIOR- HAVE CHANGED FROM THOSE USED WITH THE 1973-STYLE INPUT STRUCTURE. THE DEFINITION OF -AMSKK- ON RM-CARD WAS CHANGED WITH REVISIONS DATED 28 SEP 81. THIS IS THE FORTRAN77 VERSION NEW OPTIONS: DAMBREAK OUTFLOW SUBMERGENCE , SINGLE EVENT DAMAGE CALCULATION, DSS:WRITE STAGE FREQUENCY, DSS:READ TIME SERIES AT DESIRED CALCULATION INTERVAL LOSS RATE:GREEN AND AMPT INFILTRATION KINEMATIC WAVE: NEW FINITE DIFFERENCE ALGORITHM 1 HEC-1 INPUT PAGE 1 LINE ID.......1.......2.......3.......4.......5.......6.......7.......8.......9......10 1 ID CHARLOTTE-MECKLENBURG POST CONSTRUCTION DESIGN MANUAL 2 ID ANALYZED BY ABC ENGINEERING 3 ID DATE: OCTOBER 2006 * **************************************************************************** * * TIME SPECIFICATION CARD * TOTAL MODEL DURATION - 27 HOURS * 24 HOURS AFTER CENTER OF 6 HOUR RAINFALL 4 IT 1 0 0 1620 * DIAGRAM * TIME INTERVAL CARD 5 IN 5 0 0 * * OUTPUT CONTROL CARD 6 IO 5 0 0 * 7 KK PRE1 * ***************************************************************************** * ***************** 10-YEAR, 6-HOUR STORM EVENT ******************************* * ***************************************************************************** 8 PI .000 .011 .011 .012 .012 .012 .012 .013 .013 .013 9 PI .014 .014 .015 .015 .016 .016 .017 .018 .018 .023 10 PI .024 .025 .026 .027 .029 .036 .039 .042 .045 .049 11 PI .054 .079 .089 .103 .161 .201 .395 .590 .275 .177 12 PI .112 .095 .084 .057 .051 .047 .043 .040 .038 .030 13 PI .028 .027 .025 .024 .023 .019 .018 .017 .017 .016 14 PI .016 .015 .015 .014 .014 .013 .013 .013 .012 .012 15 PI .012 .011 .011 .000 16 KM EAST SUB-BASIN PRE-DEVELOPED CONDITIONS 17 KO 5 0 0 0 21 18 BA .0018 19 LS 0 69.9 0 20 UD 0.319 21 KK PRE2 22 KM WEST SUB-BASIN PRE-DEVELOPED CONDITIONS 23 KO 5 0 0 0 21 24 BA .0028 25 LS 0 69.9 0 26 UD 0.319 27 KK COMB1 28 KO 5 0 0 0 21 29 HC 2 30 KK POST1 31 KM POST-DEVELOPED CONDITIONS - ENTIRE DRAINAGE AREA 32 KO 3 0 0 0 21 33 BA .0046 34 LS 0 92.6 0 35 UD 0.050 1 HEC-1 INPUT PAGE 2 LINE ID.......1.......2.......3.......4.......5.......6.......7.......8.......9......10 36 KK DIV 37 KO 5 0 0 0 21 38 DT SF 39 DI 0.00 1.54 3.07 4.46 5.51 10.07 17.56 26.97 37.92 50.20 40 DI 63.69 41 DQ 0.00 1.54 3.07 4.46 5.51 6.39 7.16 7.86 8.50 9.09 42 DQ 9.65 43 KK EDROU 44 KO 3 0 0 0 21 45 KM ROUTE BYPASSED HYDROGRAPH THROUGH THE DOWNSTREAM EXTENDED DRY DETENTION 46 KM DESIGN TARGET IS HOLDING COMBINED SAND FILTER AND EXTENDED DRY DETENTION OUTF 47 KM FOR 24 HOURS BEYOND THE CENTER OF THE RAINFALL 48 RS 1 ELEV 730 49 SV 0 .080 .160 .240 .320 50 SE 730 730.5 731 731.5 732 51 SQ 0.00 0.24 0.38 9.68 26.57 52 SE 730 730.5 731 731.5 732 53 KK SF 54 KM RECALL HYDROGRAPH THAT WAS DIVERTED TO SAND FILTER

Charlotte-Mecklenburg BMP Design Manual July 1, 2013
4.8.48
55 KO 5 0 0 0 21 56 DR SF 57 KK SFROU 58 KO 3 0 0 0 21 59 KM ROUTE DIVERTED HYDROGRAPH THROUGH THE SAND FILTER FACILITY 60 KM NO OVERFLOW STRUCTURE INCLUDED IN STAGE-DISCHARGE; ALL FLOW THROUGH FILTER ME 61 RS 1 ELEV 734 62 SV 0 .041 .083 .123 .162 .201 .240 .282 .323 .364 63 SV .391 0.404 64 SE 734 734.5 735 735.5 736 736.5 737 737.5 738 738.5 65 SE 738.85 739 66 SQ 0.00 0.073 0.088 0.102 0.117 0.132 0.146 0.386 0.626 1.107 67 SQ 1.333 6.706 68 SE 734 734.5 735 735.5 736 736.5 737 737.5 738 738.5 69 SE 738.85 739 70 KK COMBO 71 KO 3 0 0 0 21 72 KM COMBINATION OF SAND FILTER OUTFLOW AND EXTENDED DRY DETENTION OUTFLOW 73 HC 2 74 ZZ 1***************************************** *************************************** * * * * * FLOOD HYDROGRAPH PACKAGE (HEC-1) * * U.S. ARMY CORPS OF ENGINEERS * * JUN 1998 * * HYDROLOGIC ENGINEERING CENTER * * VERSION 4.1 * * 609 SECOND STREET * * * * DAVIS, CALIFORNIA 95616 * * RUN DATE 11APR08 TIME 10:07:46 * * (916) 756-1104 * * * * * ***************************************** *************************************** CHARLOTTE-MECKLENBURG POST CONSTRUCTION DESIGN MANUAL ANALYZED BY ABC ENGINEERING DATE: OCTOBER 2006 1 RUNOFF SUMMARY FLOW IN CUBIC FEET PER SECOND TIME IN HOURS, AREA IN SQUARE MILES PEAK TIME OF AVERAGE FLOW FOR MAXIMUM PERIOD BASIN MAXIMUM TIME OF OPERATION STATION FLOW PEAK AREA STAGE MAX STAGE + 6-HOUR 24-HOUR 72-HOUR HYDROGRAPH AT + PRE1 1. 3.52 0. 0. 0. .00 HYDROGRAPH AT + PRE2 2. 3.52 0. 0. 0. .00 2 COMBINED AT + COMB1 3. 3.52 1. 0. 0. .00 HYDROGRAPH AT + POST1 17. 3.18 1. 0. 0. .00 DIVERSION TO + SF 7. 3.18 1. 0. 0. .00 HYDROGRAPH AT + DIV 10. 3.18 0. 0. 0. .00 ROUTED TO + EDROU 0. 3.35 0. 0. 0. .00 + 730.83 3.37 HYDROGRAPH AT + SF 7. 3.18 1. 0. 0. .00 ROUTED TO + SFROU 1. 4.03 1. 0. 0. .00 + 738.83 4.08 2 COMBINED AT + COMBO 2. 3.98 1. 0. 0. .00 *** NORMAL END OF HEC-1 ***

Charlotte-Mecklenburg BMP Design Manual July 1, 2013
4.8.49
Figure 4.8.13 Schematic of Extended Detention Basin Outlet Structure
Comparison of this example with the previous stand-alone sand filter example indicates that the storage volume required is less for three of the design storm events; 1-inch, 6-hour, 10-year, 6-hour, and 50-year, 6-hour storm events. The storage volume required is slightly larger for this example for the 1-year, 24-hour control requirement. However, some of the storage volume is provided in an above-ground extended dry detention facility which may be more cost-effective to construct relative to an under-ground sand filter. Step 13 Design Inlets and Underdrain System Inlet conveyance system design is not included in this design example. Standards for conveyance system design are covered in the Charlotte-Mecklenburg Storm Water Design Manual. The underdrain system must be designed to meet two design goals; the underdrain capacity must be greater than the filter media capacity, and the capacity must drain the runoff volume from the system within design duration (1.13 days for this example). The design must assume that 50 percent of the underdrain system (perforations and pipe system capacity) is lost due to clogging. Design specifications require the underdrain system to be a 6-inch perforated PVC pipe with 3/8-inch perforations spaced 3 inches on center, along 4 longitudinal rows spaced 90° apart. Minimum underdrain slope is 0.5 percent. The length, slope, number of pipes, spacing, etc. is configured per design requirements. Based upon the required area for the sand filter BMP (1,395 ft2) the approximate dimensions of the sand filter area is selected to be 38 feet wide by 38 feet in length (approximately 1,444 ft2).

Charlotte-Mecklenburg BMP Design Manual July 1, 2013
4.8.50
The design process uses a trial and error process. The capacity of the perforations and pipe (assuming 50 percent of the system is clogged) are computed. The computed underdrain capacity is checked relative to the filter media capacity to ensure that the filter media is the controlling outflow condition. The computed underdrain capacity if compared to the static outflow discharge that ensures the runoff within the system leaves within 27 hours. Compute minimum drawdown discharge Water quality volume = (0.19 ac-ft)(43,560ft3/ac ft) = 8,276 ft3 Drawdown = 8,276 ft3/[(27 hours)(3,600sec/hour)] = 0.085 cfs Compute perforation capacity Since the maximum underdrain spacing is 10 feet on center and the sand filter area is 38 feet wide by 38 feet in length, three parallel underdrain pipes (6-inch diameter PVC) 38 feet in length were selected. For the calculations below, the length of pipe containing holes was reduced by 1 foot per cleanout to account for fittings. Number of perforations = (3 pipes)(4 rows/ft)(38-2) ft/pipe)(4 holes/row) = 1,728 holes 50 percent of perforations = 864 holes Capacity of one hole = CA(2gh)0.5 = (0.6)(3.1416)[(3/8in)(1/24)]2[(64.4)(3.0ft)]0.5 = 0.0064 cfs/hole Total capacity = (0.0064 cfs/hole)(864 holes) = 5.53 cfs The perforations capacity (5.53 cfs) is greater than the filter media capacity (0.088 cfs, computed in step 11b) and the minimum drawdown capacity requirement (0.085 cfs computed in this step). Therefore the design is acceptable. Note that the headwater depth used to determine the filter media capacity is 1.0 feet, the average headwater depth above the filter media for the water quality storm event. The drawdown computation is also based on the water quality volume. The headwater depth for the perforations is also based on the same average headwater elevations, 1 feet above the filter media, or 3.0 feet above the perforations. Compute underdrain pipe capacity For 6-inch PVC underdrain pipe at 0.005 ft/ft slope: Capacity of pipe = (1.49/n)(A)(A/P)0.67(S)0.5
= (1.49/0.013)(0.1963 ft2)(0.125 ft)0.67(0.005)0.5
= 0.40 cfs Fifty percent assuming clogging = 0.20 cfs The pipe capacity (0.20 cfs) is greater than the filter media capacity (0.088 cfs, computed in step 11b) and the minimum drawdown capacity requirement (0.085 cfs computed in this step). Therefore the design is acceptable. Step 14 Design Overflow Weir The final step is to route the 50-year, 6-hour storm event through the sand filter and extended dry detention basin facilities to ensure that a minimum of 6-inches of freeboard is provided and that a maximum of 5 feet of depth is over the sand filter media. A thirty (30) foot weir at 738.85 is proposed as the emergency overflow for the sand filter. A ten (10) foot weir at 731.00 is proposed as the emergency overflow for the extended dry detention. The following HEC-1 output file illustrates the results. 1***************************************** *************************************** * * * * * FLOOD HYDROGRAPH PACKAGE (HEC-1) * * U.S. ARMY CORPS OF ENGINEERS * * JUN 1998 * * HYDROLOGIC ENGINEERING CENTER * * VERSION 4.1 * * 609 SECOND STREET * * * * DAVIS, CALIFORNIA 95616 *

Charlotte-Mecklenburg BMP Design Manual July 1, 2013
4.8.51
* RUN DATE 11APR08 TIME 10:50:36 * * (916) 756-1104 * * * * * ***************************************** *************************************** X X XXXXXXX XXXXX X X X X X X XX X X X X X XXXXXXX XXXX X XXXXX X X X X X X X X X X X X X X XXXXXXX XXXXX XXX THIS PROGRAM REPLACES ALL PREVIOUS VERSIONS OF HEC-1 KNOWN AS HEC1 (JAN 73), HEC1GS, HEC1DB, AND HEC1KW. THE DEFINITIONS OF VARIABLES -RTIMP- AND -RTIOR- HAVE CHANGED FROM THOSE USED WITH THE 1973-STYLE INPUT STRUCTURE. THE DEFINITION OF -AMSKK- ON RM-CARD WAS CHANGED WITH REVISIONS DATED 28 SEP 81. THIS IS THE FORTRAN77 VERSION NEW OPTIONS: DAMBREAK OUTFLOW SUBMERGENCE , SINGLE EVENT DAMAGE CALCULATION, DSS:WRITE STAGE FREQUENCY, DSS:READ TIME SERIES AT DESIRED CALCULATION INTERVAL LOSS RATE:GREEN AND AMPT INFILTRATION KINEMATIC WAVE: NEW FINITE DIFFERENCE ALGORITHM 1 HEC-1 INPUT PAGE 1 LINE ID.......1.......2.......3.......4.......5.......6.......7.......8.......9......10 1 ID CHARLOTTE-MECKLENBURG POST CONSTRUCTION DESIGN MANUAL 2 ID ANALYZED BY ABC ENGINEERING 3 ID DATE: OCTOBER 2006 * **************************************************************************** * * TIME SPECIFICATION CARD * TOTAL MODEL DURATION - 27 HOURS * 24 HOURS AFTER CENTER OF 6 HOUR RAINFALL 4 IT 1 0 0 1620 * DIAGRAM * TIME INTERVAL CARD 5 IN 5 0 0 * * OUTPUT CONTROL CARD 6 IO 5 0 0 * 7 KK PRE1 * ***************************************************************************** * ***************** 50-YEAR, 6-HOUR STORM EVENT ******************************* * ***************************************************************************** 8 PI .000 .016 .016 .016 .017 .017 .018 .018 .019 .019 9 PI .020 .020 .021 .022 .022 .023 .024 .025 .026 .031 10 PI .032 .033 .035 .037 .039 .049 .053 .056 .061 .066 11 PI .073 .103 .116 .133 .209 .260 .513 .749 .356 .231 12 PI .145 .124 .109 .077 .069 .063 .058 .054 .051 .040 13 PI .038 .036 .034 .033 .031 .026 .025 .024 .023 .023 14 PI .022 .021 .021 .020 .019 .019 .018 .018 .017 .017 15 PI .017 .016 .016 .000 16 KM EAST SUB-BASIN PRE-DEVELOPED CONDITIONS 17 KO 5 0 0 0 21 18 BA .0018 19 LS 0 69.9 0 20 UD 0.319 21 KK PRE2 22 KM WEST SUB-BASIN PRE-DEVELOPED CONDITIONS 23 KO 5 0 0 0 21 24 BA .0028 25 LS 0 69.9 0 26 UD 0.319 27 KK COMB1 28 KO 5 0 0 0 21 29 HC 2 30 KK POST1 31 KM POST-DEVELOPED CONDITIONS - ENTIRE DRAINAGE AREA 32 KO 3 0 0 0 21 33 BA .0046 34 LS 0 92.6 0 35 UD 0.050 1 HEC-1 INPUT PAGE 2 LINE ID.......1.......2.......3.......4.......5.......6.......7.......8.......9......10 36 KK DIV 37 KO 5 0 0 0 21 38 DT SF 39 DI 0.00 1.54 3.07 4.46 5.51 10.07 17.56 26.97 37.92 50.20 40 DI 63.69 41 DQ 0.00 1.54 3.07 4.46 5.51 6.39 7.16 7.86 8.50 9.09 42 DQ 9.65 43 KK EDROU 44 KO 3 0 0 0 21 45 KM ROUTE BYPASSED HYDROGRAPH THROUGH THE DOWNSTREAM EXTENDED DRY DETENTION 46 KM DESIGN TARGET IS HOLDING COMBINED SAND FILTER AND EXTENDED DRY DETENTION OUTF 47 KM FOR 24 HOURS BEYOND THE CENTER OF THE RAINFALL 48 RS 1 ELEV 730 49 SV 0 .080 .160 .240 .320 50 SE 730 730.5 731 731.5 732 51 SQ 0.00 0.24 0.38 9.68 26.57 52 SE 730 730.5 731 731.5 732 53 KK SF 54 KM RECALL HYDROGRAPH THAT WAS DIVERTED TO SAND FILTER 55 KO 5 0 0 0 21 56 DR SF

Charlotte-Mecklenburg BMP Design Manual July 1, 2013
4.8.52
57 KK SFROU 58 KO 3 0 0 0 21 59 KM ROUTE DIVERTED HYDROGRAPH THROUGH THE SAND FILTER FACILITY 60 KM NO OVERFLOW STRUCTURE INCLUDED IN STAGE-DISCHARGE; ALL FLOW THROUGH FILTER ME 61 RS 1 ELEV 734 62 SV 0 .041 .083 .123 .162 .201 .240 .282 .323 .364 63 SV .391 0.404 64 SE 734 734.5 735 735.5 736 736.5 737 737.5 738 738.5 65 SE 738.85 739 66 SQ 0.00 0.073 0.088 0.102 0.117 0.132 0.146 0.386 0.626 1.107 67 SQ 1.333 6.706 68 SE 734 734.5 735 735.5 736 736.5 737 737.5 738 738.5 69 SE 738.85 739 70 KK COMBO 71 KO 3 0 0 0 21 72 KM COMBINATION OF SAND FILTER OUTFLOW AND EXTENDED DRY DETENTION OUTFLOW 73 HC 2 74 ZZ 1***************************************** *************************************** * * * * * FLOOD HYDROGRAPH PACKAGE (HEC-1) * * U.S. ARMY CORPS OF ENGINEERS * * JUN 1998 * * HYDROLOGIC ENGINEERING CENTER * * VERSION 4.1 * * 609 SECOND STREET * * * * DAVIS, CALIFORNIA 95616 * * RUN DATE 11APR08 TIME 10:50:36 * * (916) 756-1104 * * * * * ***************************************** *************************************** CHARLOTTE-MECKLENBURG POST CONSTRUCTION DESIGN MANUAL ANALYZED BY ABC ENGINEERING DATE: OCTOBER 2006 1 RUNOFF SUMMARY FLOW IN CUBIC FEET PER SECOND TIME IN HOURS, AREA IN SQUARE MILES PEAK TIME OF AVERAGE FLOW FOR MAXIMUM PERIOD BASIN MAXIMUM TIME OF OPERATION STATION FLOW PEAK AREA STAGE MAX STAGE + 6-HOUR 24-HOUR 72-HOUR HYDROGRAPH AT + PRE1 2. 3.50 0. 0. 0. .00 HYDROGRAPH AT + PRE2 4. 3.50 1. 0. 0. .00 2 COMBINED AT + COMB1 6. 3.50 1. 0. 0. .00 HYDROGRAPH AT + POST1 23. 3.18 2. 1. 0. .00 DIVERSION TO + SF 8. 3.18 2. 0. 0. .00 HYDROGRAPH AT + DIV 16. 3.18 1. 0. 0. .00 ROUTED TO + EDROU 5. 3.30 0. 0. 0. .00 + 731.23 3.30 HYDROGRAPH AT + SF 8. 3.18 2. 0. 0. .00 ROUTED TO + SFROU 5. 3.45 1. 0. 0. .00 + 738.96 3.45 2 COMBINED AT + COMBO 8. 3.42 1. 0. 0. .00 *** NORMAL END OF HEC-1 ***
Table 4.8.12 presents the results of the design. In addition, the table includes the results (highlighted with italics) of the previous design example discussed in section 4.8.8. The previous design example used only a sand filter to meet the design goals of the same site.

Charlotte-Mecklenburg BMP Design Manual July 1, 2013
4.8.53
Table 4.8.12 Summary of Controls Provided
Control Element Type/Size of Control
Stor. (ac-ft)
Peak Elev. (MSL)
Disc. (cfs) Remarks
Water Quality Extended Detention
(WQv-ed)
Sand filter media at 734.0 0.154 735.90 0.14
cfs
Entire 1-inch, 6-hour storm event is routed through sand
filter media Water Quality
Extended Detention (WQv-ed)
Sand filter media at 734.0 0.176 735.29 0.05
cfs
Entire 1-inch, 6-hour storm event is routed through sand
filter media
Channel Protection (CPv)
Sand filter media at 734.0 and 0.15 foot
weir at 737.0/extended dry
detention 4-inch orifice at 730.0
0.266 +
0.021 =
0.287
737.31 730.13
0.29 0.06
Portion of the 1-year, 24-hour storm event is routed through the sand filter and a portion is routed through the extended dry detention 4-inch orifice
outlet
Channel Protection (CPv)
Sand filter media at 734.0 and 5-inch orifice at 735.5
0.281 736.04 0.43 cfs
Portion of the 1-year, 24-hour storm event is routed through the sand filter and a portion is
routed through the 5-inch orifice outlet
Flood Protection (Q10)
Sand filter media at 734.0 and 0.15 foot
weir at 737.0/extended dry
detention 4-inch orifice at 730.0
0.391 +
0.133 =
0.524
738.83 730.83
1.32 0.33
Same orifice control was designed for the 1-year, 24-hour and the 10-year, 6-hour
storm events
Flood Protection (Q10)
Sand filter media at 734.0 and 5-inch orifice at 735.5
0.542 737.98 1.08 cfs
Same orifice control was designed for the 1-year, 24-hour and the 10-year, 6-hour
storm events
Emergency Overflow (Q50)
Sand filter media at 734.0,0.15 foot weir
at 737.0, and 30 foot weir at
738/extended dry detention 4-inch
orifice at 730.0 and 10 foot weir at
731.0
0.403 +
0.197 =
0.600
738.96 731.23
5.23 4.75
Less than 5 feet of headwater depth on sand filter media.
Emergency Overflow (Q50)
Sand filter media at 734.0, 5-inch orifice at 735.5, and 8-foot
weir at 738.0
0.717 738.25 10.16 cfs
Less than 5 feet of headwater depth on sand filter media.
Step 15 Assess Maintenance Access and Safety Features The filter media and sedimentation chamber must be accessible from the surface in order to provide regular maintenance without significant access challenges. All areas of both chambers must be within 25 feet of an access location from the surface that is large enough for personnel to enter in order to remove trash, debris, sediment, etc. In addition, the sand filter media must be accessible in order to facilitate complete replacement when the sand filter ponds runoff without filtration.