4 7 bureau of justice statistics annual report fiscal 1986 · bureau of justice statistics annual...
TRANSCRIPT
TJ.S. Department of Justice Bureau 01 Justi.:.: Stati~tics
4 7
ftlF!
4
Bureau of Justice Statistics Annual Report Fiscal 1986
m
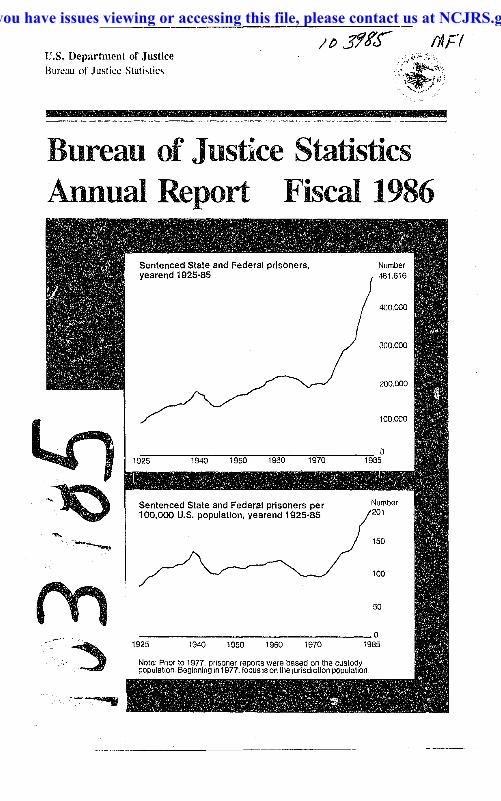
Sentenced State and Federal prisoners, yearend 1925·85
Sentenced State and Federal prisoners per 100,000 U.S. population, yearend 1925-85
/ ~oooo
50
_____________________________________ 0
1925 1940 1950 1960 1970 19S5
Note Prior to 1977, prisoner reports were based on the custody populalton. Beginning In 1977. focus is on the Jurisdiction populalton
If you have issues viewing or accessing this file, please contact us at NCJRS.gov.

U.S. Department of Justice Bureau of Justice Statistics
Bureau of Justice Statistics Annllal Report
Fiscal 1986
April 1987 NCJ-I03985
U.S. Department of Justice National Institute of Justice
103985
This document has been reproduced exactly as received from the person or organization originating it. POints of view or opinions stated in this document are t/lose of the authors and do not necessarily represent the official position vf policies of the National Institute of Justice.
Permission to reproduce this ~ material has been granted by Public Domain/BJS u.s. Denartment of Justice
to the National Criminal Justice Reference Service (NCJRS).
Further reproduction outside of the NCJRS system requires permission of the.cQPll~hr owner.
- ---------------------------------------'

U.S. Department of Justice Bureau of Justice Statistics
Steven R Schlesinger Director
Benjamin H. Renshaw III Deputy Director
Joseph M. Bessette Deputy Director
Charles R. Kindermann Associate Director
S. S. Ashton, Jr. Assistant Director
Sue A. Lindgren Associate Deputy Director
The Justice Assistance Act of 1984 (PUblic Law 98-473), Section 810, requires that "Not later than April 1 of each year •.. the Director of the Bureau of Justice Statistics ... shall •.. submit a report to the President and to the Speaker of the House of Representatives and the President of the Senate, on [the Bureau's] activities under this title during the fiscal year next preceding such date:'
The Attorney General has determined that the publication of this periodical is necessary in the transaction of the public business required by law of the Department of Justice.
Ii Bureau of Justice Statistics
~-----I

U.S. Department of Justice
Bureau of Justice Statistics
Orlic.:e of th~ Om.'(lur Jru.dutl,i:Wtf, D, c. 10S)/
The President of the United States The Speaker of the House of Representatives The President of the Senate
I am pleased to report on the activitie;s of the Bureau of Justice Statistics during fiscal 1986 as required by 42 USC 378ge.
In addition to summarizing BJS programs and activities, this report presents the latest statistical information on a variety of criminal justice topics. The report also describes BJS efforts to improve the quality and coverage of data on crime, victims of crime, and the criml;lal justice system. The final section describes the activities of individual State statistical agencies, which have been supported by BJS and which serve functions for Statea similar \0 those served by BJS at the national level.
I hope that the report will be of interest and use lo you and your staff.
Respectfully submitted,
~R.~ steven R. Schlesinger Director
1986 Annual Report iii
Contents
Transmittal letter iii
Introduction 1
BJS reports on •••
Crime 5
Crime trends 7
The volume of crime 8
Violent crime 8
Victims of crime 9
The relationship between victim and offender 10
The use of weapons in crime 11
The location of crime 12
Crime against District of Columbia residents and Capitol Hill employees 13
Characteristics of various types of crime 14
Domestic violence against women 14
Rape 15
Household burglary 16
Bank robbery 16
Automated telier machine loss and theft 17
Drugs, alcohol, and crime 18
The cost of crime 21
Economic cost of crime to victims 22
Cost of the justice system 22
iv Bureau of Justice Statistics
The public resp0r/se to crime 24
Preventing crime 25
Reporting crime 26
Fear of crime 27
Pt;blic confidence in the criminal justice system 28
Adiudicalion and sentencing 29
Local prosecution 30
Felony case processing time 32
Pretrial release and Federal ptOsecution 33
Indigent defense 34
Court casGloads 35
Appeals and habeas corpus 35
Sentencing practices 36
Sentencing outcomes 38
Corrections 40
Adult correctional populations 41
Juveniles in custody 43
Prison and jail crowding 44
Characteristics of prison and jail inmates 45
Corrections funding 47
Time served in prison 47
Capital punishment 48
Recidivism and career criminals 49
Privacy, security, and confidentiality of criminal justice data 50
New Initiatives 53
National Crime Survey Redesign implemEtntation 54
Uniform Crime Reporting assessment impleml3ntation 56
National Crime Survey supplements 57
National survey of serious victimization injury and drug-related injury 58
Data on drugs and crime 59
Law enforcement management and administrative statistics 60
Pretrial statistics 61
A national court statistics program 62
Juvenile justice statistics 63
Federal civil justice data 64
White-collar crime 64
Comparative international statistics on incarceration 65
National recidivism statistics series 65
State statistical program 67
State statistical analysis center (SAC) narratives 75
Alabcyna 76 Alaska 77 Arizona 78 Arkansas 79 California 80 Colorado 81 Commonwealth of the Northern Mariana
Islands 83 Common .... "alth of Puerto Rico 84 ConnectiO'Jt 85 Delaware 86 District of Columbia 86 Florida 87 Hawaii 89 Idaho 91
Illinois 91 Indiana 94 Iowa 96 Kansas 97 Kentucky 98 Louisiana 99 Maine 101
Maryland 102 Massachusetts 102 Michigan 103
Minnesota 104 Mississippi 105 Missouri 106 Montana 107 Nebraska 109
New Hampshire 111 New York 112 North Carolina 114
North Dakota 115
Ohio 117 Oklahoma 119 Oregon 120 P<.mnsylvania 123
Rhode Island 125 South Carolina 126 South Dakota 129
Texas 131 Utah 132 Virginia 134
Washington 135 Wisconsin 137
Appendlc:es
A Sources of narratives on Slate activities 139
8 Reports issued by BJS during fiscal 1986 145
. C Source notes 147
1986 Annual Report v
Contents
Figures
Trends in victimization rates for selected crimes, 1973-85 7
Households touched by selected crimes of violence and theft, 1975-85 7
Typical outcome of 100 felony arrests brought by the police for prosecution, 1981 31
Civil arid criminal appeals filed, 1973-83 (38 States) 35
A typical 100 sentences in felony court in 18 local jurisdictions, 1983 38
Prison admissions per 100 serious crimes committed, 1960-85 39
Number of sentenced State and Federal prisoners, yearend 1925-85 42
Number of sentenced State and Federal prisoners, per 100,000 U.S. population, yearend 1925-85 42
Tables
Functions of State statistical analysis centers (SACs), calendar 1986 68
2 Number of States producing data on issues of policy concern, calendar 1986 70
3 Issues for which State statistical analysis (;enters produced data or conducted research I calendar 1986 72
vi Bureau of Justice Statistics

Introduction
The Bureau of Justice Statistics (BJS)-• collects, analyzes, publishes, and disseminates statistical information on crime, victims 01 crime, criminal offenders, and operations of justice systems at all levels of government • provides financial and technical support to State statistical and operating agencies • analyzes national information policy on such issues as the privacy, confidentiality, and security of criminal justice data and the interstate exchange of criminal records.
In the 7 years since its creation, BJS has developed a program that responds to the diverse requirements of the 1979 Justice System Improvement Act and the 1984 Justice Assistance Act. These acts addressed more than half a century of recommendations calling for an independent and objective national center to provide basic information on crime to the President, the Congress, the judiciary, State and local governments, the general public, and the media.
In meeting its statutory mandate, BJS has developed more than two dozen data collection series using a variety of methods that include household interviews, censuses and sample surveys of criminal justice agencies and of prisoners and inmates, and compilations of administrative records.
BJS collects little raw data itself; rather, it designs collection programs and enters into agreements to collect data with other Federal agencies (such as the U.S. Bureau of the Census), private associations, and research organizations.
BJS reserves to itself the function of initial data analysis. This analysis is performed by the BJS staff of statisticians, criminologists, and social science analysts. BJS maintains this internal analytic capability to provide the Administration, Congress, the judiciary, and the public with timely and accurate data concerning problems of crime and the administration of justice in the Nation.
BJS prepared and disseminated 34 reports and data releases during fiscal 1986.
BJS Bulletins, begun in 1981, present data gleaned from its various statistical series. In a nontechnical format, each BJS Bulletin presents the latest information on particular aspects of crime or the administration of justice from the Bureau's ongoing statistical series.
I3JS Special Reports, begun in February 1983, also are written In nontechnical language and aimed at a broad audience. Each Special Report focuses on a specific topic in criminal justice.
Each BJS Bulletin and BJS Special Report is announced In a press release summarizing the findings to ensure wide dissemination to policy makers and the public. Sometimes to expedite public communication, press releases alone are used to announce new BJS findings. During fiscal 1986, this method was used in April for the first release of 1985 victimization data and In September for the release of midyear prisoner counts.
1986 Annual Report 1
Introduction
BJS press releases and reports have received extensive coverage in the electronic and print media and have beml cited frequently in the editorial columns of the Nation's newspapers.
BJS also prepares and releases detailed tabulations from its data series. These reports, often running over a hundred pages, contain extensive cross tabulations of the variables covered in the BJS data collection series. They provide 3ccess to the fuli detail of BJS data to persons for whom it is impractical to work with the data tapes. The reports also explain data collection methodology, define terms, and include copies of any questionnaires used.
BJS Technical Reports address issues of statistical methodology and special topics in a more detailed and technical format than in a BJS Bulletin or BJS Special Report.
Each year BJS publishes its Sourcebook of criminal justice statistics, which presents data from close to 100 different sources In a single, easy to use, reference volume.
In fiscal 1986, progress was made on the second edition of Report to the nation on crime and justice. r\ draft was circulated for external review with publication anticipated during 1987. The first edition was a major effort of BJS during fiscal 1983 and 1984. It was a landmark document in that it was the first attempt to describe comprehensively crime and the justice system in a nontechnical format. The first edition is now in its second printing, with n\,arly 75,000 copies sold or distributed.
2 Bureau of Justice Statistics
The first edition of Report to the nation was awarded a first place prize in the 1984 Blue Pencil Competition of the National Association of Government Communicators in the category of general publications of over 16 pages. It also received an "award of excellence" in the 1984-85 Technical Communications Contest conducted by the Washington, D.C., Chapter of the Society for Technical Communication.
To supply summary information similar to what is contained in Report to the nation In years when It is not issued, Crime and justice facts, 1985 was prepared and printed during the fiscal year. This 33-page document presents the most current data available from all the BJS statistical series.
BJS also disseminates statistical information by other methods. It responds to thousands of requests for data, both in writing and by telephone. The requests come from federal, State, and local officials, the media, researchers. students. teachers. and members of the general public. The pamphlet How to gain access to BJS data describes the programs of the Bureau and the availability of data from the various BJS series. Each year. the Bureau also publishes Telephone contacts, which lists a wide range of topics in criminal justice and the names and telephone numbers of the BJl:J staff members most familiar with each topic.
mm be
To assist persons seeking crime and criminal justice data, BJS supports a staff member who specializes in statistical resources at the National Cnminal Justice Reference Service. The BJS representative at NCJRS can be reached through a tollfree telephone number, 800-732-3277 (persons in Maryland and the Washington, D.C., metropolitan area should dial 301-251-5500).
BJS distributes its reports through the National Criminal Justice Reference Service (NCJRS). The Reference Service notifies those on its mailing list of forthcoming publfcations, and users return a form requesting copies of desired publications. Persons can obtain a registration form for the Reference Service mailing list or order a BJS report by writing to NCJRS, Box 6000, Rockville, MD 20850, or by calling 800-732-3277 (persons in Maryland and the Washington, D.C., metropolitan area should dial 301.251-5500).
BJS sponsors the National Criminal Justice Data Archive at the Inter-university Consortium for Politlcal and Social Research at the University of Michigan. The archive assists users whose needs are not satisfied by published statistics. All BJS data tapes (covering most of the 8JS data series) and much other high-quality data are stored at the archive and are disseminated via magnetic tapes compatible with the user's computing facility. The archive can be reached by writing the National Criminal Justice Data Archive, Interuniversity Consortium for Political and Social Research, P.O. Box 1248, Ann Arbor, MI 48106, 313-763-5010.
With BJS funding, a catalog and library of statistical reports produced by !he State criminal justice statistical analysis centers ar~ maintained by the Criminal Justice Statistics Association, 444 North Capitol Street, N.W., Suite 606, Washington, DC 20001, 202-347-4608.
BJS also supports the National Clearinghouse for Criminal Justice Information Systems, 925 Secret River Drive, Suite H, Sacramento, CA 95831, 916-392-2550. The clearinghouse-• operates an automated index of over 1000 crimina! justice information systems maintained by S!ate and local governments throughout the Nation • issues technical publications • provides technical assistance and training for State and local government officials • prepares the Directory of automated criminal justice information systems • operates the computerized Criminal Justice Information Eulletin Board • operates the National Criminal Justice Computer Laboratory and Training Center.
1986 Annual Report 3
BJS reports on ....
Crime
The amount and nature of crime has become one of the main indicators by which Americans judge how wei! public officials are performing their jobs. T'lese public officials, as well as criminologists and researchers, also f11onitor the crime rate to assess the effectiveness of policies and programs aimed at crime reduction. Because of the imporlance attached to changes in the crime rate, i! is crucial that the Nation have available to it sound and accurate statistics measuring the amollnt and chmacteristics of crime over time.
The largest BJS statistical series is the National Crime Survey (NCS). This survey-• provides the Nation's only systematic measurement of crime rates and the characteristics of crime and crime vj(:!ims based on national howlehold surveys • measures the amount of rape, robbery, assault, personal larceny, household burglary and larceny, and motor vehicle theft experienced by a representative sample of the U.S. popuiation • provides detailed data about the characteristics of victims, Victim-offender rei alionship, and the criminal incident, inclLlding the extent of loss or injury and whether the offense was reported to the police • conducts interviews at 5-month if Ilervals in aboul 49,000 U.S. households, asking 101,000 persons who are at least 12 years old what crimes they experienced since the last interview.
.... 15
In April, BJS released preliminary findings of a continued downturn in victimization rates in 1985, to the lowest level in the 13-year history of the NCS. This report was released on the accelerated schedule, adopted in fiscal 1985, that has reduced the time between the reference year and the release date by 5 months. This earlier release resuits frum methodo!ogic:al work aimed at rapid publication of the data.
In fiscal 198&. BJS released. for the sixth year, an NCS Indicator that measures the proportion of American households tcuched by crime, Households touched by
crime, 1985 (BJS Bulletin, June 1986). This indicator has revealed that victimization by crime is one of the most common negative life events that a family can suffer.
During the year, BJS completed the first phase 01 the National Crime Survey Redesign. In July, interviewers began using a questionnaire, rl;1vised to include a number of improvements in incident reporting, with a number of questions designed te elicit victims' experiences with the criminal justice system after their victimization. This questionnaire will remain in use until the second phase of "hanges is introduced in fiscal 1989. (The NCS redesign and other projects \0 improve the quality of statistical information on crime are discussed in the "New initiatives" section of this report.)
1986 Annual Report 5

BJS reports on ...
Tcpical NOS reports released during fiscal 1986 included-
• Reporting crimes to the police (BJS Special Report, December 1985),
• Locating city, suburban, and rural crime (BJS Special Report, Decembb( 1985)
• The use of weapons in committing crime (BJS Special P9port, January 1986)
• Crime prevention measures (BJS Special Report, March 1986)
• Preventing domestic violence against women (BJS Special Report, August 1986).
These reports frequently combine data over a number of years to provide enough sample cases to allow more indepth analysis than would be possible with a single year's data.
Also released duririg the year were-
• final 1984 NCS estimates in Criminal victimization, 1984 (BJS Bulletin, October 1985)
• National survey of crime severity (BJS Final Report, October 1985)
• Criminal victimization in the U.S .• 1983 (8JS FInal Report, Octobor 1985).
A total of 10 reports on criminal victimization were produced in liscal1986.
Topical crime studies planned for fiscal 1987 include-
• Teenage victims • Stranger and non stranger crime
• Robbery • Lifetime victimization • Federal white-coUar crime • Trends in viol(-lfll crime.
6 Bureau of Justice Statistics
-------- ---- - ------------ --- -- -- - - -- - - - -
.- ~

Crime trends
In 1985, criminal victimizations reached the lowes! level in the 13-year history of the National Crime Survey. The 34.9 million criminal victimizations recorded in 1985 were about 16% below the 41.5 million recorded in the peak year of 1981.
Since 1981 the number of-
• violent crimes fell 12% • personal thefts fell 15% • household crimes fell 18%.
The 1985 victimization rates for-e robberies fell 11 % from the previous year to a new low about 32% below its peak in 1981 • personal theft fell by 3% from 1984 to 1985
• most other crimes, including all household crimes (burglary, household theft, and motor vehicle theft) were not measurably different in 1984 and 1985.
Trends in victimization rates for selected crimes, 1973-85 Rat3 per 1,000 persons or households
140
120
100
80
60
Personal larceny without contact
HousehOld burglary
Crimes of violence 40 (rape. robbery. assaull)
Percent change 1973-85
-8.9%
~-24.2% -31.7%
-7.8% Molor vehicle Iheft ror---____________ _
-25.4% o __________ _ 1973 1979 1985
Households touched by selected crimes of violence and theft, 1975-85
Percent of households Percent change 1975-85
30
25 -22%
ro
15
10 -30%
Household r-------_ Burglary -32%
5 Rape, robbery, assault '- -18%
o r-_____ ""M"'o,;.;to;:.,r..;;ve;;.:c;:,:h;,:ic;,:le..,:t;;,:he:.:.:...ft -23%
1975 ---1900---1985
In 1985, the percentage of U.S. households touched by crime fell to its lowest level in a decade: 25% of households suffered a robbery, burglary, motor vehicle theft, rape, assault, or theft vs. 32% in 1975.
Sources: Criminal victimization 1985. Households tOUched by crime 1985.
1986 Annual Report 7

-BJS reports on , , ,
The volume of crime
In 1985, the National Crime Survey reported 34.9 million victimizations:
Personal crimes ·-of violence
Rape Robbery Assault
Aggravated Simple
-of theft
Household crimes Burglary Larcp.ny Motor vehicle theft
Number 01 victim' izatlons
5,823.000 138,000 985.000
4.699,000 1,605,000 3.094.000
13.474,000
5.594.000 8,703.000 1.270.000
Rate per 1.000
populallon'
30.0 0.7 5.1
24.2 8.3
15.9 69.4
Rate per 1,000
households
62.7 97.5 14.2
'Rates per 1.000 population are for those age 12 and over.
In 1985, 22.2 million households-25% of all households-were touched by crime:
Number of house-
holds ~
Personal crimes -of violence 4,235.000
Rape 125,000 Robbery 842.000 Assault 3,488.000
Aggravated 1,246.000 Simple 2,459,000
-of theft 10.233.000
HousehOld crimes Burglary 4.713,000 Larceny 7,240.000 Motor vehicle theft 1.201,000
Sources: Criminal victimization 1!!85. Households touched by crime 1985.
8 Bureau of Justice Statistics
4.8% .1 .9
3.9 1.4 2.8
11.5
5.3 8.1 1.4
Violent crime
Each year about 3.2% of all Americans-6 million persons-are victims of violent crime.
Violent crime rates in 1984 weres highest against black males '" higher against blacks than whites or members of other minority groups • higher against unemployed personswhether male, female, white, or blackthan against employed persons in their respective groups • about 70% higher against males than against females
• lowest against while females.
Rates for crimes of violence and theft in 1984 were highest for young persons age 12 to 14.
The lifetime chances of being murdered are much higher for blacks than for whites: black males have 1 chance in 30 to be murdered; white males have 1 chance in 178.
Each year about 1 in 12 persons are victims of a violent crime. The risk of violent crime other than homicide is particularly high among males 16 to 24 years old and is about the same for whites and blacks in this age group.
Sources: Criminal victimization 1984. The risk of violenl crime.
w
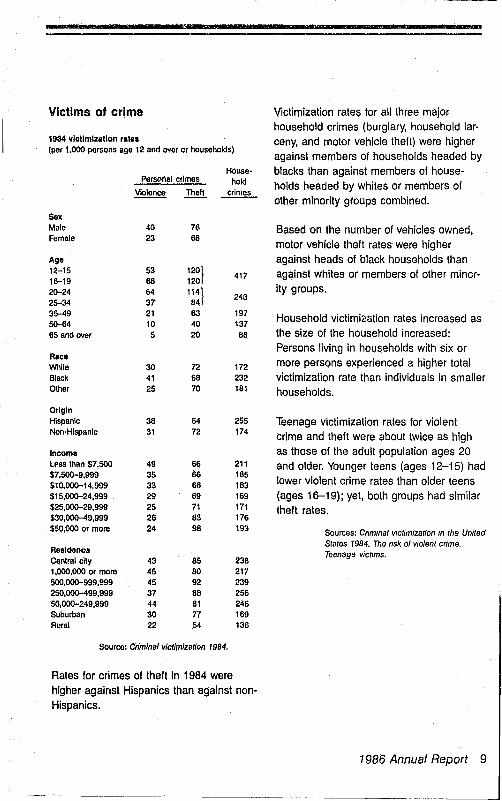
Victims of crime
1934 victimization raIn (per 1,000 persons age 12 and eNor or households)
House· PerSQllal crimes hold
VIOlence Theil crimes
Sex Male 40 71> Female 23 68
Age 12-15 53 120
1 417
16-19 68 120 20-24 &4 1141 246 25-34 37 84 35-49 21 63 197 50-64 10 40 137 65 and over 5 20 68
Race White 30 72 172 Black 41 66 232 Other 25 70 181
Origin Hispanic 38 64 255 Non·Hlspanic 31 72 174
Income L~ss than $7,500 49 66 211 $7,500-9,999 35 66 185 $10,000-14,999 33 66 183 $15,000-24,999 29 69 169 $25,000-29,999 25 71 171 $30,000-49,999 26 83 176 $50,000 or more 24 98 193
Raaldom • ..., Central cily 43 85 238 1,000,000 or more 45 80 217 500,000-999,999 45 92 239 250,000-499,999 37 88 256 50,000-249,999 44 81 246 Suburban 30 77 169 Rural 22 54 136
Source: Criminal vicrimlzation 1984.
Rates for crimes of theft in 1984 were higher against Hispanics than against non-Hispanics.
Victimization rates for all three major household crimes (burglary, household larceny, and motor vehicle theft) were higher against members of households headed by blacks than against members of households headed by whites or members of other minority groups combined.
Based on the number of vehicles owned, motor vehicle theft rates were higher against heads of black households than against Whites or members of other minority groups.
Household victimi2:stion rates increased as the size of the household increased: Persons living in households with six or more persons experienced a higher total victimization rate than individuals in smaller households.
Teenage victimization rates for violent crime and theft were about twice as high as those of the adult population ages 20 and older. Younger teens (ages 12-15) had lower violent crime rates than older teens (ages 16-19); yet, both groups had similar theft rates.
Sources: Criminal Victimization In the United States 1984. The risk 01 VIolent crime. Teenage victims.
1986 Annual Report 9
,M_
BJS reports on ...
10 Bureau of Justice Statistics
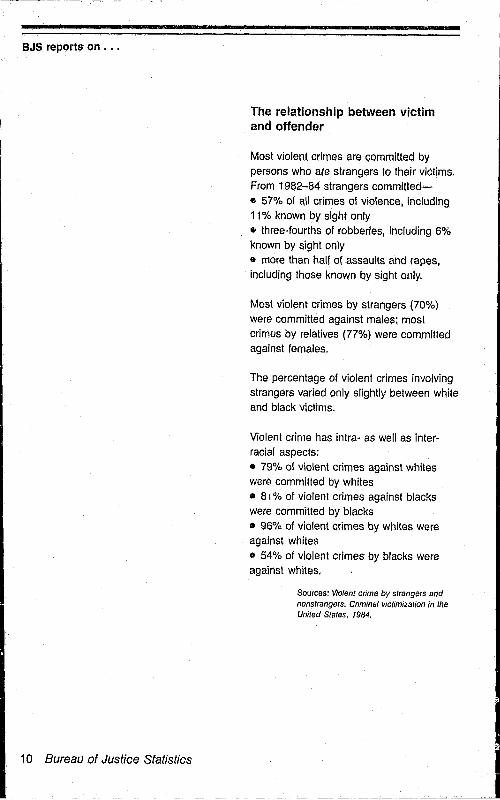
The relationship between victim and offender
Most violent crimes are committed by persons who are strangers to their victims. From 1982-84 strangers committed-• 57% of all crimes of violence, including 11 % known by sight only • three-fourths of robberies, including 6% known by sight only • more than half of assaults and rapes, including those known by sight only,
Most violent crimes by strangers (70%)
were committed against males; most crimus by relatives (77%) were committed against females.
The percentage of violent crimes involving strangers varied only slightly between white and blac\( Victims.
Violent crime has intra- as well as interracial aspects: • 79% of violent crimes against whites were committed by whites • 8 I % of violent crimes against blacks were committed by blacks • 96% of violent crimes by whites were against whites o 54% of violent crimes by blacks were against whites.
Sources: Violent crime by strangers and nonstrangers. Cominal victImization in the United States, 1984.
_~ ____ ~ _____ ~___ ~J
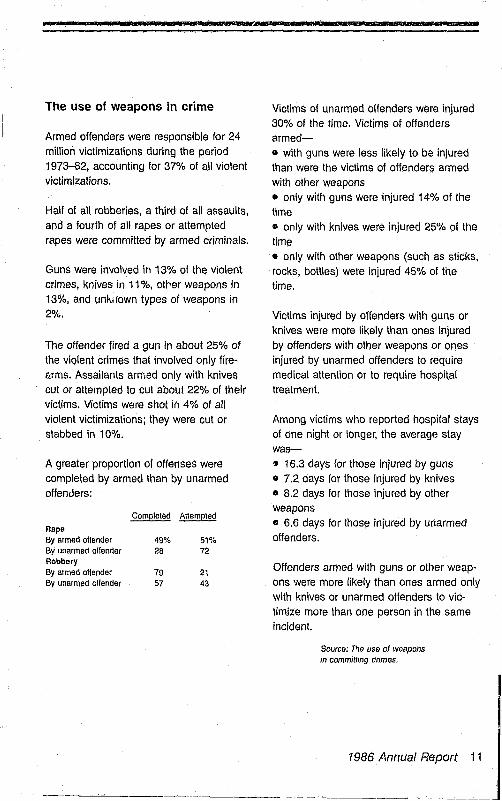
The use of weapons in crime
Armed offenders were responsible for 24 million victimizations during the period 1973-82, accounting for 37% of all violent victimizations.
Half of all robberies, a third of all assaults, and a fourth of all rapes or attempted rapes were committed by armed criminals.
Guns were involved in 13% of the violent crimes, knives in 11 %, olrer weapons in 13%, and unl\ilown types of weapons in 2% ..
The offender fired a gun in about 25% of the violent crimes that involved only firearms. Assailants armed only with knives cut or attempted to cut about 22% of their victims. Victims were shot in 4% of all violent victimizations; they were cut or stabbed in 10%.
A greater proportion of offenses were completed by armed than by unarmed offenJers:
Rape By armed ollender 49% 51% By unarmed offender 28 72 Robbery By armed offender 79 21 By unarmed offender 57 43
. ,--
Victims of unarmed offenders were injured 30% of the lime. Victims of offenders armed-• with guns were less likely to be injured than were the victims of offenders armed with other weapons • only with guns were injured 14% of the time • only with knives were injured 25% of the time • only with other weapons (such as sticks, rocks, bottles) were injured 45% of the time.
Victims injured by Offenders with guns or knives were more likely than ones injured by offenders with other weapons or ones injured by unarmed offenders to require medical attention or to require hospital treatment.
Among victims who reported hospital stays of one night or longer, the average stay was-• 16.3 days for those injured by guns • 7.2 days for those injured by knives • B.2 days for those injured by other weapons • 6.6 days for those injured by unarmed offenders.
Offenders armed with guns or other weapons were more likely than ones armed only with knives or unarmed offenders to victimize more than one person in the same incident.
Source; T~e use Df weapons In commilling crimes.
7986 Annual Report 11
----------------------------------- ---
BJS reports on ..•
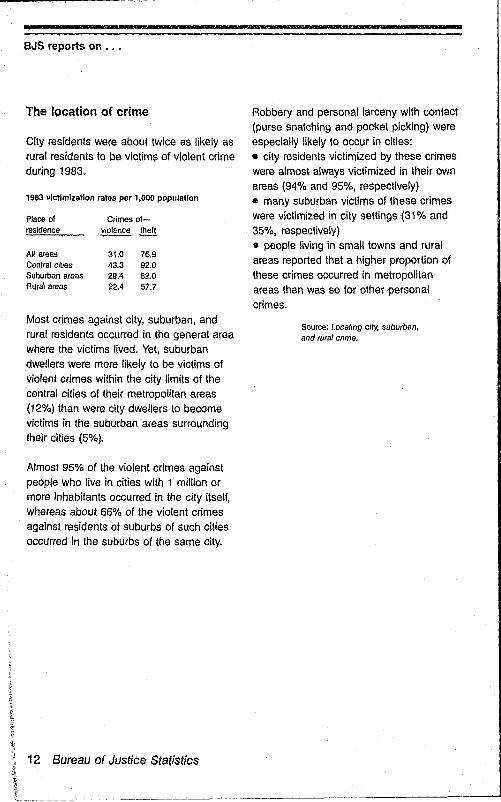
The location of crime
City residents were about twice as likely as rural residents to be victims of violent crime during 1983.
1983 Victimization rates per ',000 population
Place 01 Crimes 01-residence ~ theft
All areas 31.0 76.9 Cenlral cilies 43.3 92.0 Suburban areas 29.4 82.0 Aural areas 22.4 57.7
Most crimes against city, suburban, and rural residents occurred in the general area where the victims lived. Yet, suburban dwellers were more likely to be victims of violent crimes within the city limits of the central cities of their metropolitan areas (12%) than were city dwellers to become victims in the suburban areas surrounding their cities (5%),
Almost 95% of the violent crimes against people who live in cities with 1 million or more inhabitants occurred in the city itself, whereas about 66% of the violent crimes against residents of suburbs of such cities occurred in the suburbs of the same city.
12 Bureau of Justice Statistics
Robbery and personal larceny with contact (purse snatching and pocket picking) were especially likely to occur in cities: • city residents victimized by these crimes were almost always Victimized in their own areas (94% and 95%, respectively) \I many suburban victims of these crimes were victimized in city settings (31% and 35%, respectively) • people living in small towns and rural areas reported that a higher proportion of these crimes occurred in metropolitan areas than was so for other personal crimes.
Source: Locating city, SUburban. and rural crime.

Crime against District of Columbia residents arId Capitol Hill employees
..
Victimization rates of residents of the District of Columbia (DC) and of its Maryland and Virginia suburbs were compared: DC residents were more likely than suburban residents to be robbed but were less likely to be victims of vandalism.
The study found the following crime victim rates per 1,000 population age 12 and over:
DC Suburban
~ residents
Robbery 29 12 Personal vandalism 12 30 Household vandalism 16 35
With one exception, victimization rates did not differ significantly between Capitol Hill employees and other employed people in the DC area. The single exception was larceny wilnout contact, where Capitol Hill employees had a higher overall rate.
The following rates were found:
Vlolenl crime Robbery Assault Threats
Property crime Larceny with contact Larceny without ~ontact Personal vandalism
Capitol Hill
employees
14 32 23
58 135
39
Other employed
~.
18 36 23
62 106 31
Source: Criminal victimization of District of Co/um. '~ residents and Capilol Hill employees: Summary.
1986 Annual Report 13
BJS reports on .•.
Characteristics of various types of crime
Information on the characteristics of completed and attempted criminal events can help the public take actions to avoid crime. For example. many burglaries can be avoided by simply keeping doors locked.
BJS periodically publishes reports from the National Crime Survey on the characteristics of specific types of crimes. For example, an August 1986 Special Report examined domestic violence against women. In earlier years, crimes such as rape and burglary were the topics of special reports. Topics scheduled for analysis during fiscal 1987 include robbery and stranger and nonstranger violent crime.
Other data describing crime characteristics are collected under the Federal Justice Statistics Program. During fiscal 1 £186, the prototype for an annual compendium of Federal justice statistics was developed describing characteristics of both criminal and civil offenses. The Initial compendium will be released in fiscal1g87. In addition, data from the previously completed study on electronic fund transfer systems fraud, as set out in Electronic fund transfer systems fraud (BJS Final Report, April 1986) were made available in response to numerous public inquiries. During fiscal 1987 a report will be prepared and published on Federal white-collar crime.
14 Bureau of Justice Statistics
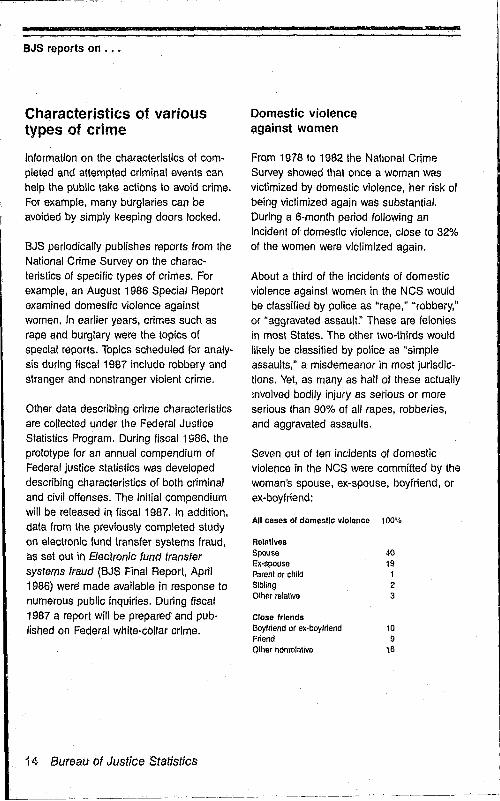
Domestic violence against women
From 1978 to 1982 the National Crime Survey showed that once a woman was victimized by domestic violence, her risk of being victimized again was substantial. During a 6-month period following an incident of domestic violence, close to 32% of the women were victimized again.
About a third of the incidents of domestic violence against women in the NCS would be classified by police as "rape," "robbeiY," or "aggravated assault:' These are felonies in most States. The other two-thirds would likely be classified by police as "simple assaults," a misdemeanor in most jurisdictions. Yet, as many as half of these actually lnvolved bodily injury as serious or more serious than 90% of all rapes, robberies, and aggravated assaults.
Sev(3n out of ten incidents of domestic violence in the NCS were committed by the woman's spollse, ex-spouse, boyfriend, or ex-boyfriend:
All cases III domestic violence 100%
Relatives Spouse 40 Ex-spouse 19 Parent or child 1 Sibling 2 Other relative 3
Close !rlends Boyfriend o( ex-boyfriend 10 Friend 9 Other nClnrelative 16
----.-- --- ------ --_._------------------~----

An estimated 52% of all incidents of domestic violence were brought to police attention. Calling the police following the violence seems to reduce the risk of a husband attacking his wife again within 6 months by as much as 62%.
Rape
Source: Preventing domestIc vIolence against women.
During the 10 years 1973-82, there were about 1.5 million rapes or attempted rapes in the United States.
Among rape and attempted rape victims• close to three-quarters are unmarried women II two-thirds are under 25 .. about half are from low-income families • four-fifths are white, but compared to their proportion in the general population black women are significantly more likely than white women to be Victims.
Two thirds of all rapes and attempted rapes occur at night-the highest proportion between 6 p.m. and midnight.
About half the cases of rape or attempted rape are reported to the police. The reasons most often given for not reporting a rape or attempted rape to the police or oth"r authorities are that-• the incident was too private or personal • the victim felt the police would be insensitive or ineffective.
Victims who said they did report the rape to the police most often said that they did so-• to keep It from happening again or to others • to punish the offender.
Over four-fifths of the rape victims reported that they took self-protective measures, Including reasoning with the offender, fleeing from the offender, screaming or yelling for help, hitting. kicking, or scratching the offender, and using or brandishing a weapon.
Sources; The came of rape. Criminal victimization In the United States. 1984.
1986 Annual Report 15
BJS reports on ...
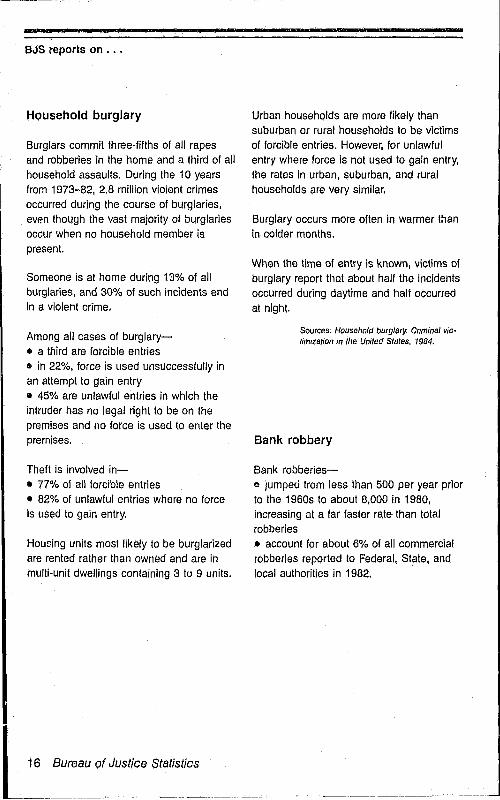
Household burglary
Burglars commit three-fifths of all rapes and robberies in the home and a third of all household assaults. During the 10 years from 1973-82, 2.8 million vioient crimes occurred during the course of burglaries, even though the vast majority of burglaries occur when no household member is present.
Someone is at home during 13% of all burglaries, and 30% of such incidents end in a violent crime.
Among all cases of burglary• a third are forcible entries s in 22%, force is used unsuccessfully in an attempt to gain entry • 45% are unlawful entries in which the intruder has no legal right to be on the premises and no force is used to enter the premises.
Theft is involved in-• 77% of all forcible entries • 82% of unlawful entries where no force is used to gain entry.
Hout1.ing units most likely to be burglarized are rented rather than owned and are in multi-unit dwellings containing 3 to 9 units.
Urban households are more likely than suburban or rural households to be victims of forcible entries. However, for unlawful entry where force is not used to gain entry, the rates in urban, suburban, and rural households are very similar.
Burglary occurs more often in warmer than in colder months.
When the time of entry is known. victims of burglary report that about half the Incidents occurred during daytime and half occurred at night.
Sources; Household burglar}'. Criminal victim.zation in Ihe United States, 1984.
Bank robbery
Bank robberies-c jumped from less than 500 per year prior to the 1960s to about 8,000 in 1980, increasing at a far faster rate than total robberies • account for about 6% of all commercial robberies reported to Federal, State, and local authorities in 1982.
------------------------------------
"
p',,' ...
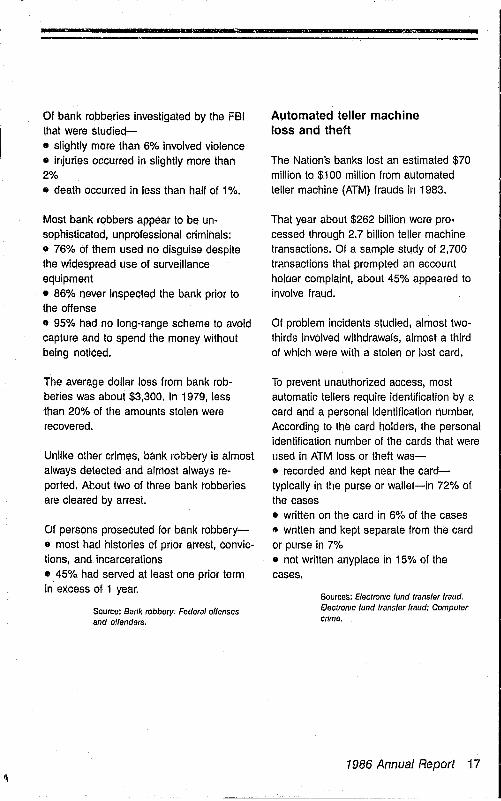
Of bank robberies investigated by the FBI that were studied-
• slightly more than 6% involved violence • injuries occurred in slightly more than 2%
• death occurred in less than half of 1 %.
Most bank robbers appear to be unsophisticated, unprofessional criminals: o 76% of them used no disguise despite the widespread use of surveillance equipment
• 86% never inspected the bank prior to the offef'!se
• 95% had no long-range scheme to avoid capture and to spend the money without being noticed.
The average dollar loss from bank robberies was about $3,300. In 1979, less than 20% of the amounts stolen were recovered.
Unlike other crimes, bank robbery is almost always detected and almost always reported. Atout two of three bank robberies are cleared by arrest.
Of persons prosecuted for bank robbery
• most had histories of prior armst, convictions, and incarcerations
• 45% had served at least one prior term in excess of 1 year.
Source: Bank robbery: Federal oltenses and ollenders.
'.W
Automated teller machine loss and theft
The Nation's banks lost an estimated $70 million to $100 million from automated teller machine (ATM) frauds in 1983.
That year about $262 billion were processed through 2.7 billion teller machine transactions. Of a sample study of 2,700 tmnsactions that prompted an account holoer complaint, about 45% appeared to involve fraud.
Of problem incidents studied, almost twothirds involved withdrawals, almost a third of which were with a stolen or lost card.
To prevent unauthorized access, most automatic tellers require identification by a card and a personal identification number. According to the card holders, the personal identification number of the cards that were used in ATM loss or theft was-e recorded and kept near the cardtypically in the purse or wallet-in 72% of the cases • written on the card in 6% of the cases ., written and kept separate from the card or purse in 7% • not written anyplace in 15% of the cases.
Sources: Electromc lund transler fraud. Electronic lund transfer fraud: Computer crlmo.
1986 Annual Report 17
BJS reports on ...
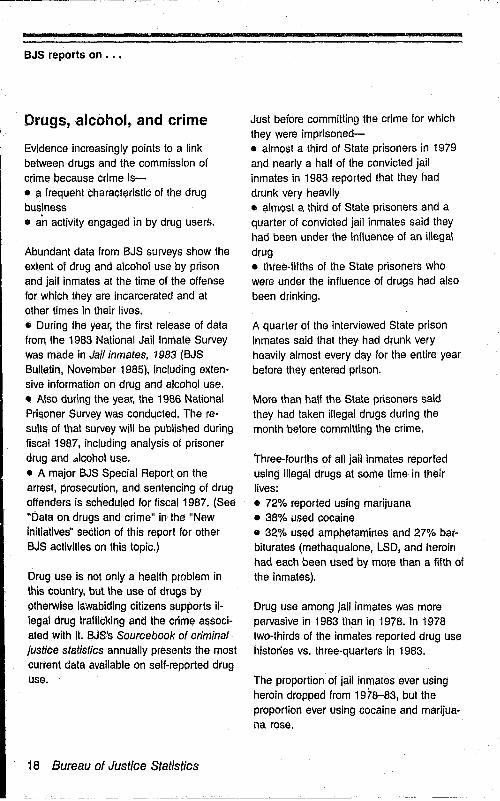
Drugs, alcohol, and crime
Evidence increasingly points to a link between drugs and the commission of crime because crime is-• a frequent characteristic of the drug business • an activity engaged in by drug users.
Abundant data from BJS surveys show the extent of drug and alcohol use by prison and jail inmates at the time of the offense for which they are incarcerated and at other times in their lives. • During the year, the first release of data from the 1983 National Jail Inmate Survey was made in Jail inmates. 1983 (BJS Bulletin, November 1985), including e)<lensive information on drug and alcohol use. • Also during the year, the 1986 National Prisoner Survey was conducted. The results of that survey will be published during fiscal 1987, including analysis of prisoner drug and alcohol use. • A major BJS Special Report on the arrest, prosecution, and sentencing of drug offenders is scheduled for fiscal 1987. (See "Data on drugs and crime" in the "New Initiatives" section of this report for other BJS activities on this topic.)
Drug use is not only a health problem in this country, but the use of drugs by otherwise lawabidlng citizens supports illegal drug trafficking and the crime associated with iI. BJS's Sourcebook of criminal justice statistics annually presents the most current data available on self-reported drug use.
18 Bureau of Justice Statistics
Just before committing the crime for which they were imprisoned-• almost a third of State prisoners in 1979 and nearly a half of the convicted jail inmates in 1983 reported that they had drunk very heavily • almost a third of State prisoners and a quarter of convicted jail inmates said they had been under the influence of an illegal drug • three-fifths of the State prisoners who were under the influence of drugs had also been drinking.
A quarter of the Interviewed State prison inmates said that they had drunk very heavily almost every day for the entire year before they entered prison.
More than half the State prisoners said they had taken illegal drugs during the month before committing the crime.
Three-fourths of all jail inmates reported using illegal drugs at some time in their lives: • 72% reported using marijuana • 38% used cocaine • 32% used amphetamines and 27% barbiturates (methaqualone, LSD, and heroin had each been used by more than a fifth of the inmates).
Drug use among jail inmates was more pervasive in 1983 than in 1978. In 1978 two-thirds of the inmates reported drug use histories vs. three-quarters in 1983.
The proportion of jail inmates ever USing heroin dropped from 1978-83, but the proportion ever using cocaine and marijuana rose.

Habitual offenders and persons convicted of assault, burglary, or rape were more likely than other State prisoners to have been very heavy drinkers. Alcohol was mos~ likely to have been used by jail inmates convicted· of public-order offenses and violent offenses, particularly manslaughter and assault.
Among State prisoners, drug offenders and burglars were the most likely to have been under the inlluence of drugs at the time of the offense. Among jail inmates, the most likely to have been under such influence were drug offenders and property offenders.
Among prison inmates, whites, males, and persons between ages 18 and 25 are especially likely to have been very heavy drinkers.
Male prison inmates are somewhat more likely than female inmates to use drugs. However, the proportion who use heroin is somewhat greater among women than among men.
The BJS-sponsored National Survey of Crime Severity asked a nationally representative sample of persons in 1977 to rank the seriousness of 204 criminal events. Results of that survey demonstrate that the American public views drug trafficking very seriously: • running a narcotics ring is ranked 10th out of 204 crimes, higher than a skyjacking, a rape requiring hospitalization, the intentional shooting of a victim, or many other serious violent crimes
• selling heroin to another person for resale ranks 28th, and smuggling heroin into the country ranks 32nd, each of which ranks higher than a husband beating his wife so that she reqUIres hospitalization, a knife stabbing, an armed bank robbery of $100,000, or robbery of a small amount of money in which the victim is injured and hospitalized • each of the six drug trafficking items on the survey ranked in the top 50% of the seriousness scale; the lower ranking items included trafficking in illegal barbiturates and marijuana.
Drug use and careers in crime appear to be related. The more convictions inmates had on their records, the more likely they were to have taken drugs in the month prior to committing the crime for which they were incarcerated: • three-fifths of State prison inmates in 1979 with five or more prior convictions had used drugs in the prior month, compared with two-fifths of those with no prior convictions • the proportion of inmates who had used heroin in the previous month was three times higher for those with five or more prior convictions than for those with no prior convictions.
1986 Annual Report 19
BJS reDorts on ...
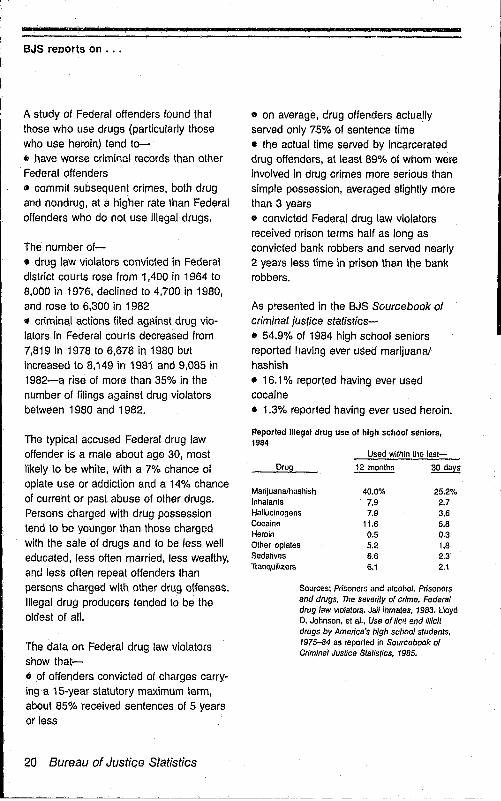
A study of Federal offenders found that those who use drugs (particularly those who use heroin) tend to-
• have worse crimir.~! records than other Federal offenders
• commit subsequent crimes, both drug and nondrug, at a higher rate than Federal offenders who do not use illegal drugs.
The number ot-• drug law Violators convicted in Federal district courts rose from 1,400 in 1964 to 8,000 in 1976, declined to 4,700 in 1980, and rose to 6,300 in 1982
• criminal actions filed against drug violators in Federal courts decreased from 7,819 in 1978 to 6,676 in 1980 but increased to 8,149 in 1981 and 9,085 in 1982-a rise of more Ihan 35% in the number of filings against drug violators between 1980 and 1982.
The typical accused Federal drug law offender is a male about age 30, most likely to be white, with a 7% chance of opiate use or addiction and a 14% chance of current or past abuse of other drugs. Persons charged with drug possession tend to be younger than those charged with the sale of drugs and to be less well educated, less often married, less wealthy, and less often repeat offenders than persons charged with other drug offenses. Illegal drug producers lended to be the oldest of all.
The data on Federal drug law violators show that-a of offenders convicted of charges carryinga 15-year statutory maximum term, about 85% received sentences of 5 years or less
20 Bureau of Justice Statistics
e on average, drug offenders actually served only 75% of sentence time
..
• the actual lime served by incarcerated drug offenders, at least 89% of whom were involved in drug crimes more serious than simple possession, averaged slightly more than 3 years o convicted Federal drug law Violators received orison terms half as long as convicted bank robbers and served nearly 2 years less time in prison than the bank robbers.
As presented In the BJS Sourcebook of criminal Justice staUstjcs-e 54.9% of 1984 high school seniors reported having ever used marijuana! hashish
• 16.1 % reported haVing ever used cocaine
• 1.3% reported having ever used heroin.
Reported Illegal drug use of high school seniors, 1984
Drug
Marijuana/hashish Inhalants Hallucinogens Cocaine Heroin Other opiates Sedatives Tranquilizers
Used within the last-
40.0% 7.9 7.9
11.6 0.5 5,2 6.6 6.1
25.2% 2.7 3.6 5.8 0.3 1.8 2.3 2.1
Sources: Prisoners and alCOhol. Prisoners and drugs. The severily o( crime. Federal drug law violators. Jail inmates. 1983. Lloyd D. Johnson. et aI., Use of Ilei! and lIIicil drugs by America's high school students, 1975-84 as reported in Sourcebook o( Criminal Jusffce Statistics. 1985.

The cost of crime
One of the questions most often asked of BJS by policy makers, the media, and members of the general public is ''What is the total cost of crime to society?"
In all likelihood, there will never be a simple qnswer to this seemingly simple question for a variety of reasons: • Many costs to society of criminal activity cannot be measured directly. These include monies that might have been channeled into legal purchases if they had not bE'en diverted for illegal purposes such as gambling, drug purchases, and prostitution. Organized crime, drug trafficking, and illegal immigration result in economic losses to society, but these defy direct measurement. Also difficult to measure are the losses from fraudulent activities that the victims are embarrassed 10 report. III Some ot the costs of crime to society are no! quantifiablo. These include nonmonetary costs to victims, such as pain and suffering from injury, psychological distress, fear, and similar effects on victims and their families and friends,
However, BJS does measure some components of the cost of crime to society. One source is the National Crim") Survey, which measures the value of property stolen or damaged through criminal incidents and the cost of medical care resulting from victimization.
Another cost of crime to society is that of operating the criminal justice system. In fiscal 1986, a second annual overview report on the cost of the criminal justice system and on employment in criminal justice-using a revised, I(;!~s expensive methodology-was issued in Justice expenditure and employment 1983 (BJS Bulletin, July 1986). Now that th('. revised methodology is firmly established, the gap between reference date and publication date can be shortened. A detailed report on total criminal justice system expenditure and employment was prepared during the year; it presents extensive tabulations (\f
data for 1982 and 1983.
The collection of fiscal 1985 data on cos Is of the justice system was completed during the year, using a methodology that will provide substantive and geographic data in greater detail. The content and coverage of these data will be similar to data gathered for 1971-79. The results will be published in fiscal 1987.
A special analysis of long-term trends in municipal spending for police services was completed during the year and the results were published in Police employment and expenditure trends (BJS Special Report, February 1986). This report examined expenditure data from 1938 to 1982 and employment data from 1954 to 1982 for 88 cities over 100,000 population.
1986 Annual Report 21
BJS reports on ...
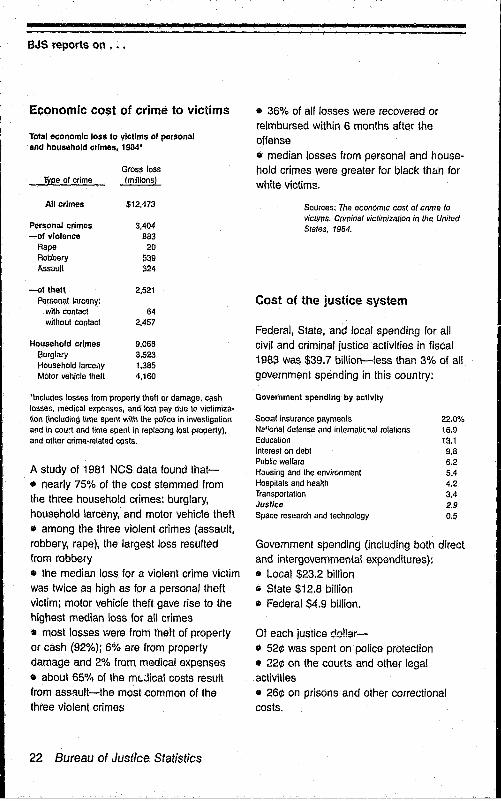
Economic cost of crime to victims
Total economic 105$ to victims of personal and household crimes, 1984'
Gross loss Type 01 crime (millions)
All crimes $12,473
Personal crimes 3,404 -of violence 883
Rape 20 Robbery 539 Assault 324
-of thelt 2,521 Personal larceny:
with contact 64 without contact 2,457
Household crimes 9,068 Burglary 3,523 Household larceilY 1,385 Molor vehicle Ihelt 4,160
'Includes losses from property theft or damage, cash losses, mediCal expenses, and lost pay due to victimization (including time spent with the pOlice in investigation and In court and lime spent in replacing lost property), and other crime-related costs,
A study of 1981 NCS data found that-e nearly 75% of the cost slemmed from the three household crimes: burglary, household larceny, and motor vehicle theft • among the three violenl crimes (assault, robbery, rape), the largest loss reSUlted from robbery • the median loss for a violent crime victim was twice as high as for a personal theft victim: motor vehiCle theft gave rise to the highest median loss for all crimes • most losses were from theft of property or cash (92%); 6% are from property damage and 2% from medical expenses • about 65% of the mt.Jical costs result from assflult-the most common of the three Violent crimes
22 Bureau of Justice Statistics
• 36% of all losses were recovered or reimbursed within 6 months after the offense • median losses from personal and household crimes were greater for black th&n for white victims.
Sources: The economic cost 01 crime 10 victims, Criminal Victimization in the United Stales, 1984.
Cost of the justice system
Federal, State, and local spending for all civil and criminal justice activities in fiscal 1983 was $39.7 bi/lion-Iess than 3% of a\l government spending in this country:
Government spending by activity
Social insurance paymenls Ne~ional delense and internatic '\al retations Education Interest on debt Public Welfare Hilusing and the environment Hospilals and health Transportation Justice Space research and technology
22.0% \6.9 13.1
9.8 6.2 5.4 4.2 3.4 2.9 0.5
Govemment spending (including both direct and intergovernmental expenditures): • Local $23.2 billion ... State $12,8 billion • Federal $4.9 bi/lion.
Of each justice do!!ar-• 52¢ was spent on police protection • 22¢ on the courts and other legal activities • 26¢ on prisons and other correctional costs.
---~------------------- -------------------~--------
I
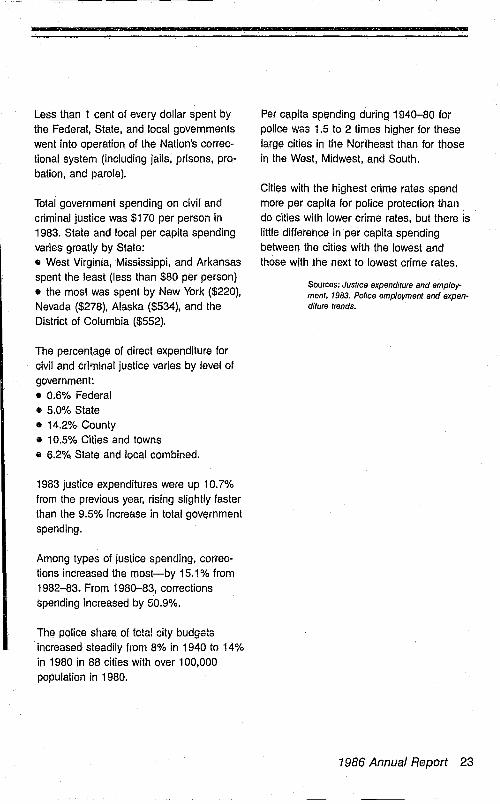
Less than 1 cent of every dollar spent by the Federal, State, and local governments went into operation of the Nation's correctional system (including jails, prisons, probation, and parole).
Total government spending on civil and criminal justice was $170 per person in 1983. State and local per capita spending varies greatly by State: • West Virginia, Mississippi, and Arkansas spent the least (less than $80 per person) • the most was spent by New York ($220), Nevada ($278), Alaska ($534), and the District of Columbia ($552).
The percentage of direct expenditure for civil and crl'Tlinal justice varies by level of government: • 0.6% Federal .5.0% State • 14.2% County • 10.5% Cities and towns a 6.2% State and local combined.
1983 justice expenditures were up 10.7% from the previous year, rising slightly faster than the 9.5% increase in total government spending.
Among types oi justice spending, corrections increased the most-by 15.1 % from 1982-83. From 1980-83, corrections spending increased by 50.9%.
ThE) police share of total city budgets increased steadily from 8% in 1940 to 14% in 1980 in 88 cities with over 100,000 population in 1980.
-
Per capita spending during 1940-80 for police was 1.5 10 2 times higher for these large cities in the Northeast than for those in the West, Midwest, and South.
Cities with the highest crime rates spend more per capita for police protection than do cities with lower crime rates, but there is little difference in per capita spending between the cities with the lowest and those with the next to lowest crime rates.
Sources: Justice expenditure and employ· ment, 1983. Police employment and expen· diture trends.
1986 Annual Report 23 I
BJS reports on ...
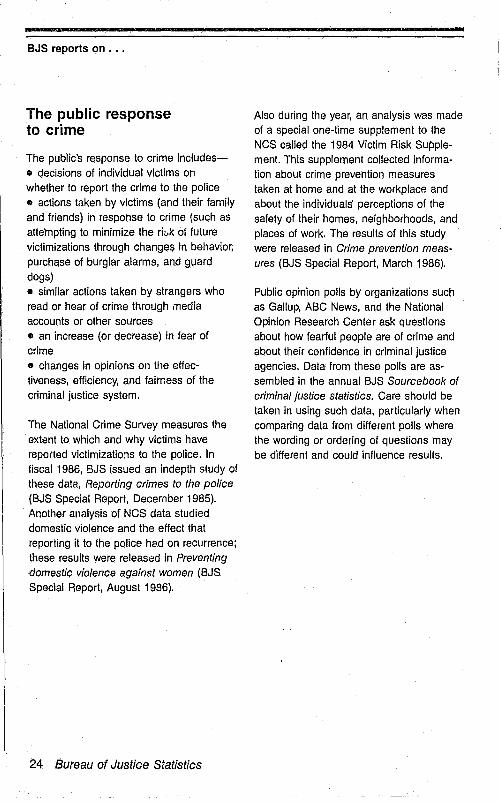
The public response to crime
The public's response to crime includes
• decisions of individual victims on whether to report the crime to the police " actions taken by victims (and their family and friends) in response to crime (such as attempting to minimize the ri:..k of future victimizations through changes in behavior, purchase of burglar alarms, and guard dogs)
• similar actions taken by strangers who read or hear of crime through media accounts or other sources
• an increase (or decrease) in fear of crime " changes in opinions on the effectiveness, efficiency, and fairness of the criminal justice system.
The National Crime Survey measures the extent to Which and why victims have reported victimizatio~s to the police. In fiscal 1986, BJS issued an indepth study of these data, Reporting crimes to the police (BJS Special Report, December 1985). Another analysis of NCS data stUdied domestic violence and the effect that reporting it to the police had on recurrence; these results were released in Preventfng domestic violence against women (BJS Special Report, August 1986).
24 Bureau of Justice Statistics
Also during the year, an analysis was made of a special one-time supplement to the NCS called the 1984 Victim Risk Supplement. This supplement collected Information about crime prevention measures taken at home and at the workplacfl and about the individuals' perceptions of the safety of their homes, neighborhoods, and places of work. The results of this study were released in Crime prevention measures (BJS Special Report, March 1986).
Public opinion polls by organizations such as Gallup, ABC News, and the National Opinion Research Center ask questions about how fearful people are of crime and about their confidence in criminal justice agencies. Data from these polls are assembled in the annual BJS Sourcebook of criminal justice statistics. Care should be taken in using such data, particularly when comparing data from different poils where the wording or ordering of questions may be different and could influence results.

Preventing crime
About a third of all households reported in 1984 taking one or more of these crime prevention measures:
Engraving valuables 25% Neighborhood watch 7 Burglar alarm 7
Black and white households are equally likely to take at least one of these measures.
The higher the household income tr.e more likely it is that the home has a burglar alarm. One in six families with incomes of $50,000 or more have onej this is twice the rate of families with incomes between $25,000 and $50,000 and three times that of families with incomes less than $25,000.
Almost a fifth of all families live in communities that have neighborhood watch programs and, of these, about 38% of the families participate in these programs.
Households in areas with neighborhood watch programs and those participating in such programs vary with income:
Percent Household wilh Percent
income ~ participating
Less than $7,500 14% 4C1/0
$7,500-9,999 14 5 $10,000-14,999 16 6 $15,000-24,999 19 7 $25,000-29,999 22 9 $30,000-49,999 25 11 $50,000 or more 30 15
One in four urban families lives in a neighborhood with a crime watch program as do one in five suburban families and one in eight families who live outside metropolitan areas.
Of the households surveyed, 20% had at least one of these features: • a fence or barricade at the entrance • a doorkeeper, guak'<.l, or receptionist G an intercom or phone for gaining entrance to the building • surveillance cameras • bars on windows or doors • signs indicating alarms or security devices .. other warning signs, such as "beware of the dog:'
Percent of respondents who reported at least one security measure at work:
Security measure Percent
Receptionist or guard who checks people In 42% Burglar alarm system 33 Police or guard for proleclion 30 Pass or ID required for entrance 19 Locked entry during work hours 16 Surveillance camera 16 Guard dog 2
Source: Crime prevention measuros.
1986 Annual Report 25
BJS reports on ...
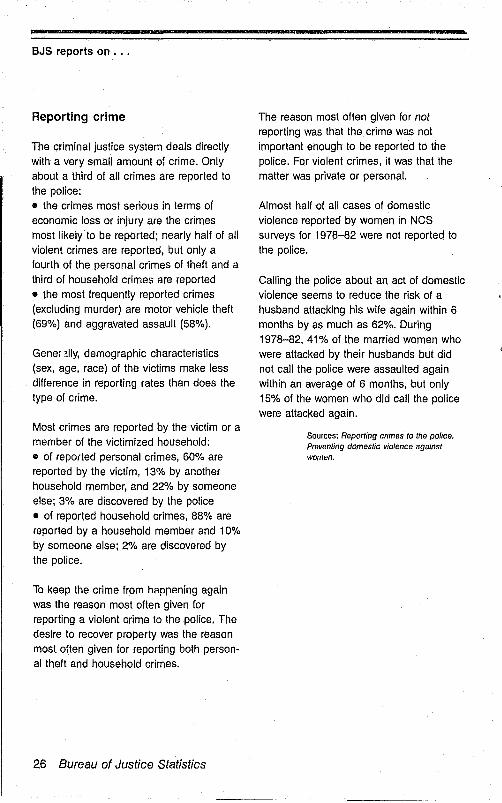
Reporting crime
The criminal justice system deals directly
with a very small amount 01 crime. Only about a third of all crimes are reported to the police:
• the crimes most serious in terms of economic loss or injury are the crimes most likely to be reported; nearly half of all violent crimes are reported, but only a fourth of the personal crimes of theft and a
third of household crimes are reported
• the most frequently reported crimes (excluding murder) are motor vehicle theft (69%) and aggravated assault (58%).
Gener lily, demographic characteristics (sex, age, race) of the victims make less
difference in reporting rates than does the type of crime.
Most crimes are reported by the victim or a
member of the victimized household:
• of reported personal crimes, 60% are reported by the victim, 13% by another household member, and 22% by someone
else; 3% are discovered by the police
• of reported household crimes, 88% are reported by a household member and 10% by someone else; 2% are discovered by the police.
To keep the crime from happFHling again was the reason most often given for
reporting a violent crime to the police. The desire to recover property was the reason most often given for reporting both personal theft and household crimes.
26 Bureau of Justice Statistics
The reason most often given for not reporting was that the crime was not
important enough to be reported to the police. For violent crimes, it was that the matter was private or personal.
Almost half of all cases of domestic violence reported by women in NCS surveys for 1978-82 were not reported to
the police.
Calling the police about an act of domestic violence seems to reduce the risk of a
husband attacking his wife again within 6 months by as much as 62%. During 1978-82,41% of the married women who
were attacked by their husbands but did not call the police were assaulted again within an average of 6 months, but only
15% of the women who did call the police were attacked again.
Sources: Reporting crimes to the police. Preventing domestic violence agamst women.

-_._----------------------------------: .
Fear of crime
In 1984, the National Crime Survey included a "Victim Risk Supplement:' Of the persons asked-" about 32% said they felt their neighborhood was very safe from crime " 59% said their neighborhood was fairly safe • 10% said it was unsafe.
More than 90% of the people asked said they felt very or fairly safe at their workplace.
As presented in the 1984 BJS Sourcebook of criminaf justice statistics, 16% of respondents to a 1983 Gallup poll said they felt unsafe when asked, "How about at home at night-do you feel safe and secure, or not?" This percentage has remained about the same when asked in 1972 (17%),1975 (19%), 1977 (15%), and
1981 (16%).
Feeling unsafe at home at night was more likely to be reported In 1983 by-e females (20%) than by males (11%)
" people In large cities than by those in smaller cities and rural areas It blacks and other nonwhites (23%) than by whites (14%).
In that same poll, 45% of respondents said "yes" when asked "Is there any area right around here-that is, within a mile-where you would be afraid to walk alone at night?" (This percentage was about the same during the 1970's, but it is an increase over the 34% and 31 % reported when the question was asked in 1965 and 1967.)
Presented in the 1985 Sourcebook were the results of a 1984 Media Generall Associated Press Poll. In that poll, the following percentages of respondents reported being concerned about-
Someone forcing his way into your home and stealing your possessions 61 % Someone robbing or mugging you on the street 49 Someone raping you or a family member 62
..
Sources; Crime prevention measures. Gal· lup Report and Gallup OpInion Index. as presented In Sourcebook 01 cnminal lustice statistics. 1984. Media General Associated Press Poll. as presented In Sourcebook 01 crlminallustlce statistics. 11185.
1986 Annual Report 27
·"A" -BJS reports on ...
Public confidence in the criminal justice system
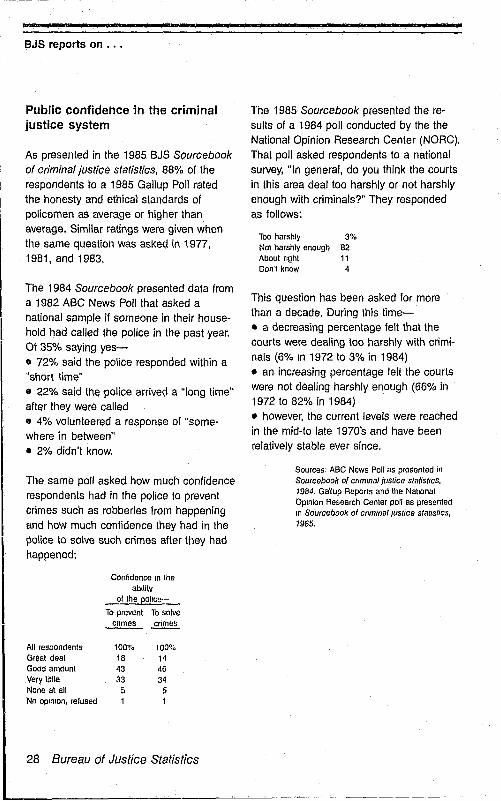
As presented in the 1985 BJS Sourcebook of criminal justice statistics, 88% of the respondents to a 1985 Gallup Poll rated the honesty and ethical standards of policemen as average or higher than average. Similar ratings were given when the same question was asked in 1977, 1981, and 1983.
The 1984 Sourcebook presented data from a 1982 ABC News Poll that asked a national sample if someone in their household had called the police in the past year. Of 35% saying yes-G 72% said the police responded within a "short time"
It 22% said the police arrived a "long time" after they were called o 4% volunteered a response of "some· where in between" • 2% didn't know.
The same poll asked how much confidence respondents had in the police to prevent crimes such as robberies from happening and how much confidence they had in the police to solve such crimes after they had happened:
All resoondants Greal deal Good amount Very little None at all No Op'niOn, refused
Confidence In the ability
of the police--
To prevent To solve
~~
100% 100% 18 14 43 46 33 34 5 5
1
28 Bureau of Justice Statistics
The 1985 Sourcebook presented the results of a 1984 poll conducted by the the National Opinion Research Center (NaRC). That poll asked respondents to a national survey, "In general, do you think the courts in this area deal too harshly or not harshly enough with criminals?" They responded as follows:
Too harshly 3% Not harshty enough 82 About nght 11 Don·t know 4
This question has been asked for more than a decade. During this time-s a decreasing percentage felt that the courts were dealing too harshly with criminals (6% In 1972 to 3% in 1984) • an increasing percentage felt the courts were not dealing harshly enough (66% in 1972 to 82% in 1984) • however, the current levels were reached in the mid-to late 1970's and have been relatively stable ever since .
Sources: ABC News Poll as presented In SourcebDok Df cflmmalllJstice slallstics, 1984. Gallup Reports and the Natlonat Opinion Research Center poll as presented 10 SDurceboDk of criminallustlCe statistics, 1985.
L.. ______________________ . ________ -- - -- - ---

---------------------------------------------------
Adjudication and sentencing
Policy makers and the public are particularly concerned about-If what happens to accused offenders when charges are brought against them and their cases are heard in court? • are they released on "technicalities?" • are they allowed to plead guilty to lesser charges and thus not receive the full measure of legal sanctions due to them for the crimes they have committed? • do they delay court proceedings through legal maneuverings that discourage witnesses and victims from continued participation in the prosecution? • are the sentences received by convicted offenders consistent with the seriousness of the offenses they have committed?
Methods of case processing and terminology vary across the country. Consequently, much of the information on this phase of criminal justice is based on studies of limited numbers of jurisdictions.
Of major importance in fiscal 1986 was the continuation of several methodological projects directed toward development of nationally representative court case· processing and outcome data and improved data on other aspects of the judicial phase of criminal justice. (These eHorts are described in the "New initiatives" section of this report.)
-
One source of data on local prosecution is the management information systems maintained by prosecutors in jurisdictions throughout the country. The BJS-sponsored Prosecution of Felony Arrests Project obtains case processing data from such systems in some jurisdictions: • It collects information on case attrition, guilty pleas, final dispositions, and case processing time. • In fiscal 1986, Felony case processing time (BJS Special Report, August 1986), covering 12 mostly urban jurisdictions, was published. • Also in fiscal 1986, final reports covering 2 years of prosecutor data were published: Prosecution of felony arrests, 1980 (BJS Final Report, October 1985) and Prosecution of felony arrests, 1981 (BJS Final Report, September 1986). • The number of jurisdictions participating in this project has grown from 13 supplying 1977 data to 28 providing 1980 data and 37 submitting 1981 data.
The Felony Sentencing Outcomes Project produced Felony sentencing in 18 local jurisdictions (BJS Special Report. June 1985) in liscal1985. • In fiscal 1986 this project was expanded to cover more than.30 jurisdictions. • Data are being collected lor 50,000 (0
55,000 felony court sentences for the offenses of homicide, rape, robbery, aggravated assault. burglary. larceny, drug trafticking. and arson. • The project will study the use of different kinds and degrees of sanctions and will examine the impact on sentencing patterns of such factors as crime severity, different types of sentencing systems, the number of conviction offenses. and the use of pleas vs. trials.
1986 Annuaf Report 29
BJS reports on . .. .
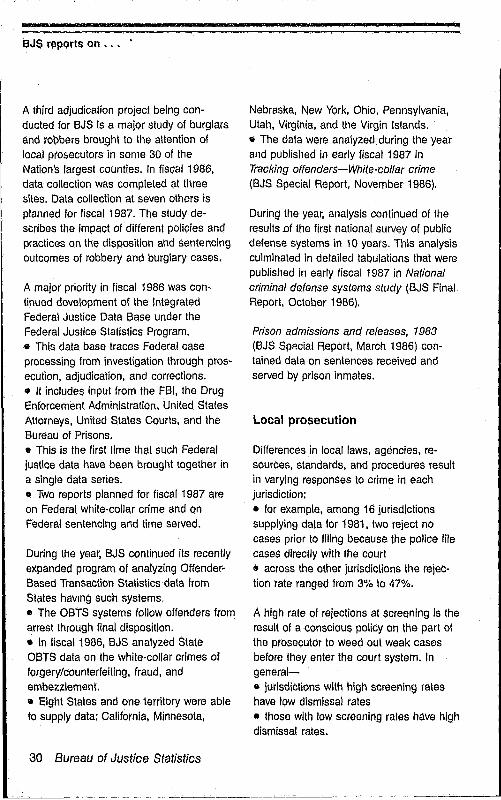
A third adjudication project being conducted for BJS is a major study of burglars and robbers brought to the attention of local pro&ecutors in some 30 of the Nation's largest counties. In fiscal 1986, data collection was completed at three sites. Data collection at seven others is planned for fiscal 1987. The study describes the impact of different pOlicies and practices on the disposition and sentencing outcomes of robbery and burglary cases.
A major priority in fiscal 1986 was continued development of the Integrated Federal Justice Data Base under the Federal Justice Statistics Program. • This data base traces Federal case processing from investigation through prosecution, adjudication, and corrections. • It includes input from the FBI, the Drug Enforcement Administration, United States Attorneys, United States Courts, and the Bureau of Prisons. • This is the first time that such Federal justice data have been brought together in a Single data series. • Two reports planned for fiscal 1987 are on Federal white-collar crime and on Federal sentencing and time served.
During the year, BJS continued its recently expanded program of analyzing OffenderBased Transaction Statistics data from States haVing such systems. • The OBTS systems follow offenders from arrest through final disposition. • In fiscal 1986, BJS analyzed State OBTS data on the white-collar crimes of forgery/counterfeiting, fraud, and embezzlement. • Eight States and one territory were able to supply data: California, Minnesota,
30 Bureau of Justice Statistics
Nebraska, New York, Ohio, Pennsylvania, Utah, Virginia, and the Virgin Islands. • The data were analyzed during the year and published in early fiscal 1987 in Tracking offenders-White-colfar crime (BJS Special Report, November 1986).
During the year, analysis continued of the results .of the first national survey of public defense systems in 10 years. This analYSis CUlminated in detailed tabulations that were published in early fiscal 1987 in National criminal defense systems study (BJS Final Report, October 1986).
Prison admissions and releases, 1983 (BJS SpRcial Report, March 1986) contained data on sentences received and served by prison inmates.
Local prosecution
Differences in local laws, agencies, resources, standards, and procedures result in varying responses to crime in each jurisdiction: • for example, among 16 jurisdictions supplying data for 1981. two reject no cases prior to filing because the police file cases directly with the court • across the other jurisdictions the rejection rate ranged from 3% to 47%.
A high rate of rejections at screening is the result of a conscious policy on the part 01 the prosecutor to weed out weak cases before they enter the court system. In general-~ jurisdictions with high screening rates have low dismissal rates • those with loW screening rates have high dismissal rates.
•
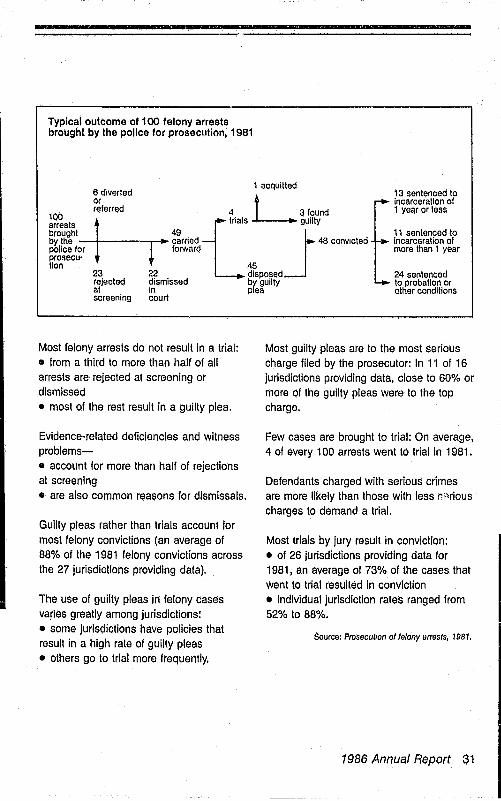
Typical outcome of 100 felony arrests brought by the police for prosecutlQn, 1981
1 acquitted
~~:~::ed 4 L 3 found
13 sentenced to ~ Incarceration of
1 year or less
!~~sts h [rialS gUilty brought 49 J by the carried 48 convicted police for forward prosecu-tion 45
23 22 disposed rejected dismissed by guilty
11 sentenced to ,.. incarceration of
more than 1 year
24 sentenced .... to probation or
other conditions at In plea screening court
Most felony arrests do not result in a trial: • from a third to more than half of all arrests are rejected at screening or dismissed • most of the rest result in a guilty plea.
Evidence-related deficiencies and witness problems-• account for more than half of rejections at screening • are also common reasons for dismissals.
Guilty pleas tather than trials account for most felony convictions (an average of 88% of the 1981 felony convictions across the 27 jurisdictions providing data).
The use of guilty pleas in felony cases varies greatly among Jurisdictions: • some jurisdictions have policies that result in a high rate of guilty pleas • others go to trial more frequently.
Most guilty pleas are to the most serious charge filed by the prosecutor: In 11 of 16 jurisdictions providing data, close to 60% or more of the guilty pleas were to the top charge.
Few cases are brought to trial: On average, 4 of every 100 arrests went to trial In 1981.
Defendants charged with serious crimes are more likely than those with less (wlous charges to demand a trial.
Most trials by jury result in conviction: • of 26 jurisdictions providing data for 1981, an average of 73% of the cases that went to trial resulted in conviction • individual jurisdiction rates ranged from 52% to 88%.
Source: Prosecution olle/ony arrests. 1981.
1986 Annual Report 31
BJS reports on •..
Felony case processing time
On average, in a study of 12 mostly urban counties, about half the felonies for which court charges were filed were disposed of within 3 112 months.
The average time for disposition was a little less than 5 months for felonies that resulted in indictments or were otherwise bound over for a trialln a State felony court.
Felony cases that went to trial took about twice as long to complete as did those with guilty pleas or dismissals. Even when felonies went to trial, the average time from arrest to disposition was less than 8 months.
Generally, the more serious the charge, the longer it took to process the case.
Processing times are greatly influenced by how the cases are handled after the charges are first filed in court: • some felony charges are reduced to misdemeanors and the cases disposed of in lower courts • other felony cases are sent to grand juries or are otherwise ordered to trial in a higher court.
Felony cases typically take longer to process than do cases in lower courts: • unlike misdemeanor cases, they typically require preliminary hearings or grand jury presentations • they also more frequently require full trials.
32 Bureau of Justice Statistics
... -
The average processing time in the 12 jurisdictions for ali felony cases filed with the courts according to the most serious charge were:
Homicide Sexual assault Robbery Burglary Larceny
6.2 months 4.2 3.5 3.2 3.2
Many factors influence case disposition times, but delay-reduction poliCies of prosecutors and courts are among the most significant.
Source: Felony cas~ proc~ssmg time.

D
Pretrial release and Federal prosecution
In the Federal courts and in the State and local courts studied, about 85% of the defendants are released pending trial.
Of all Federal defendants released in 1979-• about 50% were on unsecured bond • 23% were on personal recognizance • 14% were on deposit bond • 9% were on surety bond • less than 2% were on collateral bond.
In Federal courts, the highest bail amounts tend to be Imposed on defendants accused of the most serious crimes who have extensive criminal records and weak social and economic ties.
Of Federal defendants released. about 10% are rearrested for new crimes, violate the conditions of their release, or fail to appear for trial. In State and local courts, pretrial misconduct occurs three times as often. This difference may be attributed to the large number of while-collar offenders prosecuted in the Federal courts.
During the same bail period. Federal defendants with serious criminal records are more likely to be rearrested or fail to appear for trial (35%) than defendants with less serious records (20%). or those with no records (8%).
•••
The longer a defendant waits for a trial. the greater is the probability of misconduct: The likelihood was-CI 10% for Federal defendants free on bail for 90 days • 14% for those on ball for 180 days, • 17% for those on bail for 270 days.
Source: Pre/nal release and m/~conduc/: Federal offense and offenders.
1986 Annual Report 33
BJS reports on ...
Indigent defense
The Constitution grants a person accused of a crime punishable by a term of incarceration a right to an attorney. The courts have ruled that the defense of accused persons must be provided regardless of the defendant's ability to pay for such counsel. Therefore, the costs of indigent defense services are borne by the public.
The Nation spent almost $625 million in 1982 for indigent criminal defense services in about 3.2 million State and local court cases.
Spending for indigent defense in 1982 was-e 44% greater than the estimated $435 million spent during 1980 • 213% greater than the estimated $200 million spent in 1976.
The average cost of an indigent defense case nationwide was $196-ranglng from $567 in Hawaii to $85 in Oklahoma.
Assigned counsel systems that require the appointment of private attorneys dominate service delivery patterns. They are used in 60% of all counties, whereas 34% use public defender systems and 6% use contract systems.
Public defender systems are the dominant system in 43 01 the 50 largest counties in the United States and serve 68% of the Nation's population.
34 Bureau of Justice Statistics
A growing number of cases are no longer being handled by public defenders, mainly because of the increasingly strict definition of what constitutes a conflict of interest and limits on the number of cases the public defender is able to handle.
Of all counties studied, 75% have some form of recoupment requiring defendants to repay a portion of their defense costs; but 25% of the counties that require recoupment reported that no payments were received in 1982.
Sources; Criminal defense systems; A naI/onal survey, National criminal defense study
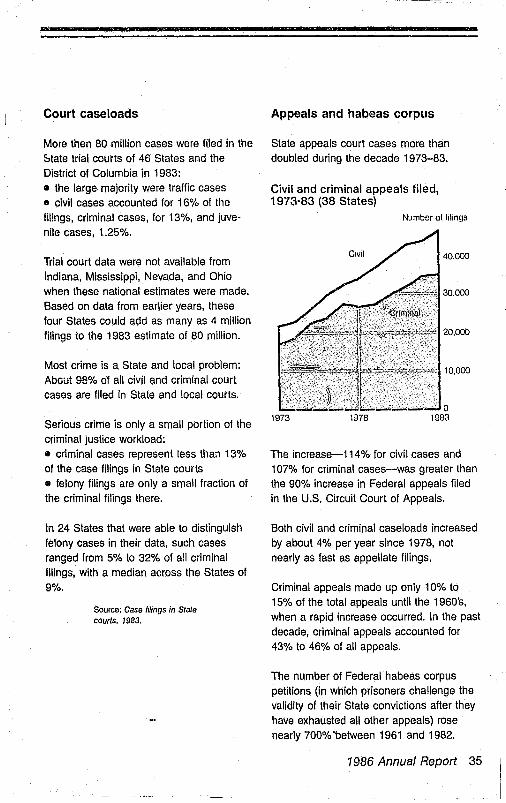
Court case loads Appeals and habeas corpus
More then 80 million cases were filed in the State appeals court cases more than State trial courts of 46 States and the doubled during the decade 1973-83. District of Columbia in 1983: • the large majority were traffic cases • civil cases accounted for 16% of the !!lIngs, criminal cases, for 13%, and juvenile cases, 1.25%.
Trial court data were not available from Indiana, Mississippi, Nevada, and Ohio when these national estimates were made. Based on data from earlier years, these four States could add as many as 4 million filings 10 the 1983 estimate of 80 million.
Most crime is a State and local problem: About 98% of all civil and criminal court cases are filed in State and local courts.
Serious crime is only a small portion of the criminal justice workload: • criminal cases represent less than 13% of the case filings in State courts
• felony filings are only a small fraction of the criminal filings there.
In 24 States that were able to distinguish felony cases in their data, such cases ranged from 5% to 32% of all criminal filings, with a median across the States of 9%.
Source: Case filings in State courts, 1983.
Civil and criminal appeals filed, 1973-83 (38 States)
Number of filings
The increase-114% for civil cases and 107% for criminal cases-was greater than the 90% increase in Federal appeals filed in the U.S. Circuit Court of Appeals.
Both civil and criminal case loads increased by about 4% per year since 1978, not nearly as fast as appellate filings.
Criminal appeals made up only 10% to 15% of the total appeals until the 1960's, when a rapid increase occurred. In the past decade, criminal appeals accounted for 43% to 46% of all appeals.
The number of Federal habeas corpus petitions (in which prisoners challenge the validity of their State convictions after they have exhausted all other appeals) rose nearly 700% 'between 1961 and 1982.
1986 Annual Report 35

BJS reports on ...
Only a small number of inmates (1.8%) who filed habeas corpus petitions were successful in gaining any type of release.
Many of the same prisoners filed successive habeas corpus petitions for State and Federal court review of their conviction and/or detention.
Sources: The growth o( appeals: 1973-83 (.'ends. Habeas corpus; Federal review of State prisoner petitions.
36 Bureau of Justice Statistics
Sentencing practices
States vary in the degree of judicial and parole board discretion in the sentencing and release decisions provided by law. Currently, the range of State sentencing systems involves-
-
Indeterminate sentencing. The judge has primary control over the type of sentence given (such as prison, probation, or fine, and the upper and lower bounds of the length of prison sentences within statutory limits)-but actual time served is determined by the parole board.
Determinate sentenc.ing. The judge sets the type of sentence and the length of prison sentences within statutory limitsbut the parole board may not rele::lse prisoners before their sentences (minus good time) have expired.
Mandatory prison terms. Legislation requires the imposition of a prison sentence,' often of specified length, for certain crimes and/or certain categories of offenders.
Presumptive sentencing. The judge is required to impose a sentence whose length is set by law for each oHense or class of offense. When there are mitigating or aggravating circumstances, however, the judge is allowed to shorten or lengthen the sentence within specified boundaries.
Some States have other practices that affect sentencing and the actual time served:
Sentencing guidelines. The courts set sentences by using procedures designed to structure sentencing decisions, usually based on oHense severity and criminal history.

Parole guidelines. Parole boards use procedures designed to structure release decisions based on measurable offender criteria.
Good-time policies, In nearly all the States, legislation allows for reduction of a pris,?n term based on the offender's behavior in prison,
Emergency crowding provisions, Policies that relieve prison crowding by systematically making certain inmates eligible for early release.
In recent years, many States have been moving away from sentencing systems that allow judges and parole boards wide discretion in sentences and time served to more certain and fixed punishments for crimes-through mandatory sentences, sentences of fixed length (determinate sentencing), and the abolition of parole boards,
Evidence of this shift in sentencing and relea<:'", policy can be seen in the percentage of offenders leaving State prisons as a result of a parole board decision: • in 1977, nearly 72% of those discharged from prison exited as a result of a parole board decision • by contrast, in 1985, 43% of those released were by a parole board's decision • increasingly, States have come to rely on mandatory release (sentence length minus good-time earned while in prison) to fix release dates rather than parole boards .
.:, .. .,.,.. '.
Mandatory sentencing has also gained wide acceptance as legisiiOttures in almost all States have defined specific offenses or offender types for which imprisonment sentences must be given (probation is not an option): • these offenses generally focus on specific violent crimes, offenses involving the use of weapons, or drug crimes • repeat offenders have also been targeted by many States with mandatory enhancements given for a prior felony conviction or the inclusion of new offense categories for repeat offenders in State criminal codes.
Sources: Setting pnson terms. Sentencing praclices In 13 States. Felony sentencing in 18 local JUrisdictions. Pnson admissions and releases. 1983.
1986 Annual Report 37
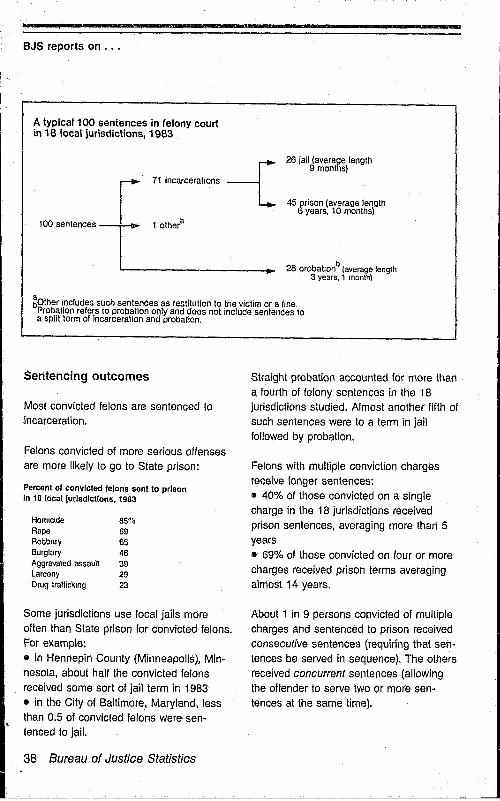
BJS reports on .••
A typical 100 sentences In felony court in 18 local jurisdictions, 1983
r 71 incarcerations
-[
26 jail (average length 9 months)
45 pnson (average length 6 years, 10 months)
1(Xl ,~""~, TL.. ___ '_o_th_e_ra ______ -..
~ 28 probationb
(average lenglh 3 years. 1 month)
bOther includes such sentences as restitution 10 the victim or a fine. Probation refers to propation only and does not include sentences \0 a split term of Incarceration and probation.
Sentencing outcomes
Most convicted felons are sentenced to incarceration.
Felons convicted of more serious offenses are more likely to go to State prison:
Percent of COnvicted felons sent to prison In 18 local iurlsdlctloM, 1983
Homicide 85% Rape 69 Robbery 65 Burglary 46 Aggravated assault 39 larceny 29 Drug trallicking 23
Some jurisdictions use local jails more often than State prison for convicted felons. For example: e in Hennepin County (Minneapolis). Minnesota, about half the convicted felons received some sort 01 jaillerm in 1983 • in the City of Baltimore. Maryland, less than 0.5 of convicted felons were sentenced to jail.
38 Bureau of Justice Statistics
Straight probation accounted for more than a fourth of felony sentences in the 18 jurisdictions stUdied. Almost another fifth of such sentences were to a term in jail followed by probation.
Felons with multiple conviction charges receive longer sentences: • 40% of those convicted on a single charge in the 18 jurisdictions received prison sentences, averaging more than 5 years • 69% of those convicted on four or more charges received prison terms averaging almost 14 years.
About 1 in 9 persons convicted of multiple charges and sentenced to prison received consecutive sentences (requiring that sentences be served in sequence). The others received concurrent sentences (allowing the offender to serve two or more sentences at the same time).
l~'~ ________ .. _________ ~_. ____________ ~" _ ________II

--~-~~- --~---------------------
The prison sentence imposed is longer for persons given consecutive sentences (an average of almost 19 years in the 18 jurisdictions) than for those given concurrent sentences (an average of almost 9 years).
Whites and blacks entering prison in 1983 received the same average sentences if differences in geographical and offense distributions are taken into account: • a higher proportion of blacks than whites had been convicted of a violent crime, especially robbery ,. blacks were concentrated in States that gave longer avernge sentences to all racial groups than were given in other States.
For each of the major violent crimes (except murder), sentences were longer for the men than for the women who entered State prison in 1983. Murder brought a median sentence of life imprisonment for both sexes.
The risk of imprisonment for serious crime has increased in recent years, but it has not yet reached the levels of 20 to 25 years ago.
6
4
2
Prison admissions per 100 serious crimes committed, 1960-85
0----------------------------1960 1965 1970 1975 1980 1985
Persons prosecuted for the white-collar crimes of forgery/counterfeiting, fraud, and embeZZlement in eight States and one territory in 1983 had a conviction rate-e slightly lower (74%) than Ihose arrested for property crimes (76%) • but higher than for violent crimes (66%) or public-order crimes (67%); public-order offenses include nonviolent sexual offenses, commercialized vice, drug offenses, disorderly conduct, and weapons offenses .
Persons convicted of white-collar crimes were-• much less likely to be sentenced to incarceration for more than a year (18%) than violent offenders (39%) and property offenders (26%) • sentenced to incarceration less often than violent offenders and property offenders (60%, 67%, and 65%, respectively) but more often than public-order offenders (55%).
Offenders against minors are more likely than other offenders to be prosecuted and convicted: • yet, fewer offenders against minors are incarcerated and, when they are, they receive shorter prison sentences than do others • a smaller percentage of persons arrested for crimes against children receive prison sentences of more than a year than do persons arrested for crimes against victims of all ages.
Sources: Felony sentencing in 18 local jurisdictions. Prisoners in 1985. Prison admissions and releases, 1983. Tracking offenders: Tile child vic 11m. Tracking offenders: White-collar crime.
1986 Annual Report 39
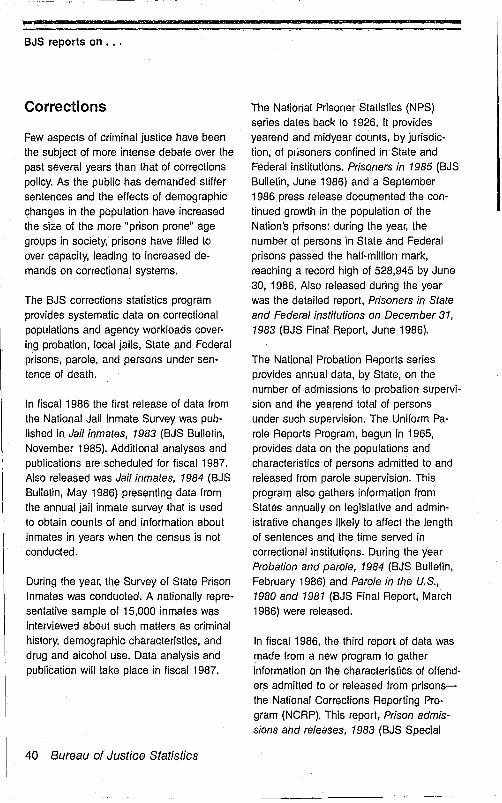
-BJS reports on •..
Corrections
Few aspects of criminal justice have been the subject of more intense debate over the past several years than that of corrections policy. As the public has demanded stiffer sentences and the effects of demographic changes in the population have increased the size of the more "prison prone" age groups in society, prisons have filled to over capacity, leading to increased demands on correctional systems.
The BJS corrections statistics program provides systematic data on correctional populations and agency workloads covering probation, local jails, State and Federal prisons, parole, and persons under sentence of death.
In fiscal 1986 the first release of data from the National Jail Inmate Survey was published in Jail inmates, 1983 (BJS Bulletin, November 1985). Additional analyses and publications are scheduled for fiscal 1987. Also released was Jail inmates, 1984 (BJS Bulletin, May 1986) presenting data from the annual jail inmate survey that is used to obtain counts of and information about inmates in years when the census is not conducted.
During the year, the Survey of State Prison Inmates was conducted. A nationally representative sample of 15,000 inmates was interviewe-:l about such matters as criminal history, demographic characteristics, and drug and alcohol use. Data analysis and publication will take place in fiscal 1987.
40 Bureau of Justice Statistics
The National Prisoner Statistics (NPS) series dates bacl< to 1926. It provides yearend and midyear counts, by jurisdiction, of prisoners confined in State and Federal institutions. Prisoners in 1985 (BJS Bulletin, June 1986) and a September 1986 press release documented the continued growth in the population of the Nation's prisons: during the year, the number of persons in State and Federal prisons passed the half-million mark, reaching a record high of 528,945 by June 30, 1986. Also released during the year was the detailed report, Prisoners in State and Federal institutions on December 31, 1983 (BJS Final Report, June 1986).
The National Probation Reports series provides annual data, by State, on the number of admissions to probation supervision and the yearend total of persons under such supervision. The Uniform Parole Reports Program, begun in 1965, provides data on the populations and characteristics of persons admitted to and released from parole supervision. This program also gathers information from States annually on legislative and administrative changes likely to affect the length of sentences and the time served in correctional institutions. During the year Probation and parole, 1984 (BJS Bulletin, February 1986) and Parole in the U. S.,
1980 and 1981 (BJS Final Report, March 1986) were released.
In fiscal 1986, the third report of data was made from a new program to gather information on the characteristics of offenders admitted to or released from prisonsthe National Corrections Reporting Program (NCRP). This report, Prison admis
sions and releases, 1983 (BJS Special
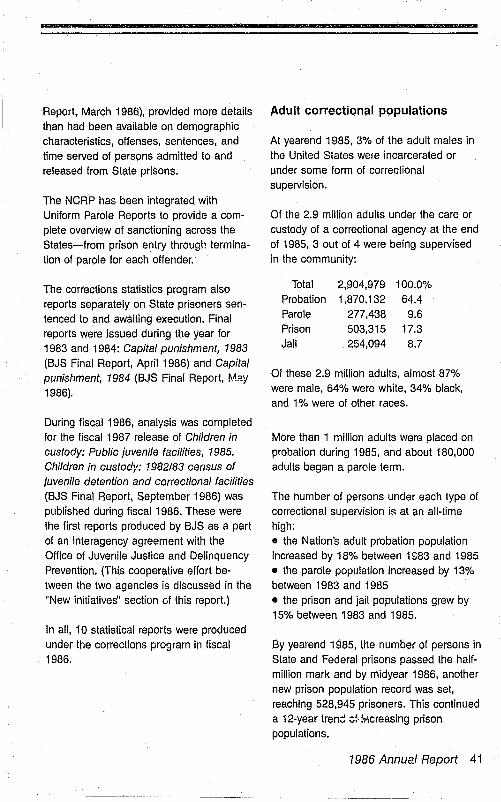
Report, March 1986), provided more details than had been available on demographic characteristics, offenses, sentences, and time served of persons admitted to and released from State prisons.
The NCRP has been integrated with Uniform Parole Reports to provide a complete overview of sanctioning across the States-from prison entry through termination of parole for each offender.
The corrections statistics program also reports separately on State prisoners sentenced to and awaiting execution. Final reports were issued during the year for 1983 and 1984: Capital punishment, 1983 (BJS Final Report, April 1986) and Capital punishment, 1984 (BJS Final Report, May 1986).
During fiscal 1986, analysis was completed for the fiscal 1987 release of Children in custody: Public juvenile facilities, 1985. Children in custody: 1982183 census of juvenile detention and correctional facilities (BJS Final Report, September 1986) was published during fiscal 1986. These were the first reports produced by BJS as a part of an interagency agreement with the Office of Juvenile Justice and Delinquency Prevention. (This cooperative effort between the two agencies is discussed in the "New initiatives" section Gf this report.)
In all, 10 statistical reports were produced under the corrections program in fiscal 1986.
Adult correctional populations
At yearend 1985, 3% of the adult males in the United States were incarcerated or under some form of correctional supervision.
Of the 2.9 million adults under the care or custody of a correctional agency at the end of 1985, 3 out of 4 were being supervised in the community:
Total 2,904,979 100.0% Probation 1,870,132 64.4 Parole 277,438 9.6 Prison 503,315 17.3 Jail 254,094 8.7
Of these 2.9 million adults, almost 87% were male, 64% were white, 34% black, and 1 % were of other races.
More than 1 million adults were placed on probation during 1985, and about 180,000 adults began a parole term.
The number of persons under each type of correctional supervision is at an all-time high: • the Nation's adult probation population Increased by 18% between 1983 and 1985 • the parole population increased by 13% between 1983 and 1985 • the prison and jail populations grew by 15% between 1983 and 1985.
By yearend 1985, the number of persons in State and Federal prisons passed the halfmillion mark and by midyear 1986, another new prison population record was set, reaching 528,945 prisoners. This continued a 12-year tren~ ~!. ~Acreasing prison populations.
1986 Annual Report 41

BJS reports on •.•
Number of sentenced State and Federal prisoners, yearend 1925-85
Number There were 554 deaths among jail inmates 481.616 during the year ending June 30, 1983,
compared to 611 such deaths in the year 400000 prior to the 1978 jail census; suicide was
the principal cause.
1930 1930 1970
Number of sentenced Stale and Federal prisoners, per 100,000 U.S. population, yearend 1925-85
300,000
200,000
100,000
o 1985
Numbe' 201
150
100
50
~1~9~30~----~19~5~0------1~9~7~0--~1~98~
Note', Prior to 1977. pnsoner reports were based on the custodypopulatlon Beginning 10 1977. focuS IS on the )uflsdlctlon populalion
Based on current incarceration rates, 3% to 5% of the males born in the United States today are likely to serve a sentence in an adult State prison during some time in their lives.
Because of their dual functions of detention and confinement, jails have a higher volume of admissions and releases than other correctional facilities. During the year ending June 3D, 1984, more than 8 miffion persons Were admitted to jails while slightly less than 8 million were released.
42 Bureau of Justice Statistics
About 55% of the adult male deaths, 79% of the adult female deaths, and all seven of the juvenile deaths in the 1982-83 period were suicides. All of the juvenile suicides were boys.
Sources: Prisoners in 1985. Probation and parole 1985. The 1983 jail census. The prevalence of imprisonment. Jail inmates, 1984. State and Federal prisoners, 1925-85. BJS press release. September 14, 1986.
-
Juveniles in custody
On February 1, 1985, 49,322 juveniles were being held in 1,040 public detention, correctional, and shelter facilities; this was a 1 % increase in the number held on the same date in 1983. Another 34,000 juveniles were housed in some 2,000 private facilities in 1985.
Of those in public facilities-• about 93% were accused of, or had been found to have committed, acts that would be criminal offenses if committed by adults • about 19% were being held for murder, rape, robbery, or aggravated assault • 5% of the juveniles in custody were status offenders, such as truants, runaways, or curfew violators.
About 18% of the public facilities (which held about 45% of the juveniles in public custody) held more residents than they were designed for.
At the time of the juvenile facility census, 86% of the juveniles were male, 61% were white, 37% black, and 2% other races. About 82% of the juveniles were between 14 and 17 years old.
Nationally, 185 juveniles per 100,000 juvenile population were in custody. This is 5% higher than in 1983. The West had the highest confinement rate, 327 juveniles per 100,000 juvenile population, followed by the Midwest with 166, the South with 162, and the Northeast with 99.
The average cost of housing a resident for 1 year in a public juvenile facility was-• $25,200 nationally • $39,900 in the Northeast • $26,100 in the Midwest • $22,900 in the West • $22,700 in the South.
In 1984, 521,607 juveniles were admitted to the public facilities and 515,301 were discharged.
Source: Children in custody: Public juvenile facilities, 1985.
1986 Annual Report 43

BJS reports on •.•
Prison and jail crowding
An estimated 165,000 new State prison beds were added between 1978 and 1985. Yet, crowding remains a serious problem: • despite use of a wide variety of crowding measures, it is estimated that the Nation's prisons are operating at between 6% and 21 % above capacity • most State prison systems, as well as the Federal system, are filled beyond capacity • 19 States reported 18,617 early releases In 1985 because of crowding • 19 States said that 10,143 prisoners were backed up in local jails because their prisons do not have room.
At yearend 1984, six States and the District of Columbia were operating their entire prison systems under a court order or consent decree concerning overcrowding and other conditions, as was Michigan's system for male offenders. In 25 other States, at least one major prison was under a court order or a consent decree.
During 1984, the prison population in States entirely under court order increased 2.9%, compared to an increase of 9.2% in States without court intervention.
Total inmate living space in State prisons throughout the country grew by 29% between 1979 and 1984. During the same period, the number of prisoners grew 45%, resulting in an 11 % decline in the average amount of living space per inmate.
44 Bureau of Justice Statistics
There is little evidence that prison population density levels were directly associated with elevated death rates, inmate-on-inmate assaults, or other disturbances. Such events occurred more frequently in maximum security facilities, irrespective of their population densities.
In 1984, about a quarter of all local jails in the Nation's largest systems, that is, those city and county jails that hold more than 100 people, held extra inmates due to crowding in other jails or in State or Federal prisons. These jails were operating at 102% of their rated capacities at midyear 1984; overall it is estimated that the Nat/on's jails were operating at 90% of rated capacity
Of the Nation's largest jailS, 22% were under court order to reduce their populations. In addition-• 13% were under orders to improve recreational facilities • 11 % have been ordered to improve their medical facilities or services.
Sources: Ptlsoners "I 1985. Population density In State pflsons, Jail Inmates, 1984.
Characteristics of prison and jail inmates
In 1985, the rate of incarceration for sentenced males was about 23 times higher than for sentenced females-394 per 100,000 males in the resident population vs. 17 per 100,000 females.
About 5% of the NaHon's Federal and State prisoners were women.
More than 40% of the women entering prison in 1983 had been convicted of larceny, forgery, or fraud, compared to 15% of the men. Violent crimes were much more common among male offenders than among women.
Prisoners entering 30 State prison systems in 1983 were convicted of the following offenses:
Burglary Robbery Larceny Drug crimes Publlo'order crimas Assault Forgery or Iraud Murder Sexual assault olher
than rape Rape Motor vehicle theft Manslaughter Stolen property Other crimes Olher violent Crimes Kidnaping Other property crimes Arson
26,3°0 14,3 11.3
8,3 7.6 7.0 5,7 3,8
2,6 2.4 2.2 1.9 1.4 1,3 1,2 1.0 1.0 0.7
Of persons entering prison in 1983-• just over a third had been convicted of a violent crime (with robbery the most common violent offense) • almost half did so for a property offense • about a sixth had committed drug offenses or public-order offenses (such as weapons violations, drunk driving, commercialized vice, or morals offenses).
Drug offenses were more common among women (11.6%) than men (8.1 %) and among whites (9.5%) than blacks (6.7%). Among Hispanic prisoners, both white and black, 14% were admitted for drug offenses.
About 18% of the new prisoners had been returned to prison for Violating parole conditions from a previous offense.
Ot persons admitted to State prison in 1983-• approximately 54% were white • 45% were black • less than 1 % were of other races, primarily native Amflricans and Asian Americans.
Of State prison inmates in 1979-• 67% were convicted violent offenders (either the current offense or a previous conviction) • 95% were convicted violent offenders or ~llaviously had been convicted of a crime.
Among local jail Inmates in 1984-• about half were awaiting or on trial • the other half were convicted offenders who will either SiYVe their sentence in jail (usua!ly for les$ t'l'\an.J y~a~ o.r '11111 be transferred to a State prison.
1986 Annual Report 45

-BJS reports on ...
The median age of jail inmates in 1983 was 27 years. Other demographic characteristics of jail inmates! • 79% were unmarried • 59% had not completed high school • 93% were male, 7% female o 58% were white, 39°/ .. black, 3% othflr races.
The median income among the inmates who had been free for the year before their arrest was $5,486. Of 1hose in jail-
• 41% had a full-time job al the time they were arrested • 12% had been working part time • 47%· were not employed,
Unconvicted offenders held in local jails were charged with these offenses:
Burglary 16% Robbery 14 Public-order ollenses 13 Murdijr1attempted murder 10 Assaull 9 Larceny 9 Drug 6f1end \!s a Fmudilorgery'embezzlemenl 6 Rape,sexual assault 4 Other properl y 5 Other VIolent
Of all inmates under sentence in a local jail, 10% were confined for drunk driving.
The most common offense of jail inlT'fites age 45 or older was driving lmder the Influence (20% of the inmates In thut age group).
l46 liurea" of Justice Statistics
Almost 9 out of 10 unconvictE:d jail inmatss had had bail set for them. Those who had not had bail set were mainly probationers or parolees whose release had been revoked or person::; charged with offenses (such as first-degree murder) for which bail may not be set in certain jurisdictions.
The number of juveniles held in jails on June 30. 1984, was 15% less than in the previous year.
Sources'. Prisoners m 1985. Pnson admlSUrI',5 and releases. HlB3. JaIl mmMes. 1983. Jail inmates. Hl84

Corrections funding
In 1983, less than one penny of every dollar spent by Federal, State, and local governments went into the operation of the Nation's correctional system (including jails, prisons, probation, and parole).
State and local governments bear the greatest burden of correctional expenses. They devoted an average of 1.7% of their spending to corrections in 1983.
In 1983, State governments spent about $5.1 billion for the operation, maintenance, and construction of State correctional Institutions. This was more than 80% of the States' total corrections expenditure of $6.3 billion In that year.
Sources: Justice expenditure and employ· ment. 1983. Justice expenditure and employment extracts: 1982 and 1983.
Time served in prison
Actual time served (including jail and prison time) is generally much less than the maximum sentence length:
1983 admissions 1983 releases
Percenl Median Percent Median 01 sentence 01 time admis- length releases served SIOIiS (months) (months)
All offenses 100% 36 100% 19
Murder 3.7 Lile 2.3 79 Manslaughter 2.6 72 2.8 32 Rape 2.6 84 1.9 47 Robbery 16.4 60 14.3 30 Assault 6.8 48 8.2 24 Burglary 25.B 36 24.1 17 Larceny 10.4 24 11.7 12 Auto thelt 1.8 24 1.9 15 Forgery/fraud! embezzlement 5.2 36 5.8 15 Drugs 8.2 36 8.6 15 Other 16.5 18,4
More than half the convicted murderers who left State prisons during 1983 served less than 7 years, including jail time, for their crimes. Half the-• rapists served less than 4 years • robbers served 2.5 years or less • arsonists served less than 2 years • burglars served less than 1.5 years.
A life sentence rarely means that an offender will spend the rest of his or her life In prison. Of those released from a life sentence in 1983-" the median time served was 8 years and 7 months, including credited jail time • about 20% served 3 years or less.
Nearly 25% of those released with life sentences had previously served time in prison for a felony conviction.
~ , Source: Prison admissions and releases, 1983.
1986 Annual Report 47

BJS reports on ...
Capital punishment
At yearend 1985. 1,591 persons were under a sentence of death in State prisons. Of these-e all had been convicted of murder • 99% were males • 57% were white • the medlan age was nearly 32. • two-thirds had prior felony convictions • 1 in 10 had a prior homicide conviction " a fifth were on parole at the time of their capital offense • nearly another fifth had pending charges, were on probation. or were prison inmates or escapees when they committed their capital offense • excluding those with pending charges. almost a third of those awaiting execution were under sentence for another crime when the capital offense was committed.
At yearend 1985', laws in 37 States authorized the death penalty, but only-• 32 States held prisoners under sentence of death • 8 States had conducted executions durIng that year.
Lethal injection (16 States) and electrocution (15 States) Were the most common methods of execution permitted by State law. Lethal gas was permitted in 8 States, hanging in 4 States, and a firing squad in 2 States.
The 18 persons executed in 1985 brought the totat to 50 persons executed in 12 States since 1976 when the Supreme Court affirmed the death penalty.
48 Bureau of Justice Statistics
Criminal history profile of prisoners under sentence of death, yearend 1985
Number Percent
Number under sentence of death 1.591 100.0%
Prior felony conviction With 970 66.2 Without 496 33.8 Nol reported 125
Prior homicide conviction With 116 9.0 Without 1.170 91.0 Not reported 305
Legat status at time of capital offense Charges pending 85 6.6 Probation 70 5.4 Parole 260 20.1 Prison escapee 36 2.8 Prison inmate 44 3.4 Other status 21 1.6 None 776 60.1 Not reported 299
From the beginning of 1977 to the end of 1985, a total of 2,110 persons were admitted to prisons under sentence of death and 889 persons were removed from the condemned poputation as a result of dispOSitions other than execution (I.e., resentencing, retrial, commutation, or death occurring while awaiting execution).
The oldest person on death row was 74 years old, the youngest was 16. There were 14 States that do not specify in their laws the minimum age at which a capital sentence may be imposed, The age most frequently set by statute is 18 years old (nine States).
Source: Capital punishment, 1985.

Recidivism and career criminals
Few issues in criminal justice have drawn as much attention as the impact of recidivism on public safety and the implicalions of this'issue for sentencing policy. Career criminal programs and mandatory or enhancer! sentences for repeat offenders are examples of policies that aim to reduce the threat recidivists pose to society.
In fiscal 1986, two BJS reports presented important new findings relevant to the contemporary debate on recidivism: • Jail inmates, 1983 (BJS Bulletin, November 1985), was based on a sample survey of jail inmates that collected detailed data on their demographic characteristics, current offense, and prior crimil"al records. • Prison admissions and releases, 1983 (BJS Special Report, March 1986), contains data for 30 States participating in the National Corrections Reporting Program for that year. These States reported on 144,804 persons entering prison in 1983 and 135,179 released from prison in that year. These prisoners represented more than three-fifths of the Nation's total State prison admissions and releases in 1983. TopiCS covered include previous criminal history.
Also during the year; significant progress was made in developing a national recidivism statistical series using FBI criminal-history information to determine criminal activity of persons released from State prisons. The first report from this effort will be released in fiscal 1987.
At least 80% of the men and women held in local jails in 1983 had a prior criminal conviction. About two-thirds had served time before in a jail or prison, and about a third had servad a prior sentence at least twice.
More than 40% of the 1983 jail population were people who at the time of their arrest had been on probation, parole, bailor other pretrial release, or had been fugitives from justice.
Almost a fifth of those admitted to State prison in 1983 were parole violators. About a third of those leaving prison in 1983 had previously served time in prison for a felony. Males were more likely than females to have a prior incarceration history for a felony. There was little difference between whites and blacks.
Prisoners released in 1983 who had served time for a past felony had received sentences on average 7 months longer (or 12% more) than those with no prison history. This varied by offense type: • 17 months longer for current violent offenses • 6 months longer for current property offenses • 11 months longer for current drug offenses.
1986 Annual Report 49
BJS reports on ...
Of persons entering a State prison in 1979-• almost 84% had a record of prior convictions, including 61 % who had prevIously been incarcerated as an adult, a juvenile, or both • about 28% had five or more prior convictions for criminal offenses " at the time of their admission, 40% were on parole or probation for prior offenses • about 28% would still have been Incarcerated for earlier crimes if they had served the maximum term imposed by the court on their prior sentence to confinement.
About half of those released from State prisons will return within 20 years, and 60% of these repeaters will be back by the end of the third year.
Recidivists entering prison for robbery, burglary, or auto theft return to prison more rapidly than those who entered for other crimes.
With some exceptions, the highest risk of returning to prison occurs during the second half of the first release year.
The greater the amount of time a former prisoner remains in the community without reincarceration beyond the first year, the less is the likelihood that he or she will relurn to prison.
Sources: Jail inmates. 1983. Prison admis· sions and releases, 1983. Examining reo cidivism. Returning to pnson. Career patterns in crime.
50 Bureau of Justice Statistics
Privacy, security, and confidentiality of criminal justice data
The increased reliance on criminal justice data for public and private sector uses has highlighted the need for accurate, complete, and timely criminal justice records. Policies that govern the collection and maintenance of such data and legislation that regulates the release of such data for different purposes are also of prime concern to the criminal justice community. In response to these concerns, a major part of BJS activity during the year in the area of privacy, security, and confidentiality focused on the issue of data quality.
A major national conference on the quality of criminal justice records was convened during fiscal 1986. The meeling, which included presentations by then Deputy Attorney General D. lowell Jensen, then Assistant Attorney General lois H. Herrington, BJS Director Steven R. Schlesinger, and several members of Congress, explored many aspects of data quality policy, legislation, and implementation techniques. Proceedings of the conference were prepared for issuance in fiscal 1987 as part of the BJS Information Policy document series.
A major report in the Criminal Justice Information Policy series, Data quality of criminal justice records, was issued in fiscal 19B6. The report describes statutory and common law reqUirements for data accuracy and discusses sanctions for failure to maintain data standards. Key issues relating to Federal and State data quality policies are also highlighted.

In recognition of the key role that courts play in the development of complete criminal-history records, a special effort was made to ensure higher levels of court disposition reporting. Specifically, during fiscal 1986, a report describing the legal, technical, and policy issues relating to disposition reporting was prepared.
Operational plans were also developed for a meeting between the court administrators and Federal and State personnel to discuss this issue. It is anticipated that the meeling, the first of its kind at the Federal level, will be convened in fiscal 1987.
In addition, BJS funded efforts to review the basic policies and assumptions underlying DOJ Regulations (28 CFR Part 20) which implement the "privacy and security requirements" as set out In Section 812 of the Omnibus Crime Control Act, as amended. This activity will continue through fiscal 1987 and may result in revision of the regulations.
Another document in the Information Policy series, Criminal justice "hot" files, was prepared. It is an extensive review of the policies and procedures affecting maintenance and dissemination of files on wanted persons and stolen property. The report also contains specific descriptions of Federal procedures lor accessing FBI "hot" files.
-
In recognition of the impact thai automated fingerprint identification systems will have on the accuracy of record checks, a study was conducted to determine the current status of such systems and to analyze the policy implications associated with increased use of automated fingerprint Checks. A report on the topic was prepared for release in fiscal 1987.
The results of a 1984 survey of State criminal justice record repositories were presented in State criminal records repositories (BJS Technical Report, October 1985). This survey provided the first composite picture of the number of subject records in State repositories, the number of arrests and final dispositions reported each year, the extent of automation of repository data, the legal requirements imposed on law enforcement agencies for disposition reporting. and the production of statistical reports by the repositories.
Also published dUring the year was Crime control and criminal records (BJS Special Report, October 1985). This report addressed the relationship between crime control policies, such as pretrial release and selective incapacitation, and the nature and amount of criminal-history record information that is collected, retained, and disseminated.
BJS continued to oversee activities to ensure the confidentiality of statistical and research data. These activities included Ihe development and review of appropriate data maintenance and transfer procedures in support of the BJS Federal, Stale, and national programs.
1986 Annual Report 51

BJS reports on ...
By 1984, all 50 States had enacted laws to ensure some i1spect of data quality.
Most State legislation (36 States) was enacted after promulgation of DOJ Privacy and Security Regulations (28 CFR Part 20) in 1975.
The statutes of almost all States (44) require that State and local law enforcement agencies report arrests for serious crimes to the central repository.
A lesser number of States require that case disposition data be reported to the central repository.
Disposition data are required to be reported-• by courts (24 States) • correctional agencies (31 States) • prosecutors (23 States).
Many disposition reporting requirements are generally worded, and, therefore, are difficult to enforce.
Criminal-history records are the most frequently used records in criminal justice.
Despite increasing awareness of data quality, States vary substantially in the quality of data. All States have some legislative requirements regarding data, but standards and sanctions are frequently unrealistic and, therefore, unworkable.
In 1984, 44 responding States reported having about 35 million subject records. (A subject record is a record pertaining 10 a specific person who has entered thl:! criminal justice system. An individual can have more than one subject record.)
52 Bureau of Justice Statistics
Close to 4 million arrests were reported to 39 State repositories in 1983. Almost 2 million final dispositions were reported to the 30 States reporting such data.
Thirty-five States had at least some automated criminal-history information and steady gains are being made in increased automation of criminal records.
...
Souraes: Compendium of State privacy and security legislation. 1984 edition: Overview. Crime control and criminal records. State criminal records repositories.

-New initiatives
BJS strives to monitor and take advantage of new technologies to collect and process data with increased efficiency and cost effectiveness, For example, during the year, BJS began to carry out the recommenda. tions of major projects that assessed and evaluated the methodology used in the Nation's two most important statistical series on crime: the National Crime SUNey (NCS) and the Uniform Crime Reporting (UCR) program.
BJS also continues to develop new data collection programs to inform policy makers and the public in areas where no or only limited data have been available in the past.
Projects during fiscal 1986 that show promise for the future include-
National Crime Survey Redesign ImplementatiQn
Uniform Crime Reporllng assessment Implemenlatlon
National Crime Survey supplements
National survey 01 serious vlctimilation Inlury and drug,elated In/ury
Data on drugs and crime
Law enforcement management and admlOlst'qtIVB statistics
Pretrial statistics
A nation at court statistics program
Juvenile Justice statistics
Federal civil jUstice data
White-collar crime
Comparative inlernational slatislics on incarceralion
National recidiYlsm slatistics series
Each of these projects is described in this section.
1986 Annual Report 53
New initiatives
National Crime Survey Redesign implementation
Implementation of the redesign of the National Crime Survey (NCS) began during fiscal 1986. Modifications judged to be non-rate-affecting were made in fiscal 1986 to provide some needed improvements quickly, while still maintaining comparability with data from previous years. These changes included-• expansion of questions on the victim's use of self-protective measures • the addition of a question about drug use by the offenders • the addition of questions about the victim's contacts and experiences with the criminal justice system.
In addition to questionnaire revisions, BJS also has been investigating the use of Computer-Assisted Telephone Interviewing (CATI) technology for NCS data collection; this technology will facilitate data processing and reduce errors in questionnaire administration and coding. Rigorous te:.ting of a CAT I capability is scheduled to begin in January 1987, Also during the year, work continued on developing a data file con· taining victimization data for large counties.
Major modifications will be made simUltaneously during fiscal 1989. Planning for this set of revisions continued throughout fiscal 1986 and resulted in the selection of a redesign package. Negotiations with the Census Bureau on lesting and implementation scheduling have begun.
54 Bureau of Justice Statistics
This second phase of the redesign recommendations will result in a "break" in the series. BJS is exploring methods to describe the magnitude of the break. However, in many cases comparisons of data collected before and after the phasein will remain difficult. These changes. nonetheless, will result in more efficient collection of NCS data, greater accuracy of victimization estimates, and improved opportunities for analYSis of victimizationrelated issues.
The NCS Redesign project, begun in 1979, was a total reassessment of the design, administration, and potential uses of the survey. It was undertaken by a consortium of experts in criminology, survey design, and statistics, with the active participation of BJS and the Census Bureau, which serves as the collection agent for the NCS.
The project was charged with investigating a wide range of issues which included-• improving the accuracy of recall for victimization incidents • expanding the scope of crimes covered • increasing cost effectiveness • enhancing the analytic potential of NCS data • improving the overall utility of NCS data.
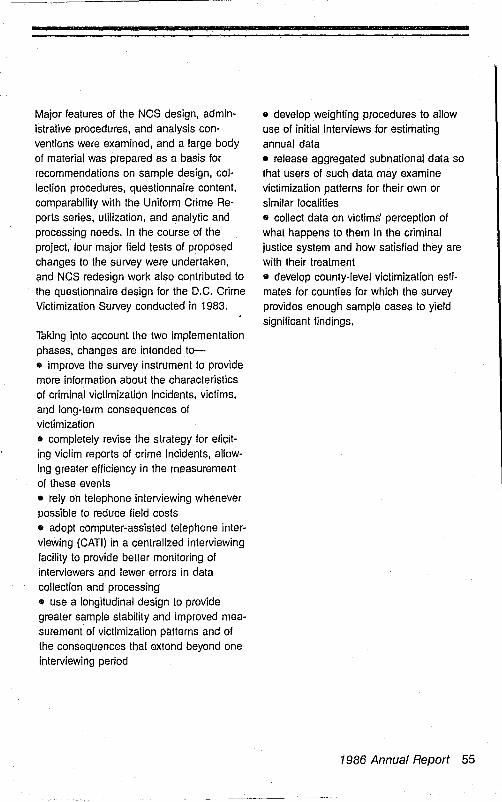
Major features of the NCS design, administrative procedures, and analysis conventions were examined, and a large body of material was prepared as a basis for recommendations on sample design, collection procedures, questionnaire content, comparability with the Uniform Crime Reports series, utilization, and analytic and processing needs. In the course of the project, four major field tests of proposed changes to the survey were undertaken, and NCS redesign work also contributed to the questionnaire design for the D.C. Crime Victimization Survey conducted in 1983.
Taking into account the two implementation phases, changes are intended to-• improve the survey instrument to provide more information about the characteristics of criminal victimization incidents, victims, and long-term consequences of victimization • completely revise the strategy for eliciting victim reports of crime incidents, allowing greater effiCiency in the measurement of tht::se events • rely on telephone interviewing whenever possible to reduce field costs • adopt computer-assisted telephone interviewing (CATI) in a centralized interviewing facility to provide better monitoring of interviewers and tewer errors in data collection and processing • use a longitudinal design to provide greater sample stability and improved measurement of victimization patterns and of the consequences that extend beyond one interviewing period
• develop weighting procedures to allow use of initial interviews for estimating annual data • release aggregated subnational data so that users of such data may examine victimization patterns for their own or similar localities • collee! data on victims' perception of what happens to them in the criminal justice system and how satisfied they are with their treatment • develop county-level victimization es\imates for counties for which the survey provides enough sample cases to yield significant findings.
1986 Annual Report 55
New initiatives
Uniform Crime Reporting assessment implementation
BJS took several steps to launch a new national crime reporting system by beginning implementation of the Uniform Crime Reporting (UCR) Redesign, undertaken in coopsiation with the FBI. BJS received $3 million for this purpose in fiscal 1987. In anticipation of the receipt of these funds, these actions were undertaken during fiscal 1986: • specific data element definitions, coding instructions, and incident reporting form revisions were developed • an award was made to the State of South Carolina to test the revised definitions, instructions, and form revisions and their utility for capturing the expanded data elements o the BJS Director wrote a letter to each Governor, describing the effort to make the first major change in UCR in more than 50 years and indicating the availability of Federal support o a full program announcement describing the availability of fiscal 1987 grant funds was sent to each State UCR program in August with a deadline for applications in October 1986 o awards were made to establish a computer laboratory to assist local police departments in acquiring new management information systems, including a UCR component, as well as to detail specific analytic benefits of the new UCR data elements in the experience of 25-30 identified police agencies.
56 Bureau of Justice Statistics
The study of the UCR Program was completed in fiscal 1985. This effort, conducted by a private contractor, was overseen by a joint BJS/FBI Task Force. The contractor was guided by a steering committee made up of police practitioners, researchers, academicians, the media, and representatives of the leading law enforcement professional organizations.
The study examined-• the original program as begun in 1930 based on the plan of the Committee on Uniform Crime Records of the International Association of Chiefs of Police • the current program as operated by the FBI o alternative potential enhancements to the current UCR system.
A set of recommendations was developed and published in Blueprint for the future of the Uniform Crime Reporting Program. This report was released in June 1985 with an invitation for public comment. More than 100 letters were received and the overwhelming majority of them endorsed the study's findings.
Major recommendations in the report are ta-o convert the UCR system to a two-level reporting system under which most agencies report basic offense and arrest information similar to that currently reported (Level I), while a comparatively small sample of agencies report much more extensive information (Level II)
o convert the emil" UCR offense reporting system to unit-record reporting in which local law enforcement agencies submit reports on the characteristics of each individual criminal incident (e.g., location, time, presence of weapon) • convert the entire UCR arrest reporting system to unit-record reporting in which local law enforcement agencies submit reports on the characteristics of each individual arrest • distinguish attempted from completed offenses o distinguish among crimes against businesses, crimes against individuals or households, and crimes against other entities • institute routine, ongoing audits of samples of participating UCR agencies in order to establish the extent of error in the system on a continuing basis for both Level I and Level II II develop the UCR, National Crime Survey (NCS), and Offender-Based Transaction Statistics systems as independent programs providing complementary criminal justice statistics for multiple purposes; the strengths of each of these data systems should be continued and enhanced, rather than compromised to achieve superficial comparability • continue efforts to provide the means for reconciling UCR and NCS data, evaluating seriousness scoring, and preparing periodic publications, special studies, and technical documentation • support continued and improved user services, including a User data base with files linked over time, the ability to draw samples of offenses for analysis either by the Ucl1 staff or by outside researchers, and response to public queries.
National Crime Survey supplements
The National Crime Survey has provided annual estimates of the extent and characterisllcs of crimes against individuals and households since 1972. It has been a stable and consistent measure of crime and various aspects of crime. However, some researchers maintain that it is being underutilized as a data collection vehicle because it has not been used to collect supplemental periodic information of great value in current policy making but which need not be collected annually as a part of the ongoing NCS.
During the year, work continued on the National Institute of Justice/Bureau of Justice Statistics jointiy sponsored research program to encourage researchers to consider the widest possible range of research and analytic interests that can be addressed by adding supplemental questions to the NCS. In offering this program, BJS and NIJ affirmed their support for enhancement of the NCS through open solicitation of ideas from the criminal justice community.
The solicitation is open-ended in that applicants are free to suggest topics of interest that can be addressed by supplemental questions to the NCS. However, several topics were offered as illustrative of the themes that could be addressed. These included-o victimization dynamics (why certain crimes occur, why they result In lesser or greater injury, and why they often go unreported to the police)
1986 Annual Report 57
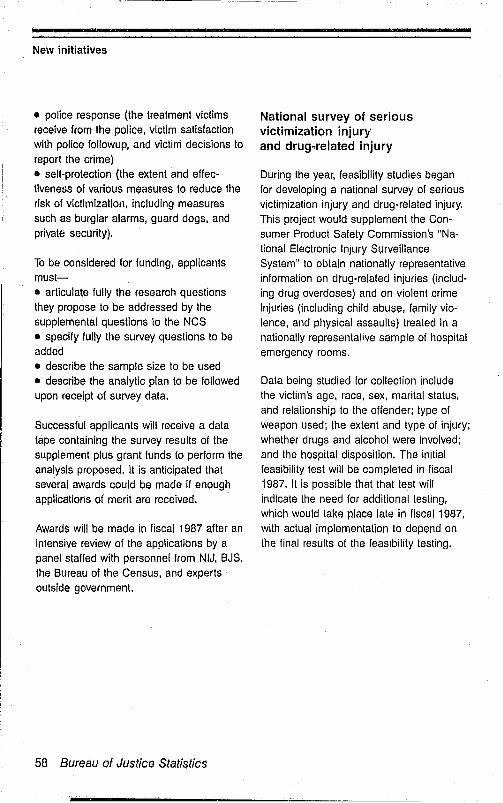
New initiatives
• police response (the treatment victims receive from the police, victim satisfaction with police followup, and victim decisions to report the crime) • self-protection (the extent and effectiveness of various measures to reduce the risk of victimization, including measures such as burglar alarms, guard dogs, and private security).
To be considered for funding, applicants must-s articulate fully the research questions they propose to be addressed by the supplemental questions (0 the NCS • specify fully the survey questions to be added • describe the sample size to be used 8 describe the analytic plan to be followed upon receipt of survey data.
Successful applicants will receive a data tape containing the survey results of the supplement plus grant funds to perform the analysis proposed. It is anticipated that several awards could be made if enough applications of merit are received.
Awards will be made in fiscal 1987 after an infensive review of the applications by a panel staffed with personnel from NIJ, BJS, the Bureau of the Census. and experts outside government.
58 Bureau of Justice Statistics
National survey of serious victimization injury and drug-related injury
During the year. feasibility studies began for developing a national survey of serious victimization injury and drug-related injury. This project would supplement the Consumer Product Safety Commission's "National Electronic Injury Surveillance System" to obtain nationally representative information on drug-related injuries (including drug overdoses) and on violent crime injuries (ineiuding child abuse. family violence, and physical assaults) treated in a nationally representafive sample of hospital emergency rooms.
Data being studied for collection include the victim's age. race, sex. marital status. and relationship to the offender; type of weapon used; the extent and type of injury; whether drugs and alcohol were involved: and the hospital disposition, The initial feasibility test will be o;)mpleted in fiscal 1987. It is possible that that test will indicate the need for additional testing. which would take place late in fiscal 1987. with actual implementation to depend on the final results of the feasibility testing.

-New initiatives
The redesigned UCR program will provide a vast increase in information concerning drugs Qnd drug-related crime. Under the enhanced UCR system-• druginatcotic offenses will be broken down by type of activity (cultivating. manufacturing, distributing, selling, buying, or tr1imsporting) and by type of drug (cc(;aine, marijuana or hashish, nonnarcotic drugs, opium and its derivatives, and synthetio narcotics) • drug paraphernalia crimes (broken down by the activities lisled aoove) will be separately recorded • information will be available about the general circumstances of the crime (the victim, offender. time of day. place of occurrence. and presence of a weapon) • reporting the crime of driving under the influence will require a specification of drug or narcotic use • information will be available-for all crimeS-Whether or not the crime was drug related • an indication will be provided of the magnitude of drug seizures (either value or weight or some combh1ation of those would be reported).
Also during the fiscal year. BJS began exploring the possibility of securing funding to establish a National Drug Oata Clearinghouse to serve policy makers. the media, and others who now must contact numerous agencies and private organizations to obtain needed statistics.
60 Bureau of Justice Statistics
4=_& II..-ztiMa
Law enforcement management and administrative statlstlcs
Recognizing thai very little national·level police administrative and management data exist, BJS commissioned a study of the need for such data along with recommendations as to what types of data should be collected.
The study focused on input data (calls for service and crimes reported), process data (number d agencies, functions, personnel, p,xpenditures), and output data (arrests. clearances, convicllons, citizen altitudes, and use of deadly force).
An extensive literature review was conducted. as were two separate surveys of police agencies to r)etormine the perceived utility of such data, the relative importance of various data ilems, and the ability of police departments to provide such data.
This first phase culminated In a "state of the art" report that addressed Ihese basic questions: • what data have been collected in the past? • what statistics are available now? , how useful are these data to the pOlice, researchers, and policymakers? • what is the quality. reliability, and comparability of these statistics?
~I

The report concluded with specific recommendations for continued planning for a national series of law enforcement management and administrative statistics. These recommendations formed the basis for a second phase of this effort: • an analysis of eXisting data sets of police statistics • a survey of small police agencies about their data needs • the development of a surveI' questionnaire and handbook tor a national collection effort Ii a discussion of various sampling designs e a pretest of the proposed survey.
This second phase wa~ completed in fiscal 1986. Also during the fiscal year, a report was published under this project that examined police expenditures over the past four decades, Police employment and expenditure (BJS Special Report, February 1986).
Durinf, fiscal 1986, data col/ection was completed to update the mailing list that will be needed for drawing a nationally representative sample of agencies. Besides obtaining current mailing address information, agency characteristics data were collected for purposes of drawing a more efficient, less costly, stratified sample. This survey to update the mailing list and sampling frame obtained a 100% response rate from the nearly 17,000 State and local law enforcement agencies in the country.
The first LEMAS survey will be conducted in fiscal 1987.
Pretrial statistics
Little information is available about the pretrial phase of the judicial process. To fill this void, BJS is sponsoring a study of the feasibility of developing a national data base covering persons who have been released pending trial. Initial work, completed in June 1986, covered the development of methodology, including the design of data collection forms. training of personnel in participating jurisdictions, and the collection of data pertaining to some 3.600 defendants in 17 jurisdictions. A report on this initial effort is now being completed and will be available for publication in fiscal 1987.
In each jurisdiction, data were being collected for a sample of between 100 and 500 defendants Who have been released pending trial. Sixty percent have been charged with felonies and the others with misdemeanors. The data include information on-• the offense • the person's prior criminal record ~ the type of pretrial release including financial and nonfinancial conditions • failure to appear In court • rearrests while on pretrial release • disposition and sentencing (for the original charge and for any charges resulting from rearrests).
Each defendant was tracked for 9 months after pretrial release or until disposition.
Further work will involve collecting data from enough sites to provide a statistically representative sample of the Nation and detailed analysis of the data. The study will be completed at the end of 1988.
1986 Annual Report 61
. New initiatives
A national court statistics program
The Adjudication Statistics Program is undergoing a major expansion to increase its statistical quality and its utility for policy makers by developing a national court statistics program. During the year. feasibility studies were conlinued to develop methods that can produce annual national felony conviction counts and nationally representative data on sentence lengths. The fti'asibility of supplementing this nalional survey with a defendant-based reporting system is also being explored. Information that is being examined for collection on defendants include demographic characteristics, criminal history, offense information, drug use history. and dates and outcomes of key actions such as arraignmer~t. disposition, and seniencing. These feasibility studies will continue in fiscal 1Q 87. with data collection to begin in that year.
During fiscal 1986, data collection was completed to update the mailing list that will be needed for drawing a nationally representative sample of courts. Besides obtaining current mailing address information, court characteristics and workload data were collected for purposes of drawing a more efficient. less costly. stratified sampl~. This survey to update the mailing list and sampling frame obtained data for 93% of the approximately 3,500 State courts of general jurisdiction in the country.
Data collection also began for a major expansion of the number of Jurisdictions included in the project thaI produced Felony sentencing in 18 local Jur'sdictions (BJS Special Report, June 1985). That project used court and prosecutor records
62 Bureau of Justice Statistics
---------1
to coliect data on the type anG length of sentence received by f.::!o:,y def97faanls for seven offenses. The expansion is expected to provide data for as many as 35 jurisdictions, with publication of the data in fiscal 1987.
An additional project is collecting data for BJS on case processing characteristlcs and other relevant variables from a sample of 10,000 defendants charged with robbery or burglary. During fiscal 1986 data collection was completed in three sites. Data collection in seven others is planned for fiscal 1987.
The study will examine the impact different policies and practices have on the disposition and correctional outcomes of robbery and burglary cases. Using a survey instrument supplemented by field data collection activities, court and prosecution records will be used to acquire background information on local criminal justice policies and system operations that will provide the backdrop for identifying the determinants of the outcomes of robbery and burglary cases prQcessed in the jurisdictions.
This study will collect information that will form the ba~is of an adjudication data series designed to answer such policyrelevant questions as-• what is the effect of determinate sentencing on sentence differentials? • what are the major factors that lead to case filings? • how does jail and prison overcrowding affect sentencing decisions? • what impact do organizational and structural differences have on case outcome?
I
Juvenile justice statistics
From the efforts of BJS and its predecessor agency over the past 15 years, the Nation is now close to having a comprehensive program describing crime and the adult criminal justice system. However, comparable data are less developed on juvenile crime, juvenile victims, and the juvenile justice system.
In fiscal 1986, BJS and the Office of Juvenile Justice and Delinquency Prevention (OJJDP) continued an interagency agreement leading to improved statistics on juvenile victims, juvenile offenders, and the juvenile justice system. A first effort was for BJS to assume responsibility for the analysis, publication, and dissemination of data from the Children in Custody series (the periodic surveys of juvenile detention and correctional facilities). During the year, two reports from that series were preparedChildren in custody: 1982183 census of juvenile detention and correctional facilities (BJS Final Report, September 1986) and Children in custody: Public juvenile facilities, 1985 (BJS Bulletin, October 1986).
A second component of this cooperative effort is a comprehensive evaluation of existing data sources on juvenile justice and an assessment of the need for new data sources. The assessment was conducted during fiscal 1986; the result of this evaluation will be a program plan to guide the development of juvenile justice statistics for years to come.
A third component of this cooperative effort during fiscal 1986 was a study of the feasibility of developing sample surveys of incarcerated juveniles (similar to the sam-
pie surveys BJS conducts of adults in jails and State prisons) to provide data on characteristics of those in custody, offenses for which they are incarcerated, their delinquent and status offense histories, and drug use histories.
1986 Annual Report 63
New initiatives
Federal civil justice data
In recognition of the importance of the civil component of American law and the impact of civil case bacf;log on overall criminal justice processing, BJS recently launched a project in the area of Federal civil justice statistics. The aim of the program is to develop a data base that traces the flow of Federal civil cases and describes the interface between agencies and organizational components involved in civil case processing. Special attention will be directed toward the volume of case flow and identification of issues that affect successful case processing.
In fiscal 1986 a complete and detailed schematic flow chart describing Federal civil case processing was developed and InclUded in a BJS Special Report on Federal civil justice that will be issued in fiscal 1987. Data also were collected describing civil case filings and processing and will be presented in a Federal justice statistics compendium to be issued annually, beginning in fiscal 1987. Analytic reports on relevant topics will be prepared in fiscal 1987 using statistics from the civil data base.
64 Bureau of Justice Statistics
White-collar crime
BJS is initiating a program to identify and measure white-collar crimes processed at the Federal and State levels. A blue ribbon panel will be convened to establish working definitions for white-collar crimes and to identify sources of data in enforcement and regulatory agencies. Data will be gathered from State and Federal agencies {including inspectors general, regulatory agencies, and State attorneys general) and will be analyzed to determine long-term trends.
The data will, for the first time, describe the overall governmental response to whitecollar crime incidents (including criminal, civil, and administrative actions) and will permit the evaluation of alternative enforcement strategies. White-collar crime data will also allow more effective targeting of enforcement resources at the Federal and State levels.
An initial effort in this area is a report to be issued in fiscal 1987 that will describe the processing of white-collar offenders by the Department of Justice, tracing such cases through adjudication and sentencing. The report is to be prepared as a part of the BJS Federal Statistics Program.
Comparative international statistics on incarceration
Studies suggesting that the United States is among the most punitive of industrialized nations have been criticized because of methodological problems and the failure to test alternative explanations for observed differences in prison use, such as differential crime rates.
BJS has initiated work that will provide more definitive information on this topic. Comparisons will be made among the United States, Great Britain, West Germany, and Canada, taking into account the amount of crime in these countries as well as incarceration rates. The results will be presented in a BJS Special Report during fiscal 1987.
National recidivism statistics series
Recidivism has been of particular concern to BJS, the Department of Justice, Congress, and the criminal justice community for the past several years. In fiscal 1986, BJS continued to develop a national statistical series to measure recidivism systematically.
During the year, collection of data under the recently developed National Corrections Reporting Program (NCRP) continued. This program combines the former Prisoner Admissions Report, Prisoner Release Report, Parole Admission Report, and Parole Release Report into a Single, integrated reporting system. The NCRP covers adult offenders under the authority of State correctfons agencies and tracks offenders up to a point of unconditional release (through discharge or successful completion of conditional release or parole).
Not adequately tracked, however, is further criminal justice activity by those who exit from the system. With the help and encouragement of State departments of correction and law enforcement and of the FBI Identification Division, a program has been designed to link BJS correctional data with State and FBI criminal-history information. This will, for the first time, enable BJS to derive a representative sample of persons released from State prisons, follow this group for several years, and ultimately produce estimates on the incidence, prevalence, and seriousness of later arrests and dispositions.
1986 Annual Report 65

New initiatives
The prison-release and criminal-history data will provide an opportunity to examine the relationship between such factors as age, sentence length, time served, and priqr fetony incarceration history with postrelease performance.
In fiscal 1986, work continued on matching records and analysis of the data began. The first release of these data is scheduled for fiscal 1987 in a report examining the postprison rear-rest experience of 19 to 22 year-old persons released from prison in 1978.
Major objectives of this effort are to-e develop for each participating State a report that describes recidivism experiences in that State • track a national cohort of offenders longitudinally • assist in the validation of prediction and classification models used by corrections and parole authorities.
66 Bureau of Justice Statistics
-State statistical program
The twofold purpose of the Bureau's State statistical program is to-e enhance the capabilities of the States in developing policy relevant statistical information to meet their own needs a make State-level data available to BJS for national compilations and studies,
Through BJS support, 47 State and 3 territory Statistical Analysis Centers (SACs) for criminal justice have been established over the years. Currently, 41 are active and are providing-• statistical services and policy guidance to the Governors, executive branch agencies, legislators, State and local criminal justice agencies, the judiciary, the press, and the public • data to BJS for multi-State statistical compilations and analyses.
"State statistical analysis center"-or SAG-is a generiC name. Many of the agencies responsible for criminal justice statistics and information at the State level have a name other than SAC.
The responsibilities and functions of these agencies vary widely among the States (table 1). Some State agencies have extensive data collection, analysis, and publication programs; others have more limited programs.
The organizational setting of the State agencies also varies. Most are in the Office of the Governor, but SACs may be found in the Office of the Attorney General, the Department of Public Safety, a crime commission, a planning agency, or a public university.
1986 Annual Report 67

'r
State statistical program
Table 1 Functions of State statistical analysis centers (SACS), calendar 1986
<'I! E ~ <'I! .c In <'I! <'I! ~ «
Crime statistics reporting 0
Legislative study/assistance
Program evaluation .. • Information systems development • Research • Directory of agencies ., Policy analysis • Task force support
Analysis of system process • Clearinghouse activities • Training • Data file maintenance/update • ell
Software development • Source: Criminal Justice Statistics Association, Computerized Index to Data Sources (CIOS).
68 Bureau of Justice Statistics
-
"5 In <'I! 0
u <'I! 'E "0 ~ til In c: ~ Ql
0 c: g c:
~ <'I! 0 c: ~ (ij "0 0 « () () ()
e • • • • • • .. •
• • .. • • • • •
(I
• • ~ .. • • ••
It • 6)
til :is E ::l "0 ()
'0 <'I! <'I! c:
~ <'I! In <'I! .~ :~ .!!l <'I! "0 0 In '0;
'I:: 0 .r: 0 ~ c: '5 0 Ql <'I! co ~ CI3 0 0 u:: C!) :r :g .Q ~ -'
fJ • • • ., • • • • .. • .. • • • • ., • • • • • • • • • .. • • • • • • • • • • • • • • • • • • •
• (I • • • • • • • • • • • • • • e • 6) • • •
(I • • • • • • • •
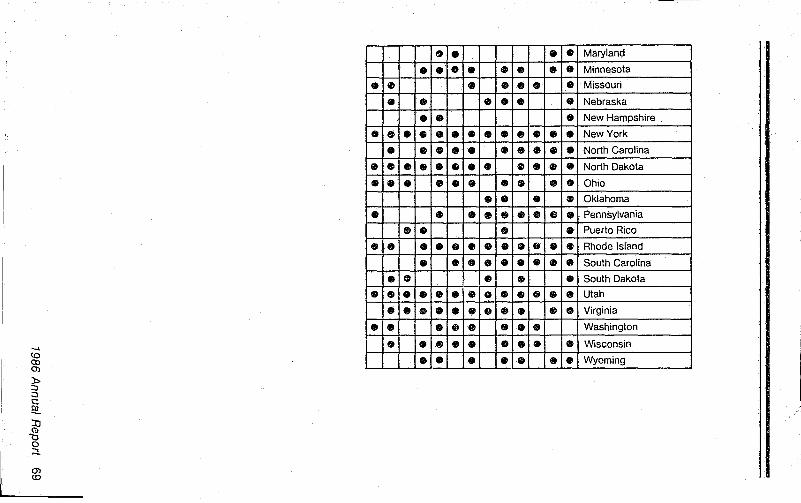
..... co co 0')
P :::J :::J c: ~
~.l
:::t
en (0
• " • • •
• • • • • • ., •
• • • •
• • •
-
0 • • .'. •
• lot • • •
• • • • • • • ., . .,
• • • • ., • • • • •
• • • • • .,
• • ., • • • • ., •
" • • • • • • • • • • • • •
• • • " ., . • • • ~ '----- -
• • Maryland
• • • .. Minnesota ! ., ., .' e Missouri
• • • Nebraska
• New Hampshire
• ., . • • New York
• ., . • • North Carolina
" . • " North Dakota
• • • • Ohio
• • " Oklahoma
e " . " .. Pennsylvania
CD • Puerto Rico
• • • • • Rhode Island
• • • " • South Carolina I
• • South Dakota
• • • • • Utah ,
• • ., • Virginia
• • • Washington
• • • • Wisconsin
~ -~ .. • Wyoming ~ ..

State statistical program
Table 2 Number of States producing data on issues of policy concern, calendar 1986
Issue Number of States
Sentencing 28 Victims 23 Juvenile delinquency 22 Police 22 Jail 20 Personnel manage-
ment issues 20 Substance abuse 20 Probation 19 Parole 17 Overcrowding 16 Recidivism 16 Drunk drivinrJ 13 Plea bargaining 13 Rehabilitation 13 Alternatives to
incarceration 12 Corrections
population projections 12
Public attitudes 12 Pretrial release 12 Sexual assault 12 Child abuse 11 Domestic violence 11 Homicide 11 C:'lme prevention 9 Female crime 8 Restitution 8 Risk assessment 8
Source: Criminal Justice Statistics Association Computerizod Index to Data Sources (CIDS). '
70 Bureau of Justice Statistics
The subjects about which the State agencies collect data or otherwise study also vary, but some topics stand out as being of particul'ar interest across the States (tables 2 and 3).
In fiscal 1986, grants and cooperative agreements were awarded to 3 States and 2 territories to continue development of SACs that had been started recently, and partial support was given to established SACs in 31 States, primarily for serving as clearinghouses for criminal justice statistics. BJS also entered into 6 cooperative agreements with individual SACs for specific projects in statistical analysis and research on topics of critical importance to the States.
The Criminal Justice Statistics Association (CJSA), the national organization of SAC Directors, held a national conference for the States on the use of data in the policy development process. State officials from throughout the Nation participated.
In conjunction with BJS, CJSA continued operation of a computerized index to State statistical data sources. This Index aims to provide rapid access to recent applied research and statistics in the States. It is updated thrnugh an annual survey of State statistical analysis centers. Some results of that survey for calendar 1986 are given in tables 1, 2. and 3.
Through BJS funding, CJSA maintains a catalog and library of statistical reports produced by the State criminal justice statistical analysis centers. CJSA also provides technical assistance, computer software, workshops, and publications for the State SAC directors.

---~~--------------------------
In past years BJS has supported the development of State Uniform Crime Reporting (UCR) systems in approximately 40 States to improve the completeness and quality of data submitted by local police agencies to the FBI. During fiscal 1986, awards were made to-e one State to assist it In continuing the effective operation of the system already in place • another State to serve as a test implementation site for the redesigned UCR program discussed in the "New initiatives" section of this report.
In fiscal 1986, all States were asked to submit applications for UCR redesign funding in fiscal 1987; 18 States responded.
Under the State statistics program, an important recent development is increased BJS analysis of Offender-Based Transaction Statistics (OBTS) data provided by the States. In OBTS, offenders are tracked through the criminal justice system from arrest to sentencing. During fiscal 1986, a report on white-collar crime using OBTS data from eight States and one territory was prepared for publication early in fiscal 1987. California, Minnesota, Nebraska, New York, Ohio, Pennsylvania, Utah, Virginia, and the Virgin Islands provided data for the report. The results of that study are presented in the section of this report titled, "BJS reports on ... Adjudication and sentencing:' Work began on tv:o additional topics, drug trafficking and arrest charge modification, for publication in fiscal 1987.
Reports issued in the past based on data provided by the States to the BJS State Statistical Program dealt with sentencing practices, time served In prison, and recidivism.
To increase State participation in OBTS, BJS used the resources of CJSA to develop a 15-minute video presentation on OBTS. The video describes OBTS in general terms so that the public, criminal justice practitioners, and policy makers all have a common understanding of the program. Additionally, a combined CJSN SGI (SEARCH Group Incorporated) task force of State representatives assisted in revising the OBTS standards and will produce a State-focused report using calendar year 1980-84 OBTS data to encourage State participation. These efforts have increased State involvement from 8 in fiscal 1986 to 13 in fiscal 1987, with an additional 3 to 4 States anticipated for fiscal 1988.
1986 Annual Report 71
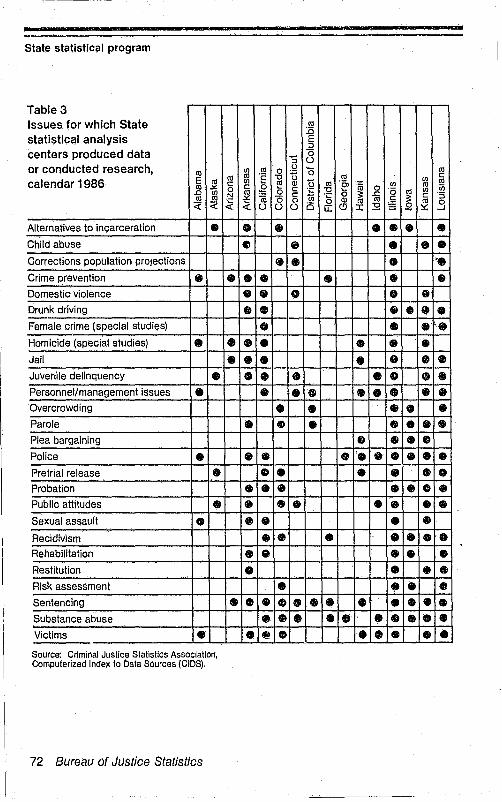
State statistical program
Table 3 Issues for which State statistical analysis centers produced data or conducted research,
'" E calendar 1986 '" '" .:.t-.0 (/)
'" '" <i: <i:
Alternatives to incarceration .. Child abuse
Corrections population projections
Crime prevention .. Domestic violence Drunk driving
Female crime (special studies)
Homicide (special studies) • Jail
Juvenile delinquency • Personnel/management issues • Overcrowding
Parole
Plea bargaining
Police • Pretrial release • Probation
Public attitudes • Sexual assault • Recidivism Rehabilitation
Restitution
Risk assessment
Sentencing
Substance abuse
Victims • Source: Criminal Justice Statisllcs ASSOCiation. Computerized Index to Data Sources (CIDS),
72 Bureau of Justice Statistics
..... :J
(/) '" 0 ,!,1
'" '" 'c "0 tl c (/) g ~ OJ o C c N '" 0 c 'C -c co 0 0 « « () () ()
0 .. " • • • • • • • • • CO • • • • • • • • • • • • • • • .,
• • • • • • • • •• • • •• • • • • .. " • •• • • • •• •
'" :.0 E :J 0 ()
'0 '" '" (/) c
tl '" '~ (/) '" '" 'C :g '~ 0 '0 (/) ,!!i iii 0 .c '" c :J
0 OJ '" '" ~ :;; '" .3 i:5 II: t') :c :g .Q ~
• • • • • .. • • ..
• • • CD G
• • • • • • .. • • '. • • • • • II • .. • (I • • • • • 4) • • • • • • • • • • • • • • It •• • • • •• • •• • 0 • • 0
• • • • • II • • • • • • • • • • •• 0 • •• • •• 0 .. •• e .. • • • •
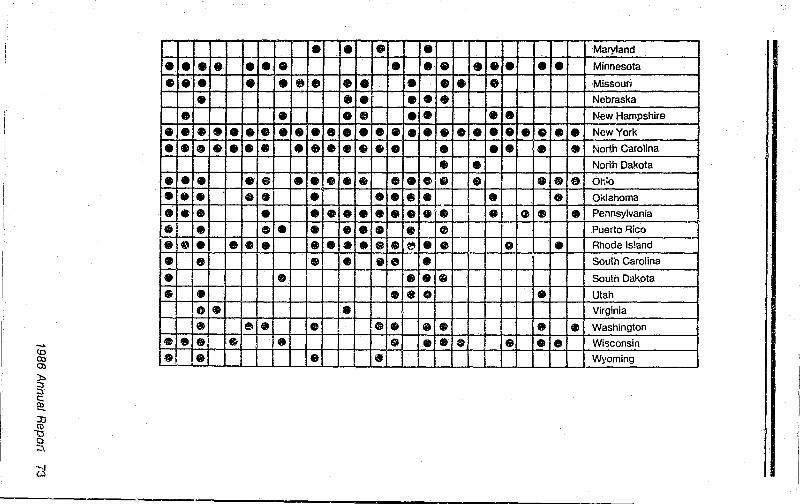
.... (Q co 0)
:t. ::J ::J c: ~
~ o ~
-~ ,,~
• • •• • • • • •
• • • .. • • • • (\
• • • lit • ~.I
•• • • • • • • • • • • • • • • • • • • • • • • • • • • e • &
•
• • • • • • e. • • • • • • (t • • • • • • • • • .. e • • • • • • • .. • • • • • • • • • • • • • • • • • • • • • ,. •
II» • • • • • e • '. • ($
• Maryland
• • • • • • • • Minnesota
• • • • Missouri
• • • Nebraska
• • • • New Hampshire
• • • • • • • • • ~ • • New York
• • • • • .. North Carolina
• • North Dakota
• • e • 6\1 • • t) 01;;0
• • • • ., Oklahoma .. • • • • • • • Pennsylvania
• • Puerto Rico
• ~ • e 0 • Rhode Island -e • South Carolina
• • • South Dakota
• e • • Utah
Virginia
• • • • • Washington (II • • • • • • Wisconsin
Ji Wyoming - -_ .. _---
OM
State statistical analysis center (SAC) nan'atives
This section presents narrative discussions of State statistical activities for the period October 1, 1985, to September 31, 1986. These give an overview of criminal justice data resources available at the State level.
BJS provides financial support to State criminal justice statistical agencies as described In the preceding section, but a number of such agencies operate largely without Federal funding. Consequently, many of the activities cited below were accompiished without Federal support.
For this section, each State agency was invited to submit a short narrative about its activities. Narratives from the States that responded were edited only for consistency of style.
States and territories that are not listed either had no statistical analysis agency (or its eqUivalent) during the period or did not submit a narrative. The names, addresses, and telephone numbers of the State officials who supplied the narratives are listed in Appendix A. These oHicials can be contacted for additional information.
1986 Annual Report 75
IF
State narratives
Alabama
The Statistical Analysis Center (SAC) is a component of the Alabama Criminal Justice Information Center (ACJIC). ACJIC is an independent State agency charged with operating and maintaining an information system for the criminal justice community.
Alabama's SAC is responsible for-Ql compiling statistics on the nature and extent of crime • compiling data for planning • dsveloping crime reduction programs • publishing statistics on the level and nature of crime and the general operation of agencies within the criminal justice system in Alabama.
The most far-reaching project involving the SAC during fiscal 1985-86 was the Uniform Crime Reports (UCR) Committee. This Committee was made up of representatives from small, medium, and large police departments, sheriffs offices, other Alabama law enforcement agencies, the FBI, and BJS.
The committee was established to review Alabama's incident reporting system. which has been in use since 1977. and to learn whether any changes were needed to make the reports more useful for law enforcement. The Department of Justice's Blueprint for the fulure of the Uniform Crime Reporting Program was taken into consideration by the committee, which had its final meeting September 29. 1986. at which time Alabama's IncidenUOffense reports were finalized and approved. Alabama was one of the firet States to act on the Department of Justice's proposed enhancements for the UCR sy£lem.
76 Bureau of Justice Statistics
•
Eleven test agencies are now using new forms. The SAC has compleied several programs to provide test agencies with the same computer support provided \0 Alabama's other incident reporting agencies.
The SAC assists in "selling" local agencies on the benefits of an incident-reporting system by providing them with computer services such as crime by sector breakdowns, manpower and case load data, and crime by shifts. The SAC has also published three reports during the year: • Crime in Alabama 1985 • Homicide in Alabama for 1976-1985 • They Answered the Call, dealing with law enforcement officers killed and assaulted (rom 1977 through 1985.

Alaska
In Federal fiscal year 1986 the Justice Center-the research wing of the School of ,-Justice at the University of Alaska, An-chorage-completed tht' initial organization of its SAC, now officially titled the Alaska Justice Statistical AnalYSis Unit (SAUl.
The SAU's new information program: • provides for regular release of BJS ruport summaries to all major justice agencies, newspapers, and other mass media throughout Alaska • published and distributed an introductory booklet detailing the function and capabilities of the center • has made preparations to publish a regular newsletter.
During the year the Justice Center also focused 0n five other major projects: • The SAU compiled an Offender-Based Transaction Statistics (OBTS) tape, which incorporates 1984 data, and is preparing to proceed with tapes of 1985 and 1986 data. The SAU is also exploring possibilities for obtaining direct research access to other computerized data systems in Alaskan police and corrections agencies. • The final stage of a 2-year study of the feasibility of placing a maximum security prison facility on Fire Island, offshore from Anchorage, in the Cook Inlet, was completed. This stagtJ included a public opinion poll in Southcentral Alaska to determine public attitudes toward the facility. A maJority of those sampled do not believe that pulling more money into prison facilities is effective in reducing crime, and they opposed using the island as a correctional site. The final report to the Department of
.. -
Corrections on the Fire Island study recommended against building a Fire Island facility because of high costs, public opinion, and engineering considerations. • An ongoing data assessment for the Pretrial Services section, Alaska Department of Law, to provide quantitative summaries on the effects of pretrial intervention programs was continued. Statistical findings related to demographic factors, offense records, and success and failure rates of participants in various pretrial programs have been used by the Pretrial Services section to improve management and operational decisionmaking and to evaluate department efforts in the handling of pretrial services. • A project involving an analysis of juvenile clients and referrals, recidivism, and consistency of adherence to established statewide criteria for detention of juvenile offenders was undertaken for the Alaska Division of Family and Youth Services. This project should provide information which will be useful in policy, judicial. and managerial decisions related to the Alaska juvenile justice system. • The SAU completed Identification of all items of data routinely and consistently maintained by State police and corrections agencies in Alaska. This information will serve as a foundation for a catalog of all criminal justice data available for use in policy analysis and research. Court and local justice data descriptions will be incorporated, and a comprehensive catalog will be prepared for distribution in fiscal 1987. When completed, this source document should facilitate improvements in the efficien(;y of researchers in areas related to justice.
1986 Annual Report 77
• State narratives
Arizona
During fiscal 1986, the Arizona Statistical Analysis Center (SAC) continued its study of major criminal justice issues in the State. It also continued to fUnction as a clearinghouse tor crime information and statistics; for example, it responded to a number of inquiries from the media and legislators for explanation and analysis of crime trends. As in past years, it was partially responsible for dissemination and interpretation of State Uniform Crime Reporting (UCR) statistics and contributed technical and analytical assistance in compiling the Department of Public Safety's annual report, Crime in Arizona.
SAC research focused largely on the issue of drunk driving. Using a more current data base, the unit reass~ssed its previous evaluation of 1982 revisions to the State's drinking-and-driving laws. The updated reo search was later presented to a select group which included some of the foremost criminal justice administrators and policymakers in Arizona. The process of investigation and analysis used in this research also became the subject of a pedagogical paper on the evaluation of deterrent impacts of new laws. The paper Was presented at the annual meeting of the American Society of Criminology. Finall~', in this area, research Into case processing of drinking drivers was conducted under special funding provided by BJS. A report of the research will be available in early fiscal 1987.
78 Bureau of Justice Statistics
--------------
..... r
The SAC also investigated other crime issues during the year. A study of homicides in Arizona was completed with a written report to be finished sometime in fiscal 1987. Two more research studies Were begun but their completion dates have not yet been estimated. One looks at the effect of macroeconomic conditions on crime in the State and at the national level. The other investigates the relationship between imprisonment and the amount of crime in Arizona. Both studies will make use of multivariate time-series analyses.
5
Arkansas
Crime in Arkansas 1985
This annual report-• provides an overview of crime based on statistics submitted by law enforcement agencies as part of the Uniform Crime Reporting Program • includes the nllmber OT arrests and incidents known and reported by law enforcement agencies III does not include data on prosecution, adjudication, or corrections " includes a statewide summary of supplemental information about rape including victim and offender data, time/place of occurrence, weapon used, and victim! offender relationship.
Arkansas Crime Pol/1985
A questionnaire mailed to a random sample of 1.500 citizens from all 75 counties requested their views on-• the effectiveness of criminal justice • fear of crime • punishment • crime events during the year • selected current issues • Arkansas resident's perception of problems within the community.
Of the 708 respondents-• 81 % felt that the courts are too easy in dealing with criminals • 7% indicated they had asked the police for a home security check o 74% had r.ot marked their possessions for identification • 56% felt that criminals shoUld serve their full sentence • 97% felt that a person should not be released on bond for the second offense • 90% felt that a jury should be informed of the parole laws before sentencing.
1986 Annual Report 79

State narratives
California
The Bureau of Criminal Statistics (BCS). of the California Attorney General's Office. is statutorily mandated to compile, analyze. and publish data on crimes. criminals. and the criminal justice system. This is a summary of major projects. activities, and accomplishments that have contributed to development of criminal justice law and policy in California.
Data bases
The Statistical Analysis Center (SAC) utilizes data collected, compiled. and maintained by the Statistical Data Center (SOC). Data sets include-
• crimes • arrests • processing of adult and juvenile offenders
• local detention facility counts • law enforcement personnel • deaths in custody • domestic violence.
Special requests program
Each year, BCS answers more than 2.500 requests for statistical information from the Governor. Legislature, other State and Federal agencies, researchers, and the public. These range from providing individual crime statistics to literature searches, special computer runs, and extensive analysis of BCS and other data.
80 Bureau of Justice Statistics
------~---~~----~---
Publications program
BCS published 9 reports during 1986, including: Outlooks (4), publications on topics of special interest: Annual Reports
(3), on crime and delinquency; a Mono
graph. on controlling plea bargaining in California: and a FOCUS, on findings of a major research project on the incidence and prevalence of arrest.
Adult criminal justice statistical system (ACJSS) longitudinal file
Il-Jis data system, begun in May 1985, is a powerful tool for studying the California criminal justice system. The file contains the entire criminal histories (for example, previous arrests, convictions) of offenders whose first arrest occurred on or after January 1. 1973. The data base is continually updated to show an offender's involvement with the justice system. Selected cohorts of arrestees can be drawn from the file for special studies, such as recidivism rates and the characteristics and patterns of specific groups of three otfElnders.
__ ~ _________ .... _ J
California Attorney General's criminal justice targeted research program
The Attorney Gen€iral initiated an ongoing program to fund 1-year research projects In the field oi criminal justice undertaken by doctoral candidates and postdoctoral research fellows. The program aims to accomplish greater and more sophisticated analysis of data collected by BCS, by working more closely with the academic community and allied practitioner agencies. Projects in 1985/1986 included studies of-• the exclusionary rule • the incidence and prevalence of arrest in California • a historical analysis of the juvenile justice system in California since 1900.
AGIUC collaboration program
In 1986, the Attorney General's Office and the University of California began a collaborative research effort on critical criminal justice policy issues. First-year concentration was on anal\:'~ing sentencing trends. An initial publication is expected in January 1987.
Colorado
Felony court cases data base
This data base consists of a 10% sample of cases filed in district criminal courts from 1979 to June 1986. Data are collected on-• the offender (age, sex, education, employment, drug and alcohol abuse, mental health needs, criminal history) • the offense at filing and at conviction (type, felony class, number of offenses charged, number of offenses convicted) • the disposition (dismissed, guilty plea, deferred prosecution or sentence, type of sentence, length of sentence, fees or fines imposed, restitution, recidivism).
The data are used to provide information to the legislature, the Governor's office, the Judicial Department, and other users of criminal justice data.
The types of analysis done include• a description of criminal court filing patterns by volume, type, and region • a description of criminal court sentencing practices including plea bargaining; number of convictions; sentences to prison, community corrections, probation; changes in type of offenses filed; type of offender; and type and length of sentence imposed • an analysis of felony filings, conllictions, and court dispositions to assess the effectiveness of the criminal justice system, to monitor implementation of new policies or legislation, and to estimate the impact of policies and legislation • an analysis of the variation in sentencing practices among several Colorado judicial districts
1986 Annual Report 81
-........ State statistical program
" a development of statistical profiles of the types of offenders sentenced to probation, community corrections, and prison and an assessment of sentencing practices based on these profiles " a preliminary analysis of the impact of new sentencing legislation (H.B. 1320 [1985]) on sentence length and consequently the State prison population and jail backlog.
There is no other research data base of criminal justice information available in the State. All other data bases, such as Judicial, CBI, PROMIS, and DOC, are designed for administrative purposes and not for research on problems in the criminal justice system.
Pretrial release practices in Colorado
Data were analyzed to describe recent pretrial release practices occurring in a sample of jurisdictions. While most (92%.) offenders are released prior to trial, local policies that determine release practices appear to impact length of pretrial detention. Specifically, the data suggest jail overcrowding is related to release practices including location of release (sheriff's office or court) and bonding practices.
82 Bureau of Justice Statistics
Analysis of risk and custody needs of Colorado offenders
A sample of the State inmate population was analyzed to determine if there was an identifiable group of inmates who might be housed at lower custody levelS (and hence lower cost) without increasing public risk. It was determined that almost half the current population could be housed at the minimum custody level and 250 additional inmates could be placed in community corrections programs. The Department of Corrections is moving in this direction.
A description of community corrections in Colorado
Dala were analyzed to determine whether !he State community corrections system could be expanded without "widening the net" or increasing public risk. It was concluded that appropriate sentences to community corrections (according to statistical profiles) might safely reduce prison sentences by 12%. Thus. with careful planning, the community corrections system could be expanded without decreasing public safety.
Commonwealth of the Northern Mariana Islands
The Commonwealth of the Northern Mariana Islands (CNMI) established its Statistical Analysis Center (SAC) during fiscal year 1986. The SAC is a division of the CNMI Criminal justice Planning Agency (CJPA), The SAC serves the Micronesian region, in addition to the Commonwealth. The regional jurisdiction of the SAC was established under a series of agreements between the CNMI and the governments of the Republic of Palau, the Federated States of Micronesia, and the Republic of the Marshall Islands.
The SAC has been busy establishing data collection stations throughout the region to support regional data analysis, with data collection arrangements and capability now available in all of the participating governments.
Coordinating the implementation of an integrated Criminal Justice Information System among the criminal justice agencies of the Commonwealth has been a priority project in the Northern Marianas.
The SAC ras produced several reports during fiscal year 1986. The first was Jury trials in the CNMI: 1978 through 1985. The CNMI, as a result of the Covenant agreement that brought it into a Commonwealth relationship with the United States, is not required to provide trials by jury in all cases. Debate has continued on the appropriateness of the jury trial system in
island communities. The study was an attempt to examine jury trials that had taken place in fight of the debate. The study supported the viability of the jury system in the CNMI.
Tho second report was Juvenile crime in the CNMI: The 1985 Update. This report examined juvenile crime trends and statistics from the Department of Public Safety.
The third report was Crime in the CNMI: The 1985 update. This was similar to the second report but its focus was broader and included alf reported offenses.
The SAC publishes a biweekly newsletter sent to all justice system practitioners and policymakers in the CNMI providing them with the most current justice system statistical analysis, news from the various agencies, and national level justice system developments. It also has several regular educational features introdUcing the readers to the use of available technology and promoting crime prevention activities.
Justice system policymakers have come to perceive the SAC as a resource for information and analysis. Already special requests have been made for studies of DUI in the CNMI and for preliminary analysis of crime statistics and social indicators as the first step in a crime prevention effort.
1986 Annual Report 83
Commonwealth of Puerto Rico
The Statistical Analysis Center (SAC) in Puerto Rico was e'3tablished within the Criminal Justice Iniormation System (CJIS), an independent agency Of the Department of Justice.
SAC's main objective is to compile, analyze, and publish criminal statistics pertaining to the four agencies of the Criminal Justice System: Department of Justice. Police, Corrections, and Courts.
The SAC acquired a microcomputer to accelerate statistical reports and attain more sophisticated analysis. At the same time, SAC is in communication with the University of Puerto Rico and is gaining access to statistical packages through the microcomputer. A seminar on the application of SAS (Statistical Analysis System) is being held in the SAC premises. The seminar is a continuation of training in statistical methods previously given. In both seminars, personnel from the criminal justice agencies were invited to participate.
At present, we are acquiring two more microcomputers to be installed in the statistics divisions of the Department of Justice and the Administration of Correction. This is necessary for us to comply with our objectives of providing technical assistance to the criminal justice components, and in this manner we expect they will produce more accurate statistics and reports.
84 Bureau of Justice Statistics
All Ihese activilies are possible through Federal funds granted by BJS.
Technical assistance and information on criminal statistics were provided to legislators, university students, criminal justice agency personnel, and personnel from other public agencies in Puerto Rico and the United States.
The following reports have been published in Spanish and are available 10 the public:
Compendio Estadistico de las Agencias que Componen el Sistema de Informacion de Justicia Criminal hio 1983-84 (Statistical Summary of the Criminal Justice System-Fiscal year 1983-84).
Crimenes Violentos en P.R. 1984 (Violent crimes in Puerto Rico, 1984).
EI Crimen En Puerto Rico-1982 (Crime in Puerto Rico, 1982).
EI Crimen en Puerto Rico-1983 (Crime in Puerto Rico, 1983).

Connecticut
The Connecticut Statistical Analysis Center (SAC) is in the Justice Planning Division of the Connecticut Office of Policy and Management. The SAC has conducted (or provided assistance for) a number of Justice Planning Division projects during the year.
Such projects included-• awarding and administration of Justice Assistance and OJJDP grants • providing technical assistance funds for criminal justice agencies • providing staff support for the Governorappointed Task Force on Family Violence • conducting a study of adult probation for the Connecticut Prison and Jail Overcrowding Commission • completing improvements and enhancements to an eXisting computerized model of Connecticut's criminal justice system • staff support for the Governor's Task Force on Safety in Public Buildings, the Governor's Action Committee on Drug Education, and the Victims of Crime Study Group established by the Justice Planning Division.
The work of the Task Force on Family Violence resulted in the passage of major legislation entitied "An Act Concerning Family Violence Prevention and Response." This act-o increa'"led resources for shelters and other fahilly-violence-related services • established family violence intervention units in Connecticut courts • provided for uniform arrest policies wherein arrest is the preferred decision In family violence incidents.
----------------
The Adult Probation Study led to-• a report documenting significant increases in probation cases due to greater court activity and more widespread use of split sentences following the abolition of parole, without a commensurate increase in probation resources • the recommendation by the Connecticut Prison and Jail Overcrowding Commission to significantly increase adult probation resources.
Improvements to Connecticut's criminal justice computer simUlation model included• conversion to a more user-friendly software package • updates of court processing and sentencing data • more detailed projections of Connecticut's future demographic profile and arrest rates by demographic category.
Revised prison and jail population projections based on this model show substantially higher future population figures than previous estimates and a continUing rise in the incarcerated population throughout the 1990's.
1986 Annual Report 85
State narratives
Delaware
During Federal fiscal year 1986, the Delaware Statistical Analysis Center produced three new major studies:
Driving under the influence
This study of accidents and driving under the influence covering the 14 years 1971-84 resulted in several conclusions including-• fatal accidents are random occurrences. Their use alone as the measure of success or failure of education and enforcement programs is a weak, unsupportable argument • the growth of Injury and fatal accidents, the number of drivers, miles driven, registered vehicles, alcohol sales, etc. have shown uninterrupted growth over time. There is no indication that anything has disturbed the long-term straight line growth.
The effects of consecutive sentences on corrections
ThIs study shows that Delaware's consecutive sentencing policy disproportionately impacts misdemeanants and traffic violators. Because of sheer numbers, more of these persons serve consecutive sentences than felons. Also, they have their sentences enhanced in greater proportion than felons when they are required to serve multiple sentences.
Reconviction in Kent County
This study of all sentences in Kent County Superior Court in 1985 shows Ihat 80% of all persons convicted had at least one prior cc,wiction in a Delaware cour!.
86 Bureau of Justice Statistics
District of Columbia
The District's Statistical Analysis Center (SAC) is a unit in the Office of Criminal Justice Plans and Analysis (OCJPA). This office provides staff support in the criminal justice area to the Mayor. the City AdministratOr/Deputy Mayor for Operations, and the Director of the Office of Policy and Program Evaluation.
Staff support functions inclUde-• analysis of criminal justice issues • gathering and complling Information and data from operating agencies • preparing written reports and studies • developing legislation • drafting government rules. regulations • and executive orders.
The SAC-o is responsible for preparing and disseminating a statistical report on crime and arrest trends in the District of Columbia • serves as a criminal justice information clearinghouse for the District of Columbia e prepares special studies and conducts ongoing research relating primarily to COl relales of crime and descriptions of the offender population • analyzes criminal justice related legislation on behalf of the Executive • assists in the preparation of Executive positions on criminal justice legislative and policy matters • is involved in development uf an automated criminal justice management infor· mation system • provides technical assistance to other agencies in helping to improve dala analysis capabilities.
Most important accomplishments
In fiscal 1986, the SAC accomplishments included-o publication of the Crime and Justice Report for the District of Columbia, which provides statistics about trends in crimes, arrest, prosecutions. convictions, corrections, and parole • publication of the District of Columbia inmate profile, which is the most comprehensive analysis ever done of the District's inmate population; this profile of inmates includes information about criminal histories, sentences, and sociodemographic variables including lastknown census tract addresses of inmates prior to incarceration • completion of a study comparing major and minor juvenile offenders along a host of variables, including age of first arrest, school history. and family backgrounds • assistance in development of the District's Criminal Justice Information System Plan, which is designed to provide the District with a computerized criminal-history file.
In coming months, the SAC will produce a comprehensive report on various aspects of the illicit drug problems In the District. The report will provide background data and information on drug arrests, drug convictions, drug treatment, caseloads, overdose deaths from drugs and drug-test findings for arrestees.
The SAC will also continue to focus on answering questions about the District's corrections population and justice decision patterns.
------------------------------
w_
Florida
The Florida Department of Law Enforcement (FDLE) is a professional State law enforcement agency. Its Commissioner reports directly to the Governor and Legislature.
FDLE provides many services to the State: • identification of criminal activities and offenders through independent investigations and ihose in cooperation with local law enforcement • operation of comprehensive crime information and intelligence programs • operation of a sta,tewide telecommunications network .. provision of technical and forensic support to local agencies • certification of all enforcement and correctional officers through the regulation of standards and training .
With the support of the Florida Legislature and BJS, FDLE continued lis efforts during the past year to improve and expand on its ability to capture data on the nature and extent of crime and criminal justice activities in Florida, FDLE has been a forerunner in the areas of computerized criminal-history (CCH) records and Uniform Crime Reporting (UCR) data for the past 15 years. Efforts have focused on the need to improve these programs and to expand FDLE's ability to perform statistical analysis of the activities of the entire criminal justice system.
One major accomplishment during the year was creation of Florida's Statistical Analysis Center (SAC). With the support and authorization of the Governor and Legislature and initial funding from BJS, the SAC became
1986 Annual Report 87
-----------------------------------
State narratives
operational in April 1986. This unit exists within FDLE's Division of Criminal Justice Information Systems and is a resource available to local, State, and Federal users of crime and criminal justice data. Among the first projects completed by the SAC were building data bases for applied CrIminal justice statistical analysis and analysis of Florida's fluctuating population base.
A second task pursued by FDLE, with specific mandates from the Florida Legislature, is a major revamping of the method for reporting criminal justice data ill Florida. FDLE Is developing statewide uniform offense, arrest, and disposition report forms that will provide the basis of a new UCR program, an Offender Based Transaction Statistics System, and improvements in CCH records beginning in January 1988. Development of the new Crime Information System based on these forms is a massive cooperative effort by State and local criminal justice agencies. The SAC will be analyzing these data systems, making comparisons with other data bases, and generating meaningful reports to users of the data.
88 Bureau of Justice Statistics
FDLE has also developed a plan and is pursuing the bid process for an Automated Fingerprint Identification System (AFIS) which will improve CCH data dramatically as well as provide the best investigative tool to law enforcement in many years. FDLE continues to maintain and improve other program services available to appropriate local, State, and Federal users of criminal justice information: the Missing Children Information Clearinghouse (MCIC); Florida Crime Information Center (FCIC): and the Florida Intelligence Center (FIC).
Hawaii
Criminal justice information system (CJIS)
The State embarked on a project to develop a well-functioning, integrated criminal justice information system by improving and building on that which is already in existence for the short term and, at the same time, to examine its directions and design strategies for the long term through establishment of a Criminal Justice Data Interagency Board.
Juvenile justice information system (JJIS)
As part of the continuing project undertaken by the Juvenile Justice Interagency Board to develop a juvenile justice information system for the State, studies have been completed defining all the data elements to be included in the proposed system and defining any legal requirements such a system will entail.
Electronic fund lransfer (EFT) crimes report
As part of a grant from BJS, a study to assess the nature and volume of electronic fund transfer crimes in Hawaii found that such crimes are not yet a major problem in Hawaii.
Hawaii judicial information system (HAJIS)
An automated transfer of information between the Hawaii Judicial Information System (HAJIS) and Offender-Based Transaction Statistics (OBTS/CCH) was implemented in order to capture court disposition data required to maintain complete and accurate criminal-history information.
Recidivism study
This study tracked prisoners released from prison in 1978 and 1979 until 1984 to examine the characteristics of recidivists as a basis for predicting recidivism prior to the release of prisoners.
Penal summons
Act 119, Session Laws of Hawaii, 1985, was implemented. This act allows for entry of penal summons cases into the OBTSf CCH system to provide more accurate and complete criminal-history records.
Acts 208-209, Session Laws of Hawaii, 1985, relating /0 criminal records clearance
These acts require criminal-history record checks for all operators, staff, or employees, or prospective emplvyees of child care, detention, and correction/treatment facilities in the State. The acts conform to requirements of Public Law 98-473 and Public Law 92-544.
1986 Annual Report 89
State narratives
White-collar crime in Hawaii
A study was conducted to assess the nature of white-collar crime in Hawaii. This study is another in a series on whits-collarl computer crimes. Questionnaires on specific types of white-collar offenses were sent to the county prosecutors, the State attorney general, and the u.s. Attorney for Hawaii.
The felony offender and the criminal justice system
This project examines offenders arrested for felonies in 1981 in Honolulu. These offenders will be tracked from arrest through sentencing. The first report from this study will describe the offender, victim, incident, and arrest. Future reports will present prosecution, court, and corrections data.
JUVenile offender study
A study on juvenile offenders is being planned. The objectives of the study are to-.. dl;ltermine the number of arrested juveniles where the offense was committed under the influenCE! of drugs or alcohol .. determine the number of juveniles arrested by geographical area • identify common faclors in the backgrounds of violent juvenile offenders.
90 Bureau of Justice Statistics
Criminal appeals in Hawaii
This study looks at various aspects of criminal appeals in Hawaii, such as who is appealing and why. Data are collected from records of the Supreme Court and of the Intermediate Court of Appeal.
Management and administrative statistics (MAS) report
This report presents the resources of criminal justice agencies in Hawaii for the purpose of assisting Federal, State, and local criminal justice administrations in evaluating agency performance and to assist in decision making. The current report covers State fiscal years 198o-a1 to 1983-84. A supplemental report will cover fiscal years 1984-85 and 1985-86.
1...-________________ . __________ .....
-
Idaho
Activities during the period included-• production of a statistical summary of drug enforcement activity by the Depart. ment of Law Enforcement. The summary includes types and amounts of drugs seized during enforcement activities, estimated street value of drugs, value of property seized as allowed by Idaho statute, and number and type of arrests. This information is used in law enforcement planning by the department and as a source of information for the Governor and the legislature • production of an analysis of Uniform Crime Reporting (UCR) data collected by that program. Results are published yearly in Crime in Idaho. Information is used by a variety of government agencies and educational institutions • production of a one-time report, based on a survey, of the statistical crime analysis electronic data processing capabilities of 10 local jurisdictions in Idaho. This information has been and is being used as the basis of recommendations to the Idaho Criminal Justice Council for training of local officers.
Illinois
The Illinois Criminal Justice Information Authority is mandated by the State legislature to improve the quality of criminal justice information throughout Illinois. As a response to that mandata, the Authority undertook numerous statistical and information system projects during Federal fiscal year 1986.
These projects can be generally classified into two categories: • research and analysis t!I information system development and operation.
Highlights of each primary program area are given below.
Research and analysis:
Information Resource Center (IRC)
The agency's IRC, a clearinghouse for criminal justice information, greatly expanded its capabilities through continued use of student interns and development of new data base management techniques. The number of requests increased substantially from the previous year.
Work was completed on the Pretrial decision data project. This effort looked at the current pretrial process in the Circuit Court of Cook County and assessed the availability and quality of information about bail decisions. This project is one part of the State's larger effort to improve the criminal justice decision making process through availability of more accurate and complete criminal-history information.
1986 Annual Report 91
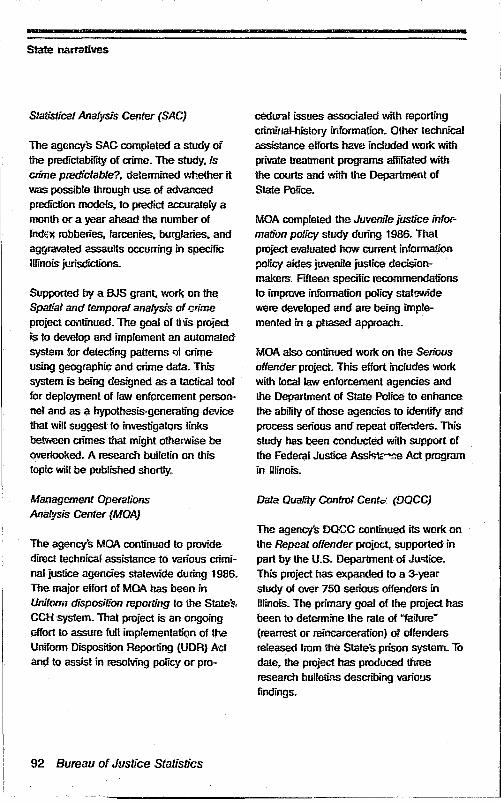
• State narratives
Statistical Analysis Center (SAC)
The agency'S SAC completed a study of the predictability of crime. The study,ls crime predictable?, determined whether it was possible through use of advanced
prediction models, to predict accurately a month or a year ahead the number of Ind€x robberies, larcenies, burglaries, and
aggravated assauHs occurring in specific Illinois jorisdictions.
Supported by a BJS grant, work on the Spatiaf and temporal analysis of c-rLrne project cootinued. The goal of tl us proiect is to develop and implement an automafed
system !or detecting patterns elf crime using geographic and crime data. This system is being designed as a tactical tool for deployment of law enforcement person
nel and as a hypothesis-generating device that will suggest to investigators links between crimes that might otherwise be overlooked. A research bulletin on this topic will be published shortly.
Management Operations Analysis Center (MOA)
The agency'S MOA continued to provide direct technical assistance to various criminal justice agencies statewide during 1986. The major effort of MOA has been in Unifoull disposition reporting 10 the Slate'~,
CCH system. That project is an ongoing effort to assure full implementation of tft.e Uniform Disposition Reporting (UDR) Act and to assist in resolving policy or pro-
92 Bureau of Justice Statistics
cedural issues associated with reporting criminal-history information. Other technical assistance efforts have included work with
private treatment programs affiliated with the courts and with the Department of State Police.
MOA completed the Juvenile justice information policy study during 1986. That project evaluated how current infonnation policy aides juvenile justice decisionmakers .. Fifteen specific recommendations to improve information policy statewide
~re developed and are being implemented in a phased approach.
MOA also continued work on the Serious
offender project. This effort includes work with local law enforcement agencies and lhe Department of State Police to enhance the ability of those agencies to identify and process serious and repeat offenders. This study has been conducted with support of Ihe Federal Justice Assm.,~ Act program in Illinois.
Data Quality Control Cent",' (DQCe)
The agency's DacC continued its work on the Repeat offender project. supported in part by the U.S. Deparlment of Ju.'>tice. This project has expanded to a 3-year study of over 750 serious offenders in Illinois. The primary goal of the project has been to detennine the rate of '"failure
(rearrest or reincarceration) of offenders released from the State"s prison system. To date, the project has produced three
research bulletins describing various findings.
-,
The OOCC conducted its annual audit of the States central repository for criminal
history records. Findings from this and previQus audits are used regularly to help identify and correct problems wiih the
Department of State Polices computerized criminal.f1istory (CCH) system.
The DaCC also completed a comprehensive Criminal justice directory for Illinois. TheclfeCtory includes criminal justice professionals,. related or affiliated profes
sionals, and members of the States electorate. This directOf)' will enhance the aliility of the aillhority to reach selected audiences when cl.stributing future publications.
Other research and analysis projects
AIl four centers in the agencys Research and Analysis Unit worked together to
develop a comprehensive overview of the criminal justice system in Illinois, including historic, current. and projected trends in all criminal justice components within the State. The fmal report. «ends & issues,
will be distnbuted statewide and nationally.
tnformalion system operation:
Information Technology Unit (ffU)
The rru is responsible for maintaining the authority's network of hardware and software systems. To support the operation and development of information systems, rru is made up of five different centers.
The Systems Development Center is responsible for the design, development. and maintenance of application software; the Quality Assurance Center is responsible for
the coordination of syl.,tems and adherence fa standards; the Telecommuni<;ations Cen
ler is responsible for the hardwarelsoftware to maintain communications between systems and components of the authority's
network; and the Information Technology Center is responsible for microcomputer support and development and provides walk-in facilities to demonstrate microcom
puter hardware and software. The rru combines the skills of these various centers to support the three malar information systems operated by the authority. Those
systems, PIMS, CIMIS, and RAPS are described be:Ow:.
Police tnformation Management System (PIMS)
The agency's PIMS continUed to provide direct information system management 10 Illinois law enforcement agencies state
wide. Four new departments were added to the system in 1986. PIMS is an automated system for the coUection and maintenance
of law enforcement recorcb that assists investigators in analyzing crimes.
The PIMS also provided continued development of its Mapping Project, providing computerized maps to participating agen
cies. Those maps display crime dala and assist potice management in strategic and tactical resource alrocation. Two additional agencies were provided this service in
1986.
1986 Annual Report 93
State narratives
Correctional Institution Management Information System (CIMIS)
The agency's CIMIS continued to provide online booking, inmate tracking and scheduling, facility utilization reports, and management reports to local correctional agencies statewide. Several program enhancements were developed in 1986.
Rapid Automated Prosecution System (RAPS)
The agency's RAPS was redesigned from an early Cook County State's Attorney system and was implemented in various locations in Illinois in 1986. The system will support case tracking and scheduling, as well as document production including informations, motions, orders, subpoenae, victim/witness leHers, and a wide range of management reports. Two new RAPS sites were implemented in 1986.
94 Bureau of Justice Statistics
Indiana
Statistical analysis center
The institute applied for and was granted by the Bureau of Justice Statistics support for establishing a Statistical Analysis Center (SAC). The SAC will address the need for criminal justice problem analysis in a more formal and functional manner within the State. The ability to provide statistical analysis in terms of quantifiable description, measurement, and communication will be a great aSEet to criminal justice planning in the future. This will be of help to practitioners, researchers, and evaluators throughout the criminal and juvenile justice systems in Indiana. Indiana is now interviewing for staff positions for this unit.
Offender-Based Tracking System
In January 1984, a Technical Advisory Committee-acting as a subset of the Data Committee of the Indiana Criminal Justice Institute-was formed to investigate the prerequisites of an Offender-Based Tracking System (OBTS).
The Technical Advisory Committee includes representatives from various components of the criminal justice system, including the Department of Correction, Indianapolis and Anderson Police Departments, Marion and Elkhart County Sheriff Departments, Criminal Justice Institute, Indiana State Police, Indiana Attorney General, and the Indiana Information Services Division.
---------- ---------------------------------------------------------------
The committee performed preliminary research including identification of possible data elements and of some major issues concerning the development of an OBTS:
• The OBTS will provide information about offenders as they are processed through the criminal justice system.
• Data entry will begin when an offender is booked for a felony or a Class A misdemeanor; will continue as the offender is tried and, if convicted and sentenced, Incarcerated; and will conclude when the
offender has served his or her sentence or has been released from probation or
parole. •
• The OBTS will provide online reports of offender Identification, arrest, trial, and incarceration as well as the status and location of any individual at any point In the
criminal justice chain.
• A variety of reports. ranging from characteristic makeups of offenders arrested on a certain day by a particular law enforcement
agency to notices of offender rele~ses, will be available to the entire Indiana criminal justice community.
The system will use the current Indiana Data and Communications (IDACS) network. The current 169 terminal locations will be i!"creased to 207.
Adult felon data base
The Adult Felon Data Base is a cooperative effort of the institute and the Indiana tepartment of Correction. This data base was started by the Indiana Legislative
-
Services Agency and is being expanded and modified by the institute. During the first quarter of 1986, in conjunction with procurement of a terminal for the Depart
ment of Correction, sentencing information and a wide variety of offender information will be available on each inmate committed to the Department of Correction. Data input
will be handled by corrections personne! using a mainframe computer in the Information Systems Division of the Department
of Administration. The system came online September 1, 1986, and now contains data on 3,857 inmates. Data continues to be entered and will eventually include all
inmates committed to the Indiana Department of Corrections.
Uniform Crime Report Program
Supported by a Governor's Executive
Order, a State Uniform Crime Report (UCR) program will be developed in the Indiana State Police. A committee appointed by the chairman of the institute boar,j of
trustees will provide direction for initial development of the project, and appointment of members to a permanent oversight
committee for SACtUCR will coordinate and oversee operation of the UCR program and the SAC unit.
1986 Annual Report :-"_1
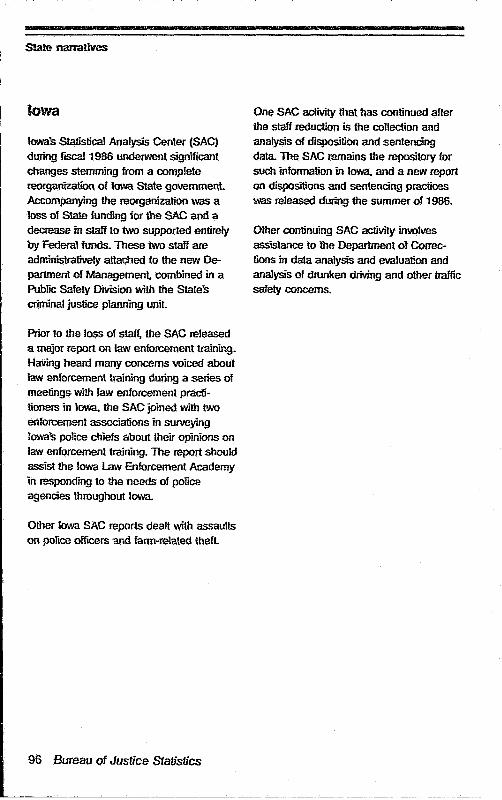
State narratives
Iowa
lowas Statistical Analysis Center (SAC)
during fiscal 1986 undenr..enl significant
changes stemming from a complete
reorganization of Iowa State government Accompanying the reorganization was a
loss of State funding lor the SAC and a
decrease in staff to two supported entirely
by Federal funds. These two staff are
admmisttatively attached to the new Department of Management. combined in a PubrlC Safety Division with the States
criminal justice planning unit
Prior to the loss of staff. the SAC released
a major report on law enforcement training.
HaVing heard many coocems voiced about
taw enforcement training during a series of
meetings with law enforcement practi
lioners in Iowa. the SAC joined with two
enforcement associations in surveying
lowas police chiefs about their opinions on
law enforcement training. The report should
assist the Iowa Law Enforcement Academy
in responding to the needs of police
agencies throughout Iowa,
Other Iowa SAC reports dealt with assaults
on police officers :ma 13rm-related theft
96 Bureau of Justice Statistics
One SAC activity Ulat has continued after
the staff reduction is the collection and
analySIS of disposition and sentencing
data The SAC remains the repository tor such information in Iowa, and a new report on OISPOsitions and sentencing practices
was released during file summer of 1986.
Other continuing SAC activity involves
assistance to the Department 01 Corrections in data analysis and evaluation and
analysis of drunken driving and other traffic
safety concerns.
Kansas
The Kansas Bureau of ~nvestigation is the -central repository- for an extensive amount of information concerning justice activities in the Stale. The Statistical Analysis Center (SAC). consisting oJ 11 people. is the component of the bureau responsible fOT data and infotmalion system development, research and statistical
activities. and publication of reports from these data sets.
Three major programs recently developed are-e an Incident-Based Reporting System
which allows the collection of standardized crime data on offenses occurring in specific jurisdictions • the Stale .Juvenile Justice Information
System which receives data from justice entities on juveniles, both as victims and offenders • the State MISSing Persons System.
Other SAC programs include data sets on justice systems employment and expen·
allures. probation. the Justice System Directory. traffic safety and law enforcement officers kllled or assaulted. and a number
oJ statistical reports and special studies inclucfmg:
Quarterly Crime Statistics
Crime in Kansas (annual report) .Juvenile Justice (annual report)
Missing Children Bulletin
.ttlstice Systems Employment and Expenditure
Justice System Directory
Highway Traffic Safety
The SAC also attempts to respond 10 requests for justice system data and continually works with other justice system members to elevate all data to a usable level for persons in Kansas. Finally. training
in mandatory reporting procedures is provided by SAC staff.
1986 Annual Report 97
State narratives
Kentucky
Since September 1984. the Kentucky Criminal Justice Statistical Analysis Center (SAC). funded by a BJS grant. has been housed in the Attorney General's Office and operated by the Urban Studies Center, (USC is the policy research component of the College of Urban and Public Affairs of the University of LoUisville,) It was assUrTIed such a State government-university partnership would be more efficient than developing the necessary research expertise and capabilities within the Office of the Attorney General. Thus, the Honorable David L. Armstrong (Kentucky Attorney General) provides policy guidance, and the University of Louisville research center. in cooperation with faculty from other Kentucky universities, conducts research and disseminates the findings. Additionally, a SAC Steering Committee. composed of representatives from a variety of agencies that deai with criminal justice issues, advises the Attorney General on research matters in the Commonwealth,
The SAC's second year of operation has continued to be productive. The SAC was instrumental in preparing an extensive OBTS bill Which was passed by the 1986 legislature. The system follows a defendant from arrest to release from prison. Additionally, four major stUdies were also completed:
Back from the dead.' An analysis of 23 Furman inmates by Dr. Gennaro F. Vito
98 Bureau of Justice Statistics
Child abuse and neglect in Kentucky: Reports, children, and the agency by Dr. Gordon S. Bonham
Criminal victimization in Kentucky.' A longitudinal study; by Drs. Knowlton W. Johnson and Fran Norris
Persistent felony offenders in Kentucky: A comparison of first-time and repeat offenders by Drs. Gennaro F. Vito and Deborah G. Wilson
The results of these stUdies have been disseminated in a variety of ways. In September 1986, the SAC held its second annual, statewide conference featuring panel discussions of the preliminary results from each study. Additional topics included privatization of prisons, alternative sentencing/home incarceration, and the need for a comprehensive criminal justice catalog for the State. The 2-day conference attracted nearly 125 criminal justice professionals from agencies across the Commonwealth. The reports will be released in December 1986.
In October an OBTS videotape compiled by the Criminal Justice Statistics Association (CJSA), with assistance from BJS, was presented to several audiences, including a statewide commission overseeing information systems. Bimonthly bulletins have been released highlighting the six reports from 1985, Topics for the bulletins have covered the annual conference, child abuse, OBTS, persistent felons, recidivism, and victimization.
---
The SAC plans for 1986-87 include: • a social policy experiment testing the impact of a SAC affiliate program on the use of statistical information • a third child abuse study focusing on a benefit analysis of each type of social service intervention • a detailed data inventory of State and local criminal justice agencies • a study of the capital punishment issue in Kentucky focusing on cases available to be prosecuted under the current statute • a crime estimation study which mirrors parts of the National Crime Survey and will produce victimization rates for the Commonwealth • a third annual conference with presentation of SAC products generated dUring the year • providing planning assistance for implementation of statewide OBTS to relevant State agencies.
WfAA
Louisiana
The Louisiana Statistical Analysis Center (SAC) is a division of the Louisiana Commission on Law Enforcement. It was the first such organization funded under the Federal Comprehensive Data Systems program.
Since its establishment in 1975, the mission of SAC has undergone significant evolution: from a statistical information reporting agency in the early years to the policy directed research and technical assistance organization it is today. Statistical research remains the primary tool at SAC, but its use is more clearly focused on critical policy issues confronting State and local criminal justice systems in Louisiana.
Since 1984, SAC efforts have focused on the largest single problem confronting the State's criminal justice policymakers: The overcrowding crisis in the State's prisons and jails. In dealing with this issue, SAC was assigned to support the work of the Governor's Prison Overcrowding Policy Task Force. The SAC role in this effort is to provide research and policy analysis services to thp. Task Force, and policy impact statements to the relevant legislative committees. Largely as a result of the Task Force's efforts, major legislative packages dealing with State and local corrections were adopted during the 1985 and 1986 Regular Legislative Sessions. The work of the Task Force is continuing and additional legislative proposals are expected in 1987.
1986 Annual Report 99

State narratives
The work of the Task Force has resulted in an expanded role for SAC as the focal
point for policy analysis and research activities in the Stale's criminal justice system. This expansion occurred primarily
in two areas. The first was the passage of the Comprehensive Correctional Planning Coordination Act of 1986. The functions of
SAC under this act include-
• reporting the status of Stale and local correctional facilities and programs to the
Governor and legislature on an annual
basis • conducting needs analyses for all Stale and local correctional facllity construction projects where State funds are involved .. presenting policy impact statements on
each major proposed chaTl;)e to correctionallaw
• maintaining prison population forecasts fc:r all State and local correctional institutions, as well as probation :and parole
caseloads
• evaluating the cost and effectiveness of all correctional programs approved by the legislature on an experimental basis.
SAC is currently engaged in a broad range of activities to carry out the provision of the
act.
The second major expansion of the SAC role resulting from Task Force initiatives is in the area of sentencing. SAC is currently
working with the law Institute of the Louisiana State University law Center in an examination and possible restructuring
of the entire sentencing system in louisiana SAC is responsible for the empirical research and policy analysis aspects of the
100 Bureau of Justice Stab"stics
project, while the law Institute handles the
legal research and reporting responsibilities. The goal of the project is to create proposals for legislative considera
tion which would result in a theoretically consistent and responsive sanctioning syslem for the State.
In addition 10 these projects, SAC is engaged in a number of other activities deSigned to support criminal justice pol
icymaking and operations in the Stale. Among these are-
• development and maintenance of criminal justice policy simulation models to improve the information available to decisionmakers relative to the potential impact
of existing and proposed criminal justice policies
• development of risle assessment technologies to support the decisionmaking process Cif the Louisiana Board of Parole
II provision of technical assistance to State and local criminal justice agencies in the areas of policy analysis. planning, evaluation, and information systems II Ciperation :and maintenance of the Parish Prison Information System
II development of a comprehensive infor
mation and analysis system to support activities of the Peace Olficers Standards and Training Council
• implementation of an active research agenda responsive to the policy concerns of the State's .:hie! criminal justice pol
icymakers; the 1987 research agenda will focus on prison overcrowding, juvenile justice, and drug control
II creation and operation of the Bureau of Criminal Justice Information in conjunction with the Louisiana S.'1erlff's Association.

The goal of each of these activities is to bring advanced analytical technologies to bear on the problems of criminal justice in
the State and to promote the use of empirical information in decisionmaking at all levels.
Maine
The Maine Criminal Justice Data Center has been active in the planning and implementation of the Department ot Cor
rections' Management Information System.
Once completed, this system will provide the criminal justice community the critically needed corrections and probation informa
tion on which to base its decisions (judicial. presentence, erc.}. The cormctional information system will include all the items
from Ihe National Corre<:tions Reporting Program as welf as correctional items thai are rettuired and desirabre from the Offender-Based Transaction Statistics program.
The Data Center has updated its Directory of criminal justice practitioners in Maine and ils Juvenile crime data book this year: This past year the Data Center has provided technical assistance to several committees.
Rnafly. the Data Center has worked closely with the Uniform Crime Reports Division of the Department of Public Safety in the
publication of their annual Crime in Maine book.. We have been involved with this pUblication since 1975. The Data Centeris finishing an extensive document that uses
UCR data to portray the 5-year crime patterns for the Stale. The data wi!! be broken down by county and municipality.
1986 Annual Report 101
State m:rratives
Maryland
In fiscal 1986, the Maryland Justice Analy
sis Center (MJAC) focused its attention on development of an audit for our criminal justice information system (CJIS). The Maryland CJIS Adviwry Board has long
noted the absence of any audit of CJIS. The Governor and Governor-elect have established the improvement of CJIS as
one of the highest priorities for State criminal justice funding.
During fiscal 1986, the MJAC in conjunction with representatives from the executive
and judicial branches designed a procedure to develop an audit process and secured initial funding from the Maryland General Assembly to develop and test the
audit. A contractor has just been selected and the audit development should begin by
the end of this month. The MJAC is responsible for directing this effort. When completed this project will represent the first comprehensive audit by an independ
ent agency of a State criminal justice information system and will produce a
model audit process.
102 Bureau of Justice Statistics
Massachusetts
The Massachusetts Statistical Analysis
Center (SAC) is organizationally within the
Committee on Criminal Justice, an agency in the Secretariat of Public Safety.
The SAC acts as a statistical resource to
the Executive Branch in general but responds to inquiries from the legislature, press, and public.
The SAC sees itself as having four specific roles: o to respond to the criminal justice data and analysis needs of the Executive Office
and the Governor • to gather, summarize, and publish monthly abstracts of significant criminal justice reports frOll'1 a variety of sources • to conduct research of importance for
the Commonwealth II as a facilitator between outside researchers (typically, academic) and government agencies.
In 1986, the SAC embarked on a number of projects. With support of the Bureau of Justice Statistics, it has begun an examina
tion of "Police Response to Domestic Violence," examining a sample of Mas
sachusetts' police agencies to determine
the nature and extent of calls for service in this area.
As a resource in the area of data analysis,
research methodology, and statistics, the SAC has been called upon by a number of State agencies to advise them on pro
posed research projects.
-----------~~~
The SAC has continued to put out a monthly Brief of important research findings gathered from a variety of sources,
This is distributed to members of the Governor's Statewide Anti-Crime Council (ACC), The SAC also has begun to
compile biweekly abstracts of the reports and publications received for distribution to members of the ACC staff and other
criminal justice planners in State
government.
In response to the proposed BJS/FBI redesign of the Uniform Crime Reporting
system, the SAC has become deeply involved in creating an incident-based reporting system within the Commonwealth. The SAC has been designated as the agency that will be in charge of implement
ing these changes. In addition, the SAC will become involved in the analysis and
interpretation of UCR data in future years.
Michigan
The Michigan Statistical Analysis Center (SAC) is an element of the Office of
Criminal Justice in the Department of Management and Budget. This year the
SAC again received a large number of requests for data and for graphic presentation of data. In all cases the SAC re
sponded with the most recent information available.
The most frequently used sources are
Michigan's Uniform Crime Report, the Department of Corrections' Annual Statistical Summary, lhe Supreme Court Administrator's Office, and the Office of Criminal
Justice Juvenile Justice Detention Data Base which now contains data for 1982 through 1986. The SAC is adding 1981 data.
The SAC computer manages accounting and generates fiscal management reports for the following programs using modifiod SIGMA software: Justice Assistance, Juve
nile Justice. JJ Reversion, Justice Training (State). Secondary Road Patrol (State), Victims' Rights (State), ana Victims of
Crime Act.
The SAC Program Analysis for the Sec
ondary Road Patrol Program was included
in its annual report.
1986 Annual Report 103
--State narratives
Minnesota
The goa! of the Minnesota Statistical Analysis Center (SAC) is to provide State and local governments with data and information resources for inlormed criminal justice decisionmaking. During fiscal 1986 the SAC, which is part of the State Planning Agency, accomplished the following:
Minnesota 2010. The SAC completed forecasting the future of criminal justice in Minnesota through the year 2010. ThiS major study identifies counties and cities likely to have especially lar Je "rime increases. The forecasts will :'!"p the State plan for future service and institution needs.
Juvenile court '1984. The SAC completed the annual analysis of Minnesota's juvenile court that examined dispositions, legal representation of juveniles, and referencing of juveniles to adult court. Data are provided to each county on its juvenile court activity.
Adult felony court 1984. The SAC exam. Ined trends in felony case proceSSing and provided each county with data on its felony court activity.
Sentencing effectiveness in Minnesota. The SAC began a complex research project on the impact of sentencing on criminal careers.
Legislation. The SAC followed judicial legislation on behalf of the Governor's office.
104 Bureau of Justice Statist/cs
Information services. The SAC responded to requests for over 17,000 SAC publications, analyses, and library materials.
Cooperative exchange with BJS. The SAC provided a computer tape of annual State felony court case processing.
- -
Mississippi
The Mississippi Statistical Analysis Center (SAC) is a function of the Governor's Office of Criminal Justice Planning. SAC serves as a clearinghouse for criminal justice information and statistics in the State. To assist in this activity, SAC maintains a file of statistical reports, criminal justice newsletters, and other publications from numerous Federal and Slate agencies in addition to nongovernmental sources. SAC also attempts to maintain a current list of names, addresses, and telephone numbers of various criminal justice sources in order to refer inquiries to the most appropriate parties.
The SAC also provides analytical support for the Office of Criminal Justice Planning and the Board on Law Enforcement Officer Standards and Training. Assistance in data collection and analysis, needs assessment, and task analysis have been provided on a regular basis.
The SAC annually publishes Crime in Mississippi. which presents a variety 01 crime statistics for the Stale. In addition. SAC also publishes a quarterly newsletter focusing on the individual components of the criminal justice system. Surveys conducted throughout the year provide the basic information for the newsletter. Much of this data is not readily available from any other single source in the State. It is therefore believed that the publication can be beneficial as well as informative to administrators. planners, and researchers throughout the criminal justice community.
L~ _________________ _
In conducting its activities, SAC tries to maintain a close working relationship with the Bureau of Justice Statistics, many national criminal justice associations, and State and local agencies.
1986 Annual Report 105
State narratives
Missouri
The Missouri Statistical Analysis Center (SAC) is a unit of the Missouri State Highway Patrol under the Department of Public Safety and was designed to provide research and information services in the areas of traffic safety and criminal justice.
The following are major accomplishments 01 the SAC from October 1, 1985, through September 30, 1986: 4J developed and published a set of standard reports to assist public officials in identifying traffic safety and criminal justice problems that confront the State. During this time, the SAC produced and disseminated the following major publications to Federal, State, and local authorities: 1984 Missouri crime and arrest digest; 1984 Missouri law enforcement employment and assault report; Traffic accident trends: 1975-1985 • completed a research project designed to provide criminal justice authorities with information on missing children and adults in the State. Results of this research were documented in "Missing persons report: 1984 Active cases from the statewide MULES system." In addition, a series of statistical programs were developed which access the Missouri Uniform Law Enforcement System (MULES) and produce reports deSigned to monitor and evaluate, on an ongoing basis, the State's missing Children and adult problem
106 Bureau of Justice Statistics
o processed 331 traffic safety and criminal Justice-related requests for studies, reports, and SAC library publications for Federal, State, and local authorities. Criminal justice-related studies included analysis of crime, arrest, and other criminal justice data \0 assist in evaluation of proposed legislation. Studies also were completed to assist criminal justice authorities in the development of internal policies and programs to increase their capabilities for addressing Missouri's traffic safety and crime problems.

-- -----.------
Montana
Administration
The Statistical Analysis Center (SAC) is part of the Crime Control Division. Montana Department of Justice. The overall responsibility of the Crime Control Division. aside from administering Federal grants. is to provide centralized technical assistance and aid to all elements of the criminal justice system.
The mission statement adopted by the Board of Crime Control provides a summary outline of the Crime Control Division's role: "To promote public safety by strengthening the coordination and performance of both the criminal and juvenile justice system and by increasing citizen and public official support and involvement in criminal justice:'
SAC goal
The goal of the Statistical Analysis Center which complements the board's goal is "to provide base data and statistics to improve the administration. efficiency, and effectiveness of juvenile and criminal justice agencies:'
Jails
The SAC has been involved in a comprehensive jail program over the past year which has involved new legislation for the administration and operation of jails, and, through the Montana Uniform Crime Reporting program. data are being collected on jail activities.
The jail legislation is aimed at a modern view of jail administration. Most existing laws relating to jails were passed in the late 1800's and many still had the antiquated philosophy embedded within them. The objective is to get the 1987 Legislature to review and enact the modern version. However, it appears that it will be 1989 before the task can be completed. Thus the efforts of the board, commission staff, and the SAC will be aimed first at 1987, but if an appropriate redraft of current statutes is net possible the work will continue until 1989.
Montana Uniform Crime Reporting (MUGR)
SAC is responsible for the administration of the MUCR program. Montana operates this system as an incident-based reporting system and as of July 1986, the system includes data on jail activities. This component is primarily capturing admission and release data per incident or arrest.
Police Officers Standards
and Training (POST)
The pas r program has developed a
microcomputer file of all training taking place throughout the State. profiling individual training by officer. A r.c:ilfJiete record of the officer's training is now available for present and future certification. Personnel placement will be enhanced through use of this system.
1986 Annual Report 107

'" State narratives
Criminal justice technical assistance
The Board of Crime Control Staff, utilizing a BJS grant, is providing statewide technical assistance to law enforcement. The assistance is targeting consolidation is'sues, new facility plans, record systems, and administrative and operational issues. So far the program, although relatively new, has met with a high degree of success and acceptance at the local law enforcement level.
Juvenile Probation Information System (JPIS)
Within the juvenile justice system, one of the major efforts of the Crime Control Staff has been in relation to the JPIS which is an activity-recording system for Montana's Youth Court.
JPIS historically has been run on a mainirame computer at the State level with individual records from 20 judicial districts being keypunched and processed by the State, The new direction for the JPIS is to become a microcomputer-based information system which will be operated at the local level with statistical information being provided to the State via computer modem or diskette. The local agencies will have a viable tool to work with. The State will still have the necessary data to do statewide planning. The components will include case management, summary statistics, and a restitution accounting system. Six judicial districts will be initiating this effort during early 1987.
108 Bureau of Justice Statistics
Juvenile justice training
During mid-1986, the Board of Crime Control initiated a statewide coordinated Juvenile Justice Training program. This effort began with a needs assessment by State and local juvenile justice personnel. The State training coordinator developed various goals and objectives to meet perc(:lived needs and established training programs in response.
...
The long-term goal is to develop and maintain ongoing training criteria for each professional group involved in the program.

-
Nebraska
The Nebraska Commission on Law Enforcement and Criminal Justice performs several functions in the State: included in these is the operation of the Statistical Analysis Center (SAC). The Nebraska SAC responds to data requests, provides technical support to local law enforcement agencies, and collects and disseminates data related to the criminal justir::e system.
Offender-based transaction statistics (08TS)
The OBTS program tracks a felony otfender through the Nebraska criminal justice system. This program aims to fulfill the urgent need for comprehensive and detailed information about what happens between arrest and final disposition. An OBTS record consists of selected facts aboul
. an arrested offender and the actions taken by the police, prosecutors. and c0IJris. The sum of Ihese activities for all adult Offenders handled by the States can provide a natiC'nal, as well as a statewide, description of the administration of adult criminal justice in terms of the flow of offenders through the system and the time intervals between various events.
Jail population report
In conjunction with the Jail Standards Division, the SAC began production 01 an annual report on jail population. ThlJ 1985 Nebraska Jail Population Report presents data on persons held in Nebraska city and county jails in 1985. All jails in Nebraska except for the Omaha City ,Jail, Douglas County Corrections, and Lancaster County Corrections are represented in this report.
The data from local jails provide detailed statistics on the flow of inmates through the jails and demographic characteristics of those confined. The data cover jail use on both a statewide and local level. Readers should keep in mind, however, that the inmates held in Oouglas and Lancaster Counties represent almost half the lotal number of inmates confined in Nebraska jails at any given time. Because they ate not included in this report, the statewide statistics reflect only the characteristics of the jail population outside these metropolitan areas.
Juvenile court report
The flow of juveniles Ihrough the judicial system is documented in the 1985 Juvenile court report, which summarizes data reported to the SAC for the 5,974 cases reaching disposition in 1985. For each case, the courts submit a form describing reasons for and sources of referral, processing lime, demographics, and related information. This allows the courts and others to compare juvenile disposition data statewide as well as by county.
Stun gun use irf Nebraska
With the growing use and availability of sturl guns, it was deSired to determine the use of and attitudes toward th6m by law enforcement agencies operating in Nebraska. This report details results 01 a survey distributed statewide.
1986 Annual Report 109
State narratives
It reports which agencies used stun guns in what situations (training, jail use) and addresses concerns such as medical and legal consequences that have either been cause for not using stun guns or for a desire for standards for their use.
Criminal justice directory
The SAC obtained all information needed to complete a 1986 Criminal Justice Directory. The directory includes all agencies related to the criminal justice system.
Names, addresses, and phone numbers are given for each entry. The directory is divided into six categories: • law enforcement • courts/adjudication • corrections 1& education • miscellaneous • State agencies.
Crime Commission neVis/etter
A monthly newsletter is published and sent to 640 agencies/persons related to the criminal justice system.
The newsletter features aspect., of the commission inciliding-• availability of films from the film library • monthly publication features of the clearInghouse library • Federal/Slate grant information • inservice jail bulletin, and much more.
110 Bureau of Justice Statistics
Computer assistance
The SAC gives computer assistance to law enforcement agencies upon request. Such assistance ranges from simple to complex systems, including software and hardware applications.
With the new automation systems available and with the scarcity of personnel in law enforcement agencies (especially In rural areas), a great deal of technical assistance is needed to help small agencies become familiar with the computer world.
New Hampshire
The New Hampshire Statistical Analysis Center (SAC) continues to be involved with the OHice of the New Hampshire Attorney General in implementing the comprehensive Crime Control Act of 1984. In March 1985, the Governor designated the Office of the Attorney General as the responsible agency for administering the act. This also applies to grant funds for fiscal 1986 for which the subgrantees have also been selected.
In addition the oHice was selected as the administrating agency by the Governor of New Hampshire for the Anti-Drug Abuse Act of 1986.
During the past reporting period the New Hampshire Statistical Analysis Center published Sentencing by the prosecutor: An overview of an alternative sentencing practice.
SAC undertook a detailed study of the role of the prosecutor in West Germany. The specific area of concentration was the prosecutor's role in "penal orders" and the "conditional suspension of prosecution:' This system of alleviating the judicial system of minor offenses was examined for its applicability to New Hampshire. Though this study presented some constitutional problems, it was felt that some form of an adaptation of the West German model was possible. Also examined, though not in as great detail, was the use of "master" and "judicial adjuncts:' These two options are regarded in aiding the relief of judicial backlogs.
I ____ ~_~--
On a closer examination, this program is both etficient and cost effective. The main change that would have to occur would be in the area of philosophy where the emphasiS on rehabilitation of the offender would have to be replaced by retribution in minor property offenses. It would seem that this philosophy is currently undergoing such a change.
1986 Annual Report 111
State narrativ.:ls
New York
The New York State Division of Criminal Justice Services (DCJS) has broad responsibility in criminal justice matters. Its central mission is to increase the overall effectiveness of the system of criminal justice in New York State. This is accomplished through the-e Office of Identification and Data Systems, which maintains crirninal-history records on offenders and other operatioroal data systems e Bureau for Municipal Police, which provides training to police officers and coordinates programs on highway safety, crime prevention, and arson awareness • Office of Funding and Program Assistance, w'hich monitors and evaluates local criminal justice programs and disburses Stafe and Federal funds to localities on behalf of the Crime Control Planning Board:
The fourth major unit in DCJS is the Office of Policy Analysis, Research and Statistical Services (OPARSS). This unit is the policyoriented research and statistical arm of the agency and performs many of the functions of the statistical analysis center for New York State.
112 Bureau of Justice ,Statistics
The mission of OPARSS is to advise and assist the Governor and the cabinet-level Director of Criminal Justice in developing pOlicies, plans, and programs for improving the criminal justice system. It conducts empirical research to test assumptions that are central to the development of criminal justice policy, provides policy analysis, and monitors the legislative process. OPARSS also is respt1sible for designing, maintaining, and coordinating statistical data systems In the agency and for disseminating statistical information on crime, offenders, criminal justice system processing, and the administration of justice in New York State.
During the past year, the office continued to address the needs of the Governor and Executive-level government officials through production of the Govtlrnor's briefing book. The briefing book provides a comprehensive assessment of criminal justice issues and county-based statistics in New York State. Statistical information for this project was generated through the office's county-based "Profiles" data base, The office has also continued to address the needs of local and State government officials through the updating of Direotory of oriminal justioe agencies. These publications provide State and local officials and administrators with comprehensive information resources for their work.
L-_____________________ ----
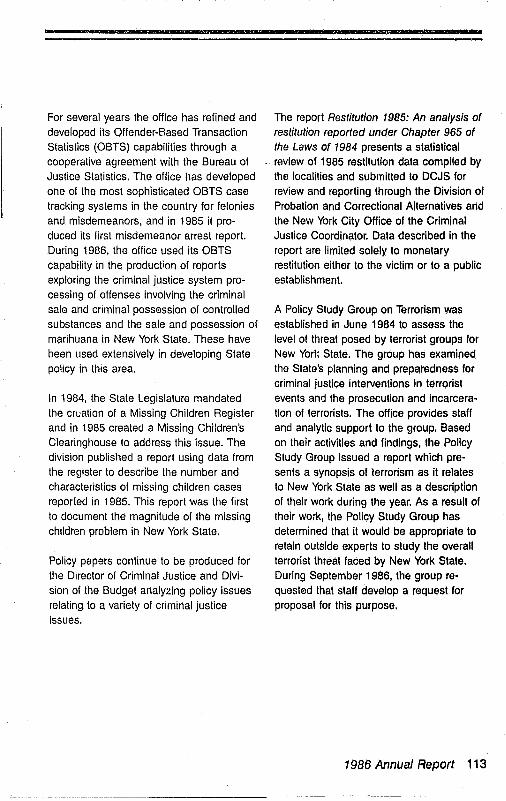
For several years the office has refined and developed its Offender-Based Transaction Statistics (OBTS) capabilities through a cooperative agreement with the Bureau of Justice Statistics. The office has developed one of the most sophisticated OBTS case tracking systems in the country for felonies and misdemeanors. and in 1985 it produced its first misdemeanor arrest report. During 1986. the office used its OBTS capability in the production of reports exploring the criminal justice system processing of offenses involving the criminal sale and criminal possession of controlled sUbstances and the sale and possession of marihuana in New York State. These have been used extensively in developing State policy in this area.
In 1984. the State Legislature mandated the cruation of a Missing Children Register and in 1985 created a Missing Children's Clearinghouse to address this issue. The division published a report using data from the register to describe the number and characteristics of missing children cases reported in 1985. This report was the first to document the magnitude of the missing children problem in New York State.
Policy papers continue to be produced for the Director of Criminal Justice and Division of the Budget analyzing policy issues relating to a variety of criminal justice issues.
~~ -----~---------
RMIG
The report Restitution 1985: An analysis of restitution reported under Chapter 965 of the Laws of 1984 presents a statistical review of 1985 restitution data complied by the localities and submitted to DCJS for review and reporting through the Division of Probation and Correctional Alternatives and the New York City Office of the Criminal Justice Coordinator, Data described in the report are limited solely to monetary restitution either to the victim or to a public establishment.
A Policy Study Group on Terrorism was established In June 1984 to assess the level of threat posed by terrorist groups fot New York State, The group has examined the State's planning and preparedness for criminal justice interventions in terrorist events and the prosecution and incarceration of terrorists. The office provides staff and analytic supporl to the group. Based on their activities and findings. the Policy Study Group issued a report Which presents a synopsis of terrorism as it relates to New York State as well as a description of their work during the year. As a result of their work, the Policy Study Group has determined that it would be appropriate to retain outside experts to study the overall terrorist threat faced by New York State. During September 1986, the group requested Ihat slaff develop a request for proposal for this purpose.
1986 Annual Report 113
r----I
State narratives
Public concern with the incidence of crime and the handling of criminal offenders has led to greater public criminal justice expenditure in order to more effectively deal with specific: crime-related issues. In response, OPARSS continues to produce the New York Staie criminal justice expenditures report, which identifies criminal justica expenditures throughout New York State for all county, city, town, and village governments. This report provides the impetus for the effective and efficient allocation of public dollars in criminal justice appropriations.
The 1970's revea.led a great deal of change in New York State, especially with regard to crime and the administration of justice. The report titled, Demographically disaggregated male felony arrest trends: New York Stala (1970-1984) describes how adult male felony arrests changed dUring this volatile period,
The issue of crimes against the elderly has been a mailer of serious concern to citizens and their elected representatives. For a number of years New York State has been a leader in developing programs to meet the needs of the elderly in tile area of crime. DCJS has been actively involved in addressing this problem. The criminal victimization of older New Yorkers report attempts to describe many of the programs that State agenCies and localities lIave undertaken. Statistical information on the frequency and severity of crimes against the elderly is also presented.
114 Bureau of Justice Statistics
North Carolina
The North Carolina Criminal Justice Analysis Center is within the Governor's Crime Commission Division of the Department of Crime Control and Public Safety. It provides analysis and research assistance to the Crime Commission as it develops crimina! jUstice policy recommendations fer the Department Secretary and the Governor. It also serves as a primary resource for data and information on crime and the criminal justice system in North Carolina.
During Federal fiscal year 1986, the Analysis Center worked with the Sentencing Committee of the Governor's Crime Commission in its study of sentencing practices and punishment alternatives in North Carolina. The committee ~ddressed the perceived lack of credibility and integrity in our determinant sentencing structure expressed by members of the judiciary. The Analysis Center presented information to the committee on the 10-year trend in sentence lengths and actual Ume served and the impact on such of determinant sentencing which was enacted in 1981. The data indicated that the Fair Sentencing Act of 1981 had in fact significantly reduced disparity or variance in both sentence lengths and time served but had also reduc.~d the average sentence and percent of time served. The Analysis Center drafted recommendations for the Sentencing Committee and then assisted in organizing and holding public hearings across the State to solicit input on the sentencing proposals. A final report is being drafted and will be presented to the Governor In January as part of the Crime Commission's 1987 Legislative Agenda.
I !-
=
During the past year, the Analysis Center also assisted the Victim and Justice Services Divi~ion in the automation and analysis of it~ court-ordered community service records. These records include information on over 50,000 defendants who have been sentenced to perform community service for a variety of offenses since 1983. The analysis of these records has also benefited the Sentencing Committee in its assessment of punishment alternatives in the State.
The Analysis Center has been working with both the Victims Committee and the Juvenile Justice Committee of the Crime Commission in the research and analysis of pertinent issues. Results from a statewide victimization survey are currently being reviewt:'d and examined for possible inclusion in the Legislative Agenda to support funding of a victims compensation bill. A research bulletin, developed by the Analysis Cent0r from the results of its Chronic Status Offender survey, was presented to select committees in the General Assembly that were considering a proposal to expand juvenile judges' authority over such offenders.
The Analysis Center will be working with the General Assembly during the 1987 session to respond to any requests for information or impact projections relating to legislation proposed by the Governor's Crime Commission
North Dakota
The North Dakota Statistical AnGllysis Center (SAC) is part of the Criminal Justice Training and Statistics Division (CJTS) of the Attomey General's Office. The division provides training for law enforcement officers and serves as a statistical analysis center and clearinghouse for criminal justice information.
The SAC manages the State Uniform Crime Reporting (UCR) Program, which collects crime statistics from all county sheriff's departments and all cities with 2,500 or greater population. The SAC analyzes the statistics and forwards them monthly to the FBI for national statistical summaries. The SAC publishes annual reports including the overview Crime in North Dakota and more specific analyses of arson, arrests for drug offenses, homicides, and law enforcement officers assaulted. Other reports are compiled and published in response to requests for specific analysis of UCR data.
A unique correctional information system, or Jail Information System (JIS) as it is called, was designed and implemented in tile State in 1977. The SAC also mar.ages this system through Which data are collected on all incarcerations in the 44 local correctional facilities in North Dakota. This system enables the SAC to monitor the nature and extent of the use of all the State's lecal jails. Data from this system are used to recommend staffing plans and advise in budget preparation, and they have been extremely useful in planning for remodeling old jail structures and construction of new ones. This system is a
1986 Annual Report 115
State narratives
very accurate tool in monitoring the detention of juveniles and incarceration of DUI offenders, two important issues in the State and across the country.
Annual reports are published on jail usage. A special report with emphasis on juvenile detentions in local jails and detention centers is prepared and circulated to all correctional facilities, judges, and other interested persons.
A Manpower and Training information System (MTIS), which maintains employment and training records for all law enforcement officers in the State, is operated by the CJTS Division. This system has been deSigned to monitor compliance with peace officer certification standards and annual sidearm certification requirements. Recent changes to computer programs will provide the SAC with a data base on officer demographics and training that should lend itself to extensive analysis of the law enforcement profession. The system. in generai. coordinates very closely with peace officer training programs \0 contribute to tho increasing professionalism of law enforcement in North Dakotc:.
The SAC periodically undertakes special research projects to address current relevant issues. One project in 1986 focused on the relative impact 01 suspended portions of sentences. good time. and parole board decisions on actual time served on prison sentences. Because these kinds of proj~cts can absorb a considerable amount of limited stall time. the SAC encourages cooperative endeavors with independent researchers. university faculty and students. and with local college intern programs.
116 Bureau of Justice Statistics
Because of the SAC's close involvement in criminal justice information systems, the SAC Director has initiated an Attorney General-appointed Justice Records Advisory Committee, coordinates and promotes efforts to establish an "integrated justice system," advocates the evolution of Offender-Based Transaction Statistics (OBTS), and encourages use of the SAC as a clearinghouse for information on automated justice records systems.
The SAC Director also has been appointed by the Attorney General to be the project manager on a project to automate the criminal-history records maintained by the Bureau of Criminal Investigation.

Ohio
Ohio's statistical analysis center (SAC) is the Bureau of Research and Statistics in the Governor's Office of Criminal Justice Services. Since being reorganized in June 1978, the SAC has undertaken a dozen major research projects, produced 30 reports, and responded to more than 1,500 requests for Information. Currently, the SAC operates with a full-time staff of four, with frequent use of interns often bringing that number to five.
Uniform Crime Report (UCR) data
The SAC continues to be the sole repository of statewide crime data in Ohio. The most recent Ohio Uniform Crime Report data (1985), received annually from the FBI, contain county-by-county crime and arrest displays for 457 Ohio law enfor.;ement agencies. In September 1986, the SAC began briefing law enforcement officialS about the potential impact of thcl revised UCR program.
Offender-based tracking stal/stics'
The SAC is the only agency that collects and analyzes information that fully describes what happens to persons arrested for serious crimes in Ohio. This process started with a 2.500-felony case tracking study by the SAC in 1983-84 in 62 criminal courts throughout the State. A smaller (2,OOO-case) followup study began in May 1986 and will be completed in mid·1987. Rigid sampling procedures ensure that the Cases are representative of the 50,000 to 60,000 such cases handled each year. Each year. the SAC also coordinates the production of a 3.000 + case computer
tape from the Computerized Criminal Histo,ries file, maintained by the Attorney General. for inclusion in the national tracking study administered by the U.S. Bureau of Justice Statistics. (In September 1986. SAC began an effort to increase dispositio.lal reporting within this program.)
Public opinion/attitude survey
The fifth SAC survey of Ohio citizen attitudes toward crime and criminal justice was conducted in September 1986. The scientific telephone poll of 1,000 Ohio residents address~d a wide range, of critical issues including fear of crime, juveniie gangs. family violence, hOf!leless people( drugs and-predominantly-juvenilejus- . tice. A final report is expected,before spring 1987.
Ohio victimization data
SAC is the repository for Ohio victimiz~tion dala collected via the National Crime Survey sponsored by the U.S. Bureau of Justice Statistics (and executed by the u.s. Bureau of the Census). During Federal fiscal year 1986 hundreds of 1984 data tables were received, ref/ecting responses from 15,000 Ohioans in 7,000 households, and providing a rich supply of data on victim reporting patterns. physical and maleriallosses. measures of self-defense, personal characteristics, and many other issues relative to the criminal event from the victim's perspective.
SuiCides in Ohio'sjai/s and prisoris
Using Department of Health statistic~ 'a'nd dec'.h certificates, the SAC is analyzing~'
.., "
1986 Annual RepM 117
MW
State narratives
some 250 inmate suicides committed during the past 10 years. Of special interest are any correlates (such as arrest offense, drug/alcohol involvement, age of arrestee, and prior criminal history) that might help corrections officials identify high-risk inmates at the front end of their detention.
"State of crime and criminal justice in Ohio'"
Ohio is currently receiving BJS funds to become one of the Nation's first two States to develop this comprehensive report on crime and justice at the state level, an emulation of the BJS Report to the nation on crime and justice of 3 years ago. It has taken Ohio's SAC 8 years to gather the full range of criminal justice system data necessary to support this type of demanding document. The resulting publication (winter/spring 1987) will be the first of its kind attempted in this State. It is anticipated that it will serve as both a textbook and resource book for all major criminal justice issues in Ohio. DUring Federal fiscal year 1986, SAC completed 311 nine chapters and put the document into final layout form.
Law enforcement management systems'
This project analyzed operational, administrative, and crime report data in more than 100 Ohio law enforcement agencies. It has been structured to provide relevant feedback to chiefs and sheriffs about the operations of agencies similar to their own in size and jurisdictional environment. The project's final report was published in May 1986 and mailed to all participating law enforcement agencies.
118 Bureau of Justice Statistics
Law enforcement training policy research'
The past year has seen the revising of Ohio's radically upgraded entry-level training curriculum by the Ohio Peace Training Council. The dramatic changes in the basic training curriculum were triggered by SAC's massive Law Enforcement Task Analysis Study 4 years ago. Henceforth, all entrylevel law enforcement officers in Ohio will receive upwards of 500 hours of basic training. almost double the 292 hours previously required. The SAC invested 2 1/2 years on the Task Analysis Study, gathering more than 4 million pieces of data from 3,500 officers in 400 agencies, a task greatly aided by a grant from BJS. The first recruit class to be trained under the reVised new curriculum is tentatively scheduled for spring 1987.
'Oenotes projects dlreclly supported by grants from Ihe Bureau 01 Justice Stabstlcs.
Oklahoma
During fiscal 1986, the Oklahoma SAC continued to maintain the Arrest Disposition Reporting System (ADRS). • This 10-year old data base contains information on charges filed by district attorneys and the dispositions of those cases. • Monthly and annual summaries of the data are produced for each DA district and the State. • A cross-reference report tells the district attorneys if a person they have filed charges against has charges pending in another county. CI The unit also has responsibility for printing and distributing numbered fingerprint cards to sheriffs and police so that cases can be tracked through the system. e Larger counties with their own information systems contribute to ADRS by supplying data via magnetic tape each month. • Other offices complete forms keyed into the system by SAC staff. e Inquiries of the system are possible by use of microfiche that is distributed monthly, by terminals in larger district offices, and by phone to the ADRS office.
The Oklahoma SAC is unique because the primary data collection and compilation funciions (ADRS) are in one agency, the Oklahoma State Sureau of Investigation (OSSI), and the SAC representative is located in the Planning and Research unit of the Department of Corrections (DOC). • This arrangement has fostered considerable interagency cooperation. Sy transferring tapes of ADRS data to DOC, a report is generated that notifies probation and parole offices of new charges filed against their clients anywhere In the State.
• A similar sharing of data is the basis for the evaluation of the DOC programs, including House Arrest, a communitybased inmate program. Terminals at DOC that are linked to ADRS are used to enter confinement data and make inquiries. OSSI and DOC staff also cooperate to share data with other law enforcement agencies. Reports of community placements and discharges are sent to the Oklahoma City Police Department (OCPD) in the State's largest metropolitan area. Plans are underway to use microcomputers at OCPD to permit direct inquiries of criminal-history information in ADRS and DOC files.
Another project in which ADRS and DOC data are being shared is the development of a prison population projection model. With the help of a SJS grant, the State has contracted with the National Council on Crime and Delinquency to develop a projection model with which legislators can see the impact of proposed law changes. SAC staff are also working with UCR field staff within OSSI to develop a training procedure for sheriffs and police to ensure proper completion and processing of fingerprint cards.
1986 Annual Report 119
I ~
bm
State narratives
Oregon
The Crime Analysis Center is part 01 the Oregon Department of Justice and serves as the chief research agency for inquiry into criminal justice issues in Oregon. The center currently has fopr authorized professional/technical staff ~ Jsitions whose purpose is to assist State and local criminal justice system pollcymakers and the public through their products and services. The continUing goal of the center is to be an objective, independent. and competent source of policy-relevant criminal justice research data and information. The center also has direct ties to the Bureau of Justice Statistics (BJS) of the U.S. Department of Justice and serves as a Statistical Analysis Center and clearinghouse for criminal justice research efforts involving State and Federal coordination. In addition to its research activities, the center also administers the Justice Assistance Act Block Grant Program in Oregon.
The primary functions of the center are to-o collect, analyze. and interpret criminal justice data • develop and maintain the collection of selected criminal justice data • prepare and disseminate research reports on crime, criminal offenders, and the operations of the criminal justice system 11 help to maintain and improve the quality of data in established criminal justice data bases within the State • provide technical assistance related to data analysis. statistical procedures. and criminal justice research to State and local agencies
120 Bureau of Justice Statistics
-
11 serve as an information center and repository for the dissemination of criminal justice data and documents to government agencies and the public • provide Oregon data to the Bureau of Justice Statistics.
Major products and services of the center included the following:
Oregon Serious Grime Survey
This is an annual survey research project involVing use of a mail questionnaire Which is filled out and returned by approximately 80% of the 1,500 randomly selected citizens who receive it. The survey provides statewide information in three topical areas: • victimization data including costs (losses) and a measure of citizens' reporting and nonreporting of crime to police • citizens' involvement in crime prevention activities • citizens' opinions about current criminal justice problems and issues.
The victimization data provide a more complete measure of certain crimes occurring in Oregon and augment understanding 01 crime beyond that attainable from official statistics only. This year's survey represents the ninth survey and is the oldest data base maintained by the center. Results are distributed to legislators and other elected oHicials, criminal justice agencies, other government officials. representatives of ihe media, and to private citizens on request. In recent years, the survey has been an important source of information on citizen opinions on such issues as jail and prison construction and such community problems as dealing with child abuse, "remanding"
juveniles to adult courts, prioritizing law enforcement services, and treating firsttime offenders.
Prison populatfon forecasts
The center staff has developed short-range (1- and 2-year) forecasts of prison and field populations for use by the Corrections Division, along with the Executive and Legislative branches. The forecasts are used in developing service needs (primarily prison bed space requirements).
Study of traffic and non traffic offenders incarcerated in and released from Oregon corrections institutions
This report profiles the post-prison experience and criminal histories of incarcerated traffic and non traffic offenders who were recently released from Oregon correction institutions. The research underlying this report was based on data ob,ained on a cohort of 2,857 individuals relilased from Oregon prisons in 1980 and 1\)81. Of these 2,587 releasees, the report focuses on the subgroup of 205 defined as traffic offenders. These were individuals for whom the most serious prison admission offense was traffic or driVing-related (Le., primarily driving while on a suspended or revoked iicense).
To augment the initial research based on Corrections Division data, computerized criminal-history (CCH or "rap sheet") data were obtained on traffic offender releasees and a representative group of all nonlraffic offender releasees.
Survey of juvenile court wards and their service needs
The center staff has completed the first phase of a major statewide survey of the service needs of children in the juvenile courts and Children'S Services Division. The survey was carried out through a contractual arrangement and is the most comprehensive study conducted on this population in recent history.
The initial results of th6 survey have been used by the juvenile courts, Children's Services Division, and the Governor's Task Force on Juvenile Correctional Alternatives, as well as the Executive and Legislative branches. Information provided during the second phase will help in setting priorities and resources for this study population over the next few years.
Currently Federally funded research projects
At present, center staff are engaged in work on four Federally funded research reports. These are as follows: • A Study with Children's Services Division assistance of child abuse as recorded in that agency's automated records. The purpose of this study is to profile the victims and perpetrators of child abuse and 10 study the cause, effect, and dimensions of this problem in Oregon. e A study of the role of county and municipal financial performance in determining criminal justice performance In Oregon counties and cities. This study explores the connection between what counties and cities spend on criminal
1986 Annual Report 121

State narratives
justice services and how their criminal justice systems perform in terms of various performance indicators. • A study of criminal victims and their response to criminal victimization in Oregon. The purpose of this survey is to profile and study the characteristics, circumstances, attitudes, and reactions of crime victims in Oregon. Of special interest is the focus on factors that enhance or retard the ability of current victims of crime to respond to the threat of further victimization and to reduce their chances or risk of being crime victims in the future. The research also includes a study of trends in unreported crime and criminal victimizations as measured by the center's 9-year Serious Crime Survey. Data from this annual survey will greatly enhance and augment the statistical picture of crime in Oregon. Historically, official law enforcement (Uniform Crime Report) data have been the only statewide source of crime data in Oregon. • An analysis of the economic costs of criminal victimization in Oregon. This study focuses on the social and economic cost of crime victimization. The study population consists of applicants receiving services and Gompensation from a special statewide program for the victims of violent crime.
Other current projects
Smaller research projects of the center include a study of the impact of changing State population characteristics on crime Tates and a study of juvenile court detention practices in Oregon.
122 Bureau of Justice Statistics
Technical assistance to State and local agencies
•
Over the years, one of the primary functions of the center has been to provide technical assistance to State and local criminal justice agencies and organizations. The technical assistance is provided in a variety of areas-statistical analyses of criminal justice data; research and program evaluation design; data form and questionnaire design; survey design and sampling strategies; and literature reviews.
Information center and repository for criminal justice data and materials
Another primary service the Center performs is to provide criminal justice data and materials to a wide variety of State and local criminal justice agencies, legislative members, colleges and universities, private organizations, the media, special study groups or advisory boards such as the Governor's Commission on Violent Crime, and the public.
The requests include specific crime and arrest data for a particular county or jurisdiction; statistics on criminal case filings and prison population numbers; and demographic information on various target groups in the criminal justice system. Other requests fall in the general category of which agency or source to contact for specific information.
Focal Center for BJS Data Requests
The center also serves as the primary contact for Oregon data and/or special study requests from the Bureau of Justice Statistics. Some recent requests fulfilled related to an analysis of Oregon data on prison time served compared to sentence lengths, together with recidivism data on prison releasees.
Pennsylvania
The Bureau of Statistics and Policy Research of the Pennsylvania Commission on Crime and Delinquency (PCCD) plays an integral part in the agency's role of examining criminal justice problems and needs, researching and proposing suggested strategies, and assessing the results of these strategies on affected components of the justice system. As the criminal justice Statistical Analysis Center (SAC) for the Commonwealth of Pennsylvania, the bureau conducts analysis of legislative issues concerning criminal justice topics, recently including such topics as sentencing reform, prison overcrowding, and driving under the influence.
The bureau fosters the development of criminal justice policy by conducting research on timely criminal justice matters. Recently ..:ompleted was a report on the deterrent effects of the State's new mandatory sentencing law. The analysis of reported robberies in 1981 and 1984 suggests that mandatory sentencing probably reduced the incidence of gun robberies somewhat below what it would have been without the new law. However, the analysis also suggests that some of this reduction may have shifted to nongun robberies.
Also, a prime objective of the agency is to examine the utility that a variety of criminal justice data bases have for addressing questions of practical and theoretical interest in the criminal justice field. One product of this examination is the recently com-
1986 Annual Report 123
State narratives
pleted Trends and issues in the Pennsylvania criminal justice system. This report describes and analyzes offenders in various stages of the criminal justice system and provides information that helps to evaluate the effects of policy changes.
A final example of the bureau's research efforts is a soon-to-be completed study of the impact of the State's sentencing guidelines. The study is being conducted in cooperation with the Pennsylvania Commission on Sentencing.
The PCCD makes effective use of appointed task forces, advisory groups, and planning committees comprised of commission and noncommission members to assist the agency with advice on how to address and resolve specific criminal justice problems the State is experiencing. The bureau is often involved in coordinating these efforts and conducting analysis and research for the advisory groups. A prime example of this work is the PC CD's Prison and Jail Overcrowding Task Force, which was established to discuss, debate, and put forth proposals to address the Stale's prison and jail crowding problem. Bureau staff assisted the Task Force in developing a report that details the magnitude of the problem and presents recommendations for ils alleviation. Related to this effort, the bureau also has responsibility for the agency's County Jail Overcrowding Technical Assistance Program. Through this program, bureau staff assists counties in analyzing the flow of offenders through their local systems to determine the magnitude, type, and causes of local crowding problems and to implement
124 Bureau of Justice SWtistics
changes to effectively deal with the problem. The bureau also assisted a State Pollce planning committee in studying the feasibility of implementing an Automated Fingerprint Identification System and, in fact, the group has developed a design for such a system in Pennsylvania.
Integral to the bureau's role in criminal justice analysis and coordination is its continuing work toward full implementation of a State Offender-Based Transaction Statistics system (OaTS) and the implementation of an integrated criminal justice information system. OaTS allows any criminal justice agency to determine the status of a criminal without going through various complicated criminal justice data bases and allows the bureau to study the criminal justice system as a whole. The development of an Integrated information system coordinated by the bureau will facilitale slatewide sharing of data among criminal justice agencies to enhance the efficiency of the entire system. OaTS provides the tool for planning, evaluation, and research; the integrated information system will provide on-line, interagency communication capability within the State.
-
Rhode Island
The Rhode Island Statistical Analysis Center (SAC) has been a unit of the Governor's Justice Commission since 1975, Among Its major accomplishments and ongoing services are the following:
Statistical
The SAC produces an annual report on Serious Crime in Rhode Island. This report focuses on the eight most serious crimes and is generally released in May. The SAC also produces many special reports and studies on such important issues as domestic violence, drug abuse, rape, motor vehicle theft, stolen property, female criminality, robbery, juvenile statistics, arson, and clearances by arrests.
Thus, the SAC has become a recognized clearinghouse and authority for much of the public- and private-sectors' needs for criminal justice statistics. Further, the SAC produces press releases and provides radio and television Interviews. In short, the SAC has been able to take complex data and translate them into more understandable terms for the business person and general public.
Information systems
Over the past 11 years, the SAC has been the catalyst agency in Rhode Island for planning, funding, and coordinating modern computerized information systems for the State's criminal justice system. For example, with Federal and State funds, the SAC
has had a direct hand in implementing these statewide computer programs: • the State Police's message switcher (a system that can transfer and receive a vast flow of communications by computer from local and national sources) • the court's Wang computer system (a system installed throughout the entire court system) • a recently installed computer system at the Attorney General's Bureau of Criminal Identification (BCI).
The SAC also acts as resource, coordinator, and liaison for the State's ongoing Criminal Justice Information Systems (CJIS) Subcommittee. Germane to activities of the CJIS Subcommittee, a R.I. Comprehensive Criminal/Juvenile Justice Information Plan Is in the development stage at present.
Governor's Justice Commission liaison/coordination
The SAC unit and the Governor's Justice Commission (GJC) are under the same organizational umbrella, that is, the Governor's Executive Office. As such, the GJC has a major role in developing and implementing criminal justice policy, generally having statewide impact. The SAC is therefore, many times, requested by the GJC to provide statistics and data toward eventual completion of a special report or study.
The GJC has been directly instrumental In bringing about recent policy change through the production of the following documents:
1986 Annual Report 125
W' I
State narratives
Report of the Commission to Study the Juvenile & Adult Probation Systems in Rhode Island
Rhode Island's overcrowded prisons: Recommendations to the Governor from the Task Force on Prison Overcrowding
Criminal sentencing practices: Background information for policy makers
Special Commission to Combat Auto Theft: A report to the Governor and General Assembly
Recommendations of the Juvenile Justice Committee of the Governor's Justice Commission
Fire fighters training and education: Recommendations of the Fire Education and Training and Task Force prepared for the Governor and General Assembly
Fitting the pieces together through juvenile probation: The major findings and recommendations of the Rhode Island Task Force on Juvenile Probation
Governor's Justice Commission's 1985 annual report to the Governor and General Assembly.
All of the preceding documents are available by simply contacting the Rhode Island Governor's Justice Commission. Further, the GJC is active with and coordinating the following Rhode Island-based groups: Probation Task Force, State-National Crime Prevention Act, Youth Advocacy Organization, the Crime and Delinquency Prevention Task Force, and the National Criminal Justice Association (Board of Directors).
126 Bureau of Justice Statistics
South Carolina
Established by legislation during the 1978 session, the Office of Criminal Justice Programs, which includes the Statistical Analysis Center (SAC), is the Division of Public Safety in the Governor's Office.
Some of the functions mandated in the legislation include-• collecting and disseminating information concerning crime and criminal justice for the purpose of assisting the General Assembly and enhancing the quality of criminal justice at all levels of government in the State • analyzing activities and problems in the administration of criminal justice and developing plans for improvement for consideration and implementation by State and local agencies • advising and assisting law enforcement agencies in the State to improve their law enforcement systems and their relationship with other agencies and the statewide system • stimulating and seeking fi''lncial support from Federal, State, and loc.11 governments and private sources for programs and projects designed to improve the administration of criminal justice, court systems, law enforcement, prosecution, corrections, probation and parole, juvenile delinquency programs, and related fields.
These activities are performed in conjunc .. tlon with the Governor's Committee on Criminal Justice, Crime, and Delinquency. The Governor's Committee, which was established by the same legislation as the Office of Criminal Justice Programs, functions as the policy board for the Office of Criminal Justice Programs and also for the

Juvenile Justice and Delinquency Prevention Act of 1974 (Public Law 93-415). The committee advises the Office of Criminal Justice Programs and the Governor on criminal and juvenile justice policy and issues and makes recommendations for administratiVe and legislative improvements to the system.
The oHice also works with the Juvenile Justice Advisory Council established by the same legislation. The advisory council advises the committee and the office on ali matters relevant to juvenile justice and recommends priorities for the improvement of juvenile justice services.
In support of legislative mandates, the SAC provides the Office of Criminal Justice Programs with technical support in many areas. During Ihe past Federal fiscal year some of the more important tasks supported by the Office 01 Criminal Justice ProgrElms inclUde-
Coroner's system
A !.opecial subcommittee was appointed by the Governor's Committee to examine the coroner system and develop recommendations, After considerable research and numerous meetings, five recommendutions were presented to, and approved by, the Governor's Committee. Legislation was introduced to establish a Forensic Death Investigation Center. The center will provide a major improvement to the coroner system in South Carolina. The legislation did not get througn the leglslaiive process during the 1986 session. The bill is being redrafted and will be Introduced during the 1987 legislation session
State Law Enforcement Division (SLED) Crime Lab
While judicial reform has rosulted in many improvements for the judicial system, the increased case load and, speciHcally, the 180-day rule have resulted in an unmanageable burden for SLED in performing the requisite technical work for evider1ce.
SLED performs 95% of the technical work in the Sta.te in a lab that is seriously inadequate in terms of equipment and manpower. SLED estimates that it is currently 200-3QO days behind in its lab work. Much of the lab equipment is outmoded and needs replacing, and additional criminologists are needed to do the lab work and provide court testimony.
The SAC director toured the Georgia Crime lab In Alianta in order to make a funding recommendation to the Governor. Additional slaff work by the OHice of Criminal Justice Programs has resulted in the Governor's supporting the allocation of additional funds to upgrade SLED's crime lab. A $9.8 million bond iseue was approved by the General Assembly during the 1986 Session.
The Omnibus Criminal Justice Improvements Act
Like those of many other States, South Carolina's prisons are severely overcrowded. In January 1985 the State agreed to the settlement of a Fer.h)ral suit mandating minimum square footage requirements and "safe and reasonable" prison operating levels.
1986 Annual Report 127
r---I
• State narratives
In response to this problem, the Governor initiated a comprehensive correctional and public safety reform package titled The Omnibus Criminal Justice Improvement Act. This legislation, signed into law on June 5, 1986, encourages the use of restitution, community service, and work release for Short-term, nonviolent of;enders on the local level.
Ten restitution centers are planned to be in operation within 5 years around the State. These centers will house nonViolent offenders sentenced to restitution as a condition of probation or as an alternative to incarceration for probation revocation. Those sentenced to the program will wor'.t at paid employment and perform public service work in order to make court-ordered victim restitution, pay fines, and pay for the costs of participaling in the program.
The acl also establishes a "shock probation" program for youthful, nonviolent offenders as a condition of probation or as an alternative punishment for probation violations. Offenders sentenced to the program participate in a "boot camp" type regimen for 90 days before release to probation supervision.
Revisions to the S.C. Prison Overcrowding Powers Act were also included to improve this "safety valve" for crisis prison overcrowding. The amended act now specifies a s;:>ecific number of prisoners which need to be released 10 keep the inmate population at a safe and reasonable operating level. Risk assessments will be conducted on inmates to identify "eligible" inmates for emergency release; that is, those inmates Who present a low risk to public safety.
c"",a" of Justice Statistics
Finally. South Carolina has instituted an Intensive Supervision Program to provide closer surveillance on offenders who need more structured parole or probation supervision. This program can be used in conjunction with restitution. public work or shock probation sentences to increase the effectiveness of these alternative programs.
Crime Booklet
The Office of Criminal Justice Programs! SAC provides a Wide range of criminal justice data to the criminal justice system at the national, State, and localleve/. Additionally, similar dala are also provided to units of government at the same level as well as the general public. One method utilized to provide data is the publication of crime booklets. These booklets concern the criminal and juvenile justice system in South Carolina. They are intended to help correct or clarify some of the misinformation and myths about crime and criminal justice in South Carolina. They provide facts on the incidence of crime and the population that passes through Ihe criminal and juvenile justice systems. The books are aimed al the general public and the legislature as well as groups within the criminal justice system.
Victims compensation
In 1982. the General Assembly established the Victim's Compensation Fund to award funds to crime victims to pay for physical injuries incurred as a direct result of the crime. Even though a recent Governor's Office-commissioned study indicated that less than half of all crime victims were even aware of the exlslence of the fund,
&
the tremendous number of victims applying for compensation has depleted the fund and caused a shortfall to occur.
In 1986, the General Assembly reduced the maximum award amount to an individual victim from $10,000 to $3,000 in order to make the funds go further, but it is apparent that more funds are needed if the victim's fund is to adequately address the needs of South Carolina crime victims. The OHice of Criminal Justice Programs is assisting the Victim Compensation Fund in addressing this funding IJroblem.
South Dakota
The South Dakota Statistical Analysis Center (SDSAC) is in the Office of the Attorney General. The Attorney General is mandated by statute to maintain the Bureau of Criminal Statistics for the State. The SAC was involved in a number of projects during the Federal fiscal year 1986. The primary task is providing information to interested individuals and to agencies that make inquiries about criminal justice issues.
The SAC has published and continues to update a complete criminal justice directory for the State, which lists the addresses, phone numbers, and positions of all people involved in the criminal justice system in South Dakota. A copy was made available to all those included in the directory and also to whomever requested It. The directory is the most widely used product of the SAC and has facilitated access of individuals to one another and between their agencies.
For the second consecutive year, the SAC surveyed all law enforcement agencies in the State to obtain comparative management information. Budgetary and personnel information and wage/salary practices werd examined in addition to many other policies and practices of the law enforcement departments throughout the State. Two separate reports were compiled, one each for the sheriffs and police chiefs, and widely distributed. The law enforcement administrators have come to rely on these reports to support their budget requests and to provide them with comparative management statistics never before available in South Dakota.
":pq-.
1986 Annual Report 129
--State narrl3tives
In 1986, the SAC continued to keep abreast of the many changes being made in the national Uniform Crime Reporting (UCR) Program. South Dakota does not currently have a State UCR pmgram, but the SAC is very interested in becoming the State clearinghouse for UCR data. SAC staff have worked with FBI personnel to promote lraining and to increase parHcipation among South Dakota law enforcement agencies. The common goal is to increase the quality and quantity of UCR statistics within South Dakota.
A major SAC project in fiscal 1986 was the South Dakota Serious Crime Survey, in which 4,000 citizens were randomly selected and asked about any crime experiences they had in the previous 12 months. The purpose of the survey was threefold: • to estimate how many South Dakota citizens are victims of crime, including crime not reported to the police; • to analyze and appreciate the experiences of victims with the criminal justice system; and • to estimate the level of public support for certain criminal justice programs.
Results of the survey were published and widely distributed throughout the State. The results were also used to support a comprehensive package of victimlWitness assistance bills, which were passed into law by the 1986 State Legislature.
In the laller part of fiscal 1986, work was begun on a project that will continue into 1987 and beyond. All branches of the criminal justice system within the State Will be involved in a stUdy of the ssxual
130 Bureau of Justice Statistics
•
offender. The effort is coordinated by the SAC. Using police records, court documents, and prison and psychological records, a profile of the sexual offender will be attained. In addition, an OBTS-type tracking system for these offenders will be established. As a result of increased public awareness, the sex offenders have rapidly become a significant proportion of the case load for all three aspects of the South Dakota criminal justice system: law enforcement, the Courts and corrections. Results of this systemwide effort are eagerly awaited by many individuals and age:fcies in the criminal justice system.
Every year the Federal Bureau of Investigation's Crime in the United States report has COVElrAd crime in South Dakota. This is based on information received by contributing agencies within the State. The SAC has compared those figures with those of the other 50 States. This shows South Dakota's statistical crime rate when compared to such States.
The SAC has conducted research to answer many other questions about the criminal justice system and has attempted to respond adequately and correctly to such inquiries. It is the SAC's desire to continue in its clearinghouse fUnction in the roles of educator, researcher, and provider of information. With such information the criminal Iustice system will operate more efficiently and better serve the public.
.,:-v- .... ;~.;).,
-------------------------------------------
Texas
Created by State statute effective September 1983, the Texas Criminal Justice Policy Council was fully staffed and operational by early 1984. Composed of the Governor, Lieutenant Governor, Speaker of the House, and their appointees, the council was charged to develop "means to promote a more effective and cohesive State criminal justice system:' The mandates in the enabling legislation clearly indicate that data gathering and analysis would be the primary focus of the council, and the staff has concentrated on that area.
Existing staff of the Criminal Justice Policy Council consists of 5.5 positions with 4 currently paid through general revenue, 1 paid through a State grant, and 0.5 paid through the BJS Cooperative Agreement.
The Criminal Justice Policy Council is conducting these projects: • analyzing data collected by State and local agencies and recommending improvements in data collection and retrieval to enhance its usefulness for research and policy development It implemer.;'~~ lhe Policy Council's Community Crir~~ Reduction Project in Texas cities It devel('~ing a PC-based Corrections Population Simulation Model (CLASM) which will be expanded to include other components of the criminal justice system
• establishing and chairing a joint effort among the Policy Council, Legislative Budget Board, Sunset Advisory Commission, Governor's Budget and Planning Office, and State Auditor's Office to standardize the calculation of costs in the adult and juvenile systems (Uniform System Cost PiOjecij
• staffing the Sentencing Commission Task Force on Revision to the Code of Criminal Procedure o chairing an interagency study committee on the program needs of the mentally handicapped offender
• serving un the Advisory Commission on State Emergency Communications to establish 911 as the emergency telephone number statewide ., establishing and providing staff support to the Electronic Monitoring/House Arrest Task Force.
• conducting a juvenile justice system study • institutionalizing the Policy Council as the State's Statistical Analysis Center
• initiating a prison unit cost analysis project with the Texas Department of Corrections to provide detailed cost information at the lowest level of analysis possible
• analyzing proposed legislative changes in the State criminal justice system and predicting their impact on the system in terms of both persons and costs ., conducting research projects on issues of interest to State policymakers.
1986 Annual Report 131

State narratives
The Criminal Justice Policy Council has assumed a leadership role in-
• identifying problems and developing solutions
• initiating systemic improvements • analyzing existing data and recommending ways to improve their usefulness
• using data to project the impact of proposed changes in the criminal justice system
• bringing agencies together to work toward common goals.
132 Bureau of Justice Statistics
Utah
The Utah Commission on Criminal and Juvenile Justice was created by the Utah Legislature for the principal purpose of ensuring broad philosophical agreement on the objectives of the criminal and juvenile justice system in Utah and to provide a mechanism for coordinating the functions of the various branches and levels of government to achieve those objectives. The commission has 17 members representing key leaders from the legislative, judicial, and executive branches of State and local governments. The commission has a small staff and is attached to the Governor's Office.
The specific statutory charges of the commission are to-e promote the coordination of all criminal justice agencies • provide analysis and recommendations on all criminal and juvenile justice legislation, State budget and facility requests, including program and fiscal impact on all components of the criminal and juvenile justice system
• provide public information on the criminal and juvenile justice system and give technical assistance to agencies or local units of government on methods to promote public awareness
• promote research and program evaluation as an integral part of the criminal and juvenile justice system • provide a comprehensive criminal justice plan annually
• develop, monitor, and evaluate sentencing and release guidelines for adults and jUveniles
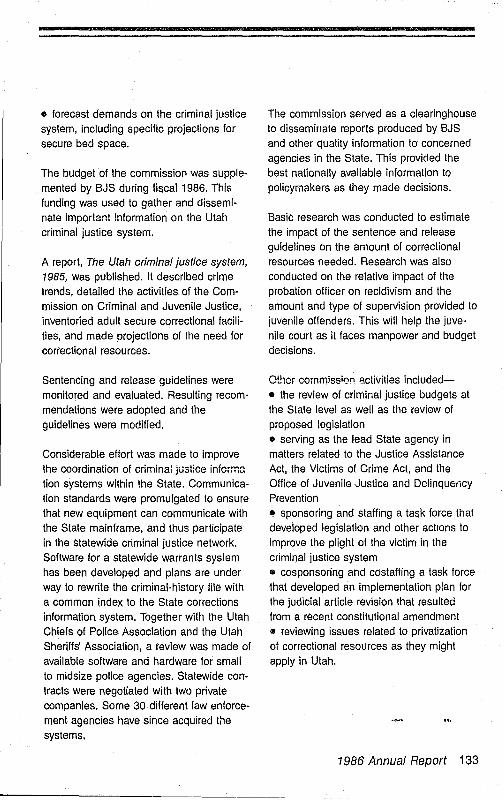
• forecast demands on the criminal justice system, including specific projections for secure bed space.
The budget of the commission was supplemented by BJS during fiscal 1986. This funding was used to gather and disseminate important information on the Utah criminal justice system.
A report, The Utah criminal justice system, 1985, was published. It described crime trends, detailed the activities of the Commission on Criminal and Juvenile Justice, inventoried adult secure correctional facilities, and made projections of the need for correctional resources.
Sentencing and release guidelines were monitored and evaluated. Resulting recommendations were adopted and the guidelines were modified.
Considerable effort was made to improve the coordination of criminal justice inform:: tion systems within the State. Communication standards were promulgated to ensure that new equipment can communicate with the State mainframe, and thus participate in the statewide criminal justice network. Software for a statewide warrants system has been developed and plans are under way to rewrite the criminal-history file with a common index to the State corrections information system. Together with the Utah Chiefs of Police Association and the Utah Sheriffs' Association, a review was made of available software and hardware for small to midsize police agencies. Statewide contracts were negotiated with two private companies. Some 30 different law enforcement agencies have since acquired the systems.
The commission served as a clearinghouse to disseminate reports produced by BJS and other quality information to concerned agencies in the State. This provided the best nationally available information to policymakers as they made decisions.
Basic research was conducted to estimate the impact of the sentence and release guidelines on the amount of correctional resources needed. Research was also conducted on the relative impact of the probation officer on recidivism and the amount and type of supervision provided to juvenile offenders. This will help the juvenile court as it faces manpower and budget decisions.
Other commission activities included-
• the review of criminal justice budgets at the State level as well as the review of proposed legislation
• serving as the lead State agency in matters related to the Justice Assistance Act, the Victims of Crime Act, and the Office of Juvenile Justice and DelinquE:rlcy Prevention • sponsoring and staffing a task force that developed legislation and other actions to improve the plight of the victim in the criminal justice system • cosponsoring and costaffing a task force thaI developed an implementation plan for the judicial article revision that resulted from a recent constitutional amendment \I reviewing issues related to privatization of correctional resources as they might apply in Utah.
1986 Annual Report 133

State narratives
Virginia
The Virginia Statistical Analysis Center (SAC) activities are undertaken within the Division of Information Systems and Technology, Department of Criminal Justice Services (DCJS). DCJS is responsible for establishing and regulating statewide training standards for law enforcement otticers, Jail/corrections officers, and the private security industry, the privacy and security of criminal-history record information, the development and coordination of criminal justice information systems, crime prevention efforts, and the provision of technical assistance and program development services to State and local criminal justlce agencies.
DCJS also administers a nl,lmber of grant programs, including the Justice Assistance Act, the Victims of Crime Act, and Statefunded criminal justice-oriented grant programs, and will administer the upcoming new drug enforcement grants. DCJS is located in the executive branch under the Secretary of Transportation and Public Safety.
The Division of Information Systems and Technology, unlike many other SACs, has its prime focus on the development and coordination of criminal justice information systems (C,~IS) to aid decisionmaking. A few of the major accomplishments include the following: • Continuing a pilot effort that began 2 years ago, a pretrial risk assessment instrument was constructed to aid magistrate decisionmaklng in Alexandria, Vir-
134 Bureau of Justice Statistics
-
ginia. In the next few months, with the input and cooperation of Alexandria's sheriff and court officials, this instrument will be implemented with the intent of transfer to other Virginia localities. • Similar in design and intent to the work with the Alexandria magistrates, the judiciary of the circuit courts was provided with a historical, descriptive analysis of sentencing patterns in Virginia. The data base used to provide this information contains approximately 240 items of information on an offender's criminal, social, medical, drug, etc., history as well as information pertaining to the instant offense such as weapon use and victim characteristics. The data file, as of November 1986, contained approximately 18,000 cases. The data file, known as the PSI data base, and its continuing analysis may be used by the judiciary to develop voluntary sentencing guidelines . • Recognizing the potential of the PSI data base. work began on a Decision Support System. The thrust of this effort will be to provide decisionmakers such as parole board members with timely Information about an offender. Menu driven programs will provide standardized reports. Information not obtainable from these reports will be available through natural English language inquiry. The user need only to pose a question to the data base in standard English sentences. Over the next several years, it is hoped that risk assessment modUles will be built into the system, thereby achieving a degree of artificial intelligence.
_1

M
• Technical assistance efforts continued to provide law enforcement agencies with requirements analyses. These needs analyses are usually followed by a subsequer~ request for proposal to procure the necessary hardware and software configuration. Assistance, for example, is being provided to the city of Richmond to procure a comprehensive CJIS system linking all city criminal justice agencies.
• The SAC continues to provide OBTS data to BJS for national compilation. A redesign of the basic data collection form for OBTS has resulted in obtaining greater specificity with respect to both arrest and conviction charges. A Virginia Crime Code system modeled after the State's criminal code was devised for this purpose. • An Automated Fingerprint Identification System (AFIS) was also selected and procured. The system will greatly enhance the utility of latent prints gathered from crime scenes and will prevent Offenders from successfully using aliases upon arrest. It Efforts also continue to coordinate information systems to avoid redundant information and wasted resources. Toward this end. an association of practitioners in CJIS. in cooperation with division staff. produces a quarterly newsletter and sponsors periodic conferences and workshops.
Washington
The criminal justice Statistical Analysis Center (SAC) is in the Office of Financial Management as part of the Forecasting Section. Responsibilities of this section include forecasting criminal justice populations and analysis of ciiminal justice issues from a policy. as well as an analytical. perspective.
Inmate population forecast
The inmate forecast was prepared for the next budget cycle under the direction of the Governor's Interagency Criminal Justice Work Group. In 1987 the inmate population is expected to decrease to about 6.770 from an ali-time high of 7.100 in 1986. The major reason for the decline is the increased number of releases due to a State Supreme Court ruling-In re Myers. 1986. That decision requires the application of shorter, determinate sentences for inmates currently serving indeterminate sentences under the old sentencing system. After 1987 the inmate population is expected to increase gradually. By 1990 it is projected that the inmate population will be about 7.400.
Jail forecast of convicted felons
The felon jail forecast methodology has been developed. This forecast will show the historical and projected jail populations for the major jails in the State by crime type and sex. The first forecast is due in spring 1987.
1986 Annual Report 135
State narratives
Juvenile institutions forecast
The Juvenile Rehabilitation Institutions forecast was prepared using a new components-of-change forecast model. A policy group of key juvenile justice administrators set assumptions (or the forecast. First, it is expected that longer sentence lengths wilf be approved by the legislature for certain sex offenses. Second I the number of youths in the 11 to 17 ye('lr old target population will continue to decrease until the early 1990s. The declining State population 01 youths will more than offset the planned sentence increases. The juvenile institution population is expected to decrease from an annual average of 816 in 1987 to 770 in 1989.
Parole board phaseout
Part of the design of Washington's determinate sentencing law is to abolish postprison supervision. Therefore, as the determinate sentencing system has phased in, the responsibilities of the parole board have started to diminish. Legislation last year removed the setting of minimum terms for the few remaining offenders who are processed under the old indeterminate law. This is now the responsibility of the sentencing judge. A study is planned thaI will project the declining case load for the indeterminate sentencing system as an aid to the phaseout of the remaining parole board functions.
136 Bureau of Justice Statistics
Crime analysis
Crime analysis was provided to the Association of Sheriffs and Police Chiefs. This analysis, based on the State UCR reporting system, presented a 15-year historical picture, as well as estimates of future crime patterns. A particulariy important issue in the crime analysis is the rapid increase in the reporting and arrests for the sexual molestation of children.
Automated fingerprint system
Staff served on the Washington State Patrol's committee for the acquisition of an automated fingerprint system. In addition to servIng on the acqUisition committee, staff helped estimate the future capacity of the system.

Wisconsin
The Wisconsin Statistical Analysis Center (SAC) is a program of the Wisconsin Council on Criminal Justice. The SAC collects, analyzes, and disseminates a variety of criminal justice data in Wisconsin.
The Wisconsin SAC was established in November 1981 by Executive Order of the Governor and was fully supported by Federal funds through March 1985. During the present period the SAC was funded 50% by the U.S. Bureau of Justice Statistics and 50% by the State of Wisconsin. On October 1, 1986, the State assumed total support of SAC, with additional BJS grant funds to undertake special studies.
The Wisconsin SAC maintains the Uniform Criminal Reporting (UCri) system for the State, as well as some components of a Jail Information System (JIS) and a Juvenile Detention Information System (JDIS). The SAC also conducts special research studies on criminal/juvenile justice topics and responds to approximately 200 information requests each year from congresSional and State legislators, justice system professionals, the media, students, and other citizens. In addition, the SAC provides technical assistance to local criminal justice agencies and promotes the coordination and development of criminal justice statistical programs in Wisconsin.
Publications during the period October 1, 1985-September 30, 1986
Wisconsin crime and arrests: Semi-annual 1985 and semi-annual 1986
Wisconsin crime and arrests: 1985
Sexual assaults in Wisconsin: 1984
Homicides by juveniles in Wisconsin:
1972-1983
Secure detentions of juveniles in Wiscon
sin: 1984
Annual jail reports: 1985 (Jackson, Juneau, Kewaunee, La Crosse)
Special jail studies (Inmate profiles and population forecasts) (Portage, SI. Croix, and Eau Claire)
Juvenile restitution programs: 1985 (annual reports)
Special UCR Reports (Chilton, Schofield, Beaver Dam, Whitefish Bay, Pleasant Prairie, Shawano, Ripon, Milwaukee & Madison Police DepartmElnts)
Drug arrests in Wisconsin: 1976-1985
Major research projects and other activities during the period
Sexual Assaults in Wisconsin 1985
Secure Detentions of Juveniles in Wisconsin 1985
Development of Felony Data Base UCRRelated Training (on a regional basis and specialized for individual departments)
Sexual Assault Study
Homicide Trends in Wisconsin
Drug Arrests In Wisconslh 1976-1985 Special UCR Reports
1986 Annual Report 137
Appendix A
Sources of narratives on State activities
Alabama Larry Wright, Deputy Director Alabama Criminal Justice Information Center 858 South Court Street Montgomery. Alabama 36104 (205) 832-4930
Alaska John E. Angell. Ph. D. Director. Justice Center University of Alaska 3211 Providence Drive Anchorage. Alaska 99508 (907) 786-1810
Arizona Tom Epperlein. SAC Director Information Analysis Section Department of Public Safety Post Office Box 6638 Phoenix. Arizona 85005 (602) 262-8082
Arkansas Larry Cockrell, Manager Special Services Section Arkansas Crime Information Center One Capitol Mall Little Rock, Arkansas 72201 (501) 371-2221
California Steve Crawford, Program Manager Bureau of Criminal Statistics and Special Services Department of Justice Post Office Box 13427 Sacramento, California 95813 (916) 739-5568
Colorado Mary J. Mande, Ph.D. SAC Director Division of Criminal Justice Department of Public Safety 700 Kipling. Suite 3000 Denver. Colorado 80215 (303) 239-4442
Commonwealth Qf the Northern Mariana Islands Richard D. Shewman. Director Criminal Justice Planning Agency RO. Box 1133 Saipan, CM 96950 (670) 322-9350
Commonwealth of Puerto Rico Ana Leticia Jimenez, Acting Director Statistical Analysis Center Office of the Attorney General Post Office Box 192 San Juan, Puerto Rico 00902 (809) 783-3382
1986 Annual Report 139
-------~---~---
Appendix A
Connecticut Gerald F. Stowell, Chief of Research Justice Planning Division Office of Policy and Management 80 Washington Street Hartford, Connecticut 06106 (203) 566-:)522
Delaware Michael H. Rabasca, Director Statistical Analysis Center 60 The Plaza Dover, Delaware 19901 (302) 736-4626
District of Columbia Steven Rickman, Director Statistical Analysis Center Office of Criminal Justice Plans and Analysis 1111 E Street, N.W., Suite 500C Washington, D.C. 20004 (202) 727-6554
Florida
-
Kenneth B. Trager, SAC Director Criminal Justice Information Systems Florida Department of Law Enforcement P.O. Box 1489 Tallahassee, Florida 32302 (904) 487-4808
Hawaii Steven E. Vidinha, Director Hawaii Criminal Justice Data Center Department of the Attorney General 465 South King Street Honolulu, Hawaii 96813 (808) 548-2090
140 Bureau of Justice Statistics
Idaho William C. Overton, SAC Director Technical Services Unit Department 01 Law Enlorcement 6081 Clinton Street Boise, Idaho 83704 (208) 334-3161
Illinois John R. Firman, Associate Director Illinois Criminal Justice Information Authority 120 South Riverside Plaza, 10th Floor Chicago, Illinois 60606 (312) 793-8550
Indiana Douglas M. Fowler, Director Criminal Justice Division Indiana Criminal Justice Institute 150 West Market Street, Suite 200 Indianapolis, Indiana 46204 (317) 232-1230
Iowa Paul Stageb'}rg, Ph.D. Director Iowa Statistical Analysis Center Department of Management Executive Hills East Des Moines, Iowa 50319 (515) 281-3108
Kansas Michael E. Boyer, Supervisor Statistical AnalysiS Center/UCR Kansas Bureau of Investigation 1620 Tyler Topeka, Kansas 66612 (913) 232-6000, ext. 312
,'!A.
--
Kentucky C. Bruce Traughber, Co-Director Statistical Analysis Center Attorney General's Office Capitol Building Frankfort, Kentucky 40601 (502) 564-4002
Louisiana Carle L. Jackson, Research Director Louisiana Commission on Law Enforcement 2121 Wooddale Boulevard Baton Rouge, Louisiana 70806 (504) 925-4440
Maine Steven Woodard, Director Maine Criminal Justice Data Center Department of Corrections State Office Building, Station 111 Augusta, Maine 04333 (207) 289-2711
Maryland Charles F. Wellford, Ph.D. Director Maryland Justice Analysis Center Institute of Criminal Justice and Criminology University of Maryland College Park, Maryland 20742 (301) 454-4538
Massachusetts Daniel B. Bibel, Director Statistical Analysis Center Massachusetts Committee on Criminal Justice 100 Cambridge Street, Room 2100 Boslon, Massachusetts 02202 (51'1) r~i"-7096
Michigan George H. Roehm, Director Statistical Analysis Center Office of Criminal Justice Lewis Cass Building, PO Box 30026 Lansing, Michigan 48909 (517) 373-6510
Minnesota Kathryn Guthrie, Research Specialist Criminal Justice Statistical Analysis Center State Planning Agency 550 Cedar Street SI. Paul, Minnesota 55101 (612) 296-7819
Mississippi Karen Skadden Systems Analyst III Statistical Analysis Center Department of Criminal Justice Planning 301 West Pearl Street Jackson, Mississippi 39203 (601) 949·2006
Missouri Martin P. Carso Jr., Director Statistical Analysis Center Department of public Safety Missouri Highway Patrol 1510 East Elm Jefferson City, Missouri 65102 (314) 751-4026
Montana Donald Crabbe Research Planning Bureau Board of Crime Control 303 North Roberts Street Helena, Montana 59620 (406) 444-3604
1986 Annual Report 141
Appendix A
Nebraska Bruce Ayers, Director Statistical Analysis Center Director Commission on Law Enforcement and Criminal Justice Box 94946 Uncoln. Nebraska 68509 (402j 471-2194
New Hampshire Mark C. Thompson. Director Statistical Analysis Center Office of the Attorney General State House Annex Concord, New Hampshire 03301 (603) 271-3658
New York Richard A. Rosen. Chief Bureau of Statistical Services Division of Criminal Justice Services Executive Park Tower Stuyvesant Plaza Albany. New York 12203 (518) 453-6901
North Carolina David E. Jones, Director Criminal Justice Analysis Center Governor's Crime Commission Department 01 Crime Control Post Office Box 27687 Raleigh, North Carolina 27611 (919) 733-5013
North Dakota Robert J. Helten, Coordinator Criminal Justice Research Office of the Attorney General State Capitol Bismark, North Dakota~p8505 (701) 224-2594
142 Bureau of Justice Statistics
Ohio Jeffrey K. Knowles, Bureau Chief Research and Statistics Office of Criminal Justice Services Slate Office Towers, Box 1001 Columbus, Ohio 43216 (614) 466-0310
Oklahoma Steve Davis. Ph.D. Administrator Planning and Research Oklahoma Department of Corrections 3400 Martin Luther King Avenue P.O. Box 11400 Oklahoma City, Oklahoma 73136 (405) 427-6511
Oregon James P. Heuser, Ph.D. Director Crime Analysis Center Department of Justice Justice Building Salem. Oregon 97310 (503) 378-8056
Pennsylvania Phillip J. RennInger, Director Bureau of Statistics and Policy Research Pennsylvania Commission on Crime and Delinquency RO. Box 1167 Harrisburg. Pennsylvania 17108 (717) 787-5152
Rhode Island Norman Dakake, Director Statistical Analysis Center Governor's CommiSsion on Justice 222 Quaker Lane, Suite 100 West Warwick, Rhode Island 02893 (401) 277-2620
l
South Carolina Ernest C. Euler Assistant Deputy Director Office of Criminal Justice Programs Office of the Governor 1205 Pendleton Street Columbia, South Carolina 29201 (803) 758-8940
South Dakota Donald E. Gromer, Director State Statistical Center Criminal Justice Training Center Division of Criminal Investigation Office of the Attorney General Pierre, Soulh Dakota 57501 (605) 773-3331
Texas Ronald D. Champion Executive Director Criminal Justice Policy Council p. O. Box 13332, Capitol Station Austin, T~xas 78711 (512) 463-1810
Utah Richard J. Oldroyd, Ph.D, Director of Research Commission on Criminal and Juvenile Justice Room 137, Utah State Capitol Salt Lake City, Ulah 84114 (801) 533-7932
Virginia Paul F. Kolmetz, Ph.D. Director Division of Information Systems and Technology Department of Criminal Justice Services 805 East Broad Street Richmond, Virginia 23219 (804) 786-7811
Washington Jack O'Connell Forecasting and Estimation Division Office of Financial Management Insurance Building, M.S. AQ44 Olympia, Washington 98504 (206) 753-1758
Wisconsin Harry A. Yates, Administrator Statistical Analysis Center Wisconsin Council on Criminal Justice 30 West Mifflin Street, Suite 1000 Madison, Wisconsin 53702 (608) 266-7646
1986 Annual Report 143
Appendix B
Reports issued by BJS during fiscal 1986
October 1985
Criminal victimization, 1984 (BJS Bulletin), NCJ-98904
Sourcebook of criminal justice statistics, 1984, NCJ-96382
Data quality of criminal history records, criminal justice information policYt NCJ-98079
National survey of crime severity (BJS Final ~\epor!), NCJ-96017
Criminal victlmizatfon in the I.I.S., 1983 (BJS Final Report), NCJ-96459
Prosecution of felony arrests, 1980 (BJS Final Report), NCJ-97684
Crime control and criminal records (BJS Special Report), NCJ-99176
State criminal records repositories (BJS Technical Report), NCJ-99017
November 1985
Jail Inmates, 1983 (BJS Bulletin), NCJ-99175
L~_-
December 1985
Reporting crimes to the police (BJS Special Report), NCJ-99432
Locating city, suburban, and rural crime (BJS Special Report), NCJ-99535
January 1986
The use of weapons In committing crime (BJS Special Report), NCJ-99643
February 1986
Police employment and expenditure (BJS Special Report), NCJ-l00117
Probation and parole 1984 (BJS Bulletin), NCJ-l00181
March 1986
Crime prevention measures (BJS Spe
cial Report), NCJ·l00438
Prison admissions and releases 1983 (BJS Special Report), NCJ-l00582
Parole In the U.S., 1980 and 1981 (BJS Final Report), NCJ-87387
1986 Annual Report 145
Appendix B
April 1986
Bureau of JustIce Statistics annual report, fiscal 1985, NCJ-100182
Electronic fund transfer fraud: Computer crime (BJS Final Report). NCJ-100461
Capital punishment 1983 (BJS Final Report), NCJ-99561
May 1986
Criminal victimization in the U.S. 1984 (BJS Final Report), NCJ-100435
Jail Inmates 1984 (BJS Bulletin), NCJ-101094
Capital punishment 1984 ,BJS Final Report). NCJ-99562
Crime and justice facts 1985, NCJ-100757
June 1986
Prisoners in State and Federal Instltu-1ions on [}<~cember 31, 1983 (BJS Final Report), NCJ-99861
Prlsonem In 1985 (BJS Bulletin). NCJ·101384
Households touched by crime, 1985
(BJS Bulletin), NCJ-101685
146 Bureau of Justice Statistics
July 1986
Justice expenditure and employment, 1983 (BJS Bulletin), NCJ-101776
August 1986
--
Felony case-processing time (BJS Special Report), NCJ-101985
Preventing domestic violence against women (BJS Special Report), NCJ-102307
September 1986
Prosecution of felony arrests, 1981 (BJS Final Report), NCJ-101380
Children in custody: 1982/83 census of Juvenile detention and correctional facilIties (BJS Final Report), NCJ-101686

Source notes
Single copies of any report with an NCJ number can be obtained free from the
National Criminal Justice Reference Service (NCJRS), P.O. Box 6000, Rockville, MD 20850, toll-free 800-732-3277 (local number 301-251-5500).
Bank robbery: Federal offenses and offenders (BJS Bulletin), August 1984, NCJ-94463
Blueprint for the future of the Uniform Crime Reporting Program: Final report of the UCR study, May 1986, NCJ-98348
BJS telephone contacts '87 (BJS Bulletin), December 1906, NGJ-102909
Bureau of Justice Statistics annual report, fiscal 1985, NCJ-100182
Capital punishment, 1983 (BJS Final
Report), April 1986, NCJ-99561
Capital punishment, 1984 (BJS Final
Report), May 1986, NCJ-99562
Capital punishment, 1985 (BJS Bulletin), November 1986, NCJ-1 02742
Career patterns In crime (BJS Special
Report), June 1983, NCJ-88672
Case filings In State courts 1983 (BJS
Bulletin), October 1984, NCJ-95111
Appendix C
Children in custody: 1982/83 census of juvenile detention and correctional facilities (BJS Final Report), September 1986, NCJ-101686
Children in custody: Public juvenile facilities, 1986 (BJS Bulletin), October 1986, NCJ-102457
Compendium of State privacy and security legislation, 1984 edition: Overview, September 1986, NCJ-98077
Compendium of State privacy and security legislation, 1984 (microfiche), NCJ-95506
Crime and justice facts 1985, May 1986, NCJ-100757
Crime control and criminal records (BJS
Special Report), October 1986, NCJ-99176
Crime prevention measures (BJS Special
Report), March 1986, NCJ-100438
Criminal defense systems: A national survey (BJS Special Report), August 1984,
NCJ-94630
Criminal justice "hot" files: Criminal justice information policy series, NCJ-101850
1986 Annual Report 147
,--~-----~~~~~------------------------------
I
I
Appendix C
Criminal victimization in the United States, 1983 (BJS Final Report). October
1985. NCJ-96459
Criminal victimization, 1984 (BJS Bul
letin). October 1985. NCJ-98904
Criminal victimization in the United States 1984 (BJS Final Report). May 1986. NCJ-100435
Criminal victimization 1985 (BJS Bul
letin). October 1986. NCJ-102534
Criminal victimization of District of Columbia residents and Capitol Hili employees: Summary, September 1986.
NCJ-98567
Data quality of criminal history records, October 1986, NCJ-98079
Data quality pOlicies and procedures: Proceedings of a BJSISEARCH conference, December 1986. NCJ-101849
Electronic fund transfer fraud (BJS Special Report). March 1986, NCJ-96666
Electronic fund transfer fraud: Computer crime (BJS Final Report). April
1986. NCJ-100182
Examining recidivism (BJS Special Report), February 1986, NCJ-96501
Federal drug law violators (BJS Bulletin),
February 1984. NCJ-92692
Felony case processing time (BJS Spe
cial Report), August 1986. NCJ-101986
148 Bureau of Justice Statistics
Felony sentencing in 18 local jurisdictions (BJS Special Report). June 1986.
NCJ-97681
Habeas corpus: Federal review of State prisoner petitions (BJS Special Report).
March 1984. NCJ-92948
Household burglary (BJS Bulletin), Janu
ary 1986, NCJ-96021
Households touched by crime, 1985 (BJS Bulletin). June 1986, NCJ-1 01685
How to gain access to BJS data, (brochure). September 1984, BC-000022
Jail inmates 1983 (BJS Bulletin).
November 1986. NCJ-99175
Jail inmates 1984 (BJS Bulletin). May
1986. NCJ-101094
Justice expenditure and employment, 1983 (BJS Bulletin). July 1986, NCJ-101776
Justice expenditure and employment extracts: 1982 and 1983 (BJS Final
Report). forthcoming
Locating city, suburban and rural crime (BJS Special Report). December 1986. NCJ-99535
National criminal defense systems study (BJS Final Report). October 1986.
NCJ-94702
National survey of crime severity (BJS Final Report), October 1985, NCJ-96017
1986 directory of automated crimin.-:il jU~1tice information systems, January 1 !l187, NCJ-102260
Parole In the U.S., 1980 and 1981, (BJS
Final Report). March 1986, NCJ-87387
Police employment and expenditure (BJS Special Report). February 1986.
NCJ-100117
Population density in State prisons (BJS
Special Report). December 1986,
NCJ-103204
Pretrial release and misconduct: Federal offenses and offenders (BJS Special
Report). January 1986. NCJ-96132
Preventing domestic violence against women (BJS Special Report). August 1986, NCJ-102037
Prison admissions and releases, 1983 (6JS Special Report). March 1986.
NCJ-100582
Prisoners and alcohol (BJS Bulletin).
January 1983, NCJ-86223
Prisoners and drugs (BJS Bulletin). March 1983, NCJ-87575
Prisoners In 1985 (BJS Bulletin). June
1986. NCJ-101384 (see also September 14, 1986, BJS press release for June 30, 1986 prisoner counts)
Prisoners In State and Federal institutions on December 31, 1983 (BJS Final
Report), June 1986. NCJ-99861
Probation and parole 1984 (BJS Bulletin).
February 1986. NCJ-100181
Probation and parole 1985 (BJS Bulletin),
January 1987, NCJ-103683
Prosecution of felony arrests, 1980 (BJS
Final Report), October 1985, NCJ-97684
Prosecution of felony arrests, 1981 (BJS
Final Report). September 1986. NCJ-101380
Reporting crimes to the pOlice (BJS
Special Report), December 1986, NCJ-99432
Report to the Nation on crime and justice, October 1983. NCJ-87068
Returning to prison (BJS Special Report).
November 1984. NCJ-95700
Sentencing practices in 13 States (BJS
SpeCial Report). October 1984, NCJ-95399
Setting prison terms (BJS Bulletin). Au
gust 1983. NCJ-76218
Sourcebook of criminal justice statistics, 1984, October 1986. NCJ-96382
Sourcebook of criminal justice statistics, 1985, October 1986, NCJ-100899
State and Federal Prisoners 1925-85
(BJS Bulletin). October 1986, NCJ-102494
State criminal records repositories (BJS
Technical Report). October 1986. NCJ·99017
1986 Annual Report 149
-. Appendix C
Teenage victims, November 1986.
NCJ-103138
The crime of rape (BJS Bulletin). March
1986. NCJ-96777
The economic cost of crime to victims (BJS Special Report). April 1984. NCJ-93950
The growth of appeals: 1973-83 trends (BJS Bulletin). February 1986. NCJ-96381
The use of weapons in committing crime (BJS Special Report). January 1986.
NCJ-99643
The prevalence of Imprisonment (BJS
Special Report). July 1986. NCJ-93657
The risk of violent crime (BJS Special
Report). May 1986. NCJ-97119
The 1983 jail census (BJS Bulletin). November 1984. NCJ-95536
The severity of crime (BJS Bulletin).
January 1984. NCJ-92326
Tracking offenders: The child victim (BJS Bulletin). December 1984. NCJ-95785
Tracklflg offenders: White-col/ar crime (BJS Special Report). November 1986. NCJ-102867
Violent crime by strangers and nonstrangers (BJS Special Report), January
1987, NCJ-103702
*U.S.GOVERNMENT PRINTING orrlCE,19B7-181-487,60412
150 Bureau of Justice Statistics