3ftfbsdi sujdmf &yqfsjnfoubm3ftfbsdipg%zobnjd ... · bnqmjuvef boe uif qfsjpe pg uif efotjuz...
TRANSCRIPT

Hindawi Publishing Corporatione �cienti�c �orld JournalVolume 2013, Article ID 714180, 14 pageshttp://dx.doi.org/10.1155/2013/714180
Research ArticleExperimental Research of Dynamic Instabilities in the Presence ofCoiledWire Inserts on Two-Phase Flow
Gokhan Omeroglu,1 Omer Comakli,2 Sendogan Karagoz,2 and Bayram Sahin3
1 Department of Mechanical Engineering, Faculty of Engineering, Bayburt University, 69000 Bayburt, Turkey2Department of Mechanical Engineering, Faculty of Engineering, Atatürk University, 25240 Erzurum, Turkey3Department of Mechanical Engineering, Faculty of Engineering and Architecture, Technical University of Erzurum, Erzurum, Turkey
Correspondence should be addressed to Gokhan Omeroglu; [email protected]
Received 21 October 2012; Accepted 10 December 2012
Academic Editors: T.-C. Jen and R.-H. Yeh
Copyright © 2013 Gokhan Omeroglu et al. is is an open access article distributed under the Creative Commons AttributionLicense, which permits unrestricted use, distribution, and reproduction in any medium, provided the original work is properlycited.
e aim of this study is to experimentally investigate the effect of the coiled wire insertions on dynamic instabilities and to comparethe results with the smooth tube for forced convection boiling. e experiments were conducted in a circular tube, and water wasused as the working �uid. Two different pitch ratios �𝐻𝐻𝐻𝐻𝐻 𝐻 𝐻𝐻𝐻𝐻 and 5.55) of coiled wire with circular cross-sections were utilised.e constant heat �ux boundary condition was applied to the outer side of the test tube, and the constant exit restriction was usedat the tube outlet. e mass �ow rate changed from 110 to 20 g/s in order to obtain a detailed idea about the density wave andpressure drop oscillations, and the range of the inlet temperature was 15–35∘C. e changes in pressure drop, inlet temperature,amplitude, and the period with mass �ow rate are presented. For each con�guration, it is seen that density wave and pressure droposcillations occur at all inlet temperatures. Analyses show that the decrease in the mass �ow rate and inlet temperature causes theamplitude and the period of the density wave and the pressure drop oscillations to decrease separately.
1. Introduction
In many industrial systems in which boiling heat transferexists, the �ow instabilities occurring based on the boilingheat transfer cause certain parts where heat is transferred tobreakdown. e fact that the system pressure, �ow rate, andsimilar parameters create oscillations shortens the life of theprocess systems. It is possible to order the events decreasingthe existence of the thermal systems operated by two-phase�ows as thermal fatigues,mechanical vibrations, the di�cultyof control caused by high transient temperatures, and theburn-out occurring on the test pipe surface [1, 2].
e main property categorising the type of two-phase�ow is the shapes that interfaces occurring between two-phases take. e effect of the �ow direction on these occur-ring shapes is highly distinctive. Two-phase �ows are clas-si�ed as horizontal, vertical, and inclined. e �ow regimesand the characteristics occurring in horizontal, vertical, andinclined tubes are different from each other. e directionthat the gravitational force affects according to the �ow
direction brings together the main classi�cation [1, 3, 4].Menteş et al. [5] and Kakaç et al. [6, 7] studied two-phase�ows in different �ow directions.
Considerable efforts have been made to investigate two-phase �ow instabilities by researchers for many years becausethe instabilities and thus the oscillations shorten the lifeof the systems. In different types of test tubes and tubeswith different cross-sections, Coleman andGarimella [8] andLeung et al. [9] investigated the instabilities of two-phase �owsystems. e forced convection boiling in a horizontal tubewas studied by Çomaklı et al. [10]. All types of dynamic insta-bilities were observed at all conducted temperatures, and theappearance boundaries of the oscillations were determined.It was observed that the instability of the system increasedwith the increase of the inlet temperature. Besides this trend,the periods, and the amplitudes of the pressure drop anddensity wave type oscillations decreased with the decreasingmass �ow rate and increased with the decreasing inlettemperature. Furthermore, it was noticed that the channellength had an important effect on two-phase dynamic �ow
2 e Scienti�c �orld �ournal
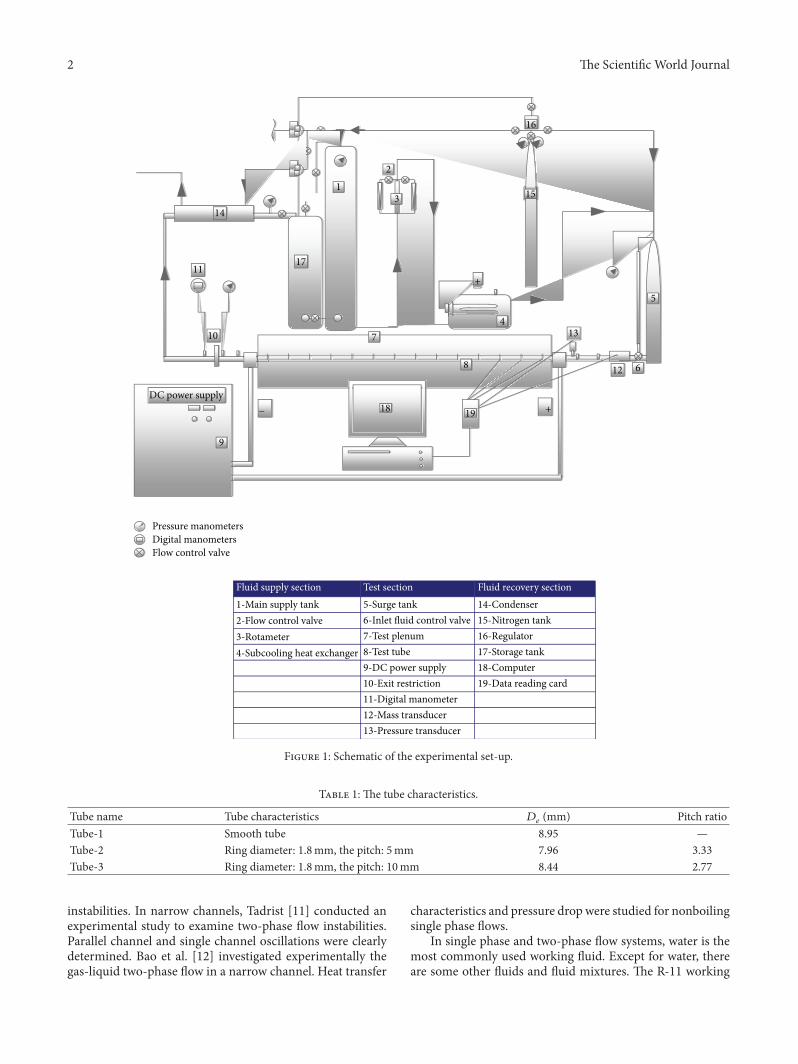
Fluid supply section Test section Fluid recovery section
1-Main supply tank 5-Surge tank 14-Condenser
2-Flow control valve 15-Nitrogen tank
3-Rotameter 7-Test plenum 16-Regulator
8-Test tube 17-Storage tank
9-DC power supply 18-Computer
10-Exit restriction 19-Data reading card
11-Digital manometer
12-Mass transducer
13-Pressure transducer
6-Inlet fluid control valve
4-Subcooling heat exchanger
Pressure manometers
Digital manometers
Flow control valve
1
2
+
4
10
11
6
7
8
5
12
13
9
3
DC power supply
17
18
14
16
15
19 +−
F 1: Schematic of the experimental set-up.
T 1: e tube characteristics.
Tube name Tube characteristics 𝐷𝐷𝑒𝑒 (mm) Pitch ratioTube-1 Smooth tube 8.95 —Tube-2 Ring diameter: 1.8mm, the pitch: 5mm 7.96 3.33Tube-3 Ring diameter: 1.8mm, the pitch: 10mm 8.44 2.77
instabilities. In narrow channels, Tadrist [11] conducted anexperimental study to examine two-phase �ow instabilities.Parallel channel and single channel oscillations were clearlydetermined. Bao et al. [12] investigated experimentally thegas-li�uid two-phase �ow in a narrow channel. �eat transfer
characteristics and pressure drop were studied for nonboilingsingle phase �ows.
In single phase and two-phase �ow systems, water is themost commonly used wor�ing �uid. �xcept for water, thereare some other �uids and �uid mixtures. e R-11 wor�ing

e Scienti�c World �ournal 3
Fluid outlettemperature 1
Total length of heater tube
Fluid inlettemperature
To sightglass
From surge tank
2 3 4 5 6 7 8 9 1011121314
F 2: ermocouples location.
�uid in a two-phase horizontal boiling system was used byÇomaklı et al. [13] and Kakaç and Cao [14]. e amplitudesand the periods of the pressure drop type and the densitywave type oscillations of R-11 were higher than those of water[13].ermal oscillations and pressure drop type oscillationsoccurred for all thermal power levels. e periods and theamplitudes of the oscillations increased with the increase ofthermal power and inlet subcooling [14]. Oil-water mixtureswere used by Poesio [15] and Sotgia et al. [16] in two-phase�ow systems to analyse the combined effect of both �uids ondynamic instabilities.
In order to investigate the two-phase �ow dynamic insta-bilities, different approaches have been employed besidesexperimental methods. �omogenous and dri� �ow modelsand the Wo�tan-�rsenbacher-ome �ow model were usedby Moreno Quibén andome [17] and Kakac and Bon [18]in a horizontal test tube, and the model results were con-�rmed with experimental models. Yu et al. [19] investigatedtwo-phase pressure drop, forced convection boiling heattransfer and the critical heat �ux of water in a horizontal testtube. e results were successfully related to the correlationsimproved for different types of working �uids and boilingwater in both narrow and wide channels.
In order to enhance the heat transfer in two-phase �ows,there are numerous techniques as in the single phase �ows.At the head of these techniques, inserting inner elementswith different geometry and con�guration as turbulencepromoter and surface area enhancer is the most preferredamong the passive heat transfer enhancement techniques.Yılmaz et al. [20, 21] examined the heat transfer enhancementmethods used in two-phase �ow in detail and presented basic�ndings related to heat transfer enhancement in two-phase�ows. e effects of enhanced surfaces on two-phase �owinstabilities in a horizontal boiling system were investigatedby Widmann et al. [22]. Dynamic instability types occurredin all different tube types. Çomakli et al. [4] and Karagozet al. [23] studied the dynamic �ow instabilities in a forcedconvection boiling system using a smooth tube and a tubewith different insertions. By the addition of the insertions intothe �ow �eld, it was seen that the periods and the amplitudesof the pressure drop type and density wave type oscillationsof the test tube with inner elements were higher than thoseof the smooth tube, and the smooth tube had a very stablestructure in terms of �ow instability. It was also noticed thatthe stability of the system increased with the decrease ofthe equivalent diameter for the same type enhanced surfaceelement. In this experimental work, the coiled wire insert
with two pitch ratios was used as turbulator in addition to thesmooth tube in order to investigate the effects on two-phase�ow instabilities. Besides the inner element and thus the pitchratio, the effect of the inlet subcooling and the mass �ow ratewere also examined.
2. Experimental Set-Up
e experimental set-up is schematically shown in Figure 1,which has been designed to create three main dynamic insta-bilities (pressure drop type, density wave type and thermaloscillations). In this study, the effects of inlet subcooling,the insertion type, pitch ratio, and the mass �ow rate ontwo-phase �ow instabilities have been investigated. As seenin Figure 1, the experimental system consists of three mainparts: �uid supply section, test section, and �uid recoverysection. e working �uid (water) in liquid form suppliedfrom the �uid supply section enters the circular tube andturns into a mixture of liquid and vapour by the effect of theheat input from the tube walls. e �uid that is nearly in thevapour phase at the end of the test section is sent to the �uidrecovery section. is �ow process goes on consistently as aclose loop.
2.1. Fluid Supply Section. e �uid supply section is com-posed of a main tank (1), �ow control valve (2), �ow meter(3), and heater (4). e main tank made of stainless steelstores the water used during the experiments.e cylindricaltank has 3 metres of height and 0.7m3 volume rates. e�ow control valve is used to set the rate of the �ow to thedesired level. e �ow rate is controlled by two �ow meters.e ranges of the �ow meters is 0�400 and 0�1000 l�hour,respectively. e �rst �ow meter is only used in small�ow rates to obtain more sensitive measurements. e inletsubcooling level is remarkably important for two-phase �owexperiments.erefore, a shell-tube heat exchanger is used tosend the water at the desired temperature to the test section.eworking �uid is heated by electrical heaters while passingthrough the tube. e temperature of the �uid heated bytwo heaters (each heater is 4 kW) is controlled with a digitalthermometer.
2.2. Test Section. e test section where the dynamic �owinstabilities are generated included a surge tank (5), inlet �uidcontrol valve (6), test plenum (7), test tube (8), DC powersupply (9), ori�ce (10), digital manometer (11), �ow meter(12), and pressure transducer (13). In order to create thecompressible volume for two-phase �ow of water, a surgetank with 0.05m3 was used. A level viewing glass, which isdurable against high pressure up to 30 bar, was added to thesurge tank in order to see the variations in both water and thecompressible volume. e surge tank also contained a levelrange to measure the level and a manometer to measure thepressure inside the tank.A turbine type �owmeter tomeasurethe oscillations inwater �ow rate, a Bourdon typemanometerto measure the pressure of the water at the tube inlet, and apressure transducer to measure the �uid pressure oscillationsat the tube inlet were installed between the surge tank and

4 e �cienti�c World �ournal
Tube-2Tube-1
Tube-3
(a) (b)
F 3: (a) Heat transfer surface augmentation elements, (b) the pictures of the elements.
0
0.5
1
1.5
2
2.5
0 50 100
Pre
ssu
re d
rop
(b
ar)
Mass flow rate (g/s)
Tube-1
d. w. oUnstable
p. d. o. withsuperimposed
d. w. o.
Stable
F 4: e steady state characteristic curves for Tube-1.
0 40 80 120
Mass flow rate (g/s)
0
0.5
1
1.5
2
2.5
3
3.5
4
4.5
5
Pre
ssu
re d
rop
(b
ar)
Tube-3
d. w. o. Unstablep. d. o. with
superimposedd. w. o.
Stable
F 5: e steady state characteristic curves for Tube-3.
the test tube. e inlet temperature of the working �uid atthe tune inlet was measured with a T-type thermocouple. Anori�ce plate was installed on the exit side of the tube in orderto de�ne the e�ects of exit restriction on �ow oscillations. ABourdon type manometer was used to measure the pressuredi�erence caused by the ori�ce plate.
0
1
2
3
4
5
6
7
0 40 80 120
Pre
ssu
re d
rop
(b
ar)
Mass flow rate (g/s)
Tube-2
d. w. o
Unstablep. d. o. with
superimposedd. w. o.
Stable
F 6: e steady state characteristic curves for Tube-2.
A stainless-steel pipe of 0.017m outer diameter, 3.4mmwall thickness, and 3m length was heated with uniformelectrical heat input from a DC generator (24 kW powersupply). To measure the oscillations of the wall temper-ature, 28 copper-constantan thermocouples were �xed onthe outer surface of the test tube (Figure 2). Half of thesethermocouples, that is, 14 thermocouples, were �xed alongthe top of the test tube� the other half were �xed along thebottom of the test tube. e �uid outlet bulk temperaturewas measured by placing another thermocouple midstreaminside the tube immediately aer the test section. e exitrestriction (10) created the necessary pressure drop. In thissystem, an ori�ce plate was used as exit restriction and thediameter ratio of the exit restriction equal to 0.448 wasused. e diameter ratio is de�ned as the ratio of the innerdiameter of the ori�ce plate to the inner diameter of thetube (𝛽𝛽 𝛽 𝛽𝛽𝛽𝛽𝛽𝛽𝛽𝛽. Downstream of the exit restriction, theexit pressure was measured with a pressure gauge. e testtube was electrically heated uniformly and insulated withglass wool that can withstand a temperature of 1000∘C. eheat input was determined by measuring the current andthe voltage drop across the heated section. In order to avoid�oating voltage e�ects, the thermocouple bead was insulatedfrom the electrically heated tube wall surface with a dab of

e �cienti�c World �ournal 5
0
1
2
3
4
5
6
7
0 40 80 120
Pre
ssu
re d
rop
(b
ar)
Tube-1
Tube-3
Tube-2
Mass flow rate (g/s)
F 7: e comparison of the steady state characteristics for alltubes. 𝑝𝑝in = 7.5 bar,𝑄𝑄 = 𝑄𝑄 kW, 𝑇𝑇in = 𝑄5∘C, 𝛽𝛽 = 𝛽.𝑄5.
0
1
2
3
4
5
6
7
0 40 80 120
Pre
ssu
re d
rop
(b
ar)
Mass flow rate (g/s)
Tube-1
Tube-3
Tube-2
F 8:e comparison of the oscillation boundaries for all tubes𝑇𝑇in = 𝑄5∘C.
electrically nonconductive paste. e test tube was followedby a sight glass for visual inspection of the �ow.
2.3. Fluid Recovery Section. Aer passing through the testtube, the working �uid comes into the �uid recovery sectionin the vapour phase. e �uid recovery section mainlyconsists of four components: condenser (14), nitrogen tank(15), regulator (1�), and �uid storage tank (17). e working�uid, nearly all in the vapour phase at the end of the testsection, is condensed with a water cooled condenser. econdensed water is sent to the storage tank.e storage wateris again sent to the main tank by pressuring with the help ofnitrogen gas.
2.4. Experimental Procedure. e experiments were con-ducted in two different categories: steady and unsteadyexperiments. In steady experiments, the steady state charac-teristics were de�ned� likewise, the two-phase �ow dynamicinstabilities were investigated in unsteady experiments. Inorder to investigate the effects of inlet subcooling on steadyand unsteady state characteristics, the experiments were con-ducted for three different inlet temperatures of 15∘C, 25∘C,and 35∘C and three different test tubes under constant heatinput (24 kW), system pressure (7.5 bar), and exit restriction(diameter ratio of 0.448). e �rst mass �ow rate for eachgroup is 110 g/s, because the �ow is single phase �ow at high�ow rates, and the mass �ow rate was decreased by 10�12 g/sslight steps to de�ne the characteristic curve. e lowest�ow rate was taken as 20 g/s in the experiments. �ecause ofthe burn-out possibility, �ow rates lower than 20 g/s cannotbe achieved. In Figure 3(a), the heat transfer enhancementsurfaces and characteristics are presented. Figure 3(b) showsthe heat transfer enhancement elements: rings.e insertionsare generally characterised with the effective diameter. Table1 presents the effective diameter and pitch ratios for alltypes of tube. e experiments were �rst conducted witha smooth tube (Tube-1) and then repeated for Tube-2 andTube-3.
At the beginning of the experiments, the main tank waspressured with high pressure nitrogen gas, and the systempressure was set by the pressure regulator on the nitrogentube. In steady state experiments, the nitrogen gas was notused, so the gas inside the surge tank was drained. As forthe unsteady experiments, the surge tank was pressured withthe nitrogen gas in order to create a constant compressiblevolume. e water level inside the tank was controlled andobserved by the aid of a transparent tube level gauge. Forboth steady and unsteady experiments, the �ow rate wasset to the highest value of 110 g/s with a control valve, andto achieve the desired temperature at the tube inlet thetemperature of water leaving the main tank was controlledwith a digital thermostat. Later, the cooling water was sentto the condenser, and then the constant heat was applied tothe tube walls by a DC power supply. Finally, the system wasoperated and brought to a steady state. It was decided that thesteady state was achieved when no higher change than 0.5∘Cwas observed on the test tube surface temperatures. Aer thesteady state was reached, all measurements were taken andthe same procedures are repeated for each other mass �owrates up to 25 g/s.
e fact that quick variations in the pressure value ofthe surge tank and water level were observed means that theoscillations began. At the unsteady experiments, the mass�ow rate was decreased until the oscillation boundary wasreached. In order to de�ne the boundary where the pressuredrop type oscillations break up, the periods of the oscillationswere observed.e slight periods in the oscillations show theboundary where the pressure drop type oscillations �nishedand the independent density wave type oscillations started.�y the decreasing mass �ow rate, the wall temperatures werefollowed carefully and the creation of the thermal oscillationswas provided. e experiments were suddenly halted whenthe burn-out began.

6 e �cienti�c World �ournal
125
135
145
155
0 10 20 30 40 50 60 70
Time (s)
(a)
0 10 20 30 40 50 60 70
Time (s)
125
135
145
155
165
(b)
1.5
2
2.5
3
3.5
4
4.5
Inle
t p
ress
ure
(b
ar)
0 10 20 30 40 50 60 70
Time (s)
(c)
35
40
45
50
Mas
s fl
ow
rat
e (g
/s)
0 10 20 30 40 50 60 70
Time (s)
Tube-1
Tube-2
Tube-3
(d)
F 9: Pressure drop oscillations (𝑄𝑄 𝑄 𝑄𝑄 kW, 𝑇𝑇in 𝑄 15∘C).
2.5. Experimental Measurements and Uncertainties. In theexperimental facility, the temperatures were measured withT-type copper-constantan thermocouples with a 0.25mmdiameter.e readingmeasurement of the temperature takenby the thermocouples was within ±%0.5∘C. e thermocou-ples were placed in a copper pipe for inlet and outlet temper-ature readings and �xed on the tube outer wall for de�ning
two-phase �ow regimes and oscillations. �n �dvantech datareading card was used for conversion of the signals takenfrom thermocouples, pressure transducer, and �ow meters,separately. e total uncertainty in readings based on chosenacquisition level was in the range of 0.1–0.5∘C.
emeasured pressures in the experimental study are thepressure of the main tank, surge tank, and nitrogen tank.e

e �cienti�c World �ournal 7
135
145
155
0 10 20 30 40 50 60 70
Time (s)
(a)
140
150
0 10 20 30 40 50 60 70
Time (s)
(b)
1.5
2
2.5
3
3.5
4
4.5
Inle
t p
ress
ure
(b
ar)
0 10 20 30 40 50 60 70
Time (s)
(c)
45
50
55
Mas
s fl
ow
rat
e (g
/s)
0 10 20 30 40 50 60 70
Time (s)
Tube-1
Tube-2
Tube-3
(d)
F 10: Pressure drop oscillations (𝑄𝑄 𝑄 𝑄𝑄 kW, 𝑇𝑇in 𝑄 𝑄5∘C).
pressures at the ori�ce inlet and outlet were also measured.e uncertainty read on the analogue manometers was±%0.1 bar. e outlet pressure of the ori�ce was measuredwith a digital manometer. e pressure transducer was onlyused to measure the oscillations occurring at the test tubeinlet and outlet; the pressure uncertainty of the transducer is±%0.1 bar.
On the determination of the oscillation and the stabilityboundaries, themass �ow ratemeasurements should be takencarefully. �wo �ow meters ha�ing �ow rate setting on itselfare used to measure and set the mass �ow rate. e rangesof the �ow meters are 0�400 and 0�1000 l/hour, respecti�ely.�y these �ow meters, the uncertainty rate is ±%0.4 l/hour.e total uncertainty of the readings taken from the turbine

8 e �cienti�c World �ournal
125
135
145
155
0 10 20 30 40 50 60 70
Time (s)
(a)
130
140
150
0 10 20 30 40 50 60 70
Time (s)
(b)
1.5
2
2.5
3
3.5
4
4.5
Inle
t p
ress
ure
(b
ar)
0 10 20 30 40 50 60 70
Time (s)
(c)
50
55
60
65
70
Mas
s fl
ow
rat
e (g
/s)
0 10 20 30 40 50 60 70
Time (s)
Tube-1
Tube-2
Tube-3
(d)
F 11: Pressure drop oscillations (𝑄𝑄 𝑄 𝑄𝑄 kW, 𝑇𝑇in 𝑄 35∘C).
type �ow meter used to measure the �ow rate oscillations is±%0.05 l/hour. e power rate of the DC power supply wasset with the setting button on the supplier, and the heat inputvalues were read from the digital volt and current gauges.eDC power supply was controlled within ±%0.2.
3. Results and Discussion
�n two�phase �ow systems, the steady state characteristiccurves that are used frequently are plotted by the pressuredrop versus mass �ow rate. ese curves show the variations
e �cienti�c �orld �ournal 9
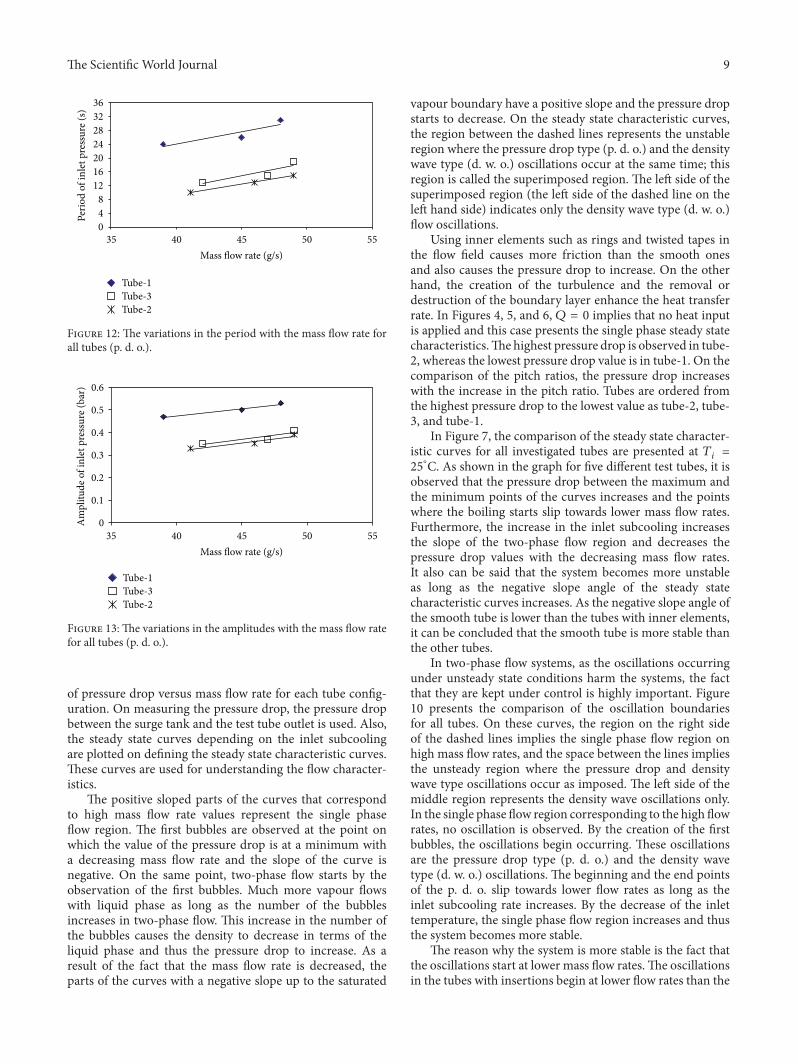
0
4
8
12
16
20
24
28
32
36
35 40 45 50 55
Per
iod
of
inle
t p
ress
ure
(s)
Mass flow rate (g/s)
Tube-1
Tube-3
Tube-2
F 12: e variations in the period with the mass �ow rate forall tubes (p. d. o.).
0
0.1
0.2
0.3
0.4
0.5
0.6
35 40 45 50 55
Am
pli
tud
e o
f in
let
pre
ssu
re (
bar
)
Mass flow rate (g/s)
Tube-1
Tube-3
Tube-2
F 13: e variations in the amplitudes with the mass �ow ratefor all tubes (p. d. o.).
of pressure drop versus mass �ow rate for each tube con�g-uration. On measuring the pressure drop, the pressure dropbetween the surge tank and the test tube outlet is used. Also,the steady state curves depending on the inlet subcoolingare plotted on de�ning the steady state characteristic curves.ese curves are used for understanding the �ow character-istics.
e positive sloped parts of the curves that correspondto high mass �ow rate values represent the single phase�ow region. e �rst bubbles are observed at the point onwhich the value of the pressure drop is at a minimum witha decreasing mass �ow rate and the slope of the curve isnegative. On the same point, two-phase �ow starts by theobservation of the �rst bubbles. �uch more vapour �owswith liquid phase as long as the number of the bubblesincreases in two-phase �ow. is increase in the number ofthe bubbles causes the density to decrease in terms of theliquid phase and thus the pressure drop to increase. As aresult of the fact that the mass �ow rate is decreased, theparts of the curves with a negative slope up to the saturated
vapour boundary have a positive slope and the pressure dropstarts to decrease. On the steady state characteristic curves,the region between the dashed lines represents the unstableregion where the pressure drop type (p. d. o.) and the densitywave type (d. w. o.) oscillations occur at the same time; thisregion is called the superimposed region. e le side of thesuperimposed region (the le side of the dashed line on thele hand side) indicates only the density wave type (d. w. o.)�ow oscillations.
Using inner elements such as rings and twisted tapes inthe �ow �eld causes more friction than the smooth onesand also causes the pressure drop to increase. On the otherhand, the creation of the turbulence and the removal ordestruction of the boundary layer enhance the heat transferrate. In Figures 4, 5, and 6, 𝑄𝑄 𝑄 𝑄 implies that no heat inputis applied and this case presents the single phase steady statecharacteristics.e highest pressure drop is observed in tube-2, whereas the lowest pressure drop value is in tube-1. On thecomparison of the pitch ratios, the pressure drop increaseswith the increase in the pitch ratio. Tubes are ordered fromthe highest pressure drop to the lowest value as tube-2, tube-3, and tube-1.
In Figure 7, the comparison of the steady state character-istic curves for all investigated tubes are presented at 𝑇𝑇𝑖𝑖 𝑄25∘�. As shown in the graph for �ve di�erent test tubes, it isobserved that the pressure drop between the maximum andthe minimum points of the curves increases and the pointswhere the boiling starts slip towards lower mass �ow rates.Furthermore, the increase in the inlet subcooling increasesthe slope of the two-phase �ow region and decreases thepressure drop values with the decreasing mass �ow rates.It also can be said that the system becomes more unstableas long as the negative slope angle of the steady statecharacteristic curves increases. As the negative slope angle ofthe smooth tube is lower than the tubes with inner elements,it can be concluded that the smooth tube is more stable thanthe other tubes.
In two-phase �ow systems, as the oscillations occurringunder unsteady state conditions harm the systems, the factthat they are kept under control is highly important. Figure10 presents the comparison of the oscillation boundariesfor all tubes. On these curves, the region on the right sideof the dashed lines implies the single phase �ow region onhigh mass �ow rates, and the space between the lines impliesthe unsteady region where the pressure drop and densitywave type oscillations occur as imposed. e le side of themiddle region represents the density wave oscillations only.In the single phase �ow region corresponding to the high �owrates, no oscillation is observed. By the creation of the �rstbubbles, the oscillations begin occurring. ese oscillationsare the pressure drop type (p. d. o.) and the density wavetype (d. w. o.) oscillations. e beginning and the end pointsof the p. d. o. slip towards lower �ow rates as long as theinlet subcooling rate increases. By the decrease of the inlettemperature, the single phase �ow region increases and thusthe system becomes more stable.
e reason why the system is more stable is the fact thatthe oscillations start at lower mass �ow rates.e oscillationsin the tubes with insertions begin at lower �ow rates than the

10 e �cienti�c World �ournal
125
135
145
155
165
175
0 10 20 30 40 50 60 70
Time (s)
(a)
125
135
145
155
165
175
185
0 10 20 30 40 50 60 70
Time (s)
(b)
0 10 20 30 40 50 60 70
Time (s)
1.5
2.5
3.5
4.5
5.5
6.5
Inle
t p
ress
ure
(b
ar)
(c)
0 10 20 30 40 50 60 70
Time (s)
Tube-1
Tube-2
Tube-3
20
25
30
Mas
s fl
ow
rat
e (g
/s)
(d)
F 14: Density wave oscillations (𝑄𝑄 𝑄 𝑄𝑄 kW, 𝑇𝑇in 𝑄 15∘C).
smooth tube and �nish at higher �ow rates. e insertionsused in the horizontal tubes in which the phase separationoccurs between the vapour and the liquid by the effect ofthe gravity disperse the vapour and cause the liquid bubblesto occur on the upper wall besides the vapour. Regardingthe oscillation boundaries, the start point of the p. d. o.draws back towards the lower �ow rates as long as theinlet temperature decreases. is case shows that increasingthe inlet subcooling makes the system more stable for all
tubes investigated. e stability boundary curves are in samemanner for all tubes.e unsteady region of the �ow e�pand,that is to say the imposed oscillation region of p. d. o. and d. w.o., grows by the increase of the gap between the boundaries.
In Figure 8, it is clearly seen that tube-1 has the widestboundaries. is means that the most unstable �ow occursin tube-1. e tubes with coiled wire insertions (tube-2 andtube-�) provide a more stable �ow than the smooth tube. �sfor the pitch ratio, the fact that the pitch increases makes

e �cienti�c World �ournal 11
125
135
145
155
165
175
0 10 20 30 40 50 60 70
Time (s)
(a)
140
160
180
200
220
240
0 10 20 30 40 50 60 70
Time (s)
(b)
1.5
2.5
3.5
4.5
5.5
6.5
Inle
t p
ress
ure
(b
ar)
0 10 20 30 40 50 60 70
Time (s)
(c)
20
25
30
35
40
45
Mas
s fl
ow
rat
e (g
/s)
0 10 20 30 40 50 60 70
Time (s)
Tube-1
Tube-2
Tube-3
(d)
F 15: Density wave oscillations (𝑄𝑄 𝑄 𝑄𝑄 kW, 𝑇𝑇in 𝑄 𝑄5∘C).
the system more unstable. In Figures 9, 10, and 11, thetime dependent top and bottom wall temperatures, the inletpressure, and themass �ow rate are shown schematically.efact that the bubbles occurring because of the too small tubediameter cover both the top and the bottom walls preventshigher temperature differences to comprise between thewalls. For each ring type, the p. d. o. oscillations are observedand these oscillations cause �uctuations with big amplitudesin the inlet pressure, top and bottom wall temperatures, and
the mass �ow rate. �lso, oscillations in the mass �ow rate areobserved in addition to the inlet pressure. e amplitudes ofthe top wall are higher than at the bottom wall. When thethermal oscillations occur, the inlet pressure and the mass�ow rate oscillate at lower fre�uency with large amplitude.
e pressure drop type �ow oscillations are like dynamicinstabilities occurring in unstable �ows. e main effectcausing pressure drop type �ow oscillations to occur is thefact that a compressible volume exists. If the test section is

12 e �cienti�c World �ournal
125
135
145
155
165
175
0 10 20 30 40 50 60 70
Time (s)
(a)
140
150
160
170
180
190
200
0 10 20 30 40 50 60 70
Time (s)
(b)
1.5
2.5
3.5
4.5
5.5
6.5
Inle
t p
ress
ure
(b
ar)
0 10 20 30 40 50 60 70
Time (s)
(c)
10
15
20
25
30
35
40
45
Mas
s fl
ow
rat
e (g
/s)
0 10 20 30 40 50 60 70
Time (s)
Tube-1
Tube-2
Tube-3
(d)
F 16: Density wave oscillations (𝑄𝑄 𝑄 𝑄𝑄 kW, 𝑇𝑇in 𝑄 35∘C).
too long, the inner compressibility is enough for the pressuredrop oscillations to occur; if not, the compressible volumeis provided by a surge tank located at front side of the testsection. In industry, the pressure drop oscillations for thesystems including two-phase �ows have a large oscillationperiod and high oscillation amplitude. is case causes thelife of the system to decrease and makes it difficult to controlthe �ow.erefore, the fact that the pressure drop oscillationsare determined and taken under control is vitally important.
In Figures 12 and 13, the e�ects of the mass �ow rate on inletpressure periods and amplitudes for all investigated tubes at𝑇𝑇𝑖𝑖 𝑄 15∘C are presented. For all tubes, the periods and theamplitudes belonging to the inlet pressure increase by theincrease of the mass �ow rate. If an order is made in terms ofthe periods and the amplitudes, it easily seen that the periodsand the amplitudes in tube-1 (smooth tube) are higher thanthose of the tubes with insertions.e tubes are ordered fromthe highest period and amplitude to the lowest ones as tube-1,

e Scienti�c World �ournal 13
0
4
8
12
16
20
24
15 20 25 30 35 40 45
Per
iod
of
inle
t p
ress
ure
(s)
Mass flow rate (g/s)
Tube-1
Tube-3
Tube-2
F 17: e variations of the periods with the mass �ow rate forall tubes (d. w. o.).
0
0.1
0.2
0.3
0.4
0.5
10 20 30 40 50
Am
pli
tud
e o
f in
let
pre
ssu
re (
bar
)
Mass flow rate (g/s)
Tube-1
Tube-3
Tube-2
F 18: e variations in the amplitudes with the mass �ow ratefor all tubes (d. w. o.).
tube-3, and tube-2. According to this order, the smooth tubewith the biggest effective diameter has the biggest period andamplitude, while tube-2 with the smallest effective diameterhas the smallest period and amplitude. In the other words, itcan be said that the period and the amplitude increase as longas the effective diameter increases. Furthermore, the periodsand the amplitudes also increase with the increase in the pitchratio.
e density wave �ow oscillations occur as a result ofboiling and the hydrodynamic behaviours of the �ow type.e density wave �ow oscillations take place together withthe pressure drop oscillations as superimposed in the regionwith negative slope. e pure density wave oscillations areobserved as long as they move to the upper points of the neg-ative sloped region, towards the unstable region. e periodand the amplitude values of the pure density wave oscillationsare lower than the pressure drop type. Furthermore, thepure d. w. o. in smooth tubes occurs at higher �ow ratesrelative to the tubes having insertions. In two-phase �ows, the
separation of the phases in the smooth tubes is observedmoreclearly than in the tubes with insertions.
In Figures 14, 15 and 16, the time dependent variationsof both top wall and the bottom wall, the inlet pressure andmass �ow rates are presented. For each ring type, the d.w. o. oscillations are observed and these oscillations cause�uctuations with big amplitudes in the inlet pressure, topand bottom wall temperatures, and the mass �ow rate. Also,oscillations in the mass �ow rate are observed in additionto the inlet pressure. e amplitudes of the bottom wall arehigher than at the top wall. When the thermal oscillationsoccur, the inlet pressure and the mass �ow rate oscillate atlower frequency with large amplitude.
Figures 17 and 18 show the variations of the periodsand amplitudes with mass �ow rates. For all investigatedtubes, the periods and the amplitudes increase as long asthe mass �ow rate increases. e amplitude and period ofthe smooth tube are higher than the other con�gurations.In terms of both the amplitude and the period, the orderfrom the biggest to the smallest is tube-1, tube-3, and tube-2. According to the order made for pure d. w. o., the smoothtube with the biggest effective diameter has the biggest periodand amplitude, and the tube-2 with the smallest effectivediameter has the smallest period and amplitude. Similar tothe results of pressure drop oscillations, the period and theamplitude increase as long as the effective diameter increases.Also, the periods and the amplitudes also increase with theincrease in the pitch ratio.
4. Conclusions
e aim of this study was to experimentally investigate theeffect of the coiled wire insertions on dynamic instabilitiesand to compare the results with the smooth tube for forcedconvection boiling. e experiments were conducted in acircular tube, and water was used as the working �uid. �wodifferent pitch ratios (𝐻𝐻𝐻𝐻𝐻 𝐻 𝐻𝐻𝐻𝐻 and 5.55) of coiled wirewith circular a cross-section were utilised. e constant heat�ux boundary condition was applied to the outer side of thetest tube, and the constant exit restrictionwas used at the tubeoutlet. e remarkable conclusions are ordered as presentedbelow.
(i) e rings had a higher pressure drop than the smoothtube and the pressure drop increasedwith the increasein the pitch ratio.
(ii) e system became more unstable as long as thenegative slope angle of the steady state characteristiccurves increased. As the negative slope angle of thesmooth tube was lower than the tubes with innerelements, the smooth tube was more stable than theother tubes.
(iii) In the single phase �ow region corresponding tothe high �ow rates, no oscillation was observed.e beginning and the end points of the p. d. o.slipped towards lower �ow rates as long as the inletsubcooling rate increased. By the decrease of the inlettemperature, the single phase �ow region increasedand thus the system became more stable.

14 e Scienti�c World Journal
(iv) e reason why the system was more stable was thefact that the oscillations started at lower mass �owrates. e oscillations in the tubes with insertionsbegan at lower �ow rates than the smooth tube and�nished at higher �ow rates.
(v) e start point of the p. d. o. drew back towardsthe lower �ow rates as long as the inlet temperaturedecreased. is case showed that increasing the inletsubcooling made the system more stable for all thetubes investigated.
(vi) e imposed oscillation region of p. d. o. and d.w. o. grew by the increase of the gap between theboundaries.
(vii) e fact that the bubbles occurred because of the toosmall tube diameter covered both the top and the bot-tom walls prevented higher temperature differencesto comprise between the walls.
(viii) For each tube, the p. d. o. oscillations were observedand these oscillations caused the �uctuations with bigamplitudes in the inlet pressure, top and bottom walltemperatures, and the mass �ow rate.
(ix) e oscillations in the mass �ow rate were observedin addition to the inlet pressure.e amplitudes of thetop wall were higher than those of the bottom wall.
(x) When the thermal oscillations occurred, the inletpressure and the mass �ow rate oscillated at a lowerfrequency with a large amplitude.
Acknowledgment
is research was supported by BAP of the Research Fund ofAtaturk University.
References
[1] S. Karagoz, Investigation of the effects of heat transfer enhance-ment on two phase �ow instabilities �Ph.D. thesis�, EngineeringFaculty, Ataturk University, Erzurum, Turkey, 2007.
[2] G. Omeroglu, Investigation of the effects of the turbulators ontwo phase �ow instabilities �Ph.D. thesis�, Engineering Faculty,Ataturk University, Erzurum, Turkey, 2012.
[3] S. Karsli, M. Yilmaz, and O. Comakli, “e effect of internalsurface modi�cation on �ow instabilities in forced convectionboiling in a horizontal tube,” International Journal of Heat andFluid Flow, vol. 23, no. 6, pp. 776–791, 2002.
[4] O. Çomakli, S. Karsli, and M. Yilmaz, “Experimental investi-gation of two phase �ow instabilities in a horizontal in-tubeboiling system,” Energy Conversion and Management, vol. 43,no. 2, pp. 249–268, 2002.
[5] A. Menteş, O. T. Yıldırım, S. Kakaç, and T. N. Veziroğlu, “Two-phase �ow instabilities in a single channel up �ow system,”in Proceedings of the Japan-U.S. Seminar on Two-Phase FlowDynamics, pp. 5–8, Lake Placid, NY, USA, 1984.
[6] S. Kakaç, C. O. Gavrilescu, and Ö. Çomaklı, “Two-phase�ow instabilities with augmented surfaces in a horizontal in-tube boiling system,” in Proceedings of the Turkish NationalConference on ermal Sciences and Technologies, pp. 1–26,Ankara, Turkey, September 1995.
[7] S. Kakaç, “A review of two-phase �ow instabilities,” in Advancesin Two-Phase Flow on Heat Transfer, vol. 2, pp. 577–668,Martinus Nijhoff, Boston, Mass, USA, 1994.
[8] J. W. Coleman and S. Garimella, “Two-phase �ow regimes inround, square and rectangular tubes during condensation ofrefrigerant R 134a,” International Journal of Refrigeration, vol.26, no. 1, pp. 117–128, 2003.
[9] L. K. H. Leung, D. C. Groeneveld, A. Teyssedou, and F. Aubé,“Pressure drops for steam and water �ow in heated tubes,”Nuclear Engineering andDesign, vol. 235, no. 1, pp. 53–65, 2005.
[10] Ö. Çomaklı, M. Yılmaz, Ö. Bedir, and B. Şahin, “Isı Trans-fer İyileştirmesinin İki Fazlı Akış Kararsızlıklarına Etkisi,”Mühendis Ve Makina, vol. 48, no. 565, pp. 9–17, 2007.
[11] L. Tadrist, “Review on two-phase �ow instabilities in narrowspaces,” International Journal of Heat and Fluid Flow, vol. 28,no. 1, pp. 54–62, 2007.
[12] Z. Y. Bao, D. F. Fletcher, and B. S. Haynes, “An experimentalstudy of gas-liquid �ow in a narrow conduit,” International Jour-nal of Heat and Mass Transfer, vol. 43, no. 13, pp. 2313–2324,2000.
[13] Ö. Çomaklı, Ş. Karagöz, M. Yılmaz, and S. Karslı, “Yataybir borudaki kaynamalı iki fazlı akış karasızlıkları ve akışkantipinin etkileri,” Teknoloji, vol. 11, pp. 15–24, 2008.
[14] S. Kakaç and L. Cao, “e effect of heat transfer enhancementon two-phase �ow dynamic instabilities in a boiling system,” inProceedings of the International Conference on ComputationalHeat and Mass Transfer (CHMT ’99), A. A. Mohamad, S. I.Eastern, and G. Mağusa, Eds., pp. 448–462, MediterraneanUniversity, April 1999.
[15] P. Poesio, “Experimental determination of pressure drop andstatistical properties of oil-water intermittent �ow throughhorizontal pipe,” Experimental ermal and Fluid Science, vol.32, no. 8, pp. 1523–1529, 2008.
[16] G. Sotgia, P. Tartarini, and E. Stalio, “Experimental analysisof �ow regimes and pressure drop reduction in oil-watermixtures,” International Journal of Multiphase Flow, vol. 34, no.12, pp. 1161–1174, 2008.
[17] J. Moreno Quibén and J. R. ome, “Flow pattern based two-phase frictional pressure drop model for horizontal tubes, PartII: new phenomenological model,” International Journal of Heatand Fluid Flow, vol. 28, no. 5, pp. 1060–1072, 2007.
[18] S. Kakac and B. Bon, “A review of two-phase �ow dynamicinstabilities in tube boiling systems,” International Journal ofHeat and Mass Transfer, vol. 51, no. 3-4, pp. 399–433, 2008.
[19] W. Yu, D. M. France, M. W. Wambsganss, and J. R. Hull, “Two-phase pressure drop, boiling heat transfer, and critical heat�ux to water in a small-diameter horizontal tube,” InternationalJournal of Multiphase Flow, vol. 28, no. 6, pp. 927–941, 2002.
[20] M. Yılmaz, Ö. Çomaklı, Ş. Karagöz, and Ö. Bedir, İki FazlıAkışlarda Isı Transfer İyileştirmesi-1 Termodinamik, vol. 176,2007.
[21] M. Yılmaz, Ö. Çomaklı, Ş. Karagöz, and Ö. Bedir, İki FazlıAkışlarda Isı Transfer İyileştirmesi-2 Termodinamik, vol. 176,2007.
[22] F. Widmann, O. Comakli, C. O. Gavrilescu, Y. Ding, and S.Kakac, “e effect of augmented surfaces on two-phase �owinstabilities in a horizontal system,” Journal of Enhanced HeatTransfer, vol. 2, no. 4, pp. 263–271, 1995.
[23] S. Karagoz, S. Karsli,M. Yilmaz, andO. Comakli, “Density-wave�ow oscillations in a water boiling horizontal tube with inserts,”Journal of Enhanced Heat Transfer, vol. 16, no. 4, pp. 331–350,2009.

TribologyAdvances in
Hindawi Publishing Corporationhttp://www.hindawi.com Volume 2014
International Journal of
AerospaceEngineeringHindawi Publishing Corporationhttp://www.hindawi.com Volume 2014
FuelsJournal of
Hindawi Publishing Corporationhttp://www.hindawi.com Volume 2014
Journal ofPetroleum Engineering
Hindawi Publishing Corporationhttp://www.hindawi.com Volume 2014
Industrial EngineeringJournal of
Hindawi Publishing Corporationhttp://www.hindawi.com Volume 2014
Power ElectronicsHindawi Publishing Corporationhttp://www.hindawi.com Volume 2014
Advances in
CombustionJournal of
Hindawi Publishing Corporationhttp://www.hindawi.com Volume 2014
Journal of
Hindawi Publishing Corporationhttp://www.hindawi.com Volume 2014
Renewable Energy
Submit your manuscripts athttp://www.hindawi.com
Hindawi Publishing Corporationhttp://www.hindawi.com Volume 2014
StructuresJournal of
International Journal of
RotatingMachinery
Hindawi Publishing Corporationhttp://www.hindawi.com Volume 2014
EnergyJournal of
Hindawi Publishing Corporationhttp://www.hindawi.com Volume 2014
Hindawi Publishing Corporation http://www.hindawi.com
Journal ofEngineeringVolume 2014
Hindawi Publishing Corporation http://www.hindawi.com Volume 2014
International Journal ofPhotoenergy
Hindawi Publishing Corporationhttp://www.hindawi.com Volume 2014
Nuclear InstallationsScience and Technology of
Hindawi Publishing Corporationhttp://www.hindawi.com Volume 2014
Solar EnergyJournal of
Hindawi Publishing Corporationhttp://www.hindawi.com Volume 2014
Wind EnergyJournal of
Hindawi Publishing Corporationhttp://www.hindawi.com Volume 2014
Nuclear EnergyInternational Journal of
Hindawi Publishing Corporationhttp://www.hindawi.com Volume 2014
High Energy PhysicsAdvances in
The Scientific World JournalHindawi Publishing Corporation http://www.hindawi.com Volume 2014