3800 years of quantitative precipitation …...3800 years of quantitative precipitation...
TRANSCRIPT
3800 Years of Quantitative Precipitation Reconstructionfrom the Northwest Yucatan PeninsulaAlicia Carrillo-Bastos, Gerald A. Islebe*, Nuria Torrescano-Valle
El Colegio de la Frontera Sur, Unidad Chetumal, Herbario, Chetumal, Quintana Roo, Mexico
Abstract
Precipitation over the last 3800 years has been reconstructed using modern pollen calibration and precipitation data. Atransfer function was then performed via the linear method of partial least squares. By calculating precipitation anomalies, itis estimated that precipitation deficits were greater than surpluses, reaching 21% and ,9%, respectively. The period from 50BC to 800 AD was the driest of the record. The drought related to the abandonment of the Maya Preclassic period featured a21% reduction in precipitation, while the drought of the Maya collapse (800 to 860 AD) featured a reduction of 18%. TheMedieval Climatic Anomaly was a period of positive phases (3.8–7.6%). The Little Ice Age was a period of climatic variability,with reductions in precipitation but without deficits.
Citation: Carrillo-Bastos A, Islebe GA, Torrescano-Valle N (2013) 3800 Years of Quantitative Precipitation Reconstruction from the Northwest YucatanPeninsula. PLoS ONE 8(12): e84333. doi:10.1371/journal.pone.0084333
Editor: Gil Bohrer, The Ohio State University, United States of America
Received April 29, 2013; Accepted November 21, 2013; Published December 31, 2013
Copyright: � 2013 Carrillo-Bastos et al. This is an open-access article distributed under the terms of the Creative Commons Attribution License, which permitsunrestricted use, distribution, and reproduction in any medium, provided the original author and source are credited.
Funding: This work received funding from: Conacyt funding project 127613. www.conacyt.mx. The funders had no role in study design, data collection andanalysis, decision to publish, or preparation of the manuscript.
Competing Interests: The authors have declared that no competing interests exist.
* E-mail: [email protected]
Introduction
The understanding of climate dynamics and the prediction of
future changes require the identification of patterns of climatic
change at different temporal scales [1]. To find these patterns, it is
necessary to take into account continuous readings that go beyond
instrumental measurements, which provide a temporally limited
perspective.
Fossil pollen is a natural source of climatic information.
Vegetation is subject to environmental conditions that favor
certain species depending on their climatic preference. By
calibrating modern pollen samples with climate variables, it is
possible to reconstruct quantitative climatic parameters [2].
Precipitation is one of the most important and sensitive
parameters of the tropical climate [3]. The reconstruction of
precipitation is of great interest because it permits the validation of
climatic change models by examining the patterns of the past,
present, and future [4]. On the Yucatan Peninsula, the fossil pollen
record has been analyzed in terms of vegetation change. However,
the inferences concerning climate have been expressed only in
qualitative terms (wetter/drier). In the Yucatan region, the
variability in precipitation had an important influence on the
cultural history of the Mayan civilization [5]. Previous studies on
the peninsula have indicated that the droughts suffered during the
Classic period contributed to the collapse of the Mayan civilization
[6–9].
A quantitative estimate of the precipitation over the last 1500
years is available for the peninsula. The record is based on
measurements of d18O values in stalagmites from the Tzabnabh
cave [8]. In that study, it was determined that precipitation
decreased by 36–52% relative to modern precipitation during the
multiple droughts at the end of the Classic period. Recently, based
on quantitative analysis of high-resolution climate records, it was
concluded that the droughts of the Terminal Classic period were
due to the reduction in the frequency and intensity of summer
storms [9].
The Yucatan Peninsula is influenced by a number of different
components of the climate system, creating a zone of mixed
climates. For this reason, it is necessary to investigate whether the
changes that occurred in this region were similar in magnitude,
frequency and time in order to understand climatic variability.
These changes are of particular importance because studying the
events of the recent past will permit us to foresee what may occur
in the near future, as climatic forcing that operated during the late
Holocene did not significantly change [10]. With the purpose of
contributing to the knowledge of climatic variability of the
Yucatan Peninsula, this study presents a reconstruction of the
vegetation from the northwest corner of the peninsula and the first
quantitative reconstruction of precipitation for the last 3800 years.
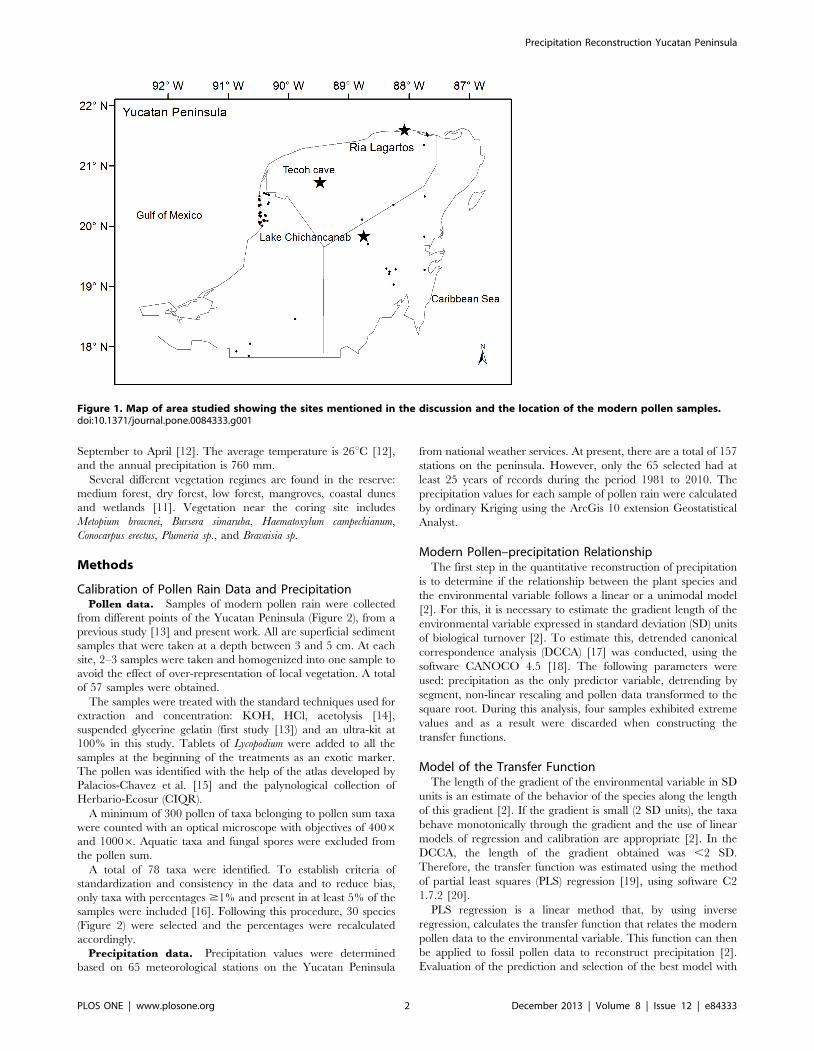
Study AreaThe study area is located in the northwest Yucatan Peninsula
between the coordinates 21.5661N and 88.0865W in the
biosphere reserve of Ria Lagartos (Figure 1). Because of its
geographical position and proximity to the sea, the site is
influenced by several different patterns of atmospheric circulation,
such as the trade winds, polar air masses and the convection
currents that provide precipitation [11]. The climate type is
BSo(h’)w(x)iw, warm-semiarid and evaporation exceeds precipita-
tion. The largest portion of the annual precipitation is received
during the summer (62%), when the Intertropical Convergence
Zone (ITCZ) and Bermuda Azores high-pressure cell move to the
north and the trade winds intensify. The remaining precipitation
(38%) occurs during the dry season from November to May. The
influence of polar air masses occurs during the months of
PLOS ONE | www.plosone.org 1 December 2013 | Volume 8 | Issue 12 | e84333
September to April [12]. The average temperature is 26uC [12],
and the annual precipitation is 760 mm.
Several different vegetation regimes are found in the reserve:
medium forest, dry forest, low forest, mangroves, coastal dunes
and wetlands [11]. Vegetation near the coring site includes
Metopium brownei, Bursera simaruba, Haematoxylum campechianum,
Conocarpus erectus, Plumeria sp., and Bravaisia sp.
Methods
Calibration of Pollen Rain Data and PrecipitationPollen data. Samples of modern pollen rain were collected
from different points of the Yucatan Peninsula (Figure 2), from a
previous study [13] and present work. All are superficial sediment
samples that were taken at a depth between 3 and 5 cm. At each
site, 2–3 samples were taken and homogenized into one sample to
avoid the effect of over-representation of local vegetation. A total
of 57 samples were obtained.
The samples were treated with the standard techniques used for
extraction and concentration: KOH, HCl, acetolysis [14],
suspended glycerine gelatin (first study [13]) and an ultra-kit at
100% in this study. Tablets of Lycopodium were added to all the
samples at the beginning of the treatments as an exotic marker.
The pollen was identified with the help of the atlas developed by
Palacios-Chavez et al. [15] and the palynological collection of
Herbario-Ecosur (CIQR).
A minimum of 300 pollen of taxa belonging to pollen sum taxa
were counted with an optical microscope with objectives of 4006and 10006. Aquatic taxa and fungal spores were excluded from
the pollen sum.
A total of 78 taxa were identified. To establish criteria of
standardization and consistency in the data and to reduce bias,
only taxa with percentages $1% and present in at least 5% of the
samples were included [16]. Following this procedure, 30 species
(Figure 2) were selected and the percentages were recalculated
accordingly.
Precipitation data. Precipitation values were determined
based on 65 meteorological stations on the Yucatan Peninsula
from national weather services. At present, there are a total of 157
stations on the peninsula. However, only the 65 selected had at
least 25 years of records during the period 1981 to 2010. The
precipitation values for each sample of pollen rain were calculated
by ordinary Kriging using the ArcGis 10 extension Geostatistical
Analyst.
Modern Pollen–precipitation RelationshipThe first step in the quantitative reconstruction of precipitation
is to determine if the relationship between the plant species and
the environmental variable follows a linear or a unimodal model
[2]. For this, it is necessary to estimate the gradient length of the
environmental variable expressed in standard deviation (SD) units
of biological turnover [2]. To estimate this, detrended canonical
correspondence analysis (DCCA) [17] was conducted, using the
software CANOCO 4.5 [18]. The following parameters were
used: precipitation as the only predictor variable, detrending by
segment, non-linear rescaling and pollen data transformed to the
square root. During this analysis, four samples exhibited extreme
values and as a result were discarded when constructing the
transfer functions.
Model of the Transfer FunctionThe length of the gradient of the environmental variable in SD
units is an estimate of the behavior of the species along the length
of this gradient [2]. If the gradient is small (2 SD units), the taxa
behave monotonically through the gradient and the use of linear
models of regression and calibration are appropriate [2]. In the
DCCA, the length of the gradient obtained was ,2 SD.
Therefore, the transfer function was estimated using the method
of partial least squares (PLS) regression [19], using software C2
1.7.2 [20].
PLS regression is a linear method that, by using inverse
regression, calculates the transfer function that relates the modern
pollen data to the environmental variable. This function can then
be applied to fossil pollen data to reconstruct precipitation [2].
Evaluation of the prediction and selection of the best model with
Figure 1. Map of area studied showing the sites mentioned in the discussion and the location of the modern pollen samples.doi:10.1371/journal.pone.0084333.g001
Precipitation Reconstruction Yucatan Peninsula
PLOS ONE | www.plosone.org 2 December 2013 | Volume 8 | Issue 12 | e84333
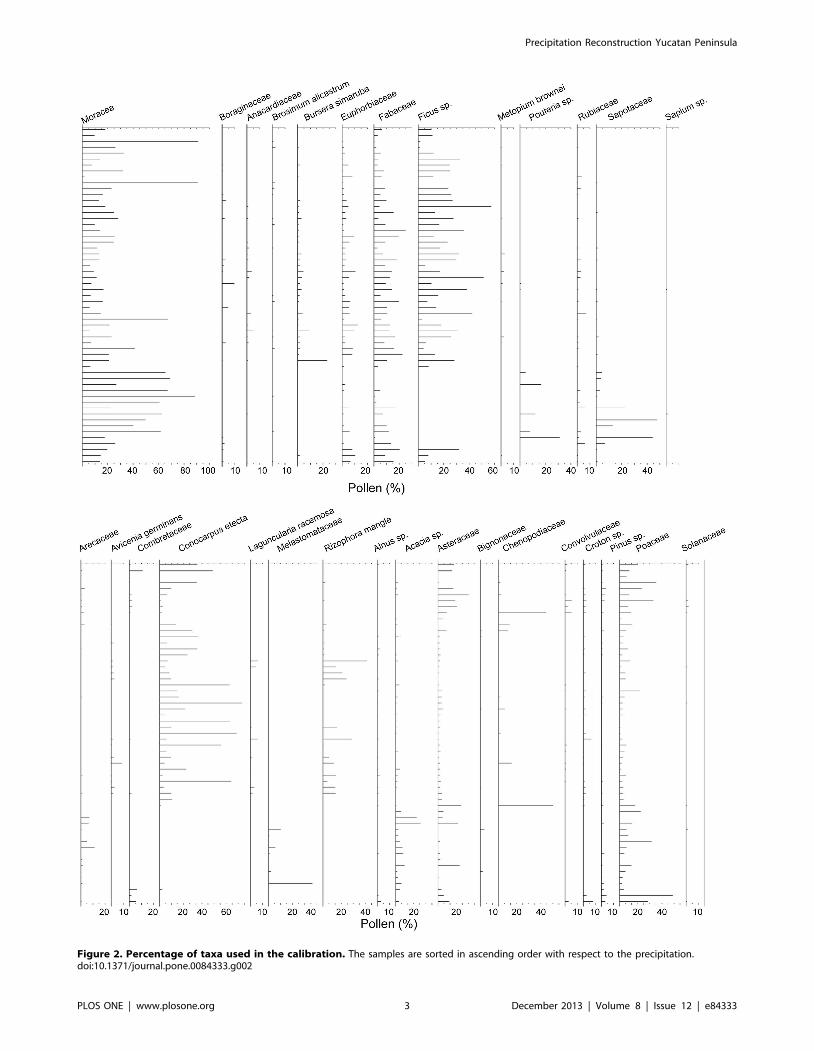
Figure 2. Percentage of taxa used in the calibration. The samples are sorted in ascending order with respect to the precipitation.doi:10.1371/journal.pone.0084333.g002
Precipitation Reconstruction Yucatan Peninsula
PLOS ONE | www.plosone.org 3 December 2013 | Volume 8 | Issue 12 | e84333

the smallest number of components are based on the combination
of the values of maximum bias, root mean squared error
(RMSEP), the coefficient of determination (r2) and the residuals,
all four of which are based on the method of cross-validation by
bootstrapping 1000 interactions. The model selected was a two
component PLS regression.
The precipitation anomalies are calculated using the following
formula: A = (Ri –Rm)*100/Rm, where A is the anomaly of every
period, Ri is the estimated precipitation in the same period and Rm
is the average of all recorded precipitation.
Fossil DataWith a Russian corer, 50 cm sections of fossil sediment were
obtained in a lagoon situated 5 to 7 km from the coastline. The
total length of the core was 200 cm. The sediment was packed and
transported to the palynology laboratory of Ecosur-Chetumal. The
sediment was processed by physical and chemical treatments using
the following protocol: treatment with HCl, filtration, digestion by
KOH, acetolysis and mounted in Ultra-Kit at 100%. During the
treatment with HCl, tablets of Lycopodium were added as an exotic
marker. A total of 74 samples of fossilized pollen were obtained at
an interval of 3 cm.
Taxa were separated by groups of ecological preference:
tropical forest, disturbed taxa and mangrove. The pollen data
are available in the Neotoma Database (http://www.neotomadb.
org/uploads/data_subs/LAGARTOS.zip). The results obtained
were graphed in a pollen diagram using the software TILIA 1.7.16
[21]. Pollen zones were determined by classification analysis based
on the index of similarity using the tool CONISS, integrated into
the same software package. The chronology was estimated by a
linear regression applied to three radiocarbon dates (AMS)
(Table 1) measured in the organic matter of the samples. The
samples were analyzed in the laboratory of Beta Analytic Inc. in
Miami, Florida. The radiocarbon dates were calibrated with the
program CALIB 6.1.1 [22] using the IntCal09 calibration curve
[23], rounded to the nearest decade and converted to calendar
ages using 1950 AD as 0 cal yr BP.
Ethics StatementThe samples are from locations where no specific permissions
were required, and field studies did not involve endangered or
protected species.
Results
Modern Pollen – precipitation RelationshipIn the DCCA, the length of the gradient was 1.69 SD. The
correlation between the first ordination axis of the taxa and
precipitation was 0.803, while the percentage of variance
accumulated between taxa and the precipitation was 95.6%.
The eigenvalue of the first ordination axis was 0.201. The
ordination diagram showed separation of taxa in the first axis,
which generated the correlation with the precipitation (Figure 3).
Model of the Transfer FunctionIn the construction of the transfer function, a model with two
components is used (Table 2). This model showed the lowest value
of the RMSEP (131 mm) and a medium–high value for the
coefficient of determination (0.703). The value of maximum bias
(280.612) was not the smallest, but with this number of model
components, the percentage of reduction in the RMSEP was
7.041% and the value of significance was 0.04.
Chronology and Reconstruction of the VegetationThe resulting equation of the linear regression applied in
conjunction with the calibrated ages (Table 1) produced, as a
result, an age of 1850 BC at the bottom of the record.
Table 1. Radiocarbon ages (AMS) and sedimentation rates.
Sample code Depth (cm)Radiocarbon age(yr BP)
Calibrated age(cal yr BP)
Calendar age(BC/AD)
Relative area underprobabilitydistribution (2s)
Sedimentationrate (mm/yr)
Beta-317982 84.1 2160630 2056–2185 106–235 BC 0.54807 0.40
Beta-325222 171.36 3020630 3141–3338 1191–1388 BC 0.974839 0.78
Beta-325223 193.8 3130630 3319–3409 1369–1459 BC 0.847747 1.80
Regression equation for chronology Age = (depth+9.1809)/0.055 r2 = 0.95987.doi:10.1371/journal.pone.0084333.t001
Figure 3. Ordination diagram results of DCCA.doi:10.1371/journal.pone.0084333.g003
Precipitation Reconstruction Yucatan Peninsula
PLOS ONE | www.plosone.org 4 December 2013 | Volume 8 | Issue 12 | e84333
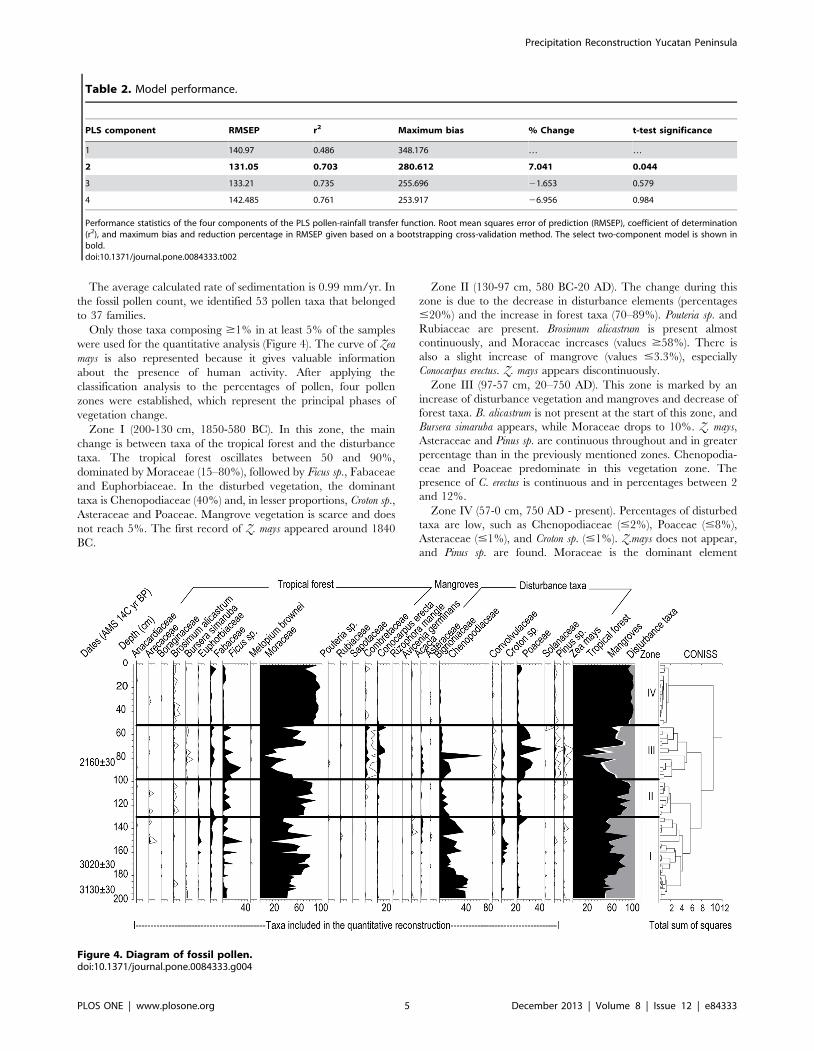
The average calculated rate of sedimentation is 0.99 mm/yr. In
the fossil pollen count, we identified 53 pollen taxa that belonged
to 37 families.
Only those taxa composing $1% in at least 5% of the samples
were used for the quantitative analysis (Figure 4). The curve of Zea
mays is also represented because it gives valuable information
about the presence of human activity. After applying the
classification analysis to the percentages of pollen, four pollen
zones were established, which represent the principal phases of
vegetation change.
Zone I (200-130 cm, 1850-580 BC). In this zone, the main
change is between taxa of the tropical forest and the disturbance
taxa. The tropical forest oscillates between 50 and 90%,
dominated by Moraceae (15–80%), followed by Ficus sp., Fabaceae
and Euphorbiaceae. In the disturbed vegetation, the dominant
taxa is Chenopodiaceae (40%) and, in lesser proportions, Croton sp.,
Asteraceae and Poaceae. Mangrove vegetation is scarce and does
not reach 5%. The first record of Z. mays appeared around 1840
BC.
Zone II (130-97 cm, 580 BC-20 AD). The change during this
zone is due to the decrease in disturbance elements (percentages
#20%) and the increase in forest taxa (70–89%). Pouteria sp. and
Rubiaceae are present. Brosimum alicastrum is present almost
continuously, and Moraceae increases (values $58%). There is
also a slight increase of mangrove (values #3.3%), especially
Conocarpus erectus. Z. mays appears discontinuously.
Zone III (97-57 cm, 20–750 AD). This zone is marked by an
increase of disturbance vegetation and mangroves and decrease of
forest taxa. B. alicastrum is not present at the start of this zone, and
Bursera simaruba appears, while Moraceae drops to 10%. Z. mays,
Asteraceae and Pinus sp. are continuous throughout and in greater
percentage than in the previously mentioned zones. Chenopodia-
ceae and Poaceae predominate in this vegetation zone. The
presence of C. erectus is continuous and in percentages between 2
and 12%.
Zone IV (57-0 cm, 750 AD - present). Percentages of disturbed
taxa are low, such as Chenopodiaceae (#2%), Poaceae (#8%),
Asteraceae (#1%), and Croton sp. (#1%). Z.mays does not appear,
and Pinus sp. are found. Moraceae is the dominant element
Table 2. Model performance.
PLS component RMSEP r2 Maximum bias % Change t-test significance
1 140.97 0.486 348.176 … …
2 131.05 0.703 280.612 7.041 0.044
3 133.21 0.735 255.696 21.653 0.579
4 142.485 0.761 253.917 26.956 0.984
Performance statistics of the four components of the PLS pollen-rainfall transfer function. Root mean squares error of prediction (RMSEP), coefficient of determination(r2), and maximum bias and reduction percentage in RMSEP given based on a bootstrapping cross-validation method. The select two-component model is shown inbold.doi:10.1371/journal.pone.0084333.t002
Figure 4. Diagram of fossil pollen.doi:10.1371/journal.pone.0084333.g004
Precipitation Reconstruction Yucatan Peninsula
PLOS ONE | www.plosone.org 5 December 2013 | Volume 8 | Issue 12 | e84333
($70%). Ficus sp. are lower. B. simaruba is not present, while B.
alicastrum is present continuously. The curve of C. erectus is
discontinuous.
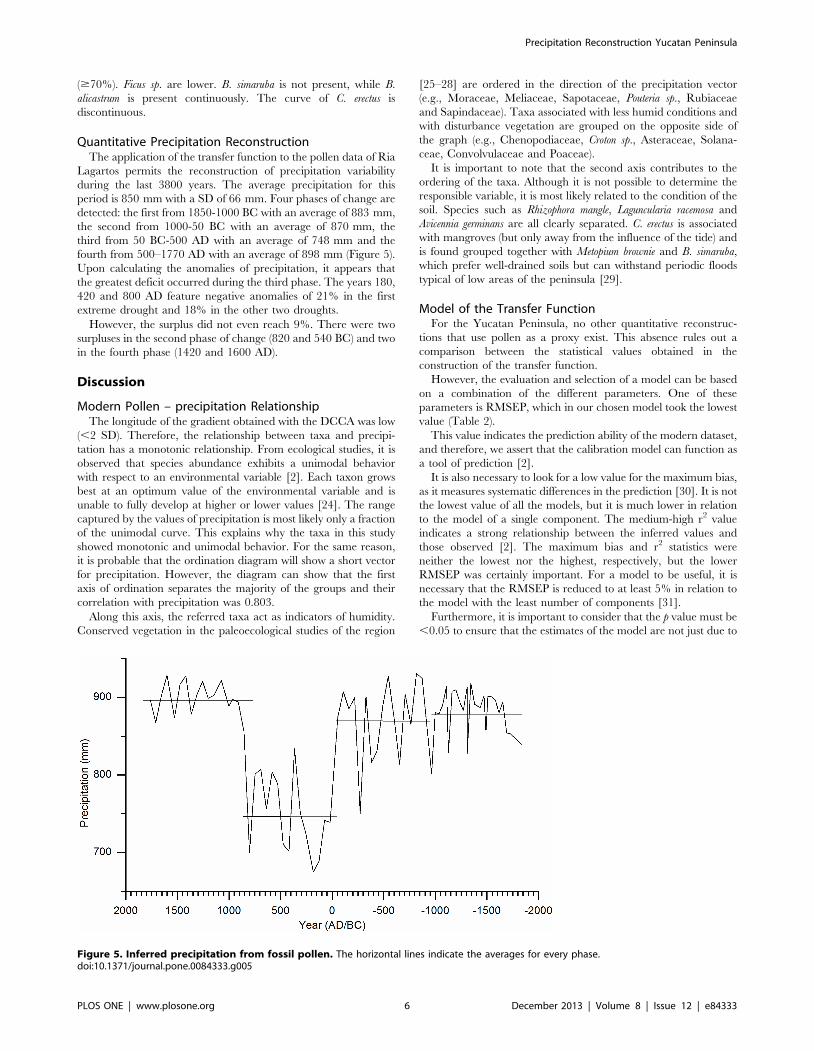
Quantitative Precipitation ReconstructionThe application of the transfer function to the pollen data of Ria
Lagartos permits the reconstruction of precipitation variability
during the last 3800 years. The average precipitation for this
period is 850 mm with a SD of 66 mm. Four phases of change are
detected: the first from 1850-1000 BC with an average of 883 mm,
the second from 1000-50 BC with an average of 870 mm, the
third from 50 BC-500 AD with an average of 748 mm and the
fourth from 500–1770 AD with an average of 898 mm (Figure 5).
Upon calculating the anomalies of precipitation, it appears that
the greatest deficit occurred during the third phase. The years 180,
420 and 800 AD feature negative anomalies of 21% in the first
extreme drought and 18% in the other two droughts.
However, the surplus did not even reach 9%. There were two
surpluses in the second phase of change (820 and 540 BC) and two
in the fourth phase (1420 and 1600 AD).
Discussion
Modern Pollen – precipitation RelationshipThe longitude of the gradient obtained with the DCCA was low
(,2 SD). Therefore, the relationship between taxa and precipi-
tation has a monotonic relationship. From ecological studies, it is
observed that species abundance exhibits a unimodal behavior
with respect to an environmental variable [2]. Each taxon grows
best at an optimum value of the environmental variable and is
unable to fully develop at higher or lower values [24]. The range
captured by the values of precipitation is most likely only a fraction
of the unimodal curve. This explains why the taxa in this study
showed monotonic and unimodal behavior. For the same reason,
it is probable that the ordination diagram will show a short vector
for precipitation. However, the diagram can show that the first
axis of ordination separates the majority of the groups and their
correlation with precipitation was 0.803.
Along this axis, the referred taxa act as indicators of humidity.
Conserved vegetation in the paleoecological studies of the region
[25–28] are ordered in the direction of the precipitation vector
(e.g., Moraceae, Meliaceae, Sapotaceae, Pouteria sp., Rubiaceae
and Sapindaceae). Taxa associated with less humid conditions and
with disturbance vegetation are grouped on the opposite side of
the graph (e.g., Chenopodiaceae, Croton sp., Asteraceae, Solana-
ceae, Convolvulaceae and Poaceae).
It is important to note that the second axis contributes to the
ordering of the taxa. Although it is not possible to determine the
responsible variable, it is most likely related to the condition of the
soil. Species such as Rhizophora mangle, Laguncularia racemosa and
Avicennia germinans are all clearly separated. C. erectus is associated
with mangroves (but only away from the influence of the tide) and
is found grouped together with Metopium brownie and B. simaruba,
which prefer well-drained soils but can withstand periodic floods
typical of low areas of the peninsula [29].
Model of the Transfer FunctionFor the Yucatan Peninsula, no other quantitative reconstruc-
tions that use pollen as a proxy exist. This absence rules out a
comparison between the statistical values obtained in the
construction of the transfer function.
However, the evaluation and selection of a model can be based
on a combination of the different parameters. One of these
parameters is RMSEP, which in our chosen model took the lowest
value (Table 2).
This value indicates the prediction ability of the modern dataset,
and therefore, we assert that the calibration model can function as
a tool of prediction [2].
It is also necessary to look for a low value for the maximum bias,
as it measures systematic differences in the prediction [30]. It is not
the lowest value of all the models, but it is much lower in relation
to the model of a single component. The medium-high r2 value
indicates a strong relationship between the inferred values and
those observed [2]. The maximum bias and r2 statistics were
neither the lowest nor the highest, respectively, but the lower
RMSEP was certainly important. For a model to be useful, it is
necessary that the RMSEP is reduced to at least 5% in relation to
the model with the least number of components [31].
Furthermore, it is important to consider that the p value must be
,0.05 to ensure that the estimates of the model are not just due to
Figure 5. Inferred precipitation from fossil pollen. The horizontal lines indicate the averages for every phase.doi:10.1371/journal.pone.0084333.g005
Precipitation Reconstruction Yucatan Peninsula
PLOS ONE | www.plosone.org 6 December 2013 | Volume 8 | Issue 12 | e84333

chance. In this work, the p value of the reconstruction was 0.044.
Therefore, we can consider that this value is statistically significant.
The graphs that compare observed values to estimated values
(Figure 6a) and the observed values to the residuals (estimated
minus observed) (Figure 6b) show that the model predicts values
greater than 800 mm relatively well but is less reliable for medium
values. However, the low values tend to be overestimated, with
differences of at least 160 mm. Overall, the model is generally
better with high values than with low values.
Chronology and Reconstruction of the VegetationResearch has revealed that the vegetation of the region has been
subject to the impact of human activities since early times. The
first evidence of maize occurs around 1840 BC. The presence of
taxa such as Malvaceae, Acacia sp., Burseraceae, Ficus sp. and
Fabaceae indicates that, during this stage, the vegetation consisted
of secondary forest with Chenopodiaceae, Poaceae, and some
cultivated plants. Data from other sites on the Yucatan Peninsula
show conditions of low humidity during this stage [6], [26]. For
this reason, we may infer that the secondary character of the
vegetation is a reaction to the climatic conditions. The presence of
Rubiaceae and the increase in abundance of Moraceae indicate
that the forest recovered in the late phase of the middle Holocene
(1550-1130 BC).
At the beginning of the late Holocene, a reduction in Moraceae
and an increase of Ficus sp. and Chenopodiaceae are recorded,
suggesting disturbed conditions in the region. This disturbance was
not related to agricultural activity, as neither Z. mays nor elements
associated with cultivation, such as Croton sp., are present. Circa
950 BC, the vegetation acquired a more open character. This is
inferred by the increase in the percentage of Pinus sp., which do not
form part of the regional vegetation. The presence of this pollen
indicates that the arboreal cover was sparse enough to permit the
deposition of allochthonous pollen [32]. During this time, the
vegetation was a mosaic of low tropical forest, savannas and crops.
From 550 BC to 50 AD, the increase in Moraceae; the almost
continuous presence of B. alicastrum; and the presence of Pouteria
sp., Rubiaceae and Sapotaceae, indicate the recovery of the
vegetation.
From 50 to 750 AD, the tropical forest suffered the greatest
transformation of the studied period. The pollen record shows that
tree cover decreased circa 190 AD. This is demonstrated by the
reduction of tropical forest taxa (,50%) such as Moraceae
(,20%) and the increase of Pinus sp. and Ficus sp. This change in
the vegetation coincides temporally with the Preclassic drought
reported in the Maya region [7], [25–26], [33–35]. In 370 AD, the
forest changed to savanna. Pollen from arboreal elements
decreased by 15%, while the taxa of disturbance (Poaceae,
Chenopodiaceae, Convolvulaceae, Pinus sp., among others)
reached a total of 84%. During both transformations, agricultural
activity was present, but maize pollen also decreased notably
during these two events. This suggests that the climate was one of
the triggers of the vegetation transformation.
The highest intensity of agricultural activity occurred in 470 AD
based on the increase in pollen from maize as well as an increase in
Poaceae and Pinus sp., among other elements of disturbance. These
taxa reach values of 56%, while forest taxa contribute only 29%.
This suggests an expansion of savannas and crops but with more
arboreal vegetation present than the period of land clearing
discussed earlier.
The forest later recovered, and taxa suggest a decrease in the
expansion of cultivated and grassland areas, although grasslands
continued to be an important component of the vegetation
(between 14 and 29%).
The vegetation mosaic of this time was composed of low tropical
forest, savannas, crops and mangrove. Evidence of maize was last
recorded around 800 AD and was absent in the next analyzed date
(860 AD). For this reason, we infer a decrease of agricultural
activities and the cultural collapse between 800 and 860 AD.
Circa 1779 AD, the youngest estimated age of this study, forest
taxa percentages are the highest of the core. B. alicastrum is present
continuously and, together with the high percentages of Moraceae
and the presence of Anacardiaceae, Rubiaceae and Boraginaceae,
suggests more conserved vegetation. There are, however, slight
variations which coincide with small oscillations in the curve of
Pinus sp. and Poaceae, which suggest phases of reduced arboreal
cover.
Quantitative Precipitation ReconstructionThe statistical values in the construction of the transfer model
indicate that the estimated precipitation from the Ria Lagartos
core corresponds to changes in vegetation. However, the
Figure 6. Model diagnostic plots. (A) Relation between estimated (with the transfer function) vs. observed precipitation. (B) Residual relations(observed-estimated) vs. observed precipitation.doi:10.1371/journal.pone.0084333.g006
Precipitation Reconstruction Yucatan Peninsula
PLOS ONE | www.plosone.org 7 December 2013 | Volume 8 | Issue 12 | e84333

vegetation of the region has been impacted since early times by
human activity, which may interfere the reliability of the
precipitation reconstruction. Nevertheless, as suggested by Leyden
et al. [30], even under human influence, the pollen signal
maintains a relationship to climatic changes. Therefore, it is
indeed useful to compare pollen to the record of precipitation
anomalies at Ria Largatos, to the record of Z. mays and to the d18O
record of Lake Chichancanab [6] (Figure 7). With these
comparisons, it is clear that precipitation deficits (droughts) and
surpluses (wet phases) do not always correlate with rises and falls in
the percentage of Z. mays.
In the first phase of the precipitation record, surpluses were
more frequent than droughts and longer in duration (Figure 5).
Precipitation was 3% higher than the average of the last 3800
years. During this time (1850-1000 BC), isotope values of Lake
Chichancanab [6] are lower than the mean, suggesting wet
conditions. Changes in the maize record do not match changes in
the precipitation record, which suggest that variations in
precipitation correspond to climate variability. This phase can
be divided into two stages. During the first (1850-1250 BC),
precipitation is above average and reaches surpluses of 6.7%. This
wet stage can also be observed in a previous study of Ria Largatos
[33] and in the Cariaco Basin [34]. During the second stage,
droughts occur (precipitation 3.4% below average), but the
surpluses are of similar magnitudes to those of the first stage.
The beginning (950 BC) of the second phase is marked by a
drought where the precipitation decreases by 6.4%. This drought
coincides with an increase in the d18O values of Lake
Chichancanab [6], Lake Tzib [26] and Lake Punta Laguna
[36], along with the decrease in the percentage of forest taxa in the
previous study of Ria Largatos [33]. We detect an increase in the
maize record. It is probable then that the decrease in precipitation
is less than the reconstruction suggests.
The largest surplus (8.75%) is recorded around 320 BC, which
agrees with lower d18O values of Lake Chichancanab [6] and with
one of the highest percentages of Ti in the last 4000 years in the
Cariaco Basin [34]. The recorded increase in precipitation also
coincides with an increase in solar radiation [37]. We find that the
most intense drought of this phase occurred in 250 BC. The
precipitation decreased 12.4%. This drought is apparently a result
of the modification of the vegetation by agricultural activities. In
Lake Chichancanab, higher d18O values are also observed but do
Figure 7. Comparison of records. (A) Record of Z. mays of this same study. (B) Anomalies of the inferred precipitation. (C) Record of d18O LakeChichancanab [6].doi:10.1371/journal.pone.0084333.g007
Precipitation Reconstruction Yucatan Peninsula
PLOS ONE | www.plosone.org 8 December 2013 | Volume 8 | Issue 12 | e84333
not hold up a reduction of precipitation, nor do we observe such a
reduction in Cariaco. However, changes are detected in the
records of maize and other elements associated with cultivation,
such as Croton sp. The second phase ended with an increase in the
precipitation (5–6%).
The third phase is clearly differentiated by repeated droughts.
During this time, precipitation was below average by an average of
12.6% but at times more than 18%. The first drought lasted from
around 130 to 236 AD. During this drought, precipitation
dropped by 21%. This phase coincided with what is known as
the Preclassic drought reported in various works in the region [26–
27], [33–34]. During this event, important changes in the
environment and in Mayan cities occurred, including the collapse
of El Mirador (Guatemala), a city that flourished during the
Preclassic period [38]. It is important to note that, during this
drought, there was no increase in the percentage of maize. The
precipitation record confirms that this was a result of the climate
and not an artifact of agricultural activity. However, the drought
that occurred around 420 AD does coincide with an increase in
evidence of maize. In fact, the drought coincides with the highest
percentage of maize in the record. Therefore, it is probable that
the 18% decrease in precipitation is overestimated. The third
drought occurred in 800 AD when precipitation declined 18.2%
and, in contrast to the previous drought, no high values of Z. mays
were observed. This drought coincides with the high d18O values
in the study of Lake Chichancanab [6] and decreased precipitation
in the Cariaco Basin [28]. The drought also coincides temporally
with the second phase of the disintegration of Mayan lands, during
which various cities were abandoned. Among these cities were
Yaxchilan, Calakmul, Piedras Negras, Copan and Naranjo [38].
Following this drought, maize disappeared from the record and is
likely related to the collapse around this time. The collapse is
estimated to have occurred between 800 and 860 AD.
Medina-Elizalde proposed that the reduction in precipitation
during the final Classic Period was 36–52% based on quantitative
precipitation reconstruction using isotopes in stalagmites. The
values obtained in this study were more conservative. Neverthe-
less, it is important to consider that the model constructed tended
to overestimate the low values (Figure 6). Therefore, it is likely that
droughts were more intense than the values suggest here.
The fourth phase of change (800–1760 AD) is characterized as a
wet period. The increase in precipitation was rapid, and the
anomaly exceeded an average of 5% with no deficits recorded,
despite variable precipitation. Medina-Elizalde [8] suggests that
the revitalization of the Puuc region in the north of the peninsula
was favored by the precipitation increase, which increased the
production of food and could subsequently support a larger
population. This event coincides temporally (860–900 AD) with
the beginning of this fourth phase, during which the precipitation
increased considerably. The period from 900 AD to 1300 AD
experienced precipitation surpluses of more than 7.5%. This
period coincides with the global event known as the Medieval
Climatic Anomaly [39].
Between 1300–1760 AD, precipitation was high overall but also
more variable. This period falls into the Little Ice Age (LIA), which
was drier than the Medieval Climatic Anomaly but still wetter
than the rest of the record. The precipitation reconstruction from
the Tzabnabh cave [8] suggests that the LIA was relatively more
humid, which agrees with the precipitation record of the present
study, yet contrary to earlier findings [34]. However, other studies
on fossil pollen on the peninsula have found droughts in this phase
[27], [33].
Conclusions
The calibration of modern fossil pollen with observed precip-
itation led to the construction of a predictive and reliable model.
The model works best with medium values, while low values tend
to be overestimated.
The application of a transfer function permitted the recon-
struction of precipitation for the last 3800 years. In the area of Ria
Lagartos, precipitation anomalies show that the magnitudes of
deficits (21%) exceed the surpluses (,9%). Four phases of change
have been detected; the third (50 BC – 800 AD) was the driest.
The drought related to the abandonment of the Preclassic Period
featured an estimated 21% reduction in precipitation, while the
drought of the Mayan collapse (800–860 AD) saw a decrease of
18%. The Medieval Climatic Anomaly was a period of positive
anomalies (3.8–7.6%), while the Little Ice Age was a more variable
period, with reductions but without droughts. Fossil pollen
indicates agricultural activity since the early phases (1840), and
those activities provoked important changes in the vegetation
during the Classic Period. Moreover, data indicate the vulnera-
bility of the vegetation to the combined effect of agriculture and
climate. When both agents operate in conjunction, it is possible to
cause major transformations in vegetation, such as occurred in 370
AD.
Acknowledgments
Valuable comments by the reviewers are acknowledged.
Author Contributions
Conceived and designed the experiments: ACB GAI NTV. Performed the
experiments: ACB GAI NTV. Analyzed the data: ACB GAI NTV.
Contributed reagents/materials/analysis tools: GAI. Wrote the paper:
ACB GAI NTV.
References
1. Labeyrie L, Cole J, Alverson K, Stocker T (2003) The History of Climate
Dynamics in the Late Quaternary. In Alverson KD, Bradley RS, Pedersen TF,
editors. Paleoclimate, global change and the future. Berlin: Springer. 33–61.
2. Birks HJ (1995) Quantitative palaeoenvironmental reconstructions. In Maddy D,
Brew JS, editors. Statistical modelling of Quaternary science data. Technical
Guide.
3. Riehl H (1979) Climate and Weather in the Tropics. London: Academic Press.
611p.
4. Birks HJ (2005) Quantitative palaeoenvironmental reconstructions from
Holocene biological data. In Mackay A, Battarbee R, Birks J, Oldfield F,
editors. Global change in the Holocene. Great Britain: Hodder education. 107–
123.
5. Hodell DA, Brenner M, Curtis J (2000) Climate change in the northern
American tropics and subtropics since the last ice age. In Lentz DL, editor.
Imperfect balance, landscape transformations in the pre-Columbian Americas.
New York: Columbia University Press. 13–38.
6. Hodell DA, Curtis JH, Brenner M (1995) Possible role of climate in the collapse
of classic Maya civilization. Nature 375: 391–394.
7. Curtis JH, Hodell DA, Brenner M (1996) Climate variability on the Yucatan
peninsula (Mexico) during the past 3500 years, and implication for Maya
cultural evolution. Quatern Res 16: 37–47.
8. Medina-Elizalde M, Burns SJ, Lea DW, Asmerom Y, van Gunten L, et al. (2010)
High resolution stalagmite climate record from the Yucatan peninsula spanning
the Maya terminal classic period. Earth Planet Sci Lett. 298: 255–262.
9. Medina-Elizalde M, Rohling EJ (2012) Collapse of Classic Maya Civilization
related to modest reduction in precipitation. Sci. 335: 956–959.
10. Mann ME (2007) Climate over the past two millennia. Annu. Rev. Earth Planet.
Sci. 35: 111–136.
11. CONANP (2007) Programa de conservacion y manejo reserva de la biosfera Rıa
Lagartos. Secretarıa de Medio Ambiente y Recursos Naturales. 266p.
Precipitation Reconstruction Yucatan Peninsula
PLOS ONE | www.plosone.org 9 December 2013 | Volume 8 | Issue 12 | e84333
12. CNA (2006) Jefatura de Proyecto de Aguas Superficiales. Subgerencia Regional
Tecnica. Gerencia Regional Penınsula de Yucatan. Comision Nacional delAgua. Mexico.
13. Torrescano-Valle N (2007) Reconstruccion paleoambiental del Holoceno
Medio-Tardio en la parte centro-sur de la penınsula de Yucatan, Mexico.Doctoral Thesis. El Colegio de la Frontera Sur.
14. Erdtman G (1969) Handbook of palynology. An Introduction to the study ofPollen grains and spores. Hafner Publishing Co. 486p.
15. Palacios-Chavez R, Ludlow-Wiechers B, Villanueva-Gutierrez R (1991) Flora
palinologica de la reserva de la biosfera de Sian Ka’an, Quintana Roo, Mexico.CICRO. 321p.
16. Correa-Metrio A, Cabrera KR, Bush MB (2010) Quantifying ecological changethrough discriminant analysis: a paleoecological example from the Peruvian
Amazon. J Veg Sci 21: 695–704.17. ter Braak CJF (1986) Canonical correspondence analysis: a new eigenvector
technique for multivariate direct gradient analysis. Ecology 67: 1167–1179.
18. ter Braak CJF, Smilauer P (2002) CANOCO Reference Manual andCANODRAW User’s Guide: Software for Canonical Community Ordination
(Version 4.5). Microcomputer Power (Ithaca, New York). 500 p.19. Wold S, Ruhe A, Wold H, Dunn WJ (1984) The collinearity problem in linear
regression: the partial least squares (PLS) approach to generalized inverses.
SIAM J Sci Comput 5: 735–743.20. Juggins S (2007) C2 version 1.5 user guide. Software for ecological and
palaeoecological data analysis and visualization. Newcastle University, New-castle upon Tyne, UK. 73p.
21. Grimm EC (2011) TILIA software version 1.7.16. Illinois State Museum,Research and Collection Center. Springfield USA. Available: http://intra.
museum.state.il.us/pub/grimm/tilia/.
22. Stuiver M, Reimer PJ, Reimer RW (2005) CALIB 5.0 Available: http://calib.qub.ac.uk/calib/.
23. Reimer PJ, Hughen KA, Guilderson TP, McCormac FG, Baillie MGL, et al.(2002) Preliminary Report of the first workshop of the IntCal04 Radiocarbon
Calibration/Comparison Working Group. Radiocarbon 44: 653–661.
24. ter Braak CJF (1987) Unimodal models to relate species to environment. DLO-Agricultural Mathematics Group. 266p.
25. Torrescano-Valle N, Islebe GA (2006) Tropical forest and mangrove historyfrom south eastern Mexico: a 5000 yr pollen record and implications for sea
level rise. Veg Hist Archaeobot 15: 191–195.
26. Carrillo-Bastos A, Islebe GA, Torrescano-Valle N, Gonzalez NE (2010)
Holocene vegetation and climate history of central Quintana Roo, Yucatan
Peninsula, Mexico. Rev Palaeobot Palyno 160: 189–196.
27. Gutierrez-Ayala LV, Torrescano Valle N, Islebe GA (2012) Reconstruccion
paleoambiental del Holoceno Tardıo de la reserva Los Petenes, Penınsula de
Yucatan, Mexico. Rev Mex Cienc Geol 29: 749–763.
28. Leyden BW (2002) Pollen evidence for climatic variability and cultural
disturbance in the Maya Lowlands. Anciente Mesoam 13: 85–101.
29. Pennington DT, Sarukhan J (2005) Arboles tropicales de Mexico: manual para
la identificacion de las principales especies. Mexico: Universidad Autonoma de
Mexico, Fondo de cultura economica. 523 p.
30. ter Braak CJF, Juggins S (1993). Weigthed averaging partial least squares
regression (WA-PLS): an improve method for reconstructing environmental
variables from species assemblages. Hydrobiologia 269/270: 485–502.
31. Birks HJB (1998) Numerical tools in quantitative palaeolimnology-progress,
potentialities, and problems. J. Paleolim 20: 307–332.
32. Islebe GA, Hooghiemstra H, Brenner M, Curtis JH, Hodell DA (1996) A
Holocene vegetation history from lowland Guatemala. The Holocene 6: 265–
271.
33. Aragon-Moreno AA, Islebe GA, Torrescano-Valle N (2012) A ,3800-yr, high-
resolution record of vegetation and climate change on the north coast of the
Yucatan Peninsula. Rev Palaeobot Palynol 178: 35–42.
34. Haug GH, Gunther D, Peterson LC, Sigman DM, Hughen KA, et al. (2003)
Climate and the Collapse of Maya Civilization. Sci 299: 1731–1735.
35. Hodell DA, Brenner M, Curtis JH, Guilderson T (2001) Solar Forcing of
Drought Frequency in the Maya Lowlands. Sci 292: 367–1370.
36. Hodell DA, Brenner M, Curtis JH (2007) Climate and cultural history of the
Northeastern Yucatan Peninsula, Quintana Roo, Mexico. Climatic Change 83;
215–240.
37. Steinhilber JAA, Beer J (2008) Solar modulation during the Holocene. Astra 4:
1–6.
38. Gill RB (2008) Las grandes sequıas mayas, agua, vida y muerte. Mexico Distrito
Federal: Fondo de cultura economica. 561 p.
39. Mann ME (2002) Medieval climatic optimum. In: MacCracken MC, Perry JS,
editors. Encyclopedia of global environmental change. Chichester: Jonh Wiley
and Sons 514–516.
Precipitation Reconstruction Yucatan Peninsula
PLOS ONE | www.plosone.org 10 December 2013 | Volume 8 | Issue 12 | e84333