3.10 ontario provincial police - auditor general of … · ontario provincial police 231 chapter 3...
TRANSCRIPT
Ontario Provincial PoliceChapter 3
Section 3.10
Chap
ter 3
• VF
M S
ectio
n 3.
10
230
Ministry of Community Safety and Correctional Services
Background
The Ontario Provincial Police (OPP) operates under the Police Services Act (Act), and primarily provides:
• front-line police services in areas of Ontario that do not have their own police force;
• patrols on provincial highways, waterways and trail systems;
• municipal policing services under contract where requested by municipalities;
• emergency and other support services to all communities in the province; and
• investigations into complex criminal cases and organized crime.
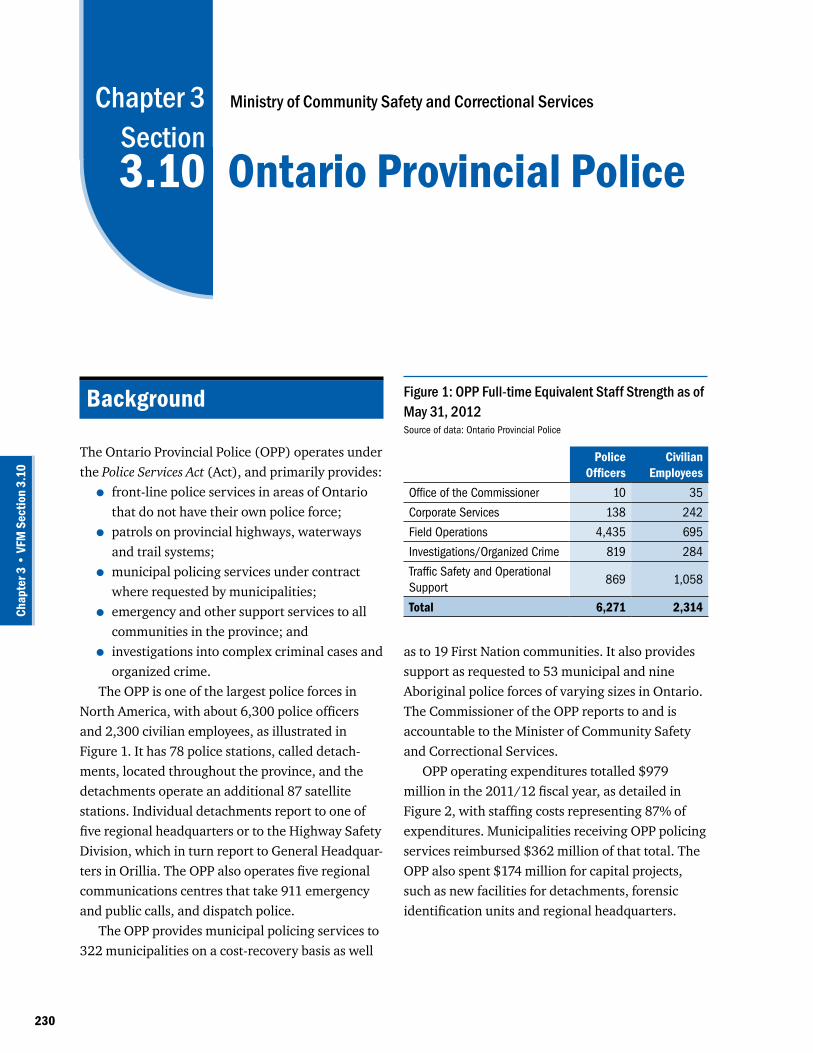
The OPP is one of the largest police forces in North America, with about 6,300 police officers and 2,300 civilian employees, as illustrated in Figure 1. It has 78 police stations, called detach-ments, located throughout the province, and the detachments operate an additional 87 satellite stations. Individual detachments report to one of five regional headquarters or to the Highway Safety Division, which in turn report to General Headquar-ters in Orillia. The OPP also operates five regional communications centres that take 911 emergency and public calls, and dispatch police.
The OPP provides municipal policing services to 322 municipalities on a cost-recovery basis as well
as to 19 First Nation communities. It also provides support as requested to 53 municipal and nine Aboriginal police forces of varying sizes in Ontario. The Commissioner of the OPP reports to and is accountable to the Minister of Community Safety and Correctional Services.
OPP operating expenditures totalled $979 million in the 2011/12 fiscal year, as detailed in Figure 2, with staffing costs representing 87% of expenditures. Municipalities receiving OPP policing services reimbursed $362 million of that total. The OPP also spent $174 million for capital projects, such as new facilities for detachments, forensic identification units and regional headquarters.
Figure 1: OPP Full-time Equivalent Staff Strength as of May 31, 2012Source of data: Ontario Provincial Police
Police Officers
Civilian Employees
Office of the Commissioner 10 35
Corporate Services 138 242
Field Operations 4,435 695
Investigations/Organized Crime 819 284
Traffic Safety and Operational Support
869 1,058
Total 6,271 2,314

231Ontario Provincial Police
Chap
ter 3
• VF
M S
ectio
n 3.
10
Audit Objective and Scope
Our audit objective was to assess whether the Ontario Provincial Police had systems and proced-ures in place to:
• ensure its provincial and municipal police services are delivered cost-effectively, and in compliance with key requirements of the Police Services Act and the OPP’s own oper-ational policies and procedures, known as Police Orders; and
• measure and report on its effectiveness in achieving its mandate and priorities.
Before beginning our fieldwork, we identified criteria we would use to address our audit object-ive. Senior management at the OPP reviewed these criteria and agreed to them.
The scope of our audit included interviews with OPP management, civilian staff and officers; and tests, reviews and analysis of relevant files, policies and procedures at the OPP’s General Headquar-ters, three regional headquarters, one regional communications centre and 10 detachments. We also considered the recommendations we made in our 2005 Annual Report and in earlier audits of
the OPP. As most police work is carried out at local detachments, we focused our work on the OPP’s regional operations. We did not review areas such as capital expenditures, investigations and organ-ized crime bureaus, and the force’s emergency preparedness activities.
We interviewed senior management of the Ministry of Community Safety and Correctional Services, staff and elected officials from nine municipalities for which the OPP provides policing services, and representatives from the Association of Municipalities of Ontario and the Association of Municipal Managers, Clerks and Treasurers of Ontario. We researched police operations in sev-eral other jurisdictions and visited the RCMP and the Sûreté du Québec (Quebec’s provincial police force) to discuss their perspectives on the admin-istration of policing services. We also engaged on an advisory basis the services of an independent expert with senior management experience in the policing sector.
Prior to our last audit in 2005, the OPP did not use the government’s Community Safety and Cor-rectional Services Audit Service Team; however, the OPP now utilizes the Ministry’s internal auditors on a regular basis. We reviewed a number of recent internal audit reports and found them helpful in planning and conducting our audit, particularly their reviews of front-line policing supervision, over-time costs and municipal policing arrangements.
We also found helpful the reports prepared by the OPP’s Quality Assurance Unit, which regularly inspects and reviews police practices at detachments.
Summary
Over the last two decades, crime rates across Canada have declined by more than 40%, and Ontario has been part of this trend. For instance, since our last audit of the OPP in 2004/05, crime rates reported by the OPP have decreased 10%,
Figure 2: OPP Expenditures, 2011/12 ($ million)Source of data: Public Accounts
Fleet management ($61)
Other ($6)
Corporate andstrategic services
($145)
Investigations andorganized crime
($102)
Field and trafficservices ($665)
2012 Annual Report of the Office of the Auditor General of Ontario232
Chap
ter 3
• VF
M S
ectio
n 3.
10
and serious motor vehicle accidents have also been trending down, with fatalities and injuries lower by 45% and 32% respectively. Over the last five years, the average number of calls for service the OPP has responded to or initiated has remained relatively stable.
By contrast, OPP expenditures net of recoveries from municipalities have increased by 27% over the same period. Most of the increase has resulted from the hiring of additional officers and staff compen-sation increases over the last six years. However, our research did indicate that many of the other larger police forces across Canada have had similar expenditure increases, notwithstanding the long-term trend of declining rates of crime and serious motor vehicle accidents.
In our last audit report in 2005, we made a number of recommendations on issues relating to staff deployment and controlling costs such as overtime. We nevertheless found that many of these issues continue to exist today. Among our major observations:
• The force has 2,800 officers assigned to front-line duties in detachments, but it uses a computer-based model developed in the 1980s to calculate how to deploy only about 1,250, or 45%, of these officers, and only to those detachments that provide policing services under contract to municipalities. It has been more than 10 years since the model was used to assess the deployment of some 1,550 other officers to detachments that provide other front-line policing services, such as patrolling provincial highways, or to municipalities that use the OPP to provide basic police service without contracts. Accordingly, officers face significantly different workloads depending on where they are assigned. We found that officers in some detachments handled an aver-age of 54% to 137% more calls than officers in other detachments.
• In 2005, the OPP advised us that it was working with the RCMP on a new officer-deployment computer model. The OPP has
since then claimed it uses this new model, but it does not. In March 2012, the OPP’s existing model calculated that the OPP requires 500 more front-line officers overall, or 18% more, whereas the new model calculated that the OPP needs 50 fewer officers. We also found that the OPP incorrectly applied staffing requirements for officer safety in the existing model; when the error was corrected, the model calculated that only an additional 156 officers were needed. The OPP also does not analyze either its officers’ availability to immediately respond to a call or the time it takes for officers to respond to a call, both key factors in determining the deployment of officers to detachments across Ontario.
• The force also lacks a model or method for ensuring that 44% of the total detachment workforce, comprising the 1,600 officers who do not perform front-line duties and 640 civilian staff, are efficiently and effectively deployed.
• Shift scheduling practices since our last audit have shown no improvement whatsoever in matching the demand for officers, especially during peak workload periods. OPP manage-ment had little control over shift scheduling at detachments, and almost all officers choose to work 12-hour shifts. Current shift arrange-ments result in overstaffing during slow early-morning hours compared to the busy afternoon hours. Similarly, Sundays are over-staffed by an estimated 20%. We estimated that improved shift scheduling could allow the OPP to save millions of dollars per year or, at the very least, make its officers more available to respond to calls for service.
• The OPP could assign more corporate-services duties and other non-policing work to lower-paid civilian staff to free up officers’ time for policing duties and to save money. The OPP has recognized this and initiated a review of some staffing positions, which identified more than $6 million a year in potential savings.
233Ontario Provincial Police
Chap
ter 3
• VF
M S
ectio
n 3.
10
• OPP officers are among the highest compen-sated police officers in Canada. Officers and civilians receive certain benefits to which other members of the Ontario public service, such as correctional officers, are not entitled, including significantly better pension benefits. Since 2003, OPP officers have been receiving an annual incentive payment worth up to $7,500 to make their salaries comparable to another large police force that had negotiated a retention incentive at that time.
• In our 2005 report, we noted that the OPP had lowered its overtime costs for 2004/05 by 10% to $33 million. However, no further progress has been made to decrease overtime hours, and overtime costs have increased by 60% to $53 million for 2011/12.
• The overall cost of OPP services for municipal-ities from 2007 to 2011 increased an average of 29% for those with contracts and 19% for those without, or up to three times the annual inflation rate. Municipal officials told us that the force offered no adequate explanations or accountability for these increases, which are due to changes in OPP billing and costing methods, and increases in officer compensa-tion. On the other hand, all municipal officials with whom we spoke said they were very satisfied with the OPP services they received.
• The way the OPP charges municipalities for its services was complex and onerous for both the force and municipalities. In contrast, the RCMP and Sûreté du Québec billing processes for municipalities appeared much more straightforward.
• OPP processes were insufficient to ensure that detachments consistently met the require-ments of the Police Services Act and the force’s own policies. In most of the eight detachments we inspected, we noted instances where seized cash, weapons and drugs, as well as officers’ weapons, were either improperly stored or accounted for, or were missing.
• While the OPP reports extensive information on its policing activities, crime and motor-vehicle accidents in its annual report, it does not report information on its own efficiency, such as per capita operating costs and response times.
Detailed Audit Observations
FUNDING LEVELS FOR POLICINGOver the past two decades, the crime rate across Canada has shown a steady decline. In total, criminal offences are down more than 40%. In Ontario, since our last audit in 2005, the number of offences is down about 20%. As well, there has been a decline in the number and seriousness of crimes reported to police across Canada and in Ontario. Statistics Canada’s report on the Canadian crime severity index, which tracks changes in the relative seriousness of police-reported crime from year to year, indicates that the severity of crime has declined every year since 1991; it was 6% lower in 2011 than in the previous year and 26% lower than in 2001. Across Canada, both the rate and severity of violent crime fell 4% in 2011 from the previous year, and it was the fifth consecutive annual decline in severity of violent crime. In Ontario, the violent crime severity index fell 5% from 2010 to 2011, and the total crime severity index dropped 6%.
As well, motor vehicle fatalities and injuries have declined by 45% and 32% respectively since 2005.
A common detachment workload measure for policing is “calls for service.” More than half of all the calls for service that police respond to are related to either Criminal Code offences or traffic incidents, and they come either from the general public or officers themselves. A call from the public—a “citizen-generated” call—might involve, for example, an assault or a missing person. A call initiated by an officer, typically while out on patrol, could involve the apprehension of someone driving

2012 Annual Report of the Office of the Auditor General of Ontario234
Chap
ter 3
• VF
M S
ectio
n 3.
10
under the influence of alcohol, although the count of officer-initiated calls does not include routine vehicle stops for traffic violations such as speeding.
Over the last five years, the average number of all calls for service to the OPP was relatively stable at approximately 716,000 a year, with about 463,000 of them initiated by police themselves and 253,000 being citizen-generated.
In total, OPP expenditures have increased 34% since our 2005 audit (27% after recoveries from municipalities), while the number of calls for ser-vice remained unchanged. Increased funding has been needed primarily to cover the cost of more officers and increases in staff compensation. In con-trast, for the six years prior to our 2005 audit, total OPP expenditures increased 37% compared to total calls for service rising 31%.
Statistics Canada data indicates the overall increase in total OPP expenditures in recent years is consistent with the increase in total expenditures for all policing in Canada. The number of OPP officers rose by nearly 13% from 2004 to 2011, comparable to the national increase of 14% over the same period. The per capita cost of municipal and provincial policing in Canada for 2008 (the last year for which the information was published) was $268, up from $205 in 2003. Ontario had the high-est such cost at $294, up from $225 in 2003. Since 2005, the OPP has added about 700 officers, 350 of whom were hired to fulfill new municipal policing requirements for which the cost was recovered. Most of the other 350 additional officers were approved in 2008, when the province provided funding for 200 additional positions for highway safety and investigative units, and the federal government provided temporary funding for 125 officers until March 31, 2013. Also, 500 more civil-ian employees were added, raising their number by 28% since 2005.
In summary, OPP expenditures have clearly increased at a much faster pace than inflation, even though crime rates and serious motor-vehicle accidents are in a trend of long-term decline. We do recognize in this regard, however, that expendi-
tures at other large police forces in Canada have increased by similar percentages. And while the number of criminal offences reported by the OPP from 2005 to 2011 declined by 10%, the clearance rate (where charges are laid, or the case is closed with no charges) improved by 19%. This clearance rate compares favourably to that of other Canadian and Ontario police forces.
We are not aware of any recent independent studies or assessments that analyze the long-term trend of OPP funding and staffing increases in the face of stable or declining demands for police servi-ces. However, we understand that the OPP has been asked to reduce its expenditures in 2012 to help address the province’s budget deficit.
RECOMMENDATION 1
To support future decisions on funding for the Ontario Provincial Police, given the long-term trend of decreasing crime rates and fewer serious motor-vehicle accidents in Ontario and across Canada, the OPP, in conjunction with the Ministry of Community Safety and Correctional Services, should formally assess the correlation of its funding and staffing levels with the actual demand for policing services, based on such fac-tors as calls for service, motor vehicle fatalities and injuries, number of reported offences, clear-ance rates for crimes and crime severity levels.
OPP RESPONSE
We agree with the Auditor General that it is important to formally assess the correlation of our funding and staffing levels with the actual demand for policing services. Crime rates are not always an accurate barometer of the need for police resources, given that proactive work and the implementation of prevention programs often lead to the reduction of crime. In addition, trends can quickly change. The total number of deaths on OPP-patrolled roads as of the end of September 2012 was 215, compared to 201 at the same time last year.
235Ontario Provincial Police
Chap
ter 3
• VF
M S
ectio
n 3.
10
MANAGING COSTSDetachment Staffing Levels
The OPP has approximately 4,500 of its 6,300 offi-cers and 640 of its 2,300 civilian staff working in 78 community-based detachments. The rest of its staff work primarily at the OPP’s regional headquarters, communications centres, and at General Headquar-ters in Orillia. Individual detachments can have up to three distinct policing responsibilities: municipal policing for municipalities that have a contract with the OPP, basic municipal policing for non-contract municipalities, and patrol of provincial highways and waterways.
As we noted in our 2005 audit, the OPP still does not have a consistent method for deploying officers to detachments. The computer-based model that the OPP developed in the 1980s—called the Deployment Model—is programmed to calculate the number of officers required for front-line duties in detachments. The Deployment Model takes into account six key parameters:
• detachment-area characteristics;
• number and type of citizen-generated calls for service;
• percentage of time an officer is available to respond to a call for service;
• patrol standards;
• total hours that officers are available for front-line policing; and
• minimum staffing levels for officer safety.While the OPP uses the Deployment Model to
calculate the number of front-line officers required in detachments that serve municipalities with con-tracts (currently about 1,250 officers), it has been more than 10 years since the model was used to assess the number of front-line officers assigned to other provincial duties or to municipalities without contracts (currently about 1,550 officers). The lack of a consistent method for deploying officers to detachments has contributed to significant vari-ances in the workloads of officers depending on the detachment to which they are posted. Front-line officers in some detachments handle an average of
The OPP is currently in the process of updating the Deployment Model to complete an assessment of staffing requirements for front-line services. The model includes calls for service for most criminal offences and all motor-vehicle collisions, as well as other parameters used to determine front-line policing staffing levels.
As the province’s police service, the OPP also provides a wide variety of services not identified in the Deployment Model. For example, the level of provincial highway staff-ing cannot be determined solely on the basis of motor-vehicle collision rates; factors such as kilometres of highways, traffic volumes and patrol standards must also be taken into account. Investigations into major crimes and organized criminal activity are also influenced by a number of factors, including the growing complexity of crimes; sophisticated and time-consuming investigative techniques; and court and case law requirements. Further, assistance to municipal police agencies is covered under Section 9 of the Police Services Act. Operational support and many specialized services (such as tactical and emergency response, major case management, and search and rescue) are staffed based on the need to have these resour-ces available to the province in case of major incidents—their size cannot be determined solely on the number of occurrences.
The OPP will continue to review its oper-ations to find efficiencies and will analyze data and information to assess whether savings are available or funding can be reallocated across programs. Through the Future of Policing Advis-ory Committee and other partnerships, the OPP will review statistics to ensure that the causal factors of crime rates and other trends are understood and that decisions are made based on sound information.
2012 Annual Report of the Office of the Auditor General of Ontario236
Chap
ter 3
• VF
M S
ectio
n 3.
10
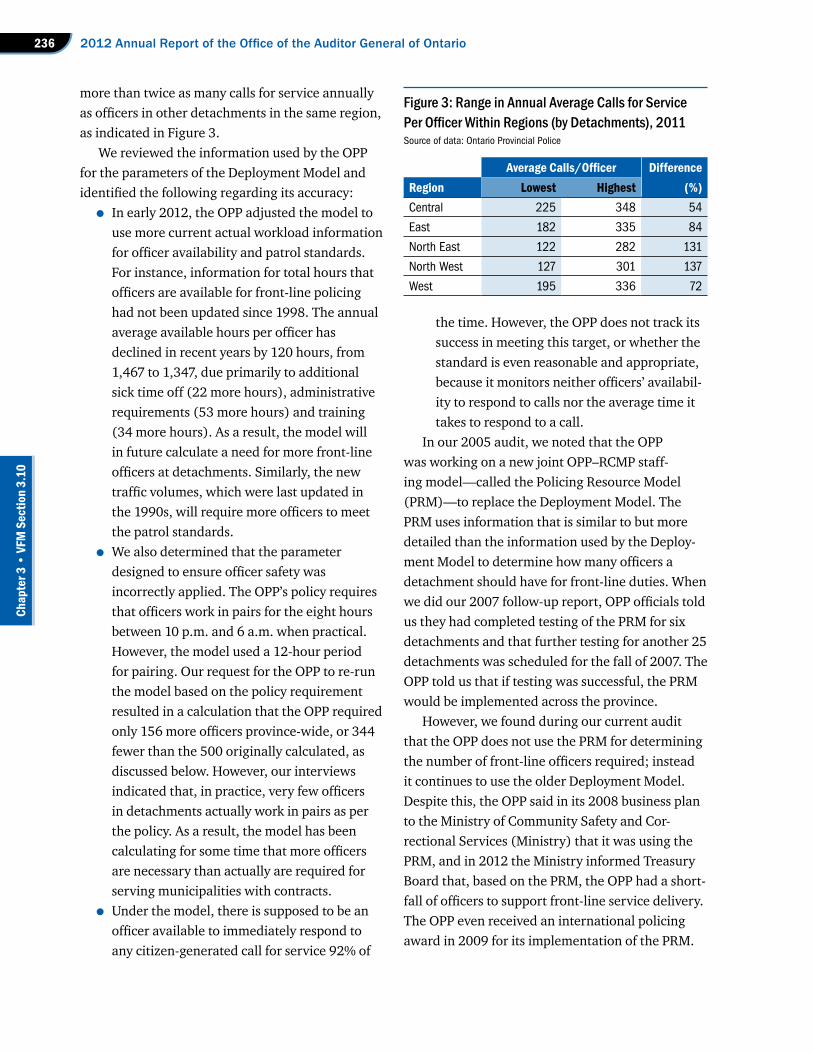
more than twice as many calls for service annually as officers in other detachments in the same region, as indicated in Figure 3.
We reviewed the information used by the OPP for the parameters of the Deployment Model and identified the following regarding its accuracy:
• In early 2012, the OPP adjusted the model to use more current actual workload information for officer availability and patrol standards. For instance, information for total hours that officers are available for front-line policing had not been updated since 1998. The annual average available hours per officer has declined in recent years by 120 hours, from 1,467 to 1,347, due primarily to additional sick time off (22 more hours), administrative requirements (53 more hours) and training (34 more hours). As a result, the model will in future calculate a need for more front-line officers at detachments. Similarly, the new traffic volumes, which were last updated in the 1990s, will require more officers to meet the patrol standards.
• We also determined that the parameter designed to ensure officer safety was incorrectly applied. The OPP’s policy requires that officers work in pairs for the eight hours between 10 p.m. and 6 a.m. when practical. However, the model used a 12-hour period for pairing. Our request for the OPP to re-run the model based on the policy requirement resulted in a calculation that the OPP required only 156 more officers province-wide, or 344 fewer than the 500 originally calculated, as discussed below. However, our interviews indicated that, in practice, very few officers in detachments actually work in pairs as per the policy. As a result, the model has been calculating for some time that more officers are necessary than actually are required for serving municipalities with contracts.
• Under the model, there is supposed to be an officer available to immediately respond to any citizen-generated call for service 92% of
the time. However, the OPP does not track its success in meeting this target, or whether the standard is even reasonable and appropriate, because it monitors neither officers’ availabil-ity to respond to calls nor the average time it takes to respond to a call.
In our 2005 audit, we noted that the OPP was working on a new joint OPP–RCMP staff-ing model—called the Policing Resource Model (PRM)—to replace the Deployment Model. The PRM uses information that is similar to but more detailed than the information used by the Deploy-ment Model to determine how many officers a detachment should have for front-line duties. When we did our 2007 follow-up report, OPP officials told us they had completed testing of the PRM for six detachments and that further testing for another 25 detachments was scheduled for the fall of 2007. The OPP told us that if testing was successful, the PRM would be implemented across the province.
However, we found during our current audit that the OPP does not use the PRM for determining the number of front-line officers required; instead it continues to use the older Deployment Model. Despite this, the OPP said in its 2008 business plan to the Ministry of Community Safety and Cor-rectional Services (Ministry) that it was using the PRM, and in 2012 the Ministry informed Treasury Board that, based on the PRM, the OPP had a short-fall of officers to support front-line service delivery. The OPP even received an international policing award in 2009 for its implementation of the PRM.
Figure 3: Range in Annual Average Calls for Service Per Officer Within Regions (by Detachments), 2011Source of data: Ontario Provincial Police
Average Calls/Officer DifferenceRegion Lowest Highest (%)Central 225 348 54
East 182 335 84
North East 122 282 131
North West 127 301 137
West 195 336 72

237Ontario Provincial Police
Chap
ter 3
• VF
M S
ectio
n 3.
10
We noted that the RCMP is currently using the PRM and has been doing so for more than five years.
In March 2012, the OPP conducted an analysis of its front-line officer requirements at all detach-ments using both models. The Deployment Model calculated that the OPP required 500 more officers, whereas the PRM calculated that it actually needed 50 fewer officers. In addition, both models identi-fied that detachments required anywhere from 30% fewer to over 100% more officers, although the results varied widely between the models. For example, at a detachment with 59 officers, the PRM calculated that 28% fewer officers were needed while the Deployment Model calculated 105% more officers were required. We talked to a number of regional and detachment senior staff, including staff in the 59-member detachment above, and they indicated to us that, from an operational perspec-tive, they had no serious concerns with their cur-rent officer staffing levels.
Both staffing models calculate the number of front-line officers needed at detachments, but the OPP has not established a staffing template for the other 44% of staff who also work in detach-ments, including 1,600 officers who do not perform front-line duties and 640 civilian staff. These other officers work in administrative and other policing duties, including courts, community relations and crime investigations. We could find no basis for determining the number of these other officers—for example, no detachment-workload indicators were being used. As well, we were told that the number of officers and civilians working at detach-ments was generally based on historical levels, and the numbers have been relatively stable over the last five years.
At the time of our audit, the OPP was engaged in a project to develop templates for detachment staff-ing and to identify inconsistencies and inequities in current detachment staffing levels.
RECOMMENDATION 2
To help ensure that the number of front-line officers at each detachment is based primarily on need and that officers are cost-effectively deployed, the Ontario Provincial Police should reassess its two computer-based models to determine which one provides the best estimate of requirements based on up-to-date and accur-ate operational and workload standards, and, once validated, use its staffing models to deploy and reassign officers. The OPP should also establish formal staffing methodologies for the other 44% of detachment staff not covered by its deployment model.
OPP RESPONSE
The OPP has conducted extensive analysis comparing the Policing Resource Model (PRM) and the Deployment Model, and determined that the Deployment Model is the most suitable model for identifying municipal and provincial staffing requirements at detachments. The OPP is updating the Deployment Model parameters and expects to complete this project in late 2013. This will make it possible to compare staffing results from the model with the actual staffing levels at each detachment. Given the diverse nature of detachments, local input and analysis of operations must also be conducted and taken into account to determine the approved staffing requirements.
The OPP agrees with the Auditor General that formal staffing methodologies are neces-sary for the detachment staff not covered by the Deployment Model, such as specialists, admin-istration and supervisory positions. The OPP has been working on a set of consistent methods for staffing the various types of non-front-line staff at detachments. The detachment structure review has led to the creation of a model for ideal staffing of non-front-line staff, which the OPP will implement as part of its current review of staffing levels in detachments.

2012 Annual Report of the Office of the Auditor General of Ontario238
Chap
ter 3
• VF
M S
ectio
n 3.
10
Officer Shift Scheduling
As with staff deployment, a key to operating cost-effectively is having the right number of officers working at the right times. In 1998 and in 2005, we reported that officers were not scheduled in a way that corresponded to peak workload periods, and this issue remains. We saw no evidence of any changes to make more efficient use of staff time in order to reduce staffing costs or improve officer availability during peak times.
We learned in interviews that OPP management had little control over shift scheduling at detach-ments. Instead, local officers generally determined their own scheduling, and almost all chose to work 12-hour shifts, which offer more days off. Manage-ment in detachments whom we spoke to said they believed they did not have the authority to change officers’ 12-hour shift schedules, and it was appar-ent that there were different interpretations and knowledge around OPP shift-scheduling policies and the collective agreement.
For the most part, the 12-hour shifts are sched-uled without overlap, so that the same number of officers is working at all times during the day and all through the week. Alternatively, overlapping shifts can offer the benefit of having more officers working during the busiest periods of the week and day. Although overlapping shifts could pose a prob-lem if, for example, there were not enough avail-able patrol vehicles, the issue has not been formally examined to assess its workability.
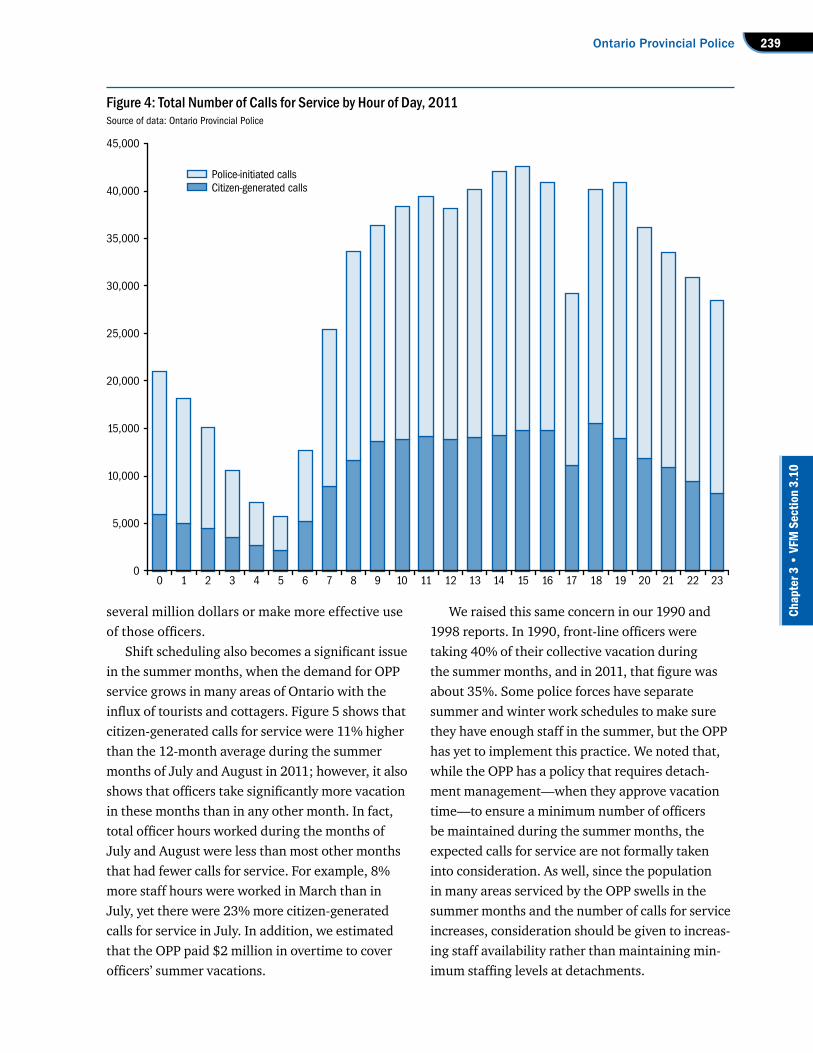
At detachments, the total number of calls for service and citizen-generated calls for service from 3 a.m. to 7 a.m. is only about one-third of the num-ber from 3 p.m. to 7 p.m., when demand is greatest, as shown in Figure 4. Because the scheduling of shifts is not based on workloads, detachments are overstaffed during slow times in the early morning hours compared to the busy afternoon hours. Front-line officers told us that after 3 a.m., they spend most of their time catching up on writing reports and court briefs, and other administrative duties. However, we also noted that the OPP has already reduced the burden of report-writing at many
detachments by assigning more of those duties to civilian staff.
OPP senior management acknowledged that moving from 12-hour shifts to a mixture of shift lengths, using part-time officers to supplement regular officers and increasing shift overlaps dur-ing peak times would save money and improve the productivity of detachments. However, manage-ment also advised us that the current collective agreement might not contain the flexibility needed to make such changes. We estimate that adjusting the current 24-hour fixed scheduling from equally manned 12-hour shifts to a mixture of shifts and less staff from 3 a.m. to 7 a.m. would either result in sav-ings in the range of $5–10 million a year or lead to improved service to the public and officer safety by more effectively matching staffing to workload.
In addition, the OPP operated 77 of its 78 detachments on a 24-hour basis in 2011. In 2008, only 68 of the detachments provided policing 24 hours a day; the other 10 were open 20 hours a day, with officers working 10-hour shifts. Even though the number of calls for service remained essentially unchanged from 2008, the OPP now operates virtually all its detachments on a 24-hour basis, with almost all of its officers working 12-hour shifts. For instance, citizen-generated calls for ser-vice averaged 1,237 per year over the past five years for its only detachment open for only 20 hours a day. Yet, we identified eight detachments that were open 24 hours a day and had either the same or even significantly fewer citizen-generated calls for service. In 2012, the OPP did change one detach-ment’s hours so that it also operates only 20 hours per day.
The same issue exists with respect to weekday versus weekend shift scheduling. The schedules are made up so that the same number of officers is assigned to each day of the week. We calculated that on Sundays, there was about 20% overstaffing of officers, based on the average number of citizen-generated calls for service. By redeploying officers throughout the week based on the demand for service, the OPP could either reduce costs by
239Ontario Provincial Police
Chap
ter 3
• VF
M S
ectio
n 3.
10
several million dollars or make more effective use of those officers.
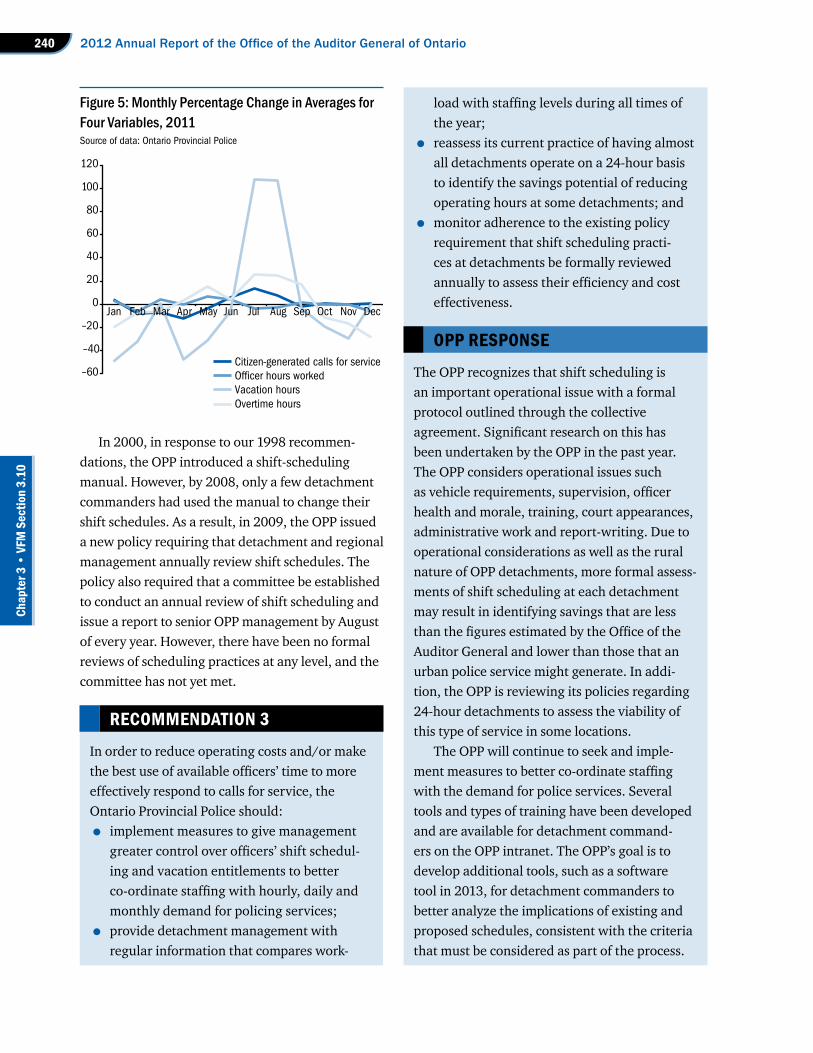
Shift scheduling also becomes a significant issue in the summer months, when the demand for OPP service grows in many areas of Ontario with the influx of tourists and cottagers. Figure 5 shows that citizen-generated calls for service were 11% higher than the 12-month average during the summer months of July and August in 2011; however, it also shows that officers take significantly more vacation in these months than in any other month. In fact, total officer hours worked during the months of July and August were less than most other months that had fewer calls for service. For example, 8% more staff hours were worked in March than in July, yet there were 23% more citizen-generated calls for service in July. In addition, we estimated that the OPP paid $2 million in overtime to cover officers’ summer vacations.
We raised this same concern in our 1990 and 1998 reports. In 1990, front-line officers were taking 40% of their collective vacation during the summer months, and in 2011, that figure was about 35%. Some police forces have separate summer and winter work schedules to make sure they have enough staff in the summer, but the OPP has yet to implement this practice. We noted that, while the OPP has a policy that requires detach-ment management—when they approve vacation time—to ensure a minimum number of officers be maintained during the summer months, the expected calls for service are not formally taken into consideration. As well, since the population in many areas serviced by the OPP swells in the summer months and the number of calls for service increases, consideration should be given to increas-ing staff availability rather than maintaining min-imum staffing levels at detachments.
Figure 4: Total Number of Calls for Service by Hour of Day, 2011Source of data: Ontario Provincial Police
0
5,000
10,000
15,000
20,000
25,000
30,000
35,000
40,000
45,000
0 1 2 3 4 5 6 7 8 9 10 11 12 13 14 15 16 17 18 19 20 21 22 23
Police-initiated callsCitizen-generated calls
2012 Annual Report of the Office of the Auditor General of Ontario240
Chap
ter 3
• VF
M S
ectio
n 3.
10
In 2000, in response to our 1998 recommen-dations, the OPP introduced a shift-scheduling manual. However, by 2008, only a few detachment commanders had used the manual to change their shift schedules. As a result, in 2009, the OPP issued a new policy requiring that detachment and regional management annually review shift schedules. The policy also required that a committee be established to conduct an annual review of shift scheduling and issue a report to senior OPP management by August of every year. However, there have been no formal reviews of scheduling practices at any level, and the committee has not yet met.
Figure 5: Monthly Percentage Change in Averages for Four Variables, 2011Source of data: Ontario Provincial Police
Citizen-generated calls for serviceOfficer hours workedVacation hours
–60
–40
–20
0
20
40
60
80
100
120
Jan Feb Mar Apr May Jun Jul Aug Sep Oct Nov Dec
Overtime hours
RECOMMENDATION 3
In order to reduce operating costs and/or make the best use of available officers’ time to more effectively respond to calls for service, the Ontario Provincial Police should:
• implement measures to give management greater control over officers’ shift schedul-ing and vacation entitlements to better co-ordinate staffing with hourly, daily and monthly demand for policing services;
• provide detachment management with regular information that compares work-
load with staffing levels during all times of the year;
• reassess its current practice of having almost all detachments operate on a 24-hour basis to identify the savings potential of reducing operating hours at some detachments; and
• monitor adherence to the existing policy requirement that shift scheduling practi-ces at detachments be formally reviewed annually to assess their efficiency and cost effectiveness.
OPP RESPONSE
The OPP recognizes that shift scheduling is an important operational issue with a formal protocol outlined through the collective agreement. Significant research on this has been undertaken by the OPP in the past year. The OPP considers operational issues such as vehicle requirements, supervision, officer health and morale, training, court appearances, administrative work and report-writing. Due to operational considerations as well as the rural nature of OPP detachments, more formal assess-ments of shift scheduling at each detachment may result in identifying savings that are less than the figures estimated by the Office of the Auditor General and lower than those that an urban police service might generate. In addi-tion, the OPP is reviewing its policies regarding 24-hour detachments to assess the viability of this type of service in some locations.
The OPP will continue to seek and imple-ment measures to better co-ordinate staffing with the demand for police services. Several tools and types of training have been developed and are available for detachment command-ers on the OPP intranet. The OPP’s goal is to develop additional tools, such as a software tool in 2013, for detachment commanders to better analyze the implications of existing and proposed schedules, consistent with the criteria that must be considered as part of the process.

241Ontario Provincial Police
Chap
ter 3
• VF
M S
ectio
n 3.
10Use of Civilians
The OPP could make better use of more civilians, who already make up 27% of its staff, to free up officers for policing duties and reduce operating costs. We noted this issue as far back as 1990.
In early 2012, the OPP said it determined that having civilian employees take over more court and community-service duties now performed by offi-cers would lower staffing costs. As of 2012, there were 103 officers working in such community-service duties as crime prevention programs in schools and media briefings. A first-class officer earns a salary of $83,500 a year, while a civilian community officer earns $57,250. The overall sav-ings if all these duties were transferred to civilians would be about $2.6 million a year. Similarly, there are about 110 officers and 23 civilians performing court duties. Transferring all court duties to civil-ians would save another $2.8 million annually.
In its recent cost-management study, the OPP identified positions in Corporate Services now filled by officers—in areas such as business, finance, human resources, training, records management, policy development, and equipment and fleet man-
agement—that could just as well be filled by civil-ians. The study said the OPP could save $760,000 by shifting some of these jobs to civilians.
We noted that the OPP has not done a full review to identify the jobs where officers could be replaced by qualified civilian staff, apart from the positions already mentioned. In many cases, offi-cers are assigned to administrative positions while retaining their officer titles and salaries and bene-fits, and they continue to receive the same police training as front-line officers. The RCMP advised us that they introduced a cost-saving initiative in 2012 to more rigorously ensure officers are used only for policing activities, while civilians handle virtually all other non-policing and administrative duties.
When the comprehensive analytical tools are finalized, it is anticipated that detachment man-agement and staff will work together to develop their own improved staffing schedules. Each region will conduct annual reviews to ensure optimum shift scheduling.
The OPP has made efforts to include shift scheduling in collective agreement negotiations. This was not successful in the last round of bar-gaining; however, the OPP continues to press for its inclusion. Shift scheduling changes using the existing manual will require a lengthy timeline and a detachment-by-detachment review and approval process. Shift scheduling is included in our proposed transformational plans and sav-ings are expected by 2014/15. RECOMMENDATION 4
To help ensure that non-policing duties and responsibilities are handled as cost-effectively as possible, the Ontario Provincial Police should:
• conduct a review of all staffing positions and responsibilities at its detachments and its regional headquarters and General Head-quarters to determine where opportunities exist to fill positions currently held by offi-cers with civilians at a lower cost;
• establish cost-saving targets and timelines for designating positions to either civilians or officers, depending on the duties of the position; and
• reassign officers who are currently in civilian positions back to front-line policing duties where possible.
OPP RESPONSE
The OPP is a participant in the Future of Poli-cing Committee (FPAC) review created by the Ministry of Community Safety and Correctional Services and involving municipal and police stakeholders to redefine core duties. This extensive review will provide service options for consideration by all Ontario police agencies.

2012 Annual Report of the Office of the Auditor General of Ontario242
Chap
ter 3
• VF
M S
ectio
n 3.
10
Differential Response Unit
The OPP uses what it calls a Differential Response Unit (DRU) in each of its five regions and its High-way Safety Division to handle low-priority calls for service over the phone. The goal of the program is to make the most efficient and cost-effective use of front-line officers’ time. However, as we noted in
our 1998 and 2005 audits, the DRU program is not yet consistently managed and executed.
The DRU function is supposed to work as fol-lows: When any of the five regional communica-tions centres receives a citizen-generated call for service, the detachment platoon sergeant decides whether an officer will be sent out or if the call can be handled over the telephone at a later time. If the sergeant decides that a front-line officer does not need to be dispatched, the call is forwarded to the region’s DRU, which normally deals with the call over the phone. (Under OPP policy, however, if a caller or a municipality asks for an officer to respond in person, one is dispatched regardless of the nature of the call.)
The OPP reviewed DRU operations in 2007 and found that all regions did not provide the same kind of service and the units often lacked proper supervision, which could cause service delivery to suffer. The OPP noted these inconsistencies and deficiencies again in 2010, and said it would launch a project to ensure that the DRU program had a standardized structure to ensure consistent manage-ment and accountability. However, we found no evi-dence that this project was ever set up. OPP senior command requested another review of the DRU pro-gram, to start in fall 2011. We were informed that as of July 2012, a draft report was being finalized.
Our review of the number of calls handled by DRUs in 2011 noted significant differences in use of the program, as shown in Figure 6. One region, for example, used DRU to handle just 1% of its calls.
We believe that the DRU program, with proper management, could help the OPP reduce operating costs and make more efficient use of the time of its front-line officers. However, only one region has a centralized DRU; in the others, local detachments cover DRU functions by assigning the duties to officers being accommodated for pregnancy, injury, illness or any other cause making them unable to go out to respond to calls. It is likely more cost-effective and efficient for a region to centralize its DRU or for all communications centres to share one DRU for the entire province.
The OPP has conducted a preliminary analysis of potential savings opportunities with regard to civilianization and will complete the analysis with a more comprehensive review of the cost savings and the operational impacts. Due to provincial responsibilities and the number of small, geographically dispersed detachments, the OPP must ensure it has adequate police offi-cers available for local emergencies and major provincial events such as Caledonia, G8/G20, major investigations and others.
The OPP acknowledges that with the finan-cial constraints in today’s economy, the cost savings of increased civilianization may be a component in the future of policing. The OPP is committed to continuing its review of staffing positions and will develop cost-savings targets and timelines for changes.
The OPP is limited by the parameters of the collective agreement in relation to the establishment of and changes to job descrip-tions and classifications. Some roles currently being performed by uniformed officers that could potentially be civilianized (e.g., Com-munity Service Officers) do not have specific job descriptions associated with them because they are not distinct positions. In addition, there are many operational benefits of police performing Community Service Officer and Court Services Officer roles: they are able to respond to other calls for service, they have powers of arrest, and they generally have more influence over students and the public.

243Ontario Provincial Police
Chap
ter 3
• VF
M S
ectio
n 3.
10
In addition, in our 2005 Annual Report we noted that one region’s DRU officers were able to each handle an average of 950 calls for service annually, compared to about 200 calls for a front-line officer. In the current audit, the same region reported that its DRU officers each handled on average fewer than 600 calls per year, and consequently, if more calls were forwarded to DRU, they could likely be handled with minimal staffing impact.
OFFICER COMPENSATIONSalary and Benefits
According to a quarterly RCMP survey of salaries, benefits and pensions, the OPP ranked third among Canadian police forces at $66.45 an hour as of March 31, 2012. Only the Toronto Police Service ($70.90/hour) and the Vancouver police ($70.52/hour) were higher. The RCMP stood at $65.72 an hour and the Sûreté du Québec at $57.84.
OPP members received an average annual salary increase of 2.9% for 2005 to 2010, a 5% wage increase in 2011, and no increases for 2012 and 2013. However, following a recent provincial government announcement that OPP officers would receive the “highest paid first-class constable base rate” in the province, an officer’s annual salary may well increase by at least 8.5% effective January 1, 2014. In addition, officers and civilian staff are entitled to a number of compensation benefits that
Figure 6: Percentage of Citizen-generated Calls for Service Handled by Differential Response Units, 2011Source of data: Ontario Provincial Police
Region % of CallsCentral 10
East 8
North East 1
North West 22
West 6
Highway Safety* Unknown
* The Highway Safety Division operates a DRU, but does not maintain any statistics on its use.
RECOMMENDATION 5
To help achieve the significant cost and oper-ational benefits of implementing a Differential Response Unit (DRU) program to free up front-line officers’ time for more serious matters, the Ontario Provincial Police should:
• establish a strategic plan for fully imple-menting its DRU program throughout the province, with targets for measurable savings and benefits, and associated timelines; and
• given the lack of widespread success in implementing the DRU program over the last decade, consider centralizing the program to improve service levels, enhance consistency and help realize economies of scale and cost savings.
OPP RESPONSE
The OPP acknowledges that there are oppor-tunities to enhance and improve the Differential
Response Unit (DRU) program. A comprehen-sive report, reaffirming these opportunities, was completed and presented to senior management in September 2012.
All regions have established a DRU program to some extent, but implementation provincially has been inconsistent, as it relates to having an effective operating environment and staffing requirements, including short-term accom-modated officers, and appropriate management and training. The current report concludes that, rather than centralization, the most decisive suc-cess factors are having clear direction from the regional commanders, oversight, accountability and well-defined reporting relationships among those assigned to perform the DRU function.
The OPP is committed to moving forward on this initiative and will invest the resources required to implement improvements, includ-ing setting performance targets and measuring against these targets.
2012 Annual Report of the Office of the Auditor General of Ontario244
Chap
ter 3
• VF
M S
ectio
n 3.
10
few other members of the Ontario public service, such as correctional officers, receive. For instance:
• In 2003, after the Toronto Police Service began paying its officers a retention bonus to encourage them not to leave the force in sig-nificant numbers, the provincial government negotiated an incentive called the Provincial Responsibility Incentive with the officers’ union—even though staff were not leaving the OPP for other employment in significant numbers—that resulted in OPP officers being paid at compensation levels comparable to Toronto officers. Commissioned officers (generally senior OPP management staff) who are not part of the union also received the incentive, which was officially established to compensate officers for being expected to respond across the province to emergencies, for long-term investigations and for large local events when extra resources are required. In 2012, the annual incentive was 3% of salary after eight years of service; 6% of salary after 16 years of service; and 9% of salary for 23 years or more, up to a maximum of $7,500. We noted that in 2002, before the incentive was provided, only 43 officers that year left the force, which then stood at 5,300. In 2011, only 25 officers left the force.
• OPP staff have better pension benefits, includ-ing a lower retirement age, than other Ontario government employees who are members of the same Public Service Pension Plan or other pension plans. This in itself is a retention incentive. In addition, as of January, 2012, the pensions of officers are calculated based on a 36-month average of their highest annual salary, rather than a 60-month average used for other provincial government employees. For civilian OPP staff, the pension is based on a 48-month average. Using fewer months to determine average salaries results in higher pension costs for the government.
• Each year, instead of taking five vacation days, staff may opt to receive an additional week’s
pay. From 2009 to 2011, 30% of staff received this payment, and it represented about $4 mil-lion annually.
• The OPP provides an allowance of $1,250 annually to each officer whose policing duties require plain clothes in addition to uniforms. In 2006, the OPP extended that allowance to all 200 commissioned officers, who work primarily in an office environment, where the OPP has a business-attire dress code. In 2010, the allowance was expanded to include dry cleaning expenses. The cost of providing commissioned officers a clothing allowance is $250,000 annually.
Overtime
In our 2005 Annual Report, we noted that the OPP had achieved some success in lowering overtime expenditures, decreasing them by more than 10% to approximately $33 million in 2004/05. Since then, overtime hours have been kept to a consistent rate per officer, but the impact of compensation increases and increases in the number of officers has been a 60% increase in overtime costs to $53 mil-lion for 2011/12. Approximately 63% of overtime was incurred by officers in detachments, who on average received overtime payments of $7,500 each in the 2011/12 fiscal year. The increase in overtime occurred even though over the last five years, the average annual total calls for services handled by the OPP remained relatively stable, the number of criminal offences reported by the OPP declined and the OPP has added 700 officers since 2007.
In addition, we noted that in 2011, about $7 mil-lion of overtime was logged for administrative dut-ies, such as training, report-writing and meetings, in apparent contradiction of OPP overtime policy.
RECOMMENDATION 6
To help inform future decisions on compen-sation levels for officers and as part of the preparation for future collective bargaining

245Ontario Provincial Police
Chap
ter 3
• VF
M S
ectio
n 3.
10
MUNICIPAL POLICINGUnder the Police Services Act (Act), municipalities may establish police forces either on their own or with other municipalities, or they may purchase policing services from other municipalities or from the OPP under a five-year renewable contract with the Ministry. If municipalities make no arrange-ments, the OPP is required to provide the basic policing services it thinks are necessary and those municipalities reimburse the OPP for the cost of the policing provided. Municipalities that have contracts with the OPP have more control over the accountability and level of service that they get from the OPP, and in setting community priorities for their own policing.
During the 2011/12 fiscal year, the OPP serviced 149 municipalities with contracts, and 173 muni-cipalities that pay for services without a contract. The OPP received $362 million in revenues for providing these services, with 75% of that coming from municipalities with contracts. Billings and collections for both contract and non-contract municipalities are handled by the Shared Services Bureau of the Ministry of Government Services using information provided by the OPP. In addi-tion, the provincial government assists small and
negotiations, the Ontario Provincial Police (OPP) should analyze the working condi-tions and compensation levels of its officers in comparison to other major police forces across Canada and in relation to current Ontario gov-ernment compensation policies.
The OPP should also increase its oversight of overtime expenditures as well as identify and address the underlying reasons for the signifi-cant increase in overtime costs in recent years.
OPP RESPONSE
The OPP has committed in its 2012 trans-formational plan proposal to continue to work through the Police Bargaining Working Group to identify opportunities to bend the cost curve in police compensation. The OPP uses Statistics Canada and RCMP Police Sector Total Compen-sation reports and communicates with other policing agencies regarding compensation. The Employer (Ministry of Government Services), in consultation with OPP, has reviewed many aspects of OPP compensation and will continue to bring these forward to the negotiation table. The OPP will continue to assess compensation trends and will annually review its compensa-tion compared to other policing agencies and the Ontario government.
The OPP agrees that overtime is an import-ant cost to manage. After significant effort, overtime costs were brought to very low levels for the 2004/05 fiscal year, as noted by the Aud-itor General. Since that time, overtime has been significantly impacted by major events including protracted First Nations protests, several large-scale investigations and the G8/G20.
Although overtime has increased in dol-lar terms, a portion of the increase is directly attributable to compensation increases and the increase in officers for new municipal contracts. Administrative overtime is generally not permit-ted and in some cases may be a coding issue rather than administrative overtime. The OPP
will review the current administrative overtime and will ensure it is reduced where appropri-ate or coded to the correct activity. The results will be monitored and reviewed for 2012/13 and onward.
Over the past few years the OPP imple-mented additional overtime oversight and processes including detailed monthly overtime reports, detailed detachment analysis and memos regarding overtime management. Over-time management is part of the OPP’s current cost management strategies and savings targets are reflected in the Results-based Planning process, underlying the OPP’s commitment to overtime management.

2012 Annual Report of the Office of the Auditor General of Ontario246
Chap
ter 3
• VF
M S
ectio
n 3.
10
rural municipalities with their policing costs. In 2011, municipalities policed by the OPP received $71.9 million from the Ministry of Finance under the Police Services Grant Program.
In addition, the OPP provides support to smaller and rural municipal police forces that may need assistance from time to time, and to help them meet policing standards for events such as emer-gency response.
Relations with Municipalities
A number of municipal officials told us that while their annual costs for OPP services have increased significantly, the OPP offered no adequate explana-tions or accountability for these increases, and showed no flexibility to limit them. The OPP and Ministry have acknowledged these concerns and, during our audit, were working on ways to better share information to improve the relationship with municipalities.
Municipalities are paying more for OPP services largely because of changes over the last several years to the OPP’s billing and costing methods, as well as increases in officers’ salaries. We calculated that for municipalities with contracts, the overall cost of the OPP’s services increased 29% from 2007 to 2011, an average of about 7% annually—or more than three times the rate of inflation. For municipal-ities without contracts, the overall increases were 19% over the same period, or an average of about 4% annually. Over the same period, individual municipalities experienced a range of changes in costs for OPP service, from a decrease of 60% to an increase of 135%. Factors besides internal OPP cost increases that affect the chargeback include changes in the number of calls for service to a municipality.
Notwithstanding the concerns expressed about costs, all municipal officials we spoke with said they were very satisfied with the OPP services they received and with the communication provided by local detachment commanders on community issues. As well, all the municipalities acknowledged that using the OPP’s services was generally less
costly than maintaining their own municipal police forces. According to OPP estimates, municipalities with and without contracts save on average any-where from 35% to 60% by using the OPP instead of having their own police forces, as shown in Figure 7.
OPP senior staff told us that some municipalities choose not to sign contracts for OPP services, while others with contracts decide to pay for services over and above the basic requirements. Consequently, municipalities can receive different levels of poli-cing. As an example, two municipalities with simi-lar numbers of calls for service had very different levels of service: One, a non-contract municipality, paid $9 million a year for a minimum level of police service; the other paid more than $15 million a year for a contract that provided for 30 staffing enhance-ments, including a dedicated traffic patrol and greater officer presence in the community. Several larger municipalities have chosen a basic level of service by not entering into contracts with the OPP, likely due to the lower costs of such arrangements. Interestingly, the OPP advised us that three muni-cipalities that paid for enhanced OPP services were cited in 2010 by a national magazine as being in the top five safest communities in Canada.
The Ministry and OPP have been working to improve relationships with municipalities by providing more information on the costs of their services. In February 2012 , a project team of representatives from the OPP, the Ministry, munici-palities and their associations, and police services boards was formed to improve communication and accountability about the OPP’s costing policies and processes, and to identify opportunities for municipalities to contain or reduce policing costs. In March 2012, about 40 policing organizations and municipal stakeholders took part in a summit on the future of policing hosted by the Ministry. As well, the Ministry created the Future of Policing Advisory Committee with municipal involvement to oversee and make recommendations by 2015 for changes to policing standards.

247Ontario Provincial Police
Chap
ter 3
• VF
M S
ectio
n 3.
10
Costing and Billing Methodology
The OPP sets the minimum number of officers and hours required to service a municipality, regardless of whether it has a contract in place. This deter-mines the municipality’s expected costs, including direct costs for officers’ salaries plus an allocation for other support and operating costs, such as vehicles, training, communications, forensic iden-tification units and facilities. Municipalities with contracts can also opt to enhance the service level beyond the minimum recommended by the OPP, and to pay extra for more officers. Municipalities are given a budget at the beginning of the year, billed monthly based on that budget, and receive a final invoice that reconciles the budget to actual expenses at year-end.
To determine the minimum number of officers a municipality requires, the OPP uses either its Deployment Model or a workload analysis tool. However, these different methods can produce different results. In 2011, internal auditors noted that the OPP had not established clear criteria for using one or the other method. We were told that a manual on the contract renewal and negotiation process was to be completed by late 2012, and shared with municipalities, to address the internal auditor’s recommendation that the OPP ensure that the process of establishing municipal contracts is transparent and managed effectively.
As of our current audit, the agreements with municipalities did not clearly indicate whether the number of officers was the original minimum determined by the OPP or whether it was a higher
Figure 7: Cost Comparison of Municipal Police Services, 2011Source of data: Ontario Provincial Police
Estimated per Capita CostProvider of Police Services # of Municipalities of Police Services ($)Population 100,000 and overMunicipal police force 17 282
OPP – with contract 0 —
OPP – no contract 0 —
Population 50,000–99,999Municipal police force 7 264
OPP – with contract 6 153
OPP – no contract 2 117
Population 15,000–49,999Municipal police force 14 284
OPP – with contract 21 150
OPP – no contract 4 131
Population 5,000–14,999Municipal police force 14 329
OPP – with contract 48 156
OPP – no contract 31 133
Population less than 5,000Municipal police force 1 371
OPP – with contract 74 238
OPP – no contract 136 142

2012 Annual Report of the Office of the Auditor General of Ontario248
Chap
ter 3
• VF
M S
ectio
n 3.
10
number based on a municipal request. For example, contracts for one municipality showed that the number of officers increased from 65 in 2009 to 80 in 2013. However, there was no indication whether these additional officers were needed as a minimum to meet increasing workloads, or whether they had been requested as enhancements to the contract. Without sufficient contractual or other docu-mentation, the OPP risks not being able to clearly demonstrate that it is providing policing services to municipalities consistently and cost-effectively.
The costing formula for the OPP’s contracts is established by a regulation under the Police Ser-vices Act and approved by Treasury Board. Direct costs represent about 80% of the formula and are updated annually based on actual salaries and benefits paid to officers, including all increases negotiated as part of collective agreements. Other support and operating costs make up the rest of the formula and are based on provincial average costs calculated periodically and applied based on the number of officers assigned to the municipality. The cost per officer to municipalities for both direct and other support and operating costs increased from approximately $122,200 in 2007 to $144,000 in 2011, or 18%.
Other support and operating costs embedded in the formula were not updated annually, so the charges did not necessarily reflect current OPP costs. Beginning in 2012, all municipalities without contracts were billed using the 2010 costing for-mula, the most recent approved by Treasury Board. However, for municipalities with contracts, the OPP is currently billing based on 2003, 2008 and 2010 formulas, depending on when the five-year contract was last negotiated. This is because as the contracts expired and were renewed, the most cur-rent formula at the time was applied to the contract for the entire five-year renewal without provision for the OPP to update the formula. Other support and operating costs increased from about $18,000 per officer under the 2003 formula to $29,000 in the 2010 formula. As a result, municipalities could have experienced increases of up to 60% in these
costs in the year that the contracts were renewed. As of March 31, 2012, the OPP was still billing 32 municipalities using the 2003 formula and four using the 2008. We noted that if all municipalities were updated to the current 2010 formula, the OPP would have recovered an additional $5.4 million of its other support and operating costs annually.
The OPP has received approval from Treasury Board to update and apply the formula on an annual basis beginning in 2012. Internal auditors also identified that costs in the formula are not con-sistently included, updated or validated, and that there is no clear documentation for the rationale for including or excluding a particular cost. Beginning in 2012 with the annual updates to the formula, the OPP was to have a formal process in place to review all the items used in the costing formula, and improve its documentation for determining which costs should be included. Better documenta-tion should also help improve the OPP’s ability to disclose its charging practices to municipalities.
In addition, we found that in 2011, municipal-ities covered by 49 of the 118 contracts in place received more hours of service than their guaran-teed minimums, including three locations that have each been over-serviced by more than 10,000 hours annually since 2007. However, the OPP is unable to recover the additional costs of providing more ser-vices than required in the contracts. As well, muni-cipalities covered by 21 contracts received fewer hours of service than the guaranteed minimum. OPP officials told us that these discrepancies could stem from officers not properly recording their time or because the use of their time had not been prop-erly monitored by their supervising officer.
Annual Credit Reimbursement to Municipalities
OPP detachments operate on an integrated service model whereby one detachment may provide poli-cing services to several municipalities—contract and non-contract—as well as perform provincial
249Ontario Provincial Police
Chap
ter 3
• VF
M S
ectio
n 3.
10
policing duties either within or outside of the detachment area.
Officers who work in detachments are not designated as specifically municipal or provincial. Whatever their duties on a particular day and what-ever municipality they work at, officers record their activities and location in the OPP’s Daily Activity Reporting (DAR) system. As part of the billing pro-cess, the OPP provides contract and non-contract municipalities with a Provincial Service Usage (PSU) credit to make up for the time officers in the detachment spend performing provincial policing duties or working outside of the detachment area rather than performing municipal duties. The OPP provided an average of $23 million per year over the last five years in total PSU credits to municipal-ities. These credits were in addition to the police services grants managed by the Ministry of Finance.
For municipalities with contracts, we asked why the OPP needed to provide PSU credits of about $15.6 million annually when its contracts and annual budgets with these municipalities are based on hours of service and municipalities are charged only for the time spent on municipal policing, thus making the credits unnecessary. (For municipalities without contracts, annual budgets are calculated in a different way that requires providing a PSU credit.) In addition, we noted that the PSU credit and billing method does not take into account whether the minimum required contract hours were exceeded by the OPP for municipalities with contracts. For instance, five municipalities with contracts were each over-serviced by more than 10,000 hours in 2011 and still received between 3% and 8% of their gross costs back in PSU credits at the end of year.
The OPP notes that municipalities rely on PSU credits to reduce their police services costs, and that any proposal to eliminate the credit would need Treasury Board approval, because it would place a greater financial burden on municipalities at the same time that the updated costing formula was being applied to include more of the OPP’s true costs for providing services.
Other Provinces
The charging practices for the OPP’s services are complex and onerous both on municipalities and on the OPP, and, as already noted, not well understood by municipalities. In contrast, our understanding of the RCMP and Sûreté du Québec costing processes suggests they appear much easier to administer. For example, the RCMP dedicated officers to its munici-pal contracts and charged municipalities 80% of the cost of those officers. As a result, the RCMP did not provide credits to municipalities for any police work they performed outside of the municipality, since co-operation between police forces is considered a normal practice. In Quebec, all municipalities with populations up to 50,000 have been required since 2001 to use the Sûreté du Québec for policing. Ten-year contracts are used, and regional muni-cipalities are invoiced based on property values and population.
The OPP prepared a briefing note to the Minister of Community Safety and Correctional Services in 2004 proposing to implement a provincial per capita or per household methodology for invoicing muni-cipalities, but no action was taken. The OPP advised us at the time of our audit that it was reconsidering a per capita costing methodology and expected to present a briefing note to the Ministry in late 2012.
Assisting Municipal Police Services
The OPP is sometimes called on to assist municipal police forces, but it has never charged municipalities for this, even though it has the authority to do so under the Act. In some cases, a formal support agreement with the OPP is required to allow the municipal police force to meet the adequacy stan-dards under the Act for a municipality to have its own police force. The OPP has calculated that from 2007 to 2009, the average cost of providing assist-ance to other police services was $11.3 million per year. However, we were told that this calculation included costs that fall under the OPP’s provincial responsibilities, such as complex cross-jurisdictional
2012 Annual Report of the Office of the Auditor General of Ontario250
Chap
ter 3
• VF
M S
ectio
n 3.
10
investigations, which may not be recoverable, and that the OPP’s system does not track the strictly municipal assistance costs separately.
As part of its 2012/13 planning, the Ministry has recommended to the Treasury Board that it start charging municipalities for its assistance. However, the OPP noted that it was the smaller municipalities that most often required the most assistance with major incidents or investigations, and they might not be able to afford to pay for such help.
USE OF VEHICLES The OPP operates a fleet of about 3,800 vehicles— 1,250 assigned to officers or civilian staff and the rest designated as patrol and pool-usage vehicles.
In 2008, to comply with Canada Revenue Agency regulations, the OPP notified officers and civilian staff that they would incur a taxable benefit when a vehicle assigned to them was used for personal reasons, such as routine commuting from home to work. In March 2009, the OPP approved a list of job descriptions and positions that were deemed exempt from a taxable benefit.
RECOMMENDATION 7
To promote better relations with, and consist-ent services to, municipalities, and fairer and more transparent billing processes, the Ontario Provincial Police, in conjunction with the Ministry of Community Safety and Cor-rectional Services, the Ministry of Finance and municipalities, should:
• seek ways to simplify, and make more transparent, its cost-recovery methods and consider whether various grants and credits should be amalgamated into one all-encompassing costing formula;
• address the issues in its costing and billing methods that result in municipalities paying different rates and consider phasing in cost increases over time rather than when con-tracts are renewed; and
• consider establishing a policy that would require identifying all costs for providing services to support municipal police forces as well as the proportion to be recovered.
OPP RESPONSE
A comprehensive document explaining the cost-recovery formula was prepared in August 2012 in collaboration with the Association of Municipalities of Ontario (AMO) and three municipal Chief Administrative Officers. This document was shared with every municipality that receives policing services from the OPP.
The OPP, Ministry of Community Safety and Correctional Services and Ministry of Finance have been collaborating on identifying and evaluating changes to the current complicated system of charges and grants. Proposals for a more equitable and simple billing process are being developed for consideration as part of the government’s commitment to economically sustainable policing.
The recovery of costs for providing police service to municipalities that receive policing from the OPP is governed by the regulations under the Police Services Act. The OPP and Ministry report annually on costs in accordance with these regulations. In addition, the OPP brings forward options for additional cost cat-egories for inclusion in the cost-recovery model if they are found to be directly attributable and material to the provision of services. AMO is aware of this practice/policy and Police Service Boards are also made aware through their biannual conferences.
OPP senior management is open to the con-cept of charging municipalities for some services that the OPP provides to municipal police forces, depending on a variety of factors, particularly where core police services are provided that would normally be routine business for a force.
251Ontario Provincial Police
Chap
ter 3
• VF
M S
ectio
n 3.
10
The OPP calculates the amount of taxable benefit to be reported on employee T4 income slips using its fleet bureau system, in which drivers are to record their personal mileage each month. Man-agers are responsible for reviewing the fleet bureau entries at the end of the year to ensure employees are properly reporting their mileage.
In late 2011, the OPP began a review to see if it could operate more efficiently by cutting down on the number of vehicles it assigned to officers and civilian staff and to examine whether taxable benefits were being properly administered. The review, completed in February 2012, found that poor record-keeping and problems with various processes resulted in the following:
• The whereabouts of 200 vehicles listed in the fleet management database were not readily known, since the vehicles were not listed as assigned to a region or investigations bureau.
• The list of vehicles assigned to staff could not be located and had to be recreated.
• The approved list of job descriptions and pos-itions deemed exempt from a taxable benefit had not been reviewed and updated since it was released in March 2009. The review also identified 40 staff listed as exempt, but whose current positions did not qualify for the exemption.
• No personal mileage was reported by more than half of the 640 non-exempt staff who were assigned vehicles.
OPP staff informed us that, as of September 2012, they had accounted for all vehicles and issued amended T4 tax slips to the 40 employees whose positions did not qualify for an exemption.
DETACHMENT INSPECTIONSThe Police Services Act stipulates that all police forces have quality assurance processes in place for the delivery of adequate and effective policing. The OPP’s Quality Assurance Unit uses two processes for conducting audits for this purpose:
• It provides a Management Inspection Process (MIP) questionnaire to each detachment com-mander three times a year to assess whether the detachment is meeting the standards of the Police Services Act and the OPP’s own policies.
• It conducts an on-site physical inspection of all detachments every two years (three years up until mid-2011) to verify the information provided in the MIP questionnaire; audit high-risk areas such as vaults that hold seized firearms, drugs and cash, and storage of the detachment’s armaments; and examine the detachment’s financial processes. The Unit sends its findings to the detachment com-mander and to management at the regional headquarters and at General Headquarters.
RECOMMENDATION 8
To help adequately manage and control the use of vehicles, the Ontario Provincial Police should:
• improve its record-keeping and other pro-cesses for tracking inventory and assigning vehicles and capturing personal-use mileage; and
• ensure that its processes result in compliance with tax laws that require that any signifi-cant personal use of vehicles be reported as employee income.
OPP RESPONSE
The OPP agrees that the vehicle management process implemented in 2008/09 is not meeting current needs. A project has been established to review the current system and improve the management of vehicle taxable benefits. As well, all discrepancies between the fleet management database and the physical vehicles have now been resolved. New processes and policies will enable the OPP to effectively and efficiently manage vehicle assignments and ensure compli-ance with tax reporting requirements.

2012 Annual Report of the Office of the Auditor General of Ontario252
Chap
ter 3
• VF
M S
ectio
n 3.
10
We expected that with these quality assurance processes in place, relatively few problems would be found at the detachments. However, inspection reports that we saw often noted that detachments were not complying in a number of areas and were told to correct deficiencies. Similarly, we did our own inspections at eight detachments and found a number of deficiencies, even though, just as with inspections by the Unit, the detachments were noti-fied in advance of our inspections. The problems we found at the detachments included missing documentation, the use of improper signatures for authorizations, and poor controls over evidence and OPP weapons. For example:
• We noted several cases where physical counts of seized items in the vaults did not match the inventory listings in the computerized Records Management System (RMS). At one detachment, the staff could not provide an inventory listing from RMS for seized cash, drugs and firearms, and instead were using a manually prepared ledger that lacked the controls in the RMS system. We found three cash court-evidence exhibits in the vault that were not recorded in the ledger. At two other detachments, the physical count of seized fire-arms did not match the RMS inventory listing; in one of the cases, the vault contained five fewer seized firearms than the RMS listing. In several other detachments, the required records of items placed in and removed from the vaults were not always maintained or the items were improperly documented. It was also often not clear who had access to court evidence in the vaults.
• Several transfers of seized cash out of detach-ments were made without acknowledgment from the recipients. At one detachment, $7,500 was transferred to another OPP inves-tigations bureau without proper signatures, and an exhibit of $1,700 in seized cash could not be located in the vault.
• We found cases in which seized items were secured in non-approved exhibit storage
bags, where documentation for items was missing, and where only one signature was obtained for disposal of illicit drugs when two signatures are required. At one detachment a civilian staff member was assigned to manage the storage vault, which is contrary to policy.
• In some cases, officers’ handguns were stored in locked firearms lockers that did not have the required locking cable or an approved lock. As well, we found off-duty officers’ pep-per spray canisters were not in handgun stor-age lockers as required by policy.
RECOMMENDATION 9
To ensure that detachments meet legislative and policy requirements for ensuring the security and integrity of seized cash, drugs and firearms, and detachment weapons, the Ontario Provin-cial Police should:
• reassess its quality assurance processes and increase senior management oversight of results to identify ways to make inspections more effective, including the periodic use of surprise inspections to promote sustainable compliance; and
• make detachment commanders more accountable for ensuring that actions have been taken to correct any deficiencies noted.
OPP RESPONSE
The OPP has made a strong commitment to ensuring that Police Orders and legislative requirements for policing standards are consist-ently followed. The OPP has investigated and resolved the discrepancies identified by the Auditor General’s review. Through this review, the regions have identified accountability, train-ing and policy clarity as areas that will improve seized asset management. The OPP will review the suggestions and implement new processes where required.
The OPP’s Quality Assurance (QA) unit works in partnership with the regions to

253Ontario Provincial Police
Chap
ter 3
• VF
M S
ectio
n 3.
10EFFECTIVE POLICINGCommunity-oriented Policing
The Police Services Act requires the Minister of Com-munity Safety and Correctional Services to develop and promote programs for community-oriented police services. As well, the Act establishes min-imum police service standards and requires every chief of police to establish specific procedures and processes for community-oriented policing.
Historically, the OPP’s community-oriented policing program involved regular meetings and communications between a committee of local citizens and members of the local detachment, dur-ing which the group would deal with local concerns about such issues as crime and traffic. The goal of the program has been to improve community safety and to involve the community in crime prevention.
In 2010, the Ontario Association of Chiefs of Police introduced a new community-policing model, which, according to the 2011 OPP business plan, was to be the foundation of the force’s crime-prevention efforts. The business plan indicates that the OPP needed to make significant efforts through awareness sessions or other communications to
tell OPP staff about the new model and train them accordingly, and to let communities know about it.
On our visits to eight detachments, we asked commanders, sergeants and constables whether, or what, they knew about the new community-policing model. Some detachment members knew about the new model and had even received some training or had attended awareness sessions; others were unaware of it. We also checked to see whether the community-policing committees still existed. In three jurisdictions, the committees still met, and in another three, the committees existed in some form, but had not met recently or were being redeveloped. In two detachments, there were no committees.
In our 1998 and 2005 audits, we reported that the community-oriented policing program needed to have better management oversight and a pro-cess to measure the effectiveness of the program against established criteria. We found during our current audit that these observations had not been addressed.
Results-Driven Policing
In 2006, the OPP introduced the Results-Driven Policing Accountability Framework for improving community safety through targeted crime and traffic-enforcement initiatives. Using the framework, detachments and regional headquarters collect and analyze statistics on rates of certain crimes and the numbers of road-related fatalities and injuries, and these statistics are discussed at quarterly meetings. If, for instance, the statistics show an increase in accidents on a certain highway, or a spike in certain types of crimes in a particular area, resources may be redirected to address the situation. Senior manage-ment at General Headquarters reviews the Results-Driven Policing reports quarterly and, if necessary, requests corrective action.
This sort of response strategy is useful in that it helps detachments focus their resources on improving tangible results, but the framework sets no targets against which detachments can meas-ure their results and compare them with other
continually review and improve QA processes. Furthermore, substantial changes were made after the Auditor General’s recommendations in 2005 and follow-up report in 2007.
Currently, the Deputy Commissioner of Field Operations and each Regional Commander receives a summary of all findings. The QA unit works with the detachments and the region to ensure all the issues are resolved in a timely fash-ion. If an issue is systemic or involves a risk that is not resolved, the QA unit will inform the Deputy Commissioner. In most cases, errors are related to documentation or process discrepancies.
The OPP will continue to reassess its quality assurance processes and ensure detachment commanders are accountable.
2012 Annual Report of the Office of the Auditor General of Ontario254
Chap
ter 3
• VF
M S
ectio
n 3.
10
detachments. Setting targets could allow the OPP to more effectively monitor and improve detach-ments’ performance.
Response Times
Communication devices in OPP vehicles have a button that officers use specifically to report to the communications centre when they arrive at a scene, and officers are required to use this button. However, unlike municipal police services and the RCMP, the OPP does not analyze information about how much time elapses between when a call is received by one of its regional communications centres and when the officer arrives on the scene. Consequently, the OPP does not know whether average response times are reasonable, particularly for more serious or higher-priority calls. OPP officials told us it would be impractical to set a response-time standard for all calls because of sig-nificant geographic differences across the province. Nevertheless, keeping track of average response times on a detachment-by-detachment basis would allow the OPP to monitor officer response times to determine whether there were any detachments that may need more officers during certain periods.
The OPP compiled an informal sample of aver-age response times from one regional communi-cations centre in 2011 and found that an officer arrived on the scene within 10 minutes in 78% of calls for service and within 40 minutes for 95% of calls. No other analyses of response times have been carried out, whether of individual detachments, regions or the province as a whole.
RECOMMENDATION 10
To help ensure that police resources are focused on the Ontario Provincial Police’s key objectives for effective policing, the Ontario Provincial Police should:
• improve the reporting to management on the community-oriented policing program and the results-driven policing program,
and establish measures for assessing the effectiveness of these programs at individual detachments; and
• monitor average officer response times to calls for service for each detachment to ensure that adequate response times are achieved, particularly for higher-priority calls and during peak demand periods.
OPP RESPONSE
The OPP will develop a reporting mechanism for community-oriented policing. The OPP Crime Prevention Section has begun communicating with regions on how Ontario’s Mobilization and Engagement Model of Community Policing can be used most successfully. The OPP has also established a tactical priority-setting process enabling officers in the OPP and other police agencies to focus on severe crime problems affecting communities.
The Results Driven Policing (RDP) program is an accountability process meant to identify and respond to issues quickly, rather than com-paring benchmarks against other detachments and regions. Significant work is done at the detachment and regional levels regarding RDP statistics and in response to trends and emerging issues. Best practices are identified and shared. All of those results are in turn rolled-up and reviewed monthly at OPP Executive Council meetings at General Headquarters. The OPP is currently developing a better corporate analysis framework and reporting process on the benefits and the successes/failures of RDP regional initia-tives. In the new year, a streamlined and more efficient RDP process will be implemented at the detachment, regional and provincial levels.
The OPP will investigate ways to efficiently monitor response times and has set a target to provide reports and analysis to senior manage-ment by the end of 2013.
255Ontario Provincial Police
Chap
ter 3
• VF
M S
ectio
n 3.
10
INFORMATION SYSTEMSOfficers use two separate OPP systems on a daily basis to record their activities:
• The Records Management System (RMS) tracks occurrences, such as those resulting from calls for service, and permits analysis of case-related information, such as types of crime committed, location, people and prop-erty involved, witness statements and officers’ notes. Officers are required to update RMS after each occurrence.
• The Daily Activity Reporting system (DAR) is, primarily, a time-accounting system that tracks an officer’s regular and overtime work hours, the number and types of calls for service to which an officer responds, and how much time each officer spends on activities such as traffic patrol, Criminal Code investiga-tions and administration. Officers are required to update DAR daily.
Officers, administrators and local and provin-cial governments rely on the RMS, which holds about 11 million records, to provide accurate data quickly. For example, front-line officers use the RMS to look up records of known violent offenders, vicious animals or high-risk residences, as well as to access a suspect’s criminal background and other vital data. Organizationally, the OPP uses RMS to compile crime statistics for policing initiatives such as community-oriented and results-driven policing, and uses DAR for reporting publicly on the number of calls for service to which it responds.
The OPP has acknowledged concerns about the quality of data in RMS. Random internal audits have revealed a number of data-quality issues, including the fact that occurrence information is often incompletely or poorly documented, and that occurrences that are already recorded in the system do not show up during RMS searches by officers.
Data integrity problems are more prevalent in DAR. In 2005, we recommended that the OPP insti-tute procedures to require supervisory officers to oversee the completeness and accuracy of the infor-mation entered into the system by officers. This
was only partially implemented, and a supervisor’s approval is required only when officers record over-time hours. Supervisors are also required to ensure weekly that officers have updated DAR, but they do not check or approve the officers’ data entries. By comparison, the Sûreté du Québec requires that supervisors approve officers’ activity reports on a daily basis.
There is data overlap between the occurrences recorded in RMS and the calls for service recorded in DAR, with between 50% and 80% of similar data in both. Since there is no linkage between the two systems, data has to be manually entered twice. The OPP does not have any processes that regularly compare or reconcile the information in RMS with that in DAR. Our own analysis comparing the similar data in the two systems for 2011 noted a significant difference between the 635,000 calls for service in DAR and the approximately 815,000 occurrences reported in RMS. For example, some of the differ-ences in the number of occurrences or calls for ser-vice between RMS and DAR were approximately as follows: 4,000 thefts, 1,200 assaults, 13,000 alarm responses, 26,000 police assistances, 130,000 traffic incidents and 6,000 incidents relating to compulsory auto insurance. The general view among the officers we spoke to at the OPP is that the occurrences data from RMS are more reliable than the calls-for-service data in DAR; however, it is the DAR data that is published in annual reports and used for staffing deployment models.
RECOMMENDATION 11
To help ensure that its two key information sys-tems contain accurate information that can be reliably used for managing and reporting on its policing activities and on crime and traffic occur-rences, the Ontario Provincial Police should:
• assess the extent to which the Records Management System and Daily Activity Reporting systems do not reconcile with each other for critical data such as occur-rences and calls for services;
2012 Annual Report of the Office of the Auditor General of Ontario256
Chap
ter 3
• VF
M S
ectio
n 3.
10
PERFORMANCE MEASUREMENT AND REPORTING
The OPP uses its annual report to publicly give details about its programs, services and activities; its three-year strategic plan; motor-vehicle fatalities and injuries; and crime levels and clearance rates. Crime statistics are reported in the same uniform reporting format used by police forces across Canada. As of August, 2012, the most recent OPP annual report covered the 2010 calendar year.
While the OPP reports extensive information on its policing activities, crime and motor-vehicle
accidents, it does not report on its own efficiency. By comparison, municipalities and their police forces typically report on their operating costs for police services on a per capita or per household basis. Other police forces set targets for achieving efficiency levels, such as times for its communica-tions centre to respond to an emergency call and officer time lost to illness. In addition, the OPP does not include in its annual report the percentage of time its officers spent on administrative duties.
In its 2011–13 Strategic Plan, the OPP identified four goals:
• public safety, with emphasis on excellence in delivering core police services;
• strong, effective partnerships with commun-ities, stakeholders and colleagues;
• a sustainable workforce that demonstrates expertise, pride and dedication; and
• efficiency and effectiveness in an increas-ingly complex and challenging policing environment.
The force established performance indicators for each goal, but very few are measurable based on actual performance, and no targets have been set. For the efficiency and effectiveness goal, for instance, the performance indicators include having “uniform workloads statistics,” “offering financial training opportunities,” and “response to various inquests, inquiries and audits.” In its 2010 annual report, the OPP reported on results pertaining to effectiveness achieved on its 2008–10 Strategic Plan, including a list of activities completed, but no measurable results were provided on the cost-effectiveness of its operations.
The OPP conducts a community satisfaction survey every two years. In its last annual report, the force said the 2009 survey found that 95.4% of Ontarians felt safe or very safe in their communities. The results were based on interviews with the gen-eral public in specific communities about their views of the OPP. However there was no way to ascertain whether respondents actually had any contact with the OPP. We noted that the RCMP annually reports on the percentage of clients it dealt with who are
• consider whether periodic supervisory approval of officers’ daily or weekly data input would help minimize inconsistent and inaccurate data between the two systems; and
• on a longer-term basis, assess the cost/benefit of system changes that would enable officers to enter information such as occur-rences and calls for service only once to update both systems.
OPP RESPONSE
As the Auditor General recommends, the OPP has initiated work to identify where RMS and DAR data do not reconcile. Particular attention is being paid to the areas of occurrences and calls for services. Simplification of system input and the elimination of duplication is a specific deliv-erable of a project established to review the DAR system. The OPP is exploring opportunities for a customizable off-the-shelf product developed by the private sector, and estimates that a product will be procured within the next 18 months.
In addition, the OPP will develop policy and procedure around regular review and signoff for officer-entered data. The expansion of civil-ian data entry into RMS, which is to begin in 2013/14, is expected to result in improved data entry because of direct supervision and oversight.

257Ontario Provincial Police
Chap
ter 3
• VF
M S
ectio
n 3.
10
satisfied that the force is providing high-quality ser-vices. In 2010/11, the RCMP’s target was 80% and the actual performance was 79%.
RECOMMENDATION 12
While the Ontario Provincial Police provides good information on crime rates and its activ-ities and services, additional information to enable the public to assess its cost effectiveness and operational efficiency is needed. It should also periodically and independently survey com-munity residents who have had recent contact with the force to determine their satisfaction with the service they received.
OPP RESPONSE
The OPP will research best practices with regard to measuring and reporting on cost-effectiveness
and operational efficiency within police agen-cies. The OPP will ensure that the targets it sets for its goals are measurable.
The annual OPP Community Survey includes questions on effectiveness as well as questions specific to residents who have had recent contact with the force. The results are analyzed inter-nally. The OPP agrees with the Auditor General’s recommendations on reporting the results and will post its 2012 survey results on the public Internet site. Also, detachment survey results are available to Detachment Commanders to share with their communities.