3.0 university energy management questionnaire · 3.0 university energy management ... had...
TRANSCRIPT

37
3.0 University Energy Management Questionnaire
3.1 INTRODUCTION
To supplement the individual case studies, a postal survey was undertaken of energymanagement in UK universities. The survey was based very closely on the Pre InterviewQuestionnaire (PIQ) and was estimated to require around 15 minutes to complete, with themajority of questions being simple tick boxes. Questions were organised under the followingheadings:
• Annual energy costs• Energy policy and management• Environmental policy and management• Energy information systems• Energy management self assessment profile• Energy efficiency investment• Energy saving opportunities• Information sources on energy efficiency opportunities• Use of contract energy management• Implementation of specific energy efficient technologies• to energy efficiency improvement
A copy of the survey questionnaire is contained in Annex 1.
The survey was sent to the individual responsible for energy management at 94 UKuniversities (the federal colleges of the University of London were treated as a singleinstitution). Contact names were originally obtained from a database of Higher EducationEnergy Share Fair members, held by the Buildings Research Establishment. Additionalcontacts for universities that were not members of the Share Fair network were obtained fromthe institutions’ web sites and through phone calls. Some of the respondents were full timeenergy managers, but more usually their job description suggested wider responsibilities: e.g.Estates manager; Estates maintenance supervisor; mechanical engineer; procurementmanager; building services officer; and so on. The six institutions used as case studies wereexcluded from the survey.
A total of 32 replies were obtained, representing 33% of the survey population. Three of thereplies did not report their annual electricity and fuel consumption. The remaining 29 wereclassified by their total annual expenditure on energy, as follows:
Small: < £1 million/year 11 respondentsMedium: £1 - 2 million/year 9 respondentsLarge: > £2 million/year 9 respondents
The smallest reported annual energy expenditure was £228 thousand while the largest was£4.8 million. Institutions with a total energy expenditure of >£1 million/year arerecommended by the UK Energy Efficiency Office to appoint a full time energy manager. Of

38
the respondents, 15 out of the 18 institutions with annual bills exceeding £1 million had anenergy manager, while less than half of the small institutions did. The above categories aretherefore a convenient basis for comparing the performance of different sized institutions.
The performance of the universities on energy management could in principle be assessed bymeans of energy use per square meter floor area. However, experience suggests that reportingfloor area accurately may be difficult for some institutions and may discourage completion ofthe questionnaire. Even if they had the data, efficiency figures would be expected to varywidely according to the age of building and the type of building use (notably residential vs.academic). Meaningful data would therefore require more detailed surveys and the use ofdisaggregated benchmarks, such as discussed in section 2.4.3. The performance measureshere are therefore based on self assessment of variables such as technology adoption. This isindirect and impressionistic, but nevertheless useful.
The sample is self selecting and it seems reasonable to assume that a response to thequestionnaire indicates an interest in, and willingness to devote time to, energy related issues.It is therefore likely that the sample will be biased towards those universities with a moreproactive approach to energy efficiency. This, together with the small sample size, suggeststhat the results should be treated with caution and may not be representative of the totaluniversity population. Nevertheless the results provide a useful picture of energy managementpractices in one third of UK universities in 1999 and a useful benchmark against which tocompare the subsequent case study results.
The results of the survey are summarised in the following sections. In most cases, results arepresented as the percentage of valid replies to each question, where a non-valid reply meansthat no answer was given. The number of valid replies varied between questions. For mostquestions, results are broken down into the small, medium and large size categories, but thesmall sample size must be borne in mind when interpreting results expressed as percentages.
3.2 ENERGY POLICY AND MANAGEMENT
A total of 81% of respondents had an energy policy of some form, although this fell to 64% inthe small category. Integration of policy objectives into new build & refurbishmentspecifications was high at 93% overall and 100% for large institutions. Integration intomaintenance policy was poorer at 71%, while integration into purchasing policy was poorerstill with only 54% of institutions considering energy issues. Clearly, ‘integration’ here is asubjective concept and the effectiveness of such integration is considered further in the casestudies.
The DETR Making a Corporate Commitment (MACC) campaign aims to increase awarenessof energy efficiency among top management. Signatories pledge to develop and publish aformal energy policy and set specific targets for energy use. MACC may therefore beindicative of a stronger commitment to energy efficiency than in-house policies. Only 46% ofrespondents were signatories to MACC, compared to 81% with some form of energy policy.In the small size category, only 22% were signatories.

39
Table 3.1 Energy Policy (% of valid responses)
Question Small Medium Large TotalDoes the university have an energypolicy?
64 89 89 81
Are energy policy objectivesintegrated into new build &refurbishment specifications?.
89 89 100 93
Are energy policy objectivesintegrated into maintenance policy?
78 71 67 71
Are energy policy objectivesintegrated into purchasing policy?
50 25 78 54
Is the university a signatory to theMAAC campaign?
22 56 63 46
Energy management may be the full-time or part-time responsibility of one or moreindividuals. An average of 72% of respondents had an energy manager, but less than half thesmall institutions did. On average, 1.43 staff had responsibility for energy management, withthe respective figures for the individual size categories being 0.53 (small), 1.63 (medium),and 2.28 (large).
Establishment of an energy committee was a key recommendation of the HEFCE energymanagement study (HEFCE, 1996). Only 39% of respondents had such a committee, with thenumber varying from 18% in small institutions to 63% in large. Annual energy reports wereproduced by 58% of respondents, while a high proportion (83%) had conducted energy auditsin major buildings.
A notable feature of both the survey and the case studies is the extent to which responsibilityfor energy management is centralised in the Estates department. Energy budgets are rarelydevolved to individual departments, with important consequences for incentive structures.Here we note that only 22% of respondents delegated responsibility for energy to buildingmanagers.
Table 3.2 Energy management (% valid responses)
Question Small Medium Large TotalIs there an energy manager? 45 78 89 72Does the university have an energycommittee?
18 33 63 39
Is responsibility for energy delegatedto building managers?
18 33 11 22
Have energy audits been conducted inmajor buildings?
90 86 78 83
Is an annual energy report produced? 40 56 67 58
3.3 ENVIRONMENTAL POLICY & MANAGEMENT
Energy management is well established as a an essential element of cost control. In contrast,environmental management is a more recent response to social concerns and is less clearly

40
linked to the bottom line. Take up is more limited and universities are lagging behindmanufacturing firms in the adoption of accredited management systems such as ISO14001.No respondents were registered to an accredited system, although 60% of institutions statedthat they intended to develop such a system in the future.
An average of 59% of respondents had adopted an environmental policy, but only 16% (5institutions) had an environmental manager. In contrast, environmental committees wereestablished at 40% of institutions, a comparable proportion to that for energy committees.Environmental concerns are diverse and while energy use forms an important component of auniversities’ environmental impact it is frequently not the highest profile environmental issue,nor the one where initiatives are easiest to undertake. Hence, only 13% of respondents feltthat the universities’ environmental policy had made a significant impact on energymanagement.
Table 3.3 Environmental policy , & management (% valid responses)
Question Small Medium Large TotalDoes the university have anenvironmental policy?
45 67 67 59
Does the university have anenvironmental manager?
18 0 33 16
Does the university have anenvironmental committee?
60 22 38 40
Has the universities’ environmentalpolicy had a significant impact onenergy management?
0 22 22 13
Does the university have an accreditedenvironmental management system?
0 0 0 0
Does the university intend to developsuch a system?
83 25 75 60
3.4 ENERGY INFORMATION SYSTEMS
A comprehensive data collection and data analysis system for energy consumption is aprerequisite for effective energy management. In the UK, such systems are generally referredto as Monitoring & Targeting, and are supported by a variety of software packages (Croner,2000).
Respondents were asked for the level at which energy use was metered and the frequency withwhich it was recorded. Submetering was well established for electricity, with 72% metering atthe building level and 19% at the departmental level. The latter can be problematic if severaldepartments are contained in a single building and/or frequent changes are made in buildinguse. Submetering at the departmental level may therefore only be technically feasible forsome organisations - notably where there is one department per building or floor.Submetering for heat consumption is more problematic and depends upon whether eachbuilding has its own boiler or whether there is a campus district heating system fed from acentral boiler. In the former case, fuel consumption for each boiler can be recorded, while inthe latter metering of hot water is required, which can be technically difficult. An average of

41
69% of respondents metered heat at the building level, with the remainder metering at the sitelevel.
Electricity consumption was recorded monthly by 78% of respondents, while 9% recordedweekly and 13% daily. Daily recording was entirely confined to medium and large sites. Thefrequency of fuel/heat recording was very similar. More frequent recording can be highlyeffective in allowing faults and other problems to be rapidly identified and dealt with.
Table 3.4 Level that energy use is metered (% of valid replies)
Energy small med large totalElectricity Site level 28 0 0 9
Building level 64 78 67 72Departmental level 9 22 33 19
Heat Site level 50 14 33 31Building level 50 86 67 69Departmental level 0 0 0 0
Table 3.5 Frequency that energy use is recorded (% of valid replies) 19
Energy small med large totalElectricity Monthly 82 67 78 78
Weekly 18 11 0 9Daily 0 22 22 13
Heat Monthly 89 71 50 76Weekly 11 14 17 12Daily 0 14 33 12
86% of respondents monitored trends in energy consumption, with 71% of these adjustingfigures for weather conditions through the use of degree days. A quarter of the small sites didnot monitor trends and only half adjusted records for weather conditions. The extent to whichmore formal data analysis is used can be gauged from the reported use of ‘M&T schemes’.Here, 62% of respondents stated that they used such schemes, with the proportion varyingfrom 45% in the small category to 78% in the large. A slightly smaller proportion, 57%,reported comparing energy use to targets for major buildings.
The HEFCE benchmarks were used by 62% of respondents, including all those classified aslarge but only 27% of small. Energy information appears to be relatively centralised withonly 41% of respondents advising performance to building users. The centralisation ofinformation is matched by the centralisation of budgeting, with only 29% of respondentscharging departments for the energy they consume. This would appear to undermine theincentives for energy efficiency, but it is necessary to ask: first, how much control couldbuilding users have over the energy they consume; and second, how much notice they wouldtake of energy costs anyway if they form a small proportion of their total costs.
Only 17 institutions (53%) reported their performance against benchmarks. The results aresummarised in Table 3.7. Only two institutions (12%) reported very good performance, whilenon reported poor. For electricity, 70% reported either good or average performance, while
42
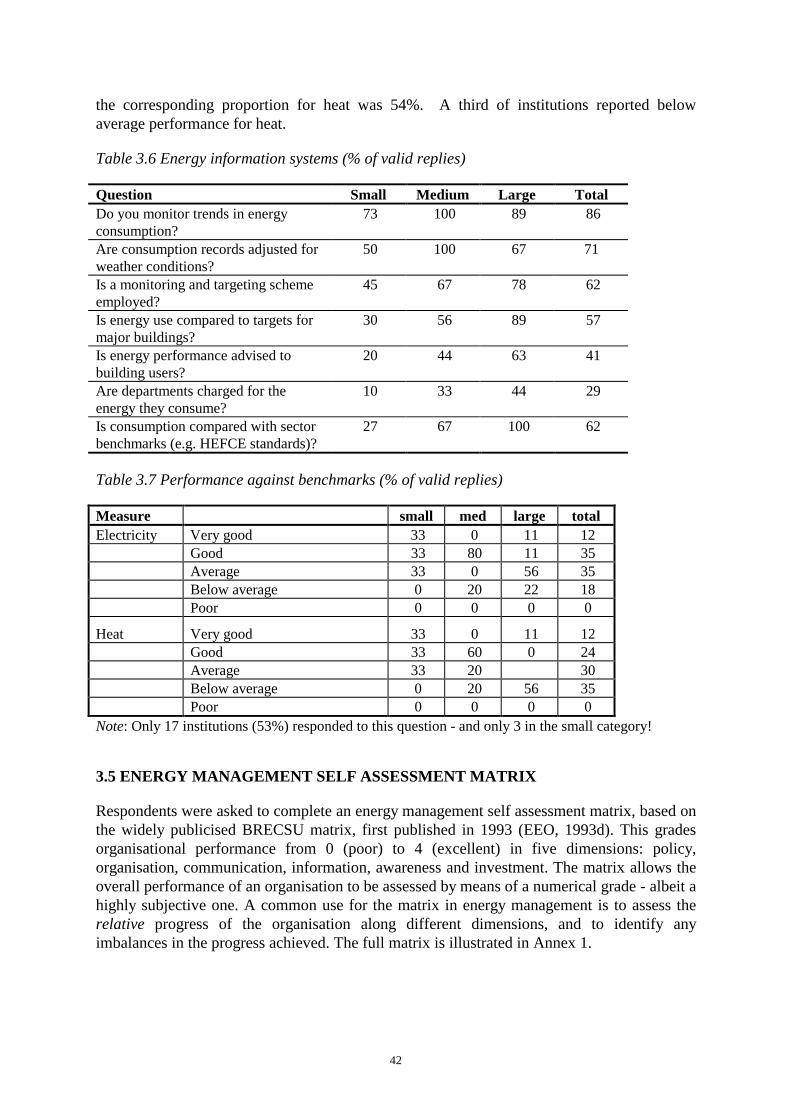
the corresponding proportion for heat was 54%. A third of institutions reported belowaverage performance for heat.
Table 3.6 Energy information systems (% of valid replies)
Question Small Medium Large TotalDo you monitor trends in energyconsumption?
73 100 89 86
Are consumption records adjusted forweather conditions?
50 100 67 71
Is a monitoring and targeting schemeemployed?
45 67 78 62
Is energy use compared to targets formajor buildings?
30 56 89 57
Is energy performance advised tobuilding users?
20 44 63 41
Are departments charged for theenergy they consume?
10 33 44 29
Is consumption compared with sectorbenchmarks (e.g. HEFCE standards)?
27 67 100 62
Table 3.7 Performance against benchmarks (% of valid replies)
Measure small med large totalElectricity Very good 33 0 11 12
Good 33 80 11 35Average 33 0 56 35Below average 0 20 22 18Poor 0 0 0 0
Heat Very good 33 0 11 12Good 33 60 0 24Average 33 20 30Below average 0 20 56 35Poor 0 0 0 0
Note: Only 17 institutions (53%) responded to this question - and only 3 in the small category!
3.5 ENERGY MANAGEMENT SELF ASSESSMENT MATRIX
Respondents were asked to complete an energy management self assessment matrix, based onthe widely publicised BRECSU matrix, first published in 1993 (EEO, 1993d). This gradesorganisational performance from 0 (poor) to 4 (excellent) in five dimensions: policy,organisation, communication, information, awareness and investment. The matrix allows theoverall performance of an organisation to be assessed by means of a numerical grade - albeit ahighly subjective one. A common use for the matrix in energy management is to assess therelative progress of the organisation along different dimensions, and to identify anyimbalances in the progress achieved. The full matrix is illustrated in Annex 1.

43
Table 3.8 summarises respondents’ performance in terms of overall weighted average scores.The overall average score was 2.0, which is reasonable but leaves considerable scope forimprovement. A score of 2.0 in each category corresponds to:
1. Policy: an unadopted energy policy;2. Organisation: an energy manager, but with authority unclear;3. Communication: contact with users through an ad hoc committee;4. Information: M&T reports based on supply meter data;5. Awareness: some ad hoc staff awareness training6. Investment: short term payback criteria The weighted average profile was relatively balanced with most scores in the range 1.5 to 2.5.Respondents scored the highest on policy, with an average of 2.5, and the lowest oncommunication and awareness with an average in both cases of 1.6. Self assessedperformance clearly improved with the size of the institution, with a difference of 0.8 in theoverall weighted average scores for small and large institutions. The difference wasparticularly marked for policy, while the score for investment was similar for all size ranges.
Table 3.8 Self assessment matrix: overall weighted average scores
Category Small Medium Large TotalPolicy 1.8 2.8 3.1 2.5Organisation 1.4 2.4 2.4 2.0Communication 1.0 1.9 2.1 1.6Information systems 1.8 2.1 2.6 2.2Awareness 1.2 2.0 1.7 1.6Investment 2.1 2.1 1.9 2.1
Overall 1.5 2.2 2.3 2.0
Table 3.9 summarises the percentage of respondents scoring very good (4) and very poor (0)in each category. On average, 3.3 respondents (12%) scored very good in each category, whilehalf that number scored very poor. Eight respondents (28%) scored very good in the policycategory, while only two (7%) scored very good for investment and none for awareness. Theresults are suggestive of a gap between policy statements and initiatives undertaken by Estatesdepartments on the one hand, and the general level of energy awareness in the organisationson the other.

44
Table 3.9 Self assessment matrix: Proportion of very good and very poor performers
Category Very poor (0) Very good (4)no.
universities% of valid
repliesno.
universities% of valid
repliesPolicy 1 3 8 28Organisation 1 3 4 14Communication 3 10 3 10Information systems 2 7 3 10Awareness 2 7 0 0Investment 1 3 2 7Average 1.7 6 3.3 12
The detailed results of the self assessment matrices are summarised in Tables 3.10 to 3.15.
Table 3.10 Self assessment matrix: Policy (percentage of valid replies)
Score Description Small Medium Large Total0 No explicit policy 9 0 0 31 Unwritten guidelines 27 11 0 142 Unadopted energy policy 46 33 33 383 Formal energy policy, but no
active commitment 9 22 22 17
4 Energy policy, action plan &review, and managementcommitment
9 33 44 28
Weighted average score 1.82 2.75 3.08 2.53
Table 3.11 Self assessment matrix: Organising (percentage of valid replies)
Score Description Small Medium Large Total0 No energy management 0 11 0 31 Energy management part time 64 11 22 352 Energy manager, but authority
unclear 36 33 22 31
3 Energy manager accountable tocommittee
0 11 44 17
4 Energy manager integrated intomanagement structure
0 33 11 14
Weighted average score 1.36 2.42 2.42 2.04

45
Table 3.12 Self assessment matrix: Communication (percentage of valid replies)
Score Description Small Medium Large Total0 No contact with users 9 11 11 101 Informal contacts 82 44 33 552 Contact through ad hoc
committee 9 0 11 7
3 Energy committee & directcontact with major users
0 33 22 17
4 Full exploitation of formal &informal channels ofcommunication
0 11 22 10
Weighted average score 1.00 1.87 2.09 1.6
Table 3.13 Self assessment matrix: Information (percentage of valid replies)
Score Description Small Medium Large Total0 No information system 9 11 0 71 Cost reporting based on invoice
data 18 11 11 14
2 M&T reports based on supplymeter data
55 44 33 45
3 M&T reports based on sub-meter data
18 22 33 24
4 Comprehensive system, setstargets, monitors consumption,identifies faults etc.
0 11 22 10
Weighted average score 1.82 2.09 2.64 2.16
Table 3.14 Self assessment matrix: Awareness (% of valid replies)
Score Description Small Medium Large Total0 No promotion of energy
efficiency 9 0 11 7
1 Informal contacts used 73 22 33 452 Some ad hoc staff awareness
training 9 56 33 31
3 Program of staff awareness ®ular publicity campaigns
9 22 22 17
4 Marketing the value of energyefficiency both within & outsidethe organisation
0 0 0 0
Weighted average score 1.18 2 1.65 1.58

46
Table 3.15 Self assessment matrix: Investment (% of valid replies)
Score Description Small Medium Large Total0 No investment 0 11 0 31 Only low cost measures taken 27 11 33 242 Short term payback criteria 36 56 44 453 Same payback criteria as all
other investment 36 0 22 21
4 Positive discrimination infavour of green schemes
0 22 0 7
Total 100 100 100 100Weighted average score 2.07 2.11 1.87 2.05
3.6 INVESTMENT IN ENERGY EFFICIENCY
Survey participants were asked what investment criteria they used for energy efficiency. Only50% gave a numerical response to this question. These reported a mean payback of 4.1 years(mode = 5 years). Three of the remainder reported using either simple payback or DCFdepending on the nature of the investment. Two reported using simple payback, withoutstating the value, while the rest gave no reply.
Survey participants were also asked whether they had an annual budget for energy efficiencyinvestments (Table 3.16). Only 39% of institutions said they had, implying that, in theremainder, efficiency improvements were funded under other budgets such as new build,refurbishment or routine maintenance. Of those with a budget, the average ratio of this to theannual energy bill was 8%, which compares favourably with the EEO recommendation of10%. However, this varied widely from 1% to 19%.
Some 27% of institutions (and 50% of large institutions) stated that they reinvested energycost savings in future projects. The difficulty here is that energy savings from efficiencyimprovements may be outweighed by other changes, such as increasing electrical loads fromPCs and other equipment, and thereby be hard to isolate. The only unambiguous measure isthe annual bill, but this is influenced by a multitude of factors.
Participants were asked how much they agreed with the statement that ‘a wide range ofenergy efficiency measures could be implemented that would yield paybacks of <4 years atcurrent energy prices’. A four year payback is likely to compare very favourably with theuniversities’ cost of capital1. The results (Table 3.17) show that 79% of institutions eitheragree or strongly agree with this statement, with 14% neutral and only 7% disagreeing. Thepotential for energy efficiency improvement is therefore widely acknowledged.
1 For example, it gives a 20% internal rate of return for an investment with a 10 year lifetime.

47
Table 3.16 Energy efficiency investment (% of valid replies)
Category Small Medium Large TotalUse of annual budget for efficiencyinvestment (% of sample)
30 44 44 39
Energy cost savings reinvested to fundfuture projects (% of sample)
22 11 50 27
Table 3.17 Lots of opportunities at <4 years payback? (% of valid replies)
Category Small Medium Large TotalStrongly agree 36 22 56 38Agree 36 68 22 41Neutral 9 11 22 14Disagree 18 0 0 7Strongly disagree 0 0 0 0Don’t know 0 0 0 0Total 100 100 100 100
3.7 INFORMATION ON ENERGY EFFICIENCY
Table 3.18 summarises the respondents’ evaluations of the usefulness of various sources ofinformation on energy efficiency. A notable feature of the results is that the DETR BestPractice Program is considered the most useful source, with 20% of respondents consideringit excellent, 53% rating it as good, and none rating it as poor. Also rated highly were contactsin other universities and energy manager networks, where 59% and 65% respectivelyconsidered these contacts to be good or excellent sources of information. This demonstratesthe value of personal contacts with individuals in similar situations. Such contacts have beenfacilitated through the DETR sponsored Higher Education Energy Share Fair network, whichcombines an email list with regular workshops. Here, university energy managers can use asystem of offers and requests to share problems and experiences with colleagues in otheruniversities.
Scoring good to average in the evaluations were equipment suppliers, technical journals andtechnical seminars. Colleagues within the university were most commonly rated average orpoor, suggesting that technical expertise is concentrated in one or two individuals. Thesource considered least useful was the energy supply industry.

48
Table 3.18 Sources of information on energy efficiency (% of valid replies)
Information source Excellent Good Avg. Poor Don’tuse
Weightedscore
DETR Best Practice Program 20 53 27 0 0 1.93
Energy manager networks 16 48 23 7 7 1.68
Contacts in other universities 16 44 28 9 3 1.63
Technical conferences/seminars 0 45 52 0 3 1.42
Professional/technical journals 0 45 45 10 0 1.36
Equipment suppliers 0 26 65 10 0 1.16
Professional associations 7 26 42 23 3 1.13
Energy supply industry 0 19 55 23 3 0.94
Colleagues within the university 7 4 32 19 3 0.59Note: Weights are: excellent=3; good=2; average=1
3.8 CONTRACT ENERGY MANAGEMENT
Only five institutions (14% of respondents) used some form of contract energy management(CEM). This result supports the interview findings that CEM, or energy services contracting,is not widespread in the sector and is treated with considerable suspicion by many Estatesstaff. The reported CEM contracts included:
• heat and electricity supply to halls of residence;• running of the boiler house;• provision of electrical and steam services to the university campus from a CHP facility
shared with major teaching hospital; and• monitoring, targeting and staff training.
One institution reported that the boilerhouse CEM contract had not been reviewed asimportant investment opportunities had been missed.
Table 3.19 Use of contract energy management (% of valid replies)
Category Small Medium Large TotalUse some form of CEM 9 11 22 14
3.9 TECHNOLOGY ADOPTION
Participants were asked to rate the extent to which they had adopted a range of energyefficient technologies, using a scale from 1 (not adopted) to 5 (extensively adopted). Thisallowed a quantitative score to be assigned for each technology. Around six technologieswere listed for each of the following categories: space heating; lighting; plantroom; buildingfabric, and electrical. The selected technologies were based on the list developed in section2.0 and included those most commonly mentioned in DETR Best Practice Program literature.

49
The overall average score in each category is summarised in Table 3.20. The overall averagewas 3.1 and there was remarkably little difference between small and large institutions. Withthe technologies selected, efficiency options for space heating were the most commonlyadopted and those for electrical equipment the least.
Table 3.20 Overall technology implementation (average score)
Technology Small Medium Large TotalSpace heating 3.47 3.43 3.45 3.46Lighting 2.96 3.47 3.24 3.21Plantroom 2.88 3.17 3.13 3.04Building fabric 3.25 2.82 2.87 2.99Electrical 2.36 2.79 2.93 2.68Overall mean score 2.98 3.14 3.12 3.08Note: 1 (not implemented) to 5 (extensively implemented)
Table 3.21 summarises the results for technology implementation, showing: a) the percentageof sites that had extensively implemented the technology; b) the percentage that had notimplemented; and c) the overall average score. The technologies are listed in descendingorder of score within each technology subcategory. This table provides a useful picture of theextent of take-up of common energy efficient technologies within one third of UKuniversities. Tables 3.22 to 3.24 give a more detailed breakdown by size of institution Thefollowing observations may be made:
• The technology with the widest reported take up is building energy management systems(BEMS), with over half of institutions reporting that they has extensively implementedthis. BEMS are largely confined to heating, ventilation and air conditioning (HVAC), asevidenced by the fact that the integration of lighting controls into BEMS was the lowestscoring technology.
• Technologies that all institutions had implemented to some extent included programmingof heating and ventilation controls; use of high frequency electronic ballasts; use of boilersequencing controls; and insulation of pipes, valves and flanges.
• Additional technologies that all but one institution had implemented to some extentincluded compact fluorescents and 28mm fluorescents.
• Technologies with relatively limited take-up (scoring 2.5 or less) included condensingboilers, CHP, draught proofing, high efficiency office equipment and high efficiencycatering equipment.
• Technologies where large institutions performed significantly better than small (adifference of 0.7 or more) included BEMS, replacement of oversized boiler plant, CHP,power factor correction and specification of high efficiency office equipment. Of these, thelargest difference in score was for CHP, at 1.7.
• Small institutions were proportionally more likely to have not implemented energyefficient technologies. On average, the technologies listed had not been implemented by19% of small institutions compared to 6% of large. Technologies that were poorlyrepresented in small institutions include all those listed above plus variable speed drives(VSDs). CHP had only been adopted by two small institutions compared to two thirds ofthe large.

50
• Small institutions were also proportionately more likely to have extensively implementedenergy efficient technologies, although the difference is not statistically significant. Onaverage, the technologies listed had been extensively implemented by 16% of smallinstitutions compared to 10% of large. Technologies that scored high in this respectincluded restricting use of portable heaters, fitting door closers to external doors andretrofitting double glazing.
As elsewhere, the limitations of self assessment and the small sample size must be borne inmind when interpreting these results.

51
Table 3.21 Summary of technology implementation
Area Technology/technique %extensively
implemented
% notimplemente
d
Averagescore
Spaceheating
Use of Building Energy ManagementSystem?
52 3 4.2
Programming heating and ventilationcontrols to match occupancy patternsand/or temperature?
38 0 4.1
Ensuring thermostats and temperaturesensors are located in the correctplace?
7 3 3.4
Installation of thermostatic radiatorvalves?
7 6 3.3
Improvements to the zoning ofheating areas?
10 14 3.0
Restricting use of portable electricheaters?
14 17 2.7
Lighting Use of compact fluorescents? 38 3 4.1
Replacement of 38mm fluorescentswith 26mm?
17 3 3.7
Use of high frequency electronicballasts?
17 0 3.5
Use of photocell, acoustic ormovement sensors?
14 10 3.0
Lighting controls integrated intoBuilding Energy ManagementSystem?
0 48 1.8
Plantroom Use of boiler sequencing controls? 38 0 4.2
Insulation of pipes, valves andflanges?
34 0 4.0
Replacement of oversized boilerplant?
14 24 2.8
Replacement of central generation ofhot water with point of useapplications?
4 17 2.6
Installation of condensing boilers? 10 31 2.5Installation of CHP? 17 55 2.2
Buildingfabric
Fitting door closers to external doors? 21 7 3.3
Specification of insulation standardsin new buildings that exceed thebuilding regulations?
17 21 3.2
Installation of secondary or doubleglazing on refurbishment?
21 10 3.2
Retrofitting insulation to walls androofs?
4 17 2.7

52
Draught proofing of windows anddoors?
0 14 2.6

53
Electrical Power factor correction 21 10 3.38Use of variable speed drives (VSD) inpumps, fans and other applications
7 14 2.90
Automatic switch off of fans &pumps when the equipment they serveis not in use
4 10 2.79
Specification of high efficiencymotors on motor replacement
7 7 2.74
Specification of high efficiency officeequipment (e.g. power down facilitieson computers)?
4 10 2.54
Specification of high efficiencycatering equipment?
4 17 2.42

54
Table 3.22 Adoption of technologies by size of institution (average score)
Technology/technique Small Medium Large TotalRestricting use of portable electric heaters? 2.73 2.67 2.78 2.72Ensuring thermostats and temperature sensorsare located in the correct place?
3.45 3.78 3.00 3.41
Installation of thermostatic radiator valves? 3.91 2.38 3.44 3.32Programming heating and ventilation controls tomatch occupancy patterns and/or temperature?
4.0 4.33 4.00 4.10
Improvements to the zoning of heating areas? 2.91 3.11 2.89 2.97Use of Building Energy Management System? 3.82 4.33 4.56 4.21Replacement of 38mm fluorescents with26mm?
3.45 4.00 3.56 3.66
Use of high frequency electronic ballasts? 3.36 3.78 3.44 3.52Use of compact fluorescents? 3.73 4.33 4.33 4.10Use of photocell, acoustic or movementsensors?
2.73 3.33 3.00 3.00
Lighting controls integrated into BuildingEnergy Management System?
1.55 1.89 1.89 1.76
Insulation of pipes, valves and flanges? 4.00 4.00 3.89 3.97Use of boiler sequencing controls? 4.30 4.22 4.00 4.18Replacement of oversized boiler plant? 2.27 3.33 3.00 2.82Installation of condensing boilers? 2.70 2.44 2.22 2.46Replacement of central generation of hot waterwith point of use applications?
2.73 2.33 2.67 2.59
Installation of CHP? 1.27 2.67 3.00 2.24Draught proofing of windows and doors? 2.64 2.22 2.78 2.55Fitting door closers to external doors? 3.82 3.11 3.00 3.34Retrofitting insulation to walls and roofs? 2.73 2.44 2.78 2.66Installation of secondary or double glazing onrefurbishment?
3.45 3.33 2.78 3.21
Specification of insulation standards in newbuildings that exceed the building regulations?
3.60 3.00 3.00 3.21
Power factor correction 2.91 3.33 4.00 3.38Specification of high efficiency officeequipment?
2.00 2.56 3.11 2.54
Specification of high efficiency cateringequipment?
2.11 2.50 2.67 2.42
Specification of high efficiency motors onmotor replacement
2.67 2.78 2.78 2.74
Use of variable speed drives (VSD) in pumps,fans and other applications
2.55 3.11 3.11 2.90
Automatic switch off of fans & pumps 2.45 3.00 3.00 2.79

55
Table 3.23 Proportion of sites not implementing technology (% valid replies)
Technology/technique Small Medium Large TotalRestricting use of portable electric heaters? 27 22 0 17Improvements to the zoning of heating areas? 27 11 0 14Installation of thermostatic radiator valves? 0 22 0 6Ensuring thermostats and temperature sensorsare located in the correct place?
0 0 11 3
Use of Building Energy Management System? 9 0 0 3Programming heating and ventilation controls tomatch occupancy patterns and/or temperature?
0 0 0 0
Lighting controls integrated into BuildingEnergy Management System?
55 44 44 48
Use of photocell, acoustic or movementsensors?
18 11 0 10
Replacement of 38mm fluorescents with26mm?
9 0 0 3
Use of compact fluorescents? 9 0 0 3Use of high frequency electronic ballasts? 0 0 0 0Installation of CHP? 82 44 33 55Installation of condensing boilers? 27 44 22 31Replacement of oversized boiler plant? 45 11 11 24Replacement of central generation of hot waterwith point of use applications?
27 11 11 17
Insulation of pipes, valves and flanges? 0 0 0 0Use of boiler sequencing controls? 0 0 0 0Specification of insulation standards in newbuildings that exceed the building regulations?
18 33 11 21
Retrofitting insulation to walls and roofs? 18 22 11 17Draught proofing of windows and doors? 18 22 0 14Installation of secondary or double glazing onrefurbishment?
9 11 11 10
Fitting door closers to external doors? 9 11 0 7Specification of high efficiency cateringequipment?
27 11 11 17
Use of variable speed drives (VSD) in pumps,fans and other applications
36 0 0 14
Power factor correction 18 11 0 10Specification of high efficiency officeequipment?
18 11 0 10
Automatic switch off of fans & pumps 27 0 0 10Specification of high efficiency motors onmotor replacement
9 11 0 7
Average 19.4 13.0 6.3 13.3

56
Table 3.24 Proportion of sites extensively implementing technologies (% valid replies)
Technology/technique Small Medium Large TotalUse of Building Energy Management System? 45 44 67 52Programming heating and ventilation controls tomatch occupancy patterns and/or temperature?
36 56 22 38
Restricting use of portable electric heaters? 27 11 0 14Improvements to the zoning of heating areas? 18 11 0 10Ensuring thermostats and temperature sensorsare located in the correct place?
9 11 0 7
Installation of thermostatic radiator valves? 18 0 0 7Use of compact fluorescents? 18 56 44 38Replacement of 38mm fluorescents with26mm?
9 44 0 17
Use of high frequency electronic ballasts? 9 33 11 17Use of photocell, acoustic or movementsensors?
9 33 0 14
Lighting controls integrated into BuildingEnergy Management System?
0 0 0 0
Use of boiler sequencing controls? 36 44 33 38Insulation of pipes, valves and flanges? 36 44 22 34Installation of CHP? 0 22 33 17Replacement of oversized boiler plant? 9 33 0 14Installation of condensing boilers? 18 11 0 10Replacement of central generation of hot waterwith point of use applications?
9 0 0 4
Fitting door closers to external doors? 36 22 0 21Installation of secondary or double glazing onrefurbishment?
36 22 0 21
Specification of insulation standards in newbuildings that exceed the building regulations?
27 11 11 17
Retrofitting insulation to walls and roofs? 9 0 0 4Draught proofing of windows and doors? 0 0 0 0Power factor correction 18 11 33 21Specification of high efficiency motors onmotor replacement
0 11 11 7
Use of variable speed drives (VSD) in pumps,fans and other applications
9 11 0 7
Specification of high efficiency officeequipment?
0 11 0 4
Specification of high efficiency cateringequipment?
0 11 0 4
Automatic switch off of fans & pumps 21 11 0 4Average 16.5 20.5 10.3 15.8

57
3.10 STATISTICAL TESTS
The score for technology adoption can be considered a measure of energy efficiencyperformance and hence a dependent variable. Factors such as the existence of an energypolicy can be considered independent variables. Statistical tests can then the conducted todetermine whether there is any relationship between the two. Table 3.25 summarises totalscores and t-test results for a number of such tests. In all cases, the observed scores are verysimilar and in some cases the difference is in the opposite direction to that predicted (e.g.institutions with an environmental policy score lower on technology adoption than thosewithout). In no cases is the difference in the observed scores statistically significant. Thissuggests small or, in some cases, non-existent effects, but the results are also affected by thesmall sample size. A wide range of factors, such as the technical scope for retrofits, may actto offset and swamp any observed relationship.
Table 3.25 Statistical tests
Independent variable Overallscore for
No
Overallscore for
Yes
t Sig
Presence of full time energy manager? 85.11 84.87 0.047 0.963Presence of energy committee? 83.05 87.92 11.001 0.325Existence of energy policy 81.50 85.73 -0.715 0.480Existence of environmental policy 87.62 83.11 0.966 0.342Use of energy audits 85.00 85.44 -0.092 0.927Charging departments for energy use 83.26 90.88 -1.444 0.159Use of M&T system 84.42 85.25 -0.173 0.864Using benchmarks for major buildings 84.58 84.90 -0.063 0.950Annual budget for efficiencyinvestment
85.61 85.16 0.096 0.924
Tests were also made to determine whether there was any correlation between technologyadoption and:
• the size of institution (measured by annual energy costs);• the performance self assessment score; and• the extent of integration of energy policy into other areas.
A small positive correlation was found in the first two tests, but in neither case was itstatistically significant (R2 of 0.07 and 0.02). No relationship was found in the third test.
3.11 BARRIERS TO ENERGY EFFICIENCY
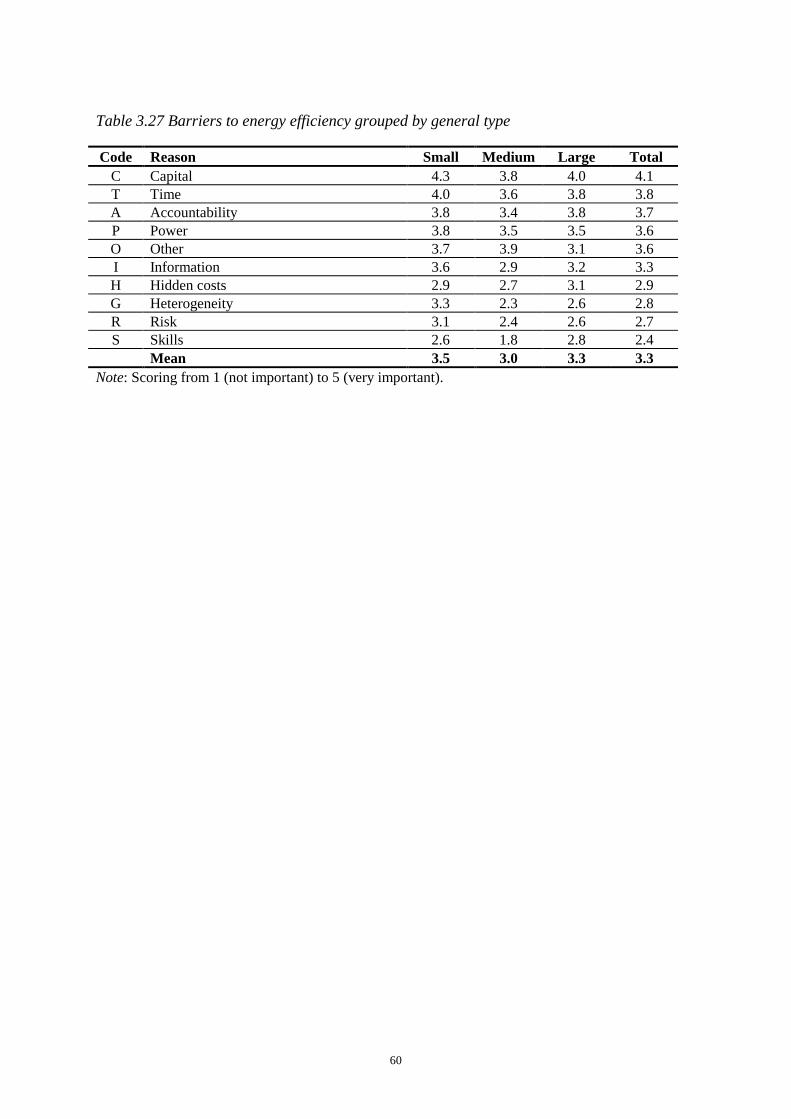
Participants were asked to rate the importance of various barriers to energy efficiency using ascale from 1 (not important) to 5 (very important). The suggested barriers were deriveddirectly from the analysis in Sorrell (1998b). The average scores for each suggested barrierare summarised in Table 3.26. In addition, each suggested barrier can be assigned to a moregeneral category, such as risk or information, based on the discussion in Sorrell (1998b). Theaverage scores for these general categories are summarised in Table 3.27, while the codes

58
cross reference the two tables. In both cases, the results are organised in descending order ofperceived importance. The following observations may be made:
• The overall mean score was 3.3, with the average for all sites ranging from 2.4 to 4.3.Hence the majority of the suggested barriers were considered of at least averageimportance and several were considered very important. Very few respondents rated any ofthe barriers as not important.
• Problems related to capital availability were clearly considered the most important obstacleto energy efficiency investment. Top of the list was other priorities for capital investment(4.3), followed by strict adherence to capital budgets (4.0) and general lack of capital (3.9).
• Lack of time was the next most commonly reported obstacle, with an overall score of 3.8.This was closely followed by departments being unaccountable for energy costs, with ascore of 3.7.
• The factor considered least important was lack of technical skills by university staff, whichhad an overall score of 2.4. It is likely, however, that individuals would be reluctant toadmit that they had insufficient skills.
• Barriers related to risk were also rated relatively low. Business and market uncertainty hadan overall score of 2.6, while technical risk scored 2.8. Again, the Energy manager maynot be the best placed individual to judge the former, and the consequences of businessuncertainty may be manifest largely in the strict payback criteria required by financialstaff.2
• Barriers related to heterogeneity (e.g. technology inappropriate) and hidden costs (e.g.hassle, inconvenience) were considered relatively unimportant, scoring less than average at2.8 and 2.9 respectively. However, salary overheads may be considered a form of hiddencost.
• Perceptions of the importance of barriers were marginally higher for smaller sites than forlarge sites, with overall scores of 3.5 and 3.2 respectively. Areas where this difference wasparticularly important include i) capital availability ii) energy manager lacks influence; andiii) level of awareness.
The results are referred to again in the discussion on barriers in section 6.0.
2 As noted in Sorrell (1998), strict payback criteria may also result from other factors.

59
Table 3.26 Barriers to energy efficiency (average scores)
Code Reason Small Medium
Large Total
C Other priorities for capital investment 4.5 4.3 4.0 4.3C Strict adherence to capital budgets 4.5 3.5 3.9 4.0C Lack of capital 4.0 3.6 4.1 3.9T Lack of time/other priorities 4.0 3.6 3.8 3.8A Departments not accountable for energy
costs3.8 3.4 3.8 3.7
O Low priority given to energy management 3.8 3.9 3.3 3.7P Conflicts of interest within the
organisation3.6 3.4 3.9 3.6
O Energy objectives not integrated intooperating, maintenance or purchasingprocedures
3.8 4.0 2.8 3.5
O Low priority given to environmentalperformance
3.6 3.9 3.2 3.5
P Energy manager lacks influence 3.9 3.6 3.0 3.5I Lack of staff awareness 4.0 3.3 2.9 3.4H Cost of disruptions /hassle /inconvenience 3.1 3.0 3.3 3.2H Poor technology performance (e.g.
unreliable)3.5 2.9 3.1 3.2
I Lack of information/poor qualityinformation on energy efficiencyopportunities
3.4 2.4 3.2 3.0
G Technology inappropriate at this site 3.3 2.3 2.6 2.8H Cost of identifying opportunities,
analysing cost effectiveness and tendering2.8 2.3 3.2 2.8
H Cost of staff replacement, retirement,retraining
2.6 2.9 3.1 2.8
R Technical risk 3.2 2.4 2.6 2.8I Difficulty/cost of obtaining information
on the energy consumption of purchasedequipment
3.1 2.3 2.8 2.8
R Business/market uncertainty 3.0 2.3 2.6 2.6S Lack of technical skills 2.6 1.8 2.8 2.4
Mean score 3.5 3.1 3.2 3.3Note: Scoring from 1 (not important) to 5 (very important).
60
Table 3.27 Barriers to energy efficiency grouped by general type
Code Reason Small Medium Large TotalC Capital 4.3 3.8 4.0 4.1T Time 4.0 3.6 3.8 3.8A Accountability 3.8 3.4 3.8 3.7P Power 3.8 3.5 3.5 3.6O Other 3.7 3.9 3.1 3.6I Information 3.6 2.9 3.2 3.3H Hidden costs 2.9 2.7 3.1 2.9G Heterogeneity 3.3 2.3 2.6 2.8R Risk 3.1 2.4 2.6 2.7S Skills 2.6 1.8 2.8 2.4
Mean 3.5 3.0 3.3 3.3Note: Scoring from 1 (not important) to 5 (very important).