30 ted turner drive dri #2758 - atlanta regional commissiondocuments.atlantaregional.com/land...
TRANSCRIPT
Transportation Analysis
30 Ted Turner Drive DRI #2758
Atlanta, Georgia
Report Prepared:
December 2017
Prepared for:
Perkins + Will
CIM Atlanta Developer, LLC
Prepared by:
Kimley-Horn and Associates, Inc.817 West Peachtree Street, Suite 601Atlanta, Georgia 30308Project #015170030
30 Ted Turner Drive DRI #2758 - Transportation Analysis
015170030 December 2017i
TABLE OF CONTENTSExecutive Summary ............................................................................................................................... 1
1.0 Project Description ................................................................................................................. 4
1.1 Introduction ............................................................................................................................ 41.2 Site Plan Review .................................................................................................................... 81.3 Site Access ............................................................................................................................ 81.4 Bicycle and Pedestrian Facilities ............................................................................................ 81.5 Transit Facilities ..................................................................................................................... 8
2.0 Traffic Analyses, Methodology and Assumptions .................................................................... 9
2.1 Growth Rate ........................................................................................................................... 92.2 Traffic Data Collection ............................................................................................................ 92.3 Detailed Intersection Analysis .............................................................................................. 10
3.0 Study Network ..................................................................................................................... 11
3.1 Gross Trip Generation.......................................................................................................... 113.2 Trip Distribution .................................................................................................................... 113.3 Level-of-Service Standards .................................................................................................. 113.4 Study Network Determination............................................................................................... 113.5 Existing Roadway Facilities .................................................................................................. 14
4.0 Trip Generation .................................................................................................................... 14
5.0 Trip Distribution and Assignment .......................................................................................... 15
6.0 Traffic Analysis ..................................................................................................................... 22
6.1 Existing 2017 Conditions ...................................................................................................... 226.2 Projected 2027 No-Build Conditions..................................................................................... 246.3 Projected 2027 Build Conditions .......................................................................................... 266.4 Projected 2027 Build Conditions – Alternative Analysis........................................................ 34
7.0 Ingress/Egress Analysis ....................................................................................................... 38
8.0 Identification of Programmed Projects .................................................................................. 38
9.0 Internal Circulation Analysis ................................................................................................. 39
10.0 Compliance with Comprehensive Plan Analysis ................................................................... 39
11.0 Additional Considerations ..................................................................................................... 39

30 Ted Turner Drive DRI #2758 - Transportation Analysis
015170030 December 2017ii
LIST OF TABLES
Table 1 Proposed Land Uses and Densities..................................................................................... 4Table 2 Peak Hour Summary ......................................................................................................... 10Table 3 Gross Trip Generation ....................................................................................................... 11Table 4 Intersection Control Summary ........................................................................................... 12Table 5 Roadway Classification and ADTs ..................................................................................... 14Table 6 Net Trip Generation ........................................................................................................... 15Table 7 Existing 2017 Intersection Levels-of-Service ..................................................................... 22Table 8 Projected 2027 No-Build Intersection Levels-of-Service .................................................... 24Table 9 Projected 2027 Build Intersection Levels-of-Service (Study Intersections)......................... 26Table 10 Projected 2027 Build Intersection Levels-of-Service (Site Driveways) ............................... 27Table 11 Projected 2027 Build Improved Intersection Levels-of-Service (Study Intersections) ......... 32Table 12 Projected 2027 Build Alternative Intersection Levels-of-Service (Study Intersections) ....... 36Table 13 Programmed Projects ........................................................................................................ 38
LIST OF FIGURES
Figure 1 Site Location Map ......................................................................................................... 5Figure 2 Site Aerial ..................................................................................................................... 6Figure 3 Bird’s Eye View ............................................................................................................ 7Figure 4 Study Intersections ..................................................................................................... 13Figure 5A Residential Distribution and Assignment..................................................................... 16Figure 5B Residential Distribution and Assignment (Site Driveways) .......................................... 17Figure 5C Non-Residential Distribution and Assignment ............................................................. 18Figure 5D Non-Residential Distribution and Assignment (Site Driveways) .................................. 19Figure 6A Project Trips ............................................................................................................... 20Figure 6B Project Trips (Site Driveways) .................................................................................... 21Figure 7 Existing 2017 Traffic Conditions ................................................................................. 23Figure 8 Projected 2027 No-Build Traffic Conditions ................................................................ 25Figure 9A Projected 2027 Build Traffic Conditions ...................................................................... 28Figure 9B Projected 2027 Build Traffic Conditions (Site Driveways) ........................................... 29Figure 10 Projected 2027 Build Improved Traffic Conditions ...................................................... 33Figure 11 Projected 2027 Build Alternative Traffic Conditions .................................................... 37
LIST OF APPENDICES
Appendix A Land Use and Zoning MapsAppendix B Proposed Site PlanAppendix C Trip Generation AnalysisAppendix D Intersection Volume WorksheetsAppendix E Programmed Project Fact SheetsAppendix F MARTA and Renew Atlanta Memorandums
Available Upon Request
Raw Traffic Count DataSynchro Capacity Analyses

30 Ted Turner Drive DRI #2758 - Transportation Analysis
015170030 December 20171
EXECUTIVE SUMMARY
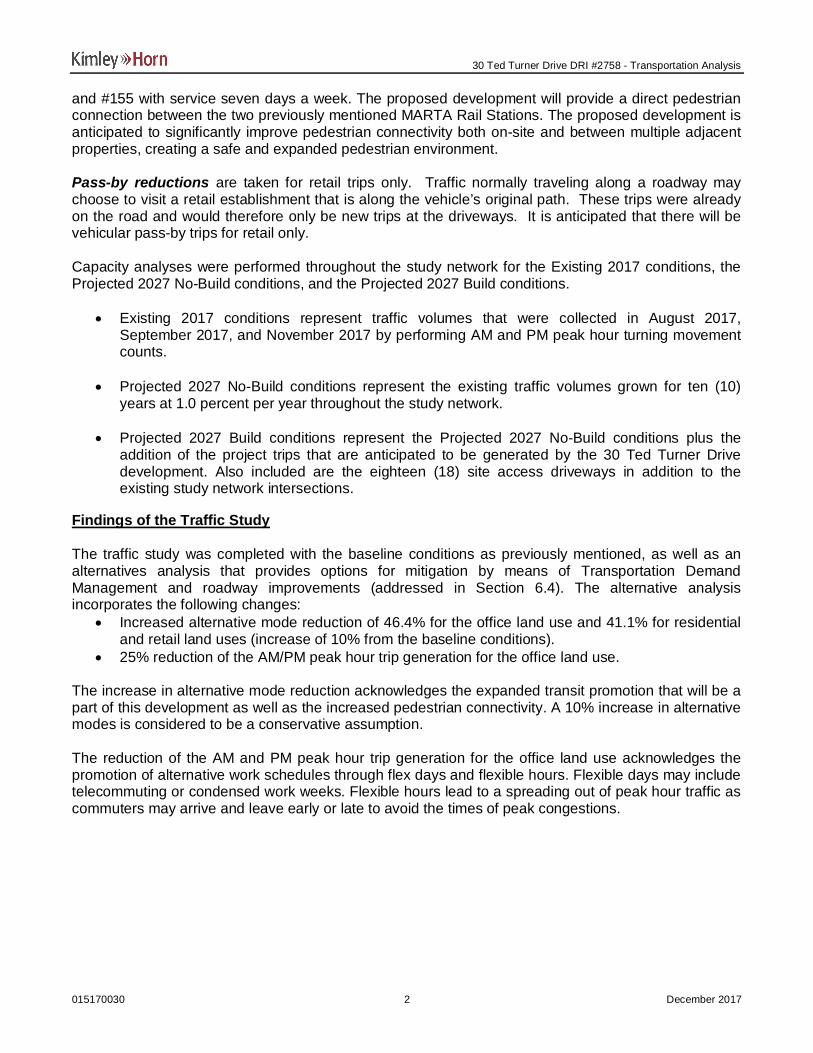
This report presents the analysis of the anticipated traffic impacts of the proposed 30 Ted Turner Driveconceptual unified development plan located in the City of Atlanta, Georgia. The approximate 27-acreproperty is bordered by Centennial Olympic Park Drive, Mitchell Street, Richard B. Russell Plaza,Martin Luther King Jr. Drive, Ted Turner Drive, and portions of Marietta Street and Forsyth Street. Theproperty proposes a development over structured parking to create a robust transit-orienteddevelopment adjacent to two MARTA stations: Five Points and Dome/GWCC/Philips Arena/CNNCenter. This development provides the opportunity to connect the Downtown core and provide directpedestrian connections between Philips Arena, Mercedes Benz Stadium, GWCC, CNN Center andCastleberry Hills with the Five Points MARTA station and downtown Atlanta. The project site currentlyconsists primarily of surface parking lots, the CNN Center deck, and freight rail right-of-way. The lack ofcurrent development and the limited connectivity of streets within the project site leads to poor vehicularand pedestrian connectivity.
The project is a Development of Regional Impact (DRI) and is subject to Georgia RegionalTransportation Authority (GRTA) and Atlanta Regional Commission (ARC) review due to the projectsize exceeding 600,000 SF of mixed-use development in a Regional Center area type, as determinedby the Atlanta Regional Commission’s Unified Growth Policy Map (UGPM). The DRI trigger for thisdevelopment was the submittal of the special administrative permit (SAP) with the City of Atlanta onNovember 20, 2017. The DRI was formally triggered with the filing of the Initial DRI Information (Form1) on November 29, 2017 by the City of Atlanta. The DRI Pre-Review/Methodology meeting occurredon August 28, 2017 with a follow-up meeting on October 3, 2017.
The proposed project is expected to be completed by 2027. The development will sit over structuredparking and provide the opportunity to create an elevated street grid that connects the surroundingareas. The project program will consist of the following land uses and densities:
Residential: 1,000 unitsHotel: 1,500 roomsOffice: 9,350,000 SFShopping Center: 1,000,000 SF
The DRI analysis includes an estimation of the overall trips projected to be generated by thedevelopment, also known as gross trips. Reductions to gross trips are also considered in the analysis,including mixed-use reductions, alternative transportation mode reductions, and pass-by trip reductions.
Mixed-use reductions occur when a site has a combination of different land uses that interact with oneanother. For example, people working in an office development or people living in the residentialdevelopment may walk to the retail and restaurants instead of driving off-site. This reduces the numberof vehicle trips that will be made on the roadway, thus reducing traffic congestion. These types ofinteractions are expected at the 30 Ted Turner Drive development.
Alternative mode reductions are taken when a site can be accessed by modes other than vehicles(walking, bicycling, transit, etc.). As the 30 Ted Turner Drive development is located in close proximityto transit with increased pedestrian facilities, a 31.1% alternative mode reduction was taken forresidential and retail land uses, and a 36.4% alternative mode reduction was taken for the office landuse. These reductions are consistent with GRTA’s Letter of Understanding (LOU) dated November 1,2017. The center of the project site is located less than 0.2 miles from the Dome/GWCC/PhilipsArena/CNN Center MARTA Rail Station, which is served by the Blue and Green lines. The center of theproject site is located approximately 0.25 miles from the Five Points MARTA Rail Station, which isserved by the Blue, Green, Red and Gold lines, MARTA Bus Route #3, #14, #32, #42, #49, #51, #74,
30 Ted Turner Drive DRI #2758 - Transportation Analysis
015170030 December 20172
and #155 with service seven days a week. The proposed development will provide a direct pedestrianconnection between the two previously mentioned MARTA Rail Stations. The proposed development isanticipated to significantly improve pedestrian connectivity both on-site and between multiple adjacentproperties, creating a safe and expanded pedestrian environment.
Pass-by reductions are taken for retail trips only. Traffic normally traveling along a roadway maychoose to visit a retail establishment that is along the vehicle’s original path. These trips were alreadyon the road and would therefore only be new trips at the driveways. It is anticipated that there will bevehicular pass-by trips for retail only.
Capacity analyses were performed throughout the study network for the Existing 2017 conditions, theProjected 2027 No-Build conditions, and the Projected 2027 Build conditions.
· Existing 2017 conditions represent traffic volumes that were collected in August 2017,September 2017, and November 2017 by performing AM and PM peak hour turning movementcounts.
· Projected 2027 No-Build conditions represent the existing traffic volumes grown for ten (10)years at 1.0 percent per year throughout the study network.
· Projected 2027 Build conditions represent the Projected 2027 No-Build conditions plus theaddition of the project trips that are anticipated to be generated by the 30 Ted Turner Drivedevelopment. Also included are the eighteen (18) site access driveways in addition to theexisting study network intersections.
Findings of the Traffic Study
The traffic study was completed with the baseline conditions as previously mentioned, as well as analternatives analysis that provides options for mitigation by means of Transportation DemandManagement and roadway improvements (addressed in Section 6.4). The alternative analysisincorporates the following changes:
· Increased alternative mode reduction of 46.4% for the office land use and 41.1% for residentialand retail land uses (increase of 10% from the baseline conditions).
· 25% reduction of the AM/PM peak hour trip generation for the office land use.
The increase in alternative mode reduction acknowledges the expanded transit promotion that will be apart of this development as well as the increased pedestrian connectivity. A 10% increase in alternativemodes is considered to be a conservative assumption.
The reduction of the AM and PM peak hour trip generation for the office land use acknowledges thepromotion of alternative work schedules through flex days and flexible hours. Flexible days may includetelecommuting or condensed work weeks. Flexible hours lead to a spreading out of peak hour traffic ascommuters may arrive and leave early or late to avoid the times of peak congestions.

30 Ted Turner Drive DRI #2758 - Transportation Analysis
015170030 December 20173
Based on the analysis of Projected 2027 Build Alternative conditions (includes background trafficgrowth and includes the projected 30 Ted Turner Drive project traffic with the alternative methodologyas discussed above), the following geometric intersection improvements would be needed in order forall study intersections to operate at or above acceptable levels-of-service:
· Intersection #5: Ted Turner Drive at Martin Luther King Jr. Driveo Restripe south leg of intersection to include one (1) shared left-turn/through lane, two (2)
exclusive through lanes and one (1) southbound egress lane.o Restripe east leg of intersection to include one (1) westbound shared left-turn/through
lane, one (1) westbound exclusive through lane, and one (1) westbound exclusive right-turn lane.
· Intersection #9: Forsyth Street at Alabama Streeto Add protected/permissive phasing for the northbound left-turn movement.
· Intersection #11: Forsyth Street at Marietta Streeto Construct one (1) exclusive eastbound left-turn lane.
· Intersection #12: Ted Turner Drive at Peters Street / Trinity Avenueo Restripe east leg of intersection to include one (1) exclusive westbound left-turn lane,
one (1) westbound through lane, one (1) westbound channelized right-turn lane, and one(1) eastbound egress lane.
· Intersection #13: Ted Turner Drive at Mitchell Streeto Restripe the southbound approach to provide an exclusive left-turn lane and a shared
through/right-turn lane.
Additional Considerations
The DRI traffic study was performed with the assumption that the existing traffic signal infrastructurewould still be in place at the build-out of the 30 Ted Turner Drive development. It is anticipated thatintelligent transportation system improvements may be added to the traffic signal infrastructure in thevicinity of the development that would help mitigate future congestion. The City of Atlanta, under theleadership of the Renew Atlanta bond program, is implementing state of the art traffic managementcontrol to improve traffic operations during peak activity. While the advancements to traffic control wereinitially implemented in response to special events at Philips Arena, Mercedes Benz Stadium, and theGeorgia World Conference Center, peak hour travel will experience benefits as well. A memorandumfrom Renew Atlanta is included in Appendix F.

30 Ted Turner Drive DRI #2758 - Transportation Analysis
015170030 December 20174
1.0 PROJECT DESCRIPTION
1.1 IntroductionThis report presents the analysis of the anticipated traffic impacts of the proposed 30 Ted Turner Drivemixed-use development located in the City of Atlanta, Georgia. The approximate 27-acre site currentlyconsists of surface parking lots, the CNN Center deck, and other parking facilities.
The project will exceed 600,000 square feet of mixed-use development within a Region Center areatype and therefore, the proposed development is a Development of Regional Impact (DRI) and issubject to Atlanta Regional Commission (ARC) and Georgia Regional Transportation Authority (GRTA)review.
Figure 1 provides the location map of the 30 Ted Turner Drive development, Figure 2 provides a siteaerial showing the project site and surrounding area, and Figure 3 provides a zoomed-in bird’s eyeview of the project site. The City of Atlanta Zoning Ordinance Map and ARC’s Unified Growth PolicyMap (UGPM) are included in Appendix A.
The proposed project is expected to be completed by 2027, and this analysis considers the full build-out of the proposed site in 2027. A summary of the proposed land-uses and densities is provided belowin Table 1.
Table 1Proposed Land Uses and Densities
High-Rise Apartments 1,000 units
Hotel 1,500 rooms
Office 9,350,000 SF
Retail 1,000,000 SF
Figure1
LocationMap
N
30 Ted Turner Drive DRITransportation Analysis
ProjectSite

Figure2
Project Site
SiteAerial
30 Ted Turner Drive DRITransportation Analysis
N

Figure3
Project Site
Bird’s EyeView
N
30 Ted Turner Drive DRITransportation Analysis
30 Ted Turner Drive DRI #2758 - Transportation Analysis
015170030 December 20178
1.2 Site Plan ReviewThe project site currently consists of surface parking lots, the CNN Center deck, and other parkingfacilities. Per the City of Atlanta Zoning Ordinance Map, the majority of the project site is zoned SpecialPublic Interest (SPI) 1-Sub-area 1 with two parcels zoned Mixed residential and commercial (MRC-2-Cand MRC-3-C). Per ARC’s Unified Growth Policy Map (UGPM), the project site is located in a RegionalCenter area type. Additionally, the project site is within and adheres to the recommendations of themost recent Downtown Atlanta LCI (2009) program and is consistent with the Downtown AtlantaTransportation Plan.
A reference of the proposed site plan is provided in Appendix B. A full-sized site plan consistent withGRTA’s Site Plan Guidelines is also being submitted as part of the review package.
1.3 Site AccessThe site will be served by five (5) driveways along Centennial Olympic Park Drive (one of which will bealigned with Andrew Young International), four (4) driveways along Ted Turner Drive, two (2) drivewaysalong Forsyth Street (one of which is the Alabama Street access to the parking deck), four (4)driveways along Martin Luther King Jr. Drive, two (2) driveways along Mitchell Street, and one (1)driveway along Marietta Street. Proposed site driveways and parking deck entrances are shown on thesite plan.
The site driveways mentioned above provide access to all parking for the site and serve the internalelevated and grade level street network. A considerable portion of the existing parking facilities withinthe study network will be replaced as a part of this development, most significantly the CNN Centerparking deck. Parking will be replaced on-site in proposed parking decks. Parking decks will largely bebelow the elevated street level. The proposed parking will serve the proposed development as well asreplace a considerable portion of the current parking uses being displaced. As currently envisioned,approximately 8,000 spaces will be provided within the parking structures for the 30 Ted Turner Drivedevelopment. The intent is to provide minimal parking to promote use of alternative modes oftransportation, reducing the need for single occupancy vehicle use. The 30 Ted Turner Drivedevelopment is located in a Region Center area type and shared parking will be utilized on the projectsite where permitted.
The master plan is still in a very conceptual stage. As such, there is still potential for the number andlocation of driveways to change. The intent of this study is to present a conservative analysis of themajor driveways planned for the site. Additionally, minor driveways may be added to the site as theproject evolves.
1.4 Bicycle and Pedestrian FacilitiesThe project site is located in Downtown Atlanta, adjacent to Philips Arena, Mercedes Benz Stadium,GWCC, CNN Center and Castleberry Hills in an area with continuing increase in pedestrian andbicyclist facilities. Pedestrian facilities (sidewalks) currently exist along the project site frontage. Thedevelopment will provide pedestrian connectivity throughout the area, most notably a direct pedestrianconnection between the Dome/GWCC/Phillips Arena/CNN Center MARTA Rail Station and the FivePoints MARTA Rail Station at street level. The development will sit over structured parking and providethe opportunity to create an elevated street grid and an on-site pedestrian grid that connects thesurrounding areas.
1.5 Transit FacilitiesThe center of the project site is located less than 0.2 miles from the Dome/GWCC/Phillips Arena/CNNCenter MARTA Rail Station, which is served by the Blue and Green lines. The center of the project siteis located approximately 0.25 miles from the Five Points MARTA Rail Station, which is served by the

30 Ted Turner Drive DRI #2758 - Transportation Analysis
015170030 December 20179
Blue, Green, Red and Gold lines, MARTA Bus Route #3, #14, #32, #42, #49, #51, #74, and #155 withservice seven days a week. The proposed development will provide a pedestrian connection betweenthe two previously mentioned MARTA Rail Stations and enhanced pedestrian access directly from thesite to each MARTA station. The project site will have pedestrian facilities internal and along theperimeter and the proposed development is anticipated to significantly improve pedestrian connectivity,creating a safe and expanded pedestrian environment. The direct connections to both the Five PointsMARTA Rail Station and the Dome MARTA Rail Station provides the potential to create a robust transit-oriented mixed-use development by bringing a high level of density to the urban core.
2.0 TRAFFIC ANALYSES, METHODOLOGY AND ASSUMPTIONS
2.1 Growth RateBackground traffic is defined as expected traffic on the roadway network in future year(s) absent theconstruction and opening of the proposed project. Background traffic can include a base growth ratebased on historical count data as well as population growth data and estimates as well as tripsanticipated from nearby or adjacent other projects. Based on methodology outlined in the GRTA Letterof Understanding (LOU), a 1.0 percent per year for ten (10) years background traffic growth rate wasused for all roadways. This background growth rate was used to account for other development activityin the area.
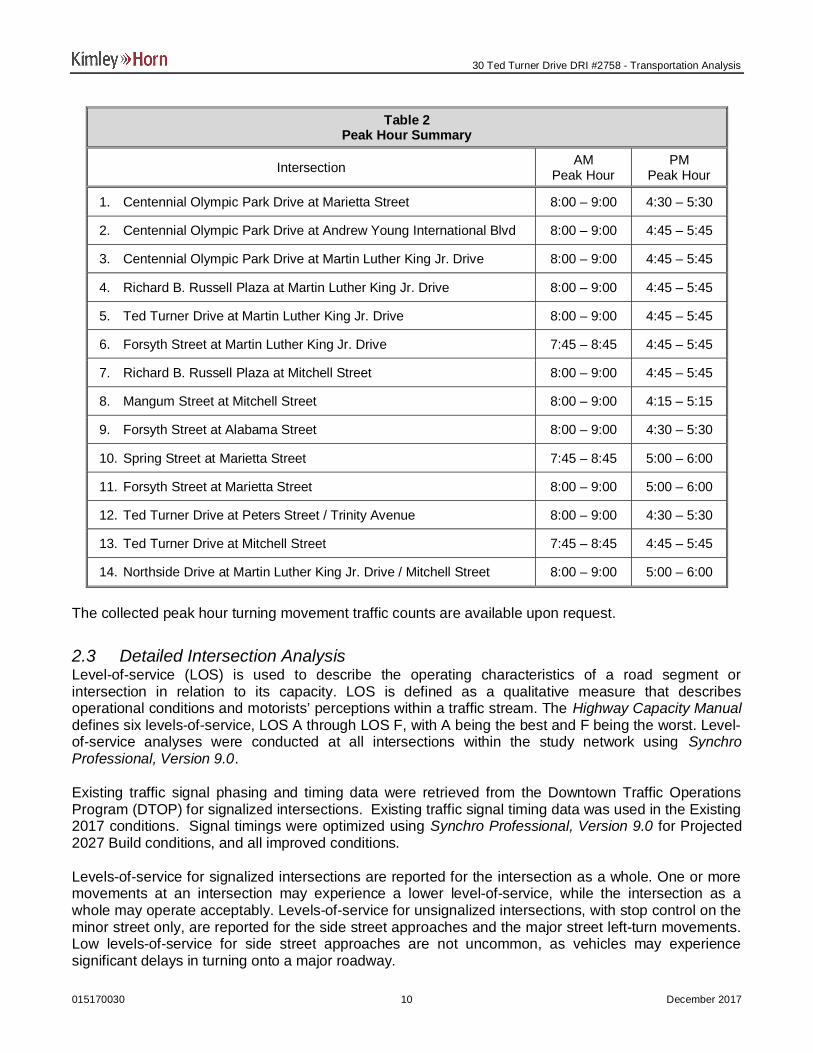
2.2 Traffic Data CollectionWeekday peak hour turning movement counts were collected on Tuesday, August 22, 2017,Wednesday, August 30, 2017, Tuesday, September 19, 2017, and Wednesday, November 1, 2017 atthe study intersections from 7:00 AM – 9:00 AM for the AM peak period and from 4:00 PM to 6:00 PMfor the PM peak period. The morning and afternoon peak hours varied slightly between theintersections. Peak hours for all intersections are shown in Table 2.
30 Ted Turner Drive DRI #2758 - Transportation Analysis
015170030 December 201710
Table 2Peak Hour Summary
Intersection AMPeak Hour
PMPeak Hour
1. Centennial Olympic Park Drive at Marietta Street 8:00 – 9:00 4:30 – 5:30
2. Centennial Olympic Park Drive at Andrew Young International Blvd 8:00 – 9:00 4:45 – 5:45
3. Centennial Olympic Park Drive at Martin Luther King Jr. Drive 8:00 – 9:00 4:45 – 5:45
4. Richard B. Russell Plaza at Martin Luther King Jr. Drive 8:00 – 9:00 4:45 – 5:45
5. Ted Turner Drive at Martin Luther King Jr. Drive 8:00 – 9:00 4:45 – 5:45
6. Forsyth Street at Martin Luther King Jr. Drive 7:45 – 8:45 4:45 – 5:45
7. Richard B. Russell Plaza at Mitchell Street 8:00 – 9:00 4:45 – 5:45
8. Mangum Street at Mitchell Street 8:00 – 9:00 4:15 – 5:15
9. Forsyth Street at Alabama Street 8:00 – 9:00 4:30 – 5:30
10. Spring Street at Marietta Street 7:45 – 8:45 5:00 – 6:00
11. Forsyth Street at Marietta Street 8:00 – 9:00 5:00 – 6:00
12. Ted Turner Drive at Peters Street / Trinity Avenue 8:00 – 9:00 4:30 – 5:30
13. Ted Turner Drive at Mitchell Street 7:45 – 8:45 4:45 – 5:45
14. Northside Drive at Martin Luther King Jr. Drive / Mitchell Street 8:00 – 9:00 5:00 – 6:00
The collected peak hour turning movement traffic counts are available upon request.
2.3 Detailed Intersection AnalysisLevel-of-service (LOS) is used to describe the operating characteristics of a road segment orintersection in relation to its capacity. LOS is defined as a qualitative measure that describesoperational conditions and motorists’ perceptions within a traffic stream. The Highway Capacity Manualdefines six levels-of-service, LOS A through LOS F, with A being the best and F being the worst. Level-of-service analyses were conducted at all intersections within the study network using SynchroProfessional, Version 9.0.
Existing traffic signal phasing and timing data were retrieved from the Downtown Traffic OperationsProgram (DTOP) for signalized intersections. Existing traffic signal timing data was used in the Existing2017 conditions. Signal timings were optimized using Synchro Professional, Version 9.0 for Projected2027 Build conditions, and all improved conditions.
Levels-of-service for signalized intersections are reported for the intersection as a whole. One or moremovements at an intersection may experience a lower level-of-service, while the intersection as awhole may operate acceptably. Levels-of-service for unsignalized intersections, with stop control on theminor street only, are reported for the side street approaches and the major street left-turn movements.Low levels-of-service for side street approaches are not uncommon, as vehicles may experiencesignificant delays in turning onto a major roadway.
30 Ted Turner Drive DRI #2758 - Transportation Analysis
015170030 December 201711
3.0 STUDY NETWORK
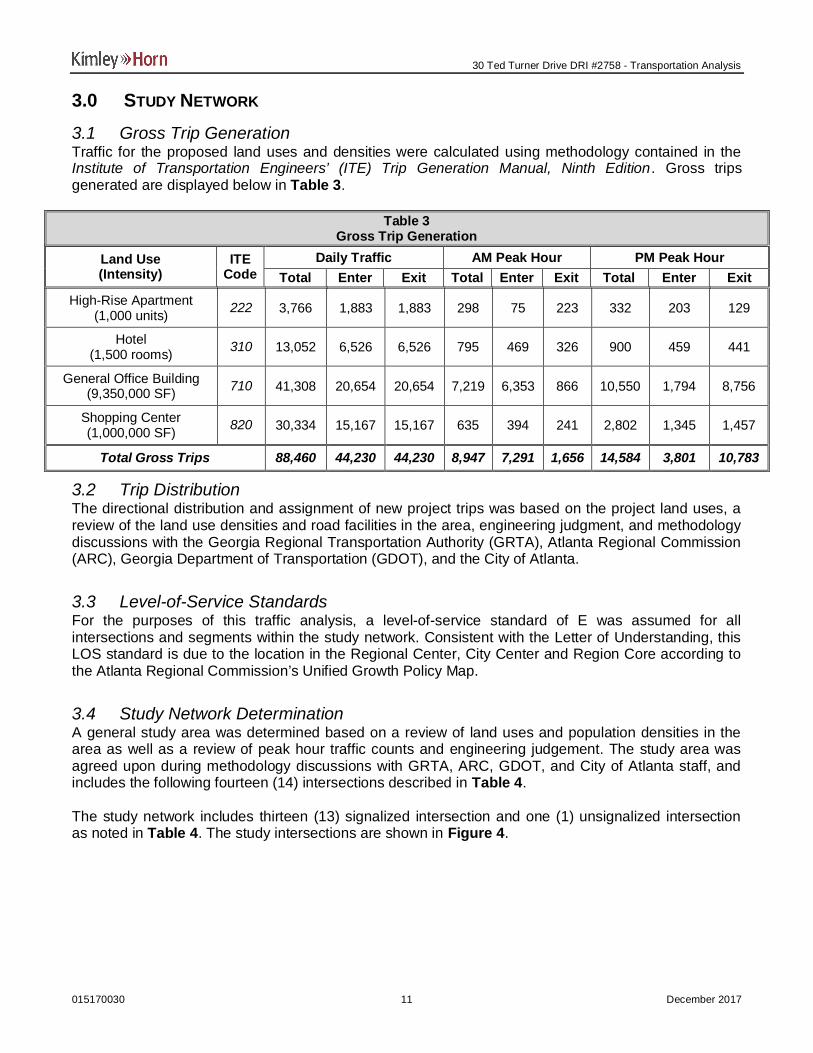
3.1 Gross Trip GenerationTraffic for the proposed land uses and densities were calculated using methodology contained in theInstitute of Transportation Engineers’ (ITE) Trip Generation Manual, Ninth Edition. Gross tripsgenerated are displayed below in Table 3.
Table 3Gross Trip Generation
Land Use(Intensity)
ITECode
Daily Traffic AM Peak Hour PM Peak HourTotal Enter Exit Total Enter Exit Total Enter Exit
High-Rise Apartment(1,000 units) 222 3,766 1,883 1,883 298 75 223 332 203 129
Hotel(1,500 rooms) 310 13,052 6,526 6,526 795 469 326 900 459 441
General Office Building(9,350,000 SF) 710 41,308 20,654 20,654 7,219 6,353 866 10,550 1,794 8,756
Shopping Center(1,000,000 SF) 820 30,334 15,167 15,167 635 394 241 2,802 1,345 1,457
Total Gross Trips 88,460 44,230 44,230 8,947 7,291 1,656 14,584 3,801 10,783
3.2 Trip DistributionThe directional distribution and assignment of new project trips was based on the project land uses, areview of the land use densities and road facilities in the area, engineering judgment, and methodologydiscussions with the Georgia Regional Transportation Authority (GRTA), Atlanta Regional Commission(ARC), Georgia Department of Transportation (GDOT), and the City of Atlanta.
3.3 Level-of-Service StandardsFor the purposes of this traffic analysis, a level-of-service standard of E was assumed for allintersections and segments within the study network. Consistent with the Letter of Understanding, thisLOS standard is due to the location in the Regional Center, City Center and Region Core according tothe Atlanta Regional Commission’s Unified Growth Policy Map.
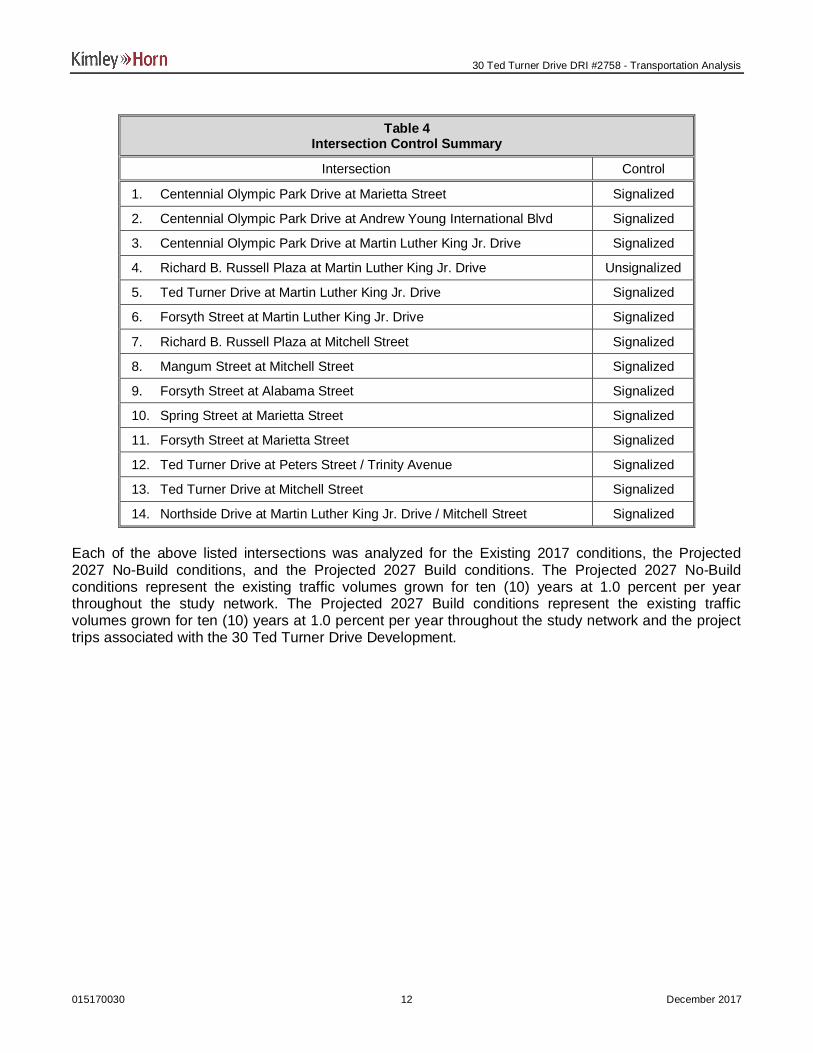
3.4 Study Network DeterminationA general study area was determined based on a review of land uses and population densities in thearea as well as a review of peak hour traffic counts and engineering judgement. The study area wasagreed upon during methodology discussions with GRTA, ARC, GDOT, and City of Atlanta staff, andincludes the following fourteen (14) intersections described in Table 4.
The study network includes thirteen (13) signalized intersection and one (1) unsignalized intersectionas noted in Table 4. The study intersections are shown in Figure 4.
30 Ted Turner Drive DRI #2758 - Transportation Analysis
015170030 December 201712
Table 4Intersection Control Summary
Intersection Control
1. Centennial Olympic Park Drive at Marietta Street Signalized
2. Centennial Olympic Park Drive at Andrew Young International Blvd Signalized
3. Centennial Olympic Park Drive at Martin Luther King Jr. Drive Signalized
4. Richard B. Russell Plaza at Martin Luther King Jr. Drive Unsignalized
5. Ted Turner Drive at Martin Luther King Jr. Drive Signalized
6. Forsyth Street at Martin Luther King Jr. Drive Signalized
7. Richard B. Russell Plaza at Mitchell Street Signalized
8. Mangum Street at Mitchell Street Signalized
9. Forsyth Street at Alabama Street Signalized
10. Spring Street at Marietta Street Signalized
11. Forsyth Street at Marietta Street Signalized
12. Ted Turner Drive at Peters Street / Trinity Avenue Signalized
13. Ted Turner Drive at Mitchell Street Signalized
14. Northside Drive at Martin Luther King Jr. Drive / Mitchell Street Signalized
Each of the above listed intersections was analyzed for the Existing 2017 conditions, the Projected2027 No-Build conditions, and the Projected 2027 Build conditions. The Projected 2027 No-Buildconditions represent the existing traffic volumes grown for ten (10) years at 1.0 percent per yearthroughout the study network. The Projected 2027 Build conditions represent the existing trafficvolumes grown for ten (10) years at 1.0 percent per year throughout the study network and the projecttrips associated with the 30 Ted Turner Drive Development.

Figure4
StudyIntersections
N
1
2
34
5
67
8 9
110
11
12
13
14
30 Ted Turner Drive DRITransportation Analysis
30 Ted Turner Drive DRI #2758 - Transportation Analysis
015170030 December 201714
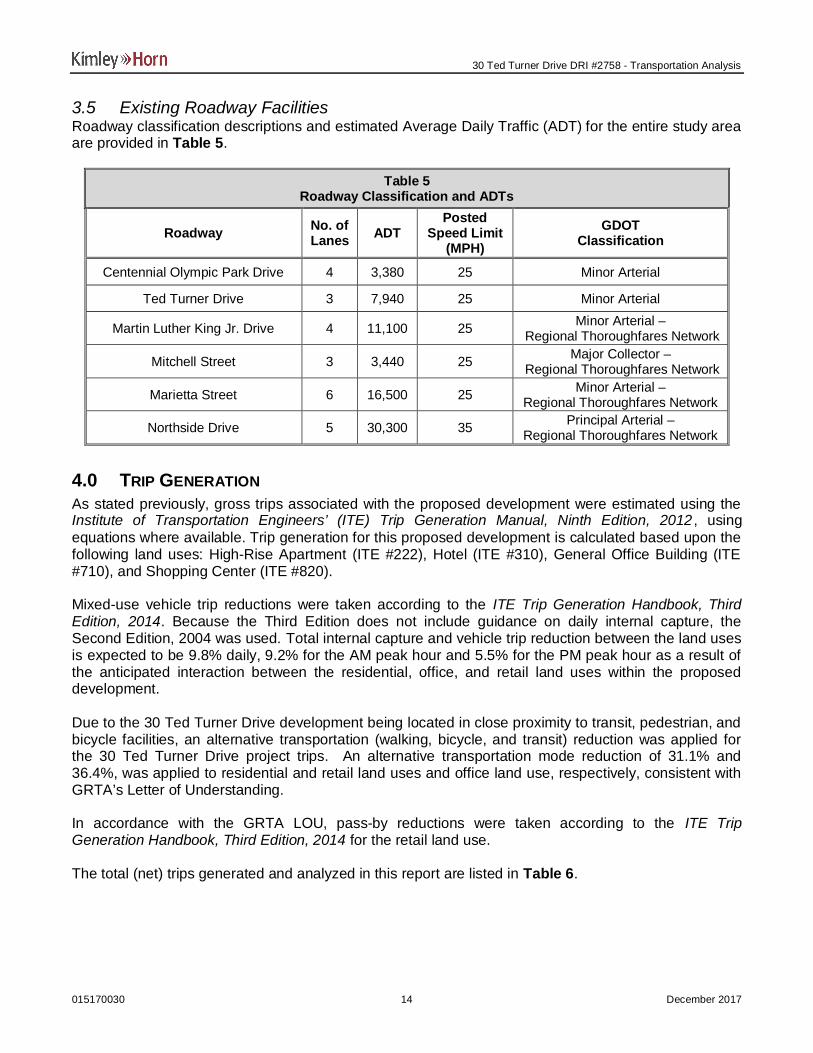
3.5 Existing Roadway FacilitiesRoadway classification descriptions and estimated Average Daily Traffic (ADT) for the entire study areaare provided in Table 5.
Table 5Roadway Classification and ADTs
Roadway No. ofLanes ADT
PostedSpeed Limit
(MPH)GDOT
Classification
Centennial Olympic Park Drive 4 3,380 25 Minor Arterial
Ted Turner Drive 3 7,940 25 Minor Arterial
Martin Luther King Jr. Drive 4 11,100 25 Minor Arterial – Regional Thoroughfares Network
Mitchell Street 3 3,440 25 Major Collector – Regional Thoroughfares Network
Marietta Street 6 16,500 25 Minor Arterial –Regional Thoroughfares Network
Northside Drive 5 30,300 35 Principal Arterial –Regional Thoroughfares Network
4.0 TRIP GENERATIONAs stated previously, gross trips associated with the proposed development were estimated using theInstitute of Transportation Engineers’ (ITE) Trip Generation Manual, Ninth Edition, 2012 , usingequations where available. Trip generation for this proposed development is calculated based upon thefollowing land uses: High-Rise Apartment (ITE #222), Hotel (ITE #310), General Office Building (ITE#710), and Shopping Center (ITE #820).
Mixed-use vehicle trip reductions were taken according to the ITE Trip Generation Handbook, ThirdEdition, 2014. Because the Third Edition does not include guidance on daily internal capture, theSecond Edition, 2004 was used. Total internal capture and vehicle trip reduction between the land usesis expected to be 9.8% daily, 9.2% for the AM peak hour and 5.5% for the PM peak hour as a result ofthe anticipated interaction between the residential, office, and retail land uses within the proposeddevelopment.
Due to the 30 Ted Turner Drive development being located in close proximity to transit, pedestrian, andbicycle facilities, an alternative transportation (walking, bicycle, and transit) reduction was applied forthe 30 Ted Turner Drive project trips. An alternative transportation mode reduction of 31.1% and36.4%, was applied to residential and retail land uses and office land use, respectively, consistent withGRTA’s Letter of Understanding.
In accordance with the GRTA LOU, pass-by reductions were taken according to the ITE TripGeneration Handbook, Third Edition, 2014 for the retail land use.
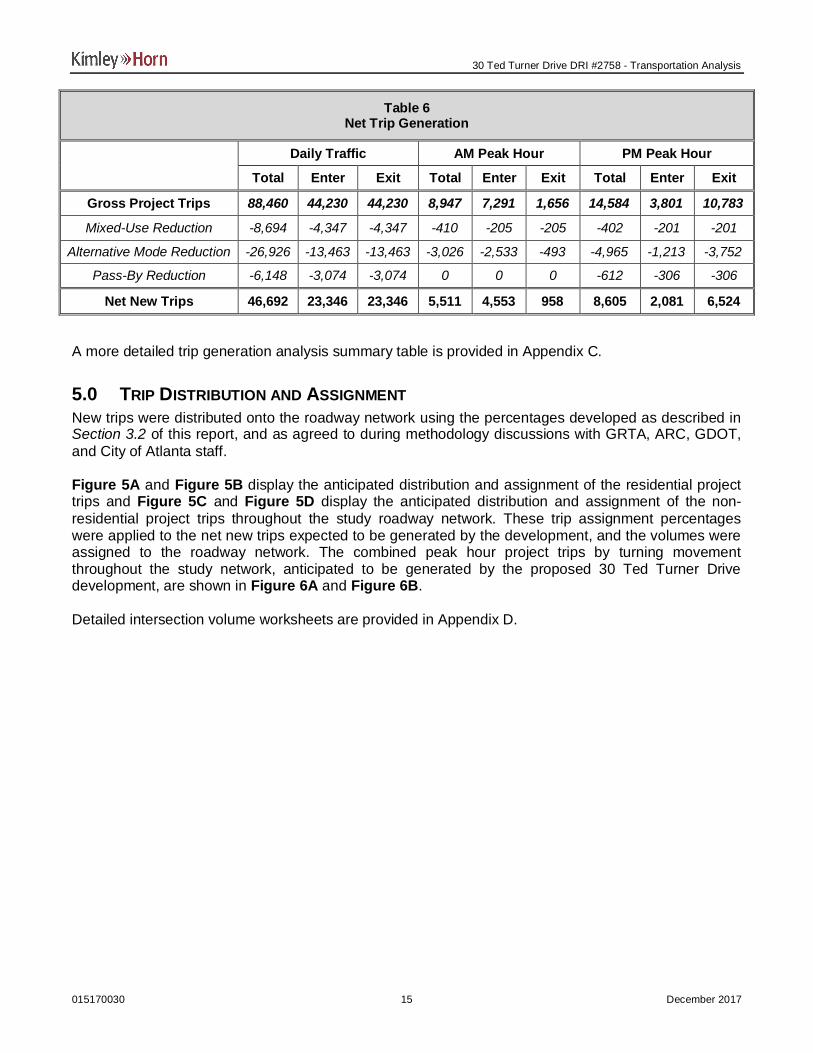
The total (net) trips generated and analyzed in this report are listed in Table 6.
30 Ted Turner Drive DRI #2758 - Transportation Analysis
015170030 December 201715
Table 6Net Trip Generation
Daily Traffic AM Peak Hour PM Peak Hour
Total Enter Exit Total Enter Exit Total Enter Exit
Gross Project Trips 88,460 44,230 44,230 8,947 7,291 1,656 14,584 3,801 10,783
Mixed-Use Reduction -8,694 -4,347 -4,347 -410 -205 -205 -402 -201 -201
Alternative Mode Reduction -26,926 -13,463 -13,463 -3,026 -2,533 -493 -4,965 -1,213 -3,752
Pass-By Reduction -6,148 -3,074 -3,074 0 0 0 -612 -306 -306
Net New Trips 46,692 23,346 23,346 5,511 4,553 958 8,605 2,081 6,524
A more detailed trip generation analysis summary table is provided in Appendix C.
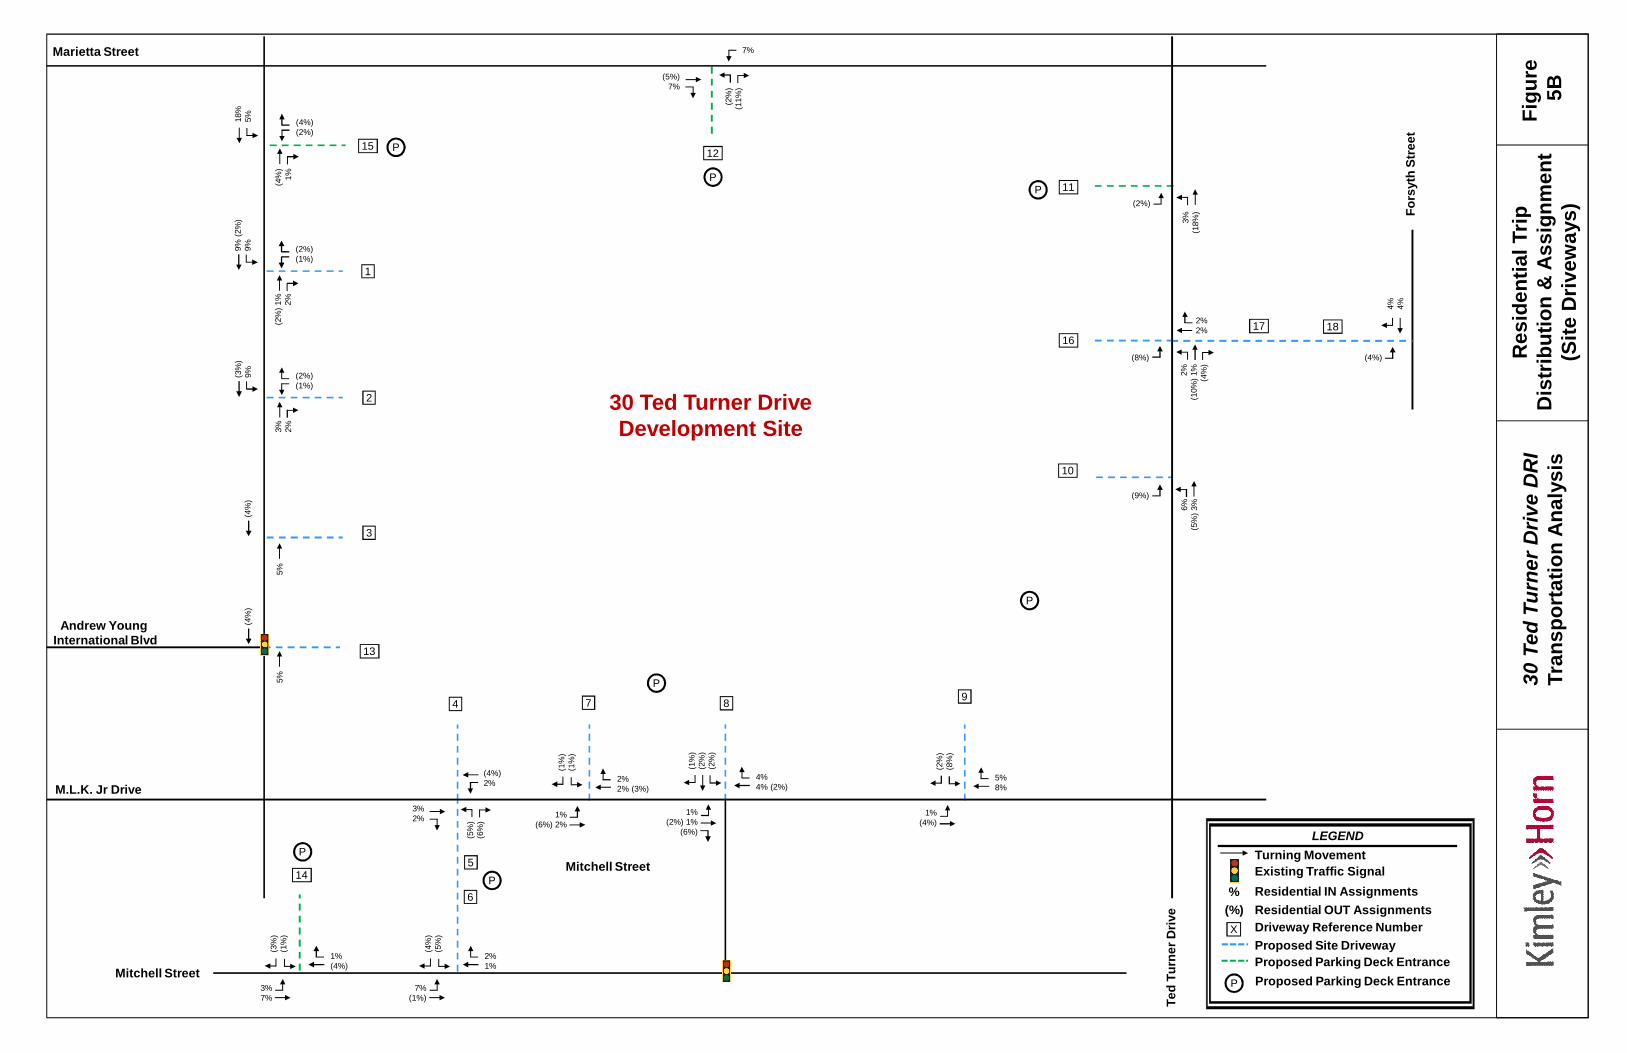
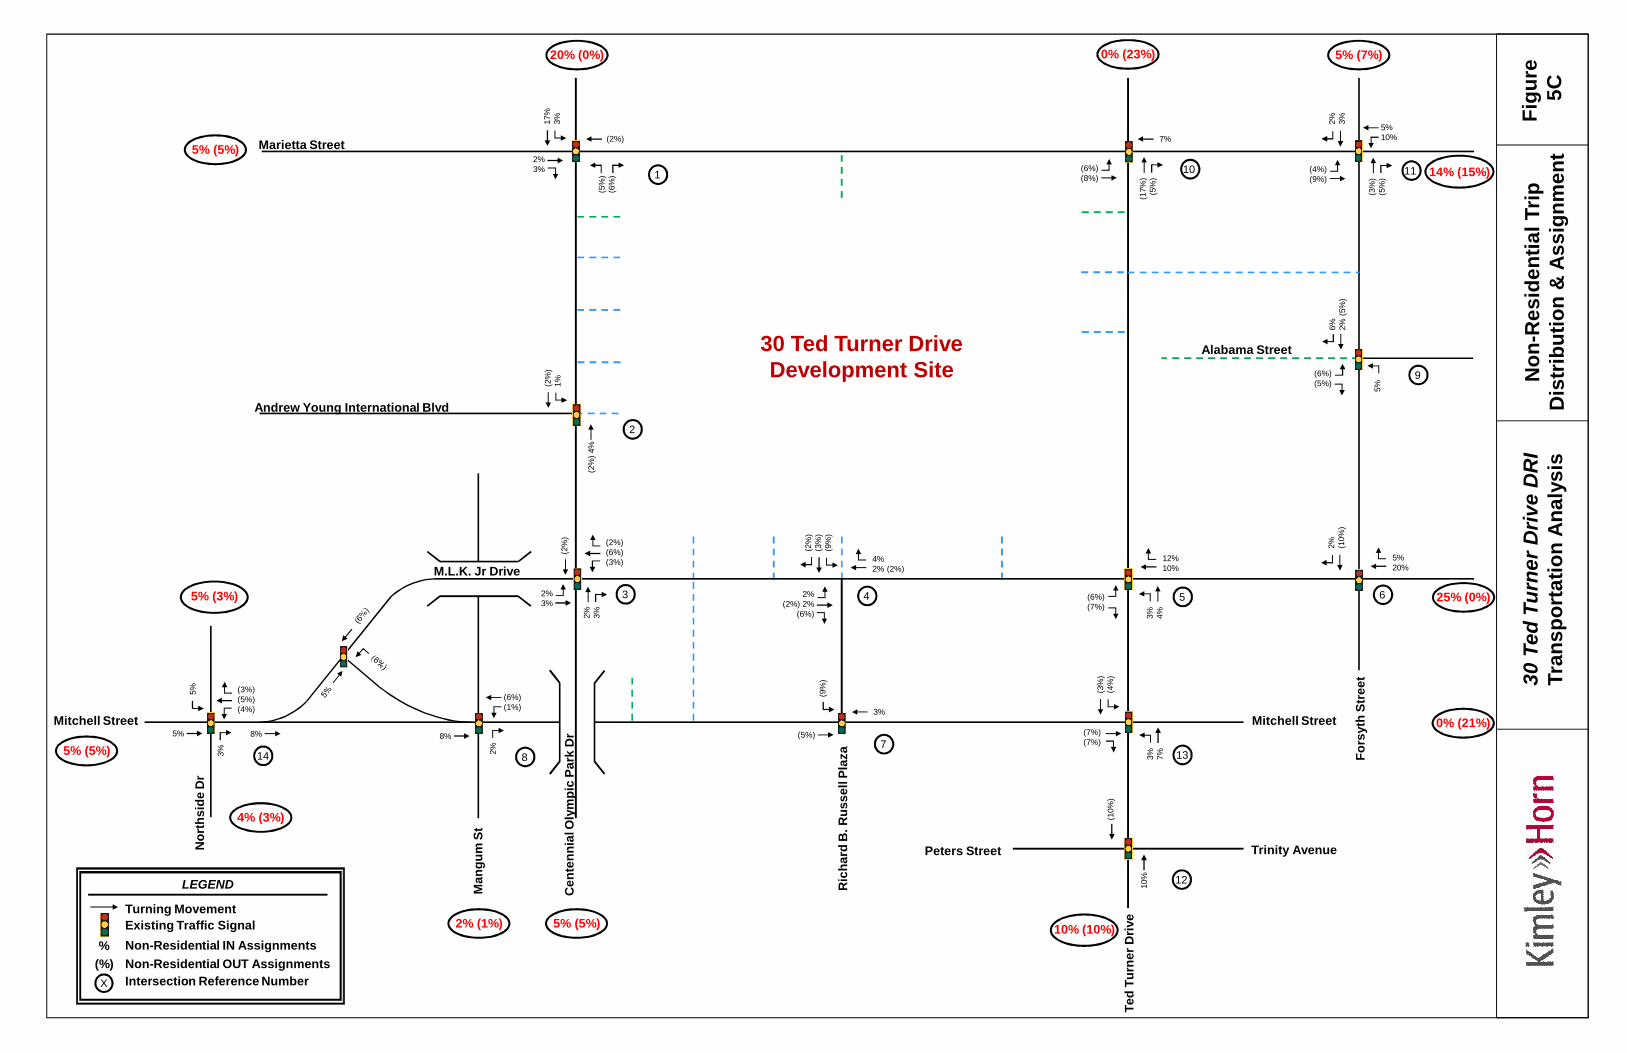
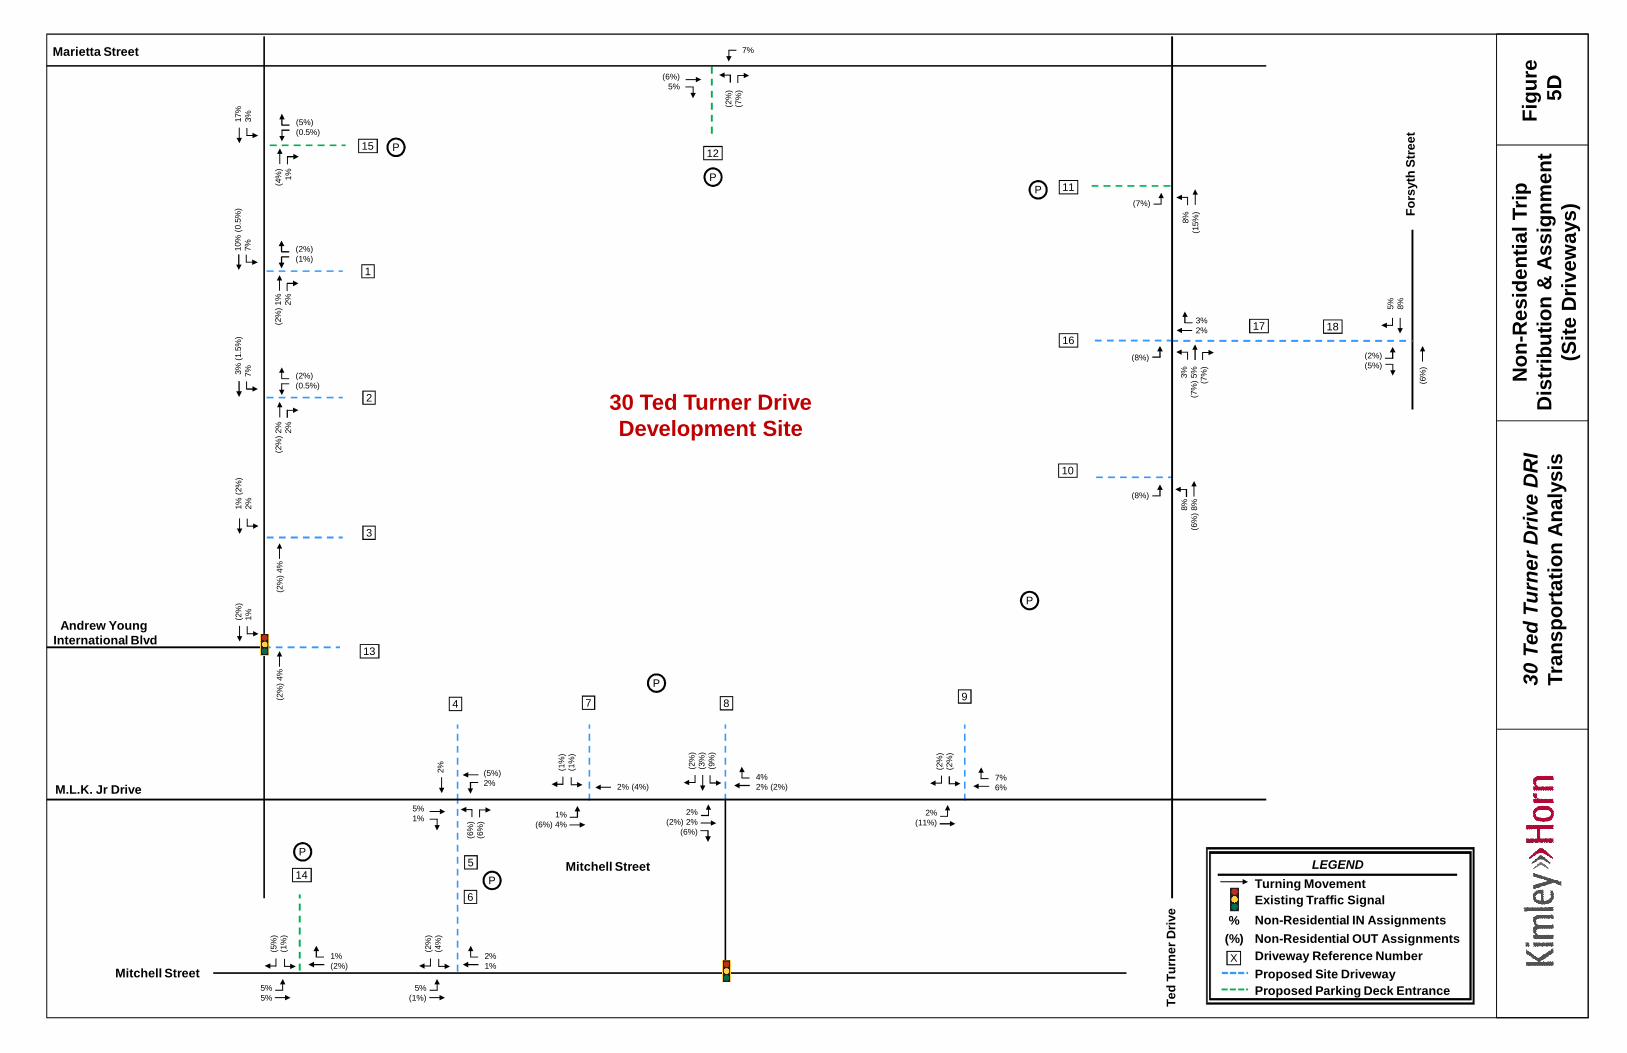
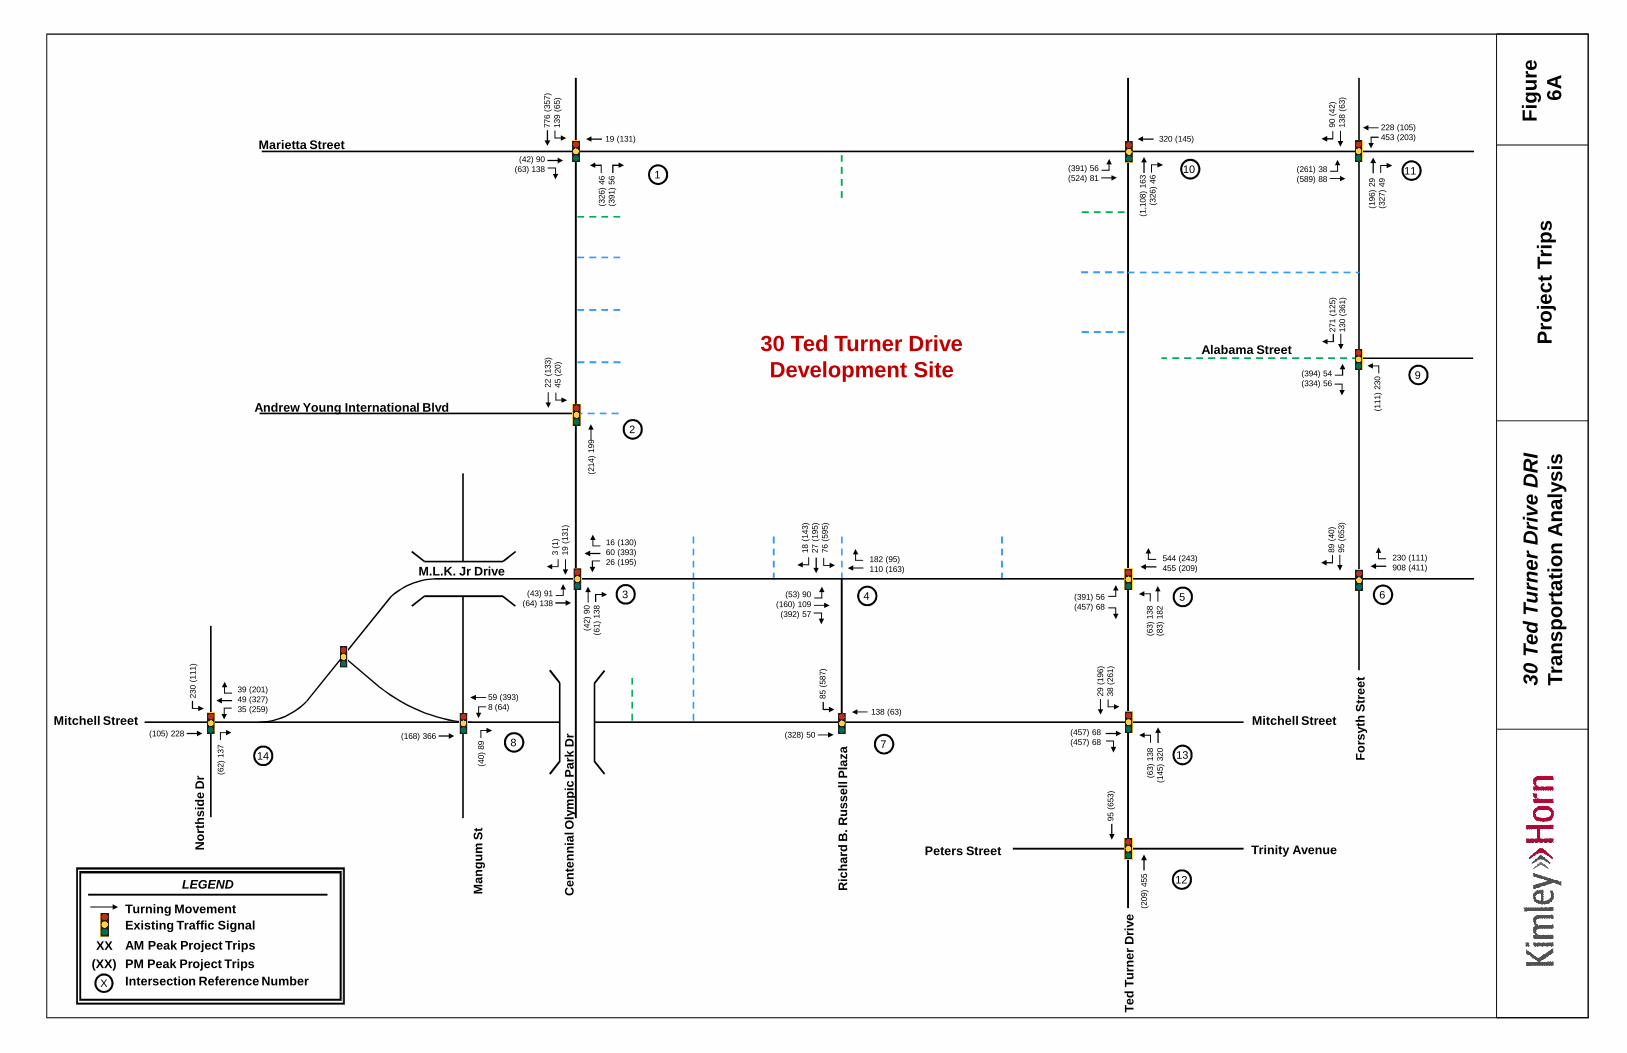
5.0 TRIP DISTRIBUTION AND ASSIGNMENTNew trips were distributed onto the roadway network using the percentages developed as described inSection 3.2 of this report, and as agreed to during methodology discussions with GRTA, ARC, GDOT,and City of Atlanta staff.
Figure 5A and Figure 5B display the anticipated distribution and assignment of the residential projecttrips and Figure 5C and Figure 5D display the anticipated distribution and assignment of the non-residential project trips throughout the study roadway network. These trip assignment percentageswere applied to the net new trips expected to be generated by the development, and the volumes wereassigned to the roadway network. The combined peak hour project trips by turning movementthroughout the study network, anticipated to be generated by the proposed 30 Ted Turner Drivedevelopment, are shown in Figure 6A and Figure 6B.
Detailed intersection volume worksheets are provided in Appendix D.

30Te
dTu
rner
Driv
eD
RI
Tran
spor
tatio
nA
naly
sis
Res
iden
tialT
ripD
istr
ibut
ion
&A
ssig
nmen
tFi
gure
5A
%
Turning Movement
LEGEND
Residential IN AssignmentsResidential OUT Assignments(%)
Existing Traffic Signal
1
2
3
8 7
4 5 6
9
1110
Marietta Street
M.L.K. Jr Drive
Mitchell Street
Cen
tenn
ialO
lym
pic
Park
Dr
Ric
hard
B.R
usse
llPl
aza
30 Ted Turner DriveDevelopment Site
Alabama Street
Andrew Young International Blvd
14 13
12
Mitchell Street
Trinity AvenuePeters Street
Ted
Turn
erD
rive
Fors
yth
Stre
et
25% (0%)
Nor
thsi
deD
r
0% (22%) 5% (7%)
10% (15%)
25% (0%)
0% (21%)
Man
gum
St
2% (2%)
5% (5%)
10% (10%)
5% (5%)
10% (10%)
2%3%
3% (3%)
(2%)
20%
5%
(3%
)(5
%)
(17%
)(3
%)
(5%)(11%)
7%
(4%)(10%)
(3%
)(5
%)
5%5%
2% 3%4%
(4%)(10%)
10%
(10%
)
10%15%
5%10%
3% 4%
(5%)(7%)
3% 7%
(7%)
(3%
)(4
%)
10%
(10%
)
(5%
)
3%
1%(2%) 1%
(6%)
(7%)(7%)
(1%
)(2
%)
(2%
)
4%4% (2%)
2% 1%
(2%
)(2
%)
3%4%
(8%)(1%)
10%
(7%)
10%
5%
(4%
)
(10%)(5%)(2%)
10%
5%
2%
Intersection Reference NumberX
30Te
dTu
rner
Driv
eD
RI
Tran
spor
tatio
nA
naly
sis
Res
iden
tialT
ripD
istr
ibut
ion
&A
ssig
nmen
t(S
iteD
rivew
ays)
Figu
re5B
%
Turning MovementLEGEND
Residential IN AssignmentsResidential OUT Assignments(%)
Existing Traffic Signal
Driveway Reference NumberXProposed Site DrivewayProposed Parking Deck Entrance
Marietta Street
M.L.K. Jr Drive
Mitchell Street
30 Ted Turner DriveDevelopment Site
Andrew YoungInternational Blvd
Fors
yth
Stre
et15
1%(2%) 1%
(6%)
(1%
)(2
%)
(2%
)
4%4% (2%)
1
2
3
13
4
5
6
14
7 8 9
10
16
11
12
17 18
1%(4%)
(2%
)(8
%)
5%8%
3%2%
3%7%
(3%
)(1
%)
1%(4%)
(4%
)1%
18%
5%
1%(6%) 2%
(1%
)(1
%)
2%2% (3%)
(9%)
(4%)
4% 4%
(4%)(2%)
(2%
)1% 2%
9%(2
%)
9% (2%)(1%)
3% 2%
(3%
)9% (2%)
(1%)
(4%
)
5%
(4%
)
5%
(4%)2%
(5%
)(6
%)
6%(5
%)3
%
(8%)
2%(1
0%)1
%(4
%)
2%2%
(2%)
3%(1
8%)
(2%
)(1
1%)
7%
(5%)7%
7%(1%)
(4%
)(5
%)
2%1%
Ted
Turn
erD
rive
Mitchell Street Proposed Parking Deck EntranceP
PP
P
P
P
P
P
30Te
dTu
rner
Driv
eD
RI
Tran
spor
tatio
nA
naly
sis
Non
-Res
iden
tialT
ripD
istr
ibut
ion
&A
ssig
nmen
tFi
gure
5C
%
Turning Movement
LEGEND
Non-Residential IN AssignmentsNon-Residential OUT Assignments(%)
Existing Traffic Signal
1
2
3
87
4 5 6
9
1110
Marietta Street
M.L.K. Jr Drive
Mitchell Street
Cen
tenn
ialO
lym
pic
Park
Dr
Ric
hard
B.R
usse
llPl
aza
30 Ted Turner DriveDevelopment Site
Alabama Street
Andrew Young International Blvd
14 13
12
Mitchell Street
Trinity AvenuePeters Street
Ted
Turn
erD
rive
Fors
yth
Stre
et
20% (0%)
Nor
thsi
deD
r
0% (23%) 5% (7%)
14% (15%)
25% (0%)
0% (21%)
Man
gum
St
4% (3%)
5% (5%)
5% (3%)
5% (5%)
10% (10%)
2%3%
5% (5%)
(2%)
17%
3%
(5%
)(6
%)
(17%
)(5
%)
(6%)(8%)
7%
(4%)(9%)
(3%
)(5
%)
5%10%
2% 3%
(6%)(5%)
5%
5%20%
12%10%
3% 4%
(6%)(7%)
3% 7%
(5%)
(3%
)(4
%)
10%
(10%
)
(9%
)
3%
(7%)(7%)
2% 3%
(2%
)
2%3%
8%8%
(2%
)4%
(3%)(5%)(4%)
5%
5%
3%
Intersection Reference NumberX
2% (1%)
6% 2%(5
%)
2% (10%
)
(2%)(6%)(3%)
(6%)(1%)
(2%
)1%
2%
2%(2%) 2%
(6%)
(2%
)(3
%)
(9%
)
4%2% (2%)
30Te
dTu
rner
Driv
eD
RI
Tran
spor
tatio
nA
naly
sis
Non
-Res
iden
tialT
ripD
istr
ibut
ion
&A
ssig
nmen
t(S
iteD
rivew
ays)
Figu
re5D
%
Turning MovementLEGEND
Non-Residential IN AssignmentsNon-Residential OUT Assignments(%)
Existing Traffic Signal
Driveway Reference NumberXProposed Site DrivewayProposed Parking Deck Entrance
Marietta Street
M.L.K. Jr Drive
Mitchell Street
30 Ted Turner DriveDevelopment Site
Andrew YoungInternational Blvd
Fors
yth
Stre
et15
2%(2%) 2%
(6%)
(2%
)(3
%)
(9%
)
4%2% (2%)
1
2
3
13
4
5
6
14
7 8 9
10
16
11
12
17 18
2%(11%)
(2%
)(2
%)
7%6%
5%1%
5%5%
(5%
)(1
%)
1%(2%)
(4%
)1%
17%
3%
1%(6%) 4%
(1%
)(1
%)
2% (4%)
(8%)
(2%)(5%)
5% 8%
(5%)(0.5%)
(2%
)1% 2%
10%
(0.5
%)
7% (2%)(1%)
(2%
)2% 2%
3%(1
.5%
)7% (2%)
(0.5%)
(2%
)4%
(2%
)4%
(5%)2%
(6%
)(6
%)
8%(6
%)8
%
(8%)
3%(7
%)5
%(7
%)
3%2%
(7%)
8%(1
5%)
(2%
)(7
%)
7%
(6%)5%
5%(1%)
(2%
)(4
%)
2%1%
1%(2
%)
2%(2
%)
1%
(6%
)
Mitchell Street
Ted
Turn
erD
rive
2%
PP
P
P
P
P
P
30Te
dTu
rner
Driv
eD
RI
Tran
spor
tatio
nA
naly
sis
Proj
ectT
rips
Figu
re6A
XX
Turning Movement
LEGEND
AM Peak Project TripsPM Peak Project Trips(XX)
Existing Traffic Signal
1
2
3
8 7
4 5 6
9
1110
Marietta Street
M.L.K. Jr Drive
Mitchell Street
Cen
tenn
ialO
lym
pic
Park
Dr
Ric
hard
B.R
usse
llPl
aza
30 Ted Turner DriveDevelopment Site
Alabama Street
Andrew Young International Blvd
14 13
12
Mitchell Street
Trinity AvenuePeters Street
Ted
Turn
erD
rive
Fors
yth
Stre
et
Nor
thsi
deD
r
Man
gum
St
(42) 90(63) 138
19 (131)
776
(357
)13
9(6
5)
(326
)46
(391
)56
(1,1
08)1
63(3
26)4
6
(391) 56(524) 81
320 (145)
(261) 38(589) 88
(196
)29
(327
)49
228 (105)453 (203)
90(4
2)13
8(6
3)
(394) 54(334) 56
(111
)230
230 (111)908 (411)
544 (243)455 (209)
(63)
138
(83)
182
(391) 56(457) 68
(63)
138
(145
)320
(328) 50
29(1
96)
38(2
61)
(209
)455
95(6
53)
85(5
87)
138 (63)
(457) 68(457) 68
(42)
90(6
1)13
8
3(1
)19
(131
)
(43) 91(64) 138
(168) 366
(214
)199
39 (201)49 (327)35 (259)
230
(111
)
(105) 228
(62)
137
Intersection Reference NumberX
271
(125
)13
0(3
61)
89(4
0)95
(653
)
16 (130)60 (393)26 (195)
59 (393)8 (64)
22(1
33)
45(2
0)
(40)
89
(53) 90(160) 109(392) 57
18(1
43)
27(1
95)
76(5
95)
182 (95)110 (163)

30Te
dTu
rner
Driv
eD
RI
Tran
spor
tatio
nA
naly
sis
Proj
ectT
rips
(Site
Driv
eway
s)Fi
gure
6B
XX
Turning MovementLEGEND
AM Peak Project TripsPM Peak Project Trips(XX)
Existing Traffic Signal
Driveway Reference NumberXProposed Site DrivewayProposed Parking Deck Entrance
Marietta Street
M.L.K. Jr Drive
Mitchell Street
30 Ted Turner DriveDevelopment Site
Andrew YoungInternational Blvd
Fors
yth
Stre
et15
1
2
3
13
4
5
6
14
7 8 9
10
16
11
12
17 18
(53) 90(701) 95
19(1
43)
28(1
47)
319 (155)273 (114)
(94) 227(31) 46
(113) 227(97) 552
46(3
36)
10(7
5)
46 (31)172 (123)
(379
)54
(23)
24
775
(343
)13
9(7
7)
(30) 46(464) 238
10(7
4)10
(74)
(577) 78
(133) 22(324) 41
227
(104
)36
3(1
61)
47 (339)8 (45)
(260
)59
(41)
68
463
(230
)32
1(1
57)
19 (141)10 (75)
(163
)107
(52)
90
153
(148
)32
1(1
57)
19 (141)7 (43)
(214
)199
47 (318)90 (51)
(400
)56
(401
)57
(217
)364
(497
)419
(522) 76
(62)
137
(560
)298
(455
)63
137 (62)90 (42)
(491) 60
(198
)363
(943
)148
(141
)19
(469
)74
320 (155)
(381) 56(117) 229
(117) 229(55) 10
22(1
43)
40(2
71)
90 (52)46 (11)
67(1
53)
89(4
0)
(388
)48
Mitchell Street
Ted
Turn
erD
rive
89(4
0)
1 (11)127 (293)
PP
P
P
P
P
P
(53) 90(160) 109(392) 57
18(1
43)
27(1
95)
76(5
95)
182 (95)110 (163)
30 Ted Turner Drive DRI #2758 - Transportation Analysis
015170030 December 201722
6.0 TRAFFIC ANALYSIS
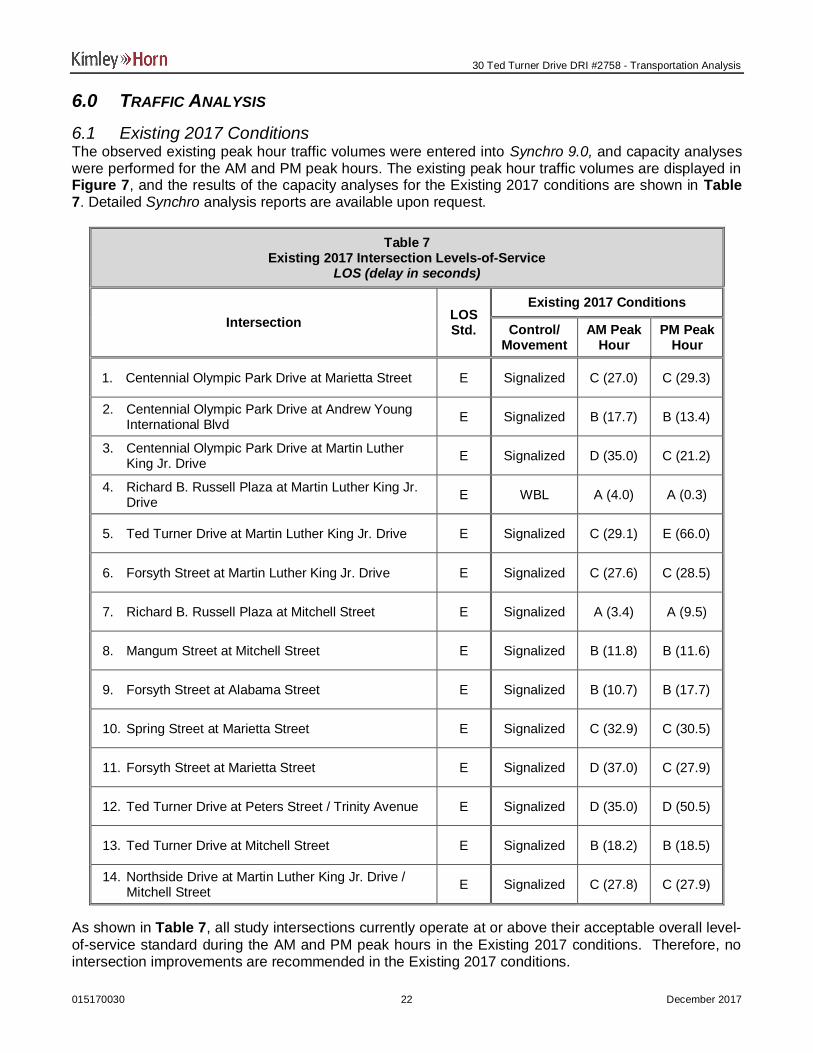
6.1 Existing 2017 ConditionsThe observed existing peak hour traffic volumes were entered into Synchro 9.0, and capacity analyseswere performed for the AM and PM peak hours. The existing peak hour traffic volumes are displayed inFigure 7, and the results of the capacity analyses for the Existing 2017 conditions are shown in Table7. Detailed Synchro analysis reports are available upon request.
Table 7Existing 2017 Intersection Levels-of-Service
LOS (delay in seconds)
Intersection LOSStd.
Existing 2017 Conditions
Control/Movement
AM PeakHour
PM PeakHour
1. Centennial Olympic Park Drive at Marietta Street E Signalized C (27.0) C (29.3)
2. Centennial Olympic Park Drive at Andrew YoungInternational Blvd E Signalized B (17.7) B (13.4)
3. Centennial Olympic Park Drive at Martin LutherKing Jr. Drive E Signalized D (35.0) C (21.2)
4. Richard B. Russell Plaza at Martin Luther King Jr.Drive E WBL A (4.0) A (0.3)
5. Ted Turner Drive at Martin Luther King Jr. Drive E Signalized C (29.1) E (66.0)
6. Forsyth Street at Martin Luther King Jr. Drive E Signalized C (27.6) C (28.5)
7. Richard B. Russell Plaza at Mitchell Street E Signalized A (3.4) A (9.5)
8. Mangum Street at Mitchell Street E Signalized B (11.8) B (11.6)
9. Forsyth Street at Alabama Street E Signalized B (10.7) B (17.7)
10. Spring Street at Marietta Street E Signalized C (32.9) C (30.5)
11. Forsyth Street at Marietta Street E Signalized D (37.0) C (27.9)
12. Ted Turner Drive at Peters Street / Trinity Avenue E Signalized D (35.0) D (50.5)
13. Ted Turner Drive at Mitchell Street E Signalized B (18.2) B (18.5)
14. Northside Drive at Martin Luther King Jr. Drive /Mitchell Street E Signalized C (27.8) C (27.9)
As shown in Table 7, all study intersections currently operate at or above their acceptable overall level-of-service standard during the AM and PM peak hours in the Existing 2017 conditions. Therefore, nointersection improvements are recommended in the Existing 2017 conditions.
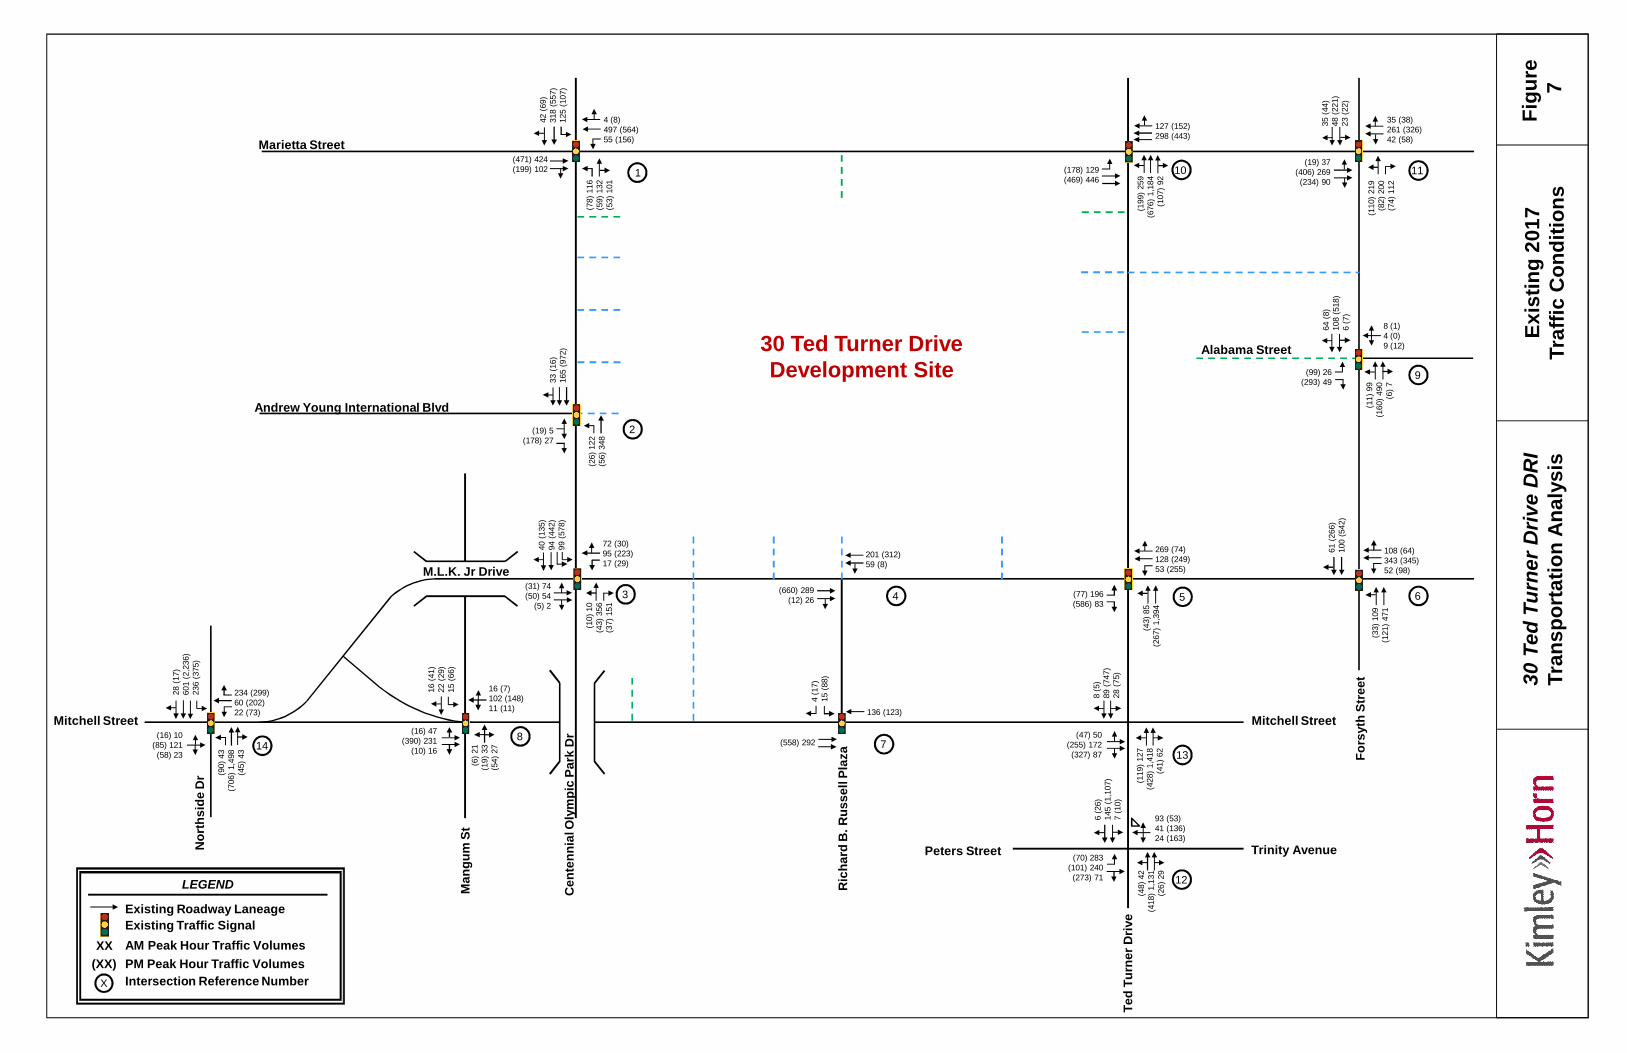
Exis
ting
2017
Traf
ficC
ondi
tions
Figu
re7
201 (312)59 (8)
(660) 289(12) 26
1
2
3
87
4 5 6
9
1110
Marietta Street
Mitchell Street
Cen
tenn
ialO
lym
pic
Park
Dr
Ric
hard
B.R
usse
llPl
aza
Alabama Street
Andrew Young International Blvd
1413
12
Mitchell Street
Trinity AvenuePeters Street
Ted
Turn
erD
rive
Fors
yth
Stre
et
(26)
122
(56)
348
33(1
6)16
5(9
72)
(19) 5(178) 27
72 (30)95 (223)17 (29)
(10)
10(4
3)35
6(3
7)15
1
40(1
35)
94(4
42)
99(5
78)
(31) 74(50) 54
(5) 2
16 (7)102 (148)11 (11)
(6)2
1(1
9)33
(54)
27
16(4
1)22
(29)
15(6
6)
(16) 47(390) 231
(10) 16
136 (123)
4(1
7)15
(88)
(558) 292
8 (1)4 (0)9 (12)
(11)
99(1
60)4
90(6
)7
64(8
)10
8(5
18)
6(7
)
(99) 26(293) 49
35 (38)261 (326)42 (58)
(110
)219
(82)
200
(74)
112
35(4
4)48
(221
)23
(22)
(19) 37(406) 269(234) 90
127 (152)298 (443)
(199
)259
(676
)1,1
84(1
07)9
2
(178) 129(469) 446
4 (8)497 (564)55 (156)
(78)
116
(59)
132
(53)
101
42(6
9)31
8(5
57)
125
(107
)
(471) 424(199) 102
269 (74)128 (249)53 (255)
(43)
85(2
67)1
,394
(77) 196(586) 83
234 (299)60 (202)22 (73)
(90)
43(7
06)1
,498
(45)
43
28(1
7)60
1(2
,236
)23
6(3
75)
(16) 10(85) 121(58) 23
(119
)127
(428
)1,4
18(4
1)62
8(5
)89
(747
)28
(75)
(47) 50(255) 172(327) 87
93 (53)41 (136)24 (163)
(48)
42(4
18)1
,131
(26)
29
6(2
6)14
5(1
,107
)7
(10)
(70) 283(101) 240(273) 71
M.L.K. Jr Drive
30 Ted Turner DriveDevelopment Site
Nor
thsi
deD
r
Man
gum
St
30Te
dTu
rner
Driv
eD
RI
Tran
spor
tatio
nA
naly
sis
Intersection Reference NumberX
XX
Existing Roadway Laneage
LEGEND
AM Peak Hour Traffic VolumesPM Peak Hour Traffic Volumes(XX)
Existing Traffic Signal
108 (64)343 (345)52 (98)
(33)
109
(121
)471
61(2
66)
100
(542
)
30 Ted Turner Drive DRI #2758 - Transportation Analysis
015170030 December 201724
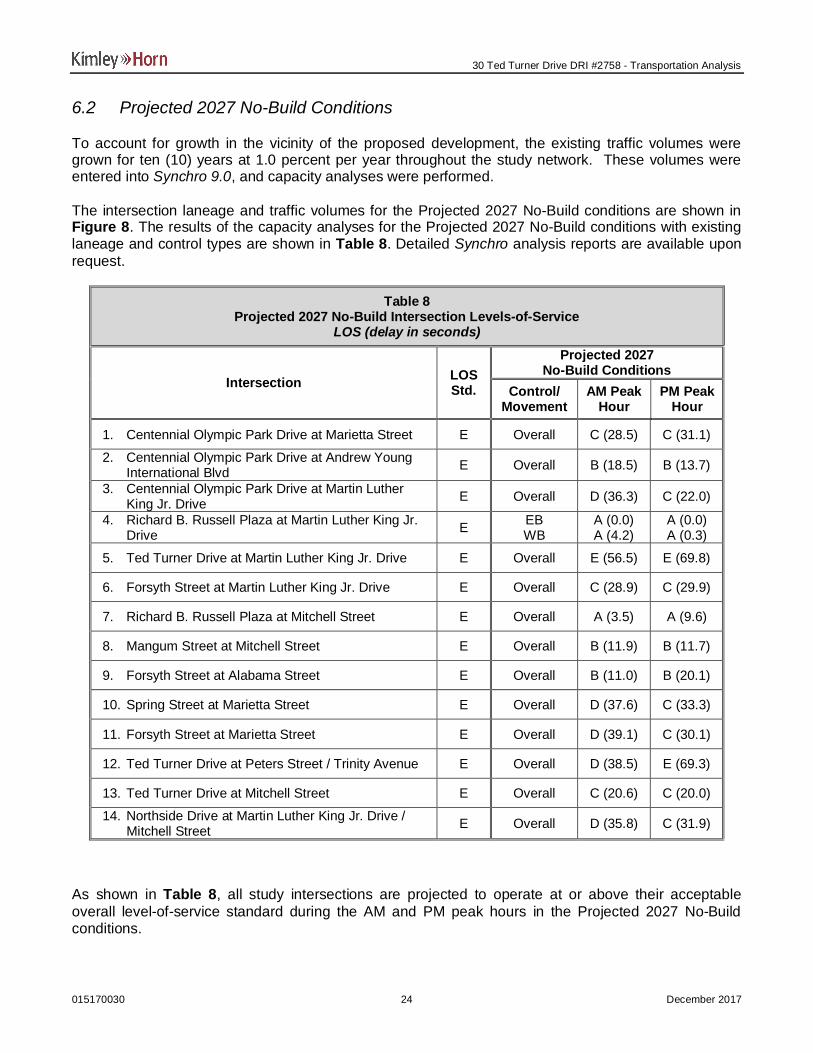
6.2 Projected 2027 No-Build Conditions
To account for growth in the vicinity of the proposed development, the existing traffic volumes weregrown for ten (10) years at 1.0 percent per year throughout the study network. These volumes wereentered into Synchro 9.0, and capacity analyses were performed.
The intersection laneage and traffic volumes for the Projected 2027 No-Build conditions are shown inFigure 8. The results of the capacity analyses for the Projected 2027 No-Build conditions with existinglaneage and control types are shown in Table 8. Detailed Synchro analysis reports are available uponrequest.
Table 8Projected 2027 No-Build Intersection Levels-of-Service
LOS (delay in seconds)
Intersection LOSStd.
Projected 2027No-Build Conditions
Control/Movement
AM PeakHour
PM PeakHour
1. Centennial Olympic Park Drive at Marietta Street E Overall C (28.5) C (31.1)
2. Centennial Olympic Park Drive at Andrew YoungInternational Blvd E Overall B (18.5) B (13.7)
3. Centennial Olympic Park Drive at Martin LutherKing Jr. Drive E Overall D (36.3) C (22.0)
4. Richard B. Russell Plaza at Martin Luther King Jr.Drive E EB
WBA (0.0)A (4.2)
A (0.0)A (0.3)
5. Ted Turner Drive at Martin Luther King Jr. Drive E Overall E (56.5) E (69.8)
6. Forsyth Street at Martin Luther King Jr. Drive E Overall C (28.9) C (29.9)
7. Richard B. Russell Plaza at Mitchell Street E Overall A (3.5) A (9.6)
8. Mangum Street at Mitchell Street E Overall B (11.9) B (11.7)
9. Forsyth Street at Alabama Street E Overall B (11.0) B (20.1)
10. Spring Street at Marietta Street E Overall D (37.6) C (33.3)
11. Forsyth Street at Marietta Street E Overall D (39.1) C (30.1)
12. Ted Turner Drive at Peters Street / Trinity Avenue E Overall D (38.5) E (69.3)
13. Ted Turner Drive at Mitchell Street E Overall C (20.6) C (20.0)
14. Northside Drive at Martin Luther King Jr. Drive /Mitchell Street E Overall D (35.8) C (31.9)
As shown in Table 8, all study intersections are projected to operate at or above their acceptableoverall level-of-service standard during the AM and PM peak hours in the Projected 2027 No-Buildconditions.
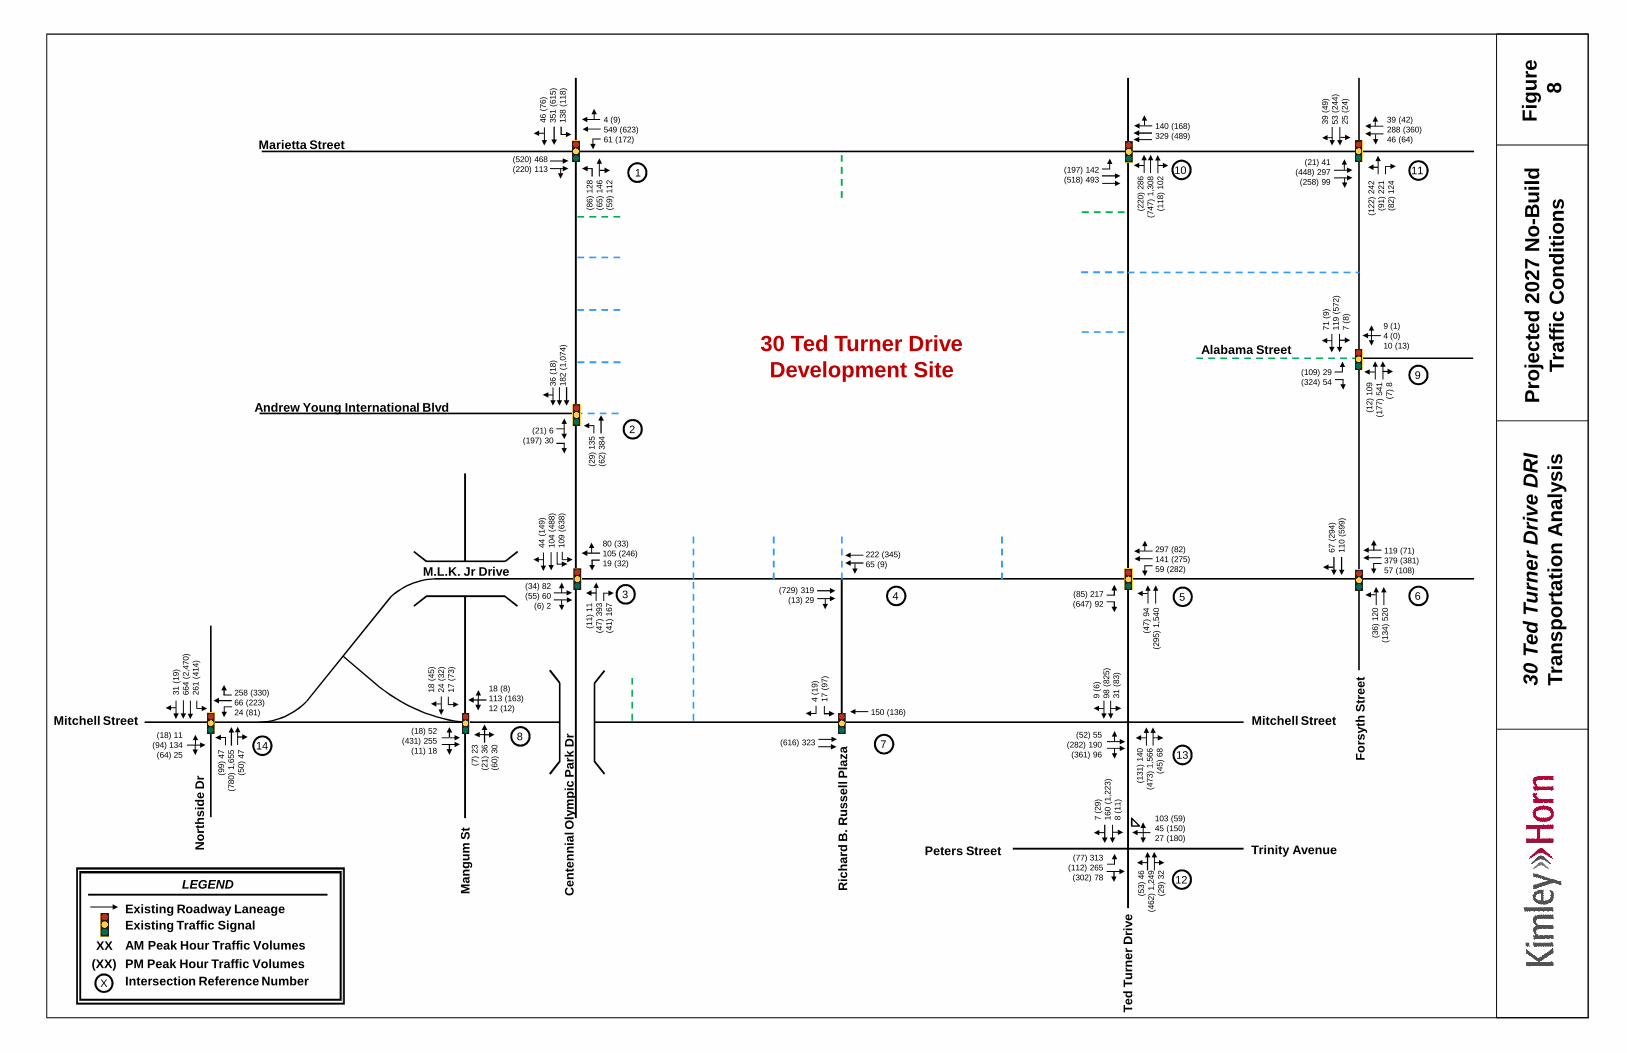
Proj
ecte
d20
27N
o-B
uild
Traf
ficC
ondi
tions
Figu
re8
222 (345)65 (9)
(729) 319(13) 29
1
2
3
87
4 5 6
9
1110
Marietta Street
Mitchell Street
Cen
tenn
ialO
lym
pic
Park
Dr
Ric
hard
B.R
usse
llPl
aza
Alabama Street
Andrew Young International Blvd
1413
12
Mitchell Street
Trinity AvenuePeters Street
Ted
Turn
erD
rive
Fors
yth
Stre
et
(29)
135
(62)
384
36(1
8)18
2(1
,074
)
(21) 6(197) 30
80 (33)105 (246)19 (32)
(11)
11(4
7)39
3(4
1)16
7
44(1
49)
104
(488
)10
9(6
38)
(34) 82(55) 60
(6) 2
18 (8)113 (163)12 (12)
(7)2
3(2
1)36
(60)
30
18(4
5)24
(32)
17(7
3)
(18) 52(431) 255
(11) 18
150 (136)
4(1
9)17
(97)
(616) 323
119 (71)379 (381)57 (108)
(36)
120
(134
)520
67(2
94)
110
(599
)
9 (1)4 (0)10 (13)
(12)
109
(177
)541
(7)8
71(9
)11
9(5
72)
7(8
)
(109) 29(324) 54
39 (42)288 (360)46 (64)
(122
)242
(91)
221
(82)
124
39(4
9)53
(244
)25
(24)
(21) 41(448) 297(258) 99
140 (168)329 (489)
(220
)286
(747
)1,3
08(1
18)1
02
(197) 142(518) 493
4 (9)549 (623)61 (172)
(86)
128
(65)
146
(59)
112
46(7
6)35
1(6
15)
138
(118
)
(520) 468(220) 113
297 (82)141 (275)59 (282)
(47)
94(2
95)1
,540
(85) 217(647) 92
258 (330)66 (223)24 (81)
(99)
47(7
80)1
,655
(50)
47
31(1
9)66
4(2
,470
)26
1(4
14)
(18) 11(94) 134(64) 25
(131
)140
(473
)1,5
66(4
5)68
9(6
)98
(825
)31
(83)
(52) 55(282) 190(361) 96
103 (59)45 (150)27 (180)
(53)
46(4
62)1
,249
(29)
32
7(2
9)16
0(1
,223
)8
(11)
(77) 313(112) 265(302) 78
M.L.K. Jr Drive
30 Ted Turner DriveDevelopment Site
Nor
thsi
deD
r
Man
gum
St
30Te
dTu
rner
Driv
eD
RI
Tran
spor
tatio
nA
naly
sis
Intersection Reference NumberX
XX
Existing Roadway Laneage
LEGEND
AM Peak Hour Traffic VolumesPM Peak Hour Traffic Volumes(XX)
Existing Traffic Signal
30 Ted Turner Drive DRI #2758 - Transportation Analysis
015170030 December 201726
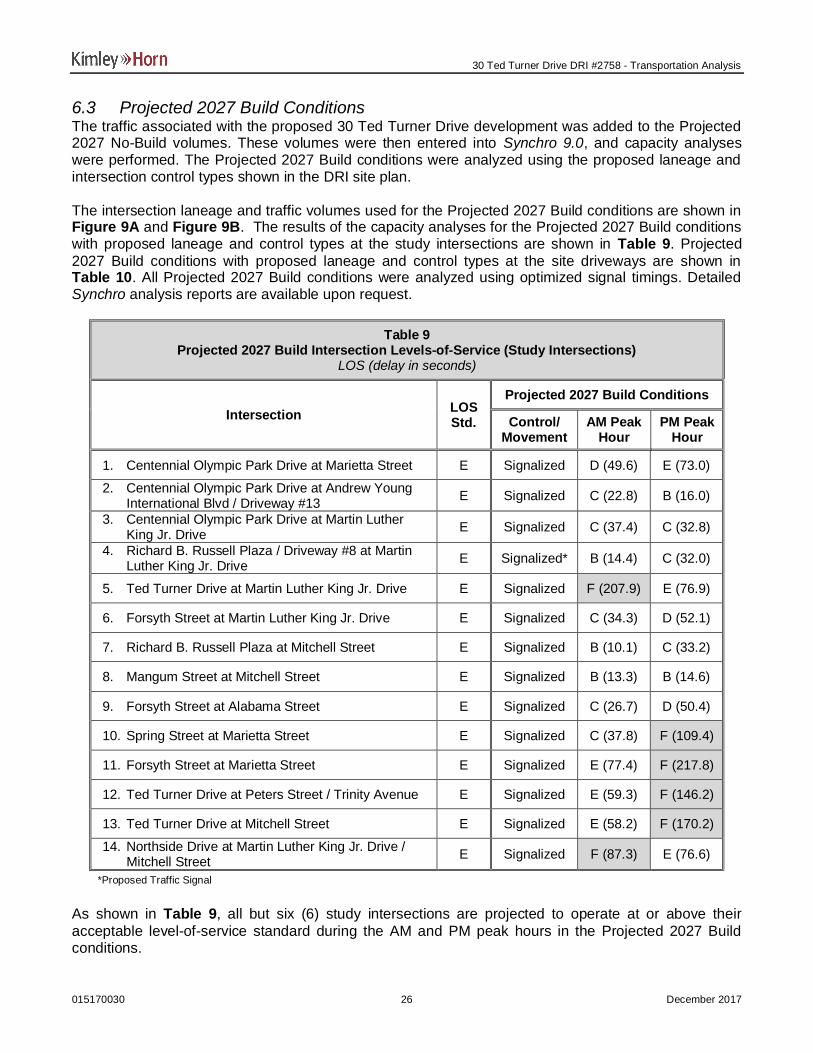
6.3 Projected 2027 Build ConditionsThe traffic associated with the proposed 30 Ted Turner Drive development was added to the Projected2027 No-Build volumes. These volumes were then entered into Synchro 9.0, and capacity analyseswere performed. The Projected 2027 Build conditions were analyzed using the proposed laneage andintersection control types shown in the DRI site plan.
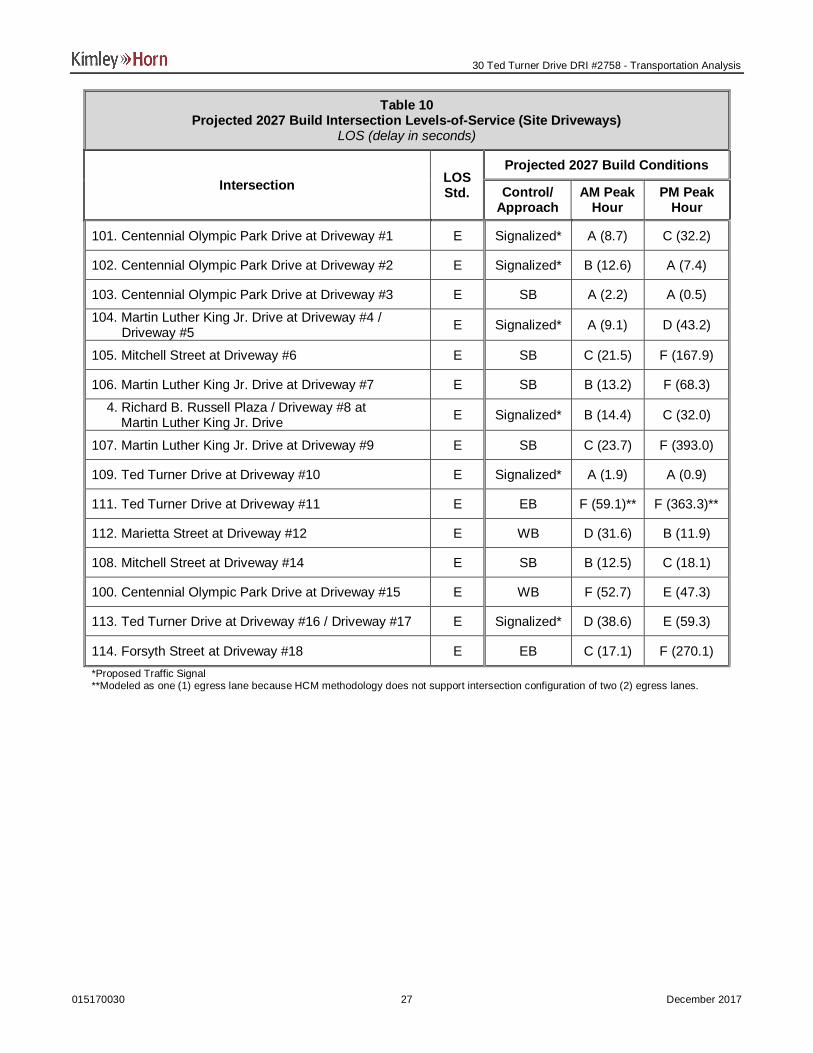
The intersection laneage and traffic volumes used for the Projected 2027 Build conditions are shown inFigure 9A and Figure 9B. The results of the capacity analyses for the Projected 2027 Build conditionswith proposed laneage and control types at the study intersections are shown in Table 9. Projected2027 Build conditions with proposed laneage and control types at the site driveways are shown inTable 10. All Projected 2027 Build conditions were analyzed using optimized signal timings. DetailedSynchro analysis reports are available upon request.
Table 9Projected 2027 Build Intersection Levels-of-Service (Study Intersections)
LOS (delay in seconds)
Intersection LOSStd.
Projected 2027 Build Conditions
Control/Movement
AM PeakHour
PM PeakHour
1. Centennial Olympic Park Drive at Marietta Street E Signalized D (49.6) E (73.0)
2. Centennial Olympic Park Drive at Andrew YoungInternational Blvd / Driveway #13 E Signalized C (22.8) B (16.0)
3. Centennial Olympic Park Drive at Martin LutherKing Jr. Drive E Signalized C (37.4) C (32.8)
4. Richard B. Russell Plaza / Driveway #8 at MartinLuther King Jr. Drive E Signalized* B (14.4) C (32.0)
5. Ted Turner Drive at Martin Luther King Jr. Drive E Signalized F (207.9) E (76.9)
6. Forsyth Street at Martin Luther King Jr. Drive E Signalized C (34.3) D (52.1)
7. Richard B. Russell Plaza at Mitchell Street E Signalized B (10.1) C (33.2)
8. Mangum Street at Mitchell Street E Signalized B (13.3) B (14.6)
9. Forsyth Street at Alabama Street E Signalized C (26.7) D (50.4)
10. Spring Street at Marietta Street E Signalized C (37.8) F (109.4)
11. Forsyth Street at Marietta Street E Signalized E (77.4) F (217.8)
12. Ted Turner Drive at Peters Street / Trinity Avenue E Signalized E (59.3) F (146.2)
13. Ted Turner Drive at Mitchell Street E Signalized E (58.2) F (170.2)
14. Northside Drive at Martin Luther King Jr. Drive /Mitchell Street E Signalized F (87.3) E (76.6)
*Proposed Traffic Signal
As shown in Table 9, all but six (6) study intersections are projected to operate at or above theiracceptable level-of-service standard during the AM and PM peak hours in the Projected 2027 Buildconditions.
30 Ted Turner Drive DRI #2758 - Transportation Analysis
015170030 December 201727
Table 10Projected 2027 Build Intersection Levels-of-Service (Site Driveways)
LOS (delay in seconds)
Intersection LOSStd.
Projected 2027 Build Conditions
Control/Approach
AM PeakHour
PM PeakHour
101. Centennial Olympic Park Drive at Driveway #1 E Signalized* A (8.7) C (32.2)
102. Centennial Olympic Park Drive at Driveway #2 E Signalized* B (12.6) A (7.4)
103. Centennial Olympic Park Drive at Driveway #3 E SB A (2.2) A (0.5)
104. Martin Luther King Jr. Drive at Driveway #4 / Driveway #5 E Signalized* A (9.1) D (43.2)
105. Mitchell Street at Driveway #6 E SB C (21.5) F (167.9)
106. Martin Luther King Jr. Drive at Driveway #7 E SB B (13.2) F (68.3)
4. Richard B. Russell Plaza / Driveway #8 at Martin Luther King Jr. Drive E Signalized* B (14.4) C (32.0)
107. Martin Luther King Jr. Drive at Driveway #9 E SB C (23.7) F (393.0)
109. Ted Turner Drive at Driveway #10 E Signalized* A (1.9) A (0.9)
111. Ted Turner Drive at Driveway #11 E EB F (59.1)** F (363.3)**
112. Marietta Street at Driveway #12 E WB D (31.6) B (11.9)
108. Mitchell Street at Driveway #14 E SB B (12.5) C (18.1)
100. Centennial Olympic Park Drive at Driveway #15 E WB F (52.7) E (47.3)
113. Ted Turner Drive at Driveway #16 / Driveway #17 E Signalized* D (38.6) E (59.3)
114. Forsyth Street at Driveway #18 E EB C (17.1) F (270.1)*Proposed Traffic Signal**Modeled as one (1) egress lane because HCM methodology does not support intersection configuration of two (2) egress lanes.

Proj
ecte
d20
27B
uild
Traf
ficC
ondi
tions
Figu
re9A
182 (95)332 (508)65 (9)
(53) 90(889) 428(405) 86
1
2
3
87
4 5 6
9
1110
Marietta Street
Mitchell Street
Cen
tenn
ialO
lym
pic
Park
Dr
Ric
hard
B.R
usse
llPl
aza
Alabama Street
Andrew Young International Blvd
1413
12
Mitchell Street
Trinity AvenuePeters Street
Ted
Turn
erD
rive
Fors
yth
Stre
et
(29)
135
(276
)583
(0)0
36(1
8)20
4(1
,207
)45
(21)
(21) 6(197) 30
96 (163)165 (639)45 (227)
(11)
11(8
9)48
3(1
02)3
04
47(1
50)
123
(619
)10
9(6
38)
(77) 173(119) 198
(6) 2
18 (8)172 (556)20 (76)
(7)2
3(2
1)36
(100
)119
18(4
5)24
(32)
17(7
3)
(18) 52(599) 621
(11) 18
288 (199)
4(1
9)10
2(6
84)
(944) 373
349 (182)1,287 (792)57 (108)
(36)
120
(134
)520
156
(334
)20
5(1
,252
)
9 (1)4 (0)10 (13)
(123
)339
(177
)541
(7)8
342
(134
)24
9(9
33)
7(8
)
(503) 83(658) 110
39 (42)516 (465)499 (267)
(122
)242
(287
)250
(409
)173
129
(91)
191
(307
)25
(24)
(282) 79(1,037) 385
(258) 99
140 (168)649 (634)
(220
)286
(1,8
55)1
,471
(444
)148
(588) 198(1,042) 574
4 (9)568 (754)61 (172)
(412
)174
(65)
146
(450
)168
46(7
6)1,
127
(972
)27
7(1
83)
(562) 558(283) 251
841 (325)596 (484)59 (282)
(110
)232
(378
)1,7
22
(476) 273(1,104) 160
297 (531)115 (550)59 (340)
(99)
47(7
80)1
,655
(112
)184
31(1
9)66
4(2
,470
)49
1(5
25)
(18) 11(199) 362
(64) 25
(194
)278
(618
)1,8
86(4
5)68
9(6
)12
7(1
,021
)69
(344
)
(52) 55(739) 258(818) 164
103 (59)45 (150)27 (180)
(53)
46(6
71)1
,704
(29)
32
7(2
9)25
5(1
,876
)8
(11)
(77) 313(112) 265(302) 78
M.L.K. Jr Drive
30 Ted Turner DriveDevelopment Site
Nor
thsi
deD
rive
Man
gum
St
30Te
dTu
rner
Driv
eD
RI
Tran
spor
tatio
nA
naly
sis
Intersection Reference NumberX
XX
Existing Roadway LaneageLEGEND
AM Peak Hour Traffic VolumesPM Peak Hour Traffic Volumes(XX)
Existing Traffic Signal
Proposed Traffic Signal
Proposed Roadway Laneage
18(1
43)
27(1
95)
76(5
95)
0 (0)0 (0)0 (0)

30Te
dTu
rner
Driv
eD
RI
Tran
spor
tatio
nA
naly
sis
Figu
re9B
Marietta Street
M.L.K. Jr Drive
Mitchell Street
30 Ted Turner DriveDevelopment Site
Andrew YoungInternational Blvd
Fors
yth
Stre
et15
1
2
3
13
4
5
6
14
7 8 9
10
16
11
12
17 18
(0) 0( 829) 563
(31) 46
(113) 227(660) 552
46(3
36)
10(7
5)
46 (31)172 (306)
(633
)362
(23)
24
1,30
0(1
,350
)18
9(7
7)
10(7
4)10
(74)
(889) 78
(133) 22(324) 41
227
(104
)56
0(7
50)
47 (339)8 (45)
(432
)368
(41)
108
845
(1,2
38)
463
(157
)19 (224)10 (129)
(251
)460
(59)
130
393
(1,1
94)
463
(171
)
19 (224)7 (97)
(217
)543
(959
)2,2
94
(522) 76(0) 0
(62)
137
(1,3
33)2
,173
(455
)63
137 (62)90 (42)
(803) 60
(198
)542
(1,7
16)1
,844
(141
)19
(469
)74
615 (699)320 (155)
(1,078) 774(117) 229
22(1
43)
40(2
71)
(0)0
(682
)635 Pr
ojec
ted
2027
Bui
ldTr
affic
Con
ditio
ns(S
iteD
rivew
ays)
Driveway Reference NumberX
XX
Existing Roadway LaneageLEGEND
AM Peak Hour Traffic VolumesPM Peak Hour Traffic Volumes(XX)
Existing Traffic Signal
Proposed Traffic Signal
Proposed Roadway Laneage
Proposed Site DrivewayProposed Parking Deck Entrance
(310
)589
(0)0
310
(1,2
53)
89(4
0)
0 (0)0 (0)
(400
)56
(401
)57
0 (0)250 (630)90 (51)
(30) 46(1,199) 574
1 (11)330 (605)
19(1
43)
28(1
47)
(53) 90(1,047) 355
319 (155)508 (437)
Mitchell Street
Ted
Turn
erD
rive
(117) 229(618) 333
90 (52)196 (194)
0(0
)89
(40)
0(0
)
Ric
hard
B.R
usse
llPl
aza
PP
P
P
P
P
P
182 (95)332 (508)65 (9)
(53) 90(889) 428(405) 86
18(1
43)
27(1
95)
76(5
95)

30 Ted Turner Drive DRI #2758 - Transportation Analysis
015170030 December 201730
Based on the Projected 2027 Build conditions, if the Transportation Demand Management measuresare not implemented, the following geometric intersection improvements would be required for all studyintersections to operate at or above acceptable levels-of-service:
Off-Site Intersections
· Intersection #5: Ted Turner Drive at Martin Luther King Jr. Driveo Restripe south leg of intersection to include one (1) northbound shared left-turn/through
lane, two (2) northbound exclusive through lanes and one (1) southbound egress lane.o Restripe east leg of intersection to include one (1) westbound shared left-turn/through
lane, one (1) westbound exclusive through lane, one (1) westbound exclusive right-turnlane.
· Intersection #9: Forsyth Street at Alabama Streeto Add protected/permissive phasing for the northbound left-turn movement during the AM
peak hour.
· Intersection #10: Ted Turner Drive at Marietta Streeto Restripe west leg of intersection to include two (2) eastbound exclusive through lanes,
two (2) eastbound exclusive left-turn lanes, and two (2) westbound egress lanes.o Restripe westbound approach to provide two (2) exclusive through lanes and one (1)
exclusive right-turn lane.
· Intersection #11: Forsyth Street at Marietta Streeto Construct one (1) exclusive eastbound left-turn lane.o Construct one (1) exclusive westbound left-turn lane.
· Intersection #12: Ted Turner Drive at Peters Street / Trinity Avenueo Restripe east leg of intersection to include one (1) exclusive westbound left-turn lane,
one (1) westbound shared through/right-turn lane with channelization, and one (1)eastbound egress lane.
o Realign the northbound approach stop bar to modify pedestrian crosswalk to allow forshorter pedestrian crossing time.
· Intersection #13: Ted Turner Drive at Mitchell Streeto Construct an additional eastbound through lane.o Remove one lane of on-street parking east of Ted Turner Drive.o Restripe the southbound approach to provide an exclusive left-turn lane and a shared
through/right-turn lane.
· Intersection #14: Northside Drive at Martin Luther King Jr. Drive / Mitchell Streeto Construct an exclusive northbound right-turn lane.
30 Ted Turner Drive DRI #2758 - Transportation Analysis
015170030 December 201731
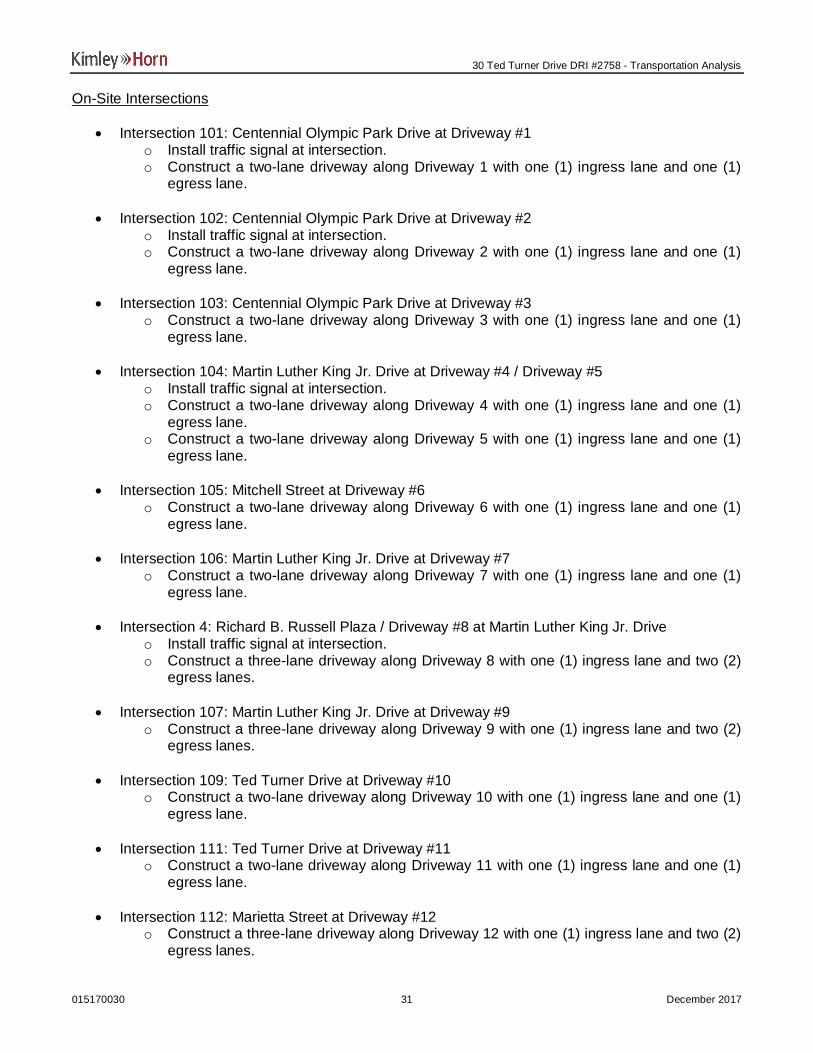
On-Site Intersections
· Intersection 101: Centennial Olympic Park Drive at Driveway #1o Install traffic signal at intersection.o Construct a two-lane driveway along Driveway 1 with one (1) ingress lane and one (1)
egress lane.
· Intersection 102: Centennial Olympic Park Drive at Driveway #2o Install traffic signal at intersection.o Construct a two-lane driveway along Driveway 2 with one (1) ingress lane and one (1)
egress lane.
· Intersection 103: Centennial Olympic Park Drive at Driveway #3o Construct a two-lane driveway along Driveway 3 with one (1) ingress lane and one (1)
egress lane.
· Intersection 104: Martin Luther King Jr. Drive at Driveway #4 / Driveway #5o Install traffic signal at intersection.o Construct a two-lane driveway along Driveway 4 with one (1) ingress lane and one (1)
egress lane.o Construct a two-lane driveway along Driveway 5 with one (1) ingress lane and one (1)
egress lane.
· Intersection 105: Mitchell Street at Driveway #6o Construct a two-lane driveway along Driveway 6 with one (1) ingress lane and one (1)
egress lane.
· Intersection 106: Martin Luther King Jr. Drive at Driveway #7o Construct a two-lane driveway along Driveway 7 with one (1) ingress lane and one (1)
egress lane.
· Intersection 4: Richard B. Russell Plaza / Driveway #8 at Martin Luther King Jr. Driveo Install traffic signal at intersection.o Construct a three-lane driveway along Driveway 8 with one (1) ingress lane and two (2)
egress lanes.
· Intersection 107: Martin Luther King Jr. Drive at Driveway #9o Construct a three-lane driveway along Driveway 9 with one (1) ingress lane and two (2)
egress lanes.
· Intersection 109: Ted Turner Drive at Driveway #10o Construct a two-lane driveway along Driveway 10 with one (1) ingress lane and one (1)
egress lane.
· Intersection 111: Ted Turner Drive at Driveway #11o Construct a two-lane driveway along Driveway 11 with one (1) ingress lane and one (1)
egress lane.
· Intersection 112: Marietta Street at Driveway #12o Construct a three-lane driveway along Driveway 12 with one (1) ingress lane and two (2)
egress lanes.
30 Ted Turner Drive DRI #2758 - Transportation Analysis
015170030 December 201732
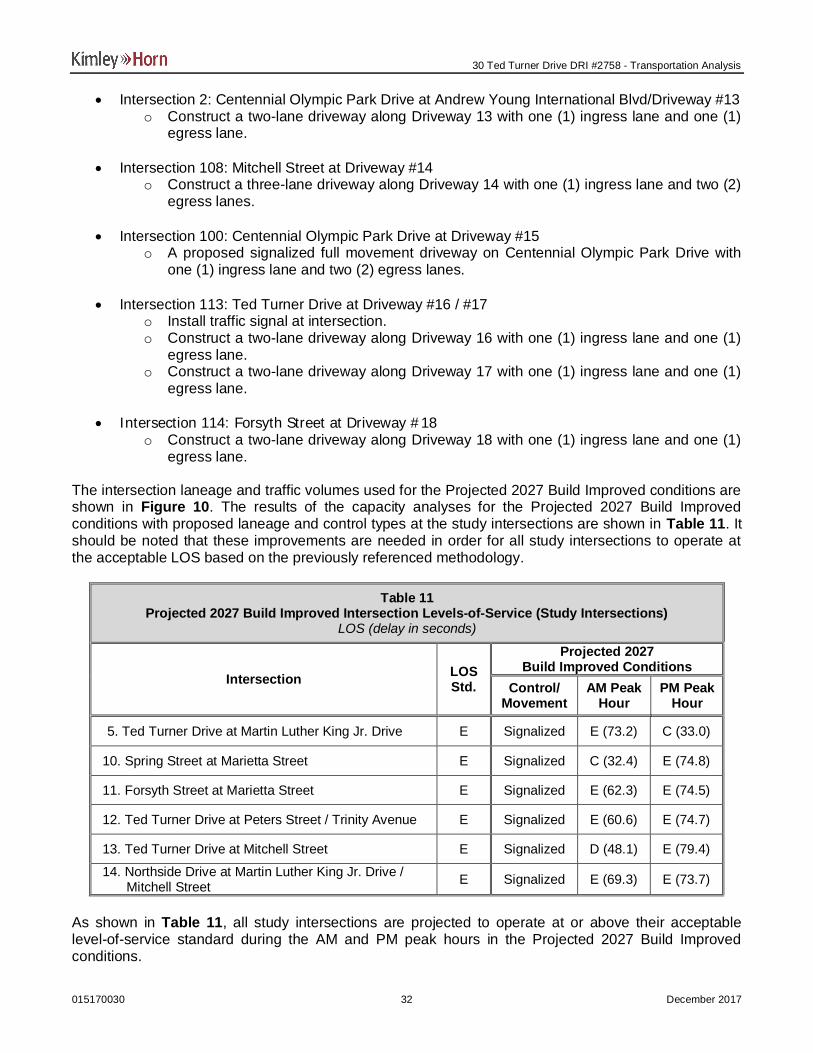
· Intersection 2: Centennial Olympic Park Drive at Andrew Young International Blvd/Driveway #13o Construct a two-lane driveway along Driveway 13 with one (1) ingress lane and one (1)
egress lane.
· Intersection 108: Mitchell Street at Driveway #14o Construct a three-lane driveway along Driveway 14 with one (1) ingress lane and two (2)
egress lanes.
· Intersection 100: Centennial Olympic Park Drive at Driveway #15o A proposed signalized full movement driveway on Centennial Olympic Park Drive with
one (1) ingress lane and two (2) egress lanes.
· Intersection 113: Ted Turner Drive at Driveway #16 / #17o Install traffic signal at intersection.o Construct a two-lane driveway along Driveway 16 with one (1) ingress lane and one (1)
egress lane.o Construct a two-lane driveway along Driveway 17 with one (1) ingress lane and one (1)
egress lane.
· Intersection 114: Forsyth Street at Driveway #18o Construct a two-lane driveway along Driveway 18 with one (1) ingress lane and one (1)
egress lane.
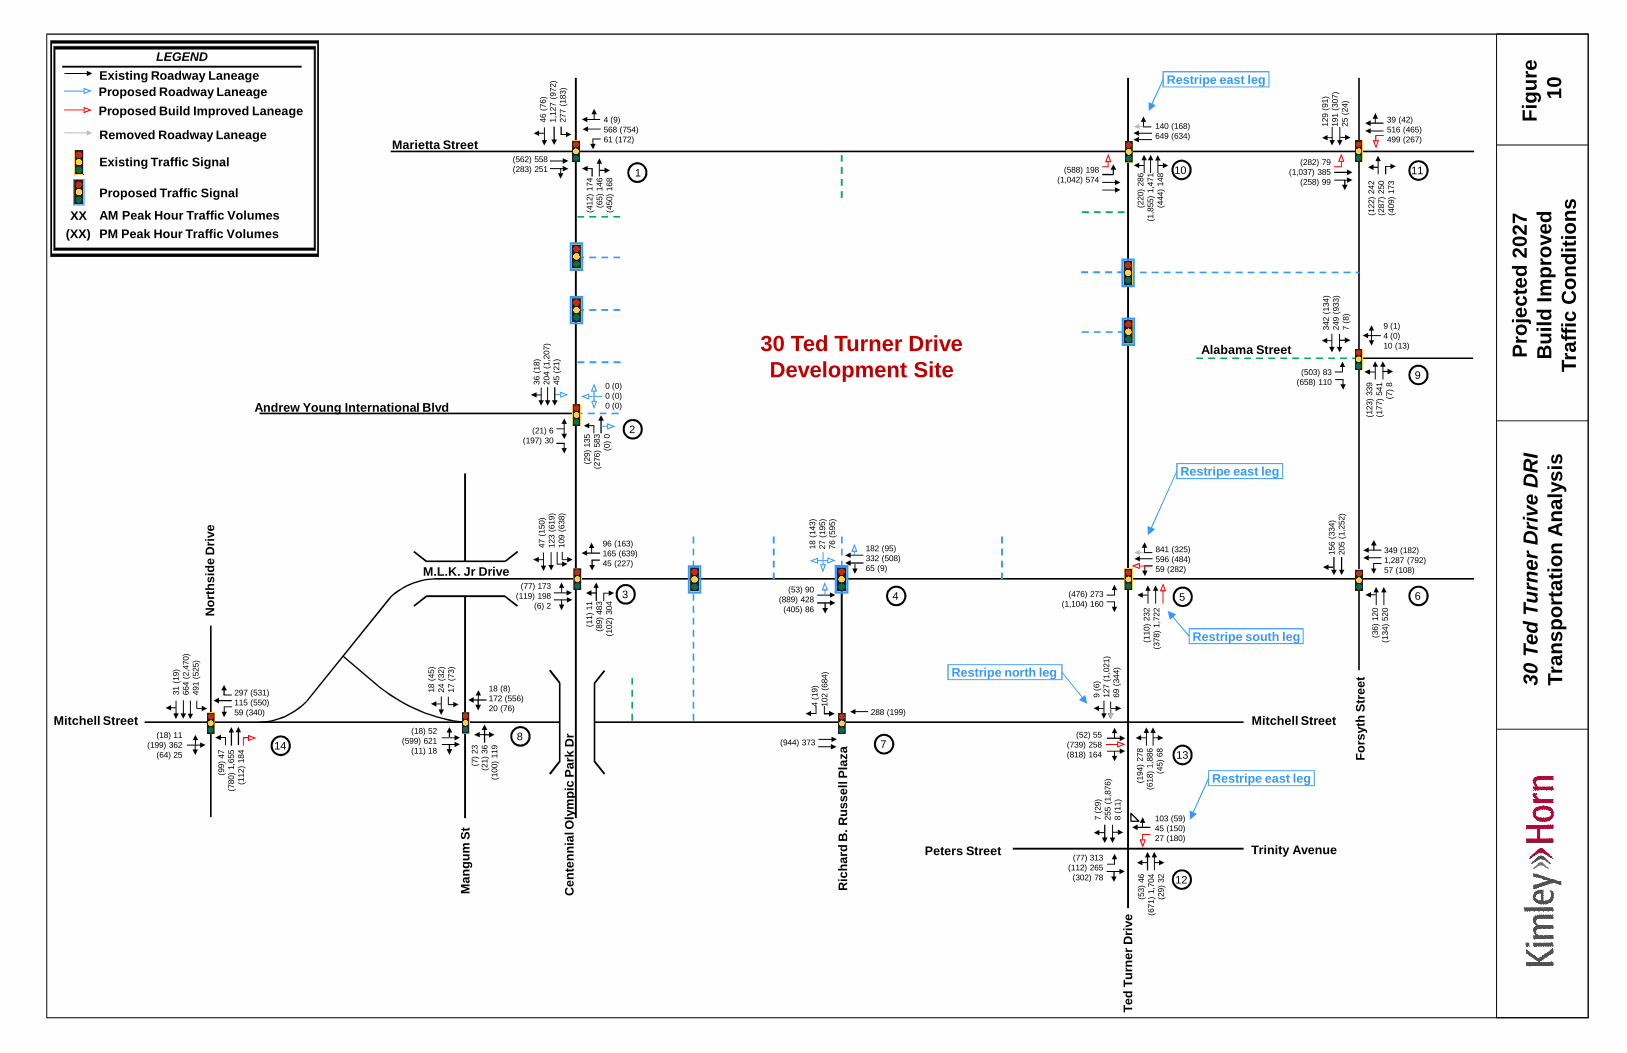
The intersection laneage and traffic volumes used for the Projected 2027 Build Improved conditions areshown in Figure 10. The results of the capacity analyses for the Projected 2027 Build Improvedconditions with proposed laneage and control types at the study intersections are shown in Table 11. Itshould be noted that these improvements are needed in order for all study intersections to operate atthe acceptable LOS based on the previously referenced methodology.
Table 11Projected 2027 Build Improved Intersection Levels-of-Service (Study Intersections)
LOS (delay in seconds)
Intersection LOSStd.
Projected 2027Build Improved Conditions
Control/Movement
AM PeakHour
PM PeakHour
5. Ted Turner Drive at Martin Luther King Jr. Drive E Signalized E (73.2) C (33.0)
10. Spring Street at Marietta Street E Signalized C (32.4) E (74.8)
11. Forsyth Street at Marietta Street E Signalized E (62.3) E (74.5)
12. Ted Turner Drive at Peters Street / Trinity Avenue E Signalized E (60.6) E (74.7)
13. Ted Turner Drive at Mitchell Street E Signalized D (48.1) E (79.4)
14. Northside Drive at Martin Luther King Jr. Drive /Mitchell Street E Signalized E (69.3) E (73.7)
As shown in Table 11, all study intersections are projected to operate at or above their acceptablelevel-of-service standard during the AM and PM peak hours in the Projected 2027 Build Improvedconditions.
Proj
ecte
d20
27B
uild
Impr
oved
Traf
ficC
ondi
tions
Figu
re10
182 (95)332 (508)65 (9)
(53) 90(889) 428(405) 86
1
2
3
87
4 5 6
9
1110
Marietta Street
Mitchell Street
Cen
tenn
ialO
lym
pic
Park
Dr
Ric
hard
B.R
usse
llPl
aza
Alabama Street
Andrew Young International Blvd
1413
12
Mitchell Street
Trinity AvenuePeters Street
Ted
Turn
erD
rive
Fors
yth
Stre
et
(29)
135
(276
)583
(0)0
36(1
8)20
4(1
,207
)45
(21)
(21) 6(197) 30
96 (163)165 (639)45 (227)
(11)
11(8
9)48
3(1
02)3
04
47(1
50)
123
(619
)10
9(6
38)
(77) 173(119) 198
(6) 2
18 (8)172 (556)20 (76)
(7)2
3(2
1)36
(100
)119
18(4
5)24
(32)
17(7
3)
(18) 52(599) 621
(11) 18
288 (199)
4(1
9)10
2(6
84)
(944) 373
349 (182)1,287 (792)57 (108)
(36)
120
(134
)520
156
(334
)20
5(1
,252
)
9 (1)4 (0)10 (13)
(123
)339
(177
)541
(7)8
342
(134
)24
9(9
33)
7(8
)
(503) 83(658) 110
39 (42)516 (465)499 (267)
(122
)242
(287
)250
(409
)173
129
(91)
191
(307
)25
(24)
(282) 79(1,037) 385
(258) 99
4 (9)568 (754)61 (172)
(412
)174
(65)
146
(450
)168
46(7
6)1,
127
(972
)27
7(1
83)
(562) 558(283) 251
297 (531)115 (550)59 (340)
(99)
47(7
80)1
,655
(112
)184
31(1
9)66
4(2
,470
)49
1(5
25)
(18) 11(199) 362
(64) 25
(194
)278
(618
)1,8
86(4
5)68
9(6
)12
7(1
,021
)69
(344
)
(52) 55(739) 258(818) 164
103 (59)45 (150)27 (180)
(53)
46(6
71)1
,704
(29)
32
7(2
9)25
5(1
,876
)8
(11)
(77) 313(112) 265(302) 78
M.L.K. Jr Drive
30 Ted Turner DriveDevelopment Site
Nor
thsi
deD
rive
Man
gum
St
30Te
dTu
rner
Driv
eD
RI
Tran
spor
tatio
nA
naly
sis
XX
Existing Roadway LaneageLEGEND
AM Peak Hour Traffic VolumesPM Peak Hour Traffic Volumes(XX)
Existing Traffic Signal
Proposed Traffic Signal
Proposed Roadway Laneage
18(1
43)
27(1
95)
76(5
95)
0 (0)0 (0)0 (0)
Proposed Build Improved Laneage
841 (325)596 (484)59 (282)
(110
)232
(378
)1,7
22
(476) 273(1,104) 160
140 (168)649 (634)
(220
)286
(1,8
55)1
,471
(444
)148
(588) 198(1,042) 574
Removed Roadway Laneage
Restripe east leg
Restripe south leg
Restripe north leg
Restripe east leg
Restripe east leg
30 Ted Turner Drive DRI #2758 - Transportation Analysis
015170030 December 201734
6.4 Projected 2027 Build Conditions – Alternative Analysis
A Projected 2027 Build Conditions – Alternative Analysis was performed as a method to mitigate trafficimpacts by measures other than roadway improvements. The central business district is geometricallyconstrained and traditional roadway improvements that require widening are not always feasible. Inorder to experience considerable economic growth in the urban core, travel patterns must shift to othermodes and off-peak times.
The higher alternative mode reduction was chosen to reflect an aggressive promotion by the applicantto NOT promote or focus on automobile traffic. The applicant is proposing to provide reduced parkingbased on the size of the development. The reduced parking as well as other measures ofTransportation Demand Management will encourage many users NOT to use their car. The purpose ofthis alternative analysis is to identify the development’s impact to the roadway network based on anelevated emphasis on alternative modes.
The proposed redevelopment is strategically located between two MARTA stations, Five Points andDome/GWCC/Phillips Arena/CNN Center Station. The applicant is committed to continuing a workingrelationship with MARTA. Improved access to the Dome/GWCC/Philips Arena/CNN Center Station isproposed to include a new ticketing concourse on the south side of the station beneath CentennialOlympic Park Drive with vertical circulation on the development site to provide direct ingress andegress. This provides a direct connection to the existing MARTA station and reduces the potentialpedestrian crossings on Centennial Olympic Park Drive. Improved access is also proposed from theFive Points station from Forsyth Street to the development. A letter of support from MARTA is includedin Appendix F.
Additional physical measures being considered to encourage alternative modes include:· Providing portals in the lobbies and elevators with real time transit and weather information.· Providing one-site wayfinding and signage to/from transit stops/stations.· Providing bicycle valet or racks within furniture zones, parking decks and buildings for
employees, customers, and residents.· Providing long-term secure bicycle parking located adjacent to building entrances.· Providing shower/changing facilities for all office tenants.· Providing bike share programs on-site.· Providing dedicated ride-share drop-off and pick-up zones.· Providing dedicated local and regional bus drop-off and pick-up zones.
Program and policy measures that are being considered to encourage alternative modes:· Providing an on-site transportation coordinator or mobility concierge to facilitate alternative
modes.· Providing preferential parking spaces for vanpool riders.· Providing a carpool or vanpool matching service to help employees or residents locate
carpool/vanpool partners.· Requiring office tenants to provide or subsidize MARTA passes (or other transit agencies) for
their employees through their lease agreements.· Providing an electric bicycle program for residential tenants.· Unbundling parking for residents, requiring users to pay costs directly.· Providing Zipcar or other car-sharing service.· Encouraging the use of shuttles or circulators from urban and suburban centers to the site.· Encouraging telecommute or alternative work arrangements –
o Flexible/Staggered Work Hourso Compressed and alternative work week
30 Ted Turner Drive DRI #2758 - Transportation Analysis
015170030 December 201735
The alternative analysis incorporates the following changes:· Increased alternative mode reduction of 46.4% for the office land use and 41.1% for residential
and retail land uses (increase of 10% from baseline methodology).· 25% reduction of the AM/PM peak hour trip generation for the office land use.
The increase in alternative mode reduction acknowledges the expanded transit promotion that will be apart of this development as well as the increased pedestrian connectivity. A 10% increase in alternativemodes is considered to be a conservative assumption.
The reduction of the AM and PM peak hour trip generation for the office land use acknowledges thepromotion of alternative work schedules through flex days and flexible hours. Flexible days may includetelecommuting or condensed work weeks. Flexible hours lead to a spreading out of peak hour traffic ascommuters may arrive and leave early or late to avoid the times of peak congestions.
The intersection laneage and traffic volumes used for the Projected 2027 Build Alternative conditionsare shown in Figure 11. The results of the capacity analyses for the Projected 2027 Build Alternativeconditions with proposed laneage and control types are shown in Table 12. Detailed Synchro analysisreports are available upon request.
The Projected 2027 Build Alternative conditions reflect the roadway improvements to meet the level-of-service standard. The following roadway improvements are in place of the off-site roadwayimprovements associated with the Projected 2027 Build conditions:
· Intersection #5: Ted Turner Drive at Martin Luther King Jr. Driveo Restripe south leg of intersection to include one (1) shared left-turn/through lane, two (2)
exclusive through lanes and one (1) southbound egress lane.o Restripe east leg of intersection to include one (1) westbound shared left-turn/through
lane, one (1) westbound exclusive through lane, and one (1) westbound exclusive right-turn lane.
· Intersection #9: Forsyth Street at Alabama Streeto Add protected/permissive phasing for the northbound left-turn movement.
· Intersection #11: Forsyth Street at Marietta Streeto Construct one (1) exclusive eastbound left-turn lane.
· Intersection #12: Ted Turner Drive at Peters Street / Trinity Avenueo Restripe east leg of intersection to include one (1) exclusive westbound left-turn lane,
one (1) westbound through lane, one (1) westbound channelized right-turn lane, and one(1) eastbound egress lane.
· Intersection #13: Ted Turner Drive at Mitchell Streeto Restripe the southbound approach to provide an exclusive left-turn lane and a shared
through/right-turn lane.

30 Ted Turner Drive DRI #2758 - Transportation Analysis
015170030 December 201736
Table 12Projected 2027 Build Alternative Intersection Levels-of-Service (Study Intersections)
LOS (delay in seconds)
Intersection LOSStd.
Projected 2027Build Alternative Conditions
Control/Movement
AM PeakHour
PM PeakHour
1. Centennial Olympic Park Drive at Marietta Street E Signalized D (38.7) D (48.9)
2. Centennial Olympic Park Drive at Andrew YoungInternational Blvd / Driveway #13 E Signalized C (19.7) B (16.1)
3. Centennial Olympic Park Drive at Martin LutherKing Jr. Drive E Signalized C (30.6) C (29.2)
4. Richard B. Russell Plaza / Driveway #8 at MartinLuther King Jr. Drive E Signalized* B (13.1) B (18.4)
5. Ted Turner Drive at Martin Luther King Jr. Drive E Signalized D (47.9) E (59.6)
6. Forsyth Street at Martin Luther King Jr. Drive E Signalized C (28.3) D (34.6)
7. Richard B. Russell Plaza at Mitchell Street E Signalized A (8.7) C (24.5)
8. Mangum Street at Mitchell Street E Signalized B (12.7) B (12.7)
9. Forsyth Street at Alabama Street E Signalized B (19.7) C (28.5)
10. Spring Street at Marietta Street E Signalized C (30.7) E (68.0)
11. Forsyth Street at Marietta Street E Signalized E (66.8) D (39.5))
12. Ted Turner Drive at Peters Street / Trinity Avenue E Signalized E (48.4) E (76.3)
13. Ted Turner Drive at Mitchell Street E Signalized C (29.7) E (76.4))
14. Northside Drive at Martin Luther King Jr. Drive /Mitchell Street E Signalized E (66.8) D (52.1)
*Proposed Traffic Signal
As shown in Table 12, all study intersections are projected to operate at or above their acceptablelevel-of-service standard during the AM and PM peak hours in the Projected 2027 Build Alternativeconditions.
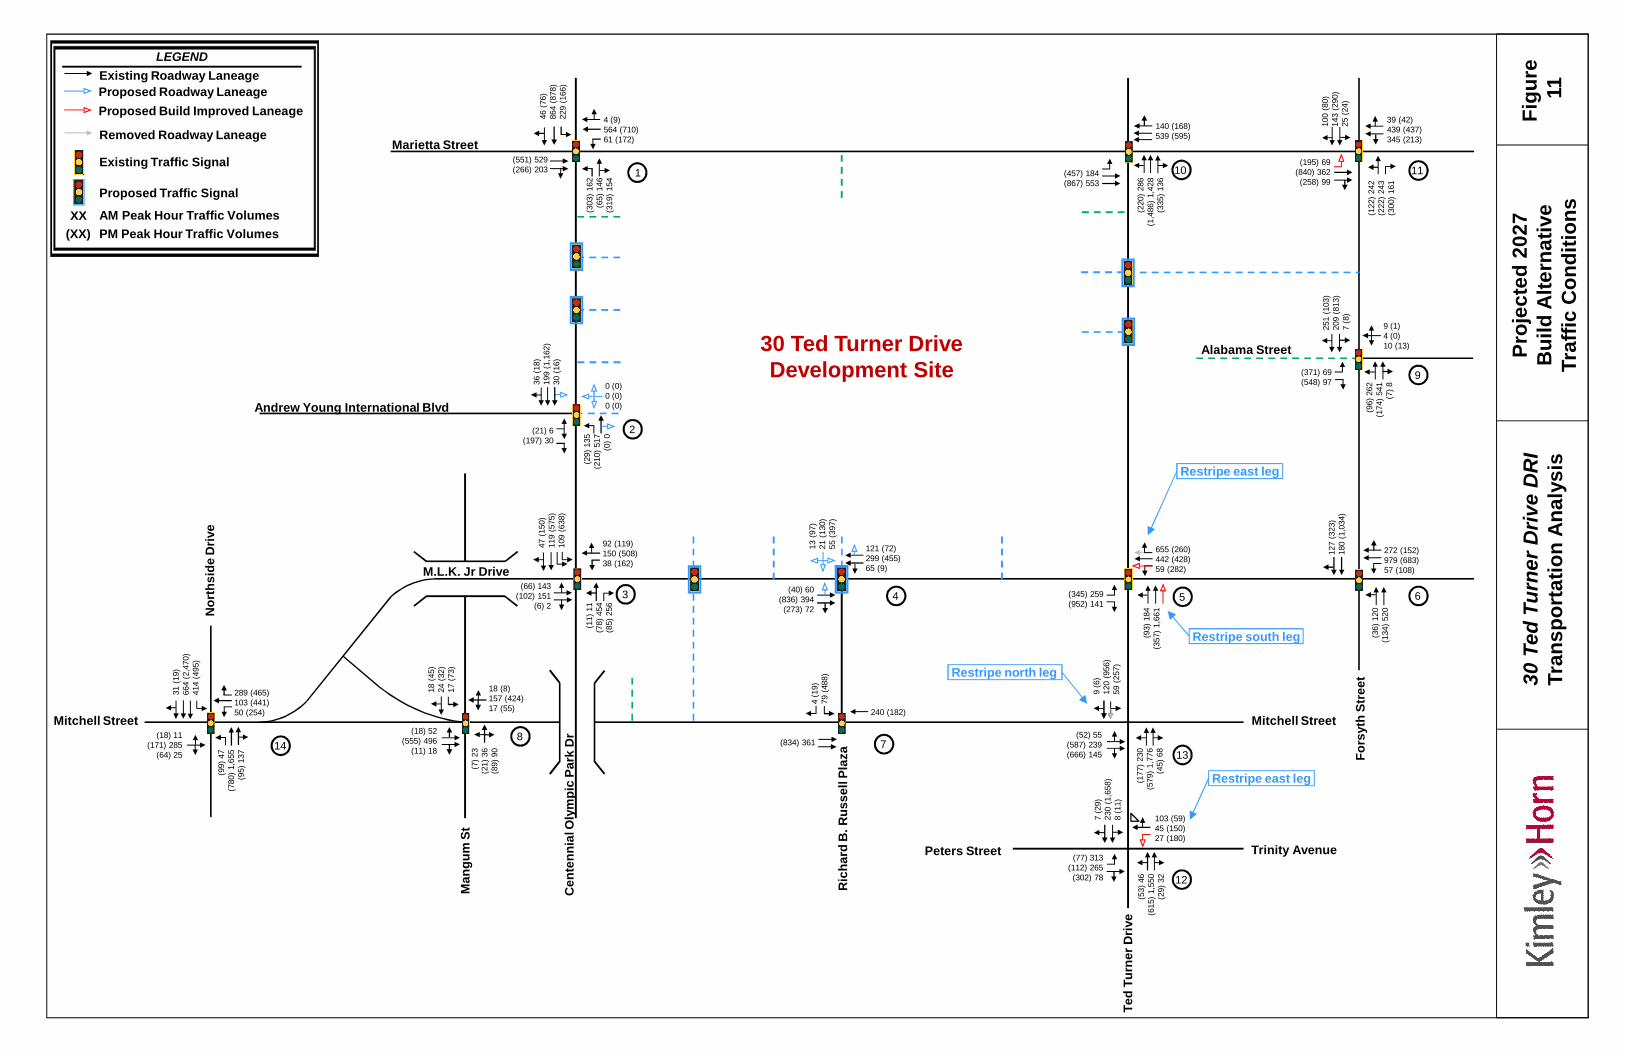
Proj
ecte
d20
27B
uild
Alte
rnat
ive
Traf
ficC
ondi
tions
Figu
re11
121 (72)299 (455)65 (9)
(40) 60(836) 394(273) 72
1
2
3
87
4 5 6
9
1110
Mitchell Street
Cen
tenn
ialO
lym
pic
Park
Dr
Ric
hard
B.R
usse
llPl
aza
Alabama Street
Andrew Young International Blvd
1413
12
Mitchell Street
Trinity AvenuePeters Street
Ted
Turn
erD
rive
Fors
yth
Stre
et
(29)
135
(210
)517
(0)0
36(1
8)19
9(1
,162
)30
(16)
(21) 6(197) 30
92 (119)150 (508)38 (162)
(11)
11(7
8)45
4(8
5)25
6
47(1
50)
119
(575
)10
9(6
38)
(66) 143(102) 151
(6) 2
18 (8)157 (424)17 (55)
(7)2
3(2
1)36
(89)
90
18(4
5)24
(32)
17(7
3)
(18) 52(555) 496
(11) 18
240 (182)
4(1
9)79
(488
)
(834) 361
272 (152)979 (683)57 (108)
(36)
120
(134
)520
127
(323
)18
0(1
,034
)
9 (1)4 (0)10 (13)
(96)
262
(174
)541
(7)8
251
(103
)20
9(8
13)
7(8
)
(371) 69(548) 97
39 (42)439 (437)345 (213)
(122
)242
(222
)243
(300
)161
100
(80)
143
(290
)25
(24)
(195) 69(840) 362(258) 99
140 (168)539 (595)
(220
)286
(1,4
86)1
,428
(335
)136
(457) 184(867) 553
4 (9)564 (710)61 (172)
(303
)162
(65)
146
(319
)154
46(7
6)86
4(8
78)
229
(166
)
(551) 529(266) 203
289 (465)103 (441)50 (254)
(99)
47(7
80)1
,655
(95)
137
31(1
9)66
4(2
,470
)41
4(4
95)
(18) 11(171) 285
(64) 25
(177
)230
(579
)1,7
76(4
5)68
9(6
)12
0(9
56)
59(2
57)
(52) 55(587) 239(666) 145
103 (59)45 (150)27 (180)
(53)
46(6
15)1
,550
(29)
32
7(2
9)23
0(1
,658
)8
(11)
(77) 313(112) 265(302) 78
M.L.K. Jr Drive
30 Ted Turner DriveDevelopment Site
Nor
thsi
deD
rive
Man
gum
St
30Te
dTu
rner
Driv
eD
RI
Tran
spor
tatio
nA
naly
sis
13(9
7)21
(130
)55
(397
)
0 (0)0 (0)0 (0)
655 (260)442 (428)59 (282)
(93)
184
(357
)1,6
61
(345) 259(952) 141
Restripe east leg
Restripe south leg
Restripe north leg
Restripe east leg
XX
Existing Roadway LaneageLEGEND
AM Peak Hour Traffic VolumesPM Peak Hour Traffic Volumes(XX)
Existing Traffic Signal
Proposed Traffic Signal
Proposed Roadway LaneageProposed Build Improved Laneage
Removed Roadway LaneageMarietta Street
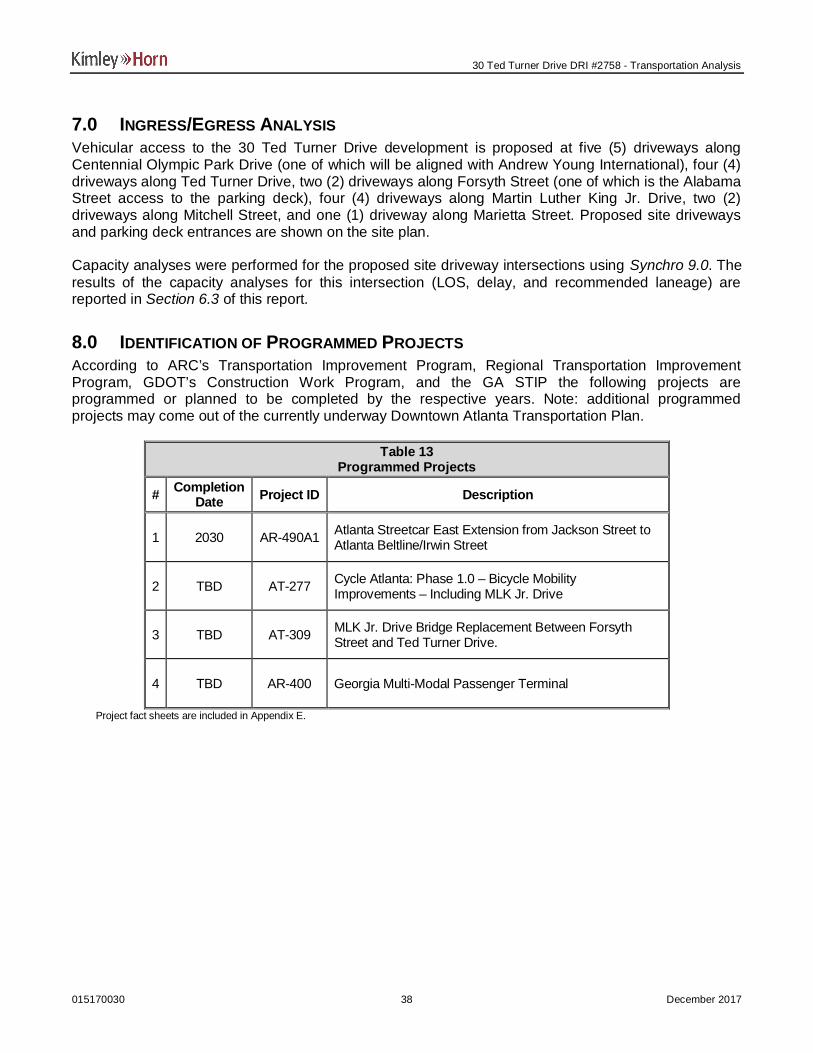
30 Ted Turner Drive DRI #2758 - Transportation Analysis
015170030 December 201738
7.0 INGRESS/EGRESS ANALYSISVehicular access to the 30 Ted Turner Drive development is proposed at five (5) driveways alongCentennial Olympic Park Drive (one of which will be aligned with Andrew Young International), four (4)driveways along Ted Turner Drive, two (2) driveways along Forsyth Street (one of which is the AlabamaStreet access to the parking deck), four (4) driveways along Martin Luther King Jr. Drive, two (2)driveways along Mitchell Street, and one (1) driveway along Marietta Street. Proposed site drivewaysand parking deck entrances are shown on the site plan.
Capacity analyses were performed for the proposed site driveway intersections using Synchro 9.0. Theresults of the capacity analyses for this intersection (LOS, delay, and recommended laneage) arereported in Section 6.3 of this report.
8.0 IDENTIFICATION OF PROGRAMMED PROJECTSAccording to ARC’s Transportation Improvement Program, Regional Transportation ImprovementProgram, GDOT’s Construction Work Program, and the GA STIP the following projects areprogrammed or planned to be completed by the respective years. Note: additional programmedprojects may come out of the currently underway Downtown Atlanta Transportation Plan.
Table 13Programmed Projects
# CompletionDate Project ID Description
1 2030 AR-490A1 Atlanta Streetcar East Extension from Jackson Street toAtlanta Beltline/Irwin Street
2 TBD AT-277 Cycle Atlanta: Phase 1.0 – Bicycle MobilityImprovements – Including MLK Jr. Drive
3 TBD AT-309 MLK Jr. Drive Bridge Replacement Between ForsythStreet and Ted Turner Drive.
4 TBD AR-400 Georgia Multi-Modal Passenger Terminal
Project fact sheets are included in Appendix E.
30 Ted Turner Drive DRI #2758 - Transportation Analysis
015170030 December 201739
9.0 INTERNAL CIRCULATION ANALYSISThe proposed site driveways will provide access to buildings on the site. A detailed copy of theproposed site plan is provided in Appendix B and a full-sized site plan is included in the reportsubmittal.
Mixed-use vehicle trip reductions were taken according to the ITE Trip Generation Handbook, ThirdEdition, 2014. Because the Third Edition does not include guidance on daily internal capture, theSecond Edition, 2004 was used. Total internal capture and vehicle trip reduction between the land usesis expected to be 9.8% daily, 9.2% for the AM peak hour and 5.5% for the PM peak hour because ofthe anticipated interaction between the residential, office, and retail land uses within the proposeddevelopment.
10.0 COMPLIANCE WITH COMPREHENSIVE PLAN ANALYSISThe project site currently consists of surface parking lots, the CNN Center deck, and other parkingfacilities. Per the City of Atlanta Zoning Ordinance Map, the majority of the project site is zoned SpecialPublic Interest (SPI) 1-Sub-area1 with two parcels zoned Mixed residential and commercial (MRC-2-Cand MRC-3-C). Per ARC’s Unified Growth Policy Map (UGPM), the project site is located in a RegionalCenter area type. Additionally, the project site is within and adheres to the recommendations of themost recent Downtown Atlanta LCI (2009) program and is consistent with the Downtown AtlantaTransportation Plan.
11.0 ADDITIONAL CONSIDERATIONSThe DRI traffic study was performed with the assumption that the existing traffic signal infrastructurewould still be in place at the build-out of the 30 Ted Turner Drive development. It is anticipated thatintelligent transportation system improvements may be added to the traffic signal infrastructure in thevicinity of the development that would help mitigate future congestion. The City of Atlanta, under theleadership of the Renew Atlanta bond program, is implementing state of the art traffic managementcontrol to improve traffic operations during peak activity. While the advancements to traffic control wereinitially implemented in response to special events at Philips Arena, Mercedes Benz Stadium, and theGeorgia World Conference Center, peak hour travel will experience benefits as well. A memorandumfrom Renew Atlanta is included in Appendix F.
015170030 A
APPENDIX A
Land Use and Zoning Maps
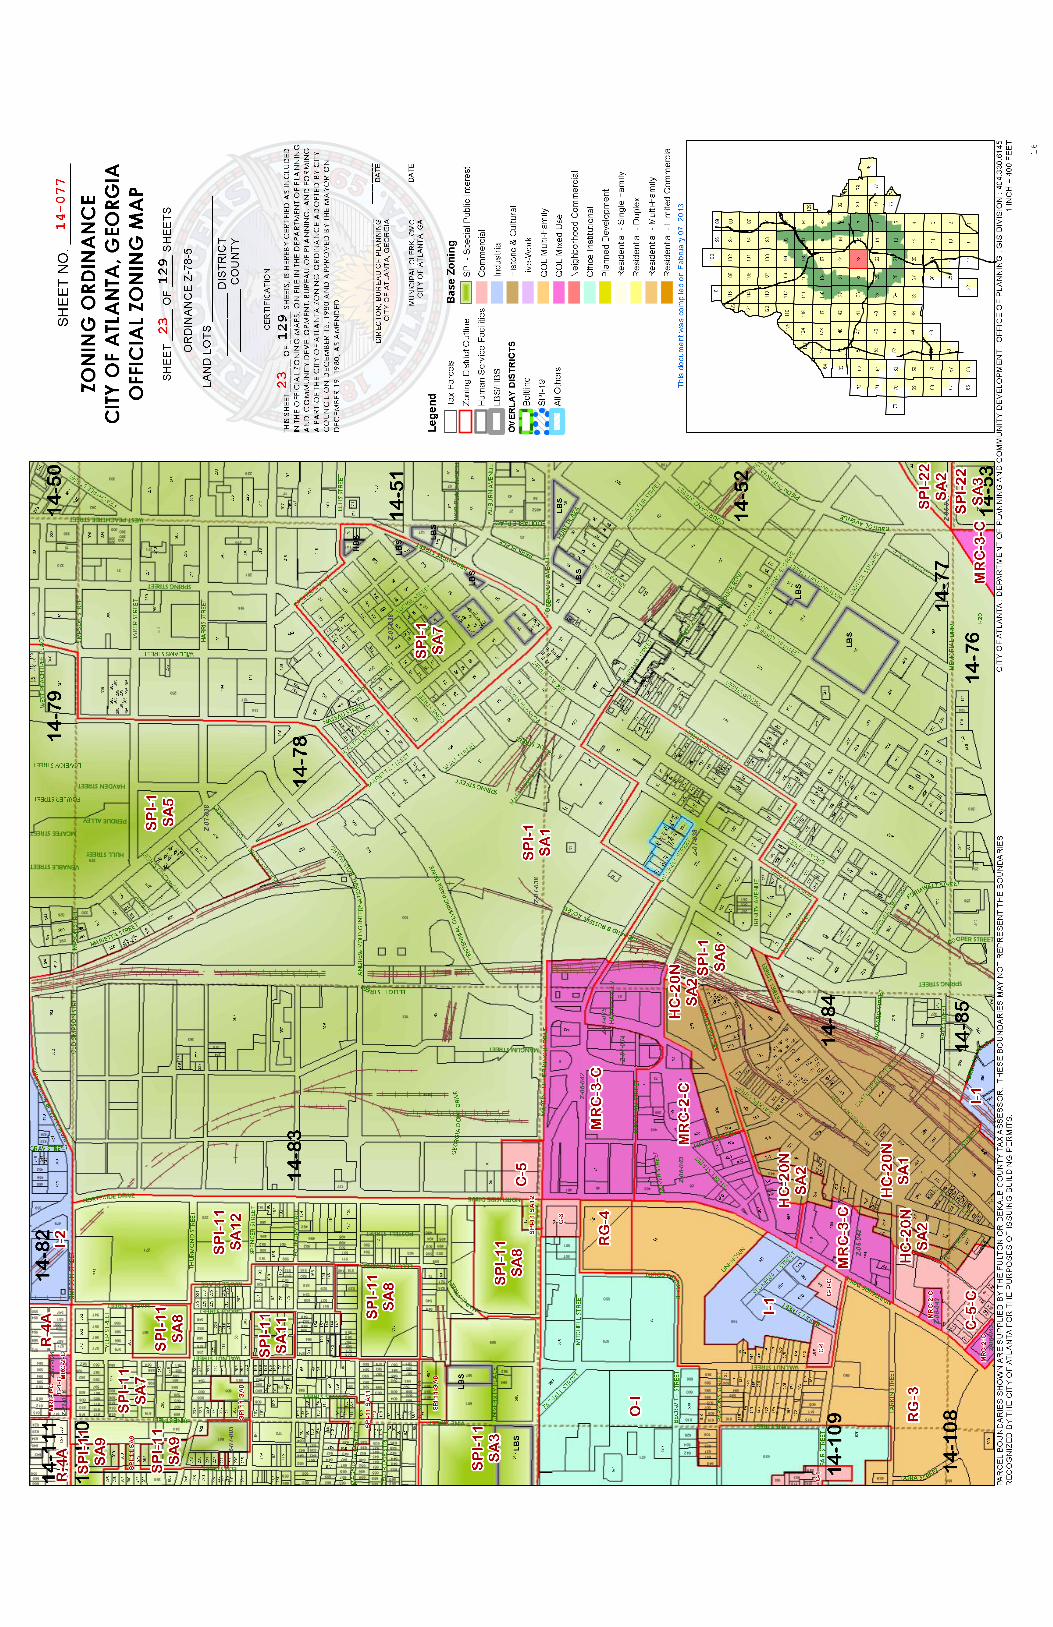
WESTPEACHTREESTREET
COURT
PER STREET
VENABLESTREET
MCAFEESTREET
IDE DRIVE
I
PERDUEALLEY
HULLSTREET
HAYDENSTREET
MAPLEPLACE
GRIGGSSTREET
ELECTRICAVENU
WALNUTSTREET
GRAVESSTREET
POSTELLSTREET
ELMSTREET
SPRINGSTREET
VINESTREET
MAPLESTREET
SPRINGSTREET
NORTHSIDEDRIVE
VINESTREET
WALNUTSTREET
MANGUMSTREET
R
641
656
647642642
260659
635
596
587
580579580
529
637
172
603
600
592
588
561
618
600
593
584
568
556
547
443
516
486220
460
251
326
127
141
300
659
652
644
638
647
639
666
605
590589
550
638
605
600
592
581
569
72
599
595
591589
548
628
616
614
606
601
598
587
572
567564
547550
92461
445
399
503
500506
501
496
327
51
257320
330
170160
637
655 652
646
109626
615
598
585
165
570
636
571
563
544
634
608
598
594
624
610608 606
597
594
590582
567
555551
462
515
499499
127
513
502
339
452
103
370
200
43
127300
303
668
645
662659
663
652
642
609
636
599
588587
541
606
591 593
556
526
520
271
600
576
559
140
193
428
363
124
250
201
323
4852
229
653660658655
647
641643644
641
660656
615
605
599600
569
635
602604
599
584
559
521
601
574235
564
552
534
527 530
640
634
616
605
596583
507
1414
506
500
490
456
432
8
100
374
135
23
67
635
663657
644
655
580
634
616
611607
606
603
593590 587
525
609
596
585584
552
517
610612 611
602
584
571
557
508
503504
494502
479
256
234
108
21615
292
649
642671
665662
651
643
665
642633
616
595
582
637
603 598596595
584 585
575
540
529
600
596
566
548
617617
592
577
566
554
456
48
511
495495
509
492
192
253
225
271
300
180
659
651648
643642
594
594597
601
592
583
567
537
244
607
179
581
570
558
538
523
616615
560
501
507503
496
73
383
234
196
31
27
5617
300300
300
015170030 B
APPENDIX B
Proposed Site Plan

015170030 C
APPENDIX C
Trip Generation Analysis

Land Use Alternate Independent Daily AM Peak Hour PM Peak Hour Variables Available Trips Total In Out Total In Out
Proposed Site Traffic222 High-Rise Apartment 1,000 d.u. persons 3,765 298 75 223 332 203 129310 Hotel 1,500 rooms occ. rooms, employees 13,052 795 469 326 900 459 441710 General Office Building 9,350,000 s.f. employees 41,307 7,219 6,353 866 10,550 1,794 8,756820 Shopping Center 1,000,000 s.f. gross leasable area 30,334 635 394 241 2,802 1,345 1,457
Gross Trips 88,458 8,947 7,291 1,656 14,584 3,801 10,783Residential Trips 3,765 298 75 223 332 203 129
Mixed-Use Reductions -735 -4 -1 -3 -83 -51 -32Alternative Mode Reductions -942 -91 -23 -68 -77 -47 -30Adjusted Residential Trips 2,088 203 51 152 172 105 67
Office Trips 41,307 7,219 6,353 866 10,550 1,794 8,756Mixed-Use Reductions -1,314 -195 -132 -63 -76 -18 -58Alternative Mode Reductions -14,557 -2,557 -2,264 -292 -3,813 -646 -3,166Adjusted Office Trips 25,436 4,467 3,957 511 6,661 1,130 5,532
Retail Trips 30,334 635 394 241 2,802 1,345 1,457Mixed-Use Reductions -4,095 -108 -72 -36 -192 -94 -98Alternative Mode Reductions -8,160 -164 -100 -64 -812 -389 -423Pass By Reductions (Based on ITE Rates) -6,147 0 0 0 -611 -306 -306Adjusted Retail Trips 11,932 363 222 141 1,187 556 630
Mixed-Use Reductions - TOTAL -8,694 -410 -205 -205 -402 -201 -201Alternative Mode Reductions - TOTAL -26,925 -3,027 -2,533 -493 -4,966 -1,213 -3,752Pass-By Reductions - TOTAL -6,147 0 0 0 -611 -306 -306New Trips 46,692 5,510 4,553 958 8,605 2,081 6,524Driveway Volumes 52,839 5,510 4,553 958 9,216 2,387 6,830
k:\amt_civil\015170029_the gulch\eng\traffic\phase ii\analysis\[2017-11-14_gulchdri-analysis-tripgen36%31%-original.xls]trip generation
Trip Generation Analysis (9th Ed. with 2nd Edition Handbook Daily IC & 3rd Edition AM/PM IC)
Intensity
The Gulch DRI - Scenario 8City of Atlanta, Georgia
015170030 D
APPENDIX D
Intersection Volume Worksheets
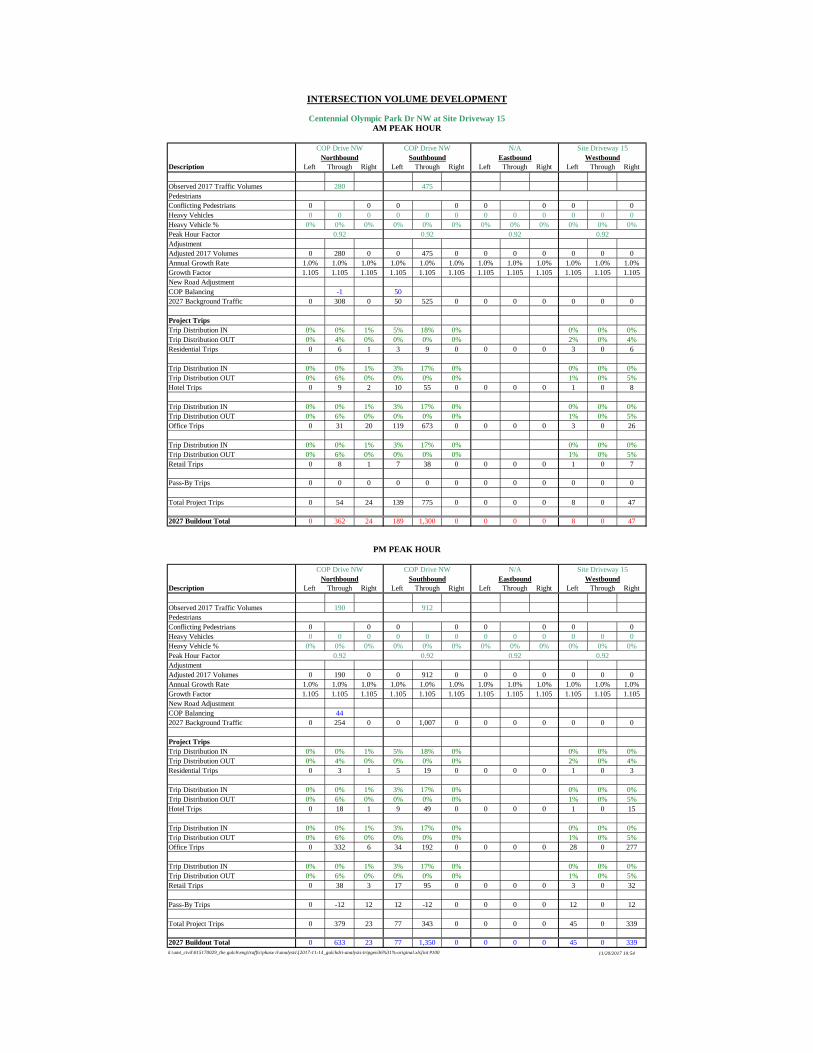
Description Left Through Right Left Through Right Left Through Right Left Through Right
Observed 2017 Traffic Volumes 280 475PedestriansConflicting Pedestrians 0 0 0 0 0 0 0 0Heavy Vehicles 0 0 0 0 0 0 0 0 0 0 0 0Heavy Vehicle % 0% 0% 0% 0% 0% 0% 0% 0% 0% 0% 0% 0%Peak Hour FactorAdjustmentAdjusted 2017 Volumes 0 280 0 0 475 0 0 0 0 0 0 0Annual Growth Rate 1.0% 1.0% 1.0% 1.0% 1.0% 1.0% 1.0% 1.0% 1.0% 1.0% 1.0% 1.0%Growth Factor 1.105 1.105 1.105 1.105 1.105 1.105 1.105 1.105 1.105 1.105 1.105 1.105New Road AdjustmentCOP Balancing -1 502027 Background Traffic 0 308 0 50 525 0 0 0 0 0 0 0
Project TripsTrip Distribution IN 0% 0% 1% 5% 18% 0% 0% 0% 0%Trip Distribution OUT 0% 4% 0% 0% 0% 0% 2% 0% 4%Residential Trips 0 6 1 3 9 0 0 0 0 3 0 6
Trip Distribution IN 0% 0% 1% 3% 17% 0% 0% 0% 0%Trip Distribution OUT 0% 6% 0% 0% 0% 0% 1% 0% 5%Hotel Trips 0 9 2 10 55 0 0 0 0 1 0 8
Trip Distribution IN 0% 0% 1% 3% 17% 0% 0% 0% 0%Trip Distribution OUT 0% 6% 0% 0% 0% 0% 1% 0% 5%Office Trips 0 31 20 119 673 0 0 0 0 3 0 26
Trip Distribution IN 0% 0% 1% 3% 17% 0% 0% 0% 0%Trip Distribution OUT 0% 6% 0% 0% 0% 0% 1% 0% 5%Retail Trips 0 8 1 7 38 0 0 0 0 1 0 7
Pass-By Trips 0 0 0 0 0 0 0 0 0 0 0 0
Total Project Trips 0 54 24 139 775 0 0 0 0 8 0 47
2027 Buildout Total 0 362 24 189 1,300 0 0 0 0 8 0 47
Description Left Through Right Left Through Right Left Through Right Left Through Right
Observed 2017 Traffic Volumes 190 912PedestriansConflicting Pedestrians 0 0 0 0 0 0 0 0Heavy Vehicles 0 0 0 0 0 0 0 0 0 0 0 0Heavy Vehicle % 0% 0% 0% 0% 0% 0% 0% 0% 0% 0% 0% 0%Peak Hour FactorAdjustmentAdjusted 2017 Volumes 0 190 0 0 912 0 0 0 0 0 0 0Annual Growth Rate 1.0% 1.0% 1.0% 1.0% 1.0% 1.0% 1.0% 1.0% 1.0% 1.0% 1.0% 1.0%Growth Factor 1.105 1.105 1.105 1.105 1.105 1.105 1.105 1.105 1.105 1.105 1.105 1.105New Road AdjustmentCOP Balancing 442027 Background Traffic 0 254 0 0 1,007 0 0 0 0 0 0 0
Project TripsTrip Distribution IN 0% 0% 1% 5% 18% 0% 0% 0% 0%Trip Distribution OUT 0% 4% 0% 0% 0% 0% 2% 0% 4%Residential Trips 0 3 1 5 19 0 0 0 0 1 0 3
Trip Distribution IN 0% 0% 1% 3% 17% 0% 0% 0% 0%Trip Distribution OUT 0% 6% 0% 0% 0% 0% 1% 0% 5%Hotel Trips 0 18 1 9 49 0 0 0 0 1 0 15
Trip Distribution IN 0% 0% 1% 3% 17% 0% 0% 0% 0%Trip Distribution OUT 0% 6% 0% 0% 0% 0% 1% 0% 5%Office Trips 0 332 6 34 192 0 0 0 0 28 0 277
Trip Distribution IN 0% 0% 1% 3% 17% 0% 0% 0% 0%Trip Distribution OUT 0% 6% 0% 0% 0% 0% 1% 0% 5%Retail Trips 0 38 3 17 95 0 0 0 0 3 0 32
Pass-By Trips 0 -12 12 12 -12 0 0 0 0 12 0 12
Total Project Trips 0 379 23 77 343 0 0 0 0 45 0 339
2027 Buildout Total 0 633 23 77 1,350 0 0 0 0 45 0 339k:\amt_civil\015170029_the gulch\eng\traffic\phase ii\analysis\[2017-11-14_gulchdri-analysis-tripgen36%31%-original.xls]int #100 11/20/2017 10:54
0.92 0.92 0.92 0.92
PM PEAK HOUR
COP Drive NW COP Drive NW N/A Site Driveway 15Northbound Southbound Eastbound Westbound
0.92 0.92 0.92 0.92
Northbound Southbound Eastbound Westbound
INTERSECTION VOLUME DEVELOPMENT
Centennial Olympic Park Dr NW at Site Driveway 15AM PEAK HOUR
COP Drive NW COP Drive NW N/A Site Driveway 15

Description Left Through Right Left Through Right Left Through Right Left Through Right
Observed 2017 Traffic Volumes 226 36 129 346PedestriansConflicting Pedestrians 0 0 0 0 0 0 0 0Heavy Vehicles 0 0 0 0 0 0 0 0 0 0 0 0Heavy Vehicle % 0% 0% 0% 0% 0% 0% 0% 0% 0% 0% 0% 0%Peak Hour FactorAdjustmentAdjusted 2017 Volumes 0 226 36 129 346 0 0 0 0 0 0 0Annual Growth Rate 1.0% 1.0% 1.0% 1.0% 1.0% 1.0% 1.0% 1.0% 1.0% 1.0% 1.0% 1.0%Growth Factor 1.105 1.105 1.105 1.105 1.105 1.105 1.105 1.105 1.105 1.105 1.105 1.105New Road AdjustmentCOP Balancing 592027 Background Traffic 0 309 40 142 382 0 0 0 0 0 0 0
Project TripsTrip Distribution IN 0.0% 1.0% 2.0% 9.0% 9.0% 0.0% 0.0% 0.0% 0.0%Trip Distribution OUT 0.0% 2.0% 0.0% 0.0% 2.0% 0.0% 1.0% 0.0% 2.0%Residential Trips 0 4 1 5 8 0 0 0 0 2 0 3
Trip Distribution IN 0.0% 0.5% 1.5% 7.0% 10.0% 0.0% 0.0% 0.0% 0.0%Trip Distribution OUT 0.0% 4.0% 0.0% 0.0% 0.5% 0.0% 1.0% 0.0% 2.0%Hotel Trips 0 8 5 23 33 0 0 0 0 2 0 3
Trip Distribution IN 0.0% 0.5% 1.5% 7.0% 10.0% 0.0% 0.0% 0.0% 0.0%Trip Distribution OUT 0.0% 4.0% 0.0% 0.0% 0.5% 0.0% 1.0% 0.0% 2.0%Office Trips 0 40 59 277 399 0 0 0 0 5 0 10
Trip Distribution IN 0.0% 0.5% 1.5% 7.0% 10.0% 0.0% 0.0% 0.0% 0.0%Trip Distribution OUT 0.0% 4.0% 0.0% 0.0% 0.5% 0.0% 1.0% 0.0% 2.0%Retail Trips 0 7 3 16 23 0 0 0 0 1 0 3
Pass-By Trips 0 0 0 0 0 0 0 0 0 0 0 0
Total Project Trips 0 59 68 321 463 0 0 0 0 10 0 19
2027 Buildout Total 0 368 108 463 845 0 0 0 0 10 0 19
Description Left Through Right Left Through Right Left Through Right Left Through Right
Observed 2017 Traffic Volumes 83 949 49 75PedestriansConflicting Pedestrians 0 0 0 0 0 0 0 0Heavy Vehicles 0 0 0 0 0 0 0 0 0 0 0 0Heavy Vehicle % 0% 0% 0% 0% 0% 0% 0% 0% 0% 0% 0% 0%Peak Hour FactorAdjustmentAdjusted 2017 Volumes 0 83 0 0 949 0 0 0 0 49 0 75Annual Growth Rate 1.0% 1.0% 1.0% 1.0% 1.0% 1.0% 1.0% 1.0% 1.0% 1.0% 1.0% 1.0%Growth Factor 1.105 1.105 1.105 1.105 1.105 1.105 1.105 1.105 1.105 1.105 1.105 1.105New Road AdjustmentCOP Balancing 80 -402027 Background Traffic 0 172 0 0 1,008 0 0 0 0 54 0 83
Project TripsTrip Distribution IN 0% 1% 2% 9% 9% 0% 0% 0% 0%Trip Distribution OUT 0% 2% 0% 0% 2% 0% 1% 0% 2%Residential Trips 0 2 2 9 10 0 0 0 0 1 0 1
Trip Distribution IN 0% 1% 2% 7% 10% 0% 0% 0% 0%Trip Distribution OUT 0% 4% 0% 0% 1% 0% 1% 0% 2%Hotel Trips 0 13 4 20 30 0 0 0 0 3 0 6
Trip Distribution IN 0% 1% 2% 7% 10% 0% 0% 0% 0%Trip Distribution OUT 0% 4% 0% 0% 1% 0% 1% 0% 2%Office Trips 0 227 17 79 141 0 0 0 0 55 0 111
Trip Distribution IN 0% 1% 2% 7% 10% 0% 0% 0% 0%Trip Distribution OUT 0% 4% 0% 0% 1% 0% 1% 0% 2%Retail Trips 0 28 8 39 59 0 0 0 0 6 0 13
Pass-By Trips 0 -10 10 10 -10 0 0 0 0 10 0 10
Total Project Trips 0 260 41 157 230 0 0 0 0 75 0 141
2027 Buildout Total 0 432 41 157 1,238 0 0 0 0 129 0 224k:\amt_civil\015170029_the gulch\eng\traffic\phase ii\analysis\[2017-11-14_gulchdri-analysis-tripgen36%31%-original.xls]int #101
INTERSECTION VOLUME DEVELOPMENT
Centennial Olympic Park Dr NW at Site Driveway 1AM PEAK HOUR
COP Drive NW COP Drive NW N/A Site Driveway 1Northbound Southbound Eastbound Westbound
0.92 0.92 0.92 0.92
PM PEAK HOUR
COP Drive NW COP Drive NW N/A Site Driveway 1Northbound Southbound Eastbound Westbound
11/20/2017 10:54
0.92 0.92 0.92 0.92
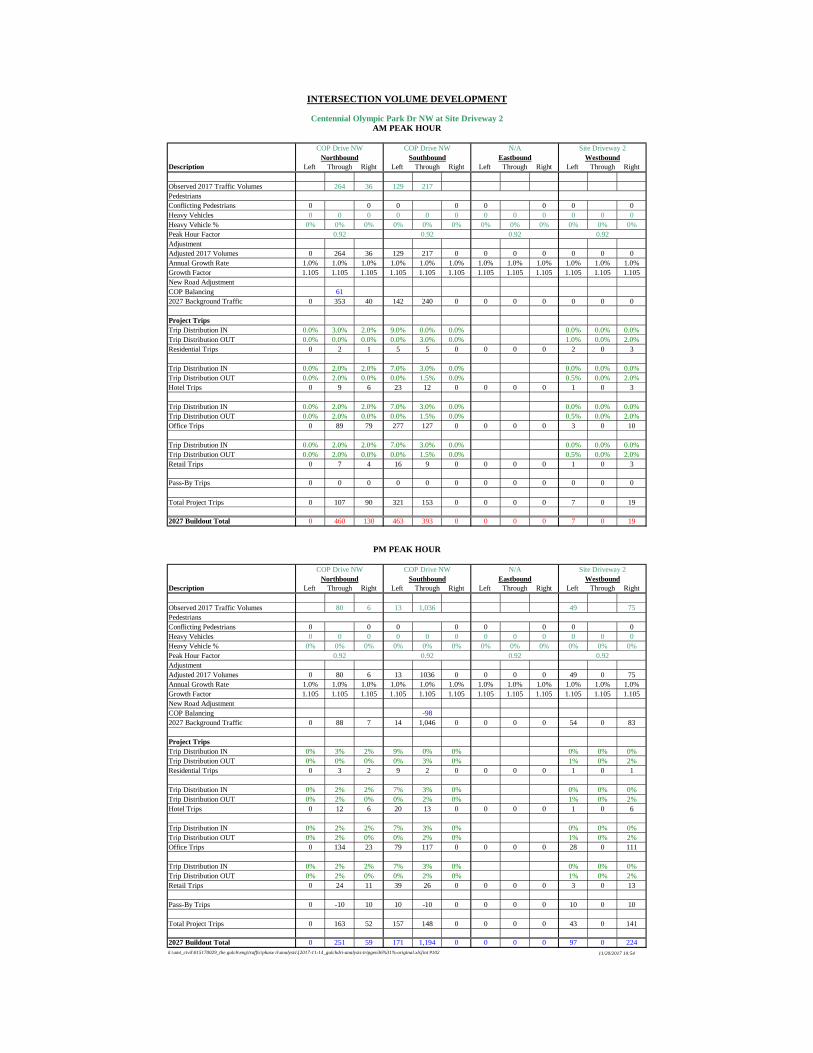
Description Left Through Right Left Through Right Left Through Right Left Through Right
Observed 2017 Traffic Volumes 264 36 129 217PedestriansConflicting Pedestrians 0 0 0 0 0 0 0 0Heavy Vehicles 0 0 0 0 0 0 0 0 0 0 0 0Heavy Vehicle % 0% 0% 0% 0% 0% 0% 0% 0% 0% 0% 0% 0%Peak Hour FactorAdjustmentAdjusted 2017 Volumes 0 264 36 129 217 0 0 0 0 0 0 0Annual Growth Rate 1.0% 1.0% 1.0% 1.0% 1.0% 1.0% 1.0% 1.0% 1.0% 1.0% 1.0% 1.0%Growth Factor 1.105 1.105 1.105 1.105 1.105 1.105 1.105 1.105 1.105 1.105 1.105 1.105New Road AdjustmentCOP Balancing 612027 Background Traffic 0 353 40 142 240 0 0 0 0 0 0 0
Project TripsTrip Distribution IN 0.0% 3.0% 2.0% 9.0% 0.0% 0.0% 0.0% 0.0% 0.0%Trip Distribution OUT 0.0% 0.0% 0.0% 0.0% 3.0% 0.0% 1.0% 0.0% 2.0%Residential Trips 0 2 1 5 5 0 0 0 0 2 0 3
Trip Distribution IN 0.0% 2.0% 2.0% 7.0% 3.0% 0.0% 0.0% 0.0% 0.0%Trip Distribution OUT 0.0% 2.0% 0.0% 0.0% 1.5% 0.0% 0.5% 0.0% 2.0%Hotel Trips 0 9 6 23 12 0 0 0 0 1 0 3
Trip Distribution IN 0.0% 2.0% 2.0% 7.0% 3.0% 0.0% 0.0% 0.0% 0.0%Trip Distribution OUT 0.0% 2.0% 0.0% 0.0% 1.5% 0.0% 0.5% 0.0% 2.0%Office Trips 0 89 79 277 127 0 0 0 0 3 0 10
Trip Distribution IN 0.0% 2.0% 2.0% 7.0% 3.0% 0.0% 0.0% 0.0% 0.0%Trip Distribution OUT 0.0% 2.0% 0.0% 0.0% 1.5% 0.0% 0.5% 0.0% 2.0%Retail Trips 0 7 4 16 9 0 0 0 0 1 0 3
Pass-By Trips 0 0 0 0 0 0 0 0 0 0 0 0
Total Project Trips 0 107 90 321 153 0 0 0 0 7 0 19
2027 Buildout Total 0 460 130 463 393 0 0 0 0 7 0 19
Description Left Through Right Left Through Right Left Through Right Left Through Right
Observed 2017 Traffic Volumes 80 6 13 1,036 49 75PedestriansConflicting Pedestrians 0 0 0 0 0 0 0 0Heavy Vehicles 0 0 0 0 0 0 0 0 0 0 0 0Heavy Vehicle % 0% 0% 0% 0% 0% 0% 0% 0% 0% 0% 0% 0%Peak Hour FactorAdjustmentAdjusted 2017 Volumes 0 80 6 13 1036 0 0 0 0 49 0 75Annual Growth Rate 1.0% 1.0% 1.0% 1.0% 1.0% 1.0% 1.0% 1.0% 1.0% 1.0% 1.0% 1.0%Growth Factor 1.105 1.105 1.105 1.105 1.105 1.105 1.105 1.105 1.105 1.105 1.105 1.105New Road AdjustmentCOP Balancing -982027 Background Traffic 0 88 7 14 1,046 0 0 0 0 54 0 83
Project TripsTrip Distribution IN 0% 3% 2% 9% 0% 0% 0% 0% 0%Trip Distribution OUT 0% 0% 0% 0% 3% 0% 1% 0% 2%Residential Trips 0 3 2 9 2 0 0 0 0 1 0 1
Trip Distribution IN 0% 2% 2% 7% 3% 0% 0% 0% 0%Trip Distribution OUT 0% 2% 0% 0% 2% 0% 1% 0% 2%Hotel Trips 0 12 6 20 13 0 0 0 0 1 0 6
Trip Distribution IN 0% 2% 2% 7% 3% 0% 0% 0% 0%Trip Distribution OUT 0% 2% 0% 0% 2% 0% 1% 0% 2%Office Trips 0 134 23 79 117 0 0 0 0 28 0 111
Trip Distribution IN 0% 2% 2% 7% 3% 0% 0% 0% 0%Trip Distribution OUT 0% 2% 0% 0% 2% 0% 1% 0% 2%Retail Trips 0 24 11 39 26 0 0 0 0 3 0 13
Pass-By Trips 0 -10 10 10 -10 0 0 0 0 10 0 10
Total Project Trips 0 163 52 157 148 0 0 0 0 43 0 141
2027 Buildout Total 0 251 59 171 1,194 0 0 0 0 97 0 224k:\amt_civil\015170029_the gulch\eng\traffic\phase ii\analysis\[2017-11-14_gulchdri-analysis-tripgen36%31%-original.xls]int #102
INTERSECTION VOLUME DEVELOPMENT
Centennial Olympic Park Dr NW at Site Driveway 2AM PEAK HOUR
COP Drive NW COP Drive NW N/A Site Driveway 2Northbound Southbound Eastbound Westbound
0.92 0.92 0.92 0.92
PM PEAK HOUR
COP Drive NW COP Drive NW N/A Site Driveway 2Northbound Southbound Eastbound Westbound
11/20/2017 10:54
0.92 0.92 0.92 0.92

Description Left Through Right Left Through Right Left Through Right Left Through Right
Observed 2017 Traffic Volumes 353 198PedestriansConflicting Pedestrians 0 0 0 0 0 0 0 0Heavy Vehicles 0 0 0 0 0 0 0 0 0 0 0 0Heavy Vehicle % 0% 0% 0% 0% 0% 0% 0% 0% 0% 0% 0% 0%Peak Hour FactorAdjustmentAdjusted 2017 Volumes 0 353 0 0 198 0 0 0 0 0 0 0Annual Growth Rate 1.0% 1.0% 1.0% 1.0% 1.0% 1.0% 1.0% 1.0% 1.0% 1.0% 1.0% 1.0%Growth Factor 1.105 1.105 1.105 1.105 1.105 1.105 1.105 1.105 1.105 1.105 1.105 1.105New Road AdjustmentCOP Balancing 242027 Background Traffic 0 390 0 0 243 0 0 0 0 0 0 0
Project TripsTrip Distribution IN 0% 5% 0% 0% 0% 0% 0% 0% 0%Trip Distribution OUT 0% 0% 0% 0% 4% 0% 0% 0% 0%Residential Trips 0 3 0 0 6 0 0 0 0 0 0 0
Trip Distribution IN 0% 4% 0% 2% 1% 0% 0% 0% 0%Trip Distribution OUT 0% 2% 0% 0% 2% 0% 0% 0% 0%Hotel Trips 0 16 0 6 6 0 0 0 0 0 0 0
Trip Distribution IN 0% 4% 0% 2% 1% 0% 0% 0% 0%Trip Distribution OUT 0% 2% 0% 0% 2% 0% 0% 0% 0%Office Trips 0 168 0 79 50 0 0 0 0 0 0 0
Trip Distribution IN 0% 4% 0% 2% 1% 0% 0% 0% 0%Trip Distribution OUT 0% 2% 0% 0% 2% 0% 0% 0% 0%Retail Trips 0 12 0 4 5 0 0 0 0 0 0 0
Pass-By Trips 0 0 0 0 0 0 0 0 0 0 0 0
Total Project Trips 0 199 0 89 67 0 0 0 0 0 0 0
2027 Buildout Total 0 589 0 89 310 0 0 0 0 0 0 0
Description Left Through Right Left Through Right Left Through Right Left Through Right
Observed 2017 Traffic Volumes 90 981PedestriansConflicting Pedestrians 0 0 0 0 0 0 0 0Heavy Vehicles 0 0 0 0 0 0 0 0 0 0 0 0Heavy Vehicle % 0% 0% 0% 0% 0% 0% 0% 0% 0% 0% 0% 0%Peak Hour FactorAdjustmentAdjusted 2017 Volumes 0 90 0 0 981 0 0 0 0 0 0 0Annual Growth Rate 1.0% 1.0% 1.0% 1.0% 1.0% 1.0% 1.0% 1.0% 1.0% 1.0% 1.0% 1.0%Growth Factor 1.105 1.105 1.105 1.105 1.105 1.105 1.105 1.105 1.105 1.105 1.105 1.105New Road AdjustmentCOP Balancing -3 162027 Background Traffic 0 96 0 0 1,100 0 0 0 0 0 0 0
Project TripsTrip Distribution IN 0% 5% 0% 0% 0% 0% 0% 0% 0%Trip Distribution OUT 0% 0% 0% 0% 4% 0% 0% 0% 0%Residential Trips 0 5 0 0 3 0 0 0 0 0 0 0
Trip Distribution IN 0% 4% 0% 2% 1% 0% 0% 0% 0%Trip Distribution OUT 0% 2% 0% 0% 2% 0% 0% 0% 0%Hotel Trips 0 18 0 6 9 0 0 0 0 0 0 0
Trip Distribution IN 0% 4% 0% 2% 1% 0% 0% 0% 0%Trip Distribution OUT 0% 2% 0% 0% 2% 0% 0% 0% 0%Office Trips 0 156 0 23 122 0 0 0 0 0 0 0
Trip Distribution IN 0% 4% 0% 2% 1% 0% 0% 0% 0%Trip Distribution OUT 0% 2% 0% 0% 2% 0% 0% 0% 0%Retail Trips 0 35 0 11 19 0 0 0 0 0 0 0
Pass-By Trips 0 0 0 0 0 0 0 0 0 0 0 0
Total Project Trips 0 214 0 40 153 0 0 0 0 0 0 0
2027 Buildout Total 0 310 0 40 1,253 0 0 0 0 0 0 0k:\amt_civil\015170029_the gulch\eng\traffic\phase ii\analysis\[2017-11-14_gulchdri-analysis-tripgen36%31%-original.xls]int #103
INTERSECTION VOLUME DEVELOPMENT
Centennial Olympic Park Dr NW at Site Driveway 3AM PEAK HOUR
COP Drive NW COP Drive NW N/A Site Driveway 3Northbound Southbound Eastbound Westbound
0.92 0.92 0.92 0.92
PM PEAK HOUR
COP Drive NW COP Drive NW N/A Site Driveway 3Northbound Southbound Eastbound Westbound
11/20/2017 10:54
0.92 0.92 0.92 0.92

Description Left Through Right Left Through Right Left Through Right Left Through Right
Observed 2017 Traffic Volumes 304 184PedestriansConflicting Pedestrians 0 0 0 0 0 0 0 0Heavy Vehicles 0 0 0 0 0 0 0 0 0 0 0 0Heavy Vehicle % 0% 0% 0% 0% 0% 0% 0% 0% 0% 0% 0% 0%Peak Hour FactorAdjustmentAdjusted 2017 Volumes 0 0 0 0 0 0 0 304 0 0 184 0Annual Growth Rate 1.0% 1.0% 1.0% 1.0% 1.0% 1.0% 1.0% 1.0% 1.0% 1.0% 1.0% 1.0%Growth Factor 1.105 1.105 1.105 1.105 1.105 1.105 1.105 1.105 1.105 1.105 1.105 1.105New Road AdjustmentMLK Balancing2027 Background Traffic 0 0 0 0 0 0 0 336 0 0 203 0
Project TripsTrip Distribution IN 0% 0% 0% 0% 0% 0% 0% 3% 2% 2% 0% 0%Trip Distribution OUT 5% 0% 6% 0% 0% 0% 0% 0% 0% 0% 4% 0%Residential Trips 8 0 9 0 0 0 0 2 1 1 6 0
Trip Distribution IN 0% 0% 0% 0% 2% 0% 0% 5% 1% 2% 0% 0%Trip Distribution OUT 6% 0% 6% 0% 0% 0% 0% 0% 0% 0% 5% 0%Hotel Trips 9 0 9 0 6 0 0 16 3 6 8 0
Trip Distribution IN 0% 0% 0% 0% 2% 0% 0% 5% 1% 2% 0% 0%Trip Distribution OUT 6% 0% 6% 0% 0% 0% 0% 0% 0% 0% 5% 0%Office Trips 31 0 31 0 79 0 0 198 40 79 26 0
Trip Distribution IN 0% 0% 0% 0% 2% 0% 0% 5% 1% 2% 0% 0%Trip Distribution OUT 6% 0% 6% 0% 0% 0% 0% 0% 0% 0% 5% 0%Retail Trips 8 0 8 0 4 0 0 11 2 4 7 0
Pass-By Trips 0 0 0 0 0 0 0 0 0 0 0 0
Total Project Trips 56 0 57 0 89 0 0 227 46 90 47 0
2027 Buildout Total 56 0 57 0 89 0 0 563 46 90 250 0
Description Left Through Right Left Through Right Left Through Right Left Through Right
Observed 2017 Traffic Volumes 665 282PedestriansConflicting Pedestrians 0 0 0 0 0 0 0 0Heavy Vehicles 0 0 0 0 0 0 0 0 0 0 0 0Heavy Vehicle % 0% 0% 0% 0% 0% 0% 0% 0% 0% 0% 0% 0%Peak Hour FactorAdjustmentAdjusted 2017 Volumes 0 0 0 0 0 0 0 665 0 0 282 0Annual Growth Rate 1.0% 1.0% 1.0% 1.0% 1.0% 1.0% 1.0% 1.0% 1.0% 1.0% 1.0% 1.0%Growth Factor 1.105 1.105 1.105 1.105 1.105 1.105 1.105 1.105 1.105 1.105 1.105 1.105New Road AdjustmentMLK Balancing2027 Background Traffic 0 0 0 0 0 0 0 735 0 0 312 0
Project TripsTrip Distribution IN 0% 0% 0% 0% 0% 0% 0% 3% 2% 2% 0% 0%Trip Distribution OUT 5% 0% 6% 0% 0% 0% 0% 0% 0% 0% 4% 0%Residential Trips 3 0 4 0 0 0 0 3 2 2 3 0
Trip Distribution IN 0% 0% 0% 0% 2% 0% 0% 5% 1% 2% 0% 0%Trip Distribution OUT 6% 0% 6% 0% 0% 0% 0% 0% 0% 0% 5% 0%Hotel Trips 18 0 18 0 6 0 0 15 3 6 15 0
Trip Distribution IN 0% 0% 0% 0% 2% 0% 0% 5% 1% 2% 0% 0%Trip Distribution OUT 6% 0% 6% 0% 0% 0% 0% 0% 0% 0% 5% 0%Office Trips 332 0 332 0 23 0 0 57 11 23 277 0
Trip Distribution IN 0% 0% 0% 0% 2% 0% 0% 5% 1% 2% 0% 0%Trip Distribution OUT 6% 0% 6% 0% 0% 0% 0% 0% 0% 0% 5% 0%Retail Trips 38 0 38 0 11 0 0 28 6 11 32 0
Pass-By Trips 9 0 9 0 0 0 0 -9 9 9 -9 0
Total Project Trips 400 0 401 0 40 0 0 94 31 51 318 0
2027 Buildout Total 400 0 401 0 40 0 0 829 31 51 630 0k:\amt_civil\015170029_the gulch\eng\traffic\phase ii\analysis\[2017-11-14_gulchdri-analysis-tripgen36%31%-original.xls]int #104
INTERSECTION VOLUME DEVELOPMENT
Site Driveway #4 / Site Driveway #5 at MLK Jr DriveAM PEAK HOUR
Site Driveway #5 Site Driveway #4 MLK Jr Drive MLK Jr DriveNorthbound Southbound Eastbound Westbound
0.92 0.92 0.92 0.92
PM PEAK HOUR
Site Driveway #5 Site Driveway #4 MLK Jr Drive MLK Jr DriveNorthbound Southbound Eastbound Westbound
11/20/2017 10:54
0.92 0.92 0.92 0.92
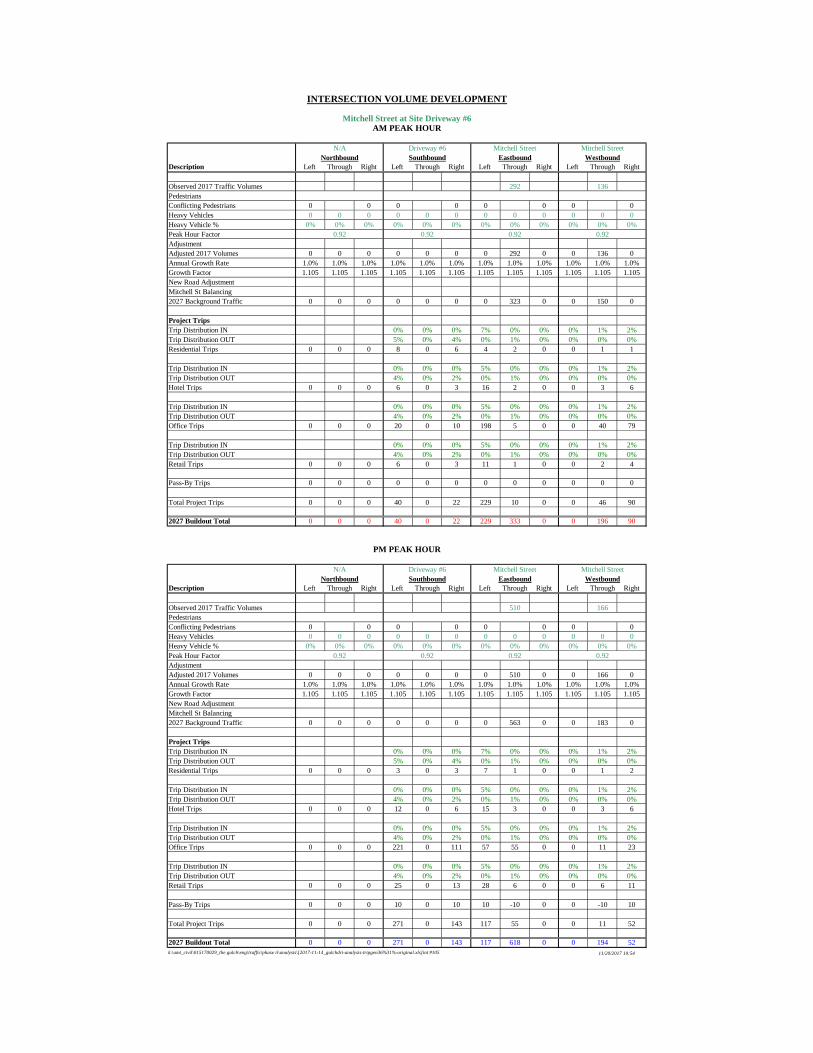
Description Left Through Right Left Through Right Left Through Right Left Through Right
Observed 2017 Traffic Volumes 292 136PedestriansConflicting Pedestrians 0 0 0 0 0 0 0 0Heavy Vehicles 0 0 0 0 0 0 0 0 0 0 0 0Heavy Vehicle % 0% 0% 0% 0% 0% 0% 0% 0% 0% 0% 0% 0%Peak Hour FactorAdjustmentAdjusted 2017 Volumes 0 0 0 0 0 0 0 292 0 0 136 0Annual Growth Rate 1.0% 1.0% 1.0% 1.0% 1.0% 1.0% 1.0% 1.0% 1.0% 1.0% 1.0% 1.0%Growth Factor 1.105 1.105 1.105 1.105 1.105 1.105 1.105 1.105 1.105 1.105 1.105 1.105New Road AdjustmentMitchell St Balancing2027 Background Traffic 0 0 0 0 0 0 0 323 0 0 150 0
Project TripsTrip Distribution IN 0% 0% 0% 7% 0% 0% 0% 1% 2%Trip Distribution OUT 5% 0% 4% 0% 1% 0% 0% 0% 0%Residential Trips 0 0 0 8 0 6 4 2 0 0 1 1
Trip Distribution IN 0% 0% 0% 5% 0% 0% 0% 1% 2%Trip Distribution OUT 4% 0% 2% 0% 1% 0% 0% 0% 0%Hotel Trips 0 0 0 6 0 3 16 2 0 0 3 6
Trip Distribution IN 0% 0% 0% 5% 0% 0% 0% 1% 2%Trip Distribution OUT 4% 0% 2% 0% 1% 0% 0% 0% 0%Office Trips 0 0 0 20 0 10 198 5 0 0 40 79
Trip Distribution IN 0% 0% 0% 5% 0% 0% 0% 1% 2%Trip Distribution OUT 4% 0% 2% 0% 1% 0% 0% 0% 0%Retail Trips 0 0 0 6 0 3 11 1 0 0 2 4
Pass-By Trips 0 0 0 0 0 0 0 0 0 0 0 0
Total Project Trips 0 0 0 40 0 22 229 10 0 0 46 90
2027 Buildout Total 0 0 0 40 0 22 229 333 0 0 196 90
Description Left Through Right Left Through Right Left Through Right Left Through Right
Observed 2017 Traffic Volumes 510 166PedestriansConflicting Pedestrians 0 0 0 0 0 0 0 0Heavy Vehicles 0 0 0 0 0 0 0 0 0 0 0 0Heavy Vehicle % 0% 0% 0% 0% 0% 0% 0% 0% 0% 0% 0% 0%Peak Hour FactorAdjustmentAdjusted 2017 Volumes 0 0 0 0 0 0 0 510 0 0 166 0Annual Growth Rate 1.0% 1.0% 1.0% 1.0% 1.0% 1.0% 1.0% 1.0% 1.0% 1.0% 1.0% 1.0%Growth Factor 1.105 1.105 1.105 1.105 1.105 1.105 1.105 1.105 1.105 1.105 1.105 1.105New Road AdjustmentMitchell St Balancing2027 Background Traffic 0 0 0 0 0 0 0 563 0 0 183 0
Project TripsTrip Distribution IN 0% 0% 0% 7% 0% 0% 0% 1% 2%Trip Distribution OUT 5% 0% 4% 0% 1% 0% 0% 0% 0%Residential Trips 0 0 0 3 0 3 7 1 0 0 1 2
Trip Distribution IN 0% 0% 0% 5% 0% 0% 0% 1% 2%Trip Distribution OUT 4% 0% 2% 0% 1% 0% 0% 0% 0%Hotel Trips 0 0 0 12 0 6 15 3 0 0 3 6
Trip Distribution IN 0% 0% 0% 5% 0% 0% 0% 1% 2%Trip Distribution OUT 4% 0% 2% 0% 1% 0% 0% 0% 0%Office Trips 0 0 0 221 0 111 57 55 0 0 11 23
Trip Distribution IN 0% 0% 0% 5% 0% 0% 0% 1% 2%Trip Distribution OUT 4% 0% 2% 0% 1% 0% 0% 0% 0%Retail Trips 0 0 0 25 0 13 28 6 0 0 6 11
Pass-By Trips 0 0 0 10 0 10 10 -10 0 0 -10 10
Total Project Trips 0 0 0 271 0 143 117 55 0 0 11 52
2027 Buildout Total 0 0 0 271 0 143 117 618 0 0 194 52k:\amt_civil\015170029_the gulch\eng\traffic\phase ii\analysis\[2017-11-14_gulchdri-analysis-tripgen36%31%-original.xls]int #105
INTERSECTION VOLUME DEVELOPMENT
Mitchell Street at Site Driveway #6AM PEAK HOUR
N/A Driveway #6 Mitchell Street Mitchell StreetNorthbound Southbound Eastbound Westbound
0.92 0.92 0.92 0.92
PM PEAK HOUR
N/A Driveway #6 Mitchell Street Mitchell StreetNorthbound Southbound Eastbound Westbound
11/20/2017 10:54
0.92 0.92 0.92 0.92
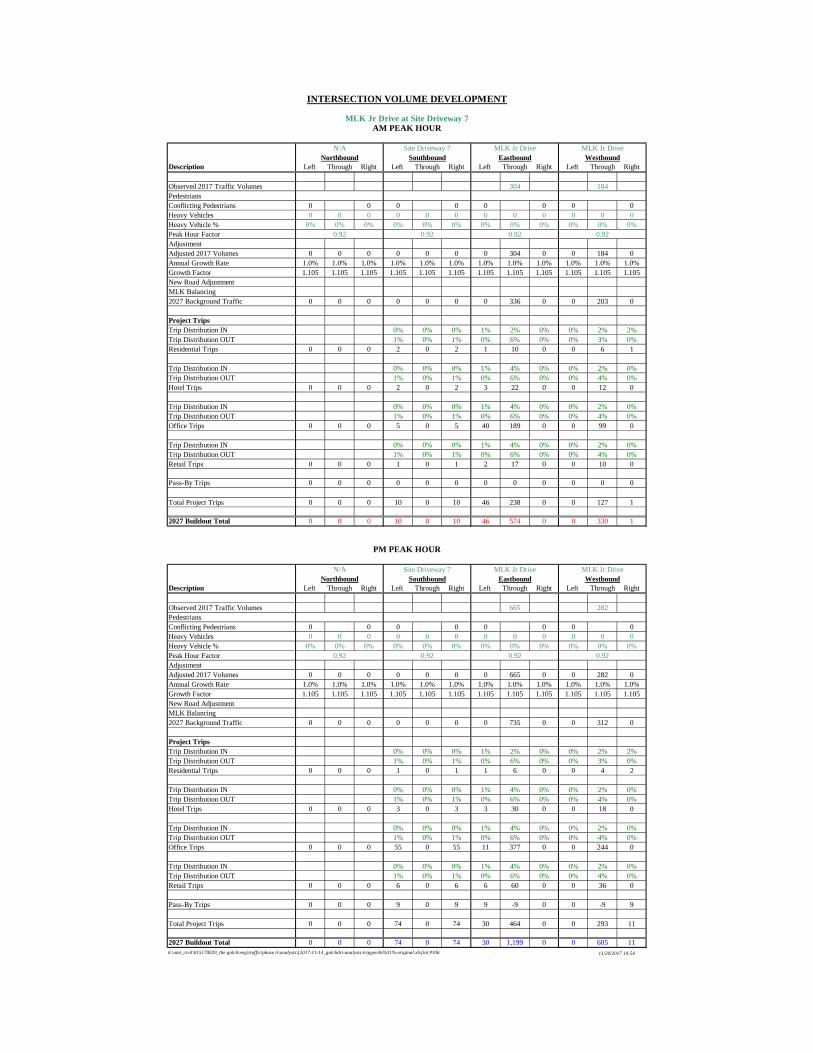
Description Left Through Right Left Through Right Left Through Right Left Through Right
Observed 2017 Traffic Volumes 304 184PedestriansConflicting Pedestrians 0 0 0 0 0 0 0 0Heavy Vehicles 0 0 0 0 0 0 0 0 0 0 0 0Heavy Vehicle % 0% 0% 0% 0% 0% 0% 0% 0% 0% 0% 0% 0%Peak Hour FactorAdjustmentAdjusted 2017 Volumes 0 0 0 0 0 0 0 304 0 0 184 0Annual Growth Rate 1.0% 1.0% 1.0% 1.0% 1.0% 1.0% 1.0% 1.0% 1.0% 1.0% 1.0% 1.0%Growth Factor 1.105 1.105 1.105 1.105 1.105 1.105 1.105 1.105 1.105 1.105 1.105 1.105New Road AdjustmentMLK Balancing2027 Background Traffic 0 0 0 0 0 0 0 336 0 0 203 0
Project TripsTrip Distribution IN 0% 0% 0% 1% 2% 0% 0% 2% 2%Trip Distribution OUT 1% 0% 1% 0% 6% 0% 0% 3% 0%Residential Trips 0 0 0 2 0 2 1 10 0 0 6 1
Trip Distribution IN 0% 0% 0% 1% 4% 0% 0% 2% 0%Trip Distribution OUT 1% 0% 1% 0% 6% 0% 0% 4% 0%Hotel Trips 0 0 0 2 0 2 3 22 0 0 12 0
Trip Distribution IN 0% 0% 0% 1% 4% 0% 0% 2% 0%Trip Distribution OUT 1% 0% 1% 0% 6% 0% 0% 4% 0%Office Trips 0 0 0 5 0 5 40 189 0 0 99 0
Trip Distribution IN 0% 0% 0% 1% 4% 0% 0% 2% 0%Trip Distribution OUT 1% 0% 1% 0% 6% 0% 0% 4% 0%Retail Trips 0 0 0 1 0 1 2 17 0 0 10 0
Pass-By Trips 0 0 0 0 0 0 0 0 0 0 0 0
Total Project Trips 0 0 0 10 0 10 46 238 0 0 127 1
2027 Buildout Total 0 0 0 10 0 10 46 574 0 0 330 1
Description Left Through Right Left Through Right Left Through Right Left Through Right
Observed 2017 Traffic Volumes 665 282PedestriansConflicting Pedestrians 0 0 0 0 0 0 0 0Heavy Vehicles 0 0 0 0 0 0 0 0 0 0 0 0Heavy Vehicle % 0% 0% 0% 0% 0% 0% 0% 0% 0% 0% 0% 0%Peak Hour FactorAdjustmentAdjusted 2017 Volumes 0 0 0 0 0 0 0 665 0 0 282 0Annual Growth Rate 1.0% 1.0% 1.0% 1.0% 1.0% 1.0% 1.0% 1.0% 1.0% 1.0% 1.0% 1.0%Growth Factor 1.105 1.105 1.105 1.105 1.105 1.105 1.105 1.105 1.105 1.105 1.105 1.105New Road AdjustmentMLK Balancing2027 Background Traffic 0 0 0 0 0 0 0 735 0 0 312 0
Project TripsTrip Distribution IN 0% 0% 0% 1% 2% 0% 0% 2% 2%Trip Distribution OUT 1% 0% 1% 0% 6% 0% 0% 3% 0%Residential Trips 0 0 0 1 0 1 1 6 0 0 4 2
Trip Distribution IN 0% 0% 0% 1% 4% 0% 0% 2% 0%Trip Distribution OUT 1% 0% 1% 0% 6% 0% 0% 4% 0%Hotel Trips 0 0 0 3 0 3 3 30 0 0 18 0
Trip Distribution IN 0% 0% 0% 1% 4% 0% 0% 2% 0%Trip Distribution OUT 1% 0% 1% 0% 6% 0% 0% 4% 0%Office Trips 0 0 0 55 0 55 11 377 0 0 244 0
Trip Distribution IN 0% 0% 0% 1% 4% 0% 0% 2% 0%Trip Distribution OUT 1% 0% 1% 0% 6% 0% 0% 4% 0%Retail Trips 0 0 0 6 0 6 6 60 0 0 36 0
Pass-By Trips 0 0 0 9 0 9 9 -9 0 0 -9 9
Total Project Trips 0 0 0 74 0 74 30 464 0 0 293 11
2027 Buildout Total 0 0 0 74 0 74 30 1,199 0 0 605 11k:\amt_civil\015170029_the gulch\eng\traffic\phase ii\analysis\[2017-11-14_gulchdri-analysis-tripgen36%31%-original.xls]int #106
INTERSECTION VOLUME DEVELOPMENT
MLK Jr Drive at Site Driveway 7AM PEAK HOUR
N/A Site Driveway 7 MLK Jr Drive MLK Jr DriveNorthbound Southbound Eastbound Westbound
0.92 0.92 0.92 0.92
PM PEAK HOUR
N/A Site Driveway 7 MLK Jr Drive MLK Jr DriveNorthbound Southbound Eastbound Westbound
11/20/2017 10:54
0.92 0.92 0.92 0.92
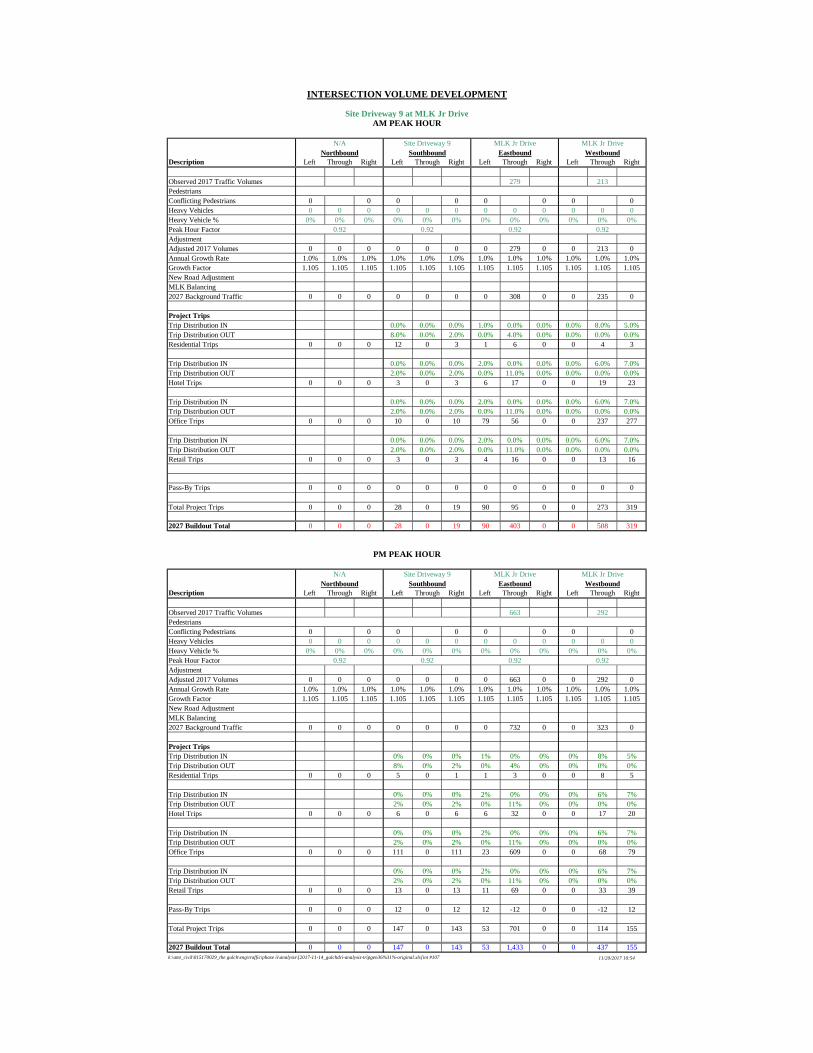
Description Left Through Right Left Through Right Left Through Right Left Through Right
Observed 2017 Traffic Volumes 279 213PedestriansConflicting Pedestrians 0 0 0 0 0 0 0 0Heavy Vehicles 0 0 0 0 0 0 0 0 0 0 0 0Heavy Vehicle % 0% 0% 0% 0% 0% 0% 0% 0% 0% 0% 0% 0%Peak Hour FactorAdjustmentAdjusted 2017 Volumes 0 0 0 0 0 0 0 279 0 0 213 0Annual Growth Rate 1.0% 1.0% 1.0% 1.0% 1.0% 1.0% 1.0% 1.0% 1.0% 1.0% 1.0% 1.0%Growth Factor 1.105 1.105 1.105 1.105 1.105 1.105 1.105 1.105 1.105 1.105 1.105 1.105New Road AdjustmentMLK Balancing2027 Background Traffic 0 0 0 0 0 0 0 308 0 0 235 0
Project TripsTrip Distribution IN 0.0% 0.0% 0.0% 1.0% 0.0% 0.0% 0.0% 8.0% 5.0%Trip Distribution OUT 8.0% 0.0% 2.0% 0.0% 4.0% 0.0% 0.0% 0.0% 0.0%Residential Trips 0 0 0 12 0 3 1 6 0 0 4 3
Trip Distribution IN 0.0% 0.0% 0.0% 2.0% 0.0% 0.0% 0.0% 6.0% 7.0%Trip Distribution OUT 2.0% 0.0% 2.0% 0.0% 11.0% 0.0% 0.0% 0.0% 0.0%Hotel Trips 0 0 0 3 0 3 6 17 0 0 19 23
Trip Distribution IN 0.0% 0.0% 0.0% 2.0% 0.0% 0.0% 0.0% 6.0% 7.0%Trip Distribution OUT 2.0% 0.0% 2.0% 0.0% 11.0% 0.0% 0.0% 0.0% 0.0%Office Trips 0 0 0 10 0 10 79 56 0 0 237 277
Trip Distribution IN 0.0% 0.0% 0.0% 2.0% 0.0% 0.0% 0.0% 6.0% 7.0%Trip Distribution OUT 2.0% 0.0% 2.0% 0.0% 11.0% 0.0% 0.0% 0.0% 0.0%Retail Trips 0 0 0 3 0 3 4 16 0 0 13 16
Pass-By Trips 0 0 0 0 0 0 0 0 0 0 0 0
Total Project Trips 0 0 0 28 0 19 90 95 0 0 273 319
2027 Buildout Total 0 0 0 28 0 19 90 403 0 0 508 319
Description Left Through Right Left Through Right Left Through Right Left Through Right
Observed 2017 Traffic Volumes 663 292PedestriansConflicting Pedestrians 0 0 0 0 0 0 0 0Heavy Vehicles 0 0 0 0 0 0 0 0 0 0 0 0Heavy Vehicle % 0% 0% 0% 0% 0% 0% 0% 0% 0% 0% 0% 0%Peak Hour FactorAdjustmentAdjusted 2017 Volumes 0 0 0 0 0 0 0 663 0 0 292 0Annual Growth Rate 1.0% 1.0% 1.0% 1.0% 1.0% 1.0% 1.0% 1.0% 1.0% 1.0% 1.0% 1.0%Growth Factor 1.105 1.105 1.105 1.105 1.105 1.105 1.105 1.105 1.105 1.105 1.105 1.105New Road AdjustmentMLK Balancing2027 Background Traffic 0 0 0 0 0 0 0 732 0 0 323 0
Project TripsTrip Distribution IN 0% 0% 0% 1% 0% 0% 0% 8% 5%Trip Distribution OUT 8% 0% 2% 0% 4% 0% 0% 0% 0%Residential Trips 0 0 0 5 0 1 1 3 0 0 8 5
Trip Distribution IN 0% 0% 0% 2% 0% 0% 0% 6% 7%Trip Distribution OUT 2% 0% 2% 0% 11% 0% 0% 0% 0%Hotel Trips 0 0 0 6 0 6 6 32 0 0 17 20
Trip Distribution IN 0% 0% 0% 2% 0% 0% 0% 6% 7%Trip Distribution OUT 2% 0% 2% 0% 11% 0% 0% 0% 0%Office Trips 0 0 0 111 0 111 23 609 0 0 68 79
Trip Distribution IN 0% 0% 0% 2% 0% 0% 0% 6% 7%Trip Distribution OUT 2% 0% 2% 0% 11% 0% 0% 0% 0%Retail Trips 0 0 0 13 0 13 11 69 0 0 33 39
Pass-By Trips 0 0 0 12 0 12 12 -12 0 0 -12 12
Total Project Trips 0 0 0 147 0 143 53 701 0 0 114 155
2027 Buildout Total 0 0 0 147 0 143 53 1,433 0 0 437 155k:\amt_civil\015170029_the gulch\eng\traffic\phase ii\analysis\[2017-11-14_gulchdri-analysis-tripgen36%31%-original.xls]int #107
INTERSECTION VOLUME DEVELOPMENT
Site Driveway 9 at MLK Jr DriveAM PEAK HOUR
N/A Site Driveway 9 MLK Jr Drive MLK Jr DriveNorthbound Southbound Eastbound Westbound
0.92 0.92 0.92 0.92
PM PEAK HOUR
N/A Site Driveway 9 MLK Jr Drive MLK Jr DriveNorthbound Southbound Eastbound Westbound
11/20/2017 10:54
0.92 0.92 0.92 0.92
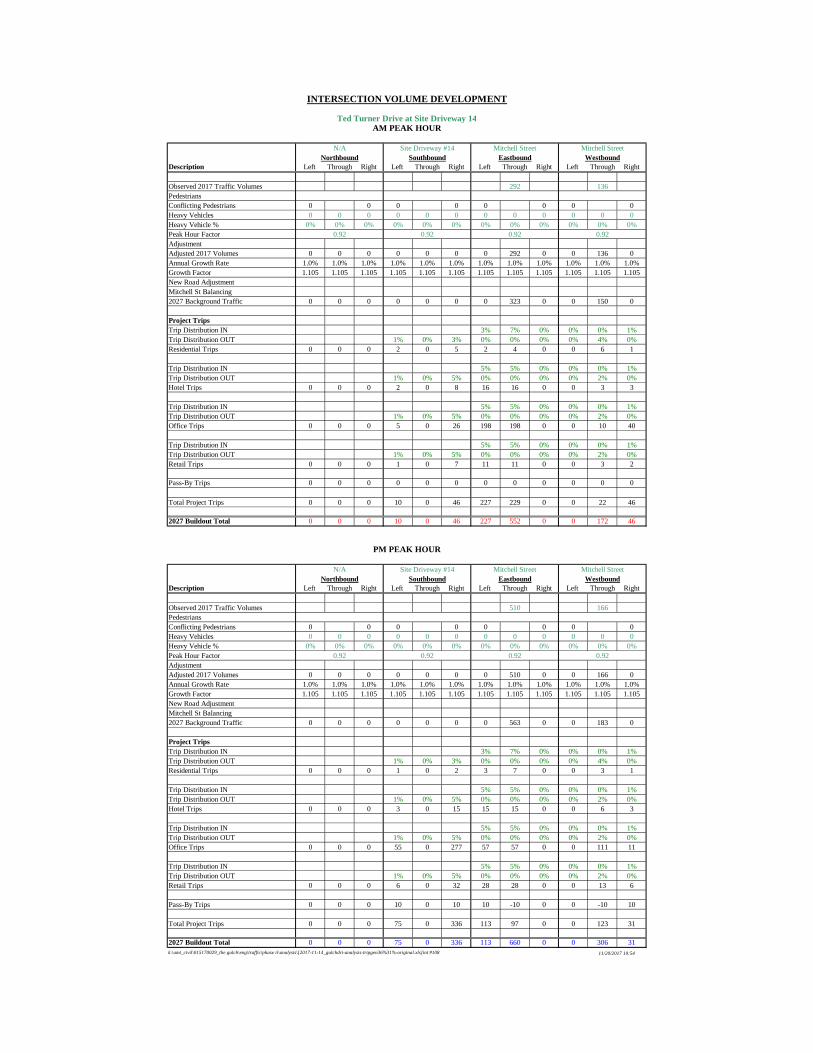
Description Left Through Right Left Through Right Left Through Right Left Through Right
Observed 2017 Traffic Volumes 292 136PedestriansConflicting Pedestrians 0 0 0 0 0 0 0 0Heavy Vehicles 0 0 0 0 0 0 0 0 0 0 0 0Heavy Vehicle % 0% 0% 0% 0% 0% 0% 0% 0% 0% 0% 0% 0%Peak Hour FactorAdjustmentAdjusted 2017 Volumes 0 0 0 0 0 0 0 292 0 0 136 0Annual Growth Rate 1.0% 1.0% 1.0% 1.0% 1.0% 1.0% 1.0% 1.0% 1.0% 1.0% 1.0% 1.0%Growth Factor 1.105 1.105 1.105 1.105 1.105 1.105 1.105 1.105 1.105 1.105 1.105 1.105New Road AdjustmentMitchell St Balancing2027 Background Traffic 0 0 0 0 0 0 0 323 0 0 150 0
Project TripsTrip Distribution IN 3% 7% 0% 0% 0% 1%Trip Distribution OUT 1% 0% 3% 0% 0% 0% 0% 4% 0%Residential Trips 0 0 0 2 0 5 2 4 0 0 6 1
Trip Distribution IN 5% 5% 0% 0% 0% 1%Trip Distribution OUT 1% 0% 5% 0% 0% 0% 0% 2% 0%Hotel Trips 0 0 0 2 0 8 16 16 0 0 3 3
Trip Distribution IN 5% 5% 0% 0% 0% 1%Trip Distribution OUT 1% 0% 5% 0% 0% 0% 0% 2% 0%Office Trips 0 0 0 5 0 26 198 198 0 0 10 40
Trip Distribution IN 5% 5% 0% 0% 0% 1%Trip Distribution OUT 1% 0% 5% 0% 0% 0% 0% 2% 0%Retail Trips 0 0 0 1 0 7 11 11 0 0 3 2
Pass-By Trips 0 0 0 0 0 0 0 0 0 0 0 0
Total Project Trips 0 0 0 10 0 46 227 229 0 0 22 46
2027 Buildout Total 0 0 0 10 0 46 227 552 0 0 172 46
Description Left Through Right Left Through Right Left Through Right Left Through Right
Observed 2017 Traffic Volumes 510 166PedestriansConflicting Pedestrians 0 0 0 0 0 0 0 0Heavy Vehicles 0 0 0 0 0 0 0 0 0 0 0 0Heavy Vehicle % 0% 0% 0% 0% 0% 0% 0% 0% 0% 0% 0% 0%Peak Hour FactorAdjustmentAdjusted 2017 Volumes 0 0 0 0 0 0 0 510 0 0 166 0Annual Growth Rate 1.0% 1.0% 1.0% 1.0% 1.0% 1.0% 1.0% 1.0% 1.0% 1.0% 1.0% 1.0%Growth Factor 1.105 1.105 1.105 1.105 1.105 1.105 1.105 1.105 1.105 1.105 1.105 1.105New Road AdjustmentMitchell St Balancing2027 Background Traffic 0 0 0 0 0 0 0 563 0 0 183 0
Project TripsTrip Distribution IN 3% 7% 0% 0% 0% 1%Trip Distribution OUT 1% 0% 3% 0% 0% 0% 0% 4% 0%Residential Trips 0 0 0 1 0 2 3 7 0 0 3 1
Trip Distribution IN 5% 5% 0% 0% 0% 1%Trip Distribution OUT 1% 0% 5% 0% 0% 0% 0% 2% 0%Hotel Trips 0 0 0 3 0 15 15 15 0 0 6 3
Trip Distribution IN 5% 5% 0% 0% 0% 1%Trip Distribution OUT 1% 0% 5% 0% 0% 0% 0% 2% 0%Office Trips 0 0 0 55 0 277 57 57 0 0 111 11
Trip Distribution IN 5% 5% 0% 0% 0% 1%Trip Distribution OUT 1% 0% 5% 0% 0% 0% 0% 2% 0%Retail Trips 0 0 0 6 0 32 28 28 0 0 13 6
Pass-By Trips 0 0 0 10 0 10 10 -10 0 0 -10 10
Total Project Trips 0 0 0 75 0 336 113 97 0 0 123 31
2027 Buildout Total 0 0 0 75 0 336 113 660 0 0 306 31k:\amt_civil\015170029_the gulch\eng\traffic\phase ii\analysis\[2017-11-14_gulchdri-analysis-tripgen36%31%-original.xls]int #108
INTERSECTION VOLUME DEVELOPMENT
Ted Turner Drive at Site Driveway 14AM PEAK HOUR
N/A Site Driveway #14 Mitchell Street Mitchell StreetNorthbound Southbound Eastbound Westbound
0.92 0.92 0.92 0.92
PM PEAK HOUR
N/A Site Driveway #14 Mitchell Street Mitchell StreetNorthbound Southbound Eastbound Westbound
11/20/2017 10:54
0.92 0.92 0.92 0.92

Description Left Through Right Left Through Right Left Through Right Left Through Right
Observed 2017 Traffic Volumes 162 1,697PedestriansConflicting Pedestrians 0 0 0 0 0 0 0 0Heavy Vehicles 0 0 0 0 0 0 0 0 0 0 0 0Heavy Vehicle % 0% 0% 0% 0% 0% 0% 0% 0% 0% 0% 0% 0%Peak Hour FactorAdjustmentAdjusted 2017 Volumes 162 1697 0 0 0 0 0 0 0 0 0 0Annual Growth Rate 1.0% 1.0% 1.0% 1.0% 1.0% 1.0% 1.0% 1.0% 1.0% 1.0% 1.0% 1.0%Growth Factor 1.105 1.105 1.105 1.105 1.105 1.105 1.105 1.105 1.105 1.105 1.105 1.105New Road AdjustmentSpring St Balancing2027 Background Traffic 179 1,875 0 0 0 0 0 0 0 0 0 0
Project TripsTrip Distribution IN 6.0% 3.0% 0.0%Trip Distribution OUT 0.0% 5.0% 9.0%Residential Trips 3 10 0 0 0 0 14 0 0 0 0 0
Trip Distribution IN 8.0% 8.0% 0.0%Trip Distribution OUT 0.0% 6.0% 8.0%Hotel Trips 26 35 0 0 0 0 12 0 0 0 0 0
Trip Distribution IN 8.0% 8.0% 0.0%Trip Distribution OUT 0.0% 6.0% 8.0%Office Trips 317 348 0 0 0 0 41 0 0 0 0 0
Trip Distribution IN 8.0% 8.0% 0.0%Trip Distribution OUT 0.0% 6.0% 8.0%Retail Trips 18 26 0 0 0 0 11 0 0 0 0 0
Pass-By Trips 0 0 0 0 0 0 0 0 0 0 0 0
Total Project Trips 364 419 0 0 0 0 78 0 0 0 0 0
2027 Buildout Total 543 2,294 0 0 0 0 78 0 0 0 0 0
Description Left Through Right Left Through Right Left Through Right Left Through Right
Observed 2017 Traffic Volumes 418 282PedestriansConflicting Pedestrians 0 0 0 0 0 0 0 0Heavy Vehicles 0 0 0 0 0 0 0 0 0 0 0 0Heavy Vehicle % 0% 0% 0% 0% 0% 0% 0% 0% 0% 0% 0% 0%Peak Hour FactorAdjustmentAdjusted 2017 Volumes 0 418 0 0 0 0 282 0 0 0 0 0Annual Growth Rate 1.0% 1.0% 1.0% 1.0% 1.0% 1.0% 1.0% 1.0% 1.0% 1.0% 1.0% 1.0%Growth Factor 1.105 1.105 1.105 1.105 1.105 1.105 1.105 1.105 1.105 1.105 1.105 1.105New Road AdjustmentSpring St Balancing2027 Background Traffic 0 462 0 0 0 0 312 0 0 0 0 0
Project TripsTrip Distribution IN 6% 3% 0%Trip Distribution OUT 0% 5% 9%Residential Trips 6 6 0 0 0 0 6 0 0 0 0 0
Trip Distribution IN 8% 8% 0%Trip Distribution OUT 0% 6% 8%Hotel Trips 23 41 0 0 0 0 24 0 0 0 0 0
Trip Distribution IN 8% 8% 0%Trip Distribution OUT 0% 6% 8%Office Trips 90 422 0 0 0 0 443 0 0 0 0 0
Trip Distribution IN 8% 8% 0%Trip Distribution OUT 0% 6% 8%Retail Trips 44 82 0 0 0 0 50 0 0 0 0 0
Pass-By Trips 54 -54 0 0 0 0 54 0 0 0 0 0
Total Project Trips 217 497 0 0 0 0 577 0 0 0 0 0
2027 Buildout Total 217 959 0 0 0 0 889 0 0 0 0 0k:\amt_civil\015170029_the gulch\eng\traffic\phase ii\analysis\[2017-11-14_gulchdri-analysis-tripgen36%31%-original.xls]int #109
INTERSECTION VOLUME DEVELOPMENT
Ted Turner at Site Driveway 10AM PEAK HOUR
Ted Turner St N/A Site Driveway 10 N/ANorthbound Southbound Eastbound Westbound
0.92 0.92 0.92 0.92
PM PEAK HOUR
Ted Turner St N/A Site Driveway 10 N/ANorthbound Southbound Eastbound Westbound
11/20/2017 10:54
0.92 0.92 0.92 0.92

Description Left Through Right Left Through Right Left Through Right Left Through Right
Observed 2017 Traffic Volumes 162 1,535PedestriansConflicting Pedestrians 0 0 0 0 0 0 0 0Heavy Vehicles 0 0 0 0 0 0 0 0 0 0 0 0Heavy Vehicle % 0% 0% 0% 0% 0% 0% 0% 0% 0% 0% 0% 0%Peak Hour FactorAdjustmentAdjusted 2017 Volumes 162 1535 0 0 0 0 0 0 0 0 0 0Annual Growth Rate 1.0% 1.0% 1.0% 1.0% 1.0% 1.0% 1.0% 1.0% 1.0% 1.0% 1.0% 1.0%Growth Factor 1.105 1.105 1.105 1.105 1.105 1.105 1.105 1.105 1.105 1.105 1.105 1.105New Road AdjustmentSpring St Balancing2027 Background Traffic 179 1,696 0 0 0 0 0 0 0 0 0 0
Project TripsTrip Distribution IN 3.0% 0.0% 0.0%Trip Distribution OUT 0.0% 18.0% 2.0%Residential Trips 2 27 0 0 0 0 3 0 0 0 0 0
Trip Distribution IN 8.0% 0.0% 0.0%Trip Distribution OUT 0.0% 15.0% 7.0%Hotel Trips 26 23 0 0 0 0 11 0 0 0 0 0
Trip Distribution IN 8.0% 0.0% 0.0%Trip Distribution OUT 0.0% 15.0% 7.0%Office Trips 317 77 0 0 0 0 36 0 0 0 0 0
Trip Distribution IN 8.0% 0.0% 0.0%Trip Distribution OUT 0.0% 15.0% 7.0%Retail Trips 18 21 0 0 0 0 10 0 0 0 0 0
Pass-By Trips 0 0 0 0 0 0 0 0 0 0 0 0
Total Project Trips 363 148 0 0 0 0 60 0 0 0 0 0
2027 Buildout Total 542 1,844 0 0 0 0 60 0 0 0 0 0
Description Left Through Right Left Through Right Left Through Right Left Through Right
Observed 2017 Traffic Volumes 700 282PedestriansConflicting Pedestrians 0 0 0 0 0 0 0 0Heavy Vehicles 0 0 0 0 0 0 0 0 0 0 0 0Heavy Vehicle % 0% 0% 0% 0% 0% 0% 0% 0% 0% 0% 0% 0%Peak Hour FactorAdjustmentAdjusted 2017 Volumes 0 700 0 0 0 0 282 0 0 0 0 0Annual Growth Rate 1.0% 1.0% 1.0% 1.0% 1.0% 1.0% 1.0% 1.0% 1.0% 1.0% 1.0% 1.0%Growth Factor 1.105 1.105 1.105 1.105 1.105 1.105 1.105 1.105 1.105 1.105 1.105 1.105New Road AdjustmentSpring St Balancing2027 Background Traffic 0 773 0 0 0 0 312 0 0 0 0 0
Project TripsTrip Distribution IN 3% 0% 0%Trip Distribution OUT 0% 18% 2%Residential Trips 3 12 0 0 0 0 1 0 0 0 0 0
Trip Distribution IN 8% 0% 0%Trip Distribution OUT 0% 15% 7%Hotel Trips 23 44 0 0 0 0 21 0 0 0 0 0
Trip Distribution IN 8% 0% 0%Trip Distribution OUT 0% 15% 7%Office Trips 90 830 0 0 0 0 387 0 0 0 0 0
Trip Distribution IN 8% 0% 0%Trip Distribution OUT 0% 15% 7%Retail Trips 44 95 0 0 0 0 44 0 0 0 0 0
Pass-By Trips 38 -38 0 0 0 0 38 0 0 0 0 0
Total Project Trips 198 943 0 0 0 0 491 0 0 0 0 0
2027 Buildout Total 198 1,716 0 0 0 0 803 0 0 0 0 0k:\amt_civil\015170029_the gulch\eng\traffic\phase ii\analysis\[2017-11-14_gulchdri-analysis-tripgen36%31%-original.xls]int #111
INTERSECTION VOLUME DEVELOPMENT
Ted Turner at Site Driveway 11AM PEAK HOUR
Ted Turner St N/A Site Driveway 11 N/ANorthbound Southbound Eastbound Westbound
0.92 0.92 0.92 0.92
PM PEAK HOUR
Ted Turner St N/A Site Driveway 11 N/ANorthbound Southbound Eastbound Westbound
11/20/2017 10:54
0.92 0.92 0.92 0.92

Description Left Through Right Left Through Right Left Through Right Left Through Right
Observed 2017 Traffic Volumes 650 557PedestriansConflicting Pedestrians 0 0 0 0 0 0 0 0Heavy Vehicles 0 0 0 0 0 0 0 0 0 0 0 0Heavy Vehicle % 0% 0% 0% 0% 0% 0% 0% 0% 0% 0% 0% 0%Peak Hour FactorAdjustmentAdjusted 2017 Volumes 0 0 0 0 0 0 0 650 0 0 557 0Annual Growth Rate 1.0% 1.0% 1.0% 1.0% 1.0% 1.0% 1.0% 1.0% 1.0% 1.0% 1.0% 1.0%Growth Factor 1.105 1.105 1.105 1.105 1.105 1.105 1.105 1.105 1.105 1.105 1.105 1.105New Road AdjustmentMarietta Street Balancing2027 Background Traffic 0 0 0 0 0 0 0 718 0 0 615 0
Project TripsTrip Distribution IN 0% 0% 0% 0% 0% 0% 0% 0% 7% 7% 0% 0%Trip Distribution OUT 2% 0% 11% 0% 0% 0% 0% 5% 0% 0% 0% 0%Residential Trips 3 0 17 0 0 0 0 8 4 4 0 0
Trip Distribution IN 0% 0% 0% 0% 0% 0% 0% 0% 5% 7% 0% 0%Trip Distribution OUT 2% 0% 7% 0% 0% 0% 0% 6% 0% 0% 0% 0%Hotel Trips 3 0 11 0 0 0 0 9 16 23 0 0
Trip Distribution IN 0% 0% 0% 0% 0% 0% 0% 0% 5% 7% 0% 0%Trip Distribution OUT 2% 0% 7% 0% 0% 0% 0% 6% 0% 0% 0% 0%Office Trips 10 0 36 0 0 0 0 31 198 277 0 0
Trip Distribution IN 0% 0% 0% 0% 0% 0% 0% 0% 5% 7% 0% 0%Trip Distribution OUT 2% 0% 7% 0% 0% 0% 0% 6% 0% 0% 0% 0%Retail Trips 3 0 10 0 0 0 0 8 11 16 0 0
Pass-By Trips 0 0 0 0 0 0 0 0 0 0 0 0
Total Project Trips 19 0 74 0 0 0 0 56 229 320 0 0
2027 Buildout Total 19 0 74 0 0 0 0 774 229 320 615 0
Description Left Through Right Left Through Right Left Through Right Left Through Right
Observed 2017 Traffic Volumes 631 642PedestriansConflicting Pedestrians 0 0 0 0 0 0 0 0Heavy Vehicles 0 0 0 0 0 0 0 0 0 0 0 0Heavy Vehicle % 0% 0% 0% 0% 0% 0% 0% 0% 0% 0% 0% 0%Peak Hour FactorAdjustmentAdjusted 2017 Volumes 0 0 0 0 0 0 0 631 0 0 642 0Annual Growth Rate 1.0% 1.0% 1.0% 1.0% 1.0% 1.0% 1.0% 1.0% 1.0% 1.0% 1.0% 1.0%Growth Factor 1.105 1.105 1.105 1.105 1.105 1.105 1.105 1.105 1.105 1.105 1.105 1.105New Road AdjustmentMarietta Street Balancing2027 Background Traffic 0 0 0 0 0 0 0 697 0 0 709 0
Project TripsTrip Distribution IN 0% 0% 0% 0% 0% 0% 0% 0% 7% 7% 0% 0%Trip Distribution OUT 2% 0% 11% 0% 0% 0% 0% 5% 0% 0% 0% 0%Residential Trips 1 0 7 0 0 0 0 3 7 7 0 0
Trip Distribution IN 0% 0% 0% 0% 0% 0% 0% 0% 5% 7% 0% 0%Trip Distribution OUT 2% 0% 7% 0% 0% 0% 0% 6% 0% 0% 0% 0%Hotel Trips 6 0 21 0 0 0 0 18 15 20 0 0
Trip Distribution IN 0% 0% 0% 0% 0% 0% 0% 0% 5% 7% 0% 0%Trip Distribution OUT 2% 0% 7% 0% 0% 0% 0% 6% 0% 0% 0% 0%Office Trips 111 0 387 0 0 0 0 332 57 79 0 0
Trip Distribution IN 0% 0% 0% 0% 0% 0% 0% 0% 5% 7% 0% 0%Trip Distribution OUT 2% 0% 7% 0% 0% 0% 0% 6% 0% 0% 0% 0%Retail Trips 13 0 44 0 0 0 0 38 28 39 0 0
Pass-By Trips 10 0 10 0 0 0 0 -10 10 10 -10 0
Total Project Trips 141 0 469 0 0 0 0 381 117 155 -10 0
2027 Buildout Total 141 0 469 0 0 0 0 1,078 117 155 699 0k:\amt_civil\015170029_the gulch\eng\traffic\phase ii\analysis\[2017-11-14_gulchdri-analysis-tripgen36%31%-original.xls]int #112
INTERSECTION VOLUME DEVELOPMENT
Site Driveway 12 at Marietta StreetAM PEAK HOUR
Site Driveway 12 N/A Marietta Street Marietta StreetNorthbound Southbound Eastbound Westbound
0.92 0.92 0.92 0.92
PM PEAK HOUR
Site Driveway 12 N/A Marietta Street Marietta StreetNorthbound Southbound Eastbound Westbound
11/20/2017 10:54
0.92 0.92 0.92 0.92

Description Left Through Right Left Through Right Left Through Right Left Through Right
Observed 2017 Traffic Volumes 1,697PedestriansConflicting Pedestrians 0 0 0 0 0 0 0 0Heavy Vehicles 0 0 0 0 0 0 0 0 0 0 0 0Heavy Vehicle % 0% 0% 0% 0% 0% 0% 0% 0% 0% 0% 0% 0%Peak Hour FactorAdjustmentAdjusted 2017 Volumes 0 1697 0 0 0 0 0 0 0 0 0 0Annual Growth Rate 1.0% 1.0% 1.0% 1.0% 1.0% 1.0% 1.0% 1.0% 1.0% 1.0% 1.0% 1.0%Growth Factor 1.105 1.105 1.105 1.105 1.105 1.105 1.105 1.105 1.105 1.105 1.105 1.105New Road AdjustmentMarietta Street Balancing2027 Background Traffic 0 1,875 0 0 0 0 0 0 0 0 0 0
Project TripsTrip Distribution IN 2% 1% 0% 0% 0% 0% 2% 2%Trip Distribution OUT 0% 10% 4% 8% 0% 0% 0% 0%Residential Trips 1 16 6 0 0 0 12 0 0 0 1 1
Trip Distribution IN 3% 5% 0% 0% 0% 0% 2% 3%Trip Distribution OUT 0% 7% 7% 8% 0% 0% 0% 0%Hotel Trips 10 27 11 0 0 0 12 0 0 0 6 10
Trip Distribution IN 3% 5% 0% 0% 0% 0% 2% 3%Trip Distribution OUT 0% 7% 7% 8% 0% 0% 0% 0%Office Trips 119 234 36 0 0 0 41 0 0 0 79 119
Trip Distribution IN 3% 5% 0% 0% 0% 0% 2% 3%Trip Distribution OUT 0% 7% 7% 8% 0% 0% 0% 0%Retail Trips 7 21 10 0 0 0 11 0 0 0 4 7
Pass-By Trips 0 0 0 0 0 0 0 0 0 0 0 0
Total Project Trips 137 298 63 0 0 0 76 0 0 0 90 137
2027 Buildout Total 137 2,173 63 0 0 0 76 0 0 0 90 137
Description Left Through Right Left Through Right Left Through Right Left Through Right
Observed 2017 Traffic Volumes 700PedestriansConflicting Pedestrians 0 0 0 0 0 0 0 0Heavy Vehicles 0 0 0 0 0 0 0 0 0 0 0 0Heavy Vehicle % 0% 0% 0% 0% 0% 0% 0% 0% 0% 0% 0% 0%Peak Hour FactorAdjustmentAdjusted 2017 Volumes 0 700 0 0 0 0 0 0 0 0 0 0Annual Growth Rate 1.0% 1.0% 1.0% 1.0% 1.0% 1.0% 1.0% 1.0% 1.0% 1.0% 1.0% 1.0%Growth Factor 1.105 1.105 1.105 1.105 1.105 1.105 1.105 1.105 1.105 1.105 1.105 1.105New Road AdjustmentMarietta Street Balancing2027 Background Traffic 0 773 0 0 0 0 0 0 0 0 0 0
Project TripsTrip Distribution IN 2% 1% 0% 0% 0% 0% 2% 2%Trip Distribution OUT 0% 10% 4% 8% 0% 0% 0% 0%Residential Trips 2 8 3 0 0 0 5 0 0 0 2 2
Trip Distribution IN 3% 5% 0% 0% 0% 0% 2% 3%Trip Distribution OUT 0% 7% 7% 8% 0% 0% 0% 0%Hotel Trips 9 36 21 0 0 0 24 0 0 0 6 9
Trip Distribution IN 3% 5% 0% 0% 0% 0% 2% 3%Trip Distribution OUT 0% 7% 7% 8% 0% 0% 0% 0%Office Trips 34 444 387 0 0 0 443 0 0 0 23 34
Trip Distribution IN 3% 5% 0% 0% 0% 0% 2% 3%Trip Distribution OUT 0% 7% 7% 8% 0% 0% 0% 0%Retail Trips 17 72 44 0 0 0 50 0 0 0 11 17
Pass-By Trips
Total Project Trips 62 560 455 0 0 0 522 0 0 0 42 62
2027 Buildout Total 62 1,333 455 0 0 0 522 0 0 0 42 62k:\amt_civil\015170029_the gulch\eng\traffic\phase ii\analysis\[2017-11-14_gulchdri-analysis-tripgen36%31%-original.xls]int #113
INTERSECTION VOLUME DEVELOPMENT
Ted Turner Street at Site Driveway 16 / Site Driveway 17AM PEAK HOUR
Ted Turner Street N/A Site Driveway 16 Site Driveway 17Northbound Southbound Eastbound Westbound
0.92 0.92 0.92 0.92
PM PEAK HOUR
Ted Turner Street N/A Site Driveway 16 Site Driveway 17Northbound Southbound Eastbound Westbound
11/20/2017 10:54
0.92 0.92 0.92 0.92

Description Left Through Right Left Through Right Left Through Right Left Through Right
Observed 2017 Traffic Volumes 531 178PedestriansConflicting Pedestrians 0 0 0 0 0 0 0 0Heavy Vehicles 0 0 0 0 0 0 0 0 0 0 0 0Heavy Vehicle % 0% 0% 0% 0% 0% 0% 0% 0% 0% 0% 0% 0%Peak Hour FactorAdjustmentAdjusted 2017 Volumes 0 531 0 0 178 0 0 0 0 0 0 0Annual Growth Rate 1.0% 1.0% 1.0% 1.0% 1.0% 1.0% 1.0% 1.0% 1.0% 1.0% 1.0% 1.0%Growth Factor 1.105 1.105 1.105 1.105 1.105 1.105 1.105 1.105 1.105 1.105 1.105 1.105New Road AdjustmentMarietta Street Balancing2027 Background Traffic 0 587 0 0 197 0 0 0 0 0 0 0
Project TripsTrip Distribution IN 0% 4% 4% 0%Trip Distribution OUT 0% 0% 0% 4%Residential Trips 0 0 0 0 2 2 6 0 0 0 0 0
Trip Distribution IN 0% 8% 5% 0% 0% 0%Trip Distribution OUT 6% 0% 0% 2% 0% 5%Hotel Trips 0 9 0 0 26 16 3 0 8 0 0 0
Trip Distribution IN 0% 8% 5% 0% 0% 0%Trip Distribution OUT 6% 0% 0% 2% 0% 5%Office Trips 0 31 0 0 317 198 10 0 26 0 0 0
Trip Distribution IN 0% 8% 5% 0% 0% 0%Trip Distribution OUT 6% 0% 0% 2% 0% 5%Retail Trips 0 8 0 0 18 11 3 0 7 0 0 0
Pass-By Trips 0 0 0 0 0 0 0 0 0 0 0 0
Total Project Trips 0 48 0 0 363 227 22 0 41 0 0 0
2027 Buildout Total 0 635 0 0 560 227 22 0 41 0 0 0
Description Left Through Right Left Through Right Left Through Right Left Through Right
Observed 2017 Traffic Volumes 266 533PedestriansConflicting Pedestrians 0 0 0 0 0 0 0 0Heavy Vehicles 0 0 0 0 0 0 0 0 0 0 0 0Heavy Vehicle % 0% 0% 0% 0% 0% 0% 0% 0% 0% 0% 0% 0%Peak Hour FactorAdjustmentAdjusted 2017 Volumes 0 266 0 0 533 0 0 0 0 0 0 0Annual Growth Rate 1.0% 1.0% 1.0% 1.0% 1.0% 1.0% 1.0% 1.0% 1.0% 1.0% 1.0% 1.0%Growth Factor 1.105 1.105 1.105 1.105 1.105 1.105 1.105 1.105 1.105 1.105 1.105 1.105New Road AdjustmentMarietta Street Balancing2027 Background Traffic 0 294 0 0 589 0 0 0 0 0 0 0
Project TripsTrip Distribution IN 0% 4% 4% 0%Trip Distribution OUT 0% 0% 0% 4%Residential Trips 0 0 0 0 4 4 3 0 0 0 0 0
Trip Distribution IN 0% 8% 5% 0% 0% 0%Trip Distribution OUT 6% 0% 0% 2% 0% 5%Hotel Trips 0 18 0 0 23 15 6 0 15 0 0 0
Trip Distribution IN 0% 8% 5% 0% 0% 0%Trip Distribution OUT 6% 0% 0% 2% 0% 5%Office Trips 0 332 0 0 90 57 111 0 277 0 0 0
Trip Distribution IN 0% 8% 5% 0% 0% 0%Trip Distribution OUT 6% 0% 0% 2% 0% 5%Retail Trips 0 38 0 0 44 28 13 0 32 0 0 0
Pass-By Trips
Total Project Trips 0 388 0 0 161 104 133 0 324 0 0 0
2027 Buildout Total 0 682 0 0 750 104 133 0 324 0 0 0k:\amt_civil\015170029_the gulch\eng\traffic\phase ii\analysis\[2017-11-14_gulchdri-analysis-tripgen36%31%-original.xls]int #114
INTERSECTION VOLUME DEVELOPMENT
Forsyth Street at Site Driveway 18AM PEAK HOUR
Forsyth Street Forsyth Street Site Driveway 18 N/ANorthbound Southbound Eastbound Westbound
0.92 0.92 0.92 0.92
PM PEAK HOUR
Forsyth Street Forsyth Street Site Driveway 18 N/ANorthbound Southbound Eastbound Westbound
11/20/2017 10:54
0.92 0.92 0.92 0.92

Description Left Through Right Left Through Right Left Through Right Left Through Right26% 66% 9% 81% 19%
Observed 2017 Traffic Volumes 116 132 101 125 318 42 0 424 102 55 497 4PedestriansConflicting Pedestrians 59 20 20 59 26 144 144 26Heavy Vehicles 1 0 0 0 0 0 0 1 0 0 1 0Heavy Vehicle % 1% 0% 0% 0% 0% 0% 0% 0% 0% 0% 0% 0%Peak Hour FactorAdjustmentAdjusted 2017 Volumes 116 132 101 125 318 42 0 424 102 55 497 4Annual Growth Rate 1.0% 1.0% 1.0% 1.0% 1.0% 1.0% 1.0% 1.0% 1.0% 1.0% 1.0% 1.0%Growth Factor 1.105 1.105 1.105 1.105 1.105 1.105 1.105 1.105 1.105 1.105 1.105 1.105New Road AdjustmentOther Proposed Developments2027 Background Traffic 128 146 112 138 351 46 0 468 113 61 549 4
Project TripsTrip Distribution IN 0% 0% 0% 5% 20% 0% 0% 2% 3% 0% 0% 0%Trip Distribution OUT 3% 0% 5% 0% 0% 0% 0% 2% 0%Residential Trips 5 0 8 3 10 0 0 1 2 0 3 0
Trip Distribution IN 0% 0% 0% 3% 17% 0% 0% 2% 3% 0% 0% 0%Trip Distribution OUT 5% 0% 6% 0% 0% 0% 0% 2% 0%Hotel Trips 8 0 9 10 55 0 0 6 10 0 3 0
Trip Distribution IN 0% 0% 0% 3% 17% 0% 0% 2% 3% 0% 0% 0%Trip Distribution OUT 5% 0% 6% 0% 0% 0% 0% 2% 0%Office Trips 26 0 31 119 673 0 0 79 119 0 10 0
Trip Distribution IN 0% 0% 0% 3% 17% 0% 0% 2% 3% 0% 0% 0%Trip Distribution OUT 5% 0% 6% 0% 0% 0% 0% 2% 0%Retail Trips 7 0 8 7 38 0 0 4 7 0 3 0
Pass-By Trips 0 0 0 0 0 0 0 0 0 0 0 0
Total Project Trips 46 0 56 139 776 0 0 90 138 0 19 0
2027 Buildout Total 174 146 168 277 1,127 46 0 558 251 61 568 4
Description Left Through Right Left Through Right Left Through Right Left Through Right15% 76% 9%
Observed 2017 Traffic Volumes 78 59 53 107 557 69 471 199 156 564 8PedestriansConflicting Pedestrians 134 62 62 134 68 163 163 68Heavy Vehicles 0 0 0 4 0 0 0 1 0 0 2 0Heavy Vehicle % 0% 0% 0% 4% 0% 0% 0% 0% 0% 0% 0% 0%Peak Hour FactorAdjustmentAdjusted 2017 Volumes 78 59 53 107 557 69 0 471 199 156 564 8Annual Growth Rate 1.0% 1.0% 1.0% 1.0% 1.0% 1.0% 1.0% 1.0% 1.0% 1.0% 1.0% 1.0%Growth Factor 1.105 1.105 1.105 1.105 1.105 1.105 1.105 1.105 1.105 1.105 1.105 1.105New Road AdjustmentOther Proposed Developments2027 Background Traffic 86 65 59 118 615 76 0 520 220 172 623 9
Project TripsTrip Distribution IN 0% 0% 0% 5% 20% 0% 0% 2% 3% 0% 0% 0%Trip Distribution OUT 3% 0% 5% 0% 0% 0% 0% 2% 0%Residential Trips 2 0 3 5 21 0 0 2 3 0 1 0
Trip Distribution IN 0% 0% 0% 3% 17% 0% 0% 2% 3% 0% 0% 0%Trip Distribution OUT 5% 0% 6% 0% 0% 0% 0% 2% 0%Hotel Trips 15 0 18 9 49 0 0 6 9 0 6 0
Trip Distribution IN 0% 0% 0% 3% 17% 0% 0% 2% 3% 0% 0% 0%Trip Distribution OUT 5% 0% 6% 0% 0% 0% 0% 2% 0%Office Trips 277 0 332 34 192 0 0 23 34 0 111 0
Trip Distribution IN 0% 0% 0% 3% 17% 0% 0% 2% 3% 0% 0% 0%Trip Distribution OUT 5% 0% 6% 0% 0% 0% 0% 2% 0%Retail Trips 32 0 38 17 95 0 0 11 17 0 13 0
Trip Distribution INTrip Distribution OUTRestaurant Trips 0 0 0 0 0 0 0 0 0 0 0 0
Trip Distribution INTrip Distribution OUTNon-Residential Trips 0 0 0 0 0 0 0 0 0 0 0 0
Pass-By Trips 0 0 0 0 0 0 0 0 0 0 0 0
Total Project Trips 326 0 391 65 357 0 0 42 63 0 131 0
2027 Buildout Total 412 65 450 183 972 76 0 562 283 172 754 9k:\amt_civil\015170029_the gulch\eng\traffic\phase ii\analysis\[2017-11-14_gulchdri-analysis-tripgen36%31%-original.xls]int #1 11/20/2017 10:54
163 68 134 62
0.98 0.98 0.98 0.98
PM PEAK HOUR
COP Drive NW COP Drive NW Marietta St Marietta StNorthbound Southbound Eastbound Westbound
0.96 0.96 0.96 0.96
Northbound Southbound Eastbound Westbound
144 26 59 20
INTERSECTION VOLUME DEVELOPMENT
Centennial Olympic Park Dr NW at Marietta Street NWAM PEAK HOUR
COP Drive NW COP Drive NW Marietta St Marietta St
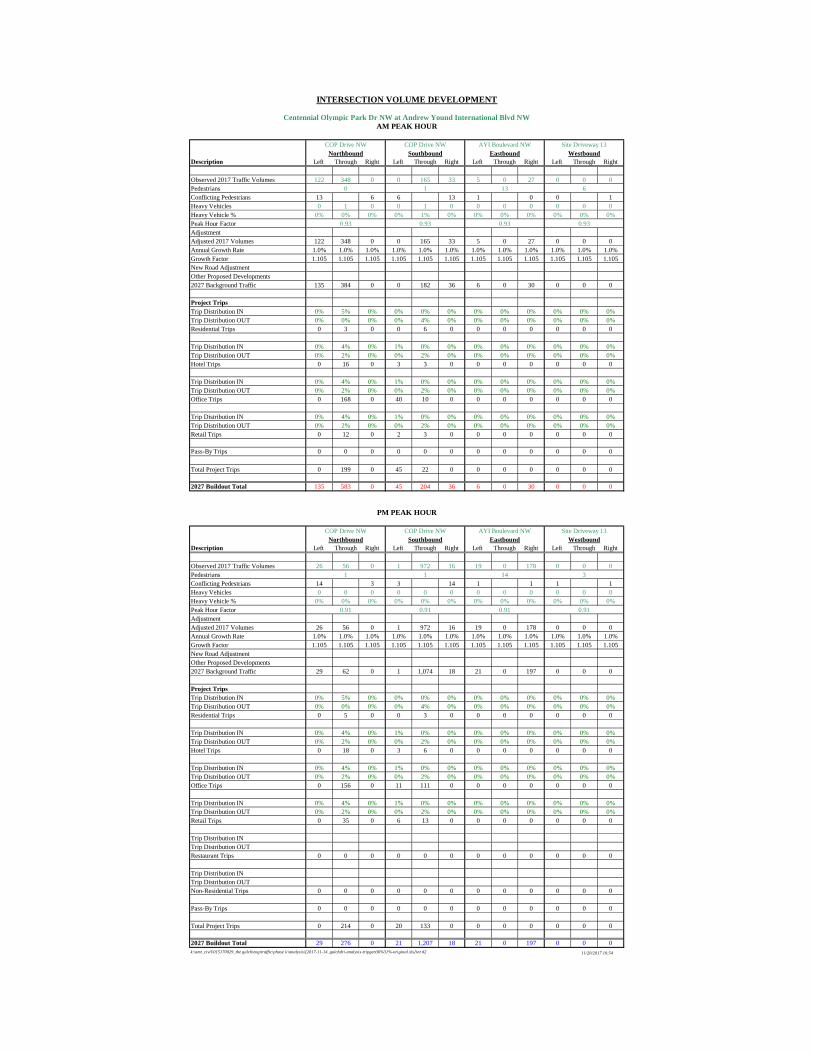
Description Left Through Right Left Through Right Left Through Right Left Through Right
Observed 2017 Traffic Volumes 122 348 0 0 165 33 5 0 27 0 0 0PedestriansConflicting Pedestrians 13 6 6 13 1 0 0 1Heavy Vehicles 0 1 0 0 1 0 0 0 0 0 0 0Heavy Vehicle % 0% 0% 0% 0% 1% 0% 0% 0% 0% 0% 0% 0%Peak Hour FactorAdjustmentAdjusted 2017 Volumes 122 348 0 0 165 33 5 0 27 0 0 0Annual Growth Rate 1.0% 1.0% 1.0% 1.0% 1.0% 1.0% 1.0% 1.0% 1.0% 1.0% 1.0% 1.0%Growth Factor 1.105 1.105 1.105 1.105 1.105 1.105 1.105 1.105 1.105 1.105 1.105 1.105New Road AdjustmentOther Proposed Developments2027 Background Traffic 135 384 0 0 182 36 6 0 30 0 0 0
Project TripsTrip Distribution IN 0% 5% 0% 0% 0% 0% 0% 0% 0% 0% 0% 0%Trip Distribution OUT 0% 0% 0% 0% 4% 0% 0% 0% 0% 0% 0% 0%Residential Trips 0 3 0 0 6 0 0 0 0 0 0 0
Trip Distribution IN 0% 4% 0% 1% 0% 0% 0% 0% 0% 0% 0% 0%Trip Distribution OUT 0% 2% 0% 0% 2% 0% 0% 0% 0% 0% 0% 0%Hotel Trips 0 16 0 3 3 0 0 0 0 0 0 0
Trip Distribution IN 0% 4% 0% 1% 0% 0% 0% 0% 0% 0% 0% 0%Trip Distribution OUT 0% 2% 0% 0% 2% 0% 0% 0% 0% 0% 0% 0%Office Trips 0 168 0 40 10 0 0 0 0 0 0 0
Trip Distribution IN 0% 4% 0% 1% 0% 0% 0% 0% 0% 0% 0% 0%Trip Distribution OUT 0% 2% 0% 0% 2% 0% 0% 0% 0% 0% 0% 0%Retail Trips 0 12 0 2 3 0 0 0 0 0 0 0
Pass-By Trips 0 0 0 0 0 0 0 0 0 0 0 0
Total Project Trips 0 199 0 45 22 0 0 0 0 0 0 0
2027 Buildout Total 135 583 0 45 204 36 6 0 30 0 0 0
Description Left Through Right Left Through Right Left Through Right Left Through Right
Observed 2017 Traffic Volumes 26 56 0 1 972 16 19 0 178 0 0 0PedestriansConflicting Pedestrians 14 3 3 14 1 1 1 1Heavy Vehicles 0 0 0 0 0 0 0 0 0 0 0 0Heavy Vehicle % 0% 0% 0% 0% 0% 0% 0% 0% 0% 0% 0% 0%Peak Hour FactorAdjustmentAdjusted 2017 Volumes 26 56 0 1 972 16 19 0 178 0 0 0Annual Growth Rate 1.0% 1.0% 1.0% 1.0% 1.0% 1.0% 1.0% 1.0% 1.0% 1.0% 1.0% 1.0%Growth Factor 1.105 1.105 1.105 1.105 1.105 1.105 1.105 1.105 1.105 1.105 1.105 1.105New Road AdjustmentOther Proposed Developments2027 Background Traffic 29 62 0 1 1,074 18 21 0 197 0 0 0
Project TripsTrip Distribution IN 0% 5% 0% 0% 0% 0% 0% 0% 0% 0% 0% 0%Trip Distribution OUT 0% 0% 0% 0% 4% 0% 0% 0% 0% 0% 0% 0%Residential Trips 0 5 0 0 3 0 0 0 0 0 0 0
Trip Distribution IN 0% 4% 0% 1% 0% 0% 0% 0% 0% 0% 0% 0%Trip Distribution OUT 0% 2% 0% 0% 2% 0% 0% 0% 0% 0% 0% 0%Hotel Trips 0 18 0 3 6 0 0 0 0 0 0 0
Trip Distribution IN 0% 4% 0% 1% 0% 0% 0% 0% 0% 0% 0% 0%Trip Distribution OUT 0% 2% 0% 0% 2% 0% 0% 0% 0% 0% 0% 0%Office Trips 0 156 0 11 111 0 0 0 0 0 0 0
Trip Distribution IN 0% 4% 0% 1% 0% 0% 0% 0% 0% 0% 0% 0%Trip Distribution OUT 0% 2% 0% 0% 2% 0% 0% 0% 0% 0% 0% 0%Retail Trips 0 35 0 6 13 0 0 0 0 0 0 0
Trip Distribution INTrip Distribution OUTRestaurant Trips 0 0 0 0 0 0 0 0 0 0 0 0
Trip Distribution INTrip Distribution OUTNon-Residential Trips 0 0 0 0 0 0 0 0 0 0 0 0
Pass-By Trips 0 0 0 0 0 0 0 0 0 0 0 0
Total Project Trips 0 214 0 20 133 0 0 0 0 0 0 0
2027 Buildout Total 29 276 0 21 1,207 18 21 0 197 0 0 0k:\amt_civil\015170029_the gulch\eng\traffic\phase ii\analysis\[2017-11-14_gulchdri-analysis-tripgen36%31%-original.xls]int #2
1 1 14 3
Northbound
COP Drive NWNorthbound
COP Drive NW
Site Driveway 13
0.93 0.93
AYI Boulevard NWEastbound
0.93
Eastbound Westbound
Site Driveway 13Westbound
0 1 13 6
Southbound
INTERSECTION VOLUME DEVELOPMENT
Centennial Olympic Park Dr NW at Andrew Yound International Blvd NWAM PEAK HOUR
Southbound
0.93
PM PEAK HOUR
11/20/2017 10:54
0.91 0.91 0.91
COP Drive NW
0.91
COP Drive NW AYI Boulevard NW

Description Left Through Right Left Through Right Left Through Right Left Through Right
Observed 2017 Traffic Volumes 10 356 151 99 94 40 74 54 2 17 95 72PedestriansConflicting Pedestrians 4 4 4 4 5 3 3 5Heavy Vehicles 0 1 0 3 2 0 0 0 0 1 0 0Heavy Vehicle % 0% 0% 0% 3% 2% 0% 0% 0% 0% 6% 0% 0%Peak Hour FactorAdjustmentAdjusted 2017 Volumes 10 356 151 99 94 40 74 54 2 17 95 72Annual Growth Rate 1.0% 1.0% 1.0% 1.0% 1.0% 1.0% 1.0% 1.0% 1.0% 1.0% 1.0% 1.0%Growth Factor 1.105 1.105 1.105 1.105 1.105 1.105 1.105 1.105 1.105 1.105 1.105 1.105New Road AdjustmentOther Proposed Developments2027 Background Traffic 11 393 167 109 104 44 82 60 2 19 105 80
Project TripsTrip Distribution IN 0% 2% 1% 0% 0% 0% 3% 4% 0% 0% 0% 0%Trip Distribution OUT 0% 0% 0% 0% 2% 2% 0% 0% 0% 1% 8% 0%Residential Trips 0 1 1 0 3 3 2 2 0 2 12 0
Trip Distribution IN 0% 2% 3% 0% 0% 0% 2% 3% 0% 0% 0% 0%Trip Distribution OUT 0% 0% 0% 0% 2% 0% 0% 0% 0% 3% 6% 2%Hotel Trips 0 6 10 0 3 0 6 10 0 5 9 3
Trip Distribution IN 0% 2% 3% 0% 0% 0% 2% 3% 0% 0% 0% 0%Trip Distribution OUT 0% 0% 0% 0% 2% 0% 0% 0% 0% 3% 6% 2%Office Trips 0 79 119 0 10 0 79 119 0 15 31 10
Trip Distribution IN 0% 2% 3% 0% 0% 0% 2% 3% 0% 0% 0% 0%Trip Distribution OUT 0% 0% 0% 0% 2% 0% 0% 0% 0% 3% 6% 2%Retail Trips 0 4 7 0 3 0 4 7 0 4 8 3
Pass-By Trips 0 0 0 0 0 0 0 0 0 0 0 0
Total Project Trips 0 90 137 0 19 3 91 138 0 26 60 16
2027 Buildout Total 11 483 304 109 123 47 173 198 2 45 165 96
Description Left Through Right Left Through Right Left Through Right Left Through Right
Observed 2017 Traffic Volumes 10 43 37 578 442 135 31 50 5 29 223 30PedestriansConflicting Pedestrians 14 9 9 14 8 10 10 8Heavy Vehicles 0 0 0 0 1 0 0 0 0 0 0 0Heavy Vehicle % 0% 0% 0% 0% 0% 0% 0% 0% 0% 0% 0% 0%Peak Hour FactorAdjustmentAdjusted 2017 Volumes 10 43 37 578 442 135 31 50 5 29 223 30Annual Growth Rate 1.0% 1.0% 1.0% 1.0% 1.0% 1.0% 1.0% 1.0% 1.0% 1.0% 1.0% 1.0%Growth Factor 1.105 1.105 1.105 1.105 1.105 1.105 1.105 1.105 1.105 1.105 1.105 1.105New Road AdjustmentOther Proposed Developments2027 Background Traffic 11 47 41 638 488 149 34 55 6 32 246 33
Project TripsTrip Distribution IN 0% 2% 1% 0% 0% 0% 3% 4% 0% 0% 0% 0%Trip Distribution OUT 0% 0% 0% 0% 2% 2% 0% 0% 0% 1% 8% 0%Residential Trips 0 2 1 0 1 1 3 4 0 1 5 0
Trip Distribution IN 0% 2% 3% 0% 0% 0% 2% 3% 0% 0% 0% 0%Trip Distribution OUT 0% 0% 0% 0% 2% 0% 0% 0% 0% 3% 6% 2%Hotel Trips 0 6 9 0 6 0 6 9 0 9 18 6
Trip Distribution IN 0% 2% 3% 0% 0% 0% 2% 3% 0% 0% 0% 0%Trip Distribution OUT 0% 0% 0% 0% 2% 0% 0% 0% 0% 3% 6% 2%Office Trips 0 23 34 0 111 0 23 34 0 166 332 111
Trip Distribution IN 0% 2% 3% 0% 0% 0% 2% 3% 0% 0% 0% 0%Trip Distribution OUT 0% 0% 0% 0% 2% 0% 0% 0% 0% 3% 6% 2%Retail Trips 0 11 17 0 13 0 11 17 0 19 38 13
Trip Distribution INTrip Distribution OUTRestaurant Trips 0 0 0 0 0 0 0 0 0 0 0 0
Trip Distribution INTrip Distribution OUTNon-Residential Trips 0 0 0 0 0 0 0 0 0 0 0 0
Pass-By Trips 0 0 0 0 0 0 0 0 0 0 0 0
Total Project Trips 0 42 61 0 131 1 43 64 0 195 393 130
2027 Buildout Total 11 89 102 638 619 150 77 119 6 227 639 163k:\amt_civil\015170029_the gulch\eng\traffic\phase ii\analysis\[2017-11-14_gulchdri-analysis-tripgen36%31%-original.xls]int #3
INTERSECTION VOLUME DEVELOPMENT
Centennial Olympic Park Drive at Martin Luther King Jr DriveAM PEAK HOUR
COP Drive COP Drive MLK Drive MLK DriveNorthbound Southbound Eastbound Westbound
3 5 4 4
0.90 0.90 0.90 0.90
PM PEAK HOUR
COP Drive COP Drive MLK Drive MLK DriveNorthbound Southbound Eastbound Westbound
11/20/2017 10:54
10 8 14 9
0.93 0.93 0.93 0.93
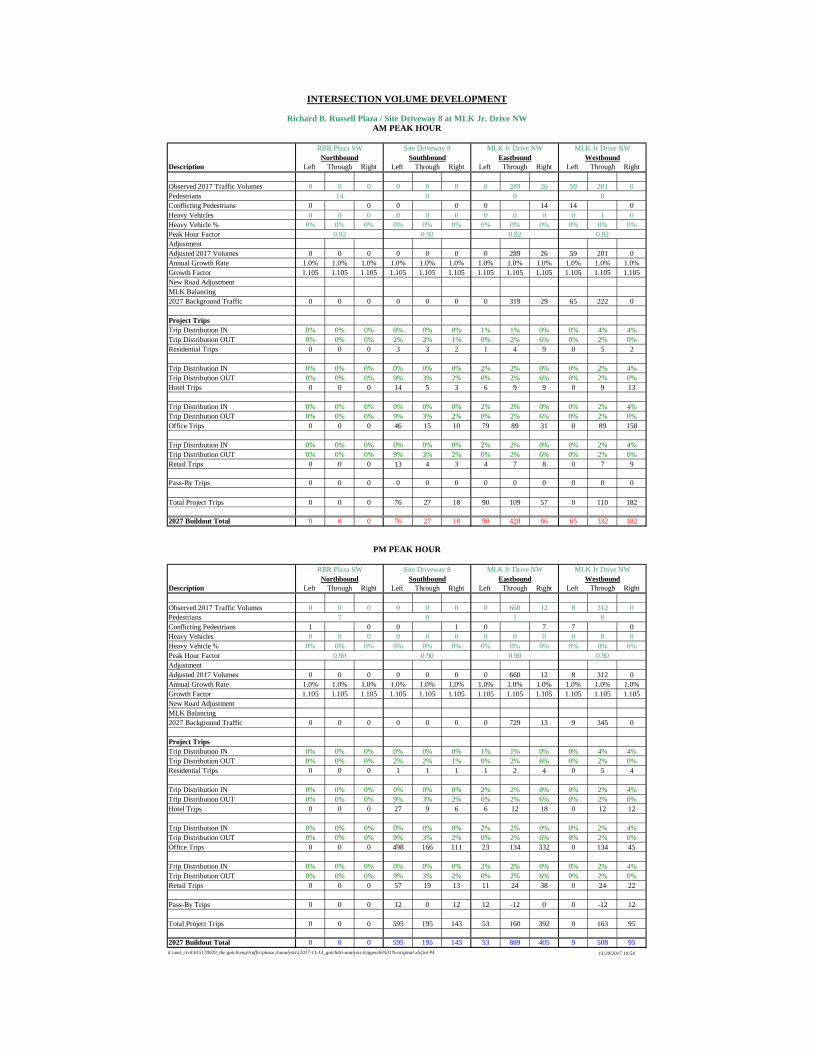
Description Left Through Right Left Through Right Left Through Right Left Through Right
Observed 2017 Traffic Volumes 0 0 0 0 0 0 0 289 26 59 201 0PedestriansConflicting Pedestrians 0 0 0 0 0 14 14 0Heavy Vehicles 0 0 0 0 0 0 0 0 0 0 1 0Heavy Vehicle % 0% 0% 0% 0% 0% 0% 0% 0% 0% 0% 0% 0%Peak Hour FactorAdjustmentAdjusted 2017 Volumes 0 0 0 0 0 0 0 289 26 59 201 0Annual Growth Rate 1.0% 1.0% 1.0% 1.0% 1.0% 1.0% 1.0% 1.0% 1.0% 1.0% 1.0% 1.0%Growth Factor 1.105 1.105 1.105 1.105 1.105 1.105 1.105 1.105 1.105 1.105 1.105 1.105New Road AdjustmentMLK Balancing2027 Background Traffic 0 0 0 0 0 0 0 319 29 65 222 0
Project TripsTrip Distribution IN 0% 0% 0% 0% 0% 0% 1% 1% 0% 0% 4% 4%Trip Distribution OUT 0% 0% 0% 2% 2% 1% 0% 2% 6% 0% 2% 0%Residential Trips 0 0 0 3 3 2 1 4 9 0 5 2
Trip Distribution IN 0% 0% 0% 0% 0% 0% 2% 2% 0% 0% 2% 4%Trip Distribution OUT 0% 0% 0% 9% 3% 2% 0% 2% 6% 0% 2% 0%Hotel Trips 0 0 0 14 5 3 6 9 9 0 9 13
Trip Distribution IN 0% 0% 0% 0% 0% 0% 2% 2% 0% 0% 2% 4%Trip Distribution OUT 0% 0% 0% 9% 3% 2% 0% 2% 6% 0% 2% 0%Office Trips 0 0 0 46 15 10 79 89 31 0 89 158
Trip Distribution IN 0% 0% 0% 0% 0% 0% 2% 2% 0% 0% 2% 4%Trip Distribution OUT 0% 0% 0% 9% 3% 2% 0% 2% 6% 0% 2% 0%Retail Trips 0 0 0 13 4 3 4 7 8 0 7 9
Pass-By Trips 0 0 0 0 0 0 0 0 0 0 0 0
Total Project Trips 0 0 0 76 27 18 90 109 57 0 110 182
2027 Buildout Total 0 0 0 76 27 18 90 428 86 65 332 182
Description Left Through Right Left Through Right Left Through Right Left Through Right
Observed 2017 Traffic Volumes 0 0 0 0 0 0 0 660 12 8 312 0PedestriansConflicting Pedestrians 1 0 0 1 0 7 7 0Heavy Vehicles 0 0 0 0 0 0 0 0 0 0 0 0Heavy Vehicle % 0% 0% 0% 0% 0% 0% 0% 0% 0% 0% 0% 0%Peak Hour FactorAdjustmentAdjusted 2017 Volumes 0 0 0 0 0 0 0 660 12 8 312 0Annual Growth Rate 1.0% 1.0% 1.0% 1.0% 1.0% 1.0% 1.0% 1.0% 1.0% 1.0% 1.0% 1.0%Growth Factor 1.105 1.105 1.105 1.105 1.105 1.105 1.105 1.105 1.105 1.105 1.105 1.105New Road AdjustmentMLK Balancing2027 Background Traffic 0 0 0 0 0 0 0 729 13 9 345 0
Project TripsTrip Distribution IN 0% 0% 0% 0% 0% 0% 1% 1% 0% 0% 4% 4%Trip Distribution OUT 0% 0% 0% 2% 2% 1% 0% 2% 6% 0% 2% 0%Residential Trips 0 0 0 1 1 1 1 2 4 0 5 4
Trip Distribution IN 0% 0% 0% 0% 0% 0% 2% 2% 0% 0% 2% 4%Trip Distribution OUT 0% 0% 0% 9% 3% 2% 0% 2% 6% 0% 2% 0%Hotel Trips 0 0 0 27 9 6 6 12 18 0 12 12
Trip Distribution IN 0% 0% 0% 0% 0% 0% 2% 2% 0% 0% 2% 4%Trip Distribution OUT 0% 0% 0% 9% 3% 2% 0% 2% 6% 0% 2% 0%Office Trips 0 0 0 498 166 111 23 134 332 0 134 45
Trip Distribution IN 0% 0% 0% 0% 0% 0% 2% 2% 0% 0% 2% 4%Trip Distribution OUT 0% 0% 0% 9% 3% 2% 0% 2% 6% 0% 2% 0%Retail Trips 0 0 0 57 19 13 11 24 38 0 24 22
Pass-By Trips 0 0 0 12 0 12 12 -12 0 0 -12 12
Total Project Trips 0 0 0 595 195 143 53 160 392 0 163 95
2027 Buildout Total 0 0 0 595 195 143 53 889 405 9 508 95k:\amt_civil\015170029_the gulch\eng\traffic\phase ii\analysis\[2017-11-14_gulchdri-analysis-tripgen36%31%-original.xls]int #4 11/20/2017 10:54
7 0 1 0
0.90 0.90 0.90 0.90
PM PEAK HOUR
RBR Plaza SW Site Driveway 8 MLK Jr Drive NW MLK Jr Drive NWNorthbound Southbound Eastbound Westbound
0.92 0.92 0.92 0.92
Northbound Southbound Eastbound Westbound
14 0 0 0
INTERSECTION VOLUME DEVELOPMENT
Richard B. Russell Plaza / Site Driveway 8 at MLK Jr. Drive NWAM PEAK HOUR
RBR Plaza SW Site Driveway 8 MLK Jr Drive NW MLK Jr Drive NW

Description Left Through Right Left Through Right Left Through Right Left Through Right
Observed 2017 Traffic Volumes 85 1,394 0 0 0 0 196 0 83 53 128 269PedestriansConflicting Pedestrians 17 10 10 17 17 16 16 17Heavy Vehicles 0 1 0 0 0 0 1 0 2 0 1 0Heavy Vehicle % 0% 0% 0% 0% 0% 0% 1% 0% 2% 0% 1% 0%Peak Hour FactorAdjustmentAdjusted 2017 Volumes 85 1394 0 0 0 0 196 0 83 53 128 269Annual Growth Rate 1.0% 1.0% 1.0% 1.0% 1.0% 1.0% 1.0% 1.0% 1.0% 1.0% 1.0% 1.0%Growth Factor 1.105 1.105 1.105 1.105 1.105 1.105 1.105 1.105 1.105 1.105 1.105 1.105New Road AdjustmentOther Proposed Developments2027 Background Traffic 94 1,540 0 0 0 0 217 0 92 59 141 297
Project TripsTrip Distribution IN 3% 4% 0% 0% 0% 0% 0% 10% 5%Trip Distribution OUT 0% 0% 0% 5% 0% 7% 0% 0% 0%Residential Trips 2 2 0 0 0 0 8 0 11 0 5 3
Trip Distribution IN 3% 4% 0% 0% 0% 0% 0% 10% 12%Trip Distribution OUT 0% 0% 0% 6% 0% 7% 0% 0% 0%Hotel Trips 10 13 0 0 0 0 9 0 11 0 32 39
Trip Distribution IN 3% 4% 0% 0% 0% 0% 0% 10% 12%Trip Distribution OUT 0% 0% 0% 6% 0% 7% 0% 0% 0%Office Trips 119 158 0 0 0 0 31 0 36 0 396 475
Trip Distribution IN 3% 4% 0% 0% 0% 0% 0% 10% 12%Trip Distribution OUT 0% 0% 0% 6% 0% 7% 0% 0% 0%Retail Trips 7 9 0 0 0 0 8 0 10 0 22 27
Pass-By Trips 0 0 0 0 0 0 0 0 0 0 0 0
Total Project Trips 138 182 0 0 0 0 56 0 68 0 455 544
2027 Buildout Total 232 1,722 0 0 0 0 273 0 160 59 596 841
Description Left Through Right Left Through Right Left Through Right Left Through Right
Observed 2017 Traffic Volumes 43 267 0 0 0 0 77 0 586 255 249 74PedestriansConflicting Pedestrians 9 10 10 9 9 10 10 9Heavy Vehicles 0 0 0 0 0 0 0 0 0 0 0 1Heavy Vehicle % 0% 0% 0% 0% 0% 0% 0% 0% 0% 0% 0% 1%Peak Hour FactorAdjustmentAdjusted 2017 Volumes 43 267 0 0 0 0 77 0 586 255 249 74Annual Growth Rate 1.0% 1.0% 1.0% 1.0% 1.0% 1.0% 1.0% 1.0% 1.0% 1.0% 1.0% 1.0%Growth Factor 1.105 1.105 1.105 1.105 1.105 1.105 1.105 1.105 1.105 1.105 1.105 1.105New Road AdjustmentOther Proposed Developments2027 Background Traffic 47 295 0 0 0 0 85 0 647 282 275 82
Project TripsTrip Distribution IN 3% 4% 0% 0% 0% 0% 0% 10% 5%Trip Distribution OUT 0% 0% 0% 5% 0% 7% 0% 0% 0%Residential Trips 3 4 0 0 0 0 3 0 5 0 11 5
Trip Distribution IN 3% 4% 0% 0% 0% 0% 0% 10% 12%Trip Distribution OUT 0% 0% 0% 6% 0% 7% 0% 0% 0%Hotel Trips 9 12 0 0 0 0 18 0 21 0 29 35
Trip Distribution IN 3% 4% 0% 0% 0% 0% 0% 10% 12%Trip Distribution OUT 0% 0% 0% 6% 0% 7% 0% 0% 0%Office Trips 34 45 0 0 0 0 332 0 387 0 113 136
Trip Distribution IN 3% 4% 0% 0% 0% 0% 0% 10% 12%Trip Distribution OUT 0% 0% 0% 6% 0% 7% 0% 0% 0%Retail Trips 17 22 0 0 0 0 38 0 44 0 56 67
Trip Distribution INTrip Distribution OUTRestaurant Trips 0 0 0 0 0 0 0 0 0 0 0 0
Trip Distribution INTrip Distribution OUTNon-Residential Trips 0 0 0 0 0 0 0 0 0 0 0 0
Pass-By Trips 0 0 0 0 0 0 0 0 0 0 0 0
Total Project Trips 63 83 0 0 0 0 391 0 457 0 209 243
2027 Buildout Total 110 378 0 0 0 0 476 0 1,104 282 484 325k:\amt_civil\015170029_the gulch\eng\traffic\phase ii\analysis\[2017-11-14_gulchdri-analysis-tripgen36%31%-original.xls]int #5
INTERSECTION VOLUME DEVELOPMENT
Spring Street at MLK Jr DriveAM PEAK HOUR
Spring Street Spring Street MLK Drive MLK DriveNorthbound Southbound Eastbound Westbound
16 17 17 10
0.97 0.97 0.97 0.97
PM PEAK HOUR
Spring Street Spring Street MLK Drive MLK DriveNorthbound Southbound Eastbound Westbound
11/20/2017 10:54
10 9 9 10
0.97 0.97 0.97 0.97

Description Left Through Right Left Through Right Left Through Right Left Through Right
Observed 2017 Traffic Volumes 109 471 0 0 100 61 0 0 0 52 343 108PedestriansConflicting Pedestrians 138 63 63 138 42 40 40 42Heavy Vehicles 0 0 0 0 0 0 0 0 0 20 0 9Heavy Vehicle % 0% 0% 0% 0% 0% 0% 0% 0% 0% 38% 0% 8%Peak Hour FactorAdjustmentAdjusted 2017 Volumes 109 471 0 0 100 61 0 0 0 52 343 108Annual Growth Rate 1.0% 1.0% 1.0% 1.0% 1.0% 1.0% 1.0% 1.0% 1.0% 1.0% 1.0% 1.0%Growth Factor 1.105 1.105 1.105 1.105 1.105 1.105 1.105 1.105 1.105 1.105 1.105 1.105New Road AdjustmentOther Proposed Developments2027 Background Traffic 120 520 0 0 110 67 0 0 0 57 379 119
Project TripsTrip Distribution IN 0% 0% 0% 0% 0% 0% 0% 0% 0% 0% 15% 10%Trip Distribution OUT 0% 0% 0% 0% 10% 0% 0% 0% 0% 0% 0% 0%Residential Trips 0 0 0 0 15 0 0 0 0 0 8 5
Trip Distribution IN 0% 0% 0% 0% 0% 2% 0% 0% 0% 0% 20% 5%Trip Distribution OUT 0% 0% 0% 0% 10% 0% 0% 0% 0% 0% 0% 0%Hotel Trips 0 0 0 0 15 6 0 0 0 0 65 16
Trip Distribution IN 0% 0% 0% 0% 0% 2% 0% 0% 0% 0% 20% 5%Trip Distribution OUT 0% 0% 0% 0% 10% 0% 0% 0% 0% 0% 0% 0%Office Trips 0 0 0 0 51 79 0 0 0 0 791 198
Trip Distribution IN 0% 0% 0% 0% 0% 2% 0% 0% 0% 0% 20% 5%Trip Distribution OUT 0% 0% 0% 0% 10% 0% 0% 0% 0% 0% 0% 0%Retail Trips 0 0 0 0 14 4 0 0 0 0 44 11
Pass-By Trips 0 0 0 0 0 0 0 0 0 0 0 0
Total Project Trips 0 0 0 0 95 89 0 0 0 0 908 230
2027 Buildout Total 120 520 0 0 205 156 0 0 0 57 1,287 349
Description Left Through Right Left Through Right Left Through Right Left Through Right
Observed 2017 Traffic Volumes 33 121 0 0 542 266 0 0 0 98 345 64PedestriansConflicting Pedestrians 145 84 84 145 46 60 60 46Heavy Vehicles 0 0 0 0 7 0 0 0 0 31 1 0Heavy Vehicle % 0% 0% 0% 0% 1% 0% 0% 0% 0% 32% 0% 0%Peak Hour FactorAdjustmentAdjusted 2017 Volumes 33 121 0 0 542 266 0 0 0 98 345 64Annual Growth Rate 1.0% 1.0% 1.0% 1.0% 1.0% 1.0% 1.0% 1.0% 1.0% 1.0% 1.0% 1.0%Growth Factor 1.105 1.105 1.105 1.105 1.105 1.105 1.105 1.105 1.105 1.105 1.105 1.105New Road AdjustmentOther Proposed Developments2027 Background Traffic 36 134 0 0 599 294 0 0 0 108 381 71
Project TripsTrip Distribution IN 0% 0% 0% 0% 0% 0% 0% 0% 0% 0% 15% 10%Trip Distribution OUT 0% 0% 0% 0% 10% 0% 0% 0% 0% 0% 0% 0%Residential Trips 0 0 0 0 7 0 0 0 0 0 16 11
Trip Distribution IN 0% 0% 0% 0% 0% 2% 0% 0% 0% 0% 20% 5%Trip Distribution OUT 0% 0% 0% 0% 10% 0% 0% 0% 0% 0% 0% 0%Hotel Trips 0 0 0 0 30 6 0 0 0 0 58 15
Trip Distribution IN 0% 0% 0% 0% 0% 2% 0% 0% 0% 0% 20% 5%Trip Distribution OUT 0% 0% 0% 0% 10% 0% 0% 0% 0% 0% 0% 0%Office Trips 0 0 0 0 553 23 0 0 0 0 226 57
Trip Distribution IN 0% 0% 0% 0% 0% 2% 0% 0% 0% 0% 20% 5%Trip Distribution OUT 0% 0% 0% 0% 10% 0% 0% 0% 0% 0% 0% 0%Retail Trips 0 0 0 0 63 11 0 0 0 0 111 28
Trip Distribution INTrip Distribution OUTRestaurant Trips 0 0 0 0 0 0 0 0 0 0 0 0
Trip Distribution INTrip Distribution OUTNon-Residential Trips 0 0 0 0 0 0 0 0 0 0 0 0
Pass-By Trips 0 0 0 0 0 0 0 0 0 0 0 0
Total Project Trips 0 0 0 0 653 40 0 0 0 0 411 111
2027 Buildout Total 36 134 0 0 1,252 334 0 0 0 108 792 182k:\amt_civil\015170029_the gulch\eng\traffic\phase ii\analysis\[2017-11-14_gulchdri-analysis-tripgen36%31%-original.xls]int #6 11/20/2017 10:54
60 46 145 84
0.94 0.94 0.94 0.94
PM PEAK HOUR
Forsyth St SW Forsyth St SW MLK Jr. Drive NW MLK Jr. Drive NWNorthbound Southbound Eastbound Westbound
0.97 0.97 0.97 0.97
Northbound Southbound Eastbound Westbound
40 42 138 63
INTERSECTION VOLUME DEVELOPMENT
Forsyth Street SW at MLK Jr. Drive NWAM PEAK HOUR
Forsyth St SW Forsyth St SW MLK Jr. Drive NW MLK Jr. Drive NW

Description Left Through Right Left Through Right Left Through Right Left Through Right
Observed 2017 Traffic Volumes 0 0 0 15 0 4 0 292 0 0 136 0PedestriansConflicting Pedestrians 3 0 0 3 11 0 0 11Heavy Vehicles 0 0 0 0 0 0 0 2 0 0 2 0Heavy Vehicle % 0% 0% 0% 0% 0% 0% 0% 1% 0% 0% 1% 0%Peak Hour FactorAdjustmentAdjusted 2017 Volumes 0 0 0 15 0 4 0 292 0 0 136 0Annual Growth Rate 1.0% 1.0% 1.0% 1.0% 1.0% 1.0% 1.0% 1.0% 1.0% 1.0% 1.0% 1.0%Growth Factor 1.105 1.105 1.105 1.105 1.105 1.105 1.105 1.105 1.105 1.105 1.105 1.105New Road AdjustmentOther Proposed Developments2027 Background Traffic 0 0 0 17 0 4 0 323 0 0 150 0
Project TripsTrip Distribution IN 0% 0% 0% 0% 0% 0% 0% 3% 0%Trip Distribution OUT 8% 0% 0% 0% 6% 0% 0% 0% 0%Residential Trips 0 0 0 12 0 0 0 9 0 0 2 0
Trip Distribution IN 0% 0% 0% 0% 0% 0% 0% 3% 0%Trip Distribution OUT 9% 0% 0% 0% 5% 0% 0% 0% 0%Hotel Trips 0 0 0 14 0 0 0 8 0 0 10 0
Trip Distribution IN 0% 0% 0% 0% 0% 0% 0% 3% 0%Trip Distribution OUT 9% 0% 0% 0% 5% 0% 0% 0% 0%Office Trips 0 0 0 46 0 0 0 26 0 0 119 0
Trip Distribution IN 0% 0% 0% 0% 0% 0% 0% 3% 0%Trip Distribution OUT 9% 0% 0% 0% 5% 0% 0% 0% 0%Retail Trips 0 0 0 13 0 0 0 7 0 0 7 0
Pass-By Trips 0 0 0 0 0 0 0 0 0 0 0 0
Total Project Trips 0 0 0 85 0 0 0 50 0 0 138 0
2027 Buildout Total 0 0 0 102 0 4 0 373 0 0 288 0
Description Left Through Right Left Through Right Left Through Right Left Through Right
Observed 2017 Traffic Volumes 0 0 0 88 0 17 0 558 0 0 123 0PedestriansConflicting Pedestrians 11 0 0 11 5 0 0 5Heavy Vehicles 0 0 0 0 0 0 0 2 0 0 0 0Heavy Vehicle % 0% 0% 0% 0% 0% 0% 0% 0% 0% 0% 0% 0%Peak Hour FactorAdjustmentAdjusted 2017 Volumes 0 0 0 88 0 17 0 558 0 0 123 0Annual Growth Rate 1.0% 1.0% 1.0% 1.0% 1.0% 1.0% 1.0% 1.0% 1.0% 1.0% 1.0% 1.0%Growth Factor 1.105 1.105 1.105 1.105 1.105 1.105 1.105 1.105 1.105 1.105 1.105 1.105New Road AdjustmentOther Proposed Developments2027 Background Traffic 0 0 0 97 0 19 0 616 0 0 136 0
Project TripsTrip Distribution IN 0% 0% 0% 0% 0% 0% 0% 3% 0%Trip Distribution OUT 8% 0% 0% 0% 6% 0% 0% 0% 0%Residential Trips 0 0 0 5 0 0 0 4 0 0 3 0
Trip Distribution IN 0% 0% 0% 0% 0% 0% 0% 3% 0%Trip Distribution OUT 9% 0% 0% 0% 5% 0% 0% 0% 0%Hotel Trips 0 0 0 27 0 0 0 15 0 0 9 0
Trip Distribution IN 0% 0% 0% 0% 0% 0% 0% 3% 0%Trip Distribution OUT 9% 0% 0% 0% 5% 0% 0% 0% 0%Office Trips 0 0 0 498 0 0 0 277 0 0 34 0
Trip Distribution IN 0% 0% 0% 0% 0% 0% 0% 3% 0%Trip Distribution OUT 9% 0% 0% 0% 5% 0% 0% 0% 0%Retail Trips 0 0 0 57 0 0 0 32 0 0 17 0
Trip Distribution INTrip Distribution OUTRestaurant Trips 0 0 0 0 0 0 0 0 0 0 0 0
Trip Distribution INTrip Distribution OUTNon-Residential Trips 0 0 0 0 0 0 0 0 0 0 0 0
Pass-By Trips 0 0 0 0 0 0 0 0 0 0 0 0
Total Project Trips 0 0 0 587 0 0 0 328 0 0 63 0
2027 Buildout Total 0 0 0 684 0 19 0 944 0 0 199 0k:\amt_civil\015170029_the gulch\eng\traffic\phase ii\analysis\[2017-11-14_gulchdri-analysis-tripgen36%31%-original.xls]int #7 11/20/2017 10:54
0 5 11 0
0.86 0.86 0.86 0.86
PM PEAK HOUR
RBR Plaza SW RBR Plaza SW Mitchell Street SW Mitchell Street SWNorthbound Southbound Eastbound Westbound
0.91 0.91 0.91 0.91
Northbound Southbound Eastbound Westbound
0 11 3 0
INTERSECTION VOLUME DEVELOPMENT
Richard B. Russell Plaza SW at Mitchell Street SWAM PEAK HOUR
RBR Plaza SW RBR Plaza SW Mitchell Street SW Mitchell Street SW
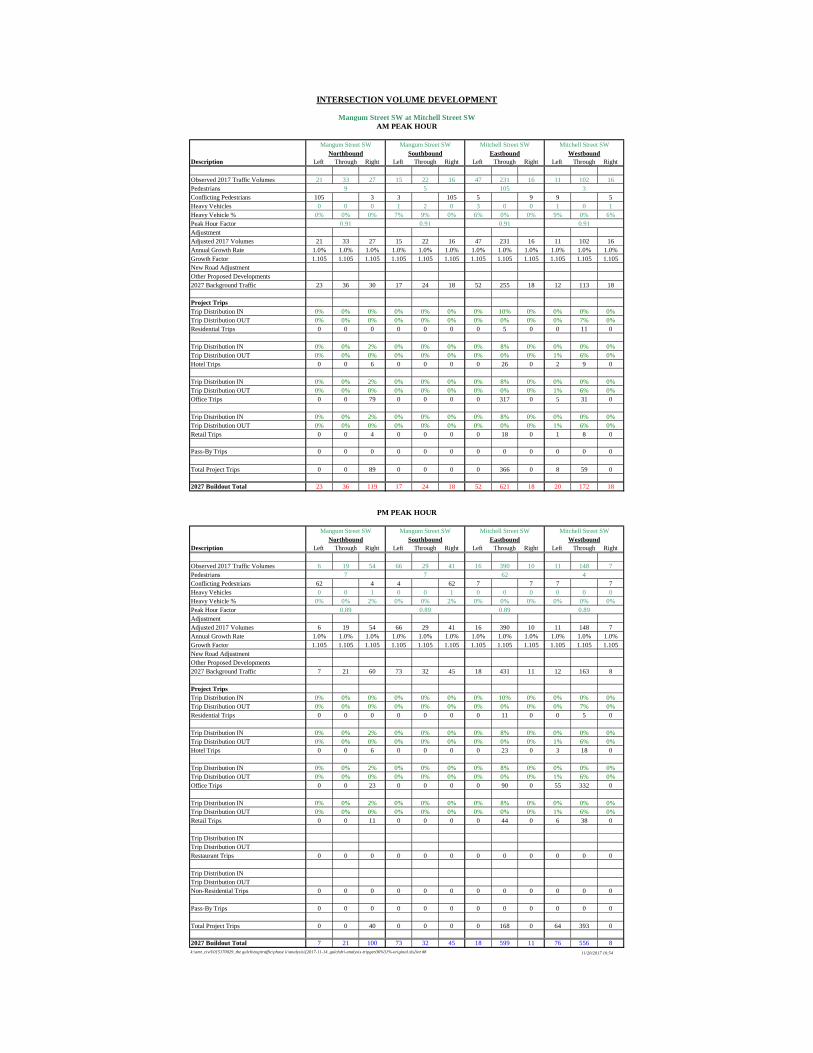
Description Left Through Right Left Through Right Left Through Right Left Through Right
Observed 2017 Traffic Volumes 21 33 27 15 22 16 47 231 16 11 102 16PedestriansConflicting Pedestrians 105 3 3 105 5 9 9 5Heavy Vehicles 0 0 0 1 2 0 3 0 0 1 0 1Heavy Vehicle % 0% 0% 0% 7% 9% 0% 6% 0% 0% 9% 0% 6%Peak Hour FactorAdjustmentAdjusted 2017 Volumes 21 33 27 15 22 16 47 231 16 11 102 16Annual Growth Rate 1.0% 1.0% 1.0% 1.0% 1.0% 1.0% 1.0% 1.0% 1.0% 1.0% 1.0% 1.0%Growth Factor 1.105 1.105 1.105 1.105 1.105 1.105 1.105 1.105 1.105 1.105 1.105 1.105New Road AdjustmentOther Proposed Developments2027 Background Traffic 23 36 30 17 24 18 52 255 18 12 113 18
Project TripsTrip Distribution IN 0% 0% 0% 0% 0% 0% 0% 10% 0% 0% 0% 0%Trip Distribution OUT 0% 0% 0% 0% 0% 0% 0% 0% 0% 0% 7% 0%Residential Trips 0 0 0 0 0 0 0 5 0 0 11 0
Trip Distribution IN 0% 0% 2% 0% 0% 0% 0% 8% 0% 0% 0% 0%Trip Distribution OUT 0% 0% 0% 0% 0% 0% 0% 0% 0% 1% 6% 0%Hotel Trips 0 0 6 0 0 0 0 26 0 2 9 0
Trip Distribution IN 0% 0% 2% 0% 0% 0% 0% 8% 0% 0% 0% 0%Trip Distribution OUT 0% 0% 0% 0% 0% 0% 0% 0% 0% 1% 6% 0%Office Trips 0 0 79 0 0 0 0 317 0 5 31 0
Trip Distribution IN 0% 0% 2% 0% 0% 0% 0% 8% 0% 0% 0% 0%Trip Distribution OUT 0% 0% 0% 0% 0% 0% 0% 0% 0% 1% 6% 0%Retail Trips 0 0 4 0 0 0 0 18 0 1 8 0
Pass-By Trips 0 0 0 0 0 0 0 0 0 0 0 0
Total Project Trips 0 0 89 0 0 0 0 366 0 8 59 0
2027 Buildout Total 23 36 119 17 24 18 52 621 18 20 172 18
Description Left Through Right Left Through Right Left Through Right Left Through Right
Observed 2017 Traffic Volumes 6 19 54 66 29 41 16 390 10 11 148 7PedestriansConflicting Pedestrians 62 4 4 62 7 7 7 7Heavy Vehicles 0 0 1 0 0 1 0 0 0 0 0 0Heavy Vehicle % 0% 0% 2% 0% 0% 2% 0% 0% 0% 0% 0% 0%Peak Hour FactorAdjustmentAdjusted 2017 Volumes 6 19 54 66 29 41 16 390 10 11 148 7Annual Growth Rate 1.0% 1.0% 1.0% 1.0% 1.0% 1.0% 1.0% 1.0% 1.0% 1.0% 1.0% 1.0%Growth Factor 1.105 1.105 1.105 1.105 1.105 1.105 1.105 1.105 1.105 1.105 1.105 1.105New Road AdjustmentOther Proposed Developments2027 Background Traffic 7 21 60 73 32 45 18 431 11 12 163 8
Project TripsTrip Distribution IN 0% 0% 0% 0% 0% 0% 0% 10% 0% 0% 0% 0%Trip Distribution OUT 0% 0% 0% 0% 0% 0% 0% 0% 0% 0% 7% 0%Residential Trips 0 0 0 0 0 0 0 11 0 0 5 0
Trip Distribution IN 0% 0% 2% 0% 0% 0% 0% 8% 0% 0% 0% 0%Trip Distribution OUT 0% 0% 0% 0% 0% 0% 0% 0% 0% 1% 6% 0%Hotel Trips 0 0 6 0 0 0 0 23 0 3 18 0
Trip Distribution IN 0% 0% 2% 0% 0% 0% 0% 8% 0% 0% 0% 0%Trip Distribution OUT 0% 0% 0% 0% 0% 0% 0% 0% 0% 1% 6% 0%Office Trips 0 0 23 0 0 0 0 90 0 55 332 0
Trip Distribution IN 0% 0% 2% 0% 0% 0% 0% 8% 0% 0% 0% 0%Trip Distribution OUT 0% 0% 0% 0% 0% 0% 0% 0% 0% 1% 6% 0%Retail Trips 0 0 11 0 0 0 0 44 0 6 38 0
Trip Distribution INTrip Distribution OUTRestaurant Trips 0 0 0 0 0 0 0 0 0 0 0 0
Trip Distribution INTrip Distribution OUTNon-Residential Trips 0 0 0 0 0 0 0 0 0 0 0 0
Pass-By Trips 0 0 0 0 0 0 0 0 0 0 0 0
Total Project Trips 0 0 40 0 0 0 0 168 0 64 393 0
2027 Buildout Total 7 21 100 73 32 45 18 599 11 76 556 8k:\amt_civil\015170029_the gulch\eng\traffic\phase ii\analysis\[2017-11-14_gulchdri-analysis-tripgen36%31%-original.xls]int #8 11/20/2017 10:54
7 7 62 4
0.89 0.89 0.89 0.89
PM PEAK HOUR
Mangum Street SW Mangum Street SW Mitchell Street SW Mitchell Street SWNorthbound Southbound Eastbound Westbound
0.91 0.91 0.91 0.91
Northbound Southbound Eastbound Westbound
9 5 105 3
INTERSECTION VOLUME DEVELOPMENT
Mangum Street SW at Mitchell Street SWAM PEAK HOUR
Mangum Street SW Mangum Street SW Mitchell Street SW Mitchell Street SW
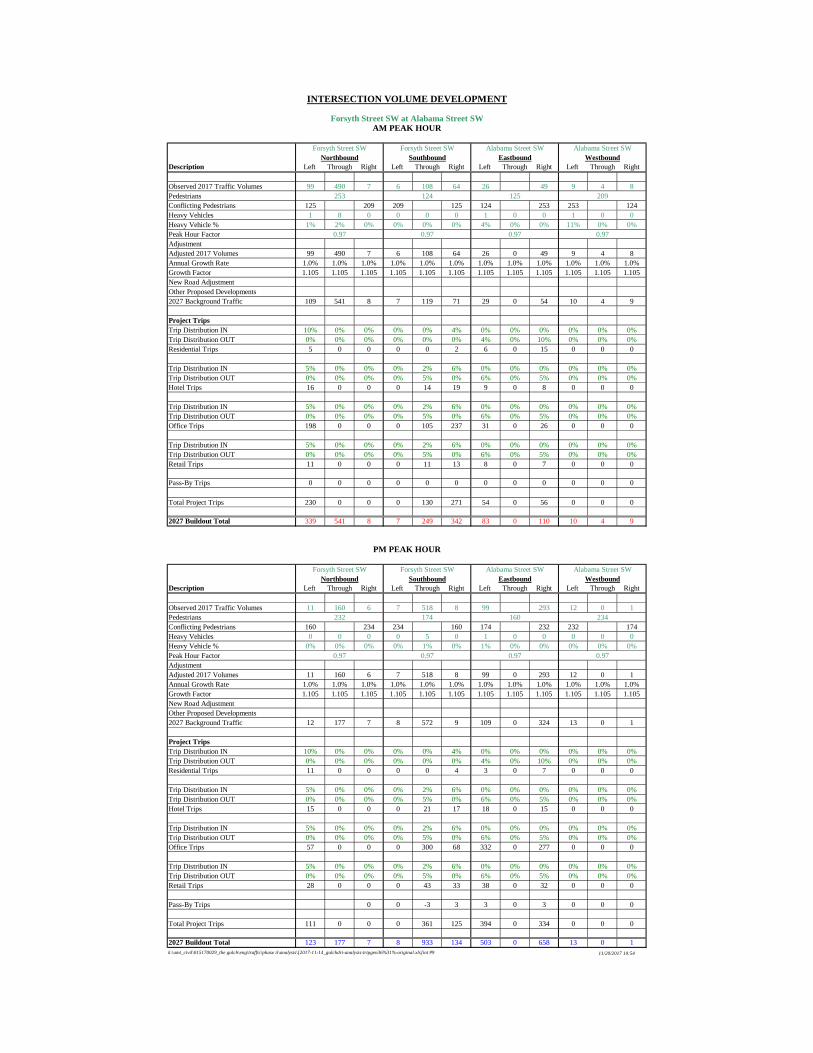
Description Left Through Right Left Through Right Left Through Right Left Through Right
Observed 2017 Traffic Volumes 99 490 7 6 108 64 26 49 9 4 8PedestriansConflicting Pedestrians 125 209 209 125 124 253 253 124Heavy Vehicles 1 8 0 0 0 0 1 0 0 1 0 0Heavy Vehicle % 1% 2% 0% 0% 0% 0% 4% 0% 0% 11% 0% 0%Peak Hour FactorAdjustmentAdjusted 2017 Volumes 99 490 7 6 108 64 26 0 49 9 4 8Annual Growth Rate 1.0% 1.0% 1.0% 1.0% 1.0% 1.0% 1.0% 1.0% 1.0% 1.0% 1.0% 1.0%Growth Factor 1.105 1.105 1.105 1.105 1.105 1.105 1.105 1.105 1.105 1.105 1.105 1.105New Road AdjustmentOther Proposed Developments2027 Background Traffic 109 541 8 7 119 71 29 0 54 10 4 9
Project TripsTrip Distribution IN 10% 0% 0% 0% 0% 4% 0% 0% 0% 0% 0% 0%Trip Distribution OUT 0% 0% 0% 0% 0% 0% 4% 0% 10% 0% 0% 0%Residential Trips 5 0 0 0 0 2 6 0 15 0 0 0
Trip Distribution IN 5% 0% 0% 0% 2% 6% 0% 0% 0% 0% 0% 0%Trip Distribution OUT 0% 0% 0% 0% 5% 0% 6% 0% 5% 0% 0% 0%Hotel Trips 16 0 0 0 14 19 9 0 8 0 0 0
Trip Distribution IN 5% 0% 0% 0% 2% 6% 0% 0% 0% 0% 0% 0%Trip Distribution OUT 0% 0% 0% 0% 5% 0% 6% 0% 5% 0% 0% 0%Office Trips 198 0 0 0 105 237 31 0 26 0 0 0
Trip Distribution IN 5% 0% 0% 0% 2% 6% 0% 0% 0% 0% 0% 0%Trip Distribution OUT 0% 0% 0% 0% 5% 0% 6% 0% 5% 0% 0% 0%Retail Trips 11 0 0 0 11 13 8 0 7 0 0 0
Pass-By Trips 0 0 0 0 0 0 0 0 0 0 0 0
Total Project Trips 230 0 0 0 130 271 54 0 56 0 0 0
2027 Buildout Total 339 541 8 7 249 342 83 0 110 10 4 9
Description Left Through Right Left Through Right Left Through Right Left Through Right
Observed 2017 Traffic Volumes 11 160 6 7 518 8 99 293 12 0 1PedestriansConflicting Pedestrians 160 234 234 160 174 232 232 174Heavy Vehicles 0 0 0 0 5 0 1 0 0 0 0 0Heavy Vehicle % 0% 0% 0% 0% 1% 0% 1% 0% 0% 0% 0% 0%Peak Hour FactorAdjustmentAdjusted 2017 Volumes 11 160 6 7 518 8 99 0 293 12 0 1Annual Growth Rate 1.0% 1.0% 1.0% 1.0% 1.0% 1.0% 1.0% 1.0% 1.0% 1.0% 1.0% 1.0%Growth Factor 1.105 1.105 1.105 1.105 1.105 1.105 1.105 1.105 1.105 1.105 1.105 1.105New Road AdjustmentOther Proposed Developments2027 Background Traffic 12 177 7 8 572 9 109 0 324 13 0 1
Project TripsTrip Distribution IN 10% 0% 0% 0% 0% 4% 0% 0% 0% 0% 0% 0%Trip Distribution OUT 0% 0% 0% 0% 0% 0% 4% 0% 10% 0% 0% 0%Residential Trips 11 0 0 0 0 4 3 0 7 0 0 0
Trip Distribution IN 5% 0% 0% 0% 2% 6% 0% 0% 0% 0% 0% 0%Trip Distribution OUT 0% 0% 0% 0% 5% 0% 6% 0% 5% 0% 0% 0%Hotel Trips 15 0 0 0 21 17 18 0 15 0 0 0
Trip Distribution IN 5% 0% 0% 0% 2% 6% 0% 0% 0% 0% 0% 0%Trip Distribution OUT 0% 0% 0% 0% 5% 0% 6% 0% 5% 0% 0% 0%Office Trips 57 0 0 0 300 68 332 0 277 0 0 0
Trip Distribution IN 5% 0% 0% 0% 2% 6% 0% 0% 0% 0% 0% 0%Trip Distribution OUT 0% 0% 0% 0% 5% 0% 6% 0% 5% 0% 0% 0%Retail Trips 28 0 0 0 43 33 38 0 32 0 0 0
Pass-By Trips 0 0 -3 3 3 0 3 0 0 0
Total Project Trips 111 0 0 0 361 125 394 0 334 0 0 0
2027 Buildout Total 123 177 7 8 933 134 503 0 658 13 0 1k:\amt_civil\015170029_the gulch\eng\traffic\phase ii\analysis\[2017-11-14_gulchdri-analysis-tripgen36%31%-original.xls]int #9 11/20/2017 10:54
232 174 160 234
0.97 0.97 0.97 0.97
PM PEAK HOUR
Forsyth Street SW Forsyth Street SW Alabama Street SW Alabama Street SWNorthbound Southbound Eastbound Westbound
0.97 0.97 0.97 0.97
Northbound Southbound Eastbound Westbound
253 124 125 209
INTERSECTION VOLUME DEVELOPMENT
Forsyth Street SW at Alabama Street SWAM PEAK HOUR
Forsyth Street SW Forsyth Street SW Alabama Street SW Alabama Street SW

Description Left Through Right Left Through Right Left Through Right Left Through Right17% 77% 6% 22% 78% 0% 0% 70% 30%
Observed 2017 Traffic Volumes 259 1,184 92 0 0 0 129 446 0 298 127PedestriansConflicting Pedestrians 35 55 55 35 64 156 156 64Heavy Vehicles 0 2 0 0 0 0 2 1 0 0 3 5Heavy Vehicle % 0% 0% 0% 0% 0% 0% 2% 0% 0% 0% 1% 4%Peak Hour FactorAdjustmentAdjusted 2017 Volumes 259 1184 92 0 0 0 129 446 0 0 298 127Annual Growth Rate 1.0% 1.0% 1.0% 1.0% 1.0% 1.0% 1.0% 1.0% 1.0% 1.0% 1.0% 1.0%Growth Factor 1.105 1.105 1.105 1.105 1.105 1.105 1.105 1.105 1.105 1.105 1.105 1.105New Road AdjustmentOther Proposed Developments2027 Background Traffic 286 1,308 102 0 0 0 142 493 0 0 329 140
Project TripsTrip Distribution IN 0% 0% 0% 0% 0% 0% 0% 7% 0%Trip Distribution OUT 0% 17% 3% 0% 0% 5% 11% 0% 0%Residential Trips 0 26 5 0 0 0 8 17 0 0 4 0
Trip Distribution IN 0% 0% 0% 0% 0% 0% 0% 7% 0%Trip Distribution OUT 0% 17% 5% 0% 0% 6% 8% 0% 0%Hotel Trips 0 26 8 0 0 0 9 12 0 0 23 0
Trip Distribution IN 0% 0% 0% 0% 0% 0% 0% 7% 0%Trip Distribution OUT 0% 17% 5% 0% 0% 6% 8% 0% 0%Office Trips 0 87 26 0 0 0 31 41 0 0 277 0
Trip Distribution IN 0% 0% 0% 0% 0% 0% 0% 7% 0%Trip Distribution OUT 0% 17% 5% 0% 0% 6% 8% 0% 0%Retail Trips 0 24 7 0 0 0 8 11 0 0 16 0
Pass-By Trips 0 0 0 0 0 0 0 0 0 0 0 0
Total Project Trips 0 163 46 0 0 0 56 81 0 0 320 0
2027 Buildout Total 286 1,471 148 0 0 0 198 574 0 0 649 140
Description Left Through Right Left Through Right Left Through Right Left Through Right
Observed 2017 Traffic Volumes 199 676 107 0 0 0 178 469 0 0 443 152PedestriansConflicting Pedestrians 26 53 53 26 85 147 147 85Heavy Vehicles 0 1 0 0 0 0 1 6 0 0 0 0Heavy Vehicle % 0% 0% 0% 0% 0% 0% 1% 1% 0% 0% 0% 0%Peak Hour FactorAdjustmentAdjusted 2017 Volumes 199 676 107 0 0 0 178 469 0 0 443 152Annual Growth Rate 1.0% 1.0% 1.0% 1.0% 1.0% 1.0% 1.0% 1.0% 1.0% 1.0% 1.0% 1.0%Growth Factor 1.105 1.105 1.105 1.105 1.105 1.105 1.105 1.105 1.105 1.105 1.105 1.105New Road AdjustmentOther Proposed Developments2027 Background Traffic 220 747 118 0 0 0 197 518 0 0 489 168
Project TripsTrip Distribution IN 0% 0% 0% 0% 0% 0% 0% 7% 0%Trip Distribution OUT 0% 17% 3% 0% 0% 5% 11% 0% 0%Residential Trips 0 11 2 0 0 0 3 7 0 0 7 0
Trip Distribution IN 0% 0% 0% 0% 0% 0% 0% 7% 0%Trip Distribution OUT 0% 17% 5% 0% 0% 6% 8% 0% 0%Hotel Trips 0 50 15 0 0 0 18 24 0 0 20 0
Trip Distribution IN 0% 0% 0% 0% 0% 0% 0% 7% 0%Trip Distribution OUT 0% 17% 5% 0% 0% 6% 8% 0% 0%Office Trips 0 940 277 0 0 0 332 443 0 0 79 0
Trip Distribution IN 0% 0% 0% 0% 0% 0% 0% 7% 0%Trip Distribution OUT 0% 17% 5% 0% 0% 6% 8% 0% 0%Retail Trips 0 107 32 0 0 0 38 50 0 0 39 0
Trip Distribution INTrip Distribution OUTRestaurant Trips 0 0 0 0 0 0 0 0 0 0 0 0
Trip Distribution INTrip Distribution OUTNon-Residential Trips 0 0 0 0 0 0 0 0 0 0 0 0
Pass-By Trips 0 0 0 0 0 0 0 0 0 0 0 0
Total Project Trips 0 1,108 326 0 0 0 391 524 0 0 145 0
2027 Buildout Total 220 1,855 444 0 0 0 588 1,042 0 0 634 168k:\amt_civil\015170029_the gulch\eng\traffic\phase ii\analysis\[2017-11-14_gulchdri-analysis-tripgen36%31%-original.xls]int #10 11/20/2017 10:54
147 85 26 53
0.89 0.89 0.89 0.89
PM PEAK HOUR
Spring Street NW Spring Street NW Marietta Street NW Marietta Street NWNorthbound Southbound Eastbound Westbound
0.94 0.94 0.94 0.94
Northbound Southbound Eastbound Westbound
156 64 35 55
INTERSECTION VOLUME DEVELOPMENT
Spring Street NW at Marietta Street NWAM PEAK HOUR
Spring Street NW Spring Street NW Marietta Street NW Marietta Street NW

Description Left Through Right Left Through Right Left Through Right Left Through Right
Observed 2017 Traffic Volumes 219 200 112 23 48 35 37 269 90 42 261 35PedestriansConflicting Pedestrians 63 118 118 63 113 137 137 113Heavy Vehicles 8 0 2 0 0 0 0 3 0 0 3 0Heavy Vehicle % 4% 0% 2% 0% 0% 0% 0% 1% 0% 0% 1% 0%Peak Hour FactorAdjustmentAdjusted 2017 Volumes 219 200 112 23 48 35 37 269 90 42 261 35Annual Growth Rate 1.0% 1.0% 1.0% 1.0% 1.0% 1.0% 1.0% 1.0% 1.0% 1.0% 1.0% 1.0%Growth Factor 1.105 1.105 1.105 1.105 1.105 1.105 1.105 1.105 1.105 1.105 1.105 1.105New Road AdjustmentOther Proposed Developments2027 Background Traffic 242 221 124 25 53 39 41 297 99 46 288 39
Project TripsTrip Distribution IN 0% 0% 0% 0% 3% 2% 0% 0% 0% 5% 5% 0%Trip Distribution OUT 0% 3% 5% 0% 0% 0% 4% 10% 0% 0% 0% 0%Residential Trips 0 5 8 0 2 1 6 15 0 3 3 0
Trip Distribution IN 0% 0% 0% 0% 3% 2% 0% 0% 0% 10% 5% 0%Trip Distribution OUT 0% 3% 5% 0% 0% 0% 4% 9% 0% 0% 0% 0%Hotel Trips 0 5 8 0 10 6 6 14 0 32 16 0
Trip Distribution IN 0% 0% 0% 0% 3% 2% 0% 0% 0% 10% 5% 0%Trip Distribution OUT 0% 3% 5% 0% 0% 0% 4% 9% 0% 0% 0% 0%Office Trips 0 15 26 0 119 79 20 46 0 396 198 0
Trip Distribution IN 0% 0% 0% 0% 3% 2% 0% 0% 0% 10% 5% 0%Trip Distribution OUT 0% 3% 5% 0% 0% 0% 4% 9% 0% 0% 0% 0%Retail Trips 0 4 7 0 7 4 6 13 0 22 11 0
Pass-By Trips 0 0 0 0 0 0 0 0 0 0 0 0
Total Project Trips 0 29 49 0 138 90 38 88 0 453 228 0
2027 Buildout Total 242 250 173 25 191 129 79 385 99 499 516 39
Description Left Through Right Left Through Right Left Through Right Left Through Right3% 62% 36%
Observed 2017 Traffic Volumes 110 82 74 22 221 44 19 406 234 58 326 38PedestriansConflicting Pedestrians 63 118 118 63 96 143 143 96Heavy Vehicles 0 0 0 0 0 1 0 3 5 0 0 1Heavy Vehicle % 0% 0% 0% 0% 0% 2% 0% 1% 2% 0% 0% 3%Peak Hour FactorAdjustmentAdjusted 2017 Volumes 110 82 74 22 221 44 19 406 234 58 326 38Annual Growth Rate 1.0% 1.0% 1.0% 1.0% 1.0% 1.0% 1.0% 1.0% 1.0% 1.0% 1.0% 1.0%Growth Factor 1.105 1.105 1.105 1.105 1.105 1.105 1.105 1.105 1.105 1.105 1.105 1.105New Road AdjustmentOther Proposed Developments2027 Background Traffic 122 91 82 24 244 49 21 448 258 64 360 42
Project TripsTrip Distribution IN 0% 0% 0% 0% 3% 2% 0% 0% 0% 5% 5% 0%Trip Distribution OUT 0% 3% 5% 0% 0% 0% 4% 10% 0% 0% 0% 0%Residential Trips 0 2 3 0 3 2 3 7 0 5 5 0
Trip Distribution IN 0% 0% 0% 0% 3% 2% 0% 0% 0% 10% 5% 0%Trip Distribution OUT 0% 3% 5% 0% 0% 0% 4% 9% 0% 0% 0% 0%Hotel Trips 0 9 15 0 9 6 12 27 0 29 15 0
Trip Distribution IN 0% 0% 0% 0% 3% 2% 0% 0% 0% 10% 5% 0%Trip Distribution OUT 0% 3% 5% 0% 0% 0% 4% 9% 0% 0% 0% 0%Office Trips 0 166 277 0 34 23 221 498 0 113 57 0
Trip Distribution IN 0% 0% 0% 0% 3% 2% 0% 0% 0% 10% 5% 0%Trip Distribution OUT 0% 3% 5% 0% 0% 0% 4% 9% 0% 0% 0% 0%Retail Trips 0 19 32 0 17 11 25 57 0 56 28 0
Trip Distribution INTrip Distribution OUTRestaurant Trips 0 0 0 0 0 0 0 0 0 0 0 0
Trip Distribution INTrip Distribution OUTNon-Residential Trips 0 0 0 0 0 0 0 0 0 0 0 0
Pass-By Trips 0 0 0 0 0 0 0 0 0 0 0 0
Total Project Trips 0 196 327 0 63 42 261 589 0 203 105 0
2027 Buildout Total 122 287 409 24 307 91 282 1,037 258 267 465 42k:\amt_civil\015170029_the gulch\eng\traffic\phase ii\analysis\[2017-11-14_gulchdri-analysis-tripgen36%31%-original.xls]int #11 11/20/2017 10:54
143 96 63 118
0.91 0.91 0.91 0.91
PM PEAK HOUR
Forsyth Street SW Forsyth Street SW Marietta Street NW Marietta Street NWNorthbound Southbound Eastbound Westbound
0.92 0.92 0.92 0.92
Northbound Southbound Eastbound Westbound
137 113 63 118
INTERSECTION VOLUME DEVELOPMENT
Forsyth Street SW at Marietta Street NWAM PEAK HOUR
Forsyth Street SW Forsyth Street SW Marietta Street NW Marietta Street NW

Description Left Through Right Left Through Right Left Through Right Left Through Right
Observed 2017 Traffic Volumes 42 1,131 29 7 145 6 283 240 71 24 41 93PedestriansConflicting Pedestrians 2 10 10 2 3 16 16 3Heavy Vehicles 0 16 0 0 2 1 1 0 1 1 0 0Heavy Vehicle % 0% 1% 0% 0% 1% 17% 0% 0% 1% 4% 0% 0%Peak Hour FactorAdjustmentAdjusted 2017 Volumes 42 1131 29 7 145 6 283 240 71 24 41 93Annual Growth Rate 1.0% 1.0% 1.0% 1.0% 1.0% 1.0% 1.0% 1.0% 1.0% 1.0% 1.0% 1.0%Growth Factor 1.105 1.105 1.105 1.105 1.105 1.105 1.105 1.105 1.105 1.105 1.105 1.105New Road AdjustmentOther Proposed Developments2027 Background Traffic 46 1,249 32 8 160 7 313 265 78 27 45 103
Project TripsTrip Distribution IN 0% 10% 0% 0% 0% 0% 0% 0% 0% 0% 0% 0%Trip Distribution OUT 0% 0% 0% 0% 10% 0% 0% 0% 0% 0% 0% 0%Residential Trips 0 5 0 0 15 0 0 0 0 0 0 0
Trip Distribution IN 0% 10% 0% 0% 0% 0% 0% 0% 0% 0% 0% 0%Trip Distribution OUT 0% 0% 0% 0% 10% 0% 0% 0% 0% 0% 0% 0%Hotel Trips 0 32 0 0 15 0 0 0 0 0 0 0
Trip Distribution IN 0% 10% 0% 0% 0% 0% 0% 0% 0% 0% 0% 0%Trip Distribution OUT 0% 0% 0% 0% 10% 0% 0% 0% 0% 0% 0% 0%Office Trips 0 396 0 0 51 0 0 0 0 0 0 0
Trip Distribution IN 0% 10% 0% 0% 0% 0% 0% 0% 0% 0% 0% 0%Trip Distribution OUT 0% 0% 0% 0% 10% 0% 0% 0% 0% 0% 0% 0%Retail Trips 0 22 0 0 14 0 0 0 0 0 0 0
Trip Distribution INTrip Distribution OUTRestaurant Trips 0 0 0 0 0 0 0 0 0 0 0 0
Trip Distribution INTrip Distribution OUTOther Non-Residential Trips 0 0 0 0 0 0 0 0 0 0 0 0
Pass-By Trips 0 0 0 0 0 0 0 0 0 0 0 0
Total Project Trips 0 455 0 0 95 0 0 0 0 0 0 0
2027 Buildout Total 46 1,704 32 8 255 7 313 265 78 27 45 103
Description Left Through Right Left Through Right Left Through Right Left Through Right
Observed 2017 Traffic Volumes 48 418 26 10 1,107 26 70 101 273 163 136 53PedestriansConflicting Pedestrians 8 6 6 8 17 17 17 17Heavy Vehicles 0 1 0 0 0 0 0 0 0 18 0 0Heavy Vehicle % 0% 0% 0% 0% 0% 0% 0% 0% 0% 11% 0% 0%Peak Hour FactorAdjustmentAdjusted 2017 Volumes 48 418 26 10 1107 26 70 101 273 163 136 53Annual Growth Rate 1.0% 1.0% 1.0% 1.0% 1.0% 1.0% 1.0% 1.0% 1.0% 1.0% 1.0% 1.0%Growth Factor 1.105 1.105 1.105 1.105 1.105 1.105 1.105 1.105 1.105 1.105 1.105 1.105New Road AdjustmentOther Proposed Developments2027 Background Traffic 53 462 29 11 1,223 29 77 112 302 180 150 59
Project TripsTrip Distribution IN 0% 10% 0% 0% 0% 0% 0% 0% 0% 0% 0% 0%Trip Distribution OUT 0% 0% 0% 0% 10% 0% 0% 0% 0% 0% 0% 0%Residential Trips 0 11 0 0 7 0 0 0 0 0 0 0
Trip Distribution IN 0% 10% 0% 0% 0% 0% 0% 0% 0% 0% 0% 0%Trip Distribution OUT 0% 0% 0% 0% 10% 0% 0% 0% 0% 0% 0% 0%Hotel Trips 0 29 0 0 30 0 0 0 0 0 0 0
Trip Distribution IN 0% 10% 0% 0% 0% 0% 0% 0% 0% 0% 0% 0%Trip Distribution OUT 0% 0% 0% 0% 10% 0% 0% 0% 0% 0% 0% 0%Office Trips 0 113 0 0 553 0 0 0 0 0 0 0
Trip Distribution IN 0% 10% 0% 0% 0% 0% 0% 0% 0% 0% 0% 0%Trip Distribution OUT 0% 0% 0% 0% 10% 0% 0% 0% 0% 0% 0% 0%Retail Trips 0 56 0 0 63 0 0 0 0 0 0 0
Trip Distribution INTrip Distribution OUTRestaurant Trips 0 0 0 0 0 0 0 0 0 0 0 0
Trip Distribution INTrip Distribution OUTNon-Residential Trips 0 0 0 0 0 0 0 0 0 0 0 0
Pass-By Trips 0 0 0 0 0 0 0 0 0 0 0 0
Total Project Trips 0 209 0 0 653 0 0 0 0 0 0 0
2027 Buildout Total 53 671 29 11 1,876 29 77 112 302 180 150 59k:\amt_civil\015170029_the gulch\eng\traffic\phase ii\analysis\[2017-11-14_gulchdri-analysis-tripgen36%31%-original.xls]int #12 11/20/2017 10:54
17 17 8 6
0.92 0.92 0.92 0.92
PM PEAK HOUR
Ted Turner Ted Turner Peters Street Trinity AveNorthbound Southbound Eastbound Westbound
0.97 0.97 0.97 0.97
Northbound Southbound Eastbound Westbound
16 3 2 10
INTERSECTION VOLUME DEVELOPMENT
Ted Turner Drive at Peters Street / Trinity AvenueAM PEAK HOUR
Ted Turner Ted Turner Peters Street Trinity Ave

Description Left Through Right Left Through Right Left Through Right Left Through Right
Observed 2017 Traffic Volumes 127 1,418 62 28 89 8 50 172 87 0 0 0PedestriansConflicting Pedestrians 19 46 46 19 28 18 18 28Heavy Vehicles 1 2 16 0 0 0 0 0 4 0 0 0Heavy Vehicle % 1% 0% 26% 0% 0% 0% 0% 0% 5% 0% 0% 0%Peak Hour FactorAdjustmentAdjusted 2017 Volumes 127 1418 62 28 89 8 50 172 87 0 0 0Annual Growth Rate 1.0% 1.0% 1.0% 1.0% 1.0% 1.0% 1.0% 1.0% 1.0% 1.0% 1.0% 1.0%Growth Factor 1.105 1.105 1.105 1.105 1.105 1.105 1.105 1.105 1.105 1.105 1.105 1.105New Road AdjustmentOther Proposed Developments2027 Background Traffic 140 1,566 68 31 98 9 55 190 96 0 0 0
Project TripsTrip Distribution IN 3% 7% 0% 0% 0% 0% 0% 0% 0% 0% 0% 0%Trip Distribution OUT 0% 0% 0% 4% 3% 0% 0% 7% 7% 0% 0% 0%Residential Trips 2 4 0 6 5 0 0 11 11 0 0 0
Trip Distribution IN 3% 7% 0% 0% 0% 0% 0% 0% 0% 0% 0% 0%Trip Distribution OUT 0% 0% 0% 4% 3% 0% 0% 7% 7% 0% 0% 0%Hotel Trips 10 23 0 6 5 0 0 11 11 0 0 0
Trip Distribution IN 3% 7% 0% 0% 0% 0% 0% 0% 0% 0% 0% 0%Trip Distribution OUT 0% 0% 0% 4% 3% 0% 0% 7% 7% 0% 0% 0%Office Trips 119 277 0 20 15 0 0 36 36 0 0 0
Trip Distribution IN 3% 7% 0% 0% 0% 0% 0% 0% 0% 0% 0% 0%Trip Distribution OUT 0% 0% 0% 4% 3% 0% 0% 7% 7% 0% 0% 0%Retail Trips 7 16 0 6 4 0 0 10 10 0 0 0
Pass-By Trips 0 0 0 0 0 0 0 0 0 0 0 0
Total Project Trips 138 320 0 38 29 0 0 68 68 0 0 0
2027 Buildout Total 278 1,886 68 69 127 9 55 258 164 0 0 0
Description Left Through Right Left Through Right Left Through Right Left Through Right
Observed 2017 Traffic Volumes 119 428 41 75 747 5 47 255 327 0 0 0PedestriansConflicting Pedestrians 16 19 19 16 19 14 14 19Heavy Vehicles 0 0 0 0 0 0 0 1 1 0 0 0Heavy Vehicle % 0% 0% 0% 0% 0% 0% 0% 0% 0% 0% 0% 0%Peak Hour FactorAdjustmentAdjusted 2017 Volumes 119 428 41 75 747 5 47 255 327 0 0 0Annual Growth Rate 1.0% 1.0% 1.0% 1.0% 1.0% 1.0% 1.0% 1.0% 1.0% 1.0% 1.0% 1.0%Growth Factor 1.105 1.105 1.105 1.105 1.105 1.105 1.105 1.105 1.105 1.105 1.105 1.105New Road AdjustmentOther Proposed Developments2027 Background Traffic 131 473 45 83 825 6 52 282 361 0 0 0
Project TripsTrip Distribution IN 3% 7% 0% 0% 0% 0% 0% 0% 0% 0% 0% 0%Trip Distribution OUT 0% 0% 0% 4% 3% 0% 0% 7% 7% 0% 0% 0%Residential Trips 3 7 0 3 2 0 0 5 5 0 0 0
Trip Distribution IN 3% 7% 0% 0% 0% 0% 0% 0% 0% 0% 0% 0%Trip Distribution OUT 0% 0% 0% 4% 3% 0% 0% 7% 7% 0% 0% 0%Hotel Trips 9 20 0 12 9 0 0 21 21 0 0 0
Trip Distribution IN 3% 7% 0% 0% 0% 0% 0% 0% 0% 0% 0% 0%Trip Distribution OUT 0% 0% 0% 4% 3% 0% 0% 7% 7% 0% 0% 0%Office Trips 34 79 0 221 166 0 0 387 387 0 0 0
Trip Distribution IN 3% 7% 0% 0% 0% 0% 0% 0% 0% 0% 0% 0%Trip Distribution OUT 0% 0% 0% 4% 3% 0% 0% 7% 7% 0% 0% 0%Retail Trips 17 39 0 25 19 0 0 44 44 0 0 0
Pass-By Trips 0 0 0 0 0 0 0 0 0 0 0 0
Total Project Trips 63 145 0 261 196 0 0 457 457 0 0 0
2027 Buildout Total 194 618 45 344 1,021 6 52 739 818 0 0 0k:\amt_civil\015170029_the gulch\eng\traffic\phase ii\analysis\[2017-11-14_gulchdri-analysis-tripgen36%31%-original.xls]int #13 11/20/2017 10:54
14 19 16 19
0.94 0.94 0.94 0.94
PM PEAK HOUR
Ted Tuner Drive Ted Tuner Drive Mitchell Street Mitchell StreetNorthbound Southbound Eastbound Westbound
0.96 0.96 0.96 0.96
Northbound Southbound Eastbound Westbound
18 28 19 46
INTERSECTION VOLUME DEVELOPMENT
Ted Turner Drive at Mitchell StreetAM PEAK HOUR
Ted Tuner Drive Ted Tuner Drive Mitchell Street Mitchell Street
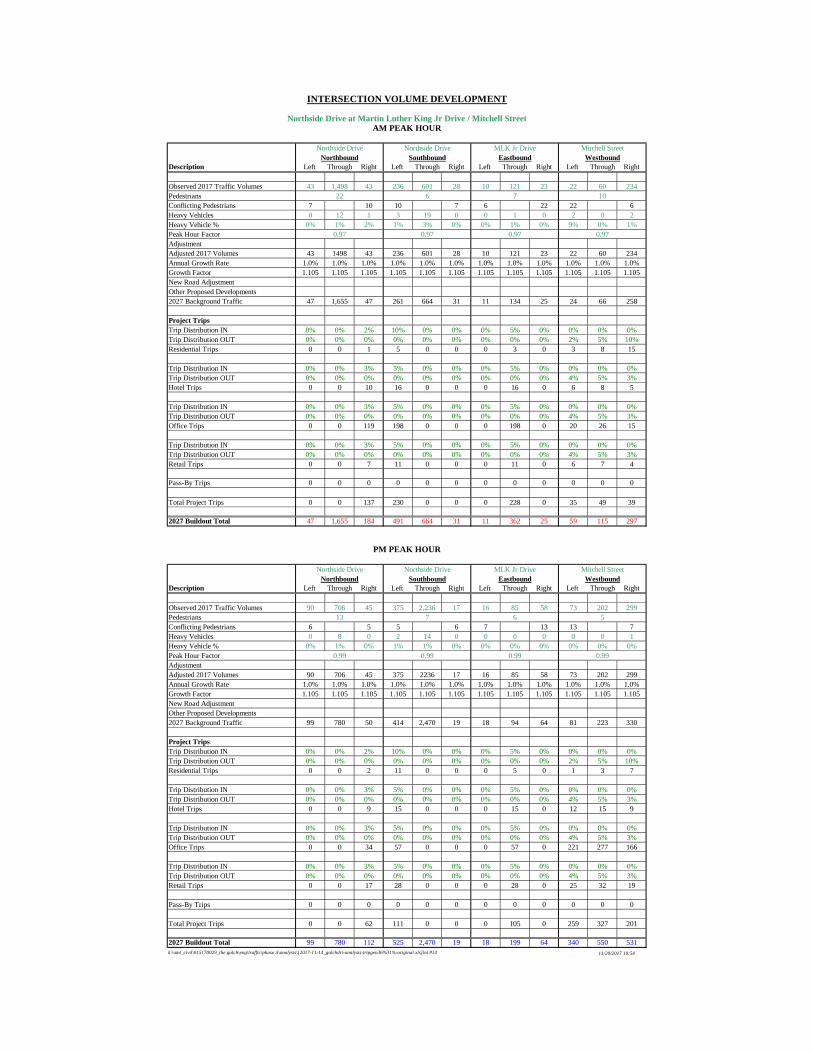
Description Left Through Right Left Through Right Left Through Right Left Through Right
Observed 2017 Traffic Volumes 43 1,498 43 236 601 28 10 121 23 22 60 234PedestriansConflicting Pedestrians 7 10 10 7 6 22 22 6Heavy Vehicles 0 12 1 3 19 0 0 1 0 2 0 2Heavy Vehicle % 0% 1% 2% 1% 3% 0% 0% 1% 0% 9% 0% 1%Peak Hour FactorAdjustmentAdjusted 2017 Volumes 43 1498 43 236 601 28 10 121 23 22 60 234Annual Growth Rate 1.0% 1.0% 1.0% 1.0% 1.0% 1.0% 1.0% 1.0% 1.0% 1.0% 1.0% 1.0%Growth Factor 1.105 1.105 1.105 1.105 1.105 1.105 1.105 1.105 1.105 1.105 1.105 1.105New Road AdjustmentOther Proposed Developments2027 Background Traffic 47 1,655 47 261 664 31 11 134 25 24 66 258
Project TripsTrip Distribution IN 0% 0% 2% 10% 0% 0% 0% 5% 0% 0% 0% 0%Trip Distribution OUT 0% 0% 0% 0% 0% 0% 0% 0% 0% 2% 5% 10%Residential Trips 0 0 1 5 0 0 0 3 0 3 8 15
Trip Distribution IN 0% 0% 3% 5% 0% 0% 0% 5% 0% 0% 0% 0%Trip Distribution OUT 0% 0% 0% 0% 0% 0% 0% 0% 0% 4% 5% 3%Hotel Trips 0 0 10 16 0 0 0 16 0 6 8 5
Trip Distribution IN 0% 0% 3% 5% 0% 0% 0% 5% 0% 0% 0% 0%Trip Distribution OUT 0% 0% 0% 0% 0% 0% 0% 0% 0% 4% 5% 3%Office Trips 0 0 119 198 0 0 0 198 0 20 26 15
Trip Distribution IN 0% 0% 3% 5% 0% 0% 0% 5% 0% 0% 0% 0%Trip Distribution OUT 0% 0% 0% 0% 0% 0% 0% 0% 0% 4% 5% 3%Retail Trips 0 0 7 11 0 0 0 11 0 6 7 4
Pass-By Trips 0 0 0 0 0 0 0 0 0 0 0 0
Total Project Trips 0 0 137 230 0 0 0 228 0 35 49 39
2027 Buildout Total 47 1,655 184 491 664 31 11 362 25 59 115 297
Description Left Through Right Left Through Right Left Through Right Left Through Right
Observed 2017 Traffic Volumes 90 706 45 375 2,236 17 16 85 58 73 202 299PedestriansConflicting Pedestrians 6 5 5 6 7 13 13 7Heavy Vehicles 0 8 0 2 14 0 0 0 0 0 0 1Heavy Vehicle % 0% 1% 0% 1% 1% 0% 0% 0% 0% 0% 0% 0%Peak Hour FactorAdjustmentAdjusted 2017 Volumes 90 706 45 375 2236 17 16 85 58 73 202 299Annual Growth Rate 1.0% 1.0% 1.0% 1.0% 1.0% 1.0% 1.0% 1.0% 1.0% 1.0% 1.0% 1.0%Growth Factor 1.105 1.105 1.105 1.105 1.105 1.105 1.105 1.105 1.105 1.105 1.105 1.105New Road AdjustmentOther Proposed Developments2027 Background Traffic 99 780 50 414 2,470 19 18 94 64 81 223 330
Project TripsTrip Distribution IN 0% 0% 2% 10% 0% 0% 0% 5% 0% 0% 0% 0%Trip Distribution OUT 0% 0% 0% 0% 0% 0% 0% 0% 0% 2% 5% 10%Residential Trips 0 0 2 11 0 0 0 5 0 1 3 7
Trip Distribution IN 0% 0% 3% 5% 0% 0% 0% 5% 0% 0% 0% 0%Trip Distribution OUT 0% 0% 0% 0% 0% 0% 0% 0% 0% 4% 5% 3%Hotel Trips 0 0 9 15 0 0 0 15 0 12 15 9
Trip Distribution IN 0% 0% 3% 5% 0% 0% 0% 5% 0% 0% 0% 0%Trip Distribution OUT 0% 0% 0% 0% 0% 0% 0% 0% 0% 4% 5% 3%Office Trips 0 0 34 57 0 0 0 57 0 221 277 166
Trip Distribution IN 0% 0% 3% 5% 0% 0% 0% 5% 0% 0% 0% 0%Trip Distribution OUT 0% 0% 0% 0% 0% 0% 0% 0% 0% 4% 5% 3%Retail Trips 0 0 17 28 0 0 0 28 0 25 32 19
Pass-By Trips 0 0 0 0 0 0 0 0 0 0 0 0
Total Project Trips 0 0 62 111 0 0 0 105 0 259 327 201
2027 Buildout Total 99 780 112 525 2,470 19 18 199 64 340 550 531k:\amt_civil\015170029_the gulch\eng\traffic\phase ii\analysis\[2017-11-14_gulchdri-analysis-tripgen36%31%-original.xls]int #14 11/20/2017 10:54
13 7 6 5
0.99 0.99 0.99 0.99
PM PEAK HOUR
Northside Drive Northside Drive MLK Jr Drive Mitchell StreetNorthbound Southbound Eastbound Westbound
0.97 0.97 0.97 0.97
Northbound Southbound Eastbound Westbound
22 6 7 10
INTERSECTION VOLUME DEVELOPMENT
Northside Drive at Martin Luther King Jr Drive / Mitchell StreetAM PEAK HOUR
Northside Drive Northside Drive MLK Jr Drive Mitchell Street

015170030 E
APPENDIX E
Programmed Project Fact Sheets

Phase Status & Funding Status FISCAL TOTAL PHASE BREAKDOWN OF TOTAL PHASE COST BY FUNDING SOURCEInformation YEAR COST FEDERAL STATE BONDS LOCAL/PRIVATE
ROW New Starts LR 2022-2030
$3,132,000 $1,409,400 $0,000 $0,000 $1,722,600
UTL New Starts LR 2022-2030
$9,396,000 $4,228,200 $0,000 $0,000 $5,167,800
CST New Starts LR 2022-2030
$50,112,000 $22,550,400 $0,000 $0,000 $27,561,600
$62,640,000 $28,188,000 $0,000 $0,000 $34,452,000
Atlanta Region's Plan RTP (2016) PROJECT FACT SHEETAR-490A1
Short Title ATLANTA STREETCAR EAST EXTENSION FROM JACKSON STREET TO ATLANTA BELTLINE/IRWIN STREET
GDOT Project No. N/A
Federal ID No. N/A
Status Long Range
Detailed Description and Justification
This project comprises the construction elements of AR-490A
Service Type Transit / Rail Capital
Sponsor
Jurisdiction
City of Atlanta/Atlanta BeltLine, Inc.
City of Atlanta
Existing Thru Lane N/A
Planned Thru Lane N/A Corridor Length N/A miles
Network Year 2030
Analysis Level In the Region's Air Quality Conformity Analysis
SCP: Scoping PE: Preliminary engineering / engineering / design / planning PE-OV: GDOT oversight services for engineering ROW: Right-of-way Acquistion UTL: Utility relocation CST: Construction / Implementation ALL: Total estimated cost, inclusive of all phases
LCI
Flex
? For additional information about this project, please call (404) 463-3100 or email [email protected].
Report Generated: 06/19/2017
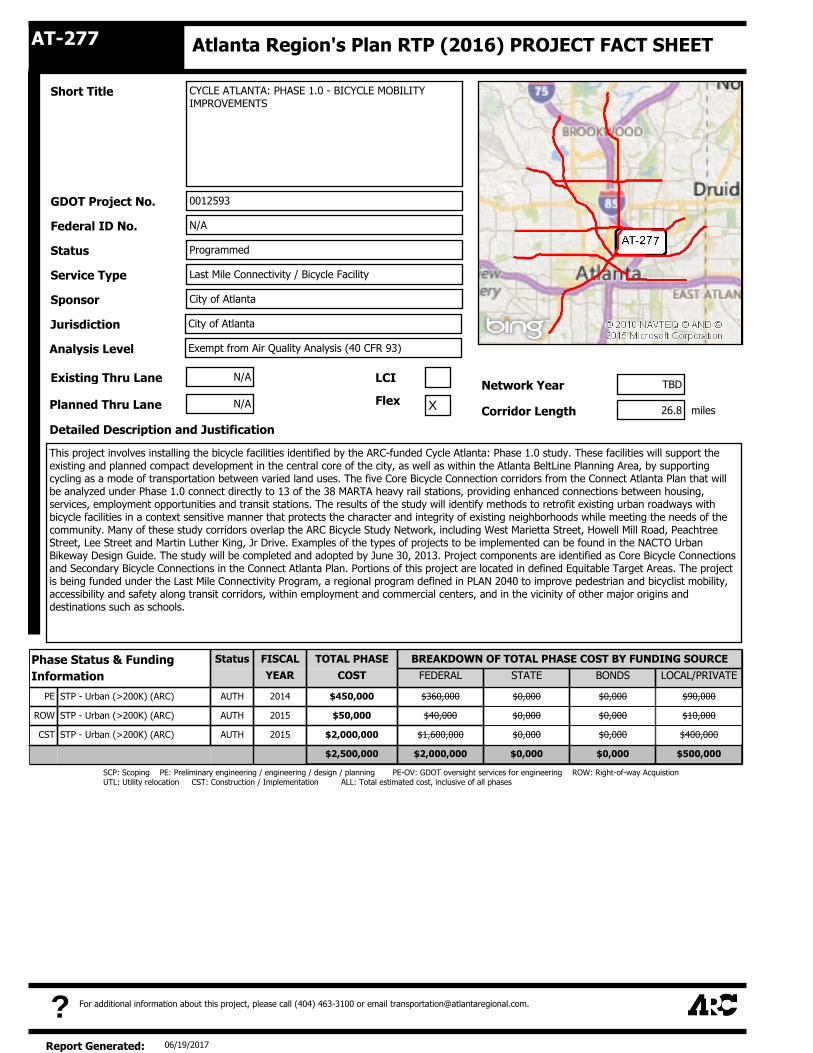
Phase Status & Funding Status FISCAL TOTAL PHASE BREAKDOWN OF TOTAL PHASE COST BY FUNDING SOURCEInformation YEAR COST FEDERAL STATE BONDS LOCAL/PRIVATE
PE STP - Urban (>200K) (ARC) AUTH 2014 $450,000 $360,000 $0,000 $0,000 $90,000
ROW STP - Urban (>200K) (ARC) AUTH 2015 $50,000 $40,000 $0,000 $0,000 $10,000
CST STP - Urban (>200K) (ARC) AUTH 2015 $2,000,000 $1,600,000 $0,000 $0,000 $400,000
$2,500,000 $2,000,000 $0,000 $0,000 $500,000
Atlanta Region's Plan RTP (2016) PROJECT FACT SHEETAT-277
Short Title CYCLE ATLANTA: PHASE 1.0 - BICYCLE MOBILITY IMPROVEMENTS
GDOT Project No. 0012593
Federal ID No. N/A
Status Programmed
Detailed Description and Justification
This project involves installing the bicycle facilities identified by the ARC-funded Cycle Atlanta: Phase 1.0 study. These facilities will support the existing and planned compact development in the central core of the city, as well as within the Atlanta BeltLine Planning Area, by supporting cycling as a mode of transportation between varied land uses. The five Core Bicycle Connection corridors from the Connect Atlanta Plan that will be analyzed under Phase 1.0 connect directly to 13 of the 38 MARTA heavy rail stations, providing enhanced connections between housing, services, employment opportunities and transit stations. The results of the study will identify methods to retrofit existing urban roadways with bicycle facilities in a context sensitive manner that protects the character and integrity of existing neighborhoods while meeting the needs of the community. Many of these study corridors overlap the ARC Bicycle Study Network, including West Marietta Street, Howell Mill Road, Peachtree Street, Lee Street and Martin Luther King, Jr Drive. Examples of the types of projects to be implemented can be found in the NACTO Urban Bikeway Design Guide. The study will be completed and adopted by June 30, 2013. Project components are identified as Core Bicycle Connections and Secondary Bicycle Connections in the Connect Atlanta Plan. Portions of this project are located in defined Equitable Target Areas. The project is being funded under the Last Mile Connectivity Program, a regional program defined in PLAN 2040 to improve pedestrian and bicyclist mobility, accessibility and safety along transit corridors, within employment and commercial centers, and in the vicinity of other major origins and destinations such as schools.
Service Type Last Mile Connectivity / Bicycle Facility
Sponsor
Jurisdiction
City of Atlanta
City of Atlanta
Existing Thru Lane N/A
Planned Thru Lane N/A Corridor Length 26.8 miles
Network Year TBD
Analysis Level Exempt from Air Quality Analysis (40 CFR 93)
SCP: Scoping PE: Preliminary engineering / engineering / design / planning PE-OV: GDOT oversight services for engineering ROW: Right-of-way Acquistion UTL: Utility relocation CST: Construction / Implementation ALL: Total estimated cost, inclusive of all phases
LCI
Flex
X
? For additional information about this project, please call (404) 463-3100 or email [email protected].
Report Generated: 06/19/2017
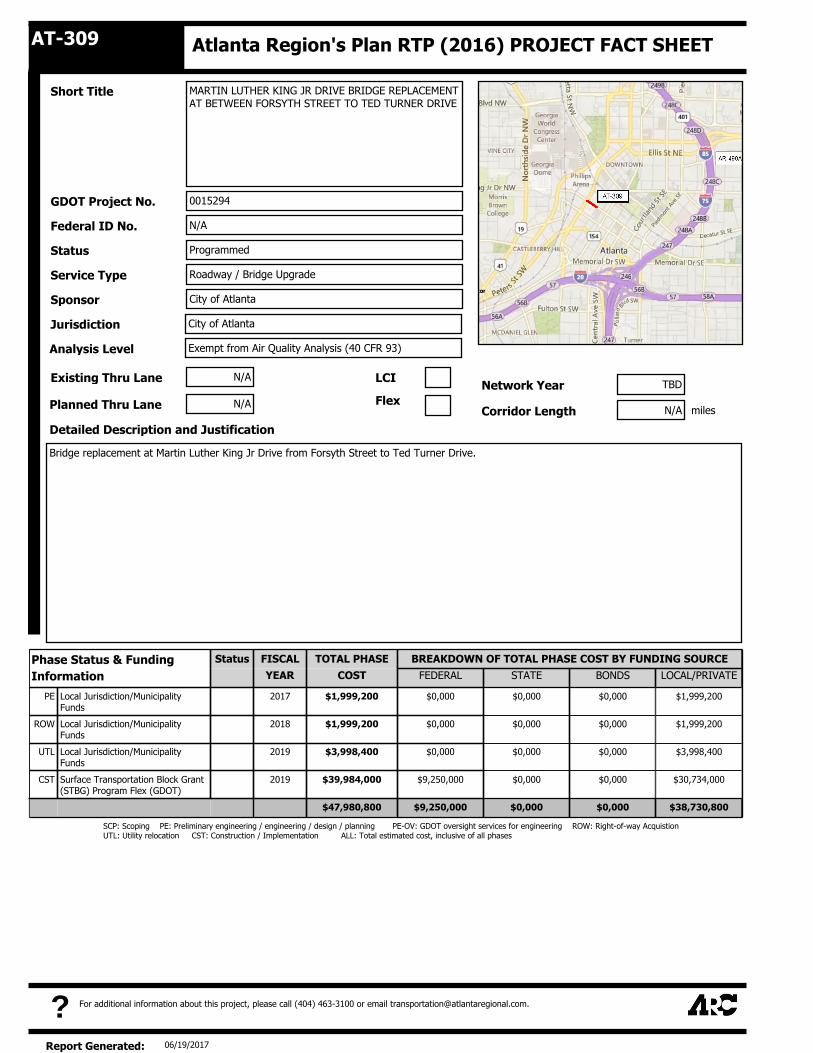
Phase Status & Funding Status FISCAL TOTAL PHASE BREAKDOWN OF TOTAL PHASE COST BY FUNDING SOURCEInformation YEAR COST FEDERAL STATE BONDS LOCAL/PRIVATE
PE Local Jurisdiction/Municipality Funds
2017 $1,999,200 $0,000 $0,000 $0,000 $1,999,200
ROW Local Jurisdiction/Municipality Funds
2018 $1,999,200 $0,000 $0,000 $0,000 $1,999,200
UTL Local Jurisdiction/Municipality Funds
2019 $3,998,400 $0,000 $0,000 $0,000 $3,998,400
CST Surface Transportation Block Grant (STBG) Program Flex (GDOT)
2019 $39,984,000 $9,250,000 $0,000 $0,000 $30,734,000
$47,980,800 $9,250,000 $0,000 $0,000 $38,730,800
Atlanta Region's Plan RTP (2016) PROJECT FACT SHEETAT-309
Short Title MARTIN LUTHER KING JR DRIVE BRIDGE REPLACEMENT AT BETWEEN FORSYTH STREET TO TED TURNER DRIVE
GDOT Project No. 0015294
Federal ID No. N/A
Status Programmed
Detailed Description and Justification
Bridge replacement at Martin Luther King Jr Drive from Forsyth Street to Ted Turner Drive.
Service Type Roadway / Bridge Upgrade
Sponsor
Jurisdiction
City of Atlanta
City of Atlanta
Existing Thru Lane N/A
Planned Thru Lane N/A Corridor Length N/A miles
Network Year TBD
Analysis Level Exempt from Air Quality Analysis (40 CFR 93)
SCP: Scoping PE: Preliminary engineering / engineering / design / planning PE-OV: GDOT oversight services for engineering ROW: Right-of-way Acquistion UTL: Utility relocation CST: Construction / Implementation ALL: Total estimated cost, inclusive of all phases
LCI
Flex
? For additional information about this project, please call (404) 463-3100 or email [email protected].
Report Generated: 06/19/2017

Phase Status & Funding Status FISCAL TOTAL PHASE BREAKDOWN OF TOTAL PHASE COST BY FUNDING SOURCEInformation YEAR COST FEDERAL STATE BONDS LOCAL/PRIVATE
SCP National Highway System AUTH 2012 $1,000,000 $800,000 $200,000 $0,000 $0,000
PE STP - Urban (>200K) (ARC) AUTH 2012 $1,250,000 $1,000,000 $250,000 $0,000 $0,000
PE Transit Fund (21533) AUTH 2012 $16,280,637 $0,000 $16,280,637 $0,000 $0,000
PE New Starts LR 2031-2040
$53,750,000 $53,750,000 $0,000 $0,000 $0,000
ROW Local Jurisdiction/Municipality Funds
LR 2031-2040
$74,724,040 $0,000 $0,000 $0,000 $74,724,040
CST Local Sources - PPP LR 2031-2040
$655,380,000 $0,000 $0,000 $0,000 $655,380,000
CST Private Sources - PPP LR 2031-2040
$337,620,000 $0,000 $0,000 $0,000 $337,620,000
$1,140,004,677 $55,550,000 $16,730,637 $0,000 $1,067,724,040
Atlanta Region's Plan RTP (2016) PROJECT FACT SHEETAR-400
Short Title GEORGIA MULTIMODAL PASSENGER TERMINAL (MMPT)
GDOT Project No. 770311-
Federal ID No. HPPNH-0CRL-00(002)
Status Long Range
Detailed Description and Justification
This effort includes the NEPA and PE work needed to ultimately develop a multi-modal passenger terminal (MMPT) in Downtown Atlanta to improve regional connectivity. The funding includes support for the expanded PE effort to further refine the operational functionality of the multi-modal facility and Phase I implementation of the MMPT transit facility improvements at the Five Points bus and rail station.
Service Type Transit / Facilities Capital
Sponsor
Jurisdiction
GDOT
Regional
Existing Thru Lane N/A
Planned Thru Lane N/A Corridor Length N/A miles
Network Year 2040
Analysis Level In the Region's Air Quality Conformity Analysis
SCP: Scoping PE: Preliminary engineering / engineering / design / planning PE-OV: GDOT oversight services for engineering ROW: Right-of-way Acquistion UTL: Utility relocation CST: Construction / Implementation ALL: Total estimated cost, inclusive of all phases
LCI
Flex
? For additional information about this project, please call (404) 463-3100 or email [email protected].
Report Generated: 06/19/2017
015170030 F
APPENDIX F
MARTA and Renew AtlantaMemorandums
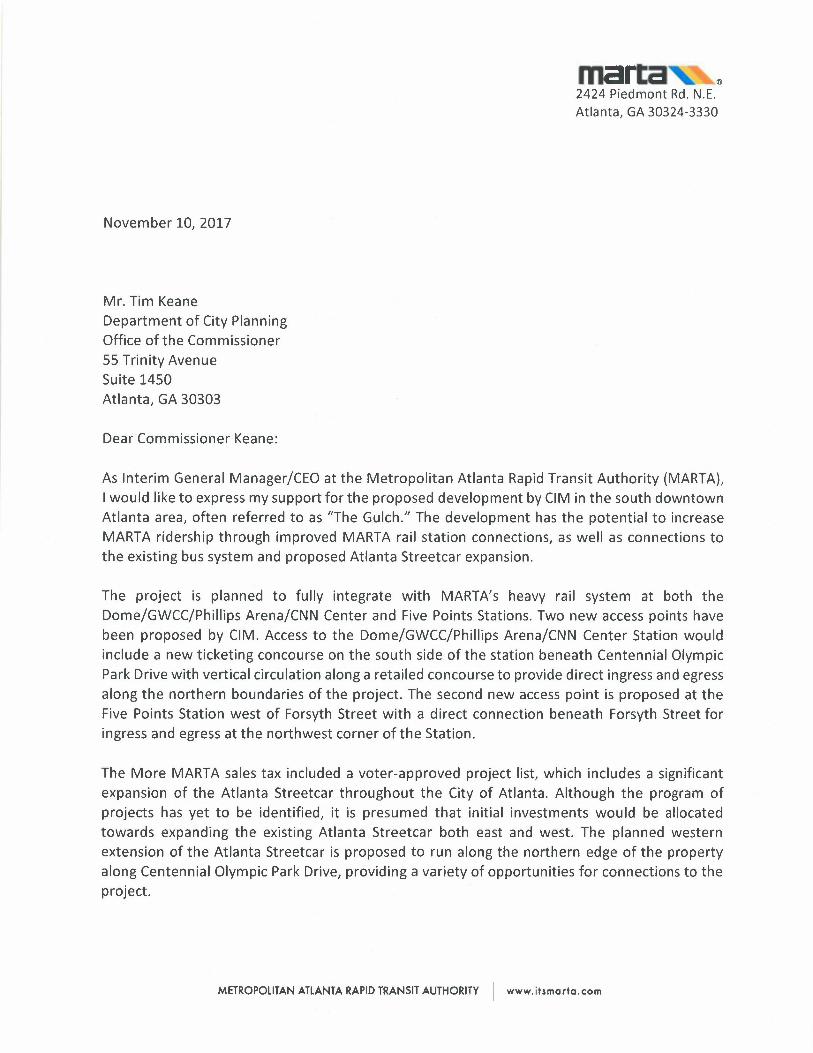
marca ®
2424 Piedmont Rd. N.E. Atlanta, GA 30324-3330
November 10, 2017
Mr. Tim Keane Department of City Planning Office of the Commissioner 55 Trinity Avenue Suite 1450 Atlanta, GA 30303
Dear Commissioner Keane:
As Interim General Manager/CEO at the Metropolitan Atlanta Rapid Transit Authority (MARTA), I would like to express my support for the proposed development by CIM in the south downtown Atlanta area, often referred to as "The Gulch." The development has the potential to increase MARTA ridership through improved MARTA rail station connections, as well as connections to the existing bus system and proposed Atlanta Streetcar expansion.
The project is planned to fully integrate with MARTA's heavy rail system at both the Dome/GWCC/Phillips Arena/CNN Center and Five Points Stations. Two new access points have been proposed by CIM. Access to the Dome/GWCC/Phillips Arena/CNN Center Station would include a new ticketing concourse on the south side of the station beneath Centennial Olympic Park Drive with vertical circulation along a retailed concourse to provide direct ingress and egress along the northern boundaries of the project. The second new access point is proposed at the Five Points Station west of Forsyth Street with a direct connection beneath Forsyth Street for ingress and egress at the northwest corner of the Station.
The More MARTA sales tax included a voter-approved project list, which includes a significant expansion of the Atlanta Streetcar throughout the City of Atlanta. Although the program of projects has yet to be identified, it is presumed that initial investments would be allocated towards expanding the existing Atlanta Streetcar both east and west. The planned western extension of the Atlanta Streetcar is proposed to run along the northern edge of the property along Centennial Olympic Park Drive, providing a variety of opportunities for connections to the project.
METROPOLITAN ATLANTA RAPID TRANSIT AUTHORITY I www.itsmorto.com

Page 2 November 10, 2017
Lastly, the project area is well served from the existing Broad Street bus mall and provides multiple street level access points to accommodate expansions of local or commuter bus services to the project and to the MARTA stations.
Transit project implementation is subject to Federal Transit Administration and MARTA Board of Directors approval.
We look forward to working in partnership with CIM to maximize transit access to their project. I appreciate your consideration and ask for your expeditious support for advancement of this project.
Sincerely,
~ /?? 0 .,),.U,U Elizabeth M. O'Neill Interim General Manager/CEO
cc: James S. Crowell; CIM Faye DiMassimo, City of Atlanta Benjamin Limmer, MARTA Devon Mccorkle; CIM Emmy Montanye; Kimley-Horn Amanda Rhein, MARTA Arthur Troup, MARTA
METROPOLITAN ATLANTA RAPID TRANSIT AUTHORITY I www.itsmarta.com