3-story office building in sunset park 4320 3 avenue 8,500...
TRANSCRIPT
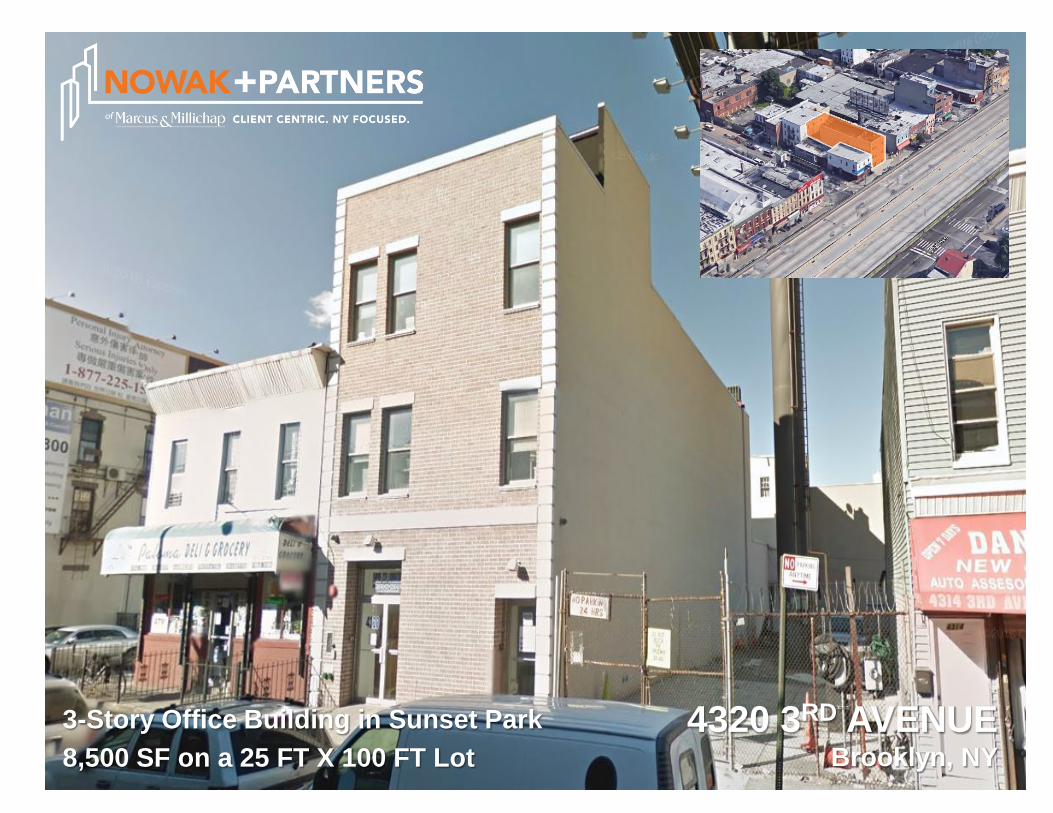
3-Story Office Building in Sunset Park 8,500 SF on a 25 FT X 100 FT Lot
4320 3RD AVENUE Brooklyn, NY

N O N - E N D O R S E M E N T A N D D I S C L A I M E R N O T I C E
Confidentiality and Disclaimer The information contained in the following Marketing Brochure is proprietary and strictly confidential. It is intended to be reviewed only by the party receiving it from Marcus & Millichap and should not be made available to any other person or entity without the written consent of Marcus & Millichap. This Marketing Brochure has been prepared to provide summary, unverified information to prospective purchasers, and to establish only a preliminary level of interest in the subject property. The information contained herein is not a substitute for a thorough due diligence investigation. Marcus & Millichap has not made any investigation, and makes no warranty or representation, with respect to the income or expenses for the subject property, the future projected financial performance of the property, the size and square footage of the property and improvements, the presence or absence of contaminating substances, PCB's or asbestos, the compliance with State and Federal regulations, the physical condition of the improvements thereon, or the financial condition or business prospects of any tenant, or any tenant's plans or intentions to continue its occupancy of the subject property. The information contained in this Marketing Brochure has been obtained from sources we believe to be reliable; however, Marcus & Millichap has not verified, and will not verify, any of the information contained herein, nor has Marcus & Millichap conducted any investigation regarding these matters and makes no warranty or representation whatsoever regarding the accuracy or completeness of the information provided. All potential buyers must take appropriate measures to verify all of the information set forth herein. Marcus & Millichap is a service mark of Marcus & Millichap Real Estate Investment Services, Inc. © 2017 Marcus & Millichap. All rights reserved. Non-Endorsement Notice Marcus & Millichap is not affiliated with, sponsored by, or endorsed by any commercial tenant or lessee identified in this marketing package. The presence of any corporation's logo or name is not intended to indicate or imply affiliation with, or sponsorship or endorsement by, said corporation of Marcus & Millichap, its affiliates or subsidiaries, or any agent, product, service, or commercial listing of Marcus & Millichap, and is solely included for the purpose of providing tenant lessee information about this listing to prospective customers. ALL PROPERTY SHOWINGS ARE BY APPOINTMENT ONLY. PLEASE CONSULT YOUR MARCUS & MILLICHAP AGENT FOR MORE DETAILS. 4320 3RD AVENUE Brooklyn, NY ACT ID Y0340145

P R E S E N T E D B Y
Jakub H. Nowak
Licensed Associate Real Estate Broker Brooklyn Office Tel: (718) 475-4353 Fax: (718) 475-4310 [email protected] License: NY 10301211147
Jake Torre
Licensed Real Estate Salesperson Brooklyn Office Tel: (718) 475-4325 Fax: (718) 475-4310 [email protected] License: NY 10401280593

TABLE OF CONTENTS
FINANCIAL ANALYSIS 01
INVESTMENT OVERVIEW 02
NEIGHBORHOOD REPORT 03
MARKET OVERVIEW 04
SECTION
4320 3RD AVENUE
5
FINANCIAL
ANALYSIS

FINANCIAL ANALYSIS
4320 3RD AVENUE
PRICING SUMMARY
6
Summary:Price $3,200,000
Down Payment $3,200,000 100%# of Commercial Suites 4Price Per Gross SqFt $376.47Price Per Above Grade SqFt $492.31Gross SqFt 8,500Above Grade SqFt 6,500Lot Size (SqFt) 2,500Approx. Year Built 1930
Current: Pro Forma:CAP Rate -0.97% 5.11%
Overview:Address: 4320 3rd AveBlock / Lot: 00727-0047Lot Dimensions: 25 Feet X 100 FeetLot Size (SF): 2,500 Zoning: M1-2
Basement (SF): 2,000 1st Level (SF): 2,500 2nd Level (SF): 2,000 3rd Level (SF): 2,000 Total Exising Square Feet: 8,500
Existing SF and Remaining Air Rights Overview:
Operating Data:
Income Current: Pro Forma:Commercial Gross Scheduled Rent $0 $215,400
Expense Reimbursements $0 $0All Other Income $0 $0Vacancy 0.0% -$ -5.0% (10,770.00)$
Effective Gross Income $0 $204,630Less: Expenses (30,905.00)$ (41,136.50)$ Net Operating Income -$30,905 $163,494
Expenses: Current: Pro Forma:Real Estate Taxes (27,655)$ (27,655)$ Insurance (3,250)$ (3,250)$ Utilities - Electric -$ -$ Utilities - Water & Sewer -$ -$ Utilities - Gas -$ -$ Repairs & Maintenance(2%) -$ (4,093)$ Management Fee (5%) -$ (6,139)$
Total Expenses (30,905)$ (41,137)$ Expenses/SF -$3.64 -$4.84
FINANCIAL ANALYSIS
4320 3RD AVENUE
OPERATING STATEMENT
7
Current: Per SF Pro Forma: Per SF
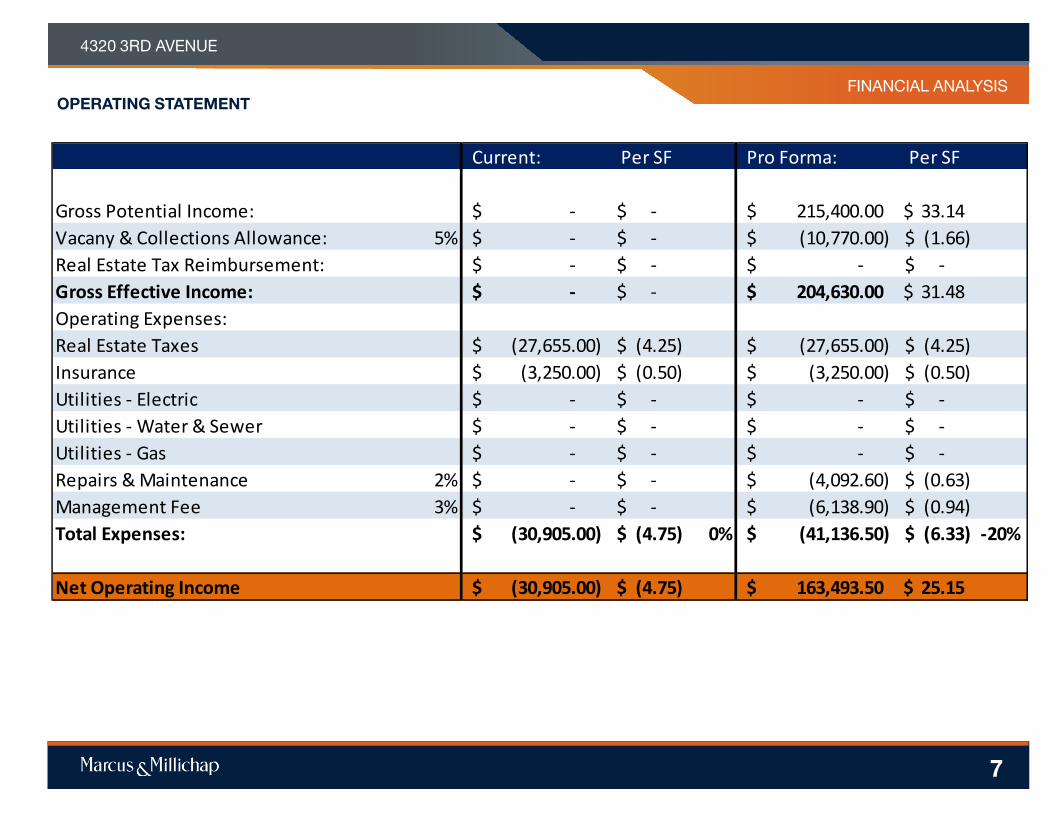
Gross Potential Income: -$ -$ 215,400.00$ 33.14$ Vacany & Collections Allowance: 5% -$ -$ (10,770.00)$ (1.66)$ Real Estate Tax Reimbursement: -$ -$ -$ -$ Gross Effective Income: -$ -$ 204,630.00$ 31.48$ Operating Expenses:Real Estate Taxes (27,655.00)$ (4.25)$ (27,655.00)$ (4.25)$ Insurance (3,250.00)$ (0.50)$ (3,250.00)$ (0.50)$ Utilities - Electric -$ -$ -$ -$ Utilities - Water & Sewer -$ -$ -$ -$ Utilities - Gas -$ -$ -$ -$ Repairs & Maintenance 2% -$ -$ (4,092.60)$ (0.63)$ Management Fee 3% -$ -$ (6,138.90)$ (0.94)$ Total Expenses: (30,905.00)$ (4.75)$ 0% (41,136.50)$ (6.33)$ -20%
Net Operating Income (30,905.00)$ (4.75)$ 163,493.50$ 25.15$
FINANCIAL ANALYSIS
4320 3RD AVENUE
RENT ROLL
8
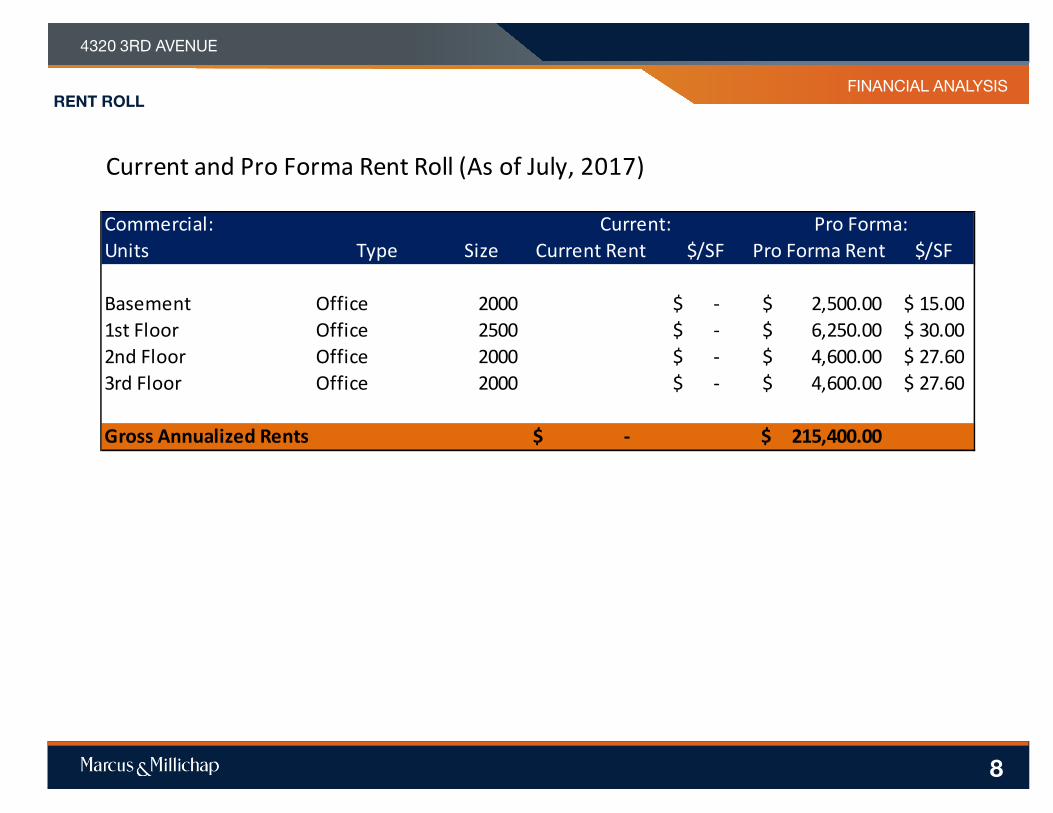
Current and Pro Forma Rent Roll (As of July, 2017)
Commercial:Units Type Size Current Rent $/SF Pro Forma Rent $/SF
Basement Office 2000 -$ 2,500.00$ 15.00$ 1st Floor Office 2500 -$ 6,250.00$ 30.00$ 2nd Floor Office 2000 -$ 4,600.00$ 27.60$ 3rd Floor Office 2000 -$ 4,600.00$ 27.60$
Gross Annualized Rents -$ 215,400.00$
Current: Pro Forma:
9
INVESTMENT
OVERVIEW

4320 3RD AVENUE
#
OFFERING SUMMARY
Turn-Key, Multi-Story Office Building with High Ceilings
4 Minute Walk from the "R" Train at 45th Street Train Station
Prime Sunset Park Location
Up the Block from Industry City, Costco, Liberty View Plaza and 5th Avenue Shopping and Dining
Strong and Ongoing Growth in Local Commercial Rents and Property Values
Property in Excellent Condition with no Deferred Maintenance
Will be Delivered Completely Vacant
INVESTMENT HIGHLIGHTS
Nowak + Partners of Marcus and Millichap has been selected to exclusively market for sale the property at 4320 3rd Ave. The subject property is a 3-story office building located in the Sunset Park section of Brooklyn, between 43rd and 44th Street (Block: 00727 Lot: 0047). The property is built full on a 25 FT X 100 FT lot and features 6,500 square feet of above-grade space. The building also features a usable 2,000 square foot basement. The property is zoned M1-2 and is overbuilt by an approximate 2,500 square feet. The site is commercially certified for medical use and has been occupied by the same tenant, utilizing the space as a medical office building. The property features a brand new hydraulic passenger elevator servicing all 4 floors. Each floor has its own separate HVAC unit along with separate gas and electric meters. The strategic location on 3rd Ave allows for easy access to the 45th Street "R" Subway Train Station as well as the BQE and the Prospect Expressway (Route-27). The subject property offers investors and owner-users the unique opportunity to purchase an immaculate turn-key commercial property with a conforming certificate of occupancy and to capitalize on the rapid growth in rents and property values occurring in this section of Brooklyn.
INVESTMENT OVERVIEW
10
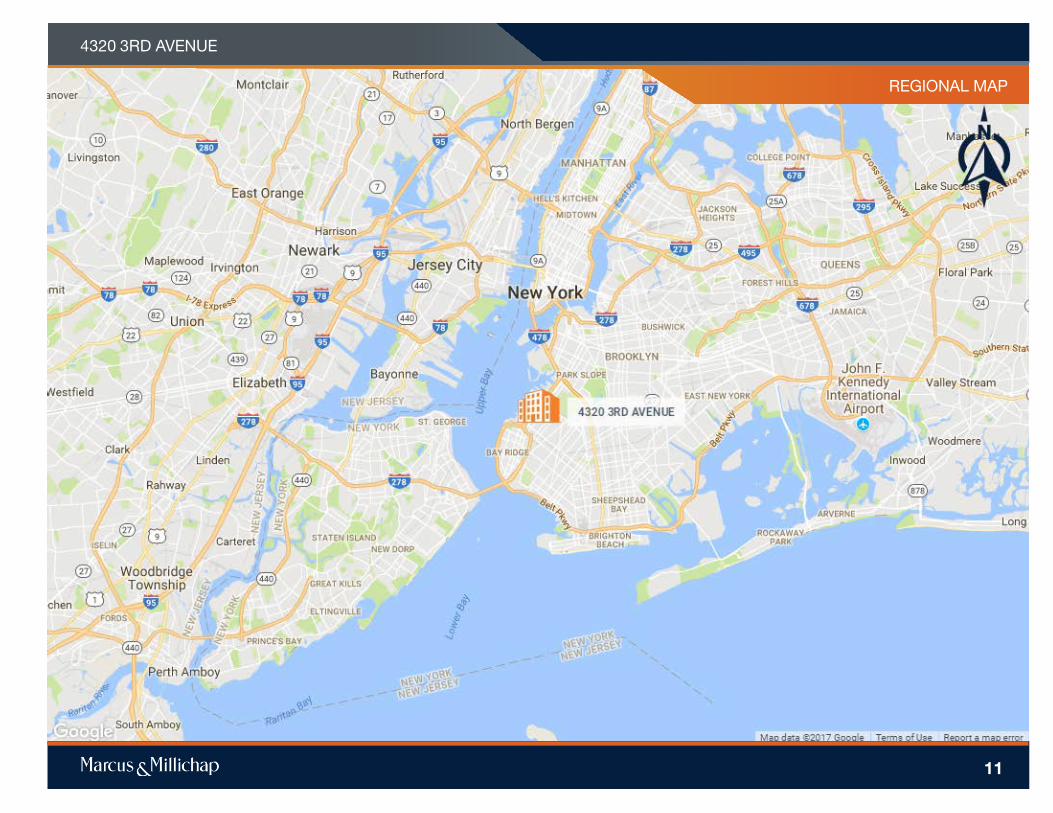
REGIONAL MAP
4320 3RD AVENUE
11

LOCAL MAP
4320 3RD AVENUE
12
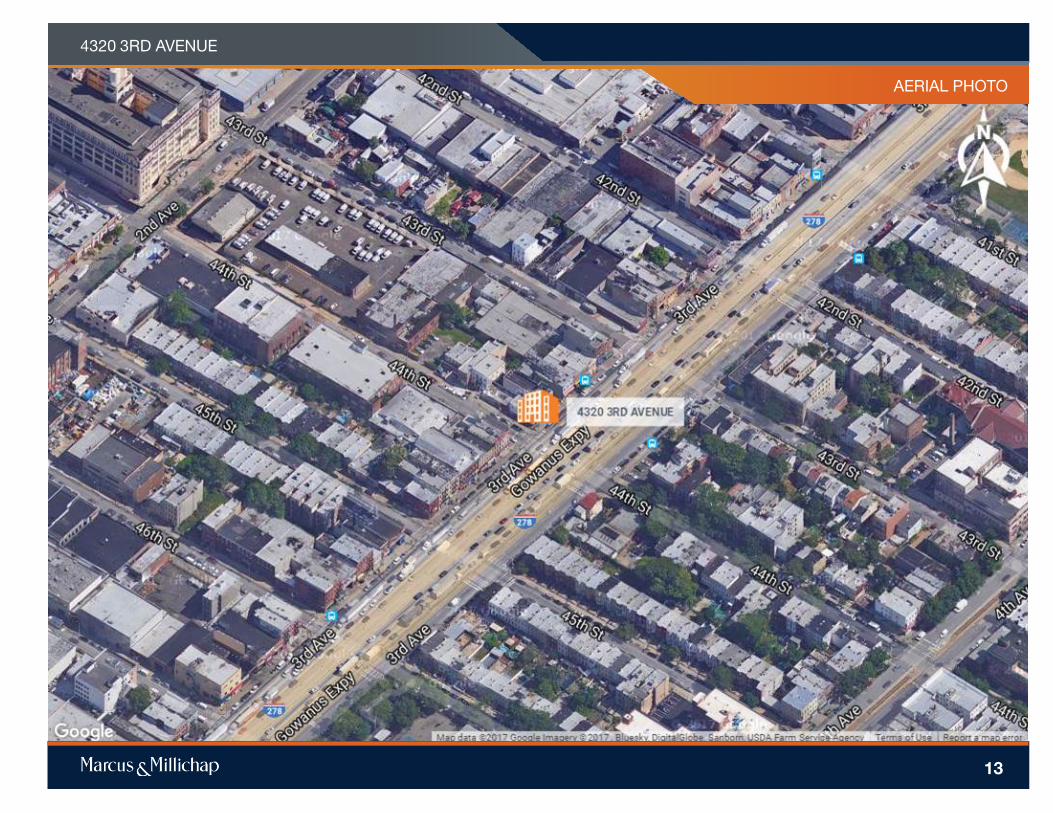
AERIAL PHOTO
4320 3RD AVENUE
13

AERIAL VIEW
4320 3RD AVENUE
14

TAX MAP
4320 3RD AVENUE
15

ZONING MAP
4320 3RD AVENUE
16
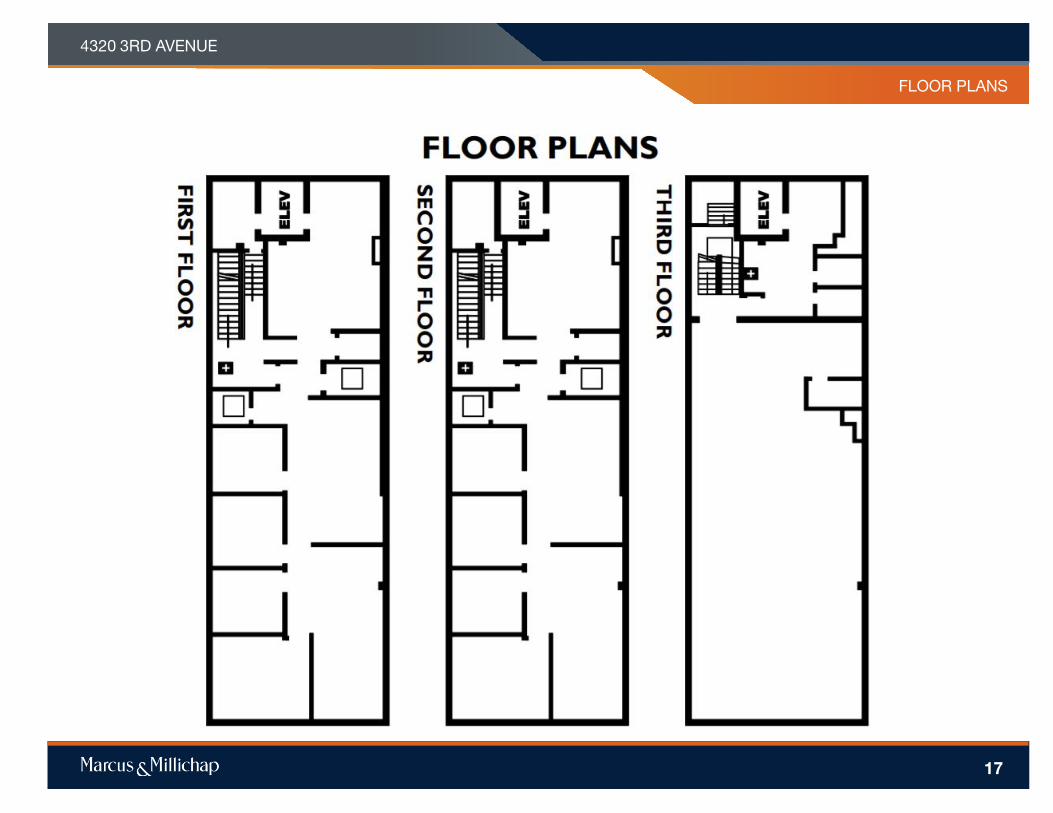
FLOOR PLANS
4320 3RD AVENUE
17

18
NEIGHBORHOOD
REPORT

NEIGHBORHOOD REPORT
Sunset Park
19

NEIGHBORHOOD REPORT
Overview The neighborhood of Sunset Park is located in the southwestern part of Brooklyn between Greenwood Heights and Bay Ridge. Like many other Brooklyn neighborhoods, Sunset Park has gone through great change and growth. It is bounded by 36th Street and Greenwood Cemetery to the north, 9th Avenue to the east, 65th Street to the south and the Upper New York Bay to the West. The neighborhood, situated on NY Harbor, became an ideal location for freight shipping into NYC in the early 20th Century. As an active port, very large warehouses were built with loading docks, freight elevators and railroad tracks connecting Brooklyn with other parts of NY. Industry began to boom. Once shipping moved away from maritime routes to ground ventures, and the BQE was built, running through the western part of the neighborhood, the waterfront declined in activity. Recently, with the newly emerging Industry City and many other projects being redeveloped as campuses for industry, technology and business, the area is thriving once again. It retains its charm as a diverse neighborhood with immense opportunities for growth and expansion. A “Tale of Two Cities,” Sunset Park houses industrial and creative spaces to the west of The Gowanus Expressway and low-lying brownstone residential homes with modest density to the east spanning long streets down to 9th Avenue. These unpretentious row homes continue to cater to an expanding demographic and attract people from all walks of life.
SUNSET PARK
20

NEIGHBORHOOD REPORT
Zoning Designation
SUNSET PARK
Sunset Park is primarily separated into two zoning categories. The waterfront, designated as a manufacturing zone remains M3-1 and M2-1 up until 4th Avenue on the east. The remaining stretch of the neighborhood, continuing until the eastern border at 9th Avenue, retains residential zoning guidelines which tend to include R6, R6A, and R6B.
21

NEIGHBORHOOD REPORT
IBZ District Southwest Brooklyn The Industrial Business Zone, or IBZ was instituted in various neighborhoods across NYC in 2006 to ensure that major industry remains in NYC and to protect areas that might have been subject to major development. Sunset Park and neighboring Greenwood Heights, parts of Gowanus and Red Hook are areas known for manufacturing and business and have been included in the rezoning as displayed in orange in the map to the right.
SUNSET PARK
22

NEIGHBORHOOD REPORT
Demographics • As of 2016, the total population of Sunset Park reached
129,473. The female population at 62,807 people is lower than that of male at 66,666 people.
• In the Sunset Park neighborhood, there are 37,755 households with 3.28 people per household on average. 26,039 of these households are family households and 11,717 are non-family households.
• The educational levels of the population in Sunset Park varies greatly; 18.5% of residents have a bachelor’s degree and 7.6% have a graduate degree, while 19.7% have some high school and 36.5% of residents do not have a high school diploma
• 62.7% of the workforce is white collar, while 37.3% is blue collar
SUNSET PARK
23
NEIGHBORHOOD REPORT
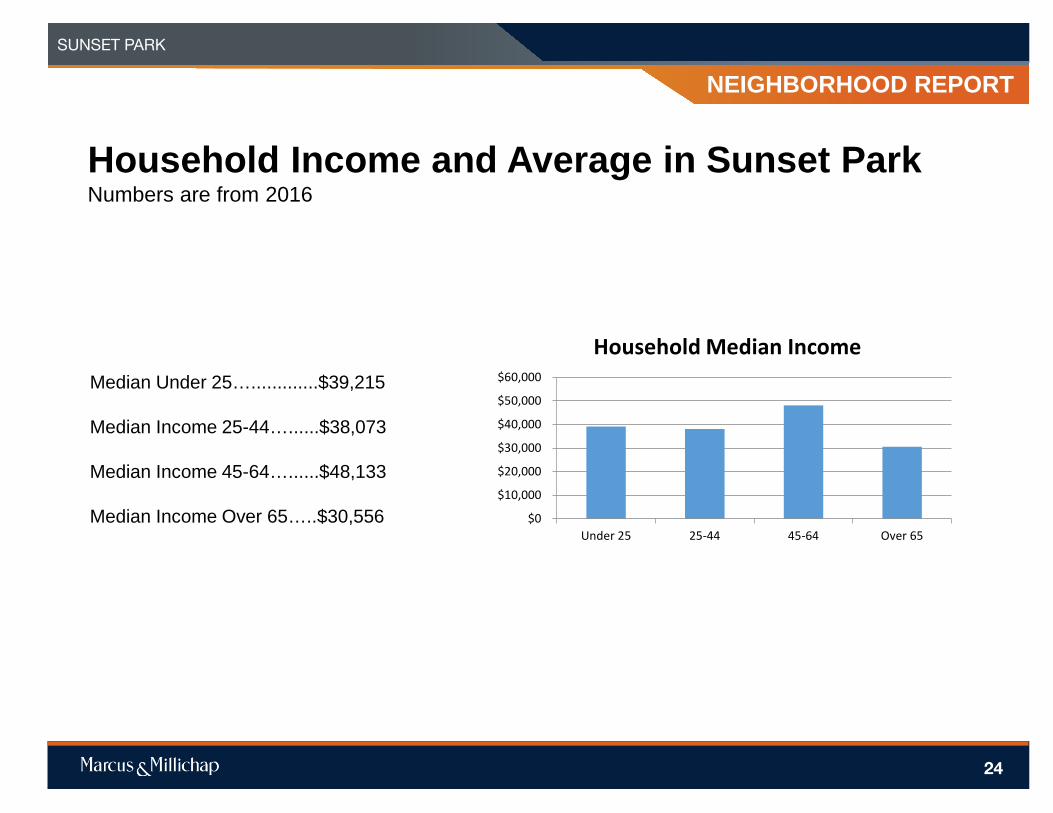
Household Income and Average in Sunset Park Numbers are from 2016
Median Under 25….............$39,215 Median Income 25-44…......$38,073 Median Income 45-64…......$48,133 Median Income Over 65…..$30,556
SUNSET PARK
$0
$10,000
$20,000
$30,000
$40,000
$50,000
$60,000
Under 25 25-44 45-64 Over 65
Household Median Income
24
NEIGHBORHOOD REPORT
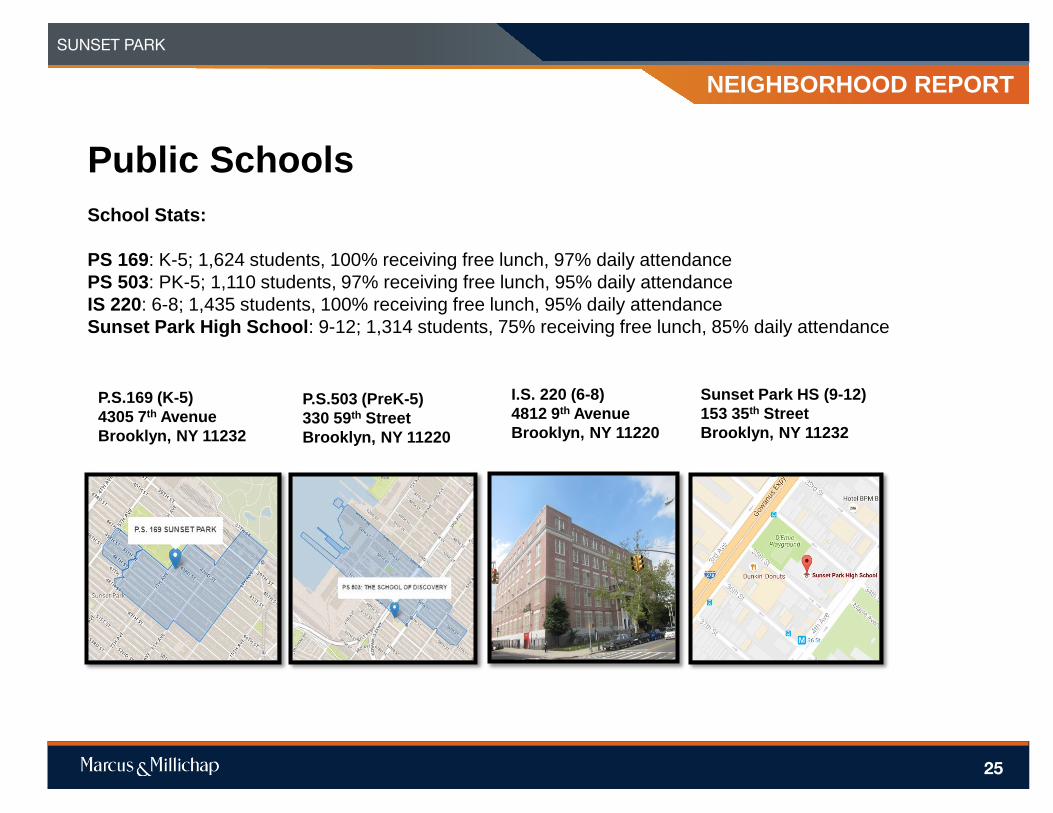
Public Schools School Stats: PS 169: K-5; 1,624 students, 100% receiving free lunch, 97% daily attendance PS 503: PK-5; 1,110 students, 97% receiving free lunch, 95% daily attendance IS 220: 6-8; 1,435 students, 100% receiving free lunch, 95% daily attendance Sunset Park High School: 9-12; 1,314 students, 75% receiving free lunch, 85% daily attendance
P.S.169 (K-5) 4305 7th Avenue Brooklyn, NY 11232
P.S.503 (PreK-5) 330 59th Street Brooklyn, NY 11220
I.S. 220 (6-8) 4812 9th Avenue Brooklyn, NY 11220
Sunset Park HS (9-12) 153 35th Street Brooklyn, NY 11232
SUNSET PARK
25

NEIGHBORHOOD REPORT Attractions
Bush Terminal Piers Park and Cultural Center After the Bush Terminal Piers closed in 1974 the waterfront went into complete decline. It was reinvigorated and opened once again as a public park in 2014. The neighborhood has been lacking in public parks for its residents and these 11 acres of parkland are a tremendous addition to the area. Pier 5, originally intended as part of the park itself has been proposed for redevelopment as a separate marine and cultural center.
Sunset Park Sunset Park, the neighborhood namesake, is a 24.5 acre park founded in the 1890’s spanning 41st to 44th streets, and from 5th to 7th Aves. At the more elevated areas the park has sweeping views of the Statue of Liberty, NY Harbor and parts of Manhattan. The park has a community pool, fields, courts, and recreation center.
SUNSET PARK
26

NEIGHBORHOOD REPORT Attractions Industry City Industry City is an attraction for locals and tourists offering pop up shops, flea markets, events, and open studios and galleries, as well as a campus for technology, innovation and business. Its 16 buildings, encompassing 6 Million Square Feet, offers a food hall, retail space, waterfront esplanade, fitness center and ample parking for its visitors and tenants to experience and enjoy alike. Hundreds of retailers and businesses have filled the space as of yet and are continuing to do so to make Industry City a fantastic Brooklyn destination. Greenwood Cemetery Opened in 1838, Greenwood Cemetery quickly became more than just an end destination for the body and soul. By the early 1860’s 500,000 visitors had been coming out to explore the beautiful 478 Acres of land and lush greenery. Reaching National Historic Landmark status in 2006 the park continues to host trolley tours, weddings at the chapel, and various cultural events and programs. The cemetery still attracts history buffs, birdwatchers, children on school trips and those simply looking for a quiet place to enjoy the scenery.
SUNSET PARK
27
NEIGHBORHOOD REPORT
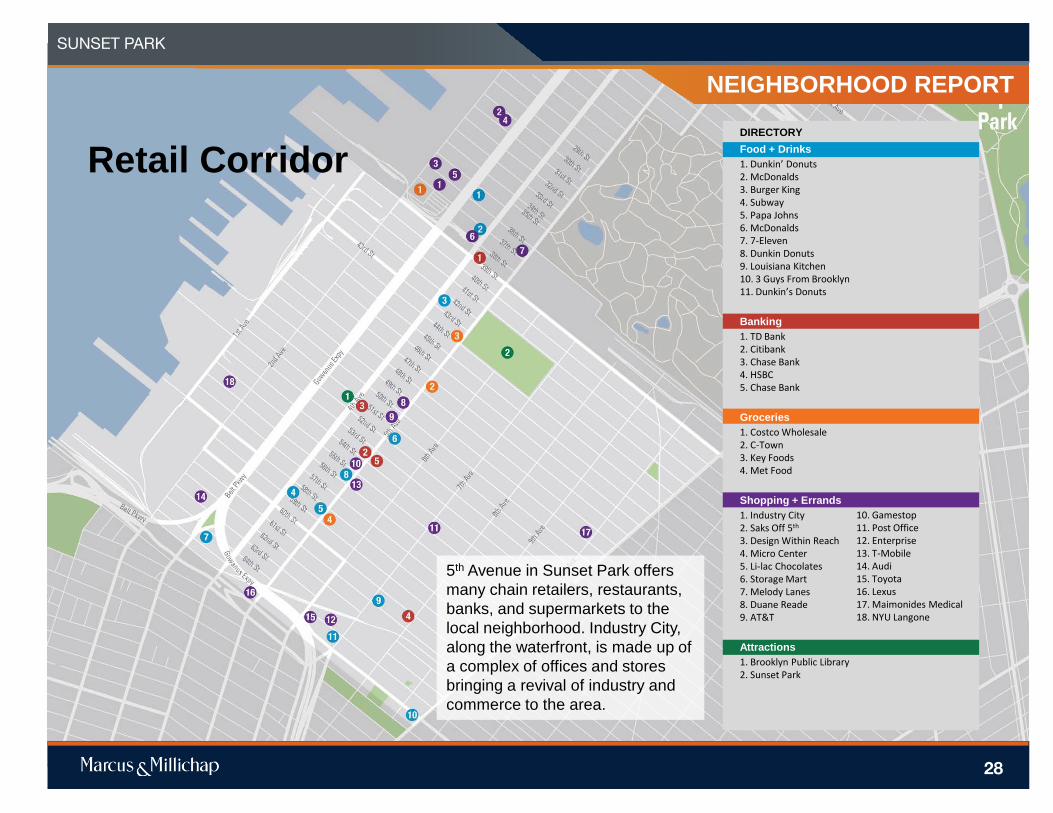
Retail Corridor
5th Avenue in Sunset Park offers many chain retailers, restaurants, banks, and supermarkets to the local neighborhood. Industry City, along the waterfront, is made up of a complex of offices and stores bringing a revival of industry and commerce to the area.
SUNSET PARK
DIRECTORY Food + Drinks 1. Dunkin’ Donuts 2. McDonalds 3. Burger King 4. Subway 5. Papa Johns 6. McDonalds 7. 7-Eleven 8. Dunkin Donuts 9. Louisiana Kitchen 10. 3 Guys From Brooklyn 11. Dunkin’s Donuts Banking 1. TD Bank 2. Citibank 3. Chase Bank 4. HSBC 5. Chase Bank Groceries 1. Costco Wholesale 2. C-Town 3. Key Foods 4. Met Food
Shopping + Errands 1. Industry City 2. Saks Off 5th 3. Design Within Reach 4. Micro Center 5. Li-lac Chocolates 6. Storage Mart 7. Melody Lanes 8. Duane Reade 9. AT&T
Attractions 1. Brooklyn Public Library 2. Sunset Park
10. Gamestop 11. Post Office 12. Enterprise 13. T-Mobile 14. Audi 15. Toyota 16. Lexus 17. Maimonides Medical 18. NYU Langone
28
NEIGHBORHOOD REPORT
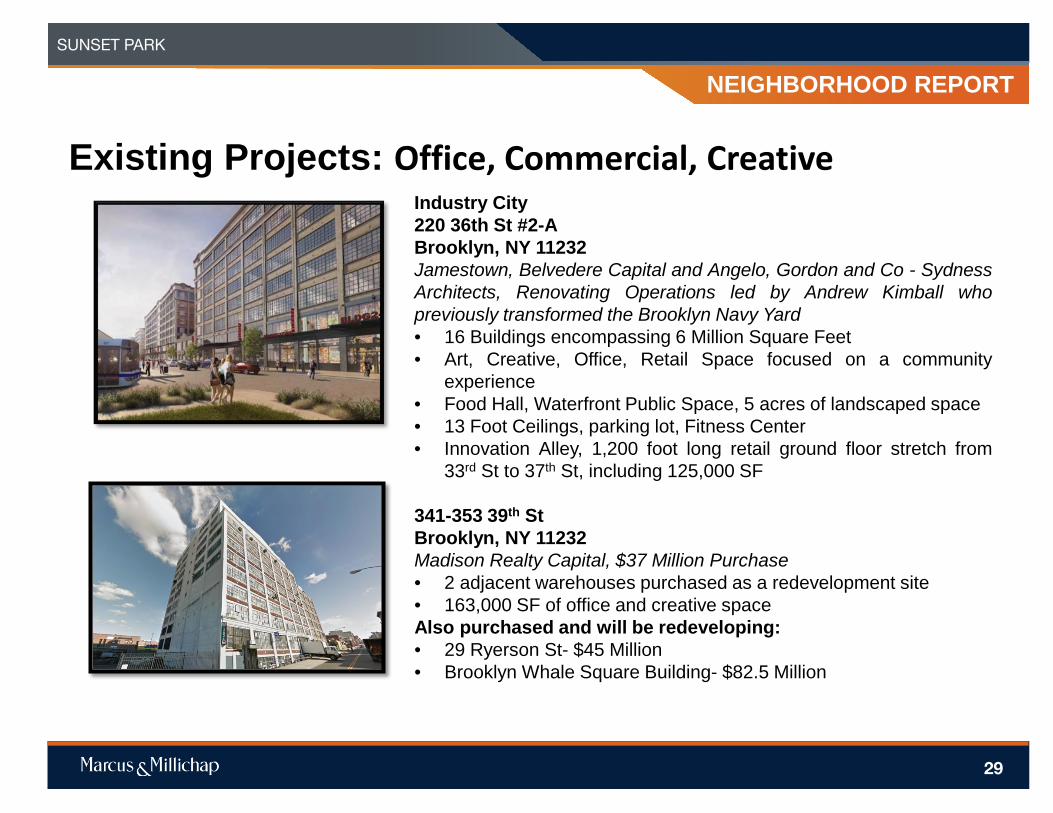
Existing Projects: Office, Commercial, Creative Industry City
220 36th St #2-A Brooklyn, NY 11232 Jamestown, Belvedere Capital and Angelo, Gordon and Co - Sydness Architects, Renovating Operations led by Andrew Kimball who previously transformed the Brooklyn Navy Yard • 16 Buildings encompassing 6 Million Square Feet • Art, Creative, Office, Retail Space focused on a community
experience • Food Hall, Waterfront Public Space, 5 acres of landscaped space • 13 Foot Ceilings, parking lot, Fitness Center • Innovation Alley, 1,200 foot long retail ground floor stretch from
33rd St to 37th St, including 125,000 SF 341-353 39th St Brooklyn, NY 11232 Madison Realty Capital, $37 Million Purchase • 2 adjacent warehouses purchased as a redevelopment site • 163,000 SF of office and creative space Also purchased and will be redeveloping: • 29 Ryerson St- $45 Million • Brooklyn Whale Square Building- $82.5 Million
SUNSET PARK
29
NEIGHBORHOOD REPORT
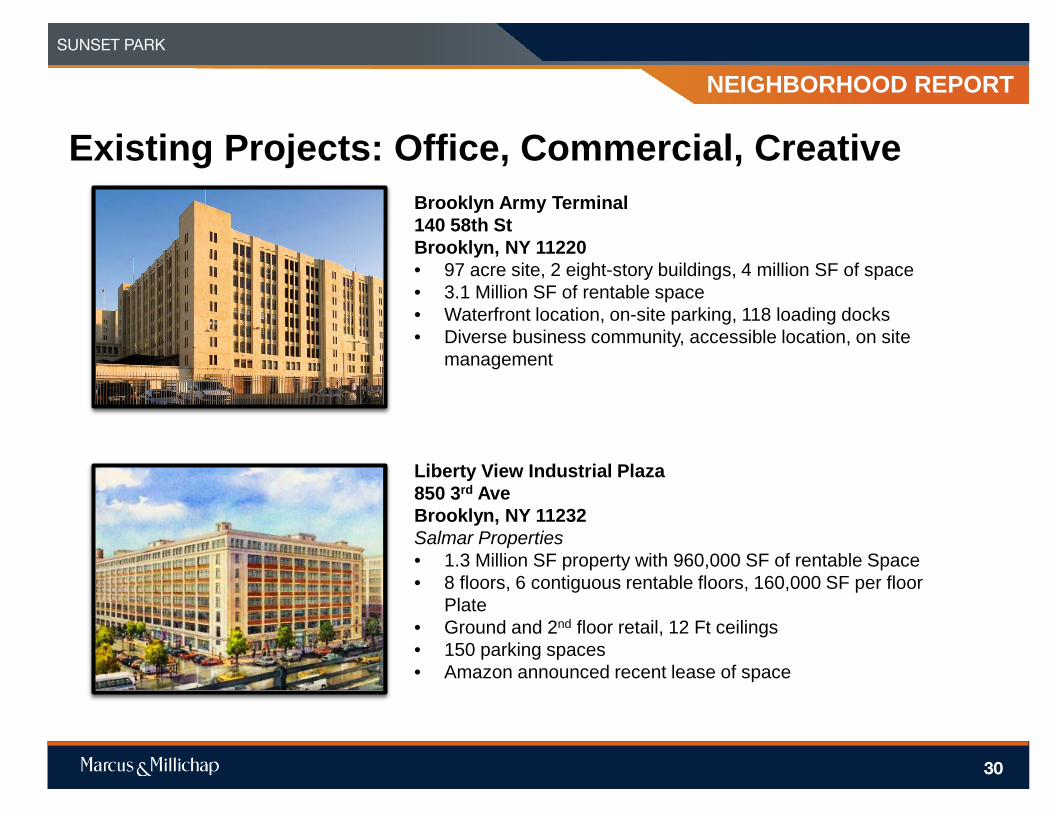
Existing Projects: Office, Commercial, Creative Brooklyn Army Terminal
140 58th St Brooklyn, NY 11220 • 97 acre site, 2 eight-story buildings, 4 million SF of space • 3.1 Million SF of rentable space • Waterfront location, on-site parking, 118 loading docks • Diverse business community, accessible location, on site
management Liberty View Industrial Plaza 850 3rd Ave Brooklyn, NY 11232 Salmar Properties • 1.3 Million SF property with 960,000 SF of rentable Space • 8 floors, 6 contiguous rentable floors, 160,000 SF per floor
Plate • Ground and 2nd floor retail, 12 Ft ceilings • 150 parking spaces • Amazon announced recent lease of space
SUNSET PARK
30

NEIGHBORHOOD REPORT
Residential Developments Projects 816 58th St, between 8th and 9th Avenues Brooklyn, NY 11220 Permits filed, William Chou developing, Shining Tam Architect • Proposed eight-story mixed-use building • 22,688 SF, 96 Ft building to include ground
floor and cellar retail, 2nd and 3rd floor daycare center, and 9 apartments to fill remaining space
• 1,276 SF per unit
SUNSET PARK
4603 8th Avenue, between 46th and 47th Street Brooklyn, NY 11220 Developer Yan Feng Liang, Architects Basics Group Corp • Six-story mixed-use building • 18,831 SF Building, ground floor retail, 2nd floor daycare,
remaining space across 3rd to 6th floor to include 10 apartments averaging 1,200 feet each
31

NEIGHBORHOOD REPORT
Representative Rental Units for Multi-Family Housing
4114 9th Ave #3C Brooklyn, NY 11232 One bedroom, one bathroom Renting for $1,775, 710 square feet
426 60th St #2 Brooklyn, NY 11220 Three bedrooms, two bathrooms Renting for $2,550 a month
SUNSET PARK
0
500
1000
1500
2000
2500
3000
Studio 1 Bedroom 2 Bedroom 3 Bedroom
Average Apartment Rents- 2016 4722 5th Ave, #1B Brooklyn, NY 11220 Alcove Studio, 1 bathroom Renting for $1,350 a month
507 41st St #2F Brooklyn, NY 11232 Two bedrooms, one bathroom Renting for $2,200 a month
32
NEIGHBORHOOD REPORT
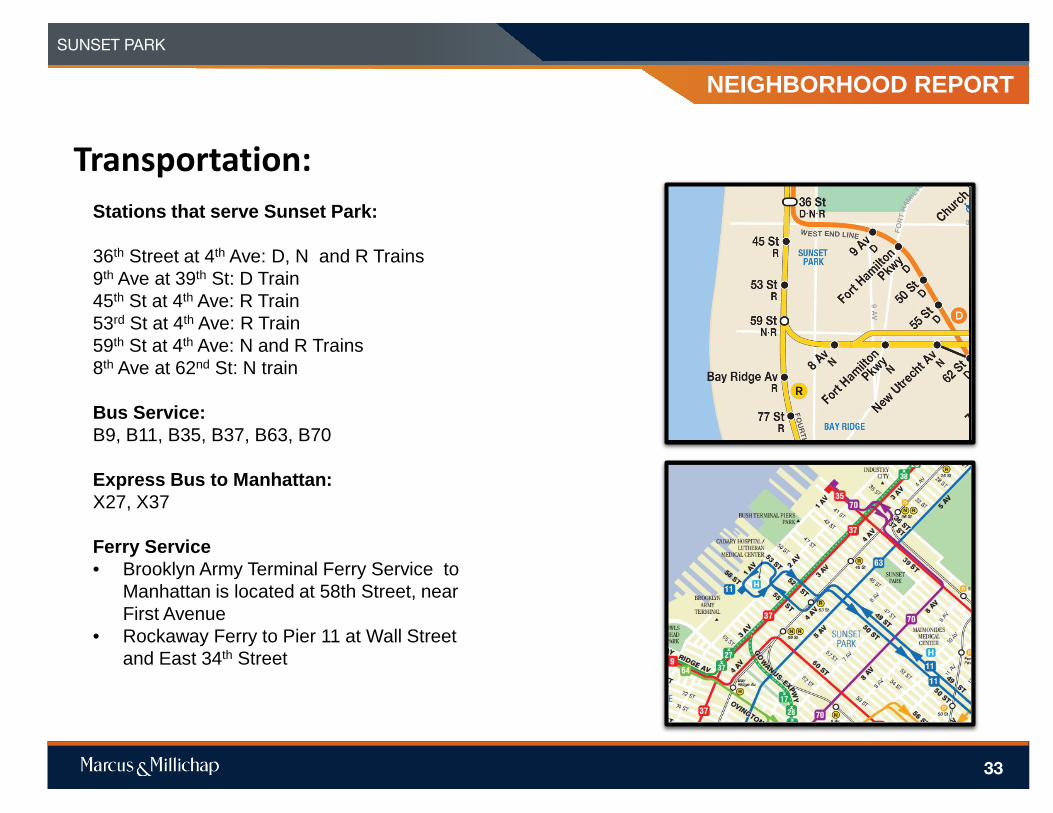
Transportation: Stations that serve Sunset Park: 36th Street at 4th Ave: D, N and R Trains 9th Ave at 39th St: D Train 45th St at 4th Ave: R Train 53rd St at 4th Ave: R Train 59th St at 4th Ave: N and R Trains 8th Ave at 62nd St: N train Bus Service: B9, B11, B35, B37, B63, B70 Express Bus to Manhattan: X27, X37 Ferry Service • Brooklyn Army Terminal Ferry Service to
Manhattan is located at 58th Street, near First Avenue
• Rockaway Ferry to Pier 11 at Wall Street and East 34th Street
SUNSET PARK
33
34
MARKET
OVERVIEW

MARKET OVERVIEW
BROOKLYN OVERVIEW
Located across the East River from Manhattan, Brooklyn is the most populous of the five New York City boroughs. Brooklyn covers 71 square miles of the land mass shared with Queens. Brooklyn is bordered to the east and south by the Atlantic Ocean, to the west by the Upper New York Bay and the East River, and to the north by the borough of Queens. The borough of Brooklyn, with a population of more than 2.5 million, is located entirely within Kings County and is divided into 18 community districts, many of which have been made famous in movies, books and television. Some of the most well-known neighborhoods include Williamsburg, Brooklyn Heights, Park Slope and Coney Island.
MARKET OVERVIEW
METRO HIGHLIGHTS
HIGH POPULATION DENSITY Were it to be counted as a standalone city, Brooklyn would be the fourth largest in the nation.
CULTURALLY DIVERSE There are almost 100 different ethnic groups offering unparalleled diversity and access to the cultures of the world.
COMPETITIVE BUSINESS COSTS Brooklyn has lower business costs than Manhattan and is easily accessible to the tri-state marketplace.
4320 3RD AVENUE
35
MARKET OVERVIEW
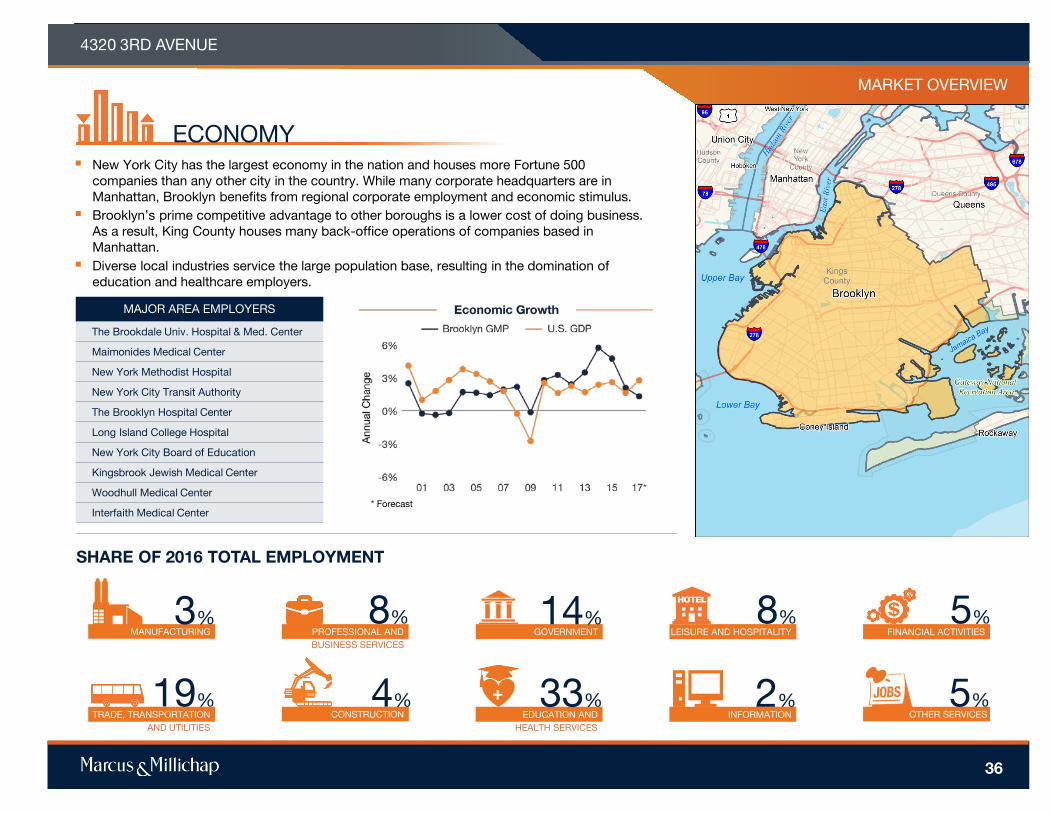
ECONOMY New York City has the largest economy in the nation and houses more Fortune 500
companies than any other city in the country. While many corporate headquarters are in Manhattan, Brooklyn benefits from regional corporate employment and economic stimulus.
Brooklyn’s prime competitive advantage to other boroughs is a lower cost of doing business. As a result, King County houses many back-office operations of companies based in Manhattan.
Diverse local industries service the large population base, resulting in the domination of education and healthcare employers.
SHARE OF 2016 TOTAL EMPLOYMENT
MAJOR AREA EMPLOYERS
The Brookdale Univ. Hospital & Med. Center
Maimonides Medical Center
New York Methodist Hospital
New York City Transit Authority
The Brooklyn Hospital Center
Long Island College Hospital
New York City Board of Education
Kingsbrook Jewish Medical Center
Woodhull Medical Center
Interfaith Medical Center * Forecast
MANUFACTURING 3%
GOVERNMENT
HEALTH SERVICES EDUCATION AND
+ OTHER SERVICES
5%
LEISURE AND HOSPITALITY FINANCIAL ACTIVITIES
19% AND UTILITIES
TRADE, TRANSPORTATION CONSTRUCTION
PROFESSIONAL AND BUSINESS SERVICES
2% INFORMATION
8%
4%
14% 8% 5%
33%
4320 3RD AVENUE
36

MARKET OVERVIEW
DEMOGRAPHICS
SPORTS
EDUCATION
ARTS & ENTERTAINMENT
The borough is expected to add nearly 50,000 people through 2021. During this time, roughly 30,000 households will be formed, generating demand for housing.
The homeownership rate of 27 percent is well below the national rate of 64 percent, maintaining a strong rental market.
Brooklynites are more educated than the U.S., with 31 percent having attained at least a bachelor’s degree, compared with the national figure of 29 percent.
Ongoing revitalization efforts boroughwide have spawned a modest rebirth of the local
economy. As the maritime industry’s impact wanes, borough officials are developing
creative ways to capitalize on the desirable waterfront location such as in the Brooklyn
Navy Yard, Erie Basin/Sunset Park, Newtown Creek and the Red Hook Marine Terminal.
Residents and visitors have a number of entertainment, sports and cultural venues to
choose from. The Brooklyn Nets and New York Islanders play in the Barclays Center.
Cultural and academic institutions include Brooklyn Academy of Music, the Brooklyn
Museum, the New York Aquarium, Prospect Park and the Brooklyn Botanic Garden.
* Forecast Sources: Marcus & Millichap Research Services; BLS; Bureau of Economic Analysis; Experian; Fortune; Moody’s Analytics; U.S. Census Bureau
34.5 2016
MEDIAN AGE:
U.S. Median:
37.7
$47,100 2016 MEDIAN
HOUSEHOLD INCOME:
U.S. Median:
$54,500
2.7M 2016
POPULATION:
Growth 2016-2021*:
1.8%
995K 2016
HOUSEHOLDS:
2.6%
Growth 2016-2021*:
QUALITY OF LIFE
2016 Population by Age
0-4 YEARS
8% 5-19 YEARS
18% 20-24 YEARS
7% 25-44 YEARS
32% 45-64 YEARS
23% 65+ YEARS
12%
4320 3RD AVENUE
37
MARKET OVERVIEW
38
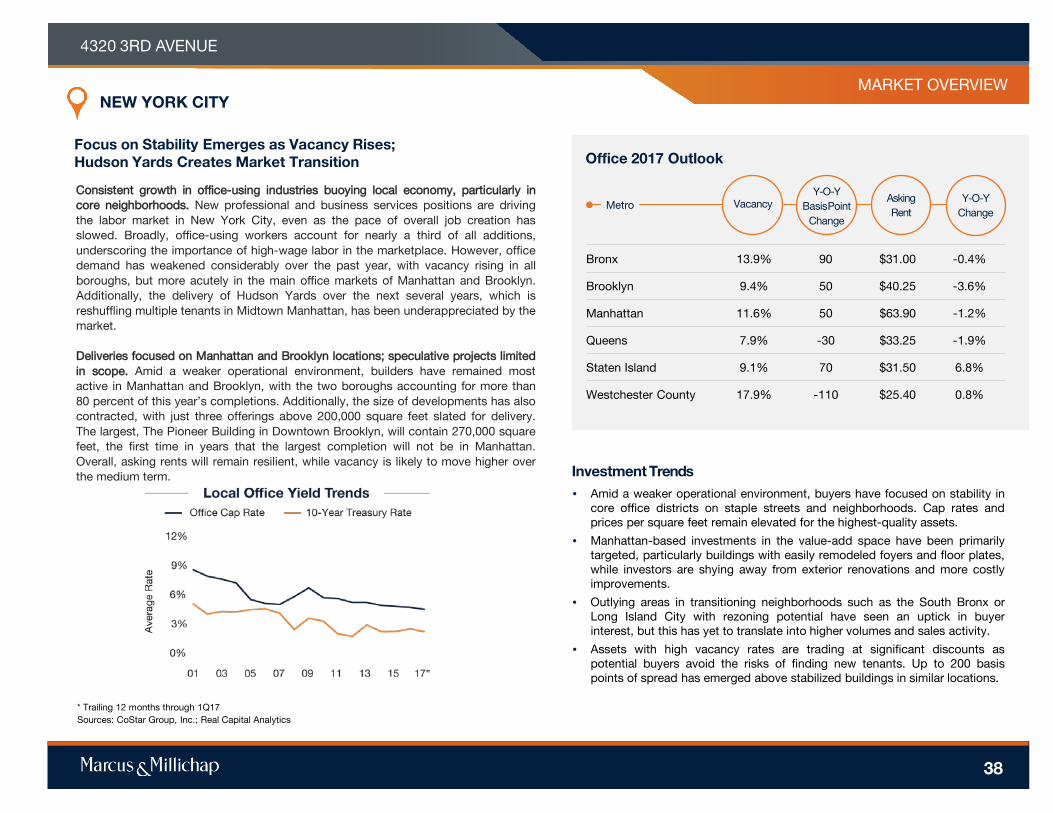
Consistent growth in office-using industries buoying local economy, particularly in core neighborhoods. New professional and business services positions are driving the labor market in New York City, even as the pace of overall job creation has slowed. Broadly, office-using workers account for nearly a third of all additions, underscoring the importance of high-wage labor in the marketplace. However, office demand has weakened considerably over the past year, with vacancy rising in all boroughs, but more acutely in the main office markets of Manhattan and Brooklyn. Additionally, the delivery of Hudson Yards over the next several years, which is reshuffling multiple tenants in Midtown Manhattan, has been underappreciated by the market. Deliveries focused on Manhattan and Brooklyn locations; speculative projects limited in scope. Amid a weaker operational environment, builders have remained most active in Manhattan and Brooklyn, with the two boroughs accounting for more than 80 percent of this year’s completions. Additionally, the size of developments has also contracted, with just three offerings above 200,000 square feet slated for delivery. The largest, The Pioneer Building in Downtown Brooklyn, will contain 270,000 square feet, the first time in years that the largest completion will not be in Manhattan. Overall, asking rents will remain resilient, while vacancy is likely to move higher over the medium term.
Focus on Stability Emerges as Vacancy Rises; Hudson Yards Creates Market Transition
NEW YORK CITY
* Trailing 12 months through 1Q17 Sources: CoStar Group, Inc.; Real Capital Analytics
Investment Trends • Amid a weaker operational environment, buyers have focused on stability in
core office districts on staple streets and neighborhoods. Cap rates and prices per square feet remain elevated for the highest-quality assets.
• Manhattan-based investments in the value-add space have been primarily targeted, particularly buildings with easily remodeled foyers and floor plates, while investors are shying away from exterior renovations and more costly improvements.
• Outlying areas in transitioning neighborhoods such as the South Bronx or Long Island City with rezoning potential have seen an uptick in buyer interest, but this has yet to translate into higher volumes and sales activity.
• Assets with high vacancy rates are trading at significant discounts as potential buyers avoid the risks of finding new tenants. Up to 200 basis points of spread has emerged above stabilized buildings in similar locations.
4320 3RD AVENUE
Office 2017 Outlook
Vacancy Y-O-Y
Basis Point Change
Metro Asking Rent
Y-O-Y Change
Bronx 13.9% 90 $31.00 -0.4%
Brooklyn 9.4% 50 $40.25 -3.6%
Manhattan 11.6% 50 $63.90 -1.2%
Queens 7.9% -30 $33.25 -1.9%
Staten Island 9.1% 70 $31.50 6.8%
Westchester County 17.9% -110 $25.40 0.8%

MARKET OVERVIEW
39
• Manhattan employers are forecasted to add 32,620 workers this year, expanding local payrolls by 1.3 percent. In the previous year, 46,000 jobs were created. Nearly 350,000 positions have been created since the recovery began in 2010.
• Low unemployment is limiting headline job growth. Highly skilled workers are in short supply.
EMPLOYMENT
• Over the past year, deliveries rose to 1.9 million from 675,000 square feet in the previous year. More than 1.8 million square feet of the space was brought online in Midtown Manhattan.
• Through the remainder of 2017, 1.3 million square feet will be finished. The largest, the Cornell Tech Campus, is 230,000 square feet.
CONSTRUCTION
• Vacancy rose to 11.2 percent as negative net absorption of 3.1 million square feet prompted an uptick in available space. The Midtown South submarket underperformed, with vacancy rising 100 basis points to 10.1 percent.
• The Uptown Manhattan submarket outperformed substantially as vacancy fell 10 basis points to 5.3 percent over the past year.
VACANCY
• A bifurcated market prompted a moderate rent growth environment, with prices rising to $64.31 per square foot. The Midtown South submarket underperformed, with prices per square foot falling 5.1 percent to $66.05.
• Uptown and Downtown Manhattan performed well, rising 8.4 percent to $50.94 per square foot and 6 percent to $54.90 per square foot, respectively.
RENTS
NEW YORK CITY: MANHATTAN
increase in the average asking rent Y-O-Y
0.5% basis point increase in vacancy Y-O-Y 90 square feet
completed Y-O-Y
1.9 million increase in total employment Y-O-Y 1.3%
* Forecast
YEAR OVER YEAR
4320 3RD AVENUE

MARKET OVERVIEW
40
Demographic Highlights
Declining Activity Underpins Drop in Prices And Dollar Volume
Outlook: Buyers have become increasingly vigilant with regard to pro forma return requirements and lease terms in place as market conditions have softened.
Vacancy Rate
Y-O-Y Basis Point
Change Submarket
Asking Rent
Y-O-Y % Change
Uptown 5.3% -10 $50.94 8.4%
Midtown South 10.1% 100 $66.05 -5.1%
Downtown 11.5% 90 $54.90 6.0%
Midtown 11.7% 90 $67.76 0.5%
Overall Metro 11.2% 90 $64.31 0.5%
Submarket Trends
Lowest Vacancy Rates 1Q17
Sales Trends
NEW YORK CITY: MANHATTAN
• Over the past year, transactions slid 8 percent as vacancy rose broadly across the county. Cap rates remained in the high-3 to low-4 percent range.
• Prices per square foot slid to the low-$1,100 range, down marginally from the previous year. This followed a $2 billion drop in dollar volume to $16.2 billion.
Pricing trend sources: CoStar Group, Inc.; Real Capital Analytics
4320 3RD AVENUE
Demographic Highlights
2017 FORECAST JOB GROWTH
* POPULATION AGE 20-34
Metro 30% U.S. Average 21%
**SQ. FT. PER OFFICE WORKER
Metro 428 U.S. Average 210
2017 OFFICE-USING JOB GROWTH
POPULATION OF AGE 25+ * PERCENT WITH BACHELOR DEGREE+
Metro 60% U.S. Average 29% * 2017-2022
**1Q17
U.S. Average 1.4%
Metro 1.5%
Metro 1.3%
U.S. Average 2.2%
1Q17 MEDIAN HOUSEHOLD INCOME
Metro $77,991 U.S. Average $58,218

MARKET OVERVIEW
41
• Kings County organizations are forecasted to create 10,800 jobs this year as hiring continues to remain strong. Last year, businesses, nonprofits and the government added 12,900 workers to payrolls.
• Nearly 160,000 positions have been added in the county since 2010. As a result, labor markets have tightened significantly, prompting overall hiring activity to slow.
EMPLOYMENT
• Deliveries rose sharply during the last 12 months, rising from 71,800 square feet in the previous year to more than 434,000 square feet.
• Construction will rise considerably through 2017. More than 1.2 million square feet is underway, led by The Pioneer Building and 620 Fulton St. in Downtown Brooklyn, accounting for 435,500 square feet combined.
CONSTRUCTION
• A higher pace of development and negative net absorption over the past year pushed vacancy to 9 percent, 140 basis points higher than the prior year.
• Submarket performance was broadly similar, with vacancy rising in all portions of the county. Downtown Brooklyn was most impacted as vacancy rose 200 basis points to 8.1 percent.
VACANCY
• The rise in vacancy was also accompanied by a slowdown in average asking rents, which declined to $40.64 per square foot. The North Brooklyn submarket outperformed as asking rents rose 2.2 percent to $29.44 per square foot.
• Asking rents slipped 5.3 percent to $53.35 per square foot in Downtown Brooklyn.
RENTS
NEW YORK CITY: BROOKLYN
decrease in the average asking rent Y-O-Y
6.5% basis point increase in vacancy Y-O-Y 140 square feet
completed Y-O-Y
434,000 increase in total employment Y-O-Y 1.5%
* Forecast
YEAR OVER YEAR
4320 3RD AVENUE

MARKET OVERVIEW
42
Increased Focus on Vacancy Pushes Cap Rates Higher
Outlook: Fully leased properties in good locations will sell quickly, while more risky assets will trade at a discount.
Vacancy Rate
Y-O-Y Basis Point
Change Submarket
Effective Rent
Y-O-Y % Change
Downtown Brooklyn 8.1% 200 $53.35 -5.3%
North Brooklyn 9.0% 50 $29.44 2.2%
South Brooklyn 10.7% 80 $25.25 -14.1%
Overall Metro 9.0% 140 $40.64 -6.5%
Submarket Trends
Lowest Vacancy Rates 1Q17
Sales Trends
NEW YORK CITY: BROOKLYN
• Amid a rise in vacancy, buyers have been much more selective in their acquisitions, preferring centrally located properties with low or no vacancy. As a result, prices per square foot have slipped to the mid-$500s on a minor slowdown in dealmaking.
• Deal flow has shifted toward South Brooklyn as investors shy away from risks related to the L train shutdown over the next few years. Cap rates have shifted toward the mid-5 percent range as a result.
Pricing trend sources: CoStar Group, Inc.; Real Capital Analytics
4320 3RD AVENUE
Demographic Highlights
2017 FORECAST JOB GROWTH
* POPULATION AGE 20-34
Metro 25% U.S. Average 21%
**SQ. FT. PER OFFICE WORKER
Metro 372 U.S. Average 210
2017 OFFICE-USING JOB GROWTH
POPULATION OF AGE 25+ * PERCENT WITH BACHELOR DEGREE+
Metro 31% U.S. Average 29% * 2017-2022
**1Q17
U.S. Average 1.4%
Metro 1.8%
Metro 1.5%
U.S. Average 2.2%
1Q17 MEDIAN HOUSEHOLD INCOME
Metro $52,940 U.S. Average $58,218

MARKET OVERVIEW
43
• Over the past year, builders delivered 41,000 square feet, dramatically slowing the pace of construction from more than 485,000 square feet in the previous year.
• Construction will pick back up through the remainder of 2017, with 390,000 square feet of office space underway. The largest project is Flushing Commons, containing 164,000 square feet.
CONSTRUCTION
• Activity remained broadly in line with prior years, yet cap rates ticked higher as investors moved to acquire value-add properties with upside potential.
• Dollar volume more than tripled during the year as buyers positioned in core neighborhoods with cap rates in the mid- to high-6 percent range.
INVESTMENT HIGHLIGHTS:
NEW YORK CITY: QUEENS
square feet completed Y-O-Y 41,000
• Vacancy declined 60 basis points to 8.1 percent as a lack of new supply and net absorption above 220,000 square feet triggered tighter market conditions.
VACANCY AND RENT:
basis point decrease in vacancy Y-O-Y 60
• Average asking rents rose to $33.32 per square foot, boosted by South and Northeast Queens. Asking rents soared 14.2 percent to $27.88 per square foot and 15.4 percent to $40.25 per square foot, respectively.
increase in the average asking rent Y-O-Y 6.2%
* Forecast Sources: CoStar Group, Inc.; Real Capital Analytics
4320 3RD AVENUE

MARKET OVERVIEW
44
• The delivery of one project in the third quarter of 2016 is the first completion since 2011, underscoring the lack of construction over the past several years.
• No buildings will be finished through the remainder of the year as the benign development environment remains in place.
CONSTRUCTION
• Transaction velocity slowed considerably as fewer owners opted to list. Pricing appreciated immensely but was largely a result of the assets that exchanged ownership rather than a revaluation of properties.
• Cap rates remain near the upper end of the metro, with average yields in the mid- to high-6 percent band for stabilized offerings.
INVESTMENT HIGHLIGHTS:
NEW YORK CITY: STATEN ISLAND
square feet completed Y-O-Y 38,100
• Net absorption of 92,100 square feet contributed to a vacancy decline to 9.3 percent, the lowest rate in over 10 years.
VACANCY AND RENT:
basis point decrease in vacancy Y-O-Y 140
• Asking rents vaulted 10.9 percent higher to $31.08 per square foot as a lack of deliveries and robust net absorption pushed demand up for existing spaces.
increase in the average asking rent Y-O-Y 10.9%
* Forecast Sources: CoStar Group, Inc.; Real Capital Analytics
4320 3RD AVENUE
MARKET OVERVIEW
45
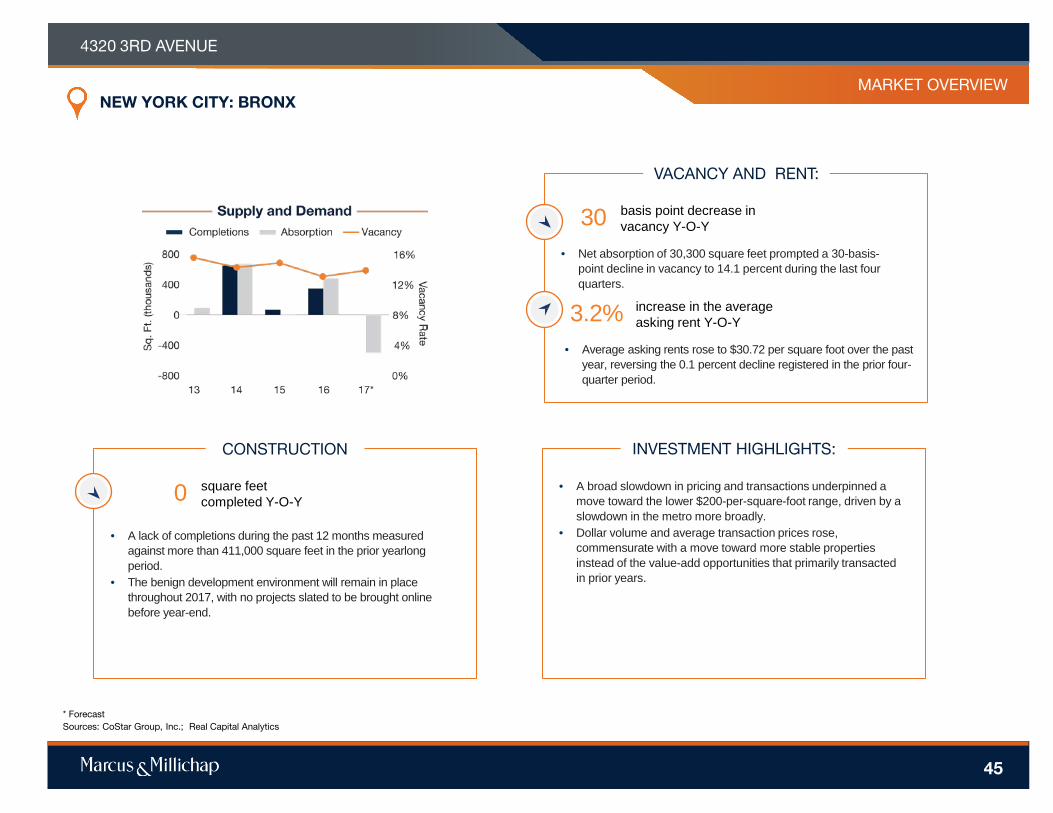
• A lack of completions during the past 12 months measured against more than 411,000 square feet in the prior yearlong period.
• The benign development environment will remain in place throughout 2017, with no projects slated to be brought online before year-end.
CONSTRUCTION
• A broad slowdown in pricing and transactions underpinned a move toward the lower $200-per-square-foot range, driven by a slowdown in the metro more broadly.
• Dollar volume and average transaction prices rose, commensurate with a move toward more stable properties instead of the value-add opportunities that primarily transacted in prior years.
INVESTMENT HIGHLIGHTS:
NEW YORK CITY: BRONX
square feet completed Y-O-Y 0
• Net absorption of 30,300 square feet prompted a 30-basis-point decline in vacancy to 14.1 percent during the last four quarters.
VACANCY AND RENT:
basis point decrease in vacancy Y-O-Y 30
• Average asking rents rose to $30.72 per square foot over the past year, reversing the 0.1 percent decline registered in the prior four-quarter period.
increase in the average asking rent Y-O-Y 3.2%
* Forecast Sources: CoStar Group, Inc.; Real Capital Analytics
4320 3RD AVENUE

MARKET OVERVIEW
46
• Builders haven’t delivered any buildings for the past six quarters, with the last significant completions coming online in 2015.
• A 30,000-square-foot medical office property in White Plains will represent the only office delivery this year.
CONSTRUCTION
• An uptick in pricing and cap rates emerged as dollar volume nearly doubled to more than $260 million over the past year.
• Cap rates have moved toward the low-7 percent band, primarily driven by an acceleration in value-add property demand. Assets along the Connecticut border comprised the bulk of transactions.
INVESTMENT HIGHLIGHTS:
NEW YORK CITY: WESTCHESTER COUNTY
square feet completed Y-O-Y 0
• No new space and net absorption above 534,000 square feet prompted a 120-basis-point decline in vacancy to 18.3 percent over the past year.
VACANCY AND RENT:
basis point decrease in vacancy Y-O-Y 120
• A sharp decline in vacancy had no effect on average asking rents, which remained unchanged at $25.22 per square foot.
change in the average asking rent Y-O-Y 0%
* Forecast Sources: CoStar Group, Inc.; Real Capital Analytics
4320 3RD AVENUE

MARKET OVERVIEW
47
• Monetary policy in transition. Despite the Fed raising its benchmark short-term rate three times in seven months and signaling another rise before the end of the year, long-term rates have remained stable. The yield on the 10-year U.S. Treasury bond remained in the low- to mid-2 percent range throughout the second quarter of 2017. The Federal Reserve wants to normalize monetary policy and, in addition to rate hikes, will start paring its balance sheet. While short- and long-term rates do not always move in tandem, both actions by the Fed have the potential to lift long-term rates.
• Sound economy a balancing act for Fed. With unemployment at the lowest level since 2007 at 4.3 percent, the Federal Reserve will remain vigilant regarding the possible rapid increase in inflation if wage growth takes off. Additionally, business confidence sits close to its all-time high. Businesses finally have the confidence to expand their footprint after years of tepid growth following the Great Recession. Office properties stand to gain significantly from this expansion with increased hiring adding to occupancy, plus expanding economic growth. The Fed, however, must now balance economic growth and job creation against wage growth and inflationary pressures.
• Underwriting discipline persists; ample debt capital remains. Overall, leverage on
acquisition loans has continued to reflect disciplined underwriting, with LTVs typically
ranging from 60 percent to 75 percent for most office properties. At the end of 2016, the
combination of higher rates, conservative lender underwriting and fiscal policy uncertainty
encouraged some investor caution that slowed deal flow, a trend that has extended into
2017. A potential easing of regulations on financial institutions, though, could liberate
additional lending capacity and higher interest rates may also encourage additional lenders
to participate. * Forecast Sources: CoStar Group, Inc.; Real Capital Analytics
NEW YORK CITY
Capital Markets
4320 3RD AVENUE
PROPERTY NAME
MARKETING TEAM
4320 3RD AVENUE
DEMOGRAPHICS
Source: © 2016 Experian
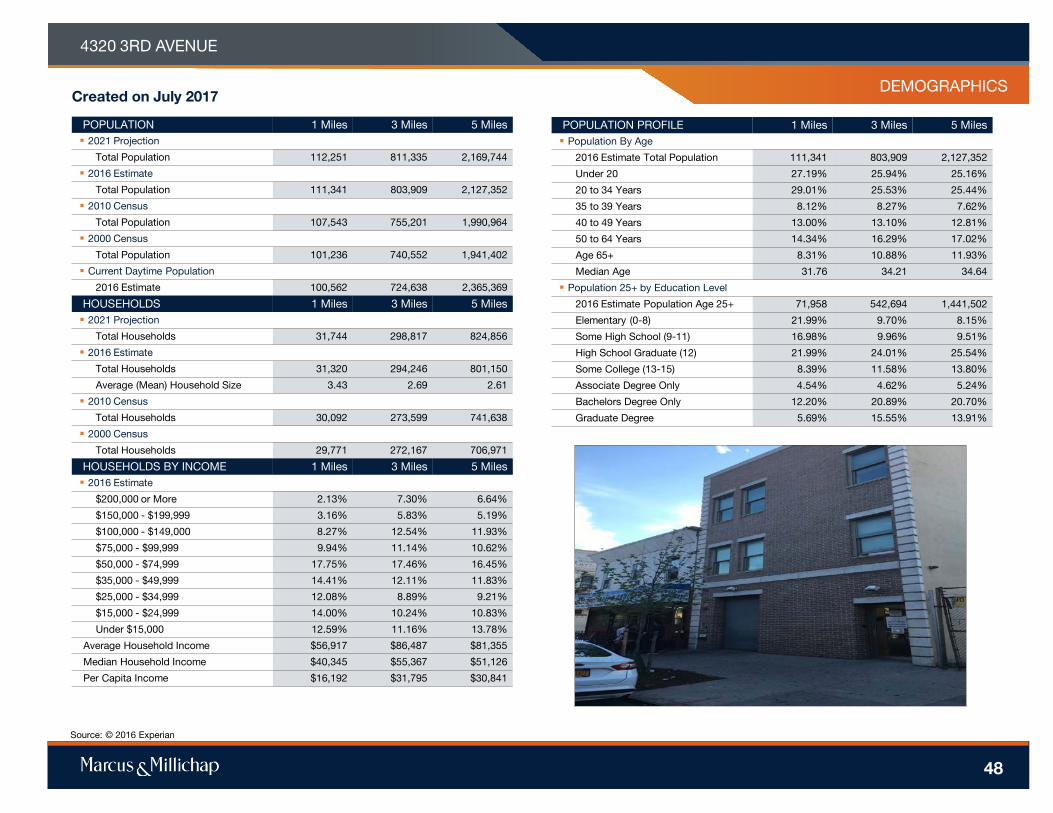
Created on July 2017
POPULATION 1 Miles 3 Miles 5 Miles 2021 Projection
Total Population 112,251 811,335 2,169,744
2016 Estimate
Total Population 111,341 803,909 2,127,352
2010 Census
Total Population 107,543 755,201 1,990,964
2000 Census
Total Population 101,236 740,552 1,941,402
Current Daytime Population
2016 Estimate 100,562 724,638 2,365,369
HOUSEHOLDS 1 Miles 3 Miles 5 Miles 2021 Projection
Total Households 31,744 298,817 824,856
2016 Estimate
Total Households 31,320 294,246 801,150
Average (Mean) Household Size 3.43 2.69 2.61
2010 Census
Total Households 30,092 273,599 741,638
2000 Census
Total Households 29,771 272,167 706,971
HOUSEHOLDS BY INCOME 1 Miles 3 Miles 5 Miles 2016 Estimate
$200,000 or More 2.13% 7.30% 6.64%
$150,000 - $199,999 3.16% 5.83% 5.19%
$100,000 - $149,000 8.27% 12.54% 11.93%
$75,000 - $99,999 9.94% 11.14% 10.62%
$50,000 - $74,999 17.75% 17.46% 16.45%
$35,000 - $49,999 14.41% 12.11% 11.83%
$25,000 - $34,999 12.08% 8.89% 9.21%
$15,000 - $24,999 14.00% 10.24% 10.83%
Under $15,000 12.59% 11.16% 13.78%
Average Household Income $56,917 $86,487 $81,355
Median Household Income $40,345 $55,367 $51,126
Per Capita Income $16,192 $31,795 $30,841
POPULATION PROFILE 1 Miles 3 Miles 5 Miles Population By Age
2016 Estimate Total Population 111,341 803,909 2,127,352
Under 20 27.19% 25.94% 25.16%
20 to 34 Years 29.01% 25.53% 25.44%
35 to 39 Years 8.12% 8.27% 7.62%
40 to 49 Years 13.00% 13.10% 12.81%
50 to 64 Years 14.34% 16.29% 17.02%
Age 65+ 8.31% 10.88% 11.93%
Median Age 31.76 34.21 34.64
Population 25+ by Education Level
2016 Estimate Population Age 25+ 71,958 542,694 1,441,502
Elementary (0-8) 21.99% 9.70% 8.15%
Some High School (9-11) 16.98% 9.96% 9.51%
High School Graduate (12) 21.99% 24.01% 25.54%
Some College (13-15) 8.39% 11.58% 13.80%
Associate Degree Only 4.54% 4.62% 5.24%
Bachelors Degree Only 12.20% 20.89% 20.70%
Graduate Degree 5.69% 15.55% 13.91%
48

PROPERTY NAME
MARKETING TEAM
4320 3RD AVENUE
DEMOGRAPHICS
Source: © 2016 Experian
Created on July 2017
POPULATION BY TRANSPORTATION TO WORK
1 Miles 3 Miles 5 Miles
2016 Estimate Total Population
Bicycle 1.43% 1.25% 1.07%
Bus or Trolley Bus 8.78% 8.05% 10.61%
Carpooled 7.46% 5.42% 5.08%
Drove Alone 14.62% 16.03% 18.22%
Ferryboat 0.00% 0.05% 0.52%
Motorcycle 0.06% 0.06% 0.08%
Other Means 0.53% 0.53% 0.55%
Railroad 0.85% 1.06% 1.27%
Streetcar or Trolley Car 0.22% 0.21% 0.29%
Subway or Elevated 49.47% 52.13% 46.81%
Taxicab 0.31% 0.44% 0.50%
Walked 13.61% 10.14% 10.77%
Worked at Home 2.67% 4.64% 4.22%
POPULATION BY TRAVEL TIME TO WORK
1 Miles 3 Miles 5 Miles
2016 Estimate Total Population
Under 15 Minutes 10.53% 9.39% 10.16%
15 - 29 Minutes 15.74% 17.12% 19.27%
30 - 59 Minutes 30.92% 34.06% 32.94%
60 - 89 Minutes 22.86% 18.96% 17.95%
90 or More Minutes 8.83% 5.22% 5.59%
Worked at Home 2.67% 4.64% 4.22%
Average Travel Time in Minutes 48 45 44
49
Income In 2016, the median household income for your selected geography is $40,345, compare this to the US average which is currently $54,505. The median household income for your area has changed by 40.49% since 2000. It is estimated that the median household income in your area will be $44,813 five years from now, which represents a change of 11.07% from the current year. The current year per capita income in your area is $16,192, compare this to the US average, which is $29,962. The current year average household income in your area is $56,917, compare this to the US average which is $78,425.
Population In 2016, the population in your selected geography is 111,341. The population has changed by 9.98% since 2000. It is estimated that the population in your area will be 112,251.00 five years from now, which represents a change of 0.82% from the current year. The current population is 52.12% male and 47.88% female. The median age of the population in your area is 31.76, compare this to the US average which is 37.68. The population density in your area is 35,383.07 people per square mile.
Households There are currently 31,320 households in your selected geography. The number of households has changed by 5.20% since 2000. It is estimated that the number of households in your area will be 31,744 five years from now, which represents a change of 1.35% from the current year. The average household size in your area is 3.43 persons.
Employment In 2016, there are 29,457 employees in your selected area, this is also known as the daytime population. The 2000 Census revealed that 43.62% of employees are employed in white-collar occupations in this geography, and 56.56% are employed in blue-collar occupations. In 2016, unemployment in this area is 9.19%. In 2000, the average time traveled to work was 48.00 minutes.
Race and Ethnicity The current year racial makeup of your selected area is as follows: 29.63% White, 3.82% Black, 0.05% Native American and 36.56% Asian/Pacific Islander. Compare these to US averages which are: 70.77% White, 12.80% Black, 0.19% Native American and 5.36% Asian/Pacific Islander. People of Hispanic origin are counted independently of race. People of Hispanic origin make up 48.82% of the current year population in your selected area. Compare this to the US average of 17.65%.
PROPERTY NAME
MARKETING TEAM
4320 3RD AVENUE
Housing The median housing value in your area was $523,642 in 2016, compare this to the US average of $187,181. In 2000, there were 6,735 owner occupied housing units in your area and there were 23,036 renter occupied housing units in your area. The median rent at the time was $639.
Source: © 2016 Experian
DEMOGRAPHICS
50

8
4320 3RD AVENUE
DEMOGRAPHICS
51
www.MarcusMillichap.com
Jakub H. Nowak
Licensed Associate Real Estate Broker
Brooklyn Office Tel: (718) 475-4353 Fax: (718) 475-4310
License: NY 10301211147
Jake Torre
Licensed Real Estate Salesperson
Brooklyn Office Tel: (718) 475-4325 Fax: (718) 475-4310
License: NY 10401280593
P R E S E N T E D B Y