3 international comparisons: identifying benchmarks and
TRANSCRIPT

Next Generation Connectivity
28
3 International comparisons: Identifying benchmarks and
practice models
3.1 Why use international comparisons?
International comparisons, in particular broadband penetration rates as reported by the Organization for Economic Cooperation and Development (OECD) and International Telecommunications Union (ITU), have been a political hot button in the past few years. Because the United States began the first decade of this century with the fourth highest levels of broadband penetration among OECD nations, and is closing the decade in 15th place in these same rankings, and because, according to ITU measures the United States slipped from 11th to 17th between 2002 and 2007, many have used these data to argue that the United States, on its present policy trajectory, is in decline. Others have responded by criticizing the quality of the data in various ways, asserting that the United States broadband market is performing well and there is no concern to be addressed. The debate occasionally resembles that of a horse race; indeed, a horse race in which those who have already placed their bets are arguing about how to decide which horse has won.
There are two primary problems with the horse race approach to international rankings as it has been used in public debate in the United States. First, there has been too much emphasis on one particular measure—penetration per 100 inhabitants, which is only one way of measuring one facet of what one might plausibly seek to learn from a benchmarking exercise. Second, there has been too much emphasis on precisely where the United States ranks, as opposed to defining a range of metrics that would allow us to identify countries that are appropriate examples from which we can learn: both from their successes and failures. The point of benchmarking along multiple dimensions is to provide us with an ability to identify countries that have had positive or negative outcomes along given dimensions of interest. Where a country measures well on a given desired outcome—for example, high levels of mobile broadband penetration, or low prices for very-high-speed offerings—it is worthwhile looking at the context and policy actions that contributed to this outcome, and to consider whether these could be transplanted successfully to the U.S. If a country or cluster of countries performs well on several different measures, one can begin to look more holistically at that country or cluster, and consider whether there are characteristics that are susceptible to transposition into the American context. The basic premise is that countries at comparable levels of economic development have faced similar problems and have adopted different approaches to addressing those problems. Through real world experimentation, by a process of trial and error, different approaches are tried in different places. Looking to the experience of places that implemented a policy and thereafter began to perform better (or worse) than other places that did not implement that policy at the same time allows us to discern whether there might be a lesson to be learned and whether the lesson is that a given practice may make sense to adopt or should be avoided (or at least treated with suspicion). Because countries differ along many dimensions, these lessons are not easily distilled and transplanted to a different environment without modification and judgment. This is why the rankings and quantitative analyses can point in the right direction, but must be supplemented with a qualitative understanding of the detailed conditions and practices as market, social, geographic, and regulatory-political determinants.
While there can and should be plausible critiques of any sources of data and analysis, along with adjustments to data collection over time, and appropriate caution in its interpretation, it would be a grave mistake on the part of the United States simply to ignore and fail to use such data sets in its planning and longer-term monitoring of our own performance and the consequences of policies we adopt. To support the integration of evidence into American policymaking, here we endeavor to do two things. First, we

International comparisons
29
present a wider range of measures than are commonly used to get at the core questions: how many people have broadband; what, technically, do they “have” when they have broadband; and at what price. That is, we look at measures of penetration, capacity, and price. Second, we provide independent data that we have gathered and analyzed in order to fill in gaps and to evaluate existing measurements. We use market analysis data for penetration and price, and actual measurements of speed and latency, in the case of capacity. We describe these data alongside other sources of data, most extensively OECD data, and correlate the data from different sources. The reanalysis of OECD data in combination with independently collected data gives us a strong degree of confidence in the results. While we do not claim that our measurements are necessarily better than those made by others, we do gain confidence where the results of our observations, using independent techniques and/or sources of evidence, are well correlated with other sources of measurement. Before turning to reporting the measurements, the analysis of critiques, and the results of our independent tests, we explain in Section 3.2. the relative emphasis of different existing measurement exercises, and which of these exercises is most useful to provide evidence for which kind of policy focus.
3.2 Measures focused on users/consumers vs. measures focused on business
There are two clusters of rankings: those that tend to locate the U.S. in the mid-teens of the rankings, and those that locate the U.S. at the very top of the rankings. The most important of the former are the OECD (U.S. ranked 15th) and ITU (17th) rankings.15 The second cluster includes, most prominently, the Connectivity Scorecard (U.S. ranks 1st) created by Leonard Waverman of the University of Calgary in collaboration with the consulting firm LECG and funded by Nokia Siemens Networks, and the World Economic Forum Network Readiness Index (U.S. ranks 3rd), produced in collaboration with the Insead Business School in France.
The principal difference between these two clusters of rankings is not their methodological quality but their focus. The purpose of one's inquiry determines which cluster is more relevant. The OECD and ITU measures are directly focused on Internet, broadband, and telecommunications-specific measures of performance. The OECD in particular covers and reports extensively on broadband-related data: such as number of subscribers as a percentage of the population and households, price ranges, speeds of access, etc. The ITU itself also collects and reports actual statistics on telecommunications and covers many more countries than the OECD. It therefore includes many comparators that are sufficiently different in wealth and technological state as to be noisier points of comparison, and it reports information that is not quite as rich on this much larger set of countries. Its index or ranking, the ICT Development Index (ITU-IDI), largely reflects communications and computer data, but also includes a component reflecting literacy, as well as secondary and tertiary educational enrollment rates. In this regard, both the OECD broadband measures and the ITU-IDI, particularly its sub-indices that exclude the educational attainment, are focused on specific measurable outcomes in terms of population-wide broadband availability, use, capacity, and price.
15 In this cluster there is also an additional sensible adaptation of the OECD data, produced by Robert Atkinson of the D.C.-
based Information Technology and Innovation Foundation (ITIF), which creates a ranking based on a composite of penetration per households rather than per-inhabitant, speed, and price. The U.S. ranks 15th in this ranking. While it does not change the position of the U.S., which is the concern of those looking at the horse races, it does change the position of several other countries, emphasizing in particular the successes of South Korea and Japan.

Next Generation Connectivity
30
By contrast, the WEF/INSEAD Network Readiness Index and the Waverman Connectivity Scorecard emphasize business use and availability. The WEF/INSEAD index captures a wide set of indicators, addressing a much broader range of policy concerns, not only in science and technology, but also in business environment more generally. The U.S. ranks third in this index. The report accompanying this index cites several factors as burdens on the U.S. ranking, including its relatively high burden of regulation and tax, the inefficacy of American law making, and the inefficiency of American dispute resolution and its low level of judicial independence (the U.S. ranks in the 20s on efficacy of law making and on judicial independence in this index). Factors tending to support the relatively high ultimate standing of the U.S. on this index are the efficiency of its markets and venture capital activity, its well developed R&D clusters, including Silicon Valley and the Research Triangle, its large pool of scientists and engineers, and the high quality of its universities.16 The breadth of parameters, both positive and negative, should provide sufficient flavor to understand that this index is useful in considering broad science and technology policy questions. If one is interested more specifically in broadband policy—understood as policy aimed at supporting ubiquitous high capacity access to all Americans at affordable rates—the measures that influence standing in this index sweep too broadly to provide meaningful guidance. It would be odd to include in a National Broadband Plan an effort to improve the efficacy of American law making or the independence of its judiciary. Moreover, in the more relevant sub-index of the WEF/Insead index (the sub-index that focuses on individual network readiness) the U.S. ranks 14th, very similar to its ranking in the OECD and ITU rankings, and in the individual usage sub-index the U.S. ranks 10th. In the sub-index describing business readiness, the U.S. ranks 3rd; in business usage, the U.S. ranks 5th.
Similar to the WEF/INSEAD Readiness Index, the Waverman Connectivity Scorecard focuses on business use of information and communications technology. And, like the Network Readiness Index, the Waverman Scorecard finds that businesses in the United States are well connected and networked, and are relatively well-positioned to take advantage of that connectivity. As the 2009 edition states, “the Scorecard is relatively heavily weighted towards the business sector. As a result, countries that perhaps have superior fiber residential broadband networks, or perhaps high mobile subscriber rates, will find themselves weighed down if there has not been a corresponding investment in business infrastructure and the necessary capital and skills to turn infrastructure into productivity enhancing vehicles.”17 Beyond the general focus on the business sector, the Waverman Scorecard, because of its focus on economic growth and its determinants, measures not only connectivity, but factors that would complement network connectivity and contribute to economic growth. The U.S. occupies a middle-tier position based on the measures that are shared with the other indices. As Waverman and his collaborators put it: “When one considers consumer infrastructure measures – as is typical of most indices – the U.S. performance is mediocre on some metrics. However, our results are actually consistent with much published research showing that the U.S. economy has benefited more strongly from ICT than most others, with the primary difference lying in more intensive ICT use by business.” To the extent one is concerned with business use of information technology, these two indices suggest that the United States is in a reasonably good condition. To the extent that one is concerned with wide dispersion of broadband to consumers, in both served and underserved areas, and with developing ubiquitous access for the American population, both the Connectivity Scorecard and the WEF/INSEAD Network Readiness Index provide less insight and, where they cover similar ground, do not appear to contradict the OECD and ITU data.
16 WEF/INSEAD 2009 report, Chapter 1.1, page 14. 17 Waverman 2009, at 3.

International comparisons
31
3.3 Penetration: Fixed
There are two commonly used methods to measure fixed broadband penetration rates: the number of subscriber lines per capita and the percentage of households with broadband connections. These metrics are based on significantly different perspectives on broadband connectivity and are based on very different data collection methods. They each have their strengths and weaknesses and both merit consideration. The subscriptions per capita measure, normally expressed as subscriptions per 100 inhabitants, includes both business and household subscriptions described as “broadband” by the carriers, and therefore provides a broader measure of connectivity than household measures. The data is collected from telecommunication carriers and reported by national telecommunications regulators. It is more frequently updated and has broader coverage than household measures, which are reported by national statistical agencies, rather than telecommunications regulators, and are based on household surveys which are more expensive and difficult to implement. The per capita broadband penetration measure has been collected for a longer period, and there are many fewer missing measurements for any given country over the past decade. On the other hand, the household subscription data is in several ways a cleaner measure of consumer connectivity, because fixed-line subscriptions are usually purchased per household. The subscriptions per capita measure is therefore more difficult to interpret and compare across countries as each subscription may cover several members of a given household and several employees of a business. Household data, however, omit business connections that are sold as “broadband connections” as opposed to various private line arrangements, and these are also an important part of broadband diffusion, particularly among small and medium sized businesses. Neither of these measures is, then, perfect. However, taken together, they offer a more robust and comprehensive view of Internet connectivity than either one does alone.
3.3.1 Penetration per 100 inhabitants measure
The best known benchmark of international performance on broadband has been the OECD's annual release of rankings of its 30 members, based on penetration of fixed broadband per 100 inhabitants. In these rankings the United States was 15th in the most recent report of 2009. These rankings have received the most attention and been subject to extensive criticism. Figure 3.1 represents the number of subscribers per 100 inhabitants in a country. The Nordic countries are uniformly high performers by this measure, occupying five of the top eight slots. The top six, or top quintile, includes Denmark, Norway, and Iceland, as well as the Netherlands, Switzerland, and South Korea. The second quintile includes, in addition to Sweden and Finland: Canada, the United Kingdom, Belgium, and Luxembourg. In our analysis throughout much of this report we largely exclude close analysis of the very small countries like Iceland and Luxembourg, because their experience is too different to provide useful insight. The third quintile is made up of France, Germany, the United States, Australia, Japan, and New Zealand. Spain, Ireland and Italy only make the fourth quintile. As we continue to go through the various metrics, one of the things we will be looking for are particularly high performers. We will also look for countries with stark disparities different measures. For example, Italy is only 22nd out of 30 in fixed broadband penetration per 100 but, as we shall see, is fifth in mobile broadband penetration. Canada is a second quintile performer in penetration (down from having penetration levels second only to South Korea's in 2003), but only a fourth quintile performer on speeds and prices. Keeping an eye out for these kinds of discrepancies allows us to identify false “successes” and false “failures,” or be more precise about what aspects of a country's performance are worth learning for adoption, and which should be avoided.

Next Generation Connectivity
32
Figure 3.1. Broadband penetration
0
10
20
30
40D
en
ma
rk
Ne
the
rla
nd
s
No
rwa
yS
witz
erl
an
d
Ice
lan
d
So
uth
Ko
rea
Sw
ed
en
Fin
lan
d
Lu
xe
mb
ou
rg
Ca
na
da
Un
ited
Kin
gd
om
Be
lgiu
m
Fra
nce
Ge
rma
ny
Un
ited
Sta
tes
Au
str
alia
Ja
pa
nN
ew
Ze
ala
nd
Au
str
ia
Sp
ain
Ire
lan
d
Ita
ly
Cze
ch
Re
pu
blic
Hu
ng
ary
Po
rtu
ga
l
Gre
ece
Slo
va
k R
ep
ub
lic
Po
lan
d
Tu
rke
y
Me
xico
Source: OECD 2008
Su
bsc
ribe
rs p
er
10
0 in
hab
itan
ts
DSL
Cable
Fibre/ LAN
Other
Un
ite
d S
tate
s0
10
20
30
40D
en
ma
rk
Ne
the
rla
nd
s
No
rwa
yS
witz
erl
an
d
Ice
lan
d
So
uth
Ko
rea
Sw
ed
en
Fin
lan
d
Lu
xe
mb
ou
rg
Ca
na
da
Un
ited
Kin
gd
om
Be
lgiu
m
Fra
nce
Ge
rma
ny
Un
ited
Sta
tes
Au
str
alia
Ja
pa
nN
ew
Ze
ala
nd
Au
str
ia
Sp
ain
Ire
lan
d
Ita
ly
Cze
ch
Re
pu
blic
Hu
ng
ary
Po
rtu
ga
l
Gre
ece
Slo
va
k R
ep
ub
lic
Po
lan
d
Tu
rke
y
Me
xico
Source: OECD 2008
Su
bsc
ribe
rs p
er
10
0 in
hab
itan
ts
DSL
Cable
Fibre/ LAN
Other
DSL
Cable
Fibre/ LAN
Other
Un
ite
d S
tate
s
The ITU also tracks fixed broadband subscribers per 100 inhabitants as part of its ICT Development Index.18 If we look only at OECD countries as reported in the ITU index for 2007, the United States switches places with Germany, edging ahead to 14th place.
The only substantial change from the OECD ranking is that Sweden moves from 7th to 1st place, nudging Denmark and the Netherlands from first and second to second and third places, and Finland and South Korea switch places from the bottom of the first to the top of the second quintile and vice versa. The ITU data shows Hong Kong as the only non-OECD member with higher fixed broadband penetration than the U.S.
A third measure of subscriptions per capita is available from an independent firm, TeleGeography. This market analysis data is based largely on reports by the companies directly to TeleGeography. In this dataset, the United States comes out 16th, instead of 15th (Figure 3.2). The rankings based on this independent market data are almost perfectly correlated the penetration rankings of the OECD, with an R2 of 0.98 (Figure 3.3). The almost perfect correlation in reports to a market analysis firm and those reported to, and filtered through, national and international authorities suggests that the underlying subscription data is likely based on measures that are not greatly distorted, whether reported to government agencies or otherwise.
18 ITU, ICT-IDI, 2009, Indicator 7. Reported under Use Indicators, pp. 93-94.

International comparisons
33
Figure 3.2. Broadband penetration as reported in TeleGeography
0%
10%
20%
30%
40%D
en
ma
rkN
eth
erl
an
ds
Ice
lan
d
No
rwa
yS
witz
erl
an
dS
ou
th K
ore
aF
inla
nd
Sw
ed
en
Be
lgiu
m
Au
str
alia
Fra
nce
Un
ited
Ca
na
da
Ge
rma
ny
Lu
xe
mb
ou
rg
Un
ited
Sta
tes
Ja
pa
nN
ew
Ze
ala
nd
Au
str
iaS
pa
inIr
ela
nd
Ita
lyC
zech
Re
pu
blic
Po
rtu
ga
lH
un
ga
ryG
ree
ceS
lova
k R
ep
ub
lic
Po
lan
dT
urk
ey
Me
xico
Source: TeleGeography
Bro
ad
ba
nd s
ub
scri
be
rs a
s p
erc
en
t o
f p
opu
latio
n,
Q3 2
00
8
Un
ite
d S
tate
s
Un
ited K
ing
dom
Figure 3.3. Comparison of OECD and TeleGeography data
0%
10%
20%
30%
40%
0 10 20 30 40
OECD subscribers per 100 inhabitants
Te
leG
eo
gra
ph
yp
en
etr
ation,
20
08
Source: Berkman Center analysis of OECD and TeleGeography broadband statistics
R2 = 0.98DK
NL
NOCH
IS
FI
LU
GBBEFR
DEUS
AU
JP
NZAT
ESIE
ITCZ
HU
PT
GR
SKPLTR
MX
KR
SE
CA
0%
10%
20%
30%
40%
0 10 20 30 40
OECD subscribers per 100 inhabitants
Te
leG
eo
gra
ph
yp
en
etr
ation,
20
08
Source: Berkman Center analysis of OECD and TeleGeography broadband statistics
R2 = 0.98DK
NL
NOCH
IS
FI
LU
GBBEFR
DEUS
AU
JP
NZAT
ESIE
ITCZ
HU
PT
GR
SKPLTR
MX
KR
SE
CA

Next Generation Connectivity
34
3.3.2 Measuring household penetration
When viewed by household penetration rates rather than per capita estimates, the international position of the U.S. is unchanged. The data here are older, because the most recent official estimate for the United States is the Current Population Survey conducted by the Census Bureau in the fall of 2007. Updated figures are unlikely to improve the U.S. standing. The most recent figures from the Pew Internet and American Life Project report that 60% of U.S. households have broadband access, citing surveys conducted in December 2009.19 Statistics from Eurostat for 2009 report twelve countries with higher household penetration rates, not including Canada, Japan, South Korea and Switzerland.
Figure 3.4. Household broadband penetration rates
0
20
40
60
80
100
So
uth
Ko
rea
Ice
lan
d
Ne
the
rla
nd
sD
en
ma
rkN
orw
ay
Sw
ed
en
Ca
na
da
Sw
itze
rla
nd
Fin
lan
dL
uxe
mb
ou
rgU
nite
d K
ing
do
mB
elg
ium
Au
stra
lia
Ja
pa
nU
nite
d S
tate
s
Ge
rma
ny
Au
str
iaF
ran
ce
Sp
ain
Ne
w Z
ea
lan
dH
un
ga
ryIr
ela
nd
Po
rtu
ga
lP
ola
nd
Cze
ch
Re
pu
blic
Slo
vak R
ep
ub
lic
Italy
Gre
ece
Me
xic
oT
urk
ey
Ho
useh
old
s w
ith
bro
ad
ban
d a
ccess
Un
ited
Sta
tes
Source: OECDNote: Data for New Zealand reflects 2006; data for Turkey reflects 2005
Using household subscription levels provides useful nuance, but does not fundamentally change the picture for most countries, including the U.S. As Figure 3.5 shows, the two measures are highly correlated and return the same basic result for most countries. This is not true for all countries. The country most heavily “penalized” by the use of a per capita rather than per household measure is South Korea.20 Table 3.1 shows that the primary effects of looking at household penetration are to move South
19 Lee Rainie, Internet, Broadband and Cellphone Statistics, January 2010, Available at:
http://www.pewinternet.org/Reports/2010/Internet-broadband-and-cell-phone-statistics.aspx 20 In our original draft, Japan too was considered a substantial under-performer in per capita terms when compared to
household penetration. Since the publication of our original draft, the OECD updated its household data, adding 2007 data for some countries (including Switzerland) that had 2006 or earlier data available until recently. From the perspective of Japan, we explained in our original report that “The Japanese numbers are potentially polluted by the fact that they include 3G subscriptions, which are particularly high in Japan, and therefore make it potentially inappropriate to interpret the Japanese household penetration numbers as in fact comparable to those of other countries. It is the case, however, that 3G services include, for example, NTT DoCoMo's “U Home” service, which offers 54Mbps service in the home. This home-specific 3G service is, in other words, faster than the fixed service available in all but a handful of countries. Given this fact, we report the Japanese household numbers with the remainder of the household penetration numbers, though with the noted caution.” The most recent OECD household data available attempts to correct for this overcounting by reporting only computer-based broadband use, therefore trying to control for the differences introduced

International comparisons
35
Korea back to the top of the list. There are slight movements in the rankings within the third quintile, with Japan and Australia moving ahead of the U.S., while France and Germany move to being lower than the U.S. Switzerland moves out of the top quintile to the second quintile, while Canada moves ahead within the second quintile. The U.S. position, however, remains unchanged.
Figure 3.5. Broadband penetration per 100 inhabitants and by households.
MX
PL
TR
AU
AT
BE
CA
CZ
DK
FI
FR
DE
GR
HU
IS
IE
IT
JP
KR
LU
NL
NZ
NO
PT
SK
ES
SE
CHGB
US
0
25
50
75
100
0 10 20 30 40
Broadband subscribers per 100 inhabitants,2007
Perc
en
t o
f h
ou
seh
old
s w
ith
bro
ad
ban
d,2
00
7
Source: OECDNote: Data for New Zealand reflects 2006; data for Turkey reflects 2005
R2 = 0.86
It is important to remember that the OECD collects and reports official data from the member states’ official statistics agencies about household penetration rates, as well as data from telecommunications regulators about subscription rates. Arguments about the weakness of the data by pointing to different numbers from different survey organizations that show slightly different rankings is somewhat akin to saying that one does not agree with the BLS employment statistics for the last month, and prefers this or that market survey instead. It may make one’s country look better on the rankings, but it simply is not a basis on which to form policy using long term comparable data.
by the use of 3G for home service in Japan. Using that number, Japan is now 12th—slightly better than its per-capita penetration ranking, but not to the same extent as we reported in the original draft.

Next Generation Connectivity
36
Table 3.1. Impact on country rank
Turkey
Mexico
Greece
Italy
Slovak Republic
Czech Republic
Poland
Portugal
Ireland
Hungary
New Zealand
Spain
France
Austria
Germany
United States
Japan
Australia
Belgium
United Kingdom
Luxembourg
Finland
Switzerland
Canada
Sweden
Norway
Denmark
Netherlands
Iceland
South Korea
Country
29
30
26
22
28
23
27
24
21
25
19
20
13
18
14
15
17
16
12
11
9
6
3
10
7
5
1
2
4
8
Per 100 rank
30
29
28
27
26
25
24
23
22
21
20
19
18
17
16
15
14
13
12
11
10
9
8
7
6
5
4
3
2
1
Per household rank Change in rank
Turkey
Mexico
Greece
Italy
Slovak Republic
Czech Republic
Poland
Portugal
Ireland
Hungary
New Zealand
Spain
France
Austria
Germany
United States
Japan
Australia
Belgium
United Kingdom
Luxembourg
Finland
Switzerland
Canada
Sweden
Norway
Denmark
Netherlands
Iceland
South Korea
Country
Turkey
Mexico
Greece
Italy
Slovak Republic
Czech Republic
Poland
Portugal
Ireland
Hungary
New Zealand
Spain
France
Austria
Germany
United States
Japan
Australia
Belgium
United Kingdom
Luxembourg
Finland
Switzerland
Canada
Sweden
Norway
Denmark
Netherlands
Iceland
South Korea
Country
29
30
26
22
28
23
27
24
21
25
19
20
13
18
14
15
17
16
12
11
9
6
3
10
7
5
1
2
4
8
Per 100 rank
29
30
26
22
28
23
27
24
21
25
19
20
13
18
14
15
17
16
12
11
9
6
3
10
7
5
1
2
4
8
Per 100 rank
30
29
28
27
26
25
24
23
22
21
20
19
18
17
16
15
14
13
12
11
10
9
8
7
6
5
4
3
2
1
Per household rank
30
29
28
27
26
25
24
23
22
21
20
19
18
17
16
15
14
13
12
11
10
9
8
7
6
5
4
3
2
1
Per household rank Change in rank
Because we have a longer period of consistent measurement by the OECD for penetration per 100 inhabitants, because that measure is so highly correlated with the primary real target of interest for much policy—household penetration, and because it is more current, we will often use penetration per 100 inhabitants where doing so will allow us to make claims about periods that precede good comparable data on household penetration, or periods that are more recent than available household-level data. While we do so, however, we must remember that per inhabitant penetration has little effect on the standing of most countries, except that it substantially understates penetration in South Korea, slightly understates penetration in Japan, Australia, Canada, Hungary, and Poland, substantially overstates penetration in Italy, France, and Switzerland, and slightly overstates penetration in Denmark, Finland, Germany, and the Czech Republic. It has no effect on U.S. standing.
Trends over time
The penetration rates per 100 have been the most salient politically because they are collected and published regularly, and so have provided the starkest image of what has been described by some as

International comparisons
37
American relative decline in the pace and level of uptake of the first broadband transition. Figure 3.6 presents historical penetration rates from the second quarter of 2002 until the fourth quarter of 2008 for the top quintile performers in 2002, and the top quintile performers in 2008. Figure 3.7 presents a similar longer term comparison of the United States and the four largest European economies.
There can be little argument that, to the extent that the OECD reports of penetration per 100 inhabitants are a pertinent measure of broadband uptake, they provide a long term view of the performance of the American broadband market relative to the performance of other markets. The numbers suggest that many of these other countries started with lower levels of penetration, and, with the exception of Italy, at some point between 2002 and 2005, accelerated and overtook the U.S. broadband market. Trying to identify what made these countries accelerate as they did, which countries accelerated more, and why, could offer some insight into the potential contribution of policy to broadband penetration.
Comparing penetration rates over time using household penetration rates is complicated by gaps in the available data. The available data, however, shows a pattern consistent with the trends seen in the per capita measure. As shown in Table 3.2, the US was between 7th and 10th place in 2003.21 Four years later, in 2007, the US was 15th.
21 The actual U.S. position in 2003 depends on the penetration rate at the time for Belgium, Iceland, Sweden and
Switzerland, countries that later showed up as clearly ahead of the U.S. in household penetration, but for which there was no 2003 data. It is clear that Australia, Finland, Luxembourg, and the UK have since surpassed the U.S. It is likely that subsequent data will show Germany among other countries passing the U.S. in household penetration rates.

Next Generation Connectivity
38
Figure 3.6. Top quintile penetration rates over the last 6 years.
0
10
20
30
40Q
20
2
Q4
02
Q2
03
Q4
03
Q2
04
Q4
04
Q2
05
Q4
05
Q2
06
Q4
06
Q2
07
Q4
07
Q2
08
Q4
08
DenmarkNetherlandsNorwaySwitzerlandIcelandSouth KoreaSwedenCanadaBelgiumUS
Source: OECD 2008Note: US, Belgium, Canada, Sweden were top quintile in 2002, but are no longer in 2008
Su
bsc
ribe
rs p
er
10
0 in
hab
itan
ts
Figure 3.7. Large European economies penetration rates over the last 6 years.
0
10
20
30
Q2
02
Q4
02
Q2
03
Q4
03
Q2
04
Q4
04
Q2
05
Q4
05
Q2
06
Q4
06
Q2
07
Q4
07
Q2
08
Q4
08
UKFranceGermanyUS
Source: OECD 2008
Italy
Su
bscri
be
rs p
er
10
0 in
ha
bita
nts
0
10
20
30
Q2
02
Q4
02
Q2
03
Q4
03
Q2
04
Q4
04
Q2
05
Q4
05
Q2
06
Q4
06
Q2
07
Q4
07
Q2
08
Q4
08
UKFranceGermanyUS
Source: OECD 2008
Italy
Su
bscri
be
rs p
er
10
0 in
ha
bita
nts

International comparisons
39
Table 3.2. Trends in household broadband penetration rates over time.
1.70.2Turkey
9.86.14.22.21.90.40.3Mexico
22.57.53.80.60.20.6Greece
30.825.316.212.9Italy
33.2New Zealand
35.326.511.47.13.6Slovak Republic
36.428.116.65.14.51.5Czech Republic
37.929.621.615.68.3Poland
39.330.424.019.712.37.9Portugal
42.333.022.010.95.8Hungary
42.930.713.17.42.90.6Ireland
44.639.229.320.815.0Spain
50.819.99.14.4United States
52.043.028.316.3Australia
54.546.133.123.115.910.3Austria
54.949.633.523.218.09.3Germany
57.142.930.3France
58.551.740.744.343.032.7Japan
60.356.448.040.6Belgium
61.057.844.133.416.37.4Luxembourg
61.556.743.931.515.810.7United Kingdom
63.052.8Switzerland
64.257.950.144.135.529.321.6Canada
66.162.952.936.121.312.4Finland
70.766.651.040.2Sweden
73.066.757.141.430.022.9Norway
74.073.866.253.920.0Netherlands
74.169.563.351.235.825.1Denmark
83.276.172.163.545.4Iceland
94.394.194.095.985.766.068.056.430.3South Korea
200820072006200520042003200220012000
Source: OECD, 2009
1.70.2Turkey
9.86.14.22.21.90.40.3Mexico
22.57.53.80.60.20.6Greece
30.825.316.212.9Italy
33.2New Zealand
35.326.511.47.13.6Slovak Republic
36.428.116.65.14.51.5Czech Republic
37.929.621.615.68.3Poland
39.330.424.019.712.37.9Portugal
42.333.022.010.95.8Hungary
42.930.713.17.42.90.6Ireland
44.639.229.320.815.0Spain
50.819.99.14.4United States
52.043.028.316.3Australia
54.546.133.123.115.910.3Austria
54.949.633.523.218.09.3Germany
57.142.930.3France
58.551.740.744.343.032.7Japan
60.356.448.040.6Belgium
61.057.844.133.416.37.4Luxembourg
61.556.743.931.515.810.7United Kingdom
63.052.8Switzerland
64.257.950.144.135.529.321.6Canada
66.162.952.936.121.312.4Finland
70.766.651.040.2Sweden
73.066.757.141.430.022.9Norway
74.073.866.253.920.0Netherlands
74.169.563.351.235.825.1Denmark
83.276.172.163.545.4Iceland
94.394.194.095.985.766.068.056.430.3South Korea
200820072006200520042003200220012000
Source: OECD, 2009

Next Generation Connectivity
40
3.3.3 Critiques of penetration measures and international comparisons
The benchmarking exercises have been the subject of extensive criticism, particularly the OECD penetration per 100 rankings. The most common criticisms have been: (1) Measuring penetration per 100 inhabitants “penalizes” countries with bigger households, like the U.S.; (2) The OECD data represent what companies tell their regulators and what these regulators in turn tell the OECD, and companies may misreport to their governments and governments misreport to multilateral organizations, in each case to make themselves look good; (3) Americans access broadband at work and in their educational institutions, and these are under-counted by the rankings; (4) the OECD rankings do not cover wireless connections, in particular 3G and publicly-available Wi-Fi connections; and (5) that differences in penetration rates are explained by differences in demand-side factors such as economic conditions, demography, and consumer preferences and by differences in geography, for example, high speed facilities are harder to deploy in sparsely populated countries, and the U.S. is less densely populated than the countries ahead of it in the rankings. We take up the critique regarding mobile broadband penetration in a separate section; mobile penetration is sufficiently important to be reported as an independent metric.
The most widely noted critique of the OECD per 100 rankings is that they penalize the United States, which has larger households than other countries. These critiques, whether well founded or not in theory, make little difference for assessing U.S. performance in the medium term given the fact that the U.S. occupies the same position if measured in terms of household penetration. The conceptual critique is sometimes combined with an effort to combine official estimates for some countries with unofficial estimates different from those reported by national agencies to the OECD, resulting in somewhat more generous evaluations of U.S. performance. It is important to remember that, while the two critiques are often combined, they are entirely distinct. If household adoption is a better standard of measurement, then the fact that the same source—OECD using official government data of the member states—reports the U.S. in virtually the same position in the international rankings using either measure should lay to rest the importance of the theoretical difference in using the two measures for US practical policymaking purposes, at least in the mid-term future before we reach full household saturation.22
Conceptually, we agree that observing household penetration is distinctly important, and indeed, likely more important than penetration per 100. Using and contrasting both per capita and household penetration measures offers a more complete picture, however. The primary disadvantage of using penetration per household rankings, rather than rankings per 100 inhabitants, is that by seeking to correct for household size such a ranking will miss—and therefore understate—business use. Most pertinently, this approach will result in ignoring use by small and medium size businesses that use consumer-type offerings reported by carriers as broadband subscriptions. Unless one holds the position that small business use is irrelevant as a policy matter, one should be cautious about abandoning
22 A clever rendition of the argument preferring household to per-100 measure is that, because of its relatively high
household sizes, the U.S. will rank 20th in the OECD if measured in per capita terms once every household and business in the OECD has a broadband connection (George S. Ford, Thomas M. Koutsky, and Lawrence J. Spiwak. July 2007. The Broadband Performance Index: A Policy-Relevant method of Comparing Broadband Adoption Among Countries. Phoenix Center Policy Paper Number 29). Even assuming that projection to be true, and that it will bias the results of the two measures to render the per-100 ultimately useless, the actual measurements, of actual penetration numbers, in the period before we reach such high levels of saturation, suggest that measurement of per 100 is in fact, as a practical matter, a good predictor of household penetration, and has additional desirable characteristics described in the text. The information lost by abandoning a regularly update, objective measure that also describes some relevant data (business use) that is not captured by the household measure is much greater than the clarity supposedly gained.

International comparisons
41
completely a measure that does reflect it for a measure that does not. Moreover, measures of household penetration are based on household surveys, not carrier-level subscription data reporting.23 This makes data collection for household penetration more expensive and time consuming. Well-constructed household level data is therefore updated less frequently, and offers more coarse-grained observation over time. Subscription data, on the other hand, is reported by carriers, on a quarterly basis, using simple objective criteria that result in consistent reporting (see Figure 3.3, for example). The reason to use both metrics is that, while we care about small business use as a measure of broadband policy and about regularly-updated data, is it clearly correct that, for purposes of identifying countries that have been more or less successful in connecting citizens in their homes, a household measure is indeed better.
Often combined with the conceptual argument are efforts to introduce alternative measurements of household penetration that show a more flattering position for the U.S. As we noted, these are entirely separate criticisms, and have nothing to do with whether households are the ideal measurement or not. The risk with these efforts is that different researchers can pick different resources, like picking friends in the crowd. The most widely noted version of this approach is Wallsten (2009).24 This paper finds that the US is “somewhere between 8th and 10th place” in household penetration rates, looking at the end of 2007 as the benchmark year. It does so by comparing the data reported in a household survey by the EU that is not considered an official statistical publication,25 some apparently formal sources for other countries, and survey data from the Pew Internet and American Life Project for the U.S. (Wallsten 2009 note 4). There exists, however, a report from the Census Bureau’s Current Population Survey data,26 as well as official European statistics from Eurostat for that period.27 The author gives no reason to prefer the Pew data to that collected by the Census Bureau, which he had used in an earlier, May 2008 version of this paper. (Wallsten 2008, footnote 8). Pew reported for December 2007 54% household penetration. The Census Bureau reported 50.8%.28 Relying on the E-Communications Household Survey, Wallsten (2009) describes the UK as having 47% household penetration and Belgium at 51% in 2007. This publication explicitly disclaims being an official source. The official Eurostat numbers in fact reported the UK as having had 57% penetration in 2007 and Belgium 56% for that year. The OECD household rankings for 2007 used the official source in each case, and its numbers comport with the original in each case. Together, these various effects combine to explain why in the OECD report from official sources for household penetration in 2007, the last year for which there are official numbers from the U.S., places the U.S. in 15th place, not “between 8th and 10th.” Except where it is unavoidable, we are not convinced that combining disparate sources of survey data and techniques is a defensible practice if one wishes to develop a measure that is consistent and comparable across countries and time. Combining data sources has the potential to introduce substantial error as a result of methodological differences in survey data collection. The better practice is to rely on formal statistics, reported through
23 One occasionally sees efforts to state household penetration numbers based on taking all subscriptions and dividing them
by number of households, instead of by number of inhabitants. This includes businesses in the numerator, but divides by households, which overstates household penetration in countries with relatively high business use (a larger numerator) and large households (a smaller denominator).
24 Scott Wallsten. Understanding International Broadband Comparisons. 2009 Update. Technology Policy Institute, June 2009.
25 Special Eurobarometer: E-Communications Household Survey, June 2008 (reporting Fieldwork from November-December 2007.)
26 Networked Nation: Broadband in America. 2008. citing U.S. Census Bureau’s Internet Use Supplement to the October 2007 Current Population Survey. The original Census data is Table 1119: Household Internet Usage, by Type of Internet Connection and State: 2007. available at: http://www.census.gov/compendia/statab/2010/tables/10s1119.xls.
27 Eurostat, Information Society Indicators, Households which have broadband access. Available at: http://epp.eurostat.ec.europa.eu/portal/page/portal/information_society/data/main_tables.
28 The location of the U.S. on Figure 1 in Wallsten 2009 appears consistent with his using the Pew value of 54%, for the US, ahead of Luxembourg, with 53%, which is ahead of Belgium 51%, and so forth.

Next Generation Connectivity
42
standardized channels and national statistical agencies to the OECD, that provide greater comparability and consistency for policy makers over time, as is common for other baseline economic measures.
Another critique of the quality of per capita penetration data is that it comes through doubly distorting self-reporting. First, companies report to their national regulators, which national regulators then report to the OECD. The concern raised is that these numbers therefore cannot be taken seriously, in part because some countries are less reliable in their data collection than others, and may try to “look good” in the international rankings, and in part because companies may misreport to their regulators. However, the congruence of the three separate measures of per capita penetration—OECD, ITU, and TeleGeography—moderates concerns over the imperfections inherent in communications between a company and its regulator, on the one hand, and a country and the multilateral organization of which it is a member, on the other. The correlation with household data is another signal that this critique is unlikely correct, because household penetration is based on household survey data, not on company reporting, and is reported by national statistics agencies, not by telecommunications regulators. Its high correlation with a measure of penetration that does depend on company reporting increases our confidence in the quality of at least the first prong of the double distortion: the company data as reported by the countries to the OECD.
Another critique is that the OECD per capita measures undercount American broadband penetration because it does not count use at work in the numerator of the broadband per 100 metric. Given the relatively higher investment levels in information technology in the business sector in the United States, this is a plausible concern. First, however, it is important to remember that capturing a portion of business use is an advantage of the per 100 inhabitants measure over the per household measure, because only the former includes at least those businesses, particularly small and medium enterprises, whose Internet access is likely counted in the carrier reports on broadband subscriptions. Second, much of the U.S. business investments in ICT are not in simple high speed Internet connectivity, but in business software and equipment. While data on U.S. business usage is weak, the OECD does collect and publish survey data from various national sources on broadband penetration among businesses.29 Unsurprisingly, in the global networked economy, 99% of businesses with over 250 employees in almost all OECD economies have broadband connections. This number drops off to about 98% for mid-sized businesses, and only then, for businesses with between 10-49 employees, do significant differences emerge. Among the higher performers in general broadband penetration, some indeed do have relatively low broadband penetration for small businesses: Canada (93.7%), the UK (92.1%), and Sweden (94.1%). The rest of the countries that have high penetration per 100 inhabitants also have penetration rates above 95% even in these smaller businesses. These are the only countries where it is possible that undercounting of business use would result in a substantial decline in their rankings relative to the US. Given the very high level of penetration in Sweden, if there is likely an effect on the meaning of penetration it is that Canada and UK may look slightly worse on penetration than by the standard measure.
Conceptually, however, it is not at all clear that use at work is a confounding factor. In order for use at work to be a critique of the U.S. position in the rankings, one would have to assume that broadband use at work is a substitute for home access, rather than a complement to it. That is, one would have to assume that people who access high speed Internet at home do so instead of getting broadband at home, rather than to assume that people who have high speed access to the Internet at work learn about what they can do when they are connected, and then subscribe at home, or simply live in a society where, increasingly, living without a connection is a burden. Indeed, the paper that made the most extravagant claim, that the OECD data undercounts US connections by 70 million, makes that assumption in
29 http://www.oecd.org/dataoecd/20/62/39574066.xls.

International comparisons
43
claiming that the true number of Internet connections (the numerator in the per 100 metric) is 72 million connections larger than the FCC reports, counting every single work connection, while at the same time acknowledging, in a footnote, that only 14% of people who were not interested in having a home Internet connection cited work-based access as the reason.30 Assuming even that every one of these was a true and complete statement of the reasons for non-subscription (a doubtful proposition given the limitations of self-awareness and the risk of framing in survey questions), the overwhelming majority of people who connect at work also connect at home, and there is no undercounting. Consistent with this proposition, European survey data suggests that within Europe at least, higher household broadband penetration is well correlated with higher individual use at work. See Figure 3.8. While this shows no causality, it is certainly consistent with the intuition that access at work would complement demand for access at home, rather than substitute for it.
Figure 3.8. Internet use at work and broadband penetration.
0%
20%
40%
60%
0 30 60 90
Percent of households with broadband access
Pe
rcen
t o
f in
div
idua
ls w
ho
use
In
tern
et a
t w
ork
Source: Berkman Center analysis of Eurostat data
R2 = 0.72
BE
DK
DE
GR
FR
CY MT
AT
PT
SI
SK
FISE
GB
ISNO
CZEEIE
ES
IT LV
LT
LU
HU
NL
PL
0%
20%
40%
60%
0 30 60 90
Percent of households with broadband access
Pe
rcen
t o
f in
div
idua
ls w
ho
use
In
tern
et a
t w
ork
Source: Berkman Center analysis of Eurostat data
R2 = 0.72
BE
DK
DE
GR
FR
CY MT
AT
PT
SI
SK
FISE
GB
ISNO
CZEEIE
ES
IT LV
LT
LU
HU
NL
PL
BE
DK
DE
GR
FR
CY MT
AT
PT
SI
SK
FISE
GB
ISNO
CZEEIE
ES
IT LV
LT
LU
HU
NL
PL
The preponderance of available data indicates that the U.S. international position in fixed broadband connectivity has fallen over the past half decade. This is backed up by multiple sources of data and supported by both household penetration rates and per capita measures. The most important remaining question is why.
This question of “why” underlies one more common critique of the OECD penetration rankings and other similar measures. The argument is that much of the difference in broadband diffusion is a function of many factors unrelated to particular regulatory policies that promote or inhibit competition in broadband markets. This type of critique is directed not at the accuracy of the penetration rankings, but at their pertinence to policy. Before turning to addressing this claim, it is important to emphasize that the benchmarking exercise is not intended to provide causal explanations. While it is entirely reasonable to debate the causal sources of differences in outcomes among countries, a subject we turn to in Parts 4-6
30 Scott Wallsten, Understanding International Broadband Comparisons. Technology Policy Institute. May 2008. Page 8,
footnote 4.

Next Generation Connectivity
44
of this report, it is important to keep the data collection separate from the interpretation. Benchmarks that try to generate hypotheses and identify causal factors as part of the measurement process itself risk obscuring the straight, objective outcome measures.
Many factors influence the rate of adoption and ultimate reach of broadband connectivity in different countries.31 These factors are likely to include geographic factors that affect costs, such as population density and terrain, variables that influence consumer demand, such as income, education, employment and individual preferences, and market factors, such as the composition and level of competition in the telecommunications sector. Broadband policy can in principal play an important role in shaping the influence of these factors. This might be manifest through programs and policies that promote demand, such as skills training. Public financing of infrastructure will have an impact on the incremental cost of construction for industry, and the level of competition can be affected by the presence or absence of policy and regulation aimed at facilitating competition, and its particular contours.
A conceptually sound argument based on the realization of the role of many factors in determining broadband penetration is that, when considering how to best promote greater broadband availability and adoption, we should be mindful of the distinction between the policy and non-policy determinants of broadband performance.32 At the crux of this argument is that without properly accounting for the influence of non-policy factors in broadband performance, one might draw false conclusions about the efficacy of different broadband policies. A more shaky extension of this basic sound insight is that these factors explain so much of the overall performance of a country that policy plays no appreciable role. Several responses to the earlier draft of this study, for example, argued that the benchmarks provide no insight because the United States’ performance on penetration is well-predicted by a variety of measures that are known to influence penetration, such as urban density, income, and education. Various versions of this argument can be found in several studies, although the details vary considerably from study to study.33 The crux is that the U.S. “meets expectations:” that our penetration level is well predicted by our “natural endowment” and that policy need not seek to improve on this. There are several problems with this more ambitious claim on behalf of the non-policy factors.
First, these studies suffer from all the limitations that we observe in the cross country quantitative analyses of broadband performance, described in Part 4 below in detail, both in terms of data and methodology. These limitations make the results of these studies highly sensitive to model specification and to the choice of explanatory variables, and require that they be read with caution. Second, given that there are countries that consistently perform “above expectations” in these models, and these are mostly the countries that are usually found at the top of the distribution on the raw benchmarks, the question remains: what can policy makers do to enable the U.S. to join the class of over-performers, rather than being content with the “meets expectations” group. Third, as we noted, none of these studies pretend to show that they explain all of the variation in broadband penetration rates; studies that intend to capture the determinants of broadband adoption have explained as much as 75% to 85% of the variation in penetration level with non-policy variables).34 For purposes of investing significant effort in getting the policy right, it is unnecessary to show that policy is primarily responsible for a country's
31 There is substantial overlap and coverage of this question in the literature we review in Part 4 of this report on open
access and broadband penetration or investment, but we have not included here a full literature review of this aspect of the critique here.
32 Robert D. Atkinson, Daniel K. Correa and Julie A. Hedlund. Explaining International Broadband Leadership. May 2008. The Information Technology and Innovation Foundation.
33 See for example, Atkinson et al. cited in footnote 31 and Ford et al. cited in footnote 21. See also Robert W. Crandall and J. Gregory Sidak. Is Mandatory Unbundling the Key to Increasing Broadband Penetration in Mexico? A Survey of International Evidence. June 2007. Available at: http://papers.ssrn.com/sol3/papers.cfm?abstract_id=996065
34 See examples cited in footnote 32.

International comparisons
45
performance; it is sufficient to show that a policy can contribute positively and appreciably, at the margin, to a country's performance relative to that country's performance without that policy. For example, imagine a policy intervention whose effect is to add only 1% to penetration rates annually over the course of a decade. Looked at from the perspective of a single year, the effect may seem insubstantial. Over the course of a decade, however, it would mean that a country will have 10% higher penetration than it would have had without the policy. If we accept the World Bank analysis that 10 points in penetration per 100 translates into 1.21% GDP growth, that becomes a very important effect indeed for any given single policy intervention. Even if the effect of policy were half that amount, the effects would constitute an important policy goal with high payoff. Needless to say, we do not attempt to measure the total contribution of a given policy or practice we describe here. We simply note that even very small positive contributions from policy can have a significant medium to long-term impact. Policy matters.
A slightly different version of this argument posits that an under-studied and poorly-understood set of demand-side variables (variation which is not otherwise captured by income or income inequality) are responsible in part for U.S. broadband penetration rates.35 The argument seems to be based on the premise that U.S. residents are generally less interested in the Internet than residents of higher performing countries in a way that is not impacted by policy. While personal preferences surely do play a role in adoption choices, and demand-side factors are in need of further study, this theory is difficult to assess. Given our own findings on the differences in speeds and prices, described below, and the obvious relationship between levels of competition and price, a less forced interpretation would be that demand is influenced by price and quality. People buy less of a low quality, high-priced good than they would buy of a higher quality good at lower prices. Better products at more affordable prices are precisely what competition is normally thought to provide. Middling speeds (quality) attached to middling or high prices would, without too much searching for mysterious, unobserved demand characteristics, lead one to predict the observed middling rates of adoption in the United States. And limited competition would lead one to predict lower quality, higher prices, and lower demand. Until that most natural hypothesis is eliminated, it seems forced to look for an answer in other, unobserved demand factors.
We therefore believe that future benchmarking exercises should always include speed and price measurements, as well as penetration, and we indeed use them here to complete our benchmarking exercise. First, however, we combine our extended penetration benchmarking exercise with a response to the last common critique of penetration measures: the claim that U.S. penetration numbers would look better if wireless penetration were included in the measure.
3.4 Penetration: Mobile and nomadic broadband
Understanding the future of the networked information environment as involving ubiquitous, seamless connectivity suggests that mobile and nomadic broadband are important independent measures of next generation transition performance. Even countries that follow capacity-oriented definitions treat mobile broadband, or ubiquitous connectivity, or Internet everywhere, as integral parts of their national plans. A critical component of ubiquity will be wireless access.
Wireless mobile connectivity for most people is experienced primarily and initially through devices that have evolved from what originally were mobile phones. However, providing a full picture of the next generation transition to ubiquity requires observations of both the trajectory from mobile telephony to mobile broadband, and the trajectory from local area network extension for laptops, to nomadic connectivity through whatever will develop from Wi-Fi hotspots. The need to consider mobile 35 Wallsten (2009) cited in footnote 23.

Next Generation Connectivity
46
penetration was initially raised in the American context as a critique of the OECD penetration metrics. The argument was that the United States would rank higher if we accounted for wireless connectivity of both sorts instead of purely for fixed connection. Upon examination, that argument proves to be false. On mobile broadband the United States is a weak performer. On nomadic connectivity we do better, but are not a particularly high performer. Nonetheless, our purpose here is not to test the competence and pertinence of measures of fixed broadband penetration, but to supplement that data with measures that would allow us to identify those countries that are particularly high performers in mobile and nomadic connectivity.
3.4.1 Mobile broadband: From phones to data
A commitment to understanding ubiquitous, seamless access as an integral part of next generation connectivity requires that we provide independent measures of mobile broadband penetration. In the longer term, it requires that we measure and monitor a set of metrics for mobile broadband similar to those we describe in the remainder of the chapter for broadband generally. Current OECD reporting on 3G subscriptions is wanting, as we explain below. We therefore report here on the results of our analysis of independent market data regarding 3G subscriptions.36 We found that the United States ranks 19th among OECD members in 3G subscriptions per 100 inhabitants (Figure 3.9). Note that, given personal usage patterns, subscriptions measured as a proportion of population, rather than households, is the only appropriate measure for mobile communications penetration. When measured by percentage increase in subscriptions, U.S. growth of 3G subscriptions in was robust between the first quarter of 2008 and the first quarter of 2009, and indeed was the 10th highest in the OECD (Figure 3.10). However, this measure overstates the speed with which the laggards are catching up to the leaders, because it compares growth relative to very different bases. A better measure of the degree to which current low performers are catching up is a measure of number of new subscriptions per 100 inhabitants. Mexico offers an extreme example of the distortion of looking at growth as percent of penetration as opposed to growth as a function of new subscriptions per 100 inhabitants. Because its base is so low, Mexico shows the highest growth rate by the percent increase measure. Because it has in fact added very few new subscribers relative to the size of its population, Mexico is 27th of 30 OECD countries in rate of growth by the measure of new subscriptions per 100. (Figure 3.11.) By this better measure, the U.S. is 16th in the OECD for 3G growth.
36 We use the TeleGeography, GlobalComms database.

International comparisons
47
Figure 3.9. 3G penetration.
0
20
40
60
80Ja
pa
n
So
uth
Ko
rea
Au
stra
lia
Ice
lan
d
Italy
Sw
ed
en
Sp
ain
Fin
lan
d
Lu
xem
bo
urg
Un
ite
d
Ne
w Z
ea
lan
d
Au
str
ia
Ge
rma
ny
Fra
nce
Sw
itze
rla
nd
Slo
vakia
No
rwa
y
De
nm
ark
Un
ited
Sta
tes
Be
lgiu
m
Gre
ece
Ire
lan
d
Po
rtu
ga
l
Cze
ch
Ne
the
rla
nd
s
Ca
na
da
Hu
ng
ary
Po
lan
d
Me
xic
o
Source: TeleGeography
3G
subscrib
ers
pe
r 10
0 in
habita
nts
Un
ited
Sta
tes
Cze
ch
Re
pu
blic
Slo
vak
Rep
ublic
Un
ite
d K
ing
dom
Figure 3.10. Annual growth in 3G penetration
0%
200%
400%
600%
Me
xic
o
Ice
lan
dC
zech
Re
pu
blic
Be
lgiu
m
Fin
lan
dC
an
ad
a
Ne
the
rla
nd
sH
un
ga
ry
Slo
vak R
ep
ub
lic
Un
ited
Sta
tes
Po
lan
d
Gre
ece
Sw
itze
rla
nd
Ire
lan
dS
we
de
nA
ust
ralia
Un
ited
Kin
gd
om
Lu
xem
bo
urg
Sp
ain
De
nm
ark
Ge
rma
ny
Ne
w Z
ea
lan
dF
ran
ce
Au
str
iaN
orw
ay
Po
rtu
ga
lS
ou
th K
ore
aIta
ly
Ja
pa
n
Source: TeleGeography
Gro
wth
in
3G
sub
scri
be
rs p
er
10
0 in
ha
bita
nts
Un
ite
d S
tate
s
Japan and South Korea are the highest performers, each with over 3 times as many 3G subscribers per 100 inhabitants as the United States, and both are still adding more subscribers per 100 inhabitants than is the U.S. Three countries substantially outperform in 3G penetration their level of fixed penetration: Australia, Italy, and Spain; while the Netherlands, Denmark, Norway and Switzerland seem to underperform their high fixed broadband performance.

Next Generation Connectivity
48
Figure 3.11. Annual increase in 3G penetration
0
10
20
30
40Ic
ela
nd
Fin
lan
d
Au
stra
lia
Sw
ed
en
Sp
ain
Be
lgiu
m
So
uth
Ko
rea
Lu
xem
bo
urg
Un
ited
Kin
gd
om
Slo
vak R
ep
ub
lic
Ne
w Z
ea
lan
d
Ja
pa
n
Sw
itze
rla
nd
Ge
rma
ny
Au
str
ia
Un
ited
Sta
tes
Fra
nce
De
nm
ark
Italy
Cze
ch
Re
pu
blic
Gre
ece
No
rwa
y
Ne
the
rla
nd
s
Ire
lan
d
Ca
na
da
Hu
ng
ary
Me
xic
o
Po
rtu
ga
l
Po
lan
d
Source: TeleGeography
Incre
ase
in 3
G s
ub
scrib
ers
pe
r 1
00
inha
bita
nts
Un
ite
d S
tate
s
The OECD's reports subscriptions to mobile phones generally, and its effort to separate out 3G subscriptions seem to miss a lot. In mobile telephony subscriptions generally, the United States is 26th among the OECD 30 (Figure 3.1237). This position seems to skew strongly against countries with low levels of pre-paid card use: the United States (26th, 17% use pre-paid), Japan (28th, 2% pre-paid) and South Korea (24th, 2%). By contrast, countries with the highest numbers of mobile cellular subscribers per 100 inhabitants have much higher levels of pre-paid usage38: Italy (1st, 89%), Greece (2d, 71%), and Luxembourg (3d, 92%). These countries all have levels of penetration above 140%, reflecting the measurement difficulty posed by counting multiple accounts held by single subscribers in a pre-paid system. More importantly, these aggregate numbers by themselves do not reveal how much of the usage is for voice communications, and how much for data; and within data, how much is really mobile broadband as opposed to simpler, 2G-supportable applications.
The OECD in its 2009 Communications Outlooks, tried to separate out 3G from 2G subscriptions.39 2G and what is sometimes called 2.5G are the second generation phones, capable of slower data speeds, which have been available in the United States for a while, and supported personal communications devices like Blackberry and iPhone until relatively recently. 3G networks have been rolled out by Verizon, AT&T, Sprint, and T-Mobile, but are still currently focused in urban areas. Looking purely at the 3G levels of subscription as reported by the OECD, the United States would not rank in the top 20, and this is also the case, in that report, for otherwise high performing countries like Norway, France, Belgium, Luxembourg and Canada. Upon examination, it appears that the OECD representation for 3G penetration reflects many missing values. Looking at a much smaller set of countries examined in 2008 by Britain's Ofcom,40 which looked only at an ambiguous measure of “availability” (not actual subscriptions), the United States seems to have roughly similar levels of mobile broadband networks to
37 Figure 4.7 from the OECD Communications Outlook 2007, http://dx.doi.org/10.1787/620604300202). 38 OECD Communications Outlook 2009, Table 4.14. 39 Fig. 4.7 and Table 4.12. 40 Ofcom, The International Communications Market 2008 (20 November 2008).

International comparisons
49
the other countries surveyed there. In this report, Japan (100%) and the UK (92%) had higher potential coverage for 3G, but other countries were more closely bunched together. The Ofcom numbers certainly suggest that the numbers reported by the OECD for 3G in particular are too low across many of the countries. It is not clear, however, what “availability” means in this report, and whether it is calculated based on availability where the stated percent of the population resides, or works, or exists during some proportion of the day. As a result, we have more confidence in the data we presented above than we do in the OECD measure, and believe it to be more pertinent than the Ofcom availability measure, because we focus on subscriptions rather than areas of potential coverage. Future efforts to incorporate measurements of mobile broadband should include a broader set of market data sources, and emphasize validation from independent diverse sources.
Figure 3.12. Cellular mobile penetration: 2G & 3G in OECD report
0
40
80
120
160
Ita
lyG
ree
ce
Lu
xe
mb
ou
rgC
ze
ch
Po
rtu
ga
l
Un
ite
dA
ust
ria
Ge
rma
ny
Fin
lan
dD
en
ma
rkIr
ela
nd
Sw
ed
en
Ne
the
rla
nd
sS
lova
kN
orw
ay
Hu
ng
ary
Sw
itze
rla
nd
Po
lan
d
Sp
ain
Ice
lan
dN
ew
Ze
ala
nd
Au
stra
lia
Be
lgiu
mS
ou
th K
ore
aF
ran
ce
Un
ite
dT
urk
ey
Jap
an
Me
xic
oC
an
ad
a
Source: OECD, 2007
Cellu
lar
mo
bile
sub
scri
be
rs p
er
10
0 in
ha
bita
nts
Un
ite
d S
tate
s
Slo
va
k R
ep
ublic
Cze
ch
Re
pu
blic
Unite
d K
ing
dom
3.4.2 Nomadic access: From Wi-Fi to ubiquity
If 3G is the evolutionary trajectory from the mobile phone, the alternative pathway to ubiquitous connectivity evolves from the wireless home network. Americans mostly know hotspots in airports, hotels, or cafes. Other emerging models include models like FoN, a company that allows users to register as members of a “club” of users who exchange free access to their Wi-Fi spots: every member can access the Internet nomadically when they are near any other member, and non-members can buy access when they are within reach of a member's connection. This model has recently been extended by several European companies to be integrated with fixed broadband subscriptions. Iliad/Free, in France, allows every Free subscriber (about 24% of the entire French broadband market) to connect nomadically through the service box of every other Free subscriber, as well as make free phone calls from any Wi-Fi enabled mobile phone. French mobile competitor SFR has a similar arrangement, and allows its subscribers to interconnect with FoN subscribers as well. In Sweden, both Telenor and TeliaSonera bundle their mobile broadband subscriptions with access to a large network of hotspots that each company operates, and in Telenor's case, to hotspots operated throughout Europe by pan-European hotspot provider The Cloud. We discuss these and other service innovations that form a part of the

Next Generation Connectivity
50
fixed-mobile convergence pattern in Parts 4 and 5. For now, we simply note that the European experience is pointing to the conclusion that Wi-Fi nomadic access is beginning to provide a trajectory toward complementing mobile broadband networks for ubiquitous access.
We found no authoritative source of information for Wi-Fi hotspots. This is an area that requires greater effort at measurement and reporting. Two separate, older reports, one from the OECD based on information from Informa (Figure 3.13),41 and the second from Ofcom based on IDATE and its own data collection (Figure 3.14),42 have sufficiently similar values for 2006 that one can be reasonably confident that the estimates are acceptable for that period. Judging by these numbers and their congruence, the United States is 7th out of the 10 countries identified, in terms of hotspots per 100,000 population. Of particular interest in these reports is the enormous jump in number of Wi-Fi hotspots in France within one year, which Ofcom interprets to partly reflect 400 public Wi-Fi deployments in Paris in the summer of 2007, on a more traditional model, and partly reflecting the very early returns from the Free strategy. One should note that 400 public hotspots translate into an increase of 0.4 hotspots per 100,000, implying that if these were indeed the two primary sources of increase, the Free strategy would account for practically the entire doubling effect.
Figure 3.13. Public wireless hotspots, OECD
0
10
20
30
Ita
ly
Sp
ain
Jap
an
Un
ite
d S
tate
s
Sw
ed
en
Ge
rma
ny
Ne
the
rla
nd
s
Fra
nce
Un
ite
d
Kin
gd
om
Ire
lan
d
Source: OECD based on Informa telecoms and media
Pu
blic
wir
ele
ss h
ots
pots
pe
r 10
0,0
00
pe
ople
, Q
40
6
Un
ite
d S
tate
s
0
10
20
30
Ita
ly
Sp
ain
Jap
an
Un
ite
d S
tate
s
Sw
ed
en
Ge
rma
ny
Ne
the
rla
nd
s
Fra
nce
Un
ite
d
Kin
gd
om
Ire
lan
d
Source: OECD based on Informa telecoms and media
Pu
blic
wir
ele
ss h
ots
pots
pe
r 10
0,0
00
pe
ople
, Q
40
6
Un
ite
d S
tate
s
41 See OECD, Broadband Growth and Policies in OECD Countries (2008). Fig. 2.4, p. 89. 42 Ofcom, The International Communications Market 2008 (20 November 2008). Fig 5.67, p. 242.

International comparisons
51
Figure 3.14. Public wireless hotspots, Ofcom
0
10
20
30
40
Fra
nce
Ire
lan
d
Un
ite
d
Kin
gd
om
Ge
rma
ny
Ne
the
rla
nd
s
Sw
ed
en
Un
ite
d S
tate
s
Sp
ain
Source: Ofcom International Markets Report, 2008
Ho
tspo
ts p
er
10
0,0
00 p
eo
ple
Un
ite
d S
tate
s
2006
2007
0
10
20
30
40
Fra
nce
Ire
lan
d
Un
ite
d
Kin
gd
om
Ge
rma
ny
Ne
the
rla
nd
s
Sw
ed
en
Un
ite
d S
tate
s
Sp
ain
Source: Ofcom International Markets Report, 2008
Ho
tspo
ts p
er
10
0,0
00 p
eo
ple
Un
ite
d S
tate
s
2006
2007
2006
2007
Because the data underlying these reports are old, and the changes clearly very rapid, we sought to identify a separate source of information to supplement and update these other sources. Our study uses information from marketing firm Jiwire, which collects lists of Wi-Fi hotspots and makes them available to the public for search as part of its business of selling advertising linked to connection through hotspots. Because there is no full inventory of hotspots, we take these data with caution. The major incongruities that these data present from the older sources of data are for Japan, which Jiwire data seems to severely undercount, unless Wi-Fi hotspots available two years ago in Japan have been dismantled, and Switzerland and Sweden, which have dramatically higher levels of availability per 100,000 population in the data we used for 2009 relative to the data Ofcom and the OECD used for 2006 and 2007. We gain some confidence in our findings, however, from qualitative review of the Wi-Fi market developments in Sweden and Switzerland. In Sweden, Telenor expanded nomadic access through its acquired subsidiary, Glocalnet, and contracted with The Cloud to build 800 hotspots, while incumbent TeliaSonera responded to this challenge by investing in more Wi-Fi hotspots. Its strategy was announced in mid-2007. In February of 2008 TeliaSonera announced an aim to double the number of hotspots in Sweden. It began to deploy hotspots in locations operated by the Svenska Spel gaming company. It now accounts for about a third of hotspots in Sweden and bundles unlimited access to its Surfzone Wi-Fi hotspots with its mobile broadband subscriptions. In Switzerland, Swisscom itself is a pan-European hotspot provider (Swisscom Eurospot), and since 2008 launched a collaboration with the Swiss railway system to offer Wi-Fi access in train stations and on trains. There was also a substantial push to deploy Wi-Fi hotspots during the European soccer championship in the summer of 2008, undertaken by a range of players: Swisscom itself, independent hotspot provider Trustive, and various municipal efforts, most successfully in Berne. We therefore think that with appropriate caution, the figures we report in Figure 3.15 are likely representative of available nomadic access in the covered countries. Data on this important development trajectory for ubiquitous access is otherwise limited, uncertain, and dated.

Next Generation Connectivity
52
Figure 3.15. Public wireless hotspots
0
20
40
60
80S
we
de
n
Sw
itze
rla
nd
Un
ite
d K
ing
do
m
Fra
nce
Ire
lan
d
Po
rtu
ga
lS
ou
th K
ore
a
Be
lgiu
m
Un
ite
d S
tate
sD
en
ma
rk
Ne
w Z
ea
lan
dL
uxe
mb
ou
rg
Ne
the
rla
nd
sG
erm
an
y
Fin
lan
dS
pa
in
Au
str
alia
Au
str
ia
No
rwa
yC
an
ad
a
Italy
Gre
ece
Cze
ch R
ep
ub
lic
Hu
ng
ary
Slo
va
k R
ep
ub
lic
Me
xico
Ice
lan
d
Po
lan
dJa
pa
n
Tu
rke
y
Source: Jiwire data
Pu
blic
ho
tsp
ots
pe
r 1
00
,00
0 p
eo
ple
, fr
ee
an
d p
aid
access
Un
ite
d S
tate
s
3.4.3 Conclusion
In looking at measures of penetration: household penetration, to emphasize the importance of home access to policy; per 100 inhabitants, to capture some small and medium enterprise use; mobile, and to some extent nomadic access, we can begin to identify a set of models for observation and learning. South Korea is a leading performer across all measures: leading household penetration, second on 3G, in the top quintile for per 100 inhabitants, and 7th for Wi-Fi Hotspots. Japan leads in 3G and is a top quintile performer for household penetration, but has lower results on per 100 inhabitants, and very low results on hotspots. We have some concerns about our data for Japan, however, because 3G and household penetration have some overlap, and the hotspot data is inconsistent with prior studies in ways for which we cannot account. The Nordic countries are all very strong performers, with Sweden in the first or second quintiles across the board, while Denmark and Norway show some weakness on 3G, and Finland, Norway, and Iceland show weakness in nomadic access. Switzerland has first quintile performance on the per 100 inhabitants measure and the nomadic access measure, but third quintile performance on 3G and second quintile for per household penetration. The Netherlands and Canada both do well on the fixed-broadband penetration front, but are substantially weaker on 3G; while Italy and Spain exhibit the inverse profile. Of the larger European countries, the United Kingdom is the steadiest performer on penetration, showing up in the second quintile in all measures except nomadic access, for which it is in the first quintile. France and Germany are solidly in the third quintile across the board, except for France's stellar performance on nomadic access. The United States is a third quintile performer for fixed penetration by both measures, a fourth quintile performer for 3G, and a second quintile performer in nomadic access. As we will see in the practices and policies chapters, these measures suggest a focus on South Korea and Japan, on the Nordic countries, on the United Kingdom among the larger European countries, and on the Netherlands and Canada for fixed, positively, and for 3G, negatively, and vice versa for Italy and Spain.

International comparisons
53
Table 3.3 provides an at-a-glance report of these various measures, providing both the actual rank and, through shading, the quintile it represents: from dark green for first quintile to dark red for fifth quintile. The ranking reflects a weighted aggregate quintile performance measure, reflecting an emphasis on fixed (60%) over mobile (40%), per-households (35%) over per 100 inhabitants (25%), and 3G (30%) over Wi-Fi (10%).
Table 3.3. Country rankings on various penetration measures.
Country
Penetration per 100, OECD
Household penetration,
OECD
3G penetration,
TeleGeography
Wi-Fi hotspots
per 100000, Jiwire
Weighted average ranking
1 South Korea 6 1 2 7 3.15
2 Sweden 7 6 6 1 5.75
3 Iceland 5 2 4 27 5.85
4 Denmark 1 4 18 10 8.05
5 Switzerland 4 8 15 2 8.5
6 Finland 8 9 8 15 9.05
7 Norway 3 5 17 19 9.5
8 Luxembourg 9 10 9 12 9.65
9 United Kingdom 11 11 10 3 9.9
10 Netherlands 2 3 25 13 10.35
11 Australia 16 13 3 17 11.15
12 Japan 17 14 1 29 12.35
13 Belgium 12 12 20 8 14
14 France 13 18 14 4 14.15
15 Germany 14 16 13 14 14.4
16 Canada 10 7 26 20 14.75
17 Spain 20 19 7 16 15.35
18 United States 15 15 19 9 15.6
19 New Zealand 18 20 11 11 15.9
20 Austria 19 17 12 18 16.1
21 Italy 22 27 5 21 18.55
22 Ireland 21 22 22 5 20.05
23 Portugal 25 23 23 6 21.8
24 Slovak Republic 27 26 16 25 23.15
25 Hungary 24 21 27 24 23.85
26 Czech Republic 23 25 24 23 24
27 Greece 26 28 21 22 24.8
28 Poland 28 24 28 28 26.6
29 Mexico 30 29 29 26 28.95
30 Turkey 29 30 30 30 29.75

Next Generation Connectivity
54
3.5 Capacity: Speed, fiber deployment, and emerging new actual measurements
The second quantity of interest in “broadband” is capacity: what is the capacity of the network that is being delivered to however many households or individuals in the population? The OECD still defines the threshold for broadband as any technology capable of delivering Internet connectivity at a speed of 256k download or better.43 The ITU uses the same measure.44 For purposes of its own data gathering purposes under Form 477, the FCC early defined “high speed” connectivity as Internet connectivity with speeds of at least 200kbps in at least one direction—effectively, downloading, given the service assumptions of providers about what users use their connections for—and as “advanced services” speeds of at least 200kbps in both directions. In the past five years, the Commission has also required carriers to report what percent of their lines provide between 200 kbps and 2.5 Mbps; 2.5Mbps and 10Mbps; 10-25, 25-100, and over 100Mbps. The Commission first reported using these more fine-grained data in its Fifth Report. While the more fine-grained data is important, conceptually, the FCC is collecting the same data as the data relied on by the OECD: peak download rates provided to the end user.
Two things must be noted in discussing capacity benchmarks. First, benchmarking capacity alone ignores the attribute of ubiquitous seamless connectivity. Second, using speed alone to measure the performance of a country's or region's network understates another major component of the definition of capacity: latency.45 Latency is the degree to which a packet of data is likely to be delayed in arriving at its destination. It is irrelevant in some applications, like email or even when downloading a large file for later use. Other applications, like voice over IP (VoIP), require relatively little bandwidth, but are highly sensitive to latency—if we have to wait for a second between when we are done speaking and the other party hears what we said, the conversation falters. Most current benchmarks ignore latency. Moreover, because companies do not report latency, this measure is only available from actual measurements data, which still presents substantial difficulties for data cleaning and analysis. Following efforts by the Oxford Saïd Business School and the University of Oviedo, funded by Cisco Systems, we provide here analysis of actual measurements that do identify latency as one of their reported characteristics. We note, however, that the measurements for latency deviate substantially from other measures, including actual measurements of upload and download speeds from the same test platform, in ways that are difficult to interpret. We therefore report latency measures separately, without bundling them like the Oxford/Oviedo study, and we do so with great caution about the extent to which it is appropriate to use currently available measures to reflect actual user experience. Substantially more work needs to be done to validate and interpret actual latency measurements before they can provide a well-understood benchmark.
Despite its limitations, speed, usually stated in terms of theoretical or advertised download speed, sometimes upload, has been the basis of measurement in the past decade and it is, in some countries, currently used by governments to define their own national goals—Australia (100Mbps), Austria (25Mbps), Finland, (1 Mbps by 2010, 100 Mbps by 2015), Germany (50 Mbps), Spain (30Mbps), UK (2Mbps as universal service to 90% of population, 40-50Mbps in broad use).46
43 OECD Broadband Subscriber Criteria.
http://www.oecd.org/document/46/0,3343,en_2649_34225_39575598_1_1_1_1,00.html 44 ITU IDI 2009 Annex 2, page 85. 45 Pepper presentation @ workshop on international comparisons August 18 2009.
http://www.broadband.gov/docs/ws_int_lessons/ws_int_lessons_pepper.pdf. 46 OECD Impact of the Crisis on ICTs and the Role in Recovery (2009).
http://www.oecd.org/dataoecd/33/20/43404360.pdf. (Table 3, p. 34).

International comparisons
55
Figure 3.16. Fastest speed offered by an incumbent
0
30,000
60,000
90,000
120,000
Me
xico
Tu
rke
yP
ola
nd
Ire
lan
dH
un
ga
ryU
nite
dA
ustr
iaS
pa
inIc
ela
nd
Slo
va
kL
uxe
mb
ou
rgC
an
ad
aC
ze
ch R
ep
ub
lic
Be
lgiu
mIta
lyS
witz
erl
an
dN
ew
Ze
ala
nd
Po
rtu
ga
lS
we
de
nG
ree
ceN
orw
ay
Au
str
alia
De
nm
ark
Ge
rma
ny
Un
ite
d S
tate
sN
eth
erl
an
ds
Fin
lan
dF
ran
ceJa
pa
nS
ou
th K
ore
a
Source: OECD
Fa
ste
st spe
ed o
ffe
red
by
incu
mb
en
t te
lco
(Kb
ps)
Un
ite
d S
tate
s
Slo
vak R
ep
ublic
Un
ite
d K
ing
dom
By several measures Japan currently enjoys the fastest speeds among OECD countries. This is due both to high degree of fiber penetration, which is both theoretically and practically the highest-capacity medium currently used, and on higher speeds achieved over DSL and Cable. Japan is the first country where DOCSIS 3.0 has been deployed at its fastest current speed over cable modems (160Mbps by J:COM), it has been at the cutting edge of DSL speeds, and is the first country where 1 Gbps is publicly offered over fiber, from K-Opticom and KDDI. South Korea, France, and Finland follow right behind in terms of advertised speeds, with higher advertised speeds than other countries on average, as well as higher speeds over DSL and cable plants, respectively. As we describe below, Sweden jumps ahead to join Japan and South Korea when actual measurements, rather than advertised speeds, are used. The OECD reports several measures, including maximum advertised speed by the incumbent (Figure 3.16), where the United States is ranked in the second group of countries, after the four leaders, together with the Netherlands, Germany, and Denmark. This is due to the availability of 50Mbps service over fiber by Verizon and the implementation of DOCSIS 3.0 by several of the cable carriers.
3.5.1 Advertised download speeds
The average–as opposed to top–speed of offerings advertised in the United States is relatively lower. As Figure 3.17 shows, the United States ranks 19th by this measure. Countries that appear as learning models are Japan, South Korea, France, and Finland, as well as the Netherlands. Some of the countries that have higher levels of penetration than the United States, like Sweden, Norway, or the United Kingdom, also have higher average advertised speeds. Other countries, such as Germany, Portugal, Australia, and Italy, which do not have higher penetration levels than the United States, do appear to have higher average offered download speeds. On the other hand, Switzerland, Belgium, and Canada, which have higher penetration levels than the United States, have lower average advertised speeds.

Next Generation Connectivity
56
Figure 3.17. Average advertised speed
0
20,000
40,000
60,000
80,000
100,000
Jap
an
So
uth
Ko
rea
Fra
nce
Fin
lan
dN
eth
erl
an
ds
Ge
rma
ny
Au
str
alia
De
nm
ark
Po
rtu
ga
lIc
ela
nd
Ne
w Z
ea
lan
dN
orw
ay
Sw
ed
en
Ita
lyU
nite
d K
ing
do
mC
ze
ch
Re
pu
blic
Au
stri
aL
uxe
mb
ou
rgU
nite
d S
tate
sS
pa
inS
witze
rla
nd
Be
lgiu
mG
ree
ce
Slo
vak R
ep
ub
lic
Ca
na
da
Ire
lan
dH
un
ga
ryP
ola
nd
Tu
rke
yM
exi
co
Source: OECD, 2008
Ave
rag
e a
dve
rtis
ed
do
wn
load
sp
ee
d (
Kbp
s)
Un
ite
d S
tate
s
Advertised average download speeds are a coarse measure of capacity as actually used and experienced by users. As a result, several regulators have begun to address speed advertising, in an effort to move providers to implement measurement systems and offer a clear set of expectations for users of their actual likely speed. In 2008, both Finland and the United Kingdom published standards for expressing speeds of service that seek to reflect more accurately the actual likely transmission speeds that would be available. As we will see below, however, when we discuss actual speed measurement data, average advertised speeds are highly correlated with actual speeds. Given the limitations of each approach, continued use of advertised speeds as part of the standard suite of benchmarks seems warranted.
3.5.2 Actual speed measurements
As we noted when discussing latency, the observation of differences between actual and advertised speeds leads to a set of efforts to develop measures of actual use. The three primary approaches currently in use involve carrier-based testing, user-side testing, and in the network, third-party testing. Carrier-based testing uses test equipment located at the premises of the carrier, or on identified clients in cooperation with a carrier, and is initially designed to help carriers understand their network. In the 2009 Communications Outlook, the OECD first reported actual speeds and compared them to advertised speeds. The data came from tests performed by a company called Epitiro in the United Kingdom, but apparently covered countries other than only OECD countries, and the OECD chose not to report the data by country. The primary findings reported were that (a) actual speeds are lower than advertised speeds, and (b) that different technologies underperformed their advertised speeds by different ratios. While the basic point about a persistent difference between advertised and observed prices is certainly true, the per-technology shortfall calculations vary widely by country, and the aggregate averages as measures of systematic performance characteristics of different technologies are not reliable. Our independent evaluation is that we should place little confidence in the aggregate, non-country-specific per-technology shortfall ratios reported in the OECD Communications Outlook 2009. We take no position on whether the weakness of the data is caused by shortfalls in the underlying data collection

International comparisons
57
technique, or in the way it was aggregated and reported. There is no inherent reason for the former to be the case, but we were not permitted to independently report on the underlying data.
A source of publicly available speed measurement based on third-party measurements in the network is Akamai’s State of the Internet report. We include here data from the report covering the 4th quarter of 2008, the same period for which we have OECD advertised speed data, and for which we analyzed end-user testing data using speedtest.net, as we describe below. Based on these measurements, the U.S. does better in actual speeds than advertised speeds. Nonetheless, the U.S. still ranks no better than 11th among OECD countries.
Figure 3.18. Average download speed
0
2
4
6
8
10
12
South
Kore
a
Japan
Sw
eden
Sw
itzerland
Neth
erlands
Belg
ium
Norw
ay
Denm
ark
Czech R
epublic
Icela
nd
United S
tate
s
Irela
nd
Canada
Austr
ia
Germ
any
United K
ingdom
Fin
land
Port
ugal
Fra
nce
Italy
Gre
ece
New
Zeala
nd
Spain
Austr
alia
Luxem
bourg
Mexic
o
Un
ited
Sta
tes
14
16
Source: Akamai, Q4 2008
0
2
4
6
8
10
12
South
Kore
a
Japan
Sw
eden
Sw
itzerland
Neth
erlands
Belg
ium
Norw
ay
Denm
ark
Czech R
epublic
Icela
nd
United S
tate
s
Irela
nd
Canada
Austr
ia
Germ
any
United K
ingdom
Fin
land
Port
ugal
Fra
nce
Italy
Gre
ece
New
Zeala
nd
Spain
Austr
alia
Luxem
bourg
Mexic
o
Un
ited
Sta
tes
14
16
0
2
4
6
8
10
12
South
Kore
a
Japan
Sw
eden
Sw
itzerland
Neth
erlands
Belg
ium
Norw
ay
Denm
ark
Czech R
epublic
Icela
nd
United S
tate
s
Irela
nd
Canada
Austr
ia
Germ
any
United K
ingdom
Fin
land
Port
ugal
Fra
nce
Italy
Gre
ece
New
Zeala
nd
Spain
Austr
alia
Luxem
bourg
Mexic
o
Un
ited
Sta
tes
14
16
Source: Akamai, Q4 2008
The major alternative source of actual measurements is distributed measurement on the user side. The idea is that users test their own speeds, and in the aggregate these provide millions of observations about actual downloading and uploading, as experienced by end users. The current most extensive dataset we have found implementing this approach is run mostly using Speedtest, a testing site developed by Ookla, a Montana company. The company provided the Berkman Center access to its global testing data from the fourth quarter of 2008, which is the equivalent period to the period described by the OECD 2009 report. We report here the results of our analyses of the Speedtest.net data.
Speedtest data is not perfect, but it offers an enormous database of actual tests, which provide insight into the speeds users experience on their computers. The dataset we analyzed included about 41 million actual tests from the OECD countries, from the fourth quarter of 2008. These provide the time of day, the ISP, the geographic location of the client and the server, measures of upload and download speeds and latency, as measured from the perspective of an application running on the end user's computer.

Next Generation Connectivity
58
Several confounding factors require that we interpret the data with caution. For example, users may be running a test through a wired connection or a wireless local area network; they may be plugged in directly to a modem or through a switch; or they may be running other bandwidth-hungry applications in the background. Users may be self-selecting because they have high speeds they want to test, and so the results may all be upwardly biased. Users who know enough to measure their bandwidth probably are above-average in their Internet skills, and again upwardly bias actual tests. All of these factors may pollute the results. Despite these limitations, the advantages of the Speedtest data include the size of the sample, the time over which it has been collected, the richness of the geographic specificity of the client and server location, and the addition of latency to upload and download speeds (although, as we mentioned, the latency data in particular is difficult to interpret). Moreover, the Speedtest data is highly correlated with the Akamai data (R2=0.75). (Figure 3.19).
Figure 3.19. Comparison of Akamai and Speedtest.net download speeds
Average download speed, Akamai (kbps)
Ave
rag
e d
ow
nlo
ad
spe
ed
, S
pee
dte
st.
ne
t (k
bps)
0
4,000
8,000
12,000
16,000
0 4,000 8,000 12,000
Source: Berkman Center analysis of Speedtest.net and Akamai data, Q4 2008Note: Hungry, Poland, the Slovak Republic and Turkey not included in Akamai data set; Axes condensed, Korea at (15,239, 20,493); R2 without Korea is 0.62
R2 = 0.75
DK
GRCA
CH
AT
FI
SE
IS
NO
IE
ES
ITLU
KR
NL
AU
NZ
US
DE
JP
GB
BE
CZ
FR
PT
MX
21,000
16,000
Average download speed, Akamai (kbps)
Ave
rag
e d
ow
nlo
ad
spe
ed
, S
pee
dte
st.
ne
t (k
bps)
0
4,000
8,000
12,000
16,000
0 4,000 8,000 12,000
Source: Berkman Center analysis of Speedtest.net and Akamai data, Q4 2008Note: Hungry, Poland, the Slovak Republic and Turkey not included in Akamai data set; Axes condensed, Korea at (15,239, 20,493); R2 without Korea is 0.62
0
4,000
8,000
12,000
16,000
0 4,000 8,000 12,000
Source: Berkman Center analysis of Speedtest.net and Akamai data, Q4 2008Note: Hungry, Poland, the Slovak Republic and Turkey not included in Akamai data set; Axes condensed, Korea at (15,239, 20,493); R2 without Korea is 0.62
R2 = 0.75
DK
GRCA
CH
AT
FI
SE
IS
NO
IE
ES
ITLU
KR
NL
AU
NZ
US
DE
JP
GB
BE
CZ
FR
PT
MX
21,000
16,000
From the perspective of U.S. performance specifically, the average download speed measured by Akamai and those measured by Speedtest both showed the United States in the 11th spot in the OECD. When two datasets, from two entirely different companies, using measurement techniques and locations that are completely independent of each other, have such similar findings, our level of confidence in the observation is increased. Together, these advantages suggest that user-side testing data are potentially useful for offering an additional source of insight on actual performance of networks. Like carrier-side and in-the-network testing data, they are an element that should be explored as a component of future stable measurement platforms that the FCC should wish to implement, as it seeks to develop a continuous basis for observing the state of broadband deployment and to identify other best-practice models. A similar model of testing is currently being developed by other projects as well; for example, the M-Labs project seeks to provide a broader-yet set of measures of quality, however, project data was not yet ready for our use.
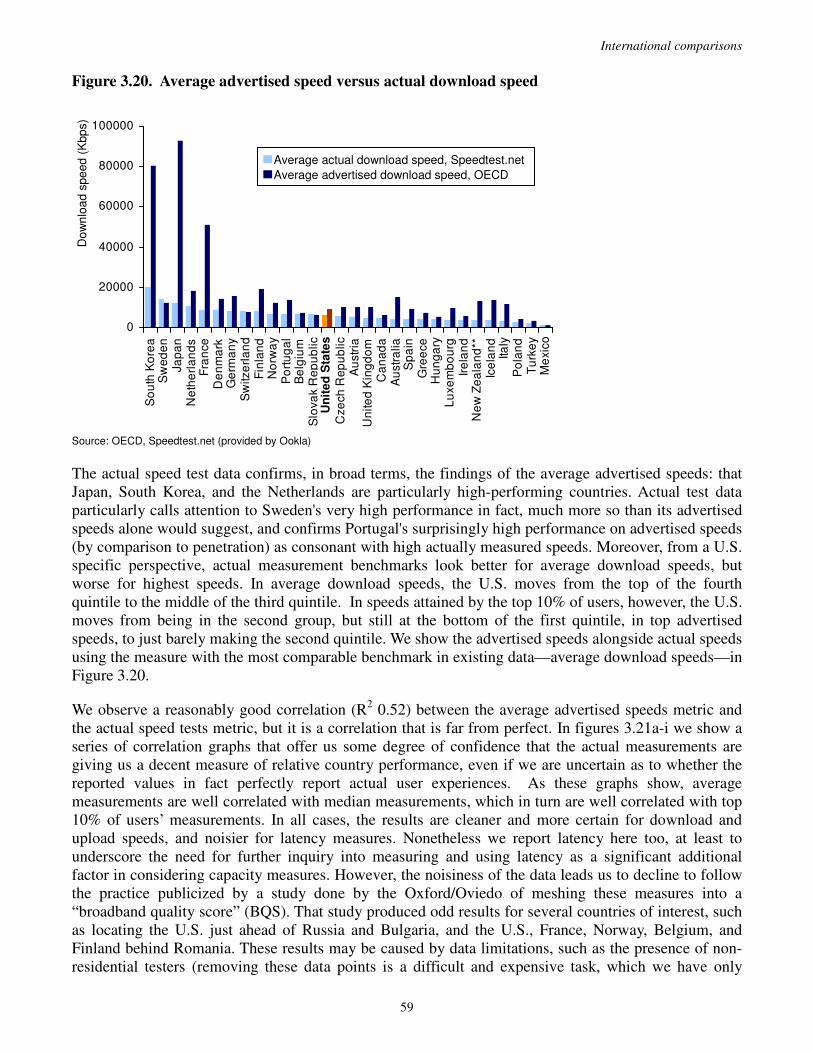
International comparisons
59
Figure 3.20. Average advertised speed versus actual download speed
0
20000
40000
60000
80000
100000
So
uth
Ko
rea
Sw
ed
en
Ja
pa
nN
eth
erl
an
ds
Fra
nce
De
nm
ark
Ge
rma
ny
Sw
itze
rla
nd
Fin
lan
dN
orw
ay
Po
rtu
ga
lB
elg
ium
Slo
va
k R
ep
ub
lic
Un
ite
d S
tate
sC
ze
ch R
ep
ub
lic
Au
str
iaU
nite
d K
ing
do
mC
an
ad
aA
ustr
alia
Sp
ain
Gre
ece
Hu
ng
ary
Lu
xe
mb
ou
rgIr
ela
nd
Ne
w Z
ea
lan
d**
Ice
lan
dIta
lyP
ola
nd
Tu
rke
yM
exi
co
Source: OECD, Speedtest.net (provided by Ookla)
Do
wn
loa
d s
pe
ed
(K
bp
s)
Un
ite
d S
tate
s
Average advertised download speed, OECD
Average actual download speed, Speedtest.net
Average advertised download speed, OECD
Average actual download speed, Speedtest.net
The actual speed test data confirms, in broad terms, the findings of the average advertised speeds: that Japan, South Korea, and the Netherlands are particularly high-performing countries. Actual test data particularly calls attention to Sweden's very high performance in fact, much more so than its advertised speeds alone would suggest, and confirms Portugal's surprisingly high performance on advertised speeds (by comparison to penetration) as consonant with high actually measured speeds. Moreover, from a U.S. specific perspective, actual measurement benchmarks look better for average download speeds, but worse for highest speeds. In average download speeds, the U.S. moves from the top of the fourth quintile to the middle of the third quintile. In speeds attained by the top 10% of users, however, the U.S. moves from being in the second group, but still at the bottom of the first quintile, in top advertised speeds, to just barely making the second quintile. We show the advertised speeds alongside actual speeds using the measure with the most comparable benchmark in existing data—average download speeds—in Figure 3.20.
We observe a reasonably good correlation (R2 0.52) between the average advertised speeds metric and the actual speed tests metric, but it is a correlation that is far from perfect. In figures 3.21a-i we show a series of correlation graphs that offer us some degree of confidence that the actual measurements are giving us a decent measure of relative country performance, even if we are uncertain as to whether the reported values in fact perfectly report actual user experiences. As these graphs show, average measurements are well correlated with median measurements, which in turn are well correlated with top 10% of users’ measurements. In all cases, the results are cleaner and more certain for download and upload speeds, and noisier for latency measures. Nonetheless we report latency here too, at least to underscore the need for further inquiry into measuring and using latency as a significant additional factor in considering capacity measures. However, the noisiness of the data leads us to decline to follow the practice publicized by a study done by the Oxford/Oviedo of meshing these measures into a “broadband quality score” (BQS). That study produced odd results for several countries of interest, such as locating the U.S. just ahead of Russia and Bulgaria, and the U.S., France, Norway, Belgium, and Finland behind Romania. These results may be caused by data limitations, such as the presence of non-residential testers (removing these data points is a difficult and expensive task, which we have only

Next Generation Connectivity
60
partly been able to implement for the results we report here, with the help of Ookla), or by the apparently significant amount of informal do-it-yourself fiber installments in Romania. However, our own, dataset still produced very counterintuitive results for latency, such as locating the United States between Greece and Turkey, both of which were ahead of France and Japan. We report the latency results here separately, and only with the caveat that they require substantial further analysis.
Figure 3.21a-i. Speedtest.net data
0
5000
10000
15000
20000
25000
KR
SE
JP
NL
FR
DK
DE
CH FI
NO
PT
BE
SK
US
CZ
AT
GB
CA
AU
ES
GR
HU
LU IE NZ IS IT PL
TR
MX
Source: Berkman Center analysis of Speedtest.net data
Ave
rag
e
do
wnlo
ad s
pe
ed (
Kbps)
US
0
2000
4000
6000
JP
SE
DK
NL
NO
CZ
SK
KR FI
US
FR
CH IS HU
AT
TR
DE
NZ
PL
CA IE
GB
BE
PT
AU
LU IT
GR
ES
MX
Ave
rag
e
uplo
ad s
pee
d (
Kbps)
US
0
5000
10000
15000
20000
25000
KR
SE
JP
NL
FR
DK
DE
CH FI
NO
PT
BE
SK
US
CZ
AT
GB
CA
AU
ES
GR
HU
LU IE NZ IS IT PL
TR
MX
Source: Berkman Center analysis of Speedtest.net data
Ave
rag
e
do
wnlo
ad s
pe
ed (
Kbps)
US
0
5000
10000
15000
20000
25000
KR
SE
JP
NL
FR
DK
DE
CH FI
NO
PT
BE
SK
US
CZ
AT
GB
CA
AU
ES
GR
HU
LU IE NZ IS IT PL
TR
MX
Source: Berkman Center analysis of Speedtest.net data
Ave
rag
e
do
wnlo
ad s
pe
ed (
Kbps)
US
0
2000
4000
6000
JP
SE
DK
NL
NO
CZ
SK
KR FI
US
FR
CH IS HU
AT
TR
DE
NZ
PL
CA IE
GB
BE
PT
AU
LU IT
GR
ES
MX
Ave
rag
e
uplo
ad s
pee
d (
Kbps)
US
0
2000
4000
6000
JP
SE
DK
NL
NO
CZ
SK
KR FI
US
FR
CH IS HU
AT
TR
DE
NZ
PL
CA IE
GB
BE
PT
AU
LU IT
GR
ES
MX
Ave
rag
e
uplo
ad s
pee
d (
Kbps)
US
0
100
200
300
NL
BE
CH
PT
SE
DK
CZ
HU
AT
GB
KR
NO
DE IT CA FI
GR
US
TR
FR
SK IE ES
PL
AU
JP
NZ
MX IS
Source: Berkman Center analysis of Speedtest.net data
Ave
rag
e late
ncy
US
0
100
200
300
NL
BE
CH
PT
SE
DK
CZ
HU
AT
GB
KR
NO
DE IT CA FI
GR
US
TR
FR
SK IE ES
PL
AU
JP
NZ
MX IS
Source: Berkman Center analysis of Speedtest.net data
Ave
rag
e late
ncy
US

International comparisons
61
0
10000
20000
30000
40000
50000
60000
70000
0 2000 4000 6000 8000 10000
90
thpe
rce
ntile
do
wnlo
ad
sp
eed
(K
bps)
0
5000
10000
15000
20000
25000
0 2000 4000 6000 8000 10000
Source: Berkman Center analysis of Speedtest.net data
Avera
ge d
ow
nlo
ad s
peed
(K
bps)
MX
TRPL
LUIS
HU
IE
SK
AUIT
GR
NZ
GBAT
ES
CA
FI
CZ
BE
US
NO
FR DK
CHDE
PT
JP
SE
NL
KR
Median download speed (Kbps)
MXTR
PLLU
IS
HUIE
SK
AU
IT
GR
NZGB
AT
ES CA
FI
CZ
BE
US
NO
FRDK CH
DE
PT
JP
SE
NL
KR
Median download speed (Kbps)
0
10000
20000
30000
40000
50000
60000
70000
0 2000 4000 6000 8000 10000
90
thpe
rce
ntile
do
wnlo
ad
sp
eed
(K
bps)
0
5000
10000
15000
20000
25000
0 2000 4000 6000 8000 10000
Source: Berkman Center analysis of Speedtest.net data
Avera
ge d
ow
nlo
ad s
peed
(K
bps)
MX
TRPL
LUIS
HU
IE
SK
AUIT
GR
NZ
GBAT
ES
CA
FI
CZ
BE
US
NO
FR DK
CHDE
PT
JP
SE
NL
KR
Median download speed (Kbps)
0
5000
10000
15000
20000
25000
0 2000 4000 6000 8000 10000
Source: Berkman Center analysis of Speedtest.net data
Avera
ge d
ow
nlo
ad s
peed
(K
bps)
MX
TRPL
LUIS
HU
IE
SK
AUIT
GR
NZ
GBAT
ES
CA
FI
CZ
BE
US
NO
FR DK
CHDE
PT
JP
SE
NL
KR
Median download speed (Kbps)
MXTR
PLLU
IS
HUIE
SK
AU
IT
GR
NZGB
AT
ES CA
FI
CZ
BE
US
NO
FRDK CH
DE
PT
JP
SE
NL
KR
Median download speed (Kbps)
0
5000
10000
15000
20000
25000
0 400 800 1200
90
thpe
rce
ntile
uplo
ad s
peed
(K
bps)
0
2000
4000
6000
0 400 800 1200
Source: Berkman Center analysis of Speedtest.net data
Avera
ge u
plo
ad
sp
eed
(K
bps)
MX
TRPL
LU
IS
HUIE
SK
AUITGR
NZGB
AT
ES
CA
FICZ
BE
US
NO
FR
DK
CH
DEPT
JP
SE
NL
Median upload speed (Kbps)
MXTR PL
LU
ISHU
IE
SKAUIT
GR
NZ
GBAT
ES
CA
FI
CZ
BE
US
NO
FR
DK
CH
DEPT
JP
SE
NLKR
Median upload speed (Kbps)
KR
0
30
60
90
0 50 100 150 200
10
thpe
rce
ntile
la
ten
cy
0
100
200
300
400
500
0 50 100 150 200
Source: Berkman Center analysis of Speedtest.net data
Avera
ge la
ten
cy
MX
TR PL
LU
IS
HU
IE
SKAU
ITGR
NZ
GBAT
ES
CA
FI
CZ
BEUS
NO
FRDK
CH DE
PT
JP
SENL
Median latency
MX
TR
PL
LU
IS
HU
IE
SK
AU
IT
GR
NZ
GBAT
ES
CA
FICZ BE
US
NOFR
DKCH
DE
PT
JP
SE
NL
KR
Median latency
KR
0
30
60
90
0 50 100 150 200
10
thpe
rce
ntile
la
ten
cy
0
100
200
300
400
500
0 50 100 150 200
Source: Berkman Center analysis of Speedtest.net data
Avera
ge la
ten
cy
MX
TR PL
LU
IS
HU
IE
SKAU
ITGR
NZ
GBAT
ES
CA
FI
CZ
BEUS
NO
FRDK
CH DE
PT
JP
SENL
Median latency
MX
TR
PL
LU
IS
HU
IE
SK
AU
IT
GR
NZ
GBAT
ES
CA
FICZ BE
US
NOFR
DKCH
DE
PT
JP
SE
NL
KR
Median latency
KR

Next Generation Connectivity
62
Another way of assessing the quality of capacity available in various countries, while keeping constant specific geographic differences, is to compare service in the major urban centers of different countries. We therefore analyzed the Speedtest data to identify upload and download speeds for each OECD country's capital city and its largest city, or where the two were one and the same, we added the second largest city as well. We found sufficient data for 55 cities using this method of selection. For average download speeds, we found that New York City is ranked 21st out of the 55 cities and Washington D.C. is ranked 36th. Both American cities in our sample did better on upload speeds, with New York City coming in at 13th and Washington D.C. at 25th for average upload speeds. The top 20 cities in each category are reported in Table 3.4.
Table 3.4. Top 20 cities in OECD countries by actual speed measurements, Q4 2008
Average download speed Average upload speed
1. Busan 1. Yokohama
2. Seoul 2. Stockholm
3. Göteborg 3. Tokyo
4. Stockholm 4. Göteborg
5. Yokohama 5. Kosice
6. Amsterdam 6. Copenhagen
7. Paris 7. Aarhus
8. Tokyo 8. Oslo
9. Aarhus 9. Amsterdam
10. Helsinki 10. Paris
11. Rotterdam 11. Espoo
12. Hamburg 12. Bergen
13. Kosice 13. New York
14. Bern 14. Helsinki
15. Berlin 15. Rotterdam
16. Copenhagen 16. Wellington
17. Espoo 17. Bratislava
18. Lyon 18. Prague
19. Lisbon 19. Bern
20. Oslo 20. Busan
3.5.3 Fiber deployment
One measure of the long-term construction of high-capacity networks is the deployment of optical fiber networks to the home. This is the technology used in the truly high capacity core of the network. DSL plant is both theoretically and practically more limited in its capacity. Its capacity has increased in the

International comparisons
63
past few years partly thanks to electronics, but partly also as a result of rolling fiber ever-closer to the home so as to shorten the copper path from the end of the fiber to the user. Cable plant too depends on hybrid fiber-coaxial networks, with the fiber relied upon to deliver the aggregate capacity to the neighborhood, and the coaxial cable to distribute it from there. DOCSIS 3.0, the new cable broadband standard, functions by binding more than one “channel” (what used to be the 6 MHz channels for TV) on the cable into a single high speed bitstream. This approach can substantially expand cable plant capacity for several more years, as it already has. But the broad consensus seems to be that the long-term fixed platform will likely be fiber, and cable plant too will likely become increasingly fiber-based over time, as the theoretical and long-term practical capacity of fiber to the home systems will be orders of magnitude larger than for cable systems. Given the theoretical, currently-practical, and long-term likely advantages of fiber infrastructure, it is plausible to look at the experience of other countries in fiber deployment.
As of December 2008, the OECD reported that 4% of U.S. broadband subscriptions were served by fiber to the home networks. Three-quarters of these connections were provided by Verizon FiOS. The remaining connections, about 1.1 million, are offered by small local incumbent and competitive providers, averaging about 1600 connections each. Neither AT&T nor Qwest have substantial Fiber-to-the-Home deployments,47 nor do they appear to have plans to implement FTTH on a substantial basis.48 Only six countries were reported as having a higher proportion of total broadband subscriptions to fiber: Japan (48%), South Korea (43%), Sweden (20%), the Slovak Republic (19%), Denmark (10%), and Norway (9%). The Czech Republic (4%) had an equal rate of fiber subscriptions. Our independent analysis suggests that the Slovak Republic's government report to the OECD erroneously reported houses passed by Orange Slovenska's then-recent fiber deployment, rather than subscriptions, resulting in an order-of-magnitude error.49 As of December 2008 about 2% of actual subscriptions in the Slovak Republic were to fiber, leaving only five countries ahead of the U.S. (although uptake in Slovakia in the past year suggests that the subscription rates are now as high as in the U.S. and the Czech Republic). Again, looking specifically at deployment of the most future-proof, high-capacity technology, Japan and South Korea emerge as high-performing outliers. Among the Nordic Countries, Sweden has clearly performed best and deserves special attention on this dimension, but Denmark and Norway clearly are also on a high-performance investment path to fiber. An argument might be made that with fiber, homes passed might be a better measure, because it would represent levels of new investment in a more future-proof technology. Several factors militate against this, as well as the poor data on the subject. First, actual subscriptions provide a less ambiguous metric. “Homes passed” might include a fiber to the neighborhood plant that is a mile from the homes in the neighborhood. Second, in some cases the last fiber drop will only be rolled out when the subscriber makes a commitment. Cost estimates from various countries suggest that the cost of the last drop represents a substantial incremental investment. In these situations subscribership indeed becomes the moment that the home genuinely gets connected by fiber. Third, given these concerns, and given that there are already countries where fiber subscriptions form an appreciable proportion of subscriptions, so that using this measure does not result in complete absence
47 North American FTTH/FTTP Status, Fiber-to-the-Home Council: North America (2009). 48 Robert C. Atkinson & Ivy E. Schultz, Broadband in America: Where it is and Where is it Going (Columbia Institute of
Tele-Information for the FCC November 11, 2009). 49 The Slovak Republic seemed to have reported the number of houses past by Orange's major deployment, in 12 Slovak
cities, of fiber passing 270,000 houses. The same report also made it into the country studies published by the European Regulators Group, ERG (17) 2009. Market data suggests that the correct number is 13,000 subscriptions to Orange's service. Given that the Slovak Republic has the highest prices for high speed capacity in the OECD, an immediate uptake of 100% of the capacity just rolled out last year would be nothing short of miraculous. The initial uptake of 5%, followed by what appears to be a doubling of subscriptions as of the end of the second quarter of 2009, to 29,000, is impressive enough.

Next Generation Connectivity
64
of data, moving to a fiber “homes passed” metric would simply mask these high performers, whose identification is a primary purpose of benchmarking by this measure.
3.5.4 Other metrics considered: Contention ratios
One of the factors affecting actual speed is what is often called “the middle mile,” a portion of the network that connects the last mile, such as the copper local loop, to the core of the network. Many network topologies adopted by broadband providers share this backhaul, or middle mile facility among multiple users. It is cheaper to build a higher capacity fiber connection to a local location, and split that capacity among multiple homes using existing infrastructure, like copper wires or cable. Even with fiber-to-the-home, the topology deployed currently by many of the carriers in many of the countries we observe is point-to-multipoint, which also brings a single shared fiber to the neighborhood, buries an optical splitter in the ground or puts it in an above ground closet, and pulls additional fiber strands from that closet to homes. In several countries, the United Kingdom, the Czech Republic, and Ireland, some providers have begun to offer packages that are price differentiated by contention ratios—that is, by a measure of how many other subscribers share the backhaul with a given subscriber. The same download speed will offer a faster connection with a 20:1 contention ratio than with a 50:1 ratio. That is, when the same backhaul capacity is dedicated to 20 users rather than 50. Contention ratios then become a plausible measurement for benchmarking, although it is ambivalent because it already assumes a certain topology. We will return to the question of topology and policy in the concluding section of Part 4 of this report.
3.5.5 Conclusion
Looking at speed, as well as the limited information we have on other measures of capacity, the list of countries that offer potential sources of insight remains relatively stable. Japan and South Korea continue to be obvious targets of observation. So too the Nordic countries, with a special emphasis on Sweden, as well as the Netherlands, continue to be of interest. When speed, rather than penetration, is the focus, France becomes a very high performing country, and Germany and Portugal also do substantially better on advertised and observed speeds than their numbers on penetration would lead one to anticipate. Interestingly, neither of these latter two countries has any fiber deployment to speak of, and they differ dramatically in market structure—Portugal has roughly 60/40 split between DSL and Cable, whereas Germany had, until very recently, almost no mode of broadband delivery but DSL (cable now is growing faster, but still represents under 10% of all broadband subscriptions). Both have advertised speeds roughly 50% faster than the United States, and both have higher average observed actual speeds. Among the relatively higher performers on penetration, Canada in particular shows up as weaker than it was on penetration, as do, to a lesser extent, the United Kingdom and Switzerland. As with penetration, we offer an at-a-glance table collecting our measures on speed in Table 3.5.

International comparisons
65
Different measures of speed are given roughly equal weight—with advertised speeds taking in total a bit more than one-third, emphasizing average advertised speeds (25%) over maximum advertised speeds (12%), and actual measurements split roughly equally between Akamai measurements (30%) and Speedtest measurements (33%) to allow the Speedtest data to be divided between its more diverse forms: treating median upload and download actual speed tests equally (10% each), with higher weight than median latency (5%), and a light emphasis on 90 percentile download and upload (4% each).50
50 Different weightings are, of course, possible. Our rankings are available online for others to tweak as they consider
appropriate. We do note that the U.S. ranking is not particularly sensitive to removing advertised rates altogether, and relying on the actual speed measurements alone, although it is sensitive to the relative weight given to upload speeds as measured by Speedtest.net, where the U.S. is 5th or 7th. For example, if median upload speeds were the only benchmark the U.S. would rank 5th—its best showing under these data. It is not clear to us that there is a plausible argument in favor of emphasizing upload speeds of that particular test to such a degree as to substantially affect the rankings.

Next Generation Connectivity
66
Table 3.5. Country rankings on various speed measures
Country
Maximum advertised
speed, OECD
Average advertised
speed, OECD
Average speed, Akamai
Median download, Speedtest.
net
Median upload,
Speedtest.net
Median latency,
Speedtest.net
90% Download,
Speedtest.net 90% Upload,
Speedtest.net
Weighted Average
Rank
1 Japan 1 1 2 4 1 17 3 1 2.48
2 South Korea 3 2 1 1 9 3 1 8 2.67
3 Netherlands 8 5 5 2 3 1 5 9 4.82
4 Sweden 3 13 3 3 2 4 2 2 5.37
5 Denmark 3 8 8 8 4 8 6 3 6.72
6 Norway 9 12 7 10 8 11 14 4 9.25
7 Finland 2 4 17 14 7 10 9 10 9.70
8 France 3 3 19 9 6 24 4 13 10.19
9 Germany 9 6 15 6 10 14 7 16 10.30
10 Switzerland 17 21 4 7 11 6 8 14 11.47
11 United States 9 19 11 11 5 17 11 7 12.30
12 Portugal 13 9 18 5 16 2 13 20 12.73
13 Iceland 3 10 10 26 15 30 24 12 12.90
14 Czech Republic 23 16 9 13 13 4 16 5 13.10
15 Belgium 25 22 6 12 19 7 12 21 15.07
16 Austria 16 17 14 17 17 12 15 15 15.57
17 Canada 17 25 13 15 12 15 22 19 17.28
18 United Kingdom 21 15 16 18 21 17 17 25 17.50
19 Australia 14 7 24 22 24 17 18 24 17.76
20 New Zealand 17 11 22 19 19 28 25 23 18.51
21 Slovak Republic 23 24 #N/A 23 14 16 10 6 19.86
22 Italy 25 14 20 21 22 23 28 27 20.15
23 Ireland 21 26 12 24 25 25 21 17 20.29
24 Spain 9 20 23 16 27 26 23 29 20.66
25 Greece 20 23 21 20 18 17 19 26 20.90
26 Luxembourg 14 18 25 27 29 27 26 30 22.87
27 Hungary 25 27 #N/A 25 23 9 20 11 23.20
28 Poland 25 28 #N/A 28 26 22 27 18 26.14
29 Turkey 29 29 #N/A 29 28 12 29 22 27.24
30 Mexico 30 30 26 30 30 29 30 28 28.67

International comparisons
67
3.6 Price
Price is obviously an important characteristic of the state of broadband connectivity. On the consumption or access side, price determines affordability for purposes of diffusion to communities with poorer residents, or to higher-cost service areas. Price at the lower end of service offerings will affect overall diffusion rates. Price at the higher end will determine diffusion of, and transition to, the highest capacity, world-class services. On the supply side, price is also an indicator of levels of competition. While the importance of competition to lowering rates is hardly news, the recent Pew survey released in June, 200951 finds that U.S. broadband subscribers who report that four or more providers are available to them pay $32.10, where three broadband providers are available, that price rises to $38.10, where only two providers are available the price increases further to $42.80, or fully one-third more than where there are four or more providers, and where only one provider is available, the price reported increases further to $44.70, or 139% of the price reported by those who live in places with competitive services (See Figure 3.22). This does not necessarily mean that the price where there are only one or two providers reflects the absence of competition. It may be that the high prices reflect the high costs of providing service in a given area, which in turn results in a lower level of competition as competitors are dissuaded from entering these markets by the high costs of entry. To assume that prices reflect purely higher costs and not the lack of competition would be equally speculative. The difference is likely a combined effect of cost and lack of competition that varies by location. Teasing out the relative influence would require additional studies comparing properly selected areas with similar costs but different levels of competition, and presents an important future avenue of research.
Figure 3.22. Price and number of competitors as reported in Pew Survey
$32.10
$38.10
$42.80
$44.70
20
30
40
50
1234+
Source: Pew, 2009
Pri
ce
pa
id f
or
mon
thly
su
bscrip
tion
(U
SD
PP
P)
39%
Number of providers in a given area
$32.10
$38.10
$42.80
$44.70
20
30
40
50
1234+
Source: Pew, 2009
Pri
ce
pa
id f
or
mon
thly
su
bscrip
tion
(U
SD
PP
P)
39%
Number of providers in a given area
Here we provide an overview of the major existing efforts at international price comparisons, and then describe our own extensive new pricing study, which complements and substantially extends currently available information about international comparisons of prices at all tiers of broadband service. We
51 Pew Internet and American Life, John Horrigan, Home Broadband Adoption 2009. p. 17.

Next Generation Connectivity
68
find that the U.S. does reasonably well at the very lowest speeds, but that prices increase substantially, by comparison to prices in other countries, for mid-, high, and very-high or next generation speeds. U.S. prices for next generation speeds are the highest, or near highest, in the world today. While there are many arguments about whether an unusual shape of demand in the U.S. accounts for middle-of-the-pack U.S. adoption rates, clearly as long as U.S. prices are middling to high relative to a set of countries, we should not expect U.S. consumers’ adoption to be better than middling by comparison to adoption elsewhere in the countries that have lower prices.
3.6.1 ITU and OECD data on pricing of lowest available prices
The two major international sources of price data are the ITU and OECD. ITU data is, however, substantially more limited in its coverage, using only the single least expensive offering, from the national incumbent, as its point of comparison.52 In terms of prices for the lowest-tier services available from a major incumbent, using that very narrow measure, the United States seems to be doing well. The ITU then ranks countries by the ratio of this low-cost price option from an incumbent to monthly GNI per capita. In this ranking the United States is ranked first. Measuring the lowest available price for an entry-level offering is useful as an initial step at identifying affordability. However, two problems in particular are presented by this measure. First, it looks only at offerings from the incumbent, or where that data is not available, one other provider. The ITU therefore reports the U.S. low-cost option to be lower than related OECD estimates, as the OECD surveys more providers in each country. And while the U.S. indeed performs well in entry-level price when more providers are considered (6th), the ITU reports higher entry level prices for Sweden, Denmark, Italy and Ireland, whereas all these countries in fact have lower entry-level offers from non-incumbent providers, according to the OECD. The ITU data assumes that the incumbent's offer represents well the lowest price offer, an assumption that does not fit with either our qualitative case studies or our company-level pricing study, reported in Part 4 below. Moreover, the ITU does not report anything for Turkey, the country with the lowest entry-level offer in the OECD data. The second problem with the ranking is that it is based on the GNI per capita rather than purchasing power parity, which is a better measure of relative affordability. Using PPP to generate the rankings does not, however, change the ranking of the United States, as long as one uses the ITU methodology of looking only at incumbent prices.
52 ITU-IDI 2009, Table 6.6, p. 67.

International comparisons
69
Figure 3.23. Range of broadband prices for monthly subscriptions
S. K
ore
a
Czech R
epublic
Mexic
o
Spain
Icela
nd
Canada
Germ
any
Luxem
bourg
Austr
ia
Port
ugal
Austr
alia
Norw
ay
Hungary
Japan
Gre
ece
UK
Pola
nd
Neth
erlands
Sw
itzFra
nce
Belg
ium
Fin
land
Slo
vak R
epublic
New
Zeala
nd
Irela
nd
Italy
Denm
ark
Sw
eden
Turk
ey
Un
ited
Sta
tes
0
100
200
300
Source: OECD, 2008
Bro
ad
ba
nd p
rices f
or
mon
thly
su
bscrip
tions (
US
D P
PP
)
3.6.2 OECD pricing measures
The OECD collects and reports a wider range of price indicators, from a larger number of providers in each of its countries. Because an increasing number of providers bundle services, including voice and video, with their broadband offerings, the data are incomplete. One fact that is immediately obvious is that South Korea's high performance on penetration and capacity comes at a price: its subscribers who wish to receive cheap, low-speed entry level access have no options. No carrier offers speeds slower than 8Mbps, and the price range from the lowest to the highest offer available is narrower than in any other country. KT offers consumers the same rate irrespective of technology of delivery, whether fiber to the home (FTTH), ADSL or VDSL. Given the near-universal household penetration (94%), one could say that high speed fixed broadband service has become a utility in South Korea. Everyone has it, and there is a relatively narrow choice about price or type of package. Other observations to point out regarding some of the countries that are among the common learning models is the relatively narrow range of prices in Sweden and Finland, as compared to Denmark and Norway, and the relatively high prices in Norway in general. From the perspective of the price of the lowest available offering, for speeds between 256k and 2Mbps, it appears that the United States compares well to other OECD countries.
Another measure commonly referred to when comparing pricing is price per megabit per second. Because neither the value of speed to consumers nor its cost to providers increases linearly with Mbps, these prices grossly reflect, on the low end, the prices of the highest-speed offerings available in a country and, on the high end, the price of the slowest speed offerings. They underscore the relative flexibility of offerings available in Japan and the fact that in South Korea the per-megabit price of capacity is dirt cheap in global terms. This way of viewing the data also allows us to see that the slowest, most expensive per-megabit prices in France are only slightly higher than prices in the United States, but the higher speed connections are ten times less expensive. The Nordic countries continue to present an attractive profile, although Norway clearly has higher prices, and it is important to try to understand why. So too the United Kingdom, where the lowest speed available is 2 Mbps, the highest 24Mbps, and

Next Generation Connectivity
70
the price, correspondingly, is somewhat higher than the lowest price in the U.S. at the low end and lower at the high end. Whether this makes the United Kingdom a good model for observation depends on whether one considers the cheaper 768kbps offerings available in the lowest tier in the United States to be “broadband” in a future-looking way. If the objective is to provide affordable access not to any kind of offering that meets the globally-used regulatory definition of “broadband,” but actually to reasonably high capacity offerings by global standards of practice, then the United Kingdom certainly serves as a useful model. As with speed and entry-level prices however, Canada's performance merits caution when observing its policies. While penetration there is high, not only is speed lower, but prices too are high in every tier of service.
A more useful measure of price than the price per megabit per second, which reflects speed as an endogenous factor, is the OECD's ranking based on tier of service. The OECD surveys operators to create an average offering price for different tiers of service: low speed (256kbps – 2Mbps), medium-speed (2.5Mpbs-10Mbps), high speed (10Mpbs-32Mbps), and very-high speed connections (above 35Mbps). Looking at a range of speeds that fall within the definition of low, medium, and high, as opposed to solely at the minimal offer for the slowest speed, the United States is 12th for low speed, 17th for medium speeds, and 18th for high speeds. As for the next generation, very high speeds, the good news is that the United States is on the list of countries that have any kind of offering in that range (35Mbps and above) in the OECD dataset (the OECD identified 12 countries with such offers; our independent research added seven more). The bad news is that prices in the U.S. for this highest speed offering are higher than in any other OECD country where these speeds are available except Norway, according to the OECD, and the highest of 19 in our more extended study.
Figure 3.24. Average monthly price for low speed tier
0
20
40
60
Italy
De
nm
ark
Be
lgiu
m
Fin
lan
d
Ire
lan
d
Un
ited
Jap
an
Sw
ed
en
Ne
the
rla
nd
s
Ne
w
Po
rtu
ga
l
Un
ited
Sw
itze
rla
nd
Slo
vak
Gre
ece
Hu
ng
ary
Fra
nce
No
rwa
y
Lu
xem
bo
urg
Cze
ch
Ca
na
da
Tu
rke
y
Ice
lan
d
Sp
ain
Ge
rma
ny
Au
stra
lia
Po
lan
d
Au
str
ia
Me
xico
Source: OECD, 2008
Ave
rag
e m
on
thly
price
(U
SD
PP
P)
Un
ite
d S
tate
s
Cze
ch
Re
pu
blic
Slo
vak R
ep
ublic
Ne
w Z
ea
lan
d
Un
ite
d K
ing
dom

International comparisons
71
Figure 3.25. Average monthly price for medium speed tier
0
20
40
60
80
100F
ran
ce
Jap
an
Un
ited
Kin
gd
om
Gre
ece
Fin
lan
d
Sw
itze
rla
nd
Ita
ly
Sw
ed
en
De
nm
ark
Po
rtu
ga
l
Ne
the
rla
nd
s
Be
lgiu
m
So
uth
Ko
rea
Ge
rma
ny
Cze
ch R
ep
ub
lic
Lu
xem
bo
urg
Un
ite
d S
tate
sN
orw
ay
Au
stri
a
Ne
w Z
ea
lan
d
Hu
ng
ary
Sp
ain
Ca
na
da
Ire
lan
d
Ice
lan
d
Au
str
alia
Me
xic
o
Po
lan
d
Tu
rke
y
Slo
va
k R
ep
ub
lic
Source: OECD, 2008
Ave
rag
e m
on
thly
price
(U
SD
PP
P)
Un
ite
d S
tate
s
Figure 3.26. Average monthly price for high speed tier
0
60
120
180
Fra
nce
Jap
an
Italy
Fin
lan
d
Gre
ece
Un
ite
d
Sw
ed
en
Sw
itze
rla
nd
De
nm
ark
Ge
rma
ny
Au
str
ia
Be
lgiu
m
Po
rtu
ga
l
Sp
ain
Ne
the
rla
nd
s
No
rwa
y
Ne
w Z
ea
lan
d
Un
ited
Sta
tes
Au
stra
lia
Hu
ng
ary
Ice
lan
d
Lu
xem
bo
urg
Po
lan
d
Cze
ch
Re
pu
blic
Ire
lan
d
Ca
na
da
Slo
vak R
ep
ub
lic
Source: OECD, 2008
Ave
rag
e m
on
thly
price
(U
SD
PP
P)
Un
ite
d S
tate
s
Un
ite
d K
ing
dom
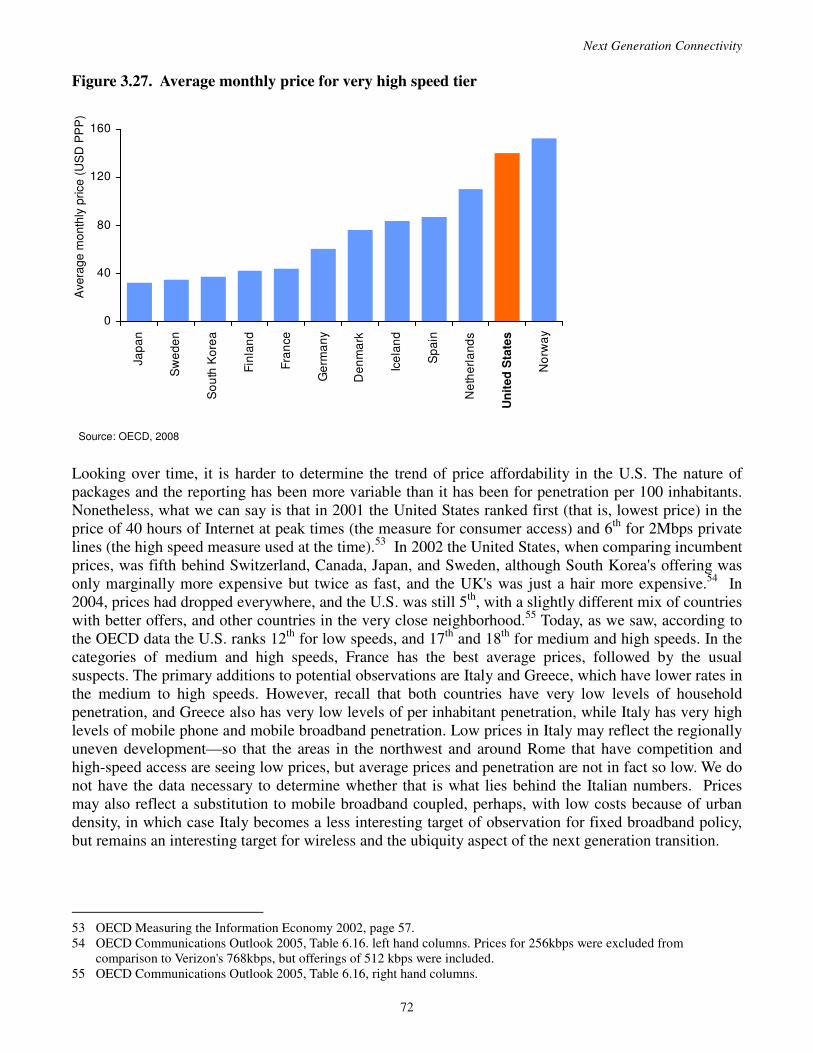
Next Generation Connectivity
72
Figure 3.27. Average monthly price for very high speed tier
0
40
80
120
160Ja
pa
n
Sw
ed
en
So
uth
Ko
rea
Fin
lan
d
Fra
nce
Ge
rma
ny
De
nm
ark
Ice
lan
d
Sp
ain
Ne
the
rla
nd
s
Un
ited
Sta
tes
No
rwa
y
Source: OECD, 2008
Ave
rag
e m
on
thly
price
(U
SD
PP
P)
Un
ite
d S
tate
s
0
40
80
120
160Ja
pa
n
Sw
ed
en
So
uth
Ko
rea
Fin
lan
d
Fra
nce
Ge
rma
ny
De
nm
ark
Ice
lan
d
Sp
ain
Ne
the
rla
nd
s
Un
ited
Sta
tes
No
rwa
y
Source: OECD, 2008
Ave
rag
e m
on
thly
price
(U
SD
PP
P)
Un
ite
d S
tate
s
Looking over time, it is harder to determine the trend of price affordability in the U.S. The nature of packages and the reporting has been more variable than it has been for penetration per 100 inhabitants. Nonetheless, what we can say is that in 2001 the United States ranked first (that is, lowest price) in the price of 40 hours of Internet at peak times (the measure for consumer access) and 6th for 2Mbps private lines (the high speed measure used at the time).53 In 2002 the United States, when comparing incumbent prices, was fifth behind Switzerland, Canada, Japan, and Sweden, although South Korea's offering was only marginally more expensive but twice as fast, and the UK's was just a hair more expensive.54 In 2004, prices had dropped everywhere, and the U.S. was still 5th, with a slightly different mix of countries with better offers, and other countries in the very close neighborhood.55 Today, as we saw, according to the OECD data the U.S. ranks 12th for low speeds, and 17th and 18th for medium and high speeds. In the categories of medium and high speeds, France has the best average prices, followed by the usual suspects. The primary additions to potential observations are Italy and Greece, which have lower rates in the medium to high speeds. However, recall that both countries have very low levels of household penetration, and Greece also has very low levels of per inhabitant penetration, while Italy has very high levels of mobile phone and mobile broadband penetration. Low prices in Italy may reflect the regionally uneven development—so that the areas in the northwest and around Rome that have competition and high-speed access are seeing low prices, but average prices and penetration are not in fact so low. We do not have the data necessary to determine whether that is what lies behind the Italian numbers. Prices may also reflect a substitution to mobile broadband coupled, perhaps, with low costs because of urban density, in which case Italy becomes a less interesting target of observation for fixed broadband policy, but remains an interesting target for wireless and the ubiquity aspect of the next generation transition.
53 OECD Measuring the Information Economy 2002, page 57. 54 OECD Communications Outlook 2005, Table 6.16. left hand columns. Prices for 256kbps were excluded from
comparison to Verizon's 768kbps, but offerings of 512 kbps were included. 55 OECD Communications Outlook 2005, Table 6.16, right hand columns.

International comparisons
73
As with contention ratios, service-providers have begun offering differentiated pricing for different kinds of use patterns. Just as some operators began to price the same speed at different rates based on contention ratios to the middle-mile, so too in both Norway (over cable) and France (over fiber) subscribers can purchase higher upload speeds for an additional fee. Providers in some countries, although not in any of the high-performing countries, impose bit caps—or maximum data transferred per month—on their customers, and charge additional fees for additional files transferred. This practice is found in Australia, Belgium, Canada, Iceland, Ireland, New Zealand, and Turkey. Data caps are used by cable operators, but not DSL providers, in Portugal as well.56
3.6.3 Results of Berkman Center pricing study
Because price is so important and hard to get at, we developed our own analysis of prices available in the OECD countries, using market data from two distinct market analysis sources: TeleGeography and Point Topic. Using both of these, as well as the OECD study, we observed close to two thousand price offers in the OECD countries. Of these offers, we look at prices offered in every tier of service by the top four providers in every country, on the assumption that these offerings will reasonably reflect the market prices in each of the countries and best capture the prices upon which consumers make decisions, while offers from smaller, more marginal providers, who might be small providers in uncompetitive remote markets or who are not well known to customers, may provide offers that are uncharacteristically high or uncharacteristically low but do not play a large role in the market as actually perceived by most consumers on a national level.57 On average these top four providers combined have 80% of their local markets (although in the U.S., with its regional competition, they account for only 60%).58
We report simple averages of these offers, for each country, in each tier of service. For countries with data caps, we excluded offers with data caps lower than 2 Gb per month. We chose that number because, although lower data caps may be a way of giving low end connectivity to subscribers who are interested in no more than email and web surfing, these do not provide a measure of what the price of broadband, and certainly broadband in a forward-looking sense, provides. We chose 2Gb per month as the lower bound of the offer we would include in our analysis because that was the lower end of the data usage rates quoted by U.S. cable firm Comcast as the median monthly usage of its subscribers.59 (See Annex on pricing for a more detailed explanation of both our methods and our examination of the OECD data.) In total, our dataset included 950 unique observations, from 115 providers in 30 countries. In all, our study shows that U.S. prices are very good by international standards at the very low speeds, around 768kbps, but become more expensive at contemporary broadband speeds above 1.5Mbps. By the time we reach offers for speeds that are high (above 10Mbps), U.S. broadband prices are substantially higher than in many of the leading countries, and when we look at next-generation speeds (above 35Mbps) U.S.
56 OECD Outlook 2009, Table 7.14. 57 Some commentary, particularly in Canada, on our draft report seems to have failed to notice that our analysis in Part 4
and our analysis here take different measurements. Here we look only at top four providers. There we take all firms with next generation offers, as well as firms with offers of over 10Mbps in countries that do not have next generation offers, and all U.S. firms with more than 2 million subscribers. This resulted in our October 2009 draft reporting no next generation offerings in Canada for the benchmarking exercise, but identifying an offer from Videotron in that tier in Part 4 of the draft. Rather than an inconsistency in our own data reporting, that difference reflects the fact that Videotron, while an important regional provider in Quebec, is not a nationally top four provider.
58 If we include all the U.S. providers in our dataset, we do get to roughly 80%. Doing so increases the prices for the cheapest and medium tiers by $11 in each case; and increases the price by $8 for the high speed tier. It does, however, decrease the price for next generation speeds by $8. The price decrease does not affect the U.S. standing in the next generation speed tier, as even the lower price is still higher than the next worst country in this tier, Canada. Moreover, if we apply the same methodology to Canada, then prices for Canada also improve, leaving the U.S. trailing further behind in terms of prices for next generation speeds.
59 http://www.comcast.net/terms/network/amendment/ (last visited Sep. 4, 2009).

Next Generation Connectivity
74
Figure 3.28. Firm-level offerings in OECD, by price tiers; US offers in orange
$0
$30
$60
$90
$120
$150
100 1,000 10,000 100,000 1,000,000Speed (kbps)
Month
ly p
rice
Source: OECD, TeleGeography, Point Topic Note: Top 4 providers only
RoW
Low Medium High Very highUS
$0
$30
$60
$90
$120
$150
100 1,000 10,000 100,000 1,000,000Speed (kbps)
Month
ly p
rice
Source: OECD, TeleGeography, Point Topic Note: Top 4 providers only
RoW
Low Medium High Very highUS
prices are the highest among the 19 countries that have such offerings. Figure 3.28 shows the entire set of offers we reviewed, with offers by U.S. carriers marked in red, and offers from all other countries market in blue. The trend lines show the crossover point for U.S. prices and the higher trajectory of cost increases relative to other countries where higher speed service is available. Figure 3.29 through Figure 3.32 report the combined results of our study, organized by tier of service. The annex shows and explains the methodology and sources, as well as the difference between the draft report, which included only the OECD and TeleGeography data, and the current dataset, which includes an additional independent market analysis dataset, Point Topic.

International comparisons
75
Figure 3.29. Low speed tier: OECD, TeleGeography, Point Topic combined data set
$0
$25
$50
$75It
aly
Denm
ark
Sw
itzerland
Sw
eden
Japan
Irela
nd
Neth
erlands
Port
ugal
United S
tate
s
Fin
land
Fra
nce
Luxem
bourg
Gre
ece
Hungary
Germ
any
South
Kore
a
Canada
United K
ingdom
Pola
nd
Slo
vak R
epublic
Austr
ia
Czech R
epublic
New
Zeala
nd
Spain
Norw
ay
Turk
ey
Icela
nd
Austr
alia
Mexic
o
Un
ite
d S
tate
s
Figure 3.30. Medium speed tier: OECD, TeleGeography, Point Topic combined data set
$0
$30
$60
$90
Japan
Sw
eden
Fra
nce
Denm
ark
Sw
itzerland
Austr
ia
Gre
ece
Belg
ium
Neth
erlands
Italy
Port
ugal
United K
ingdom
Germ
any
Fin
land
Luxem
bourg
South
Kore
a
Irela
nd
Canada
United S
tate
s
Czech R
epublic
Norw
ay
New
Zeala
nd
Slo
vak R
epublic
Hungary
Icela
nd
Spain
Austr
alia
Mexic
o
Turk
ey
Pola
nd
Un
ited
Sta
tes

Next Generation Connectivity
76
Figure 3.31. High speed tier: OECD, TeleGeography, Point Topic combined data set
$0
$30
$60
$90
$120Japan
Italy
Sw
eden
United K
ingdom
Denm
ark
Fra
nce
Gre
ece
Sw
itzerland
South
Kore
a
Fin
land
Germ
any
Belg
ium
Austr
ia
Port
ugal
Neth
erlands
Norw
ay
New
Zeala
nd
United S
tate
s
Austr
alia
Canada
Spain
Irela
nd
Icela
nd
Czech R
epublic
Luxem
bourg
Hungary
Slo
vak R
epublic
Un
ited
Sta
tes
Note: Poland not displayed
Figure 3.32. Next- generation speed tier: OECD, TeleGeography, Point Topic combined data set
$0
$50
$100
$150
Japan
Sw
eden
South
Kore
a
Fin
land
Fra
nce
Sw
itzerland
Denm
ark
Neth
erlands
Germ
any
United K
ingdom
Austr
ia
Icela
nd
Spain
Slo
vak R
epublic
Czech R
epublic
Norw
ay
Hungary
Canada
United S
tate
sU
nit
ed
Sta
tes
$0
$50
$100
$150
Japan
Sw
eden
South
Kore
a
Fin
land
Fra
nce
Sw
itzerland
Denm
ark
Neth
erlands
Germ
any
United K
ingdom
Austr
ia
Icela
nd
Spain
Slo
vak R
epublic
Czech R
epublic
Norw
ay
Hungary
Canada
United S
tate
sU
nit
ed
Sta
tes

International comparisons
77
Several of the countries in our dataset vary significantly, at least in one tier of service, from their rankings according to the OECD, suggesting that determining available pricing is difficult and noisy, and requires further sustained study. We found substantially better offers at the medium speeds in Sweden, Belgium, and Austria, and in the high speed tier we found substantially better offers in the UK, Germany, and Denmark. Our prices for Finland are systematically higher than those that the OECD found, reflecting various differences in the datasets that we describe in the Annex. For the U.S., the prices we found at the lower tier are lower than the OECD rankings, but nonetheless closer to the OECD ranking than the much narrower, best-incumbent-offer reported by the ITU. Our findings for the U.S. in the middle to high speed tiers are mostly consistent with the findings of the OECD—which is to say that U.S. prices in those tiers are middling to weak (19th of 30 for medium speed, and 18th of 28 for high). For the very highest, next-generation speeds, the U.S. has substantially higher prices than are available to residential customers in other countries where offerings of speeds over 35Mbps are available. Indeed, because our research adds observations in countries that showed no such offers in the OECD data set, and because we add several offers available in the worst performer in that study, Norway, that were not covered by the OECD study, the U.S. falls from 11th of 12 in the OECD study to 19th of 19 in our more complete survey. As our mode detailed, firm-level analysis describes in Section 4.10 below clarifies, Japan, Sweden, South Korea, Finland and France form a cluster of countries with distinctly better price-to-speed tradeoffs at the very highest end. In France, for example, 100 Mbps service, digital TV, unlimited national and international calling to 70 countries, and nomadic access to all other subscribers of the same provider are available from Free (which has 24% of French broadband subscribers) for $32.55 PPP, and SFR, which serves another 22% of the French market, has an identically-priced offer for roughly similar services. Numericable offers 100Mbps service over cable, without the bundle, for EUR10 less, and France Telecom’s bundled offer, which is less comprehensive, is about EUR10 more expensive. U.S. prices for bundles that include half the speed (50Mbps), without the international calling or the nomadic access, are three (introductory offers) to five times higher than those of Free or SFR.

Next Generation Connectivity
78
3.6.4 Conclusion
International price comparison suggests a mixed, but overall weaker picture for the U.S. than do either penetration or speed comparisons. The relatively good news is that the lowest prices available for the lowest tier offerings are quite good by comparison to other countries, placing the U.S. solidly in the second quintile of performers. The bad news is that U.S. average prices for other tiers are in the fourth quintile for medium to high speeds, and at the very bottom of the heap for next generation speeds. Whether the data about the availability of relatively affordable slow speed offerings suggest that affordability of entry-level service is not a significant problem in the United States depends on two questions, one empirical the other aspirational. The empirical question is the degree to which the lowest available offers are more-or-less nationally available. That is a question to be addressed by the more fine-grained analysis of broadband availability contemplated by the American Recovery and Reinvestment Act. On qualitative inspection however, we found that our data for the U.S. in the low tiers suggests that the U.S. ranking in that low end tier is likely representative of what is really available throughout much of the country at the low end, and is not an artifact of our methods for selecting offers from the market data. The aspirational, or policy judgment required, is whether the lowest currently-available speeds are the appropriate target for broadband policy and planning. To the extent that one believes that any level of connectivity counts, then the answer is yes. To the extent one adopts the proposition that higher capacity connections, up to a point at any given moment in time, are necessary for full enjoyment of the benefits of the then-prevalent and next-step technologies, then the answer would be an unequivocal no, and the most pertinent data would concern prices at the tier of service we consider to be the target of present policy making.
If we conceive of the benefits of broadband connectivity to include capacity-sensitive applications like voice and video over IP; if we consider telecommuting and individual, home-based Internet entrepreneurship as important applications, then the price of the slowest speeds and capacity possible is likely too low a target for policy benchmarking purposes. Once we consider current medium and high speeds, as well as prices for next generation speeds, the picture in the United States becomes significantly less rosy. If the target of policy is to achieve near-universal availability of relatively high capacity connectivity, then it would be important to look at the experience of countries that have achieved better prices for higher capacity. These include Japan, South Korea, France, Sweden, Denmark, and the United Kingdom, as well as Italy, Germany, and Greece. Among the countries that perform well by penetration standards, Norway, the Netherlands, and Canada seem to present less attractive models on the price dimension.
We present a concluding at-a-glance table, as we did for the prior attributes, but we separate out next-generation speeds from current generation speeds because a third of OECD countries have no next generation offerings in our data set. Table 3.6 reports values for all OECD countries, and orders them by their relative performance on prices at the low, medium, and high current-generation speed tiers, each weighted equally (33%) to reflect no particular emphasis on one or another speed tier. Table 3.7 reports values only for those 19 countries that have next generation offerings (above 35Mbps) available.
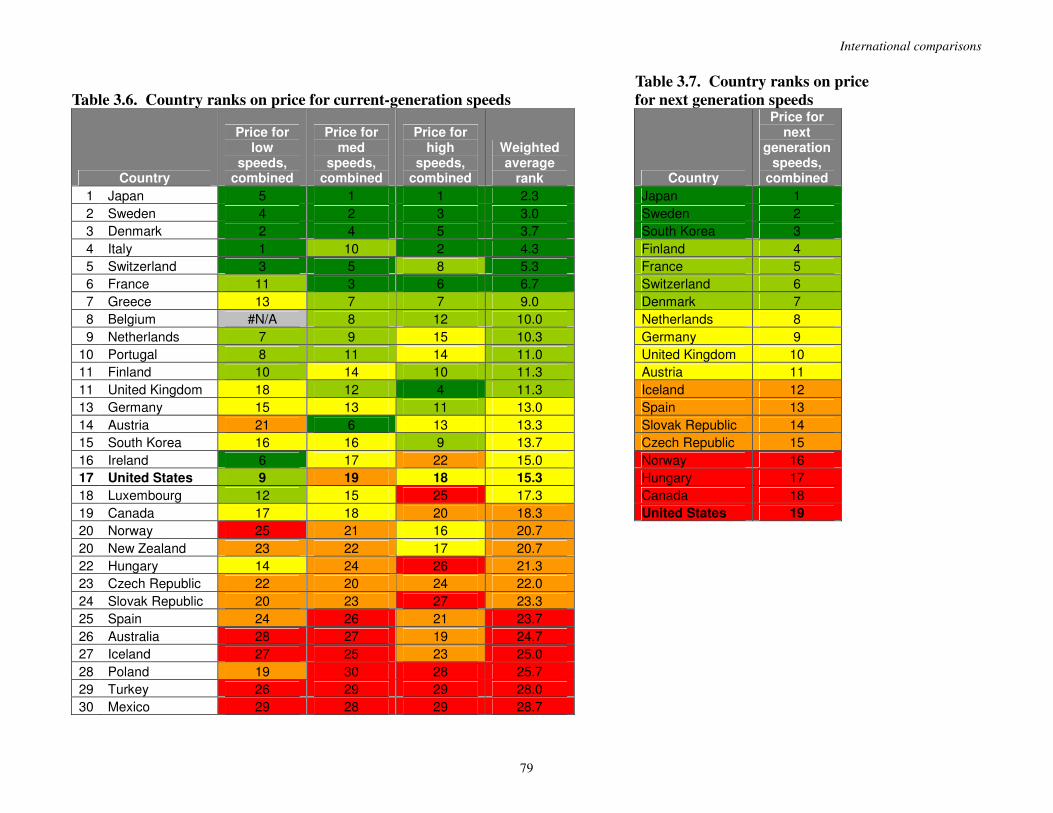
International comparisons
79
Table 3.7. Country ranks on price
Table 3.6. Country ranks on price for current-generation speeds for next generation speeds
Country
Price for low
speeds, combined
Price for med
speeds, combined
Price for high
speeds, combined
Weighted average
rank
Country
Price for next
generation speeds,
combined
1 Japan 5 1 1 2.3 Japan 1
2 Sweden 4 2 3 3.0 Sweden 2
3 Denmark 2 4 5 3.7 South Korea 3
4 Italy 1 10 2 4.3 Finland 4
5 Switzerland 3 5 8 5.3 France 5
6 France 11 3 6 6.7 Switzerland 6
7 Greece 13 7 7 9.0 Denmark 7
8 Belgium #N/A 8 12 10.0 Netherlands 8
9 Netherlands 7 9 15 10.3 Germany 9
10 Portugal 8 11 14 11.0 United Kingdom 10
11 Finland 10 14 10 11.3 Austria 11
11 United Kingdom 18 12 4 11.3 Iceland 12
13 Germany 15 13 11 13.0 Spain 13
14 Austria 21 6 13 13.3 Slovak Republic 14
15 South Korea 16 16 9 13.7 Czech Republic 15
16 Ireland 6 17 22 15.0 Norway 16
17 United States 9 19 18 15.3 Hungary 17
18 Luxembourg 12 15 25 17.3 Canada 18
19 Canada 17 18 20 18.3 United States 19
20 Norway 25 21 16 20.7
20 New Zealand 23 22 17 20.7
22 Hungary 14 24 26 21.3
23 Czech Republic 22 20 24 22.0
24 Slovak Republic 20 23 27 23.3
25 Spain 24 26 21 23.7
26 Australia 28 27 19 24.7
27 Iceland 27 25 23 25.0
28 Poland 19 30 28 25.7
29 Turkey 26 29 29 28.0
30 Mexico 29 28 29 28.7

Next Generation Connectivity
80
3.7 Summary benchmarking report
In this part we reported the results of a multi-dimensional benchmarking study, combining our own independent research and analysis with, primarily, OECD data. Our independent data sometimes confirm, sometimes refine, and sometimes disagree with OECD data in particular areas, such as low-tier service pricing or approaches to actual speed measurement. The degree of correlation between these two independent datasets and analyses adds to our confidence in the quality of both. Our core purpose throughout has been to identify which countries are stronger and which are weaker, along several dimensions of each of the three major attributes: penetration, capacity, and price. This approach resulted in greater nuance than is captured by more widely used broadband-specific benchmarks—most commonly the penetration per 100 inhabitants measure—and in a tighter focus on measures of interest than used in the wider, business-use oriented scorecards we discuss in Section 3.2. Throughout the report, at the end of each section, we offered an at-a-glance table that described how each country did along each of the several measures of each attribute, and how they ranked, in the aggregate, in terms of that attribute. Here we conclude by rolling all these attribute-specific tables into a single combined table, reported as Table 3.8, treating penetration, speed, and price as equally-weighted performance measures.
From the perspective of looking at the United States rank alone, our approach drops the U.S. by one spot, but largely confirms and increases our level of confidence in the competence of the finding that the United States is, overall, a middle-of-the-pack performer. More interesting are the substantial changes in position of several countries often thought of as good performers to middling or even weak, and of middling performers to good. First, our balanced measures place South Korea and Japan where they are widely perceived to be—in the top cluster, alongside Sweden, Denmark, the Netherlands and Finland. It does, however, emphasize that South Korea’s approach comes at the cost of having relatively high prices. More useful in terms of adding information, are the shifts in place for Canada, Switzerland, and Norway, all of which show up as weaker performers in our benchmarking study than commonly perceived. First, Canada's weak speed and price performance, as well as low 3G penetration, move it from a solid second quintile performer into the fourth quintile. They also move Switzerland out of the first quintile, mostly because of lower 3G penetration and speeds, and underscore the extent to which Norway’s prices are high by both regional and international measures. On the other hand, France comes out as a stronger performer, moving from the third to the second quintile, as does Germany to a slightly lesser extent; Italy moves from the fourth to the third quintile because of excellent prices, Portugal from fifth to third quintile, because of both speeds and prices. Luxembourg, Australia, and Iceland all show weaker performances on the combined measure than they do on the penetration measure alone, because of relatively high prices and low speeds. As we move to the next parts of the report, we will be able to use the insights gained from the benchmarking exercise to add valence to our findings: that is, to interpret the practices and policies adopted by any given country in light of whether we understand that country to be a better or worse performer, either on a given attribute, or in the aggregate.

International comparisons
81
Table 3.8. Country ranks based on weighted average aggregates
Country Penetration Speed Price Overall Weighted
Average Rank
1 Sweden 2 5 2 3.12
2 Denmark 4 7 3 4.57
3 Japan 12 2 1 5.16
4 South Korea 1 3 15 6.22
5 Switzerland 5 11 5 7.16
6 Netherlands 10 5 9 7.94
7 Finland 6 10 11 8.90
8 France 14 10 6 10.06
9 Belgium 13 15 8 12.02
10 Norway 7 9 20 12.08
11 United Kingdom 9 18 11 12.50
12 Germany 15 10 13 12.77
13 Iceland 3 13 27 14.30
14 Italy 21 20 4 15.05
15 Portugal 23 13 10 15.24
16 United States 18 12 17 15.77
17 Luxembourg 8 23 18 16.29
18 Austria 20 16 14 16.52
19 Canada 16 17 19 17.43
20 Australia 11 18 26 18.25
21 Greece 27 21 7 18.30
22 New Zealand 19 19 20 19.17
23 Ireland 22 20 16 19.43
24 Czech Republic 26 13 23 20.70
25 Spain 17 21 25 20.89
26 Slovak Republic 24 20 24 22.62
27 Hungary 25 23 22 23.40
28 Poland 28 26 28 27.38
29 Turkey 30 27 29 28.75
30 Mexico 29 29 30 29.22