3-d seismic attributes - · pdf file3-d seismic attributes crewes research report —...
TRANSCRIPT
3-D seismic attributes
CREWES Research Report — Volume 8 (1996) 45-1
3-D seismic attributes
Dan Gr. Vetrici and Robert R. Stewart
ABSTRACT
Attribute analysis of 3-D seismic data in time slices presents a great opportunity forreservoir characterization. The interpretable information of the 3-D seismic data can beenhanceded with complex seismic trace attributes. The correlation between various P-wave seismic attributes and lithology has been used for some time, however, themulticomponent seismic techniques promise augmented development. Two examplesare presented: the Sierra Devonian carbonate gas play in northeast British Columbia andthe Blackfoot Cretaceous sandstone oil play in Alberta. Landmark and Photoninterpretive systems were used as well as Matlab and ERmapper applications.
INTRODUCTION
A typical seismic interpretation workstation displays the seismic data in vertical,horizontal and arbitrary crossing planes as images. The horizontal section is called a"time slice". In the process of seismic interpretation the geophysicist uses the seismicworkstation to map seismic anomalies correlating them with geological settings in thesubsurface. The seismic interpretation carried out on workstation is materialized inattribute anomaly maps of predicted oil and gas reservoirs in the subsurface.
In this paper, we present an approach to derive from the seismic trace attributeslithological information pertinent to hydrocarbon reservoir. After a short review of theseismic reflection aspects related to the complex seismic trace, for 3-D seismic data, wediscuss the potential of the seismic attribute time slice to characterize the hydrocarbonreservoir.
Examples from a 3-D seismic set shot over the Sierra Devonian carbonate gas fieldin NE British Columbia and a 3C-3D seismic data set acquired over the BlackfootCretaceous sandstone oil field in Alberta illustrate our results.
After considerable analysis, the interpreted seismic attribute (two-way time,isochron, interval velocity, amplitude strength, instantaneous phase, instantaneousfrequency, etc.) may contain the geological information necessary to uncover thesubsurface anatomy, to detect the "reservoir anomaly". The reservoir is usually mappedand characterized by comparison and/or calibration to previous similar cases. Seismiccalibration is based on well data (if exists) and previous experience, either one’s own orfrom the literature.
The processed seismic data set encodes the geological information from subsurfaceboundaries between media with different acoustic impedance. The bandwidth of theseismic signal and processing approximations limit the subsurface resolution thuschallenging the seismic interpreter. Numerous techniques as seismic inversion, AVO,coherency processing have developed to extract geological information from the seismicdata, to decipher the subsurface geology, to uncover and evaluate commercial depositsof hydrocarbons.
From the original seismic data, new seismic attribute volumes are processed andtime slice sets constructed. In time slice display, lithological lateral variations may beeasier identified as the sedimentation develops horizontal. Computation in the time slice
Vetrici and Stewart
45-2 CREWES Research Report — Volume 8 (1996)
plane may well enhance lithology distributions patterns without a prior knowledge ofvelocity and/or density.
METHODOLOGY
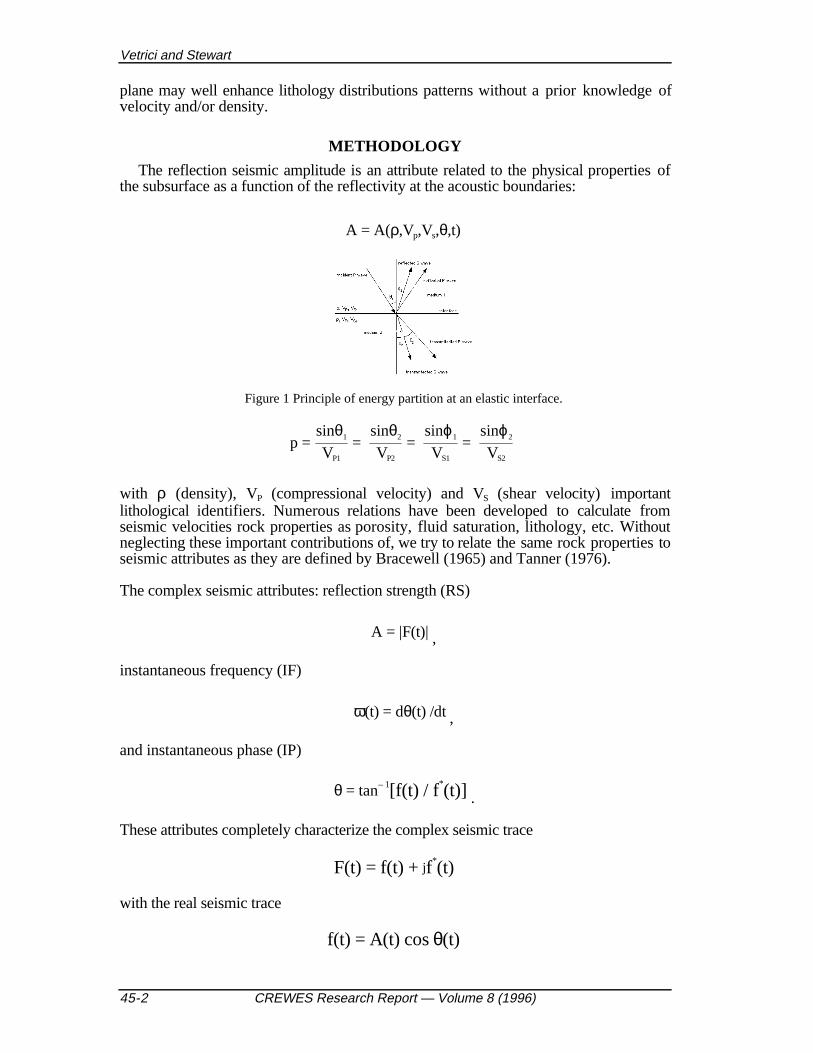
The reflection seismic amplitude is an attribute related to the physical properties ofthe subsurface as a function of the reflectivity at the acoustic boundaries:
A = A(ρ,Vp,Vs,θ,t)
Figure 1 Principle of energy partition at an elastic interface.
p =
sinθ1
VP1
=sinθ2
VP2
=sinϕ1
VS1
=sinϕ2
VS2
with ρ (density), VP (compressional velocity) and VS (shear velocity) importantlithological identifiers. Numerous relations have been developed to calculate fromseismic velocities rock properties as porosity, fluid saturation, lithology, etc. Withoutneglecting these important contributions of, we try to relate the same rock properties toseismic attributes as they are defined by Bracewell (1965) and Tanner (1976).
The complex seismic attributes: reflection strength (RS)
A = |F(t)| ,
instantaneous frequency (IF)
ω(t) = dθ(t) /dt ,
and instantaneous phase (IP)
θ = tan– 1[f(t) / f*(t)] .
These attributes completely characterize the complex seismic trace
F(t) = f(t) + jf*(t)
with the real seismic trace
f(t) = A(t) cos θ(t)
3-D seismic attributes
CREWES Research Report — Volume 8 (1996) 45-3
and imaginary seismic trace (the Hilbert transform of the real trace)
f*(t) = A(t) sin θ(t) .
The complex seismic trace attributes are found in some instances to correlate withlithological changes and historically have been used to characterize hydrocarbonreservoirs. All the seismic attributes should be considered and evaluatedsimultaneously. The 3-D seismic technique allows for a better understanding and use ofthese parameters as lithology changes develop spatially.
An assumption is made that any lithology change has a seismic response whichmight or not be directly measurable by seismic attributes of the compressional data. Forthe multicomponent seismic data there is higher chance that at least one attribute issensitive with that change. The seismic attribute analysis consists in defining that set ofattributes being sensitive to lithological variation affecting the reservoir rock hostingproperties: lithology, pore volume, permeability and water saturation.
In our case studies, we find that the instantaneous frequency seems to be sensitive toreservoir lithology. The thick slice technique, the sum of selected attribute slices, needsgeological refinements to accurately interpret lithological changes.
The seismic attribute computation is implemented on all current seismic workstationsand is straightforward. From the attribute volume time slices are constructed unflattenedor flattened on stratigraphic markers. Amplitude extraction and horizon computation isperformed on the attribute 3-D volume. 2-D filtering prior computation is performed inMatlab or Ermapper environments to enhance the output. The advantage of theERmapper is that we can interactively select the number of inputs and customizeprocesses individually; lowpass, highpass and median filters are easy to be applied inthe ERmapper environment.
In the relation
VP /VS =2 Tp /Ts – 1
we substituted T with the corespondent seismic attribute value and generated ratio mapscomparable to the isochron ratios. Different ratios were compared with the P-P and P-Sisochron ratios and we find the instantaneous frequency correlating well. The amplitudeenvelope ratio is also correlatable but we prefer the instantaneous frequency.
With isochron and seismic attribute time slice inputs reservoir character map areproduced. The following examples illustrate our approach.
Vetrici and Stewart
45-4 CREWES Research Report — Volume 8 (1996)
SIERRA 3-D SURVEY
The Sierra gas field is one of the largest gas accumulations in Western Canadalocated in northeast British Columbia, 80 km east of Fort Nelson. Gas is producedfrom the Upper Keg River carbonate buildup.
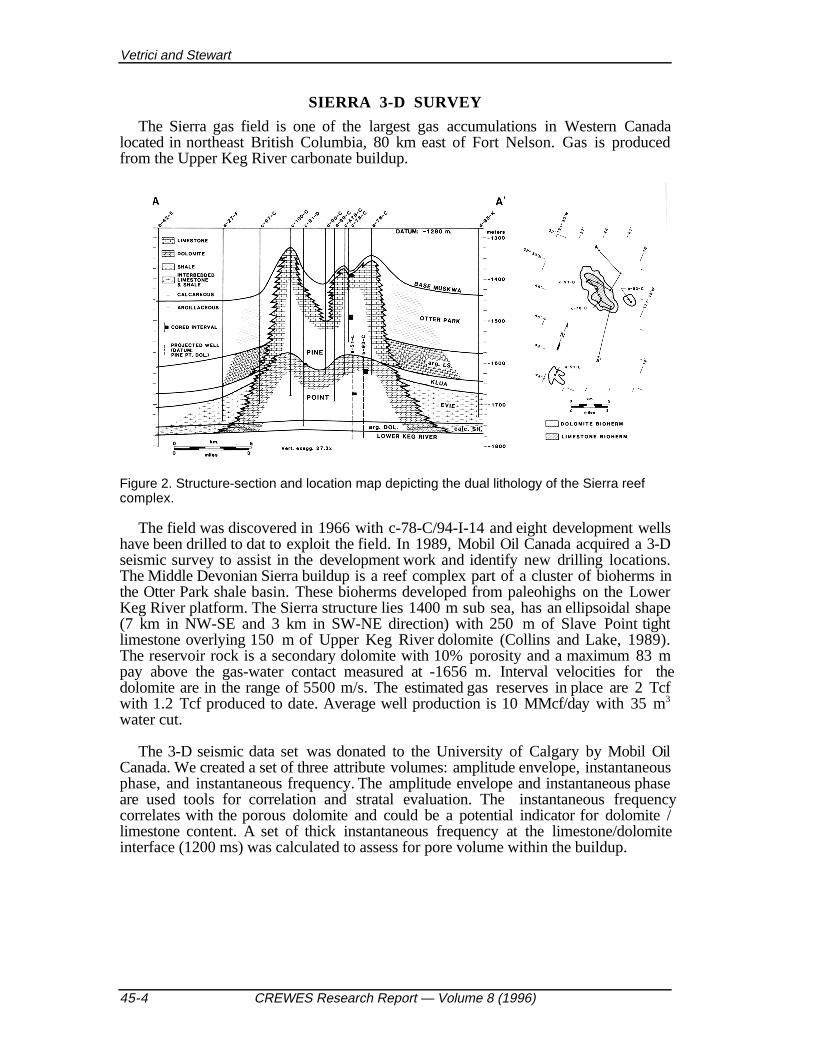
Figure 2. Structure-section and location map depicting the dual lithology of the Sierra reefcomplex.
The field was discovered in 1966 with c-78-C/94-I-14 and eight development wellshave been drilled to dat to exploit the field. In 1989, Mobil Oil Canada acquired a 3-Dseismic survey to assist in the development work and identify new drilling locations.The Middle Devonian Sierra buildup is a reef complex part of a cluster of bioherms inthe Otter Park shale basin. These bioherms developed from paleohighs on the LowerKeg River platform. The Sierra structure lies 1400 m sub sea, has an ellipsoidal shape(7 km in NW-SE and 3 km in SW-NE direction) with 250 m of Slave Point tightlimestone overlying 150 m of Upper Keg River dolomite (Collins and Lake, 1989).The reservoir rock is a secondary dolomite with 10% porosity and a maximum 83 mpay above the gas-water contact measured at -1656 m. Interval velocities for thedolomite are in the range of 5500 m/s. The estimated gas reserves in place are 2 Tcfwith 1.2 Tcf produced to date. Average well production is 10 MMcf/day with 35 m3
water cut.
The 3-D seismic data set was donated to the University of Calgary by Mobil OilCanada. We created a set of three attribute volumes: amplitude envelope, instantaneousphase, and instantaneous frequency. The amplitude envelope and instantaneous phaseare used tools for correlation and stratal evaluation. The instantaneous frequencycorrelates with the porous dolomite and could be a potential indicator for dolomite /limestone content. A set of thick instantaneous frequency at the limestone/dolomiteinterface (1200 ms) was calculated to assess for pore volume within the buildup.
3-D seismic attributes
CREWES Research Report — Volume 8 (1996) 45-5
Fig
. 3 S
ierr
a re
ef:w
ell c
ross
sec
tion
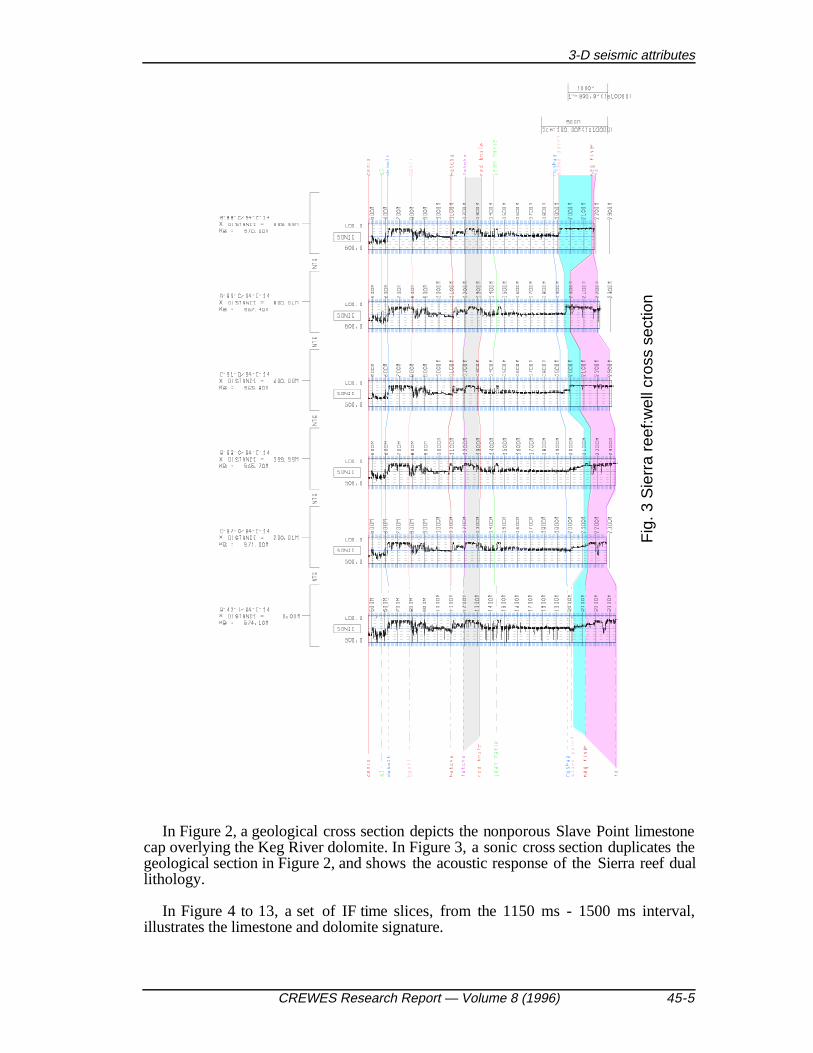
In Figure 2, a geological cross section depicts the nonporous Slave Point limestonecap overlying the Keg River dolomite. In Figure 3, a sonic cross section duplicates thegeological section in Figure 2, and shows the acoustic response of the Sierra reef duallithology.
In Figure 4 to 13, a set of IF time slices, from the 1150 ms - 1500 ms interval,illustrates the limestone and dolomite signature.
Vetrici and Stewart
45-6 CREWES Research Report — Volume 8 (1996)
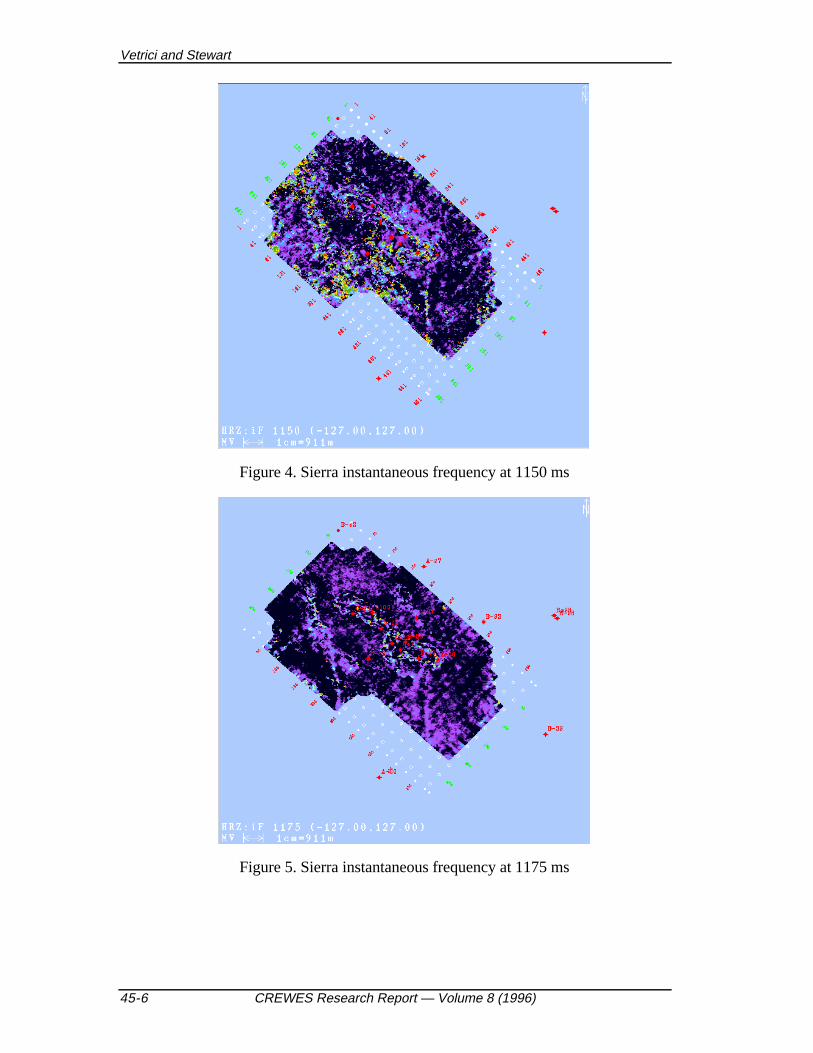
Figure 4. Sierra instantaneous frequency at 1150 ms
Figure 5. Sierra instantaneous frequency at 1175 ms
3-D seismic attributes
CREWES Research Report — Volume 8 (1996) 45-7
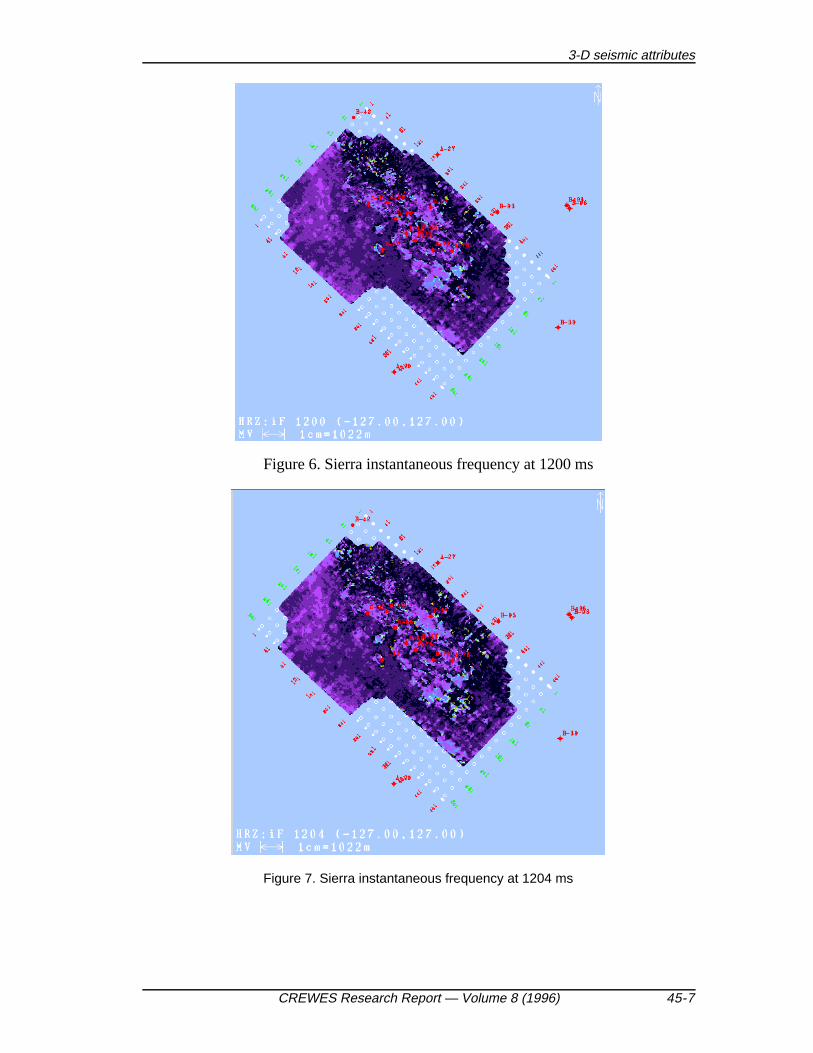
Figure 6. Sierra instantaneous frequency at 1200 ms
Figure 7. Sierra instantaneous frequency at 1204 ms
Vetrici and Stewart
45-8 CREWES Research Report — Volume 8 (1996)
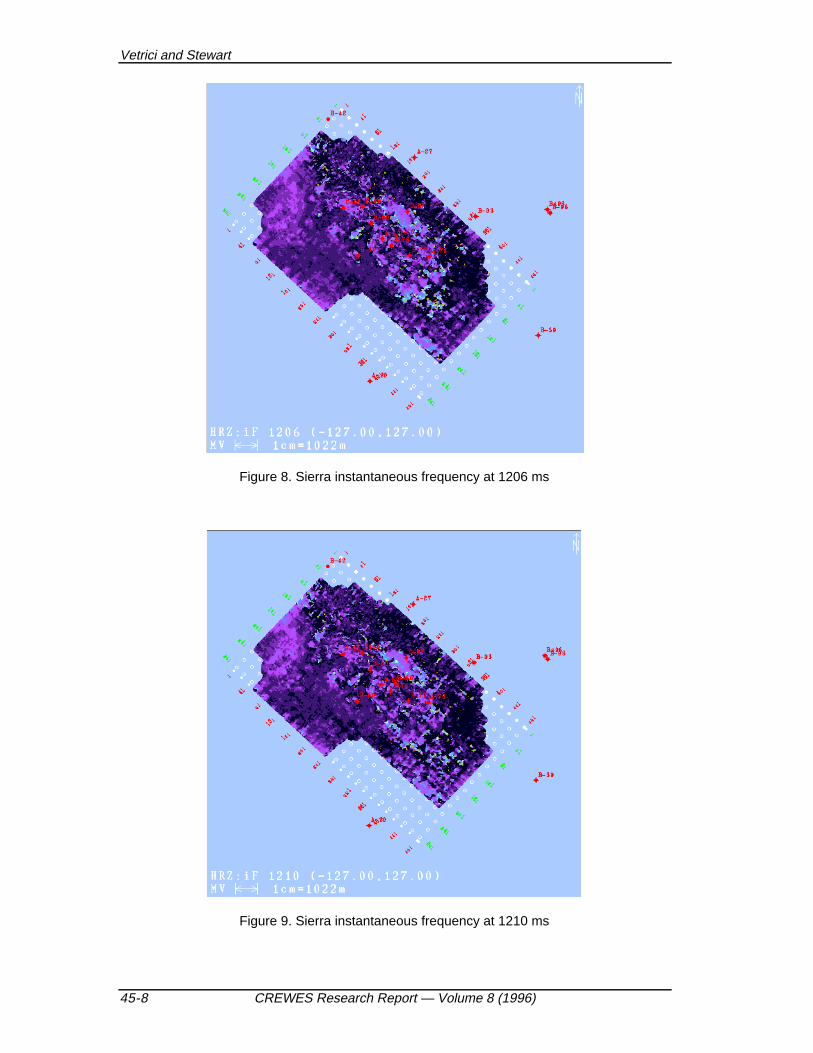
Figure 8. Sierra instantaneous frequency at 1206 ms
Figure 9. Sierra instantaneous frequency at 1210 ms
3-D seismic attributes
CREWES Research Report — Volume 8 (1996) 45-9
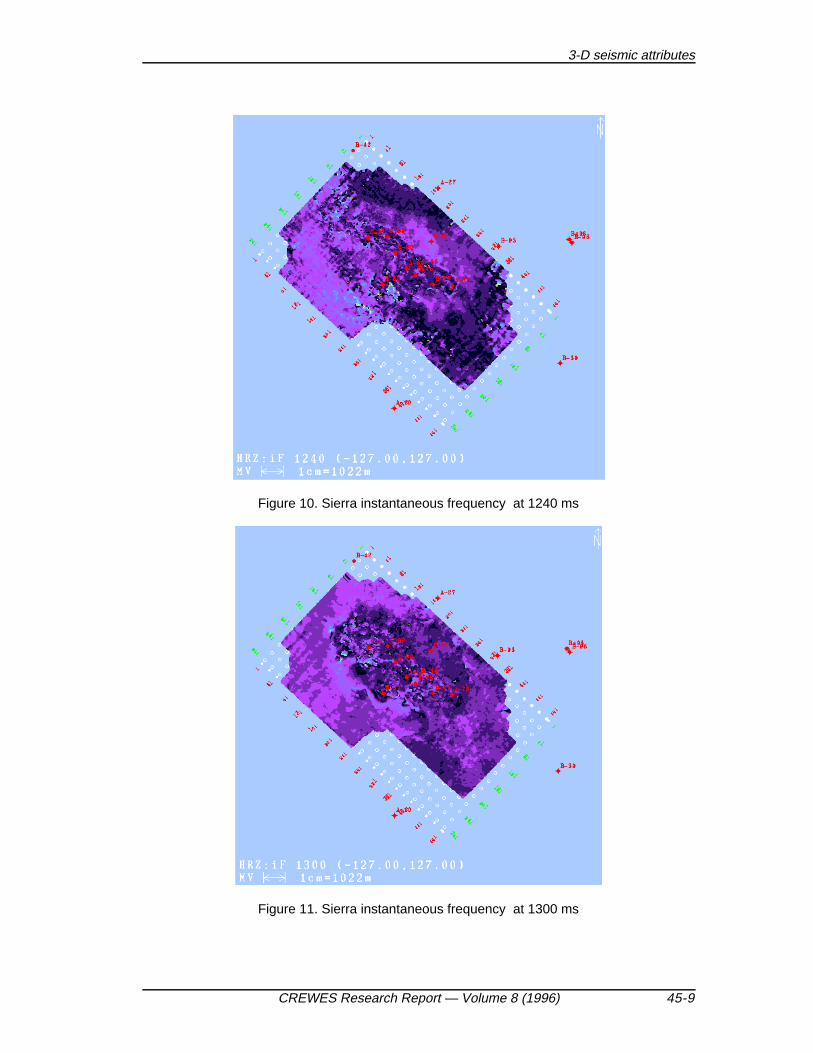
Figure 10. Sierra instantaneous frequency at 1240 ms
Figure 11. Sierra instantaneous frequency at 1300 ms
Vetrici and Stewart
45-10 CREWES Research Report — Volume 8 (1996)
.
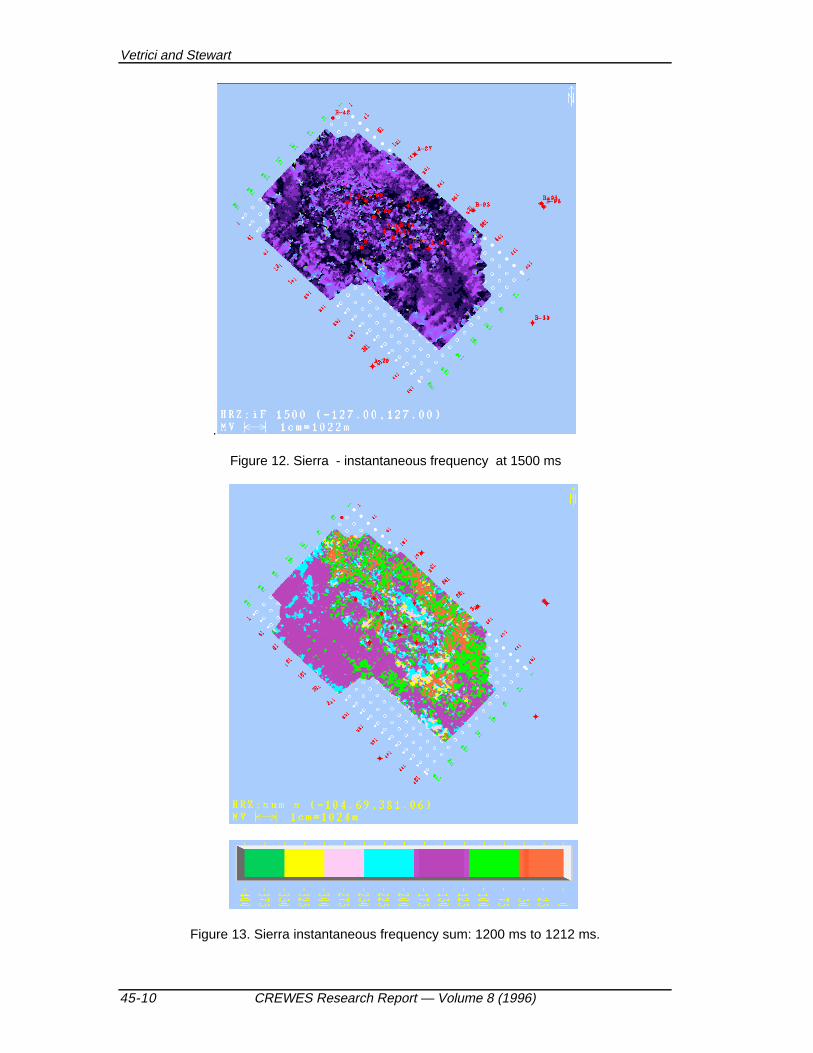
Figure 12. Sierra - instantaneous frequency at 1500 ms
Figure 13. Sierra instantaneous frequency sum: 1200 ms to 1212 ms.
3-D seismic attributes
CREWES Research Report — Volume 8 (1996) 45-11
The instantaneous frequency value and the texture of the time slice are characters wewill analyze. The IF time slice also enhances tectonic features otherwise masked on theconventional time slice displays. Figure 4, 5, are IF time slices displaying the SlavePoint limestone and Otter Park shale lithologies. The shale/limestone contact is sharplydefined wiyh the exception of the north site where the Slave Point limestone mightinterfinger with the Muskwa and Otter Park shales. Observe two faults crossing theSierra reef.
Figure 6 is the instantaneous frequency slice tangent at the dolomite structure asestimated from well data. The dolomite appear present at several locations indicatingrandom occurrence. The image texture change with the change of the instantaneousfrequency value. The light areas suggest limestone as it appears mapped on theshallower slices. In the south central part a circular feature is observed on allsubsequent slices, Figure 7, 8, 9 and 10. This represent a pinnacle reef, tested in 1990by Mobil Oil with b-80-C / 94-I-14 well. In Figure 11 the instantaneous frequency slicebeneath the reef, delineates a large elliptical shadow, an observation mention inliterature for large gas reservoirs (Tanner, 1976).
At 1500 ms on the verical seismic sections there are still correlatable reflections butthe IF slice displays little variation.
The instantaneous frequency slice in Figure 13 is a sum of seven (1200 ms to 1212ms) instantaneous frequency slices. The summation was performed to evaluate thecorrelation, if any, between the dolomite content and IF. Two distinct circular regionscan be contoured on this figure. We are favorable to the idea of interpreting this areas ashigher dolomite content than the surrounding localities.
BLACKFOOT 3C-3D SURVEY
The Blackfoot area Twp 23, R 23 W4M located 15 km southeast of town ofStrathmore, Alberta is explored for Lower Cretaceous incised valley channel sandstonereservoirs. The fluvial / estuarine Glauconitic Formation deposits range from sandstoneto shale distributed in a braided channel system with a northwesterly drainage.
A type Glauconitic sandstone reservoir is found at 600 m sub sea level depth, has anaverage thickness of 40 m, length of several kilometers and width of 200 m. Porosityvaries 0 % up to 30%. The interval velocity in clean sandstone is 3900 m/s. TheBlackfoot area has hydrocarbon reserves in place in excess of 400 MMbbl oilequivalent.
Exploration work conducted by PanCanadian area discovered in section 8-23-23W4M a NS a Glauconitic channel. P-P 3-D seismic data was acquired to supportfurther exploration and development activities here. Subsequent drilling revealed thecomplexity of the Glauconitic channel and the of the seismic response ambiguity withlithological variations affecting the reservoir porosity. A reliable exploration tool isdesired to more accurate predict Glauconitic reservoir porosity.
The Blackfoot Seismic Project conducted, with the industry participation, a 3C-3Dseismic survey in T23 R23 W4 to try 3-D multicomponent seismic technologies forsubtle Glauconitic sandstone exploration. Over 20 wells drilled in the area covered bythis seismic survey provide reasonable depth control.
From the seismic data processed at Pulsonic, Calgary, six attribute 3-D seismicvolumes were created: amplitude envelope, instantaneous phase and instantaneous
Vetrici and Stewart
45-12 CREWES Research Report — Volume 8 (1996)
frequency. As analysis of the Blackfoot data is an ongoing CREWES project atDepartment of Geophysics, University of Calgary, we will discuss the aspects pertinentto the relation between the seismic attributes and the Glauconitic channel signature.
We research the seismic attribute sensitivity to lithology. A set of two-way-time,isochron and attribute maps for the compressional (P-P) and converted (P-S) data setsare presented to illustrate our results.
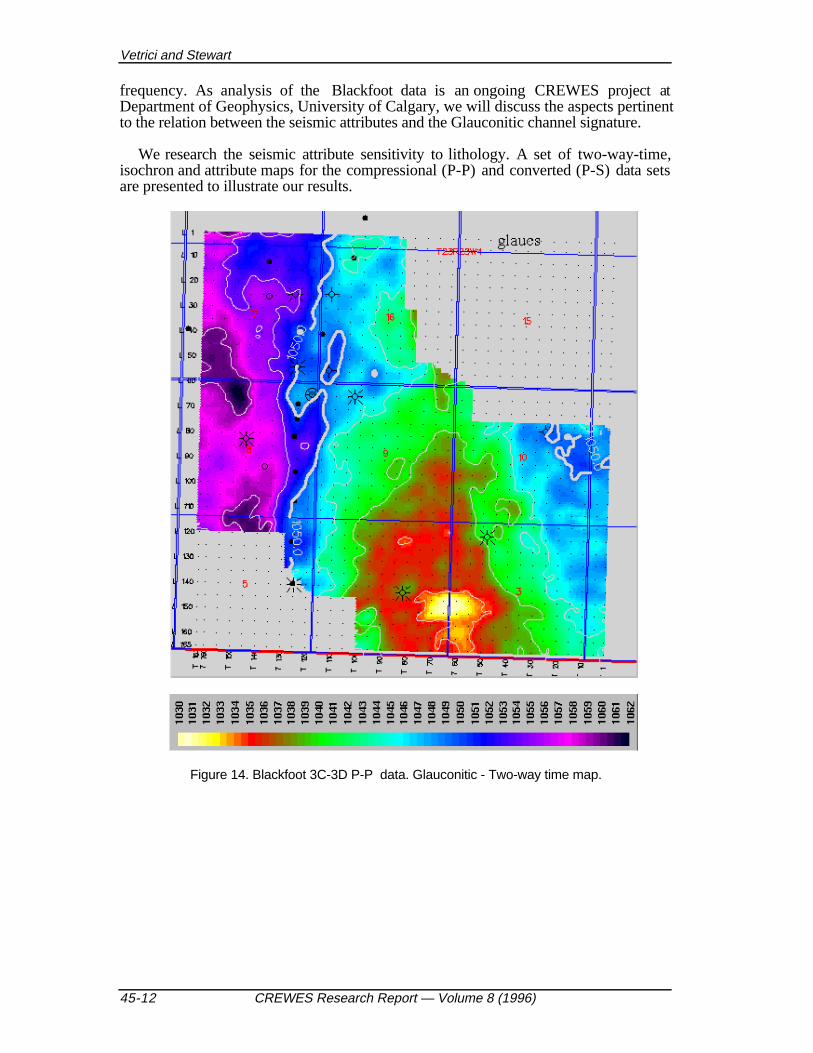
Figure 14. Blackfoot 3C-3D P-P data. Glauconitic - Two-way time map.
3-D seismic attributes
CREWES Research Report — Volume 8 (1996) 45-13
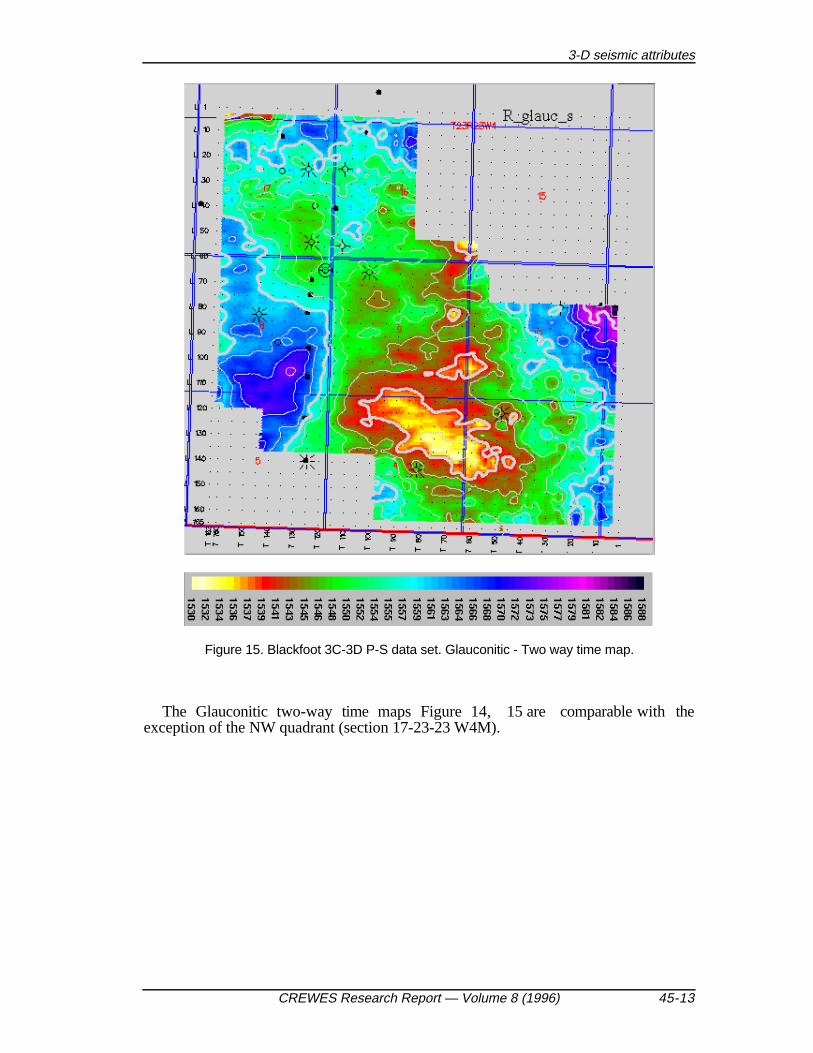
Figure 15. Blackfoot 3C-3D P-S data set. Glauconitic - Two way time map.
The Glauconitic two-way time maps Figure 14, 15 are comparable with theexception of the NW quadrant (section 17-23-23 W4M).
Vetrici and Stewart
45-14 CREWES Research Report — Volume 8 (1996)
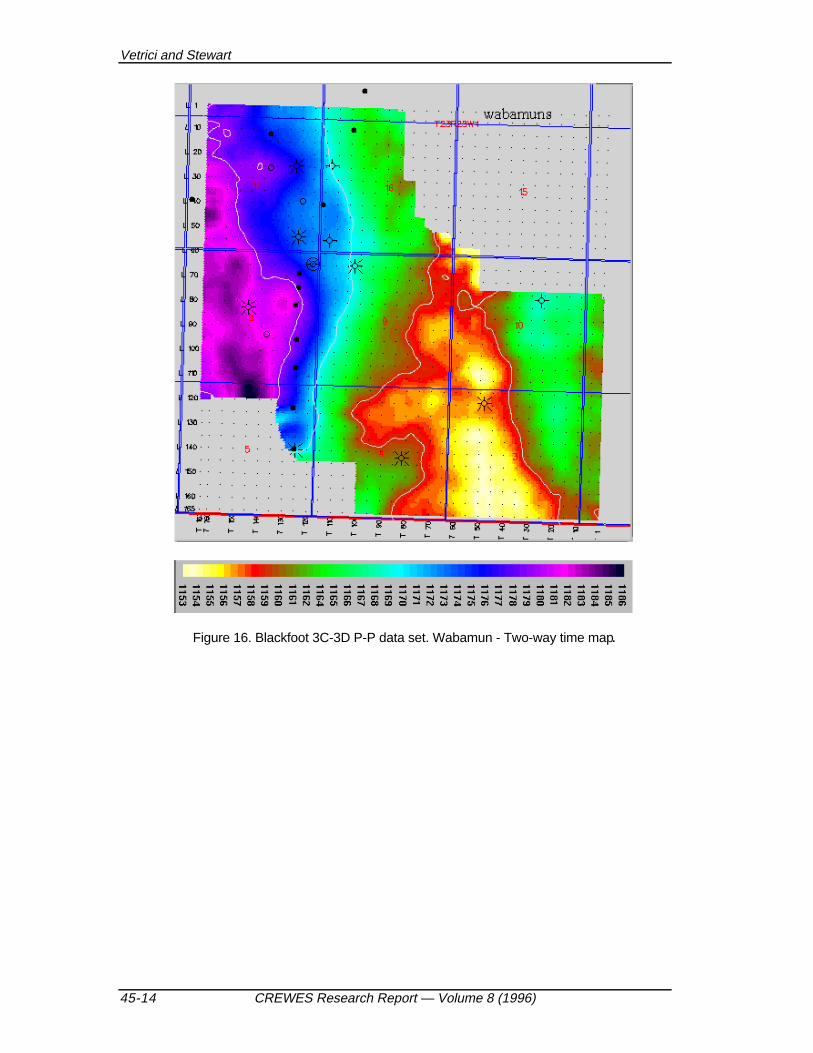
Figure 16. Blackfoot 3C-3D P-P data set. Wabamun - Two-way time map.
3-D seismic attributes
CREWES Research Report — Volume 8 (1996) 45-15
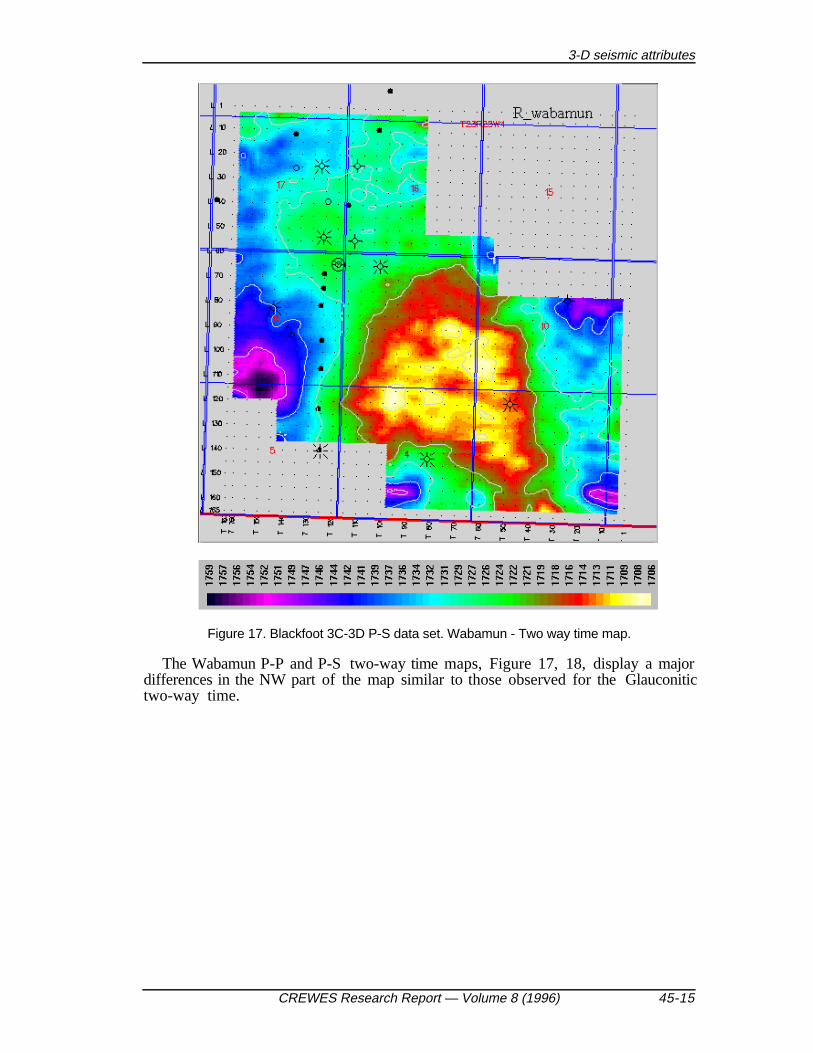
Figure 17. Blackfoot 3C-3D P-S data set. Wabamun - Two way time map.
The Wabamun P-P and P-S two-way time maps, Figure 17, 18, display a majordifferences in the NW part of the map similar to those observed for the Glauconitictwo-way time.
Vetrici and Stewart
45-16 CREWES Research Report — Volume 8 (1996)
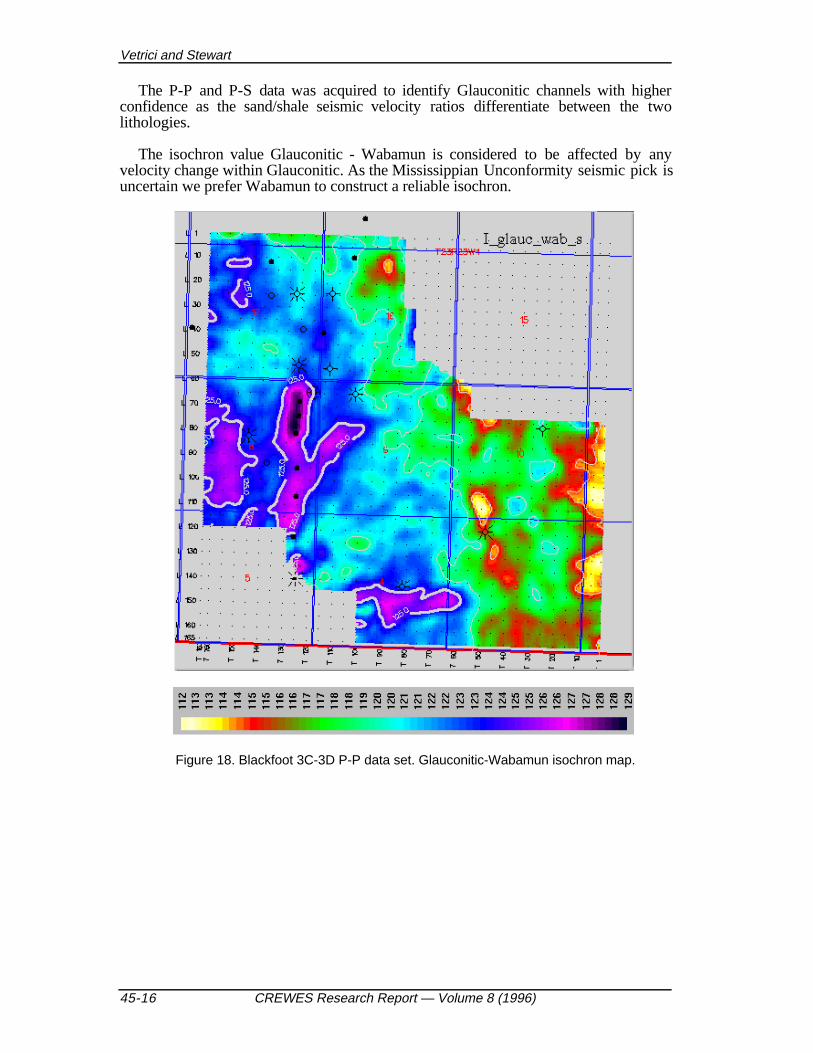
The P-P and P-S data was acquired to identify Glauconitic channels with higherconfidence as the sand/shale seismic velocity ratios differentiate between the twolithologies.
The isochron value Glauconitic - Wabamun is considered to be affected by anyvelocity change within Glauconitic. As the Mississippian Unconformity seismic pick isuncertain we prefer Wabamun to construct a reliable isochron.
Figure 18. Blackfoot 3C-3D P-P data set. Glauconitic-Wabamun isochron map.
3-D seismic attributes
CREWES Research Report — Volume 8 (1996) 45-17
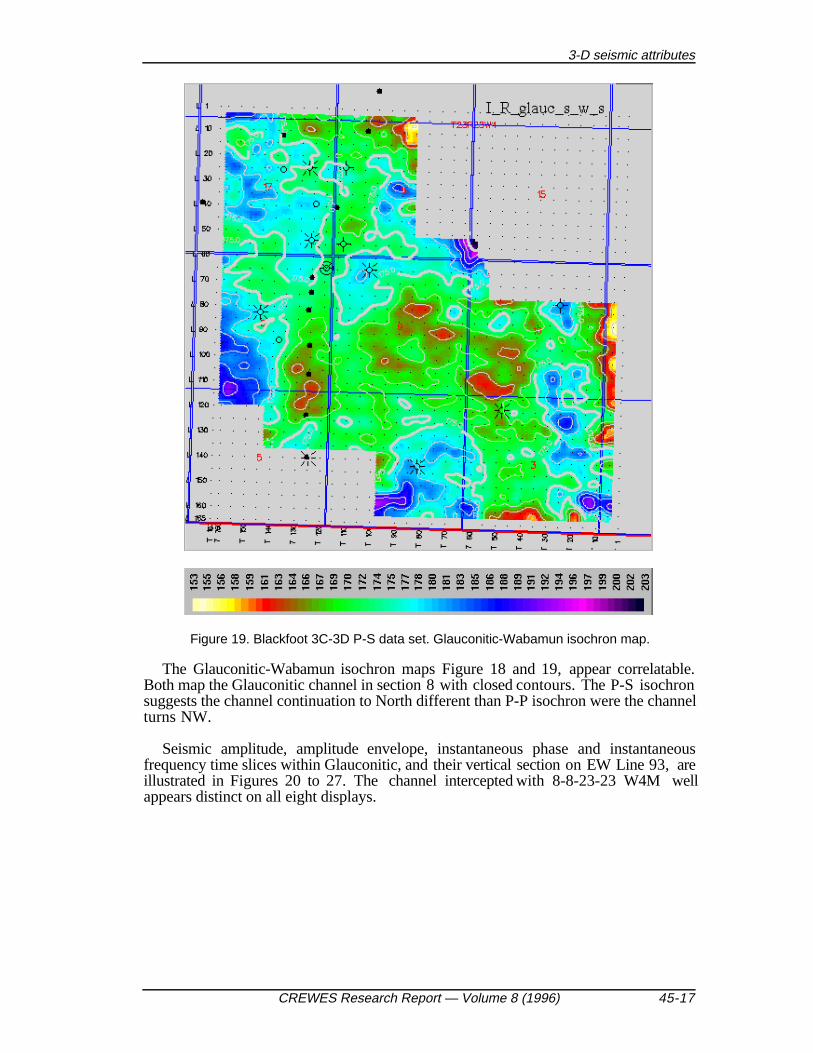
Figure 19. Blackfoot 3C-3D P-S data set. Glauconitic-Wabamun isochron map.
The Glauconitic-Wabamun isochron maps Figure 18 and 19, appear correlatable.Both map the Glauconitic channel in section 8 with closed contours. The P-S isochronsuggests the channel continuation to North different than P-P isochron were the channelturns NW.
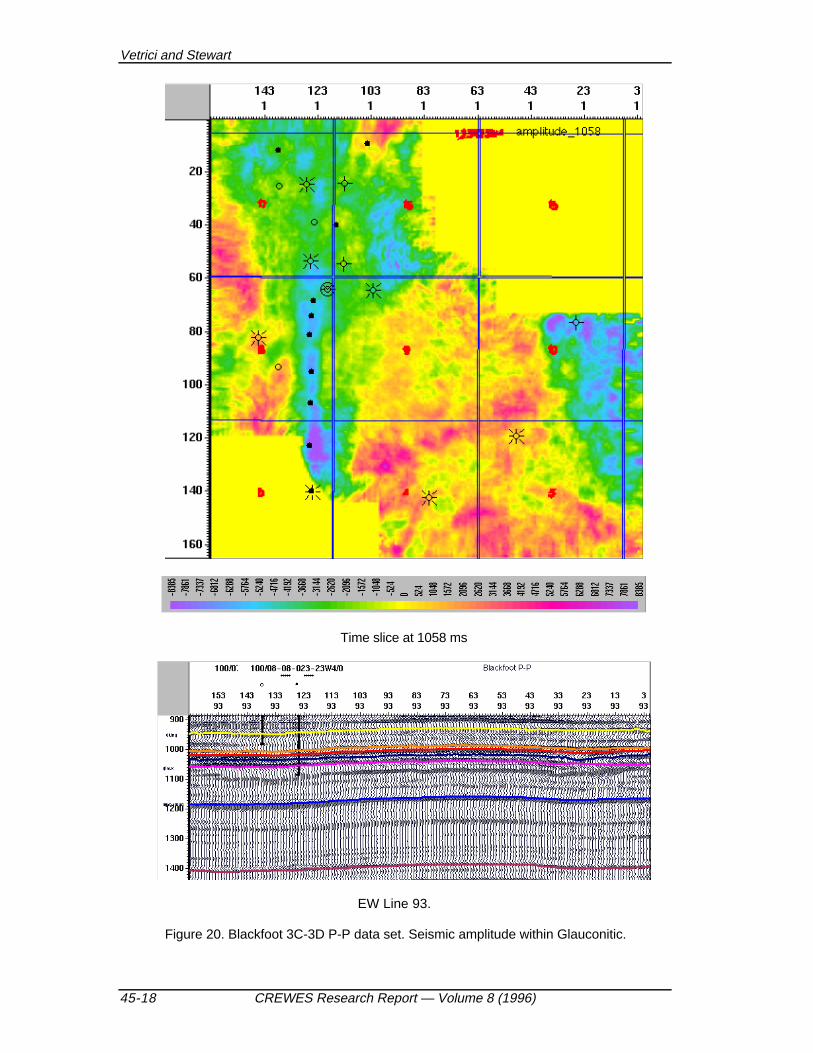
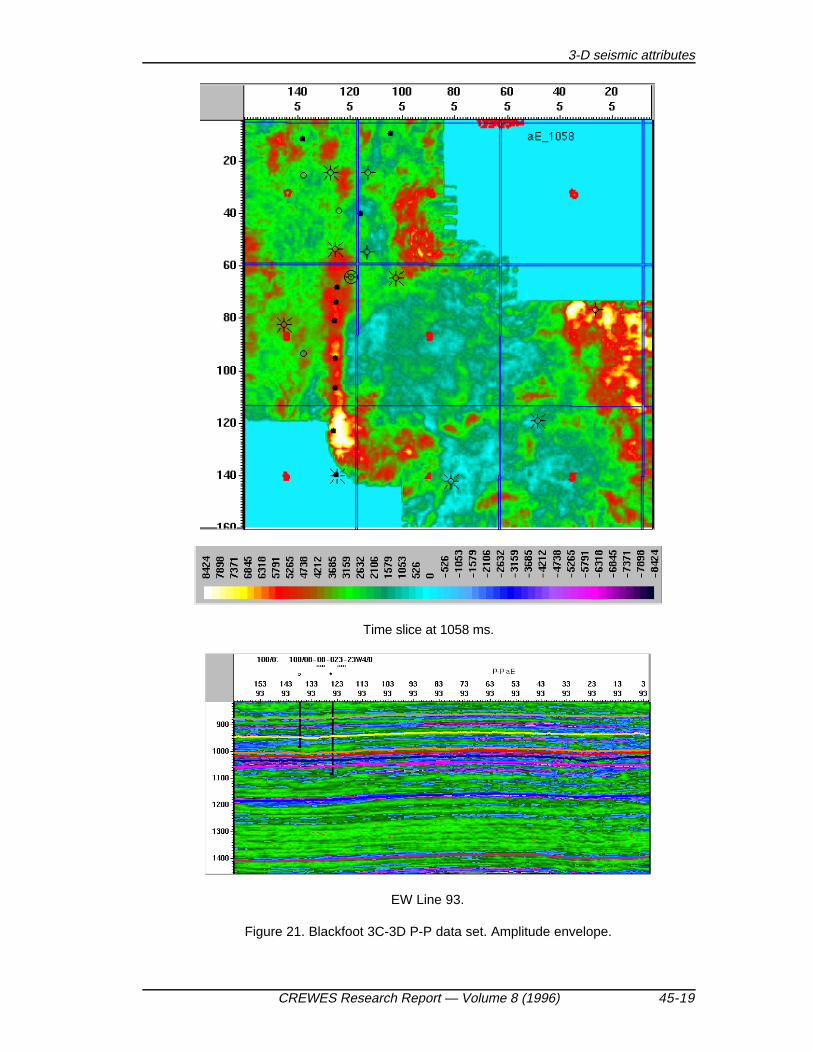
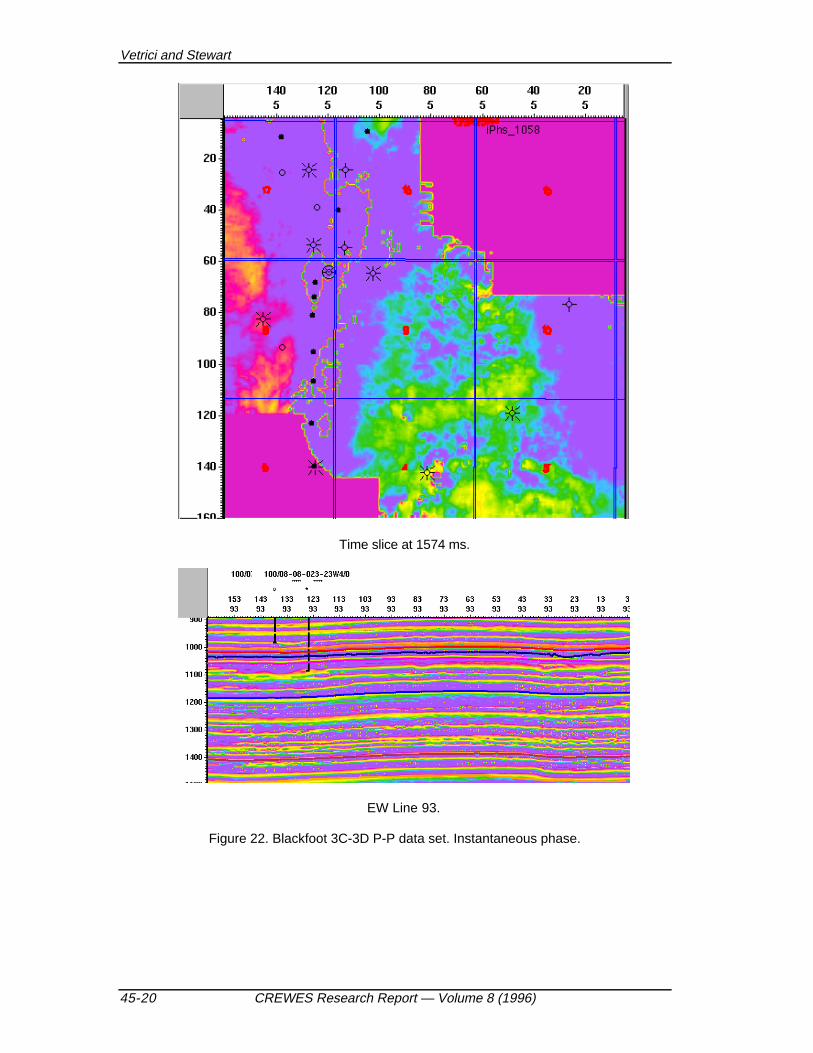
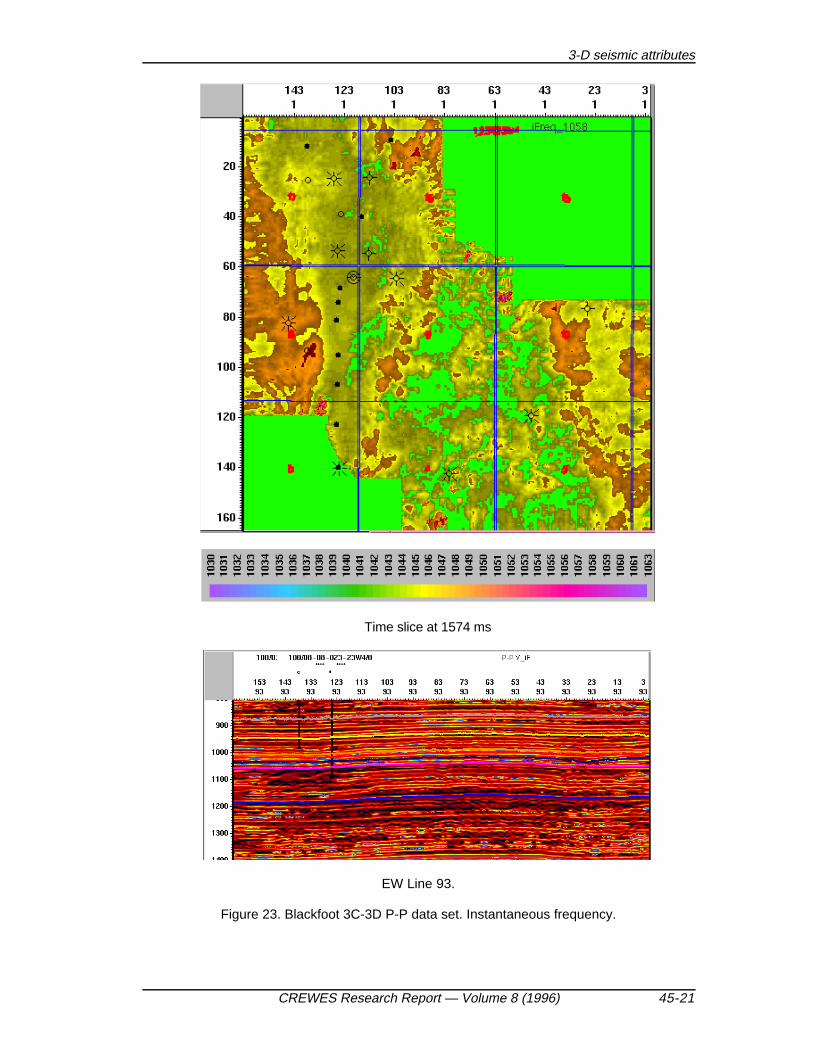
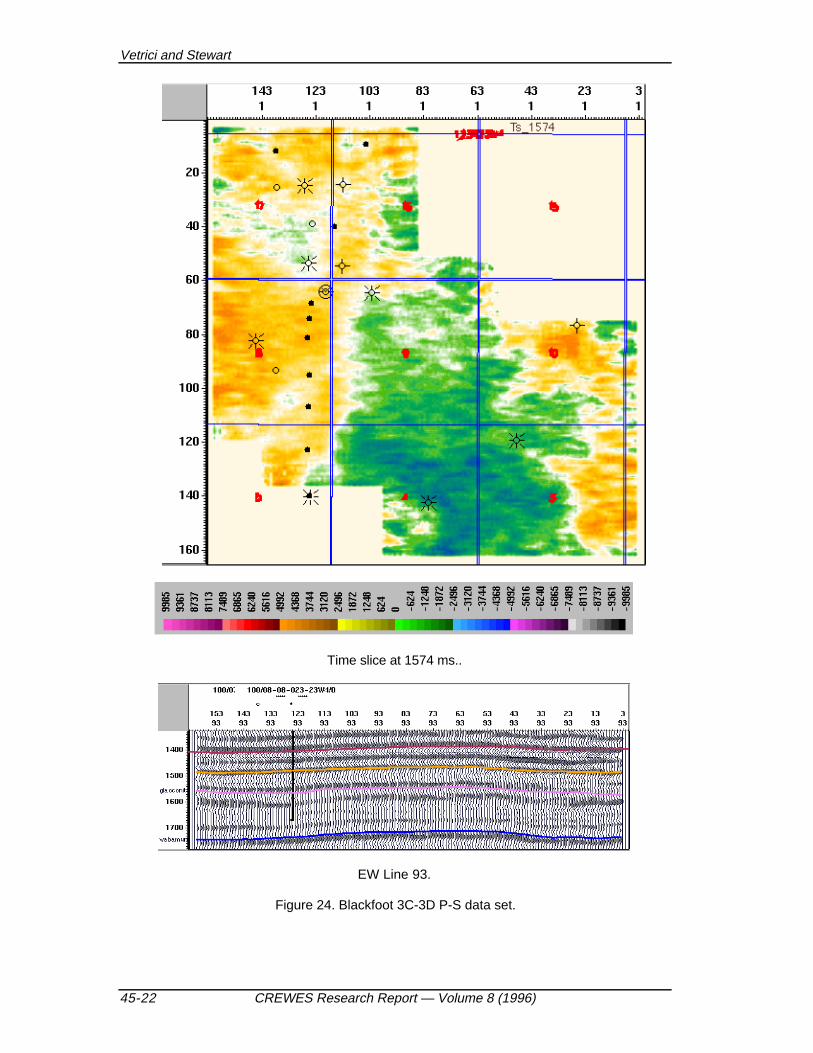
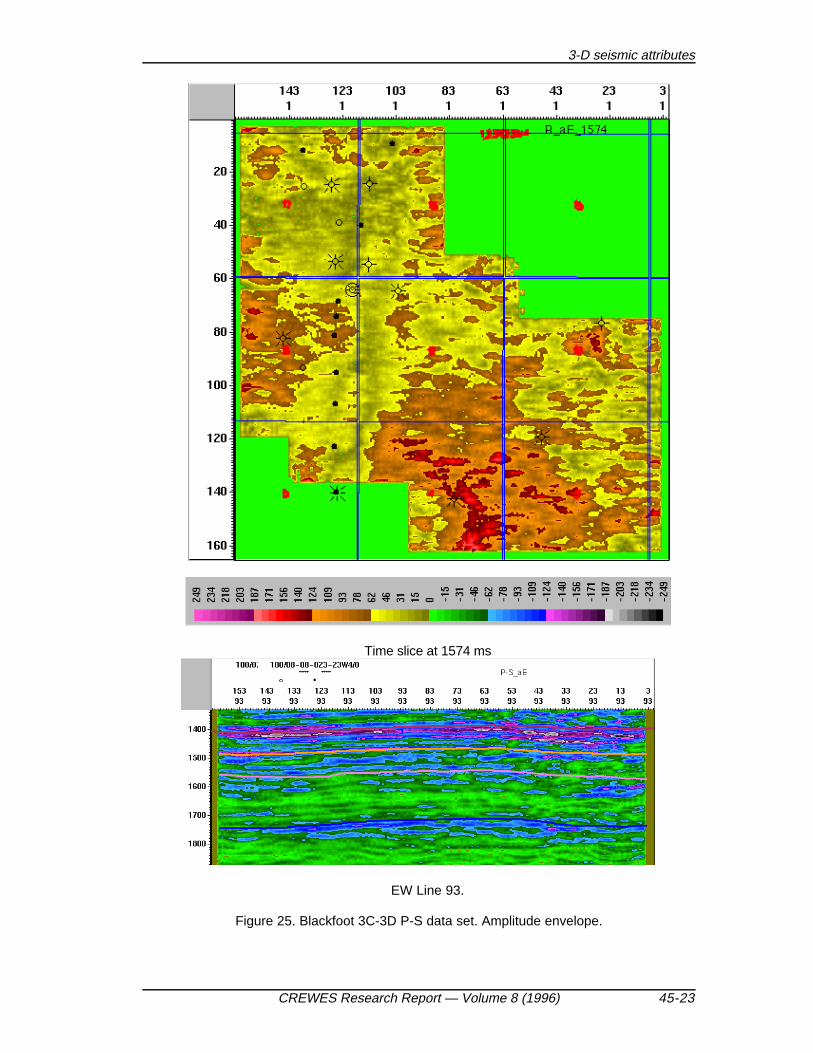
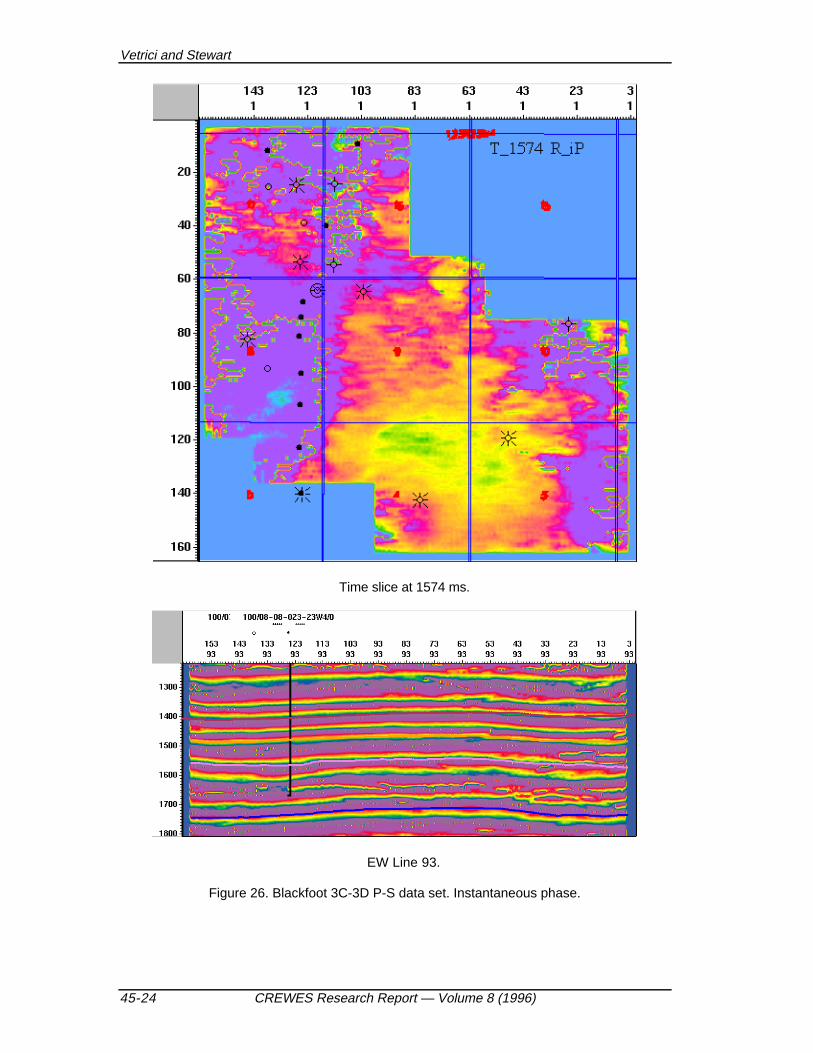
Seismic amplitude, amplitude envelope, instantaneous phase and instantaneousfrequency time slices within Glauconitic, and their vertical section on EW Line 93, areillustrated in Figures 20 to 27. The channel intercepted with 8-8-23-23 W4M wellappears distinct on all eight displays.
Vetrici and Stewart
45-18 CREWES Research Report — Volume 8 (1996)
Time slice at 1058 ms
EW Line 93.
Figure 20. Blackfoot 3C-3D P-P data set. Seismic amplitude within Glauconitic.
3-D seismic attributes
CREWES Research Report — Volume 8 (1996) 45-19
Time slice at 1058 ms.
EW Line 93.
Figure 21. Blackfoot 3C-3D P-P data set. Amplitude envelope.
Vetrici and Stewart
45-20 CREWES Research Report — Volume 8 (1996)
Time slice at 1574 ms.
EW Line 93.
Figure 22. Blackfoot 3C-3D P-P data set. Instantaneous phase.
3-D seismic attributes
CREWES Research Report — Volume 8 (1996) 45-21
Time slice at 1574 ms
EW Line 93.
Figure 23. Blackfoot 3C-3D P-P data set. Instantaneous frequency.
Vetrici and Stewart
45-22 CREWES Research Report — Volume 8 (1996)
Time slice at 1574 ms..
EW Line 93.
Figure 24. Blackfoot 3C-3D P-S data set.
3-D seismic attributes
CREWES Research Report — Volume 8 (1996) 45-23
Time slice at 1574 ms
EW Line 93.
Figure 25. Blackfoot 3C-3D P-S data set. Amplitude envelope.
Vetrici and Stewart
45-24 CREWES Research Report — Volume 8 (1996)
Time slice at 1574 ms.
EW Line 93.
Figure 26. Blackfoot 3C-3D P-S data set. Instantaneous phase.
3-D seismic attributes
CREWES Research Report — Volume 8 (1996) 45-25
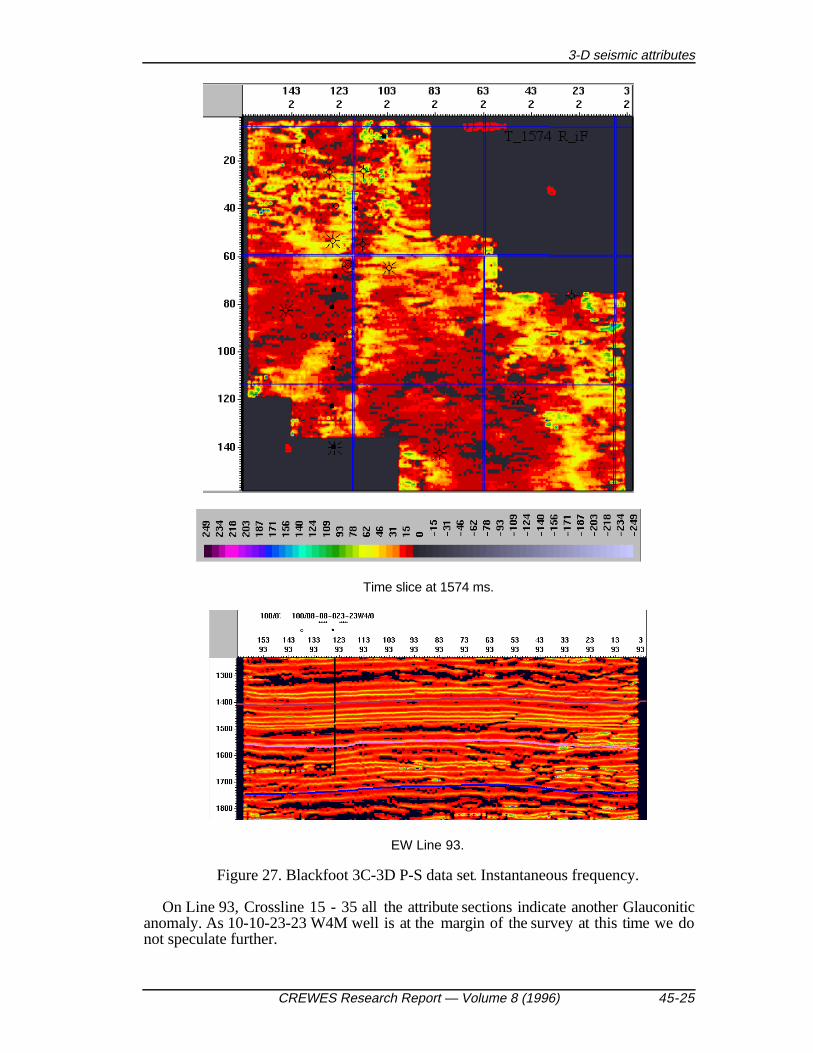
Time slice at 1574 ms.
EW Line 93.
Figure 27. Blackfoot 3C-3D P-S data set. Instantaneous frequency.
On Line 93, Crossline 15 - 35 all the attribute sections indicate another Glauconiticanomaly. As 10-10-23-23 W4M well is at the margin of the survey at this time we donot speculate further.
Vetrici and Stewart
45-26 CREWES Research Report — Volume 8 (1996)
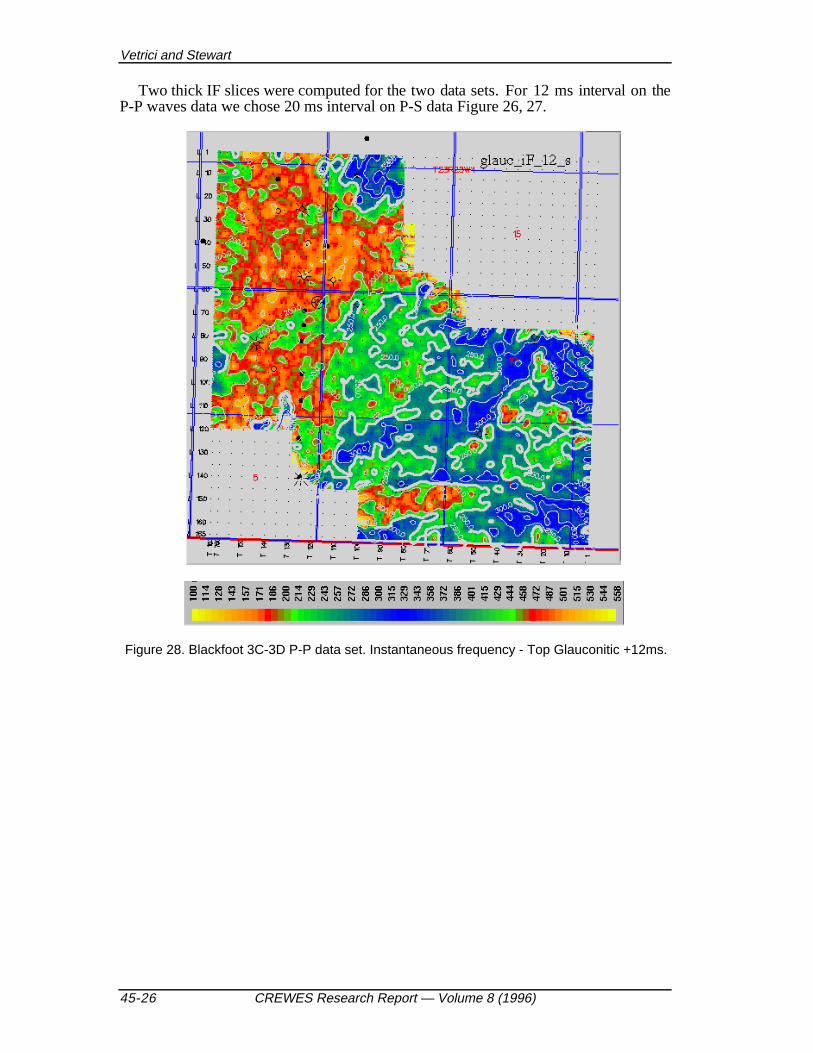
Two thick IF slices were computed for the two data sets. For 12 ms interval on theP-P waves data we chose 20 ms interval on P-S data Figure 26, 27.
Figure 28. Blackfoot 3C-3D P-P data set. Instantaneous frequency - Top Glauconitic +12ms.
3-D seismic attributes
CREWES Research Report — Volume 8 (1996) 45-27
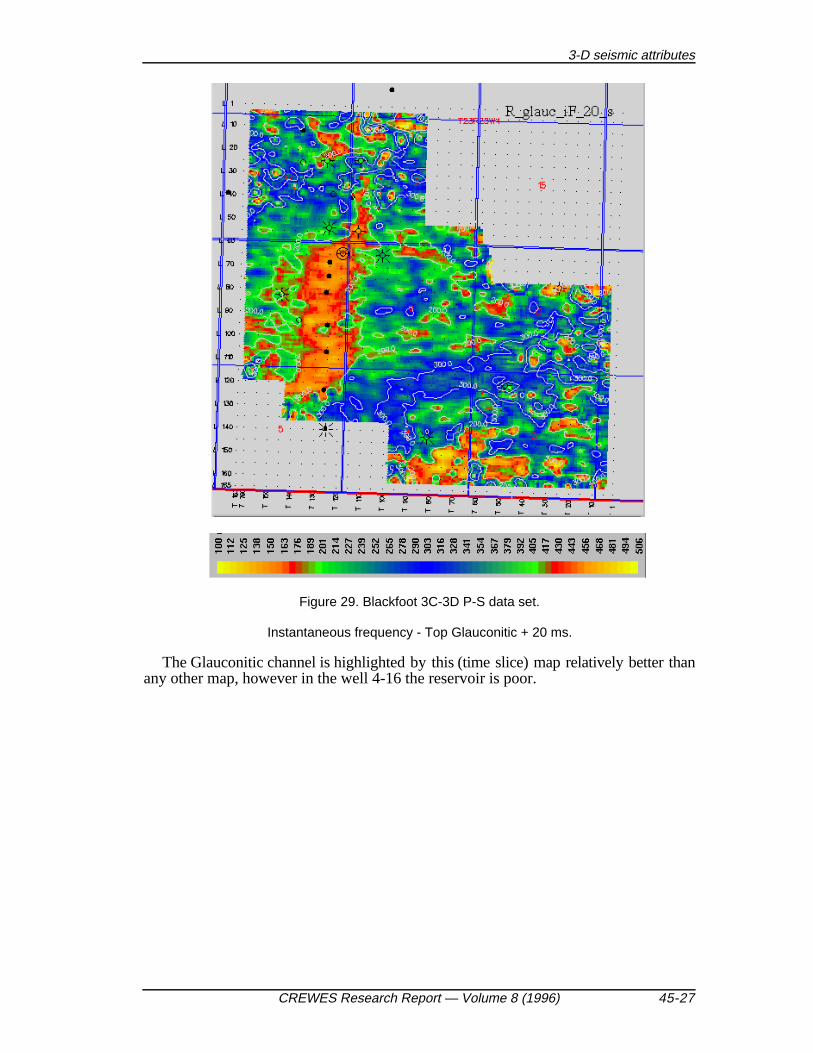
Figure 29. Blackfoot 3C-3D P-S data set.
Instantaneous frequency - Top Glauconitic + 20 ms.
The Glauconitic channel is highlighted by this (time slice) map relatively better thanany other map, however in the well 4-16 the reservoir is poor.
Vetrici and Stewart
45-28 CREWES Research Report — Volume 8 (1996)
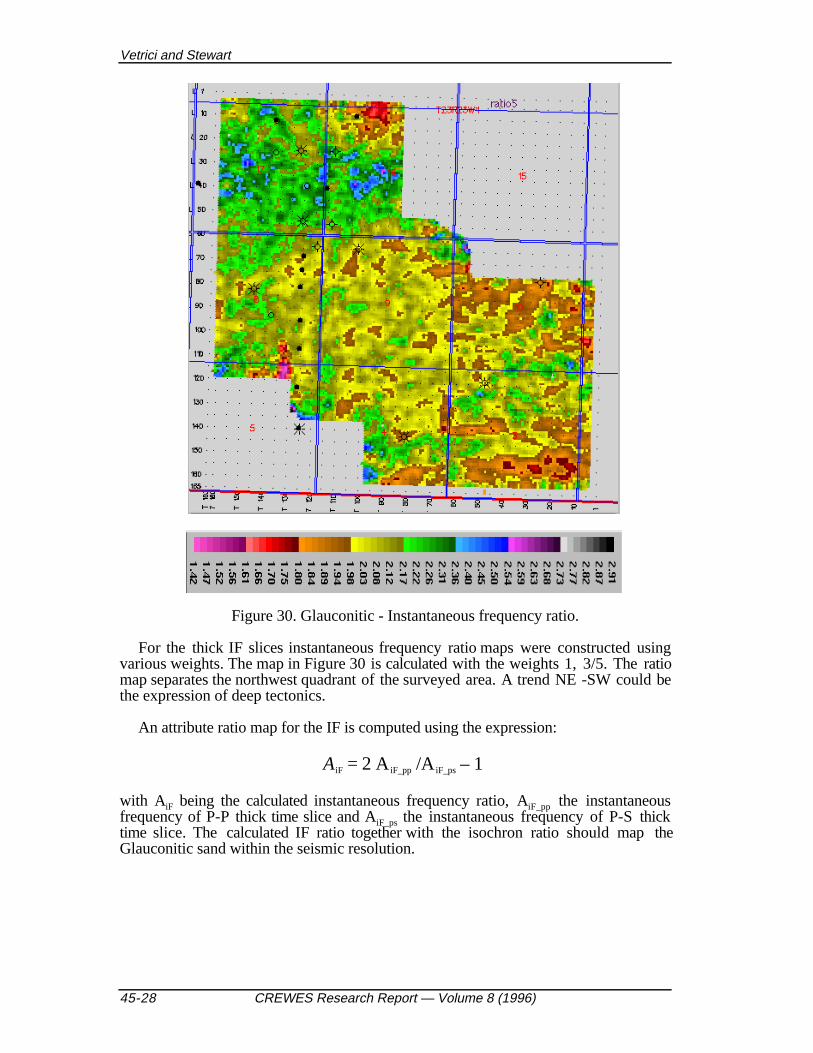
Figure 30. Glauconitic - Instantaneous frequency ratio.
For the thick IF slices instantaneous frequency ratio maps were constructed usingvarious weights. The map in Figure 30 is calculated with the weights 1, 3/5. The ratiomap separates the northwest quadrant of the surveyed area. A trend NE -SW could bethe expression of deep tectonics.
An attribute ratio map for the IF is computed using the expression:
AiF = 2 AiF_pp /AiF_ps – 1
with AiF being the calculated instantaneous frequency ratio, AiF_pp the instantaneousfrequency of P-P thick time slice and AiF_ps the instantaneous frequency of P-S thicktime slice. The calculated IF ratio together with the isochron ratio should map theGlauconitic sand within the seismic resolution.
3-D seismic attributes
CREWES Research Report — Volume 8 (1996) 45-29
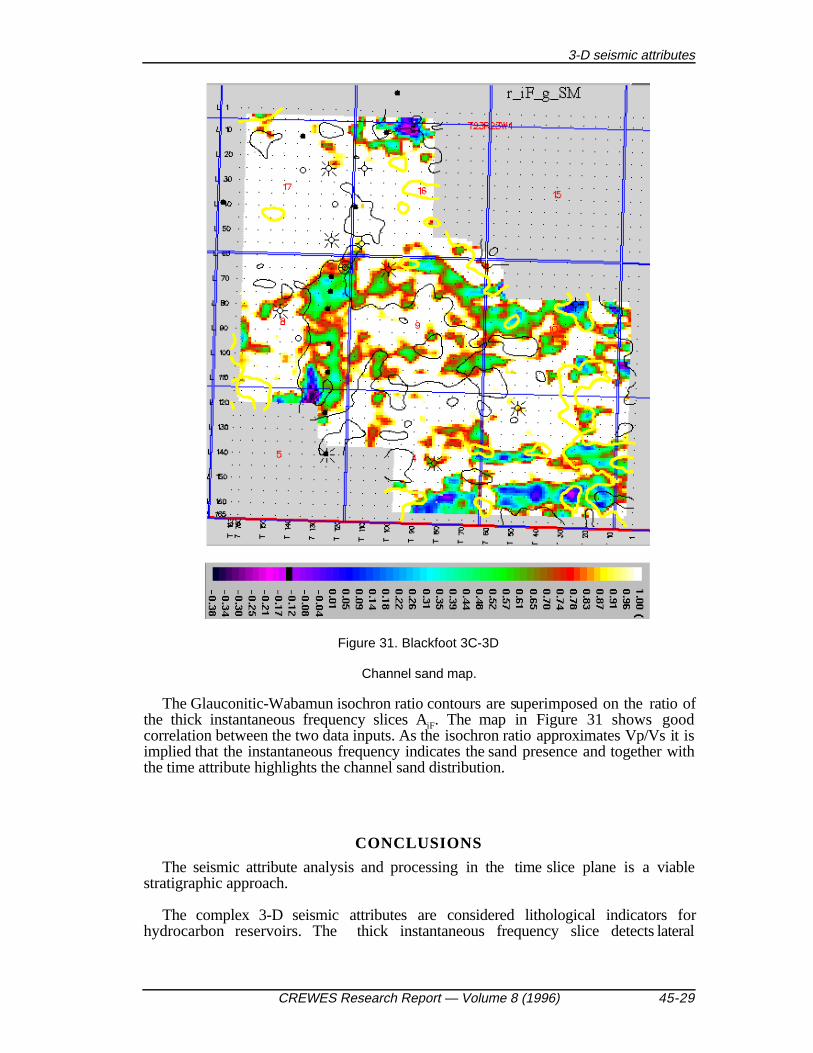
Figure 31. Blackfoot 3C-3D
Channel sand map.
The Glauconitic-Wabamun isochron ratio contours are superimposed on the ratio ofthe thick instantaneous frequency slices AiF. The map in Figure 31 shows goodcorrelation between the two data inputs. As the isochron ratio approximates Vp/Vs it isimplied that the instantaneous frequency indicates the sand presence and together withthe time attribute highlights the channel sand distribution.
CONCLUSIONS
The seismic attribute analysis and processing in the time slice plane is a viablestratigraphic approach.
The complex 3-D seismic attributes are considered lithological indicators forhydrocarbon reservoirs. The thick instantaneous frequency slice detects lateral
Vetrici and Stewart
45-30 CREWES Research Report — Volume 8 (1996)
lithological changes and quantitative evaluation might be experimented with detailedwell control.
The benefits of 3-C 3-D data sets are promising. Seismic attributes extracted from P-P and P-S seismic data appear to correlate with lithologies.
The ratio of instantaneous frequency thick slices chosen carefully can be used to mapcalitatively different rock parameters, in this example sand.
Color selection is critical in enhancing subtle features.
Large volume of data computed for surveys like Blackfoot require modern computertechnologies, large disk storage and intense analysis.
ACKNOWLEDGMENTS
We thank Mobil Oil Canada for providing the 3-D seismic survey and reservoir data;PanCandian Petroleum for the 3-D seismic survey and technical assistance, and theDepartment of Geophysics for facilities, understanding and patience.
REFERENCES
Ball, G. H., and Hall, D. J.,1965, A novel method of data analysis and pattern classification: StandfordResearch Institute, Menlo Park, California.
Billingsley, P., 1986, Probability and measure, John Wiley & Sons.Bracewell, R. N., 1965, The Fourier Transform and Its Applications, New York, McGraw-Hill, 268-
71.Brown, A. R., 1991, Color, character and zero-phaseness: Interpretation of 3-dimensional seismic data,
AAPG Memoir 42, 21-41.Clarkson, M. P., and Stark, H., 1995, Signal processing methods for audio, images and
telecommunications, Academic Press.Collins, J. F.and Lake, J. H., 1989, Sierra reef Complex, British Columbia, Memoir 13, CSPG, 414-
421.Gonzales, R. C., and Woods, R. E., 1993, Image restoration: Digital image processing, Addison-
Wesley.Hilterman, F., 1989, Is AVO the seismic signature of rock properties?: 59 th Ann. Internat. Mtg.,
Soc. Expl. Geophys., Expanded Abstracts, 559.Phipps, G., 1982, Exploring for dolomitized Slave Point carbonates in northeastern British Columbia:
JCSEG 18, 7-13.Richards, J. A., 1993, Remote sensing digital image analysis, An introduction, Springer Verlag.Tanner, M. T., Sheriff, R. E., Koehler, F. and Frye, D., 1976 Extraction and interpretation of complex
seismic trace , 46th Ann. Mtg. Soc. Exploration Geophys.., Houston.Torrie, J. E., 1973, Northeastern British Columbia, Future Petroleum Provinces of Canada, Memoir 1,
CSPG, 151-186.Yilmaz, O., 1988, 2-D surface processing: Seismic data processing, SEG, 491-495.