2q09 results presentation
TRANSCRIPT

Presentation of 2Q09 and 6M09 Results
August 14th , 2009
2
The 2Q09 results were prepared in compliance with Law 11,638/2007 and Provisional Measure
449/2008.
As allowed by CVM through its Circular CVM/SNC/SEP 02/2009, the information of 2Q08 presented together with the information of 2Q09 was not adjusted for comparison purposes pursuant to said
Law and Provisional Measure.
2Q09 and 6M09 Results Presentation

Agenda
• Recent Events
• Financial Highlights
• Financial Results
3

Recent Events
4
• The Board of Directors Meeting held on August, 13 th approved the payment of dividends amounting to R$ 20.0 million or approximately R$ 0.30 per share.
• Payment will be made on August 24th based on the shareholder base on August, 13th .
Approval of Dividend Payment
5
Financial Highlights – 2Q09 and 6M09
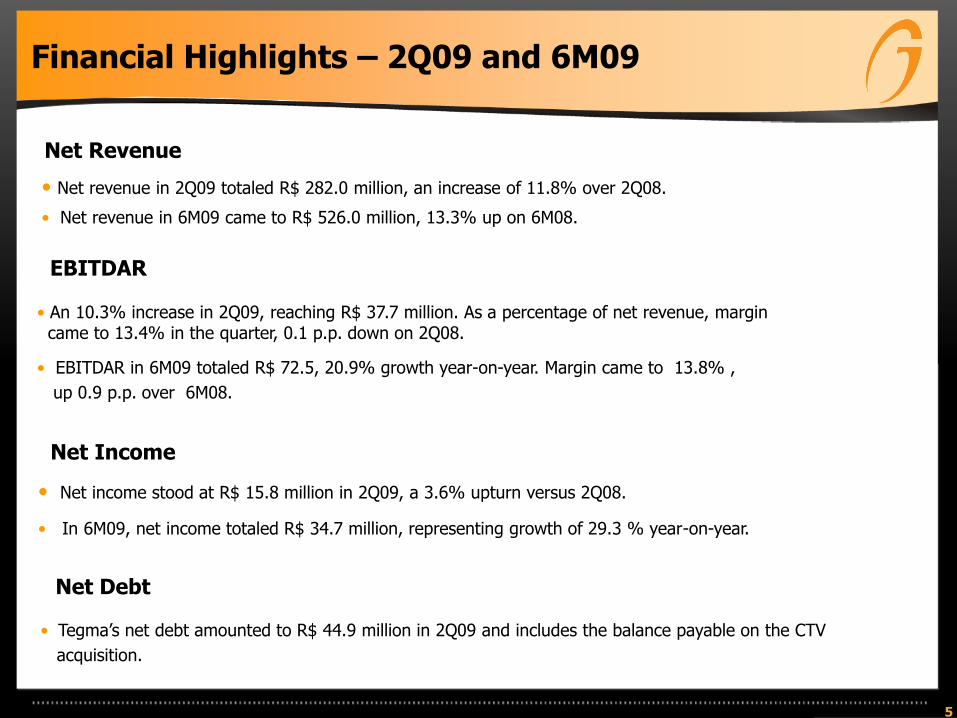
• Net revenue in 2Q09 totaled R$ 282.0 million, an increase of 11.8% over 2Q08.
• Net revenue in 6M09 came to R$ 526.0 million, 13.3% up on 6M08.
• An 10.3% increase in 2Q09, reaching R$ 37.7 million. As a percentage of net revenue, margin came to 13.4% in the quarter, 0.1 p.p. down on 2Q08.
• EBITDAR in 6M09 totaled R$ 72.5, 20.9% growth year-on-year. Margin came to 13.8% ,
up 0.9 p.p. over 6M08.
Net Revenue
EBITDAR
• Net income stood at R$ 15.8 million in 2Q09, a 3.6% upturn versus 2Q08.
• In 6M09, net income totaled R$ 34.7 million, representing growth of 29.3 % year-on-year.
Net Income
Net Debt
• Tegma’s net debt amounted to R$ 44.9 million in 2Q09 and includes the balance payable on the CTV
acquisition.
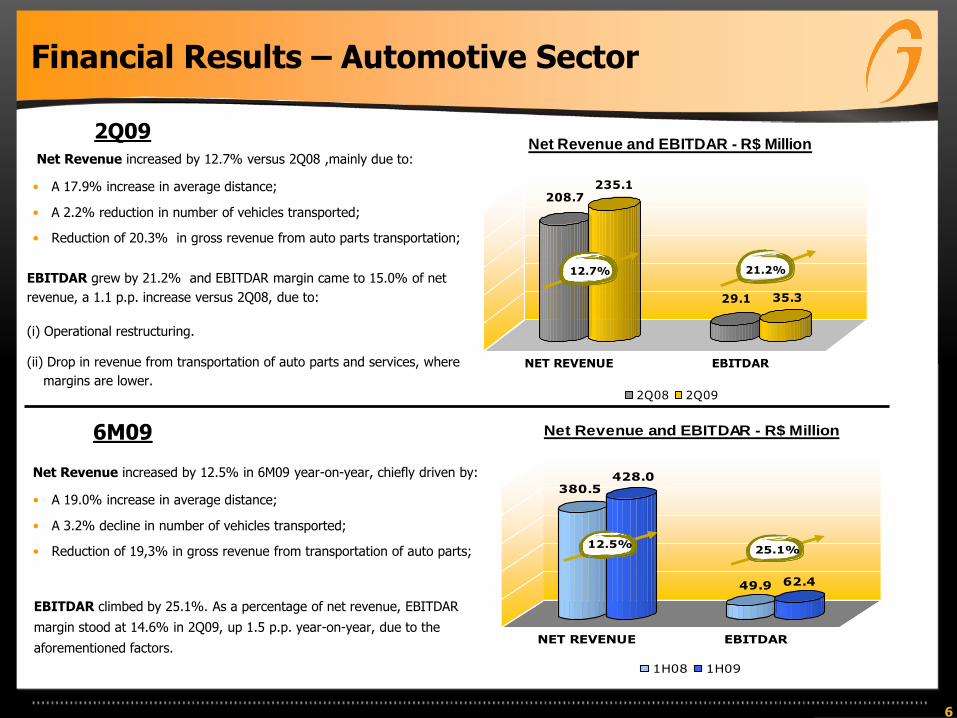
380.5428.0
49.9 62.4
NET REVENUE EBITDAR
Net Revenue and EBITDAR - R$ Million
1H08 1H09
12.5%25.1%
208.7235.1
29.1 35.3
NET REVENUE EBITDAR
Net Revenue and EBITDAR - R$ Million
2Q08 2Q09
12.7% 21.2%
6
Financial Results – Automotive Sector
Net Revenue increased by 12.7% versus 2Q08 ,mainly due to:
• A 17.9% increase in average distance;
• A 2.2% reduction in number of vehicles transported;
• Reduction of 20.3% in gross revenue from auto parts transportation;
6M09
2Q09
EBITDAR grew by 21.2% and EBITDAR margin came to 15.0% of net
revenue, a 1.1 p.p. increase versus 2Q08, due to:
(i) Operational restructuring.
(ii) Drop in revenue from transportation of auto parts and services, where
margins are lower.
EBITDAR climbed by 25.1%. As a percentage of net revenue, EBITDAR
margin stood at 14.6% in 2Q09, up 1.5 p.p. year-on-year, due to the
aforementioned factors.
Net Revenue increased by 12.5% in 6M09 year-on-year, chiefly driven by:
• A 19.0% increase in average distance;
• A 3.2% decline in number of vehicles transported;
• Reduction of 19,3% in gross revenue from transportation of auto parts;

83.8
98.0
10.0 10.0
NET REVENUE EBITDAR
Net Revenue and EBITDAR - R$ Million
1H08 1H09
17.0% 0.0%
43.746.9
5.1 2.4
NET REVENUE EBITDAR
Net Revenue and EBITDAR - R$ Million
2Q08 2Q09
7.3%-52.2%
7
Financial Results – Other Sectors
2Q09
6M09
Net revenue in 6M09 climbed by 17.0%, with the transportation segment
increasing by 27.3% and logistics services by 8.3%.
2Q09 EBITDAR totaled R$ 10.0 million, remaining stable compared to 6M08.
In relation to net revenue, EBITDAR margin stood at 10.2%, 1.8 p.p. down
year-on-year due to the impact of the above-mentioned reasons in the
second quarter.
A 7.3% increase in Net Revenue over 2Q08, mainly due to
the 16.8% increase in Gross Revenue from transportation, with the
highlights being:
• A 100% increase (approx. R$ 6.0 million) in gross revenue from fuel
transportation;
• A 16.5% drop in gross revenue from transportation of orange juice.
A 6.2% fall in gross revenue from logistics services due to the reduction in storage volume at Porto Seco de Cariacica in Espírito Santo state.
A 52.2% fall in EBITDAR on account of the lower dilution of fixed costs (due to the higher usage of proprietary assets on this segment). EBITDAR margin was 5.2% of net revenue, a 6.4 p.p. reduction from 2Q08.

8
Financial Results – Consolidated Net Revenue
• Consolidated net revenue climbed by 11.8% versus 2Q08, with the Automotive Sector increasing by 12.7% and Other Sectors by 7.3% .
• In 6M09, consolidated net revenue totaled R$ 526.0 million, a 13.3% increase year-on-year. The automotive Sector grew by 12.5%, while revenue from other sectors increased by 17.0% in the period.
252.4282.0
464.3
526.0
Net Revenue - R$ Million
13.3%
11.8%
2Q08 2Q09 1H08 1H09
9
Financial Results – Consolidated EBITDAR
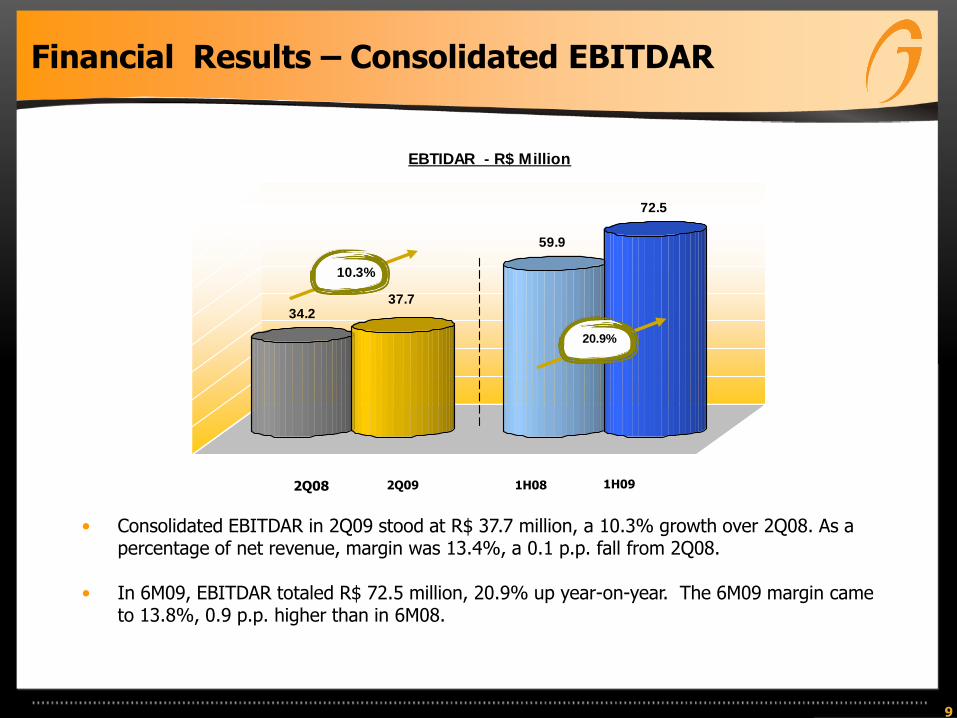
• Consolidated EBITDAR in 2Q09 stood at R$ 37.7 million, a 10.3% growth over 2Q08. As a percentage of net revenue, margin was 13.4%, a 0.1 p.p. fall from 2Q08.
• In 6M09, EBITDAR totaled R$ 72.5 million, 20.9% up year-on-year. The 6M09 margin came to 13.8%, 0.9 p.p. higher than in 6M08.
34.237.7
59.9
72.5
EBTIDAR - R$ Million
20.9%
10.3%
2Q08 2Q09 1H08 1H09

10
Financial Results – Consolidated Net Income
• Net income totaled R$ 15.8 million in 2Q09, 3.6% up on 2Q08.
• Consolidated net income came to R$ 34.7 million in 6M09, a 29.3% increase year-on-year.
15.3 15.8
26.9
34.7
Consolidated Net Income - R$ Million
29.3%
3.6%
2Q08 2Q09 1H08 1H09
Financial Results – Cash and Debt Balances
11
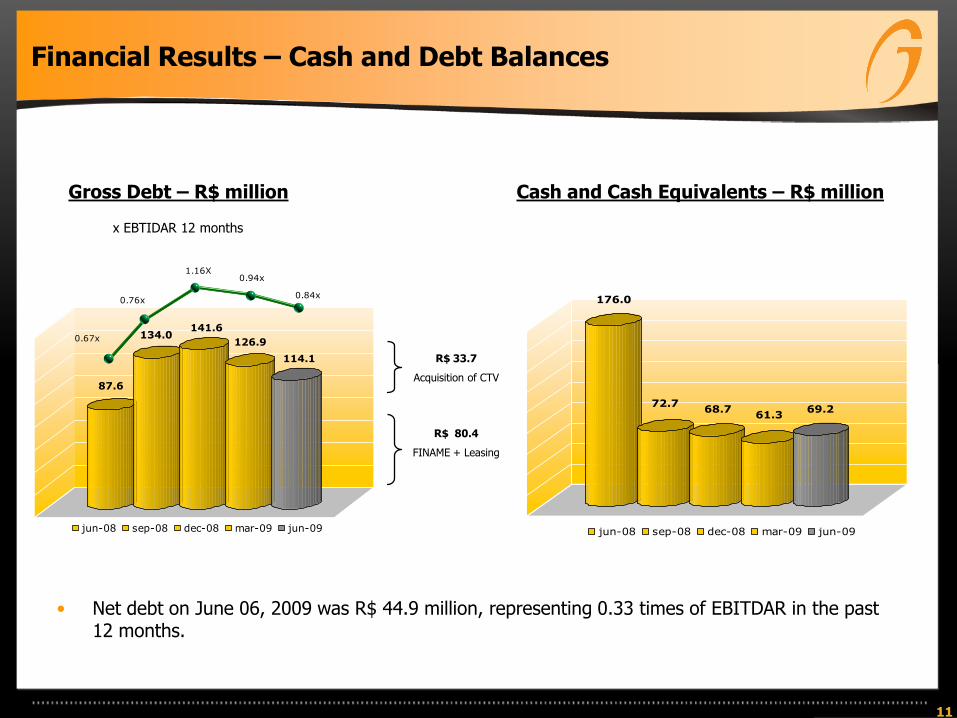
Cash and Cash Equivalents – R$ millionGross Debt – R$ million
x EBTIDAR 12 months
87.6
134.0 141.6
126.9
114.1
jun-08 sep-08 dec-08 mar-09 jun-09
0.67x
0.76x
1.16X
0.84x
0.94x
176.0
72.7 68.7
61.3 69.2
jun-08 sep-08 dec-08 mar-09 jun-09
R$ 33.7
Acquisition of CTV
R$ 80.4
FINAME + Leasing
• Net debt on June 06, 2009 was R$ 44.9 million, representing 0.33 times of EBITDAR in the past 12 months.

IR Contacts
Alexandre Brandão
+55 (11) 4346-2532
Hugo Zierth
+55 (11) 4346-2532
12
13
The forward-looking statements contained in this presentation are subject to risks anduncertainties. These are based on beliefs and assumptions of our Management and informationcurrently available to the Company. Such statements include information about our currentintentions, beliefs or expectations, as well as those of our Board of Directors and Board ofExecutive Officers.
The reservations concerning forward-looking statements also apply to information aboutpossible or presumed operating results, as well as declarations preceded by, including orfollowed by such words as "believe", "may", "will", "continue", "expect", "foresee", "intend","plan", "estimate" and other similar expressions.
Forward-looking statements do not constitute a guarantee of performance. Since they refer tothe future, they depend on circumstances that may or may not occur and are therefore subjectto risks, uncertainties and assumptions. Future results and creation of shareholder value maydiffer substantially from those expressed or suggested by the forward-looking statements. Manyfactors that may influence these results are beyond TEGMA’s control or expectations.