2d codes step by step - barcode test · 2d codes step by step connecting the dots to understand the...
TRANSCRIPT
1 ©2014 Barcode-Test LLC
2D Codes Step By Step
Connecting the Dots to
Understand the Verification Report
www.barcode-test.com
630-235-6077
© 2014 Barcode-Test LLC
2 ©2014 Barcode-Test LLC
Table of Contents
Introduction 3
2D Code Uses: A Pictorial Review 8
Getting Oriented to 2D Symbologies 11
Getting to Know QR Code 14
Getting to Know Data Matrix Code 19
Decoding the ISO 15415 Verification Report 25
Interpreting 2D Symbol Scanability from Symbol Grade 29
Glossary of Terms 31
Resources 34
3 ©2014 Barcode-Test LLC
Introduction
This document discusses the print quality of 2D or matrix symbols based on the
ISO 15415 specification. Because of their popularity, we will focus only on QR
Code and Data Matrix Code. There are other 2D symbols in current use, including
Aztec, MaxiCode (UPS Code) and Postnet/IMB.
Let’s be clear about nomenclature. A 1D or linear barcode is a series of parallel
lines and spaces of various widths. A 2D symbol is not technically a “barcode”
since it is not consistent with the 1D barcode description; it is therefore more
accurately called a “symbol” or a “matrix symbol” rather than a “barcode”.
This distinction is somewhat blurred by stacked barcodes such as PDF417 and GS1
Databar. One could reasonably argue that they are 2D symbologies. But there is
no “intelligence” in the vertical axis; they are just 1D barcodes stacked on top of
each other in rows, like lines of text on a page in a book. Postnet and its cousin,
Intelligent Mail Barcode (IMB) does have a very low level of vertical intelligence
and I therefore considered a 2D symbol.
As the use of 2D symbols has expanded into new and challenging applications,
some quality assessment limitations in the specification for 2D symbols have been
discovered, and additional specifications have been developed to deal with them.
Here is a brief review of some of those specifications, their attributes and
limitations:
ISO 15415 assumes that the QR Code symbol is a high contrast image. This
is a basically valid assumption but unlike Data Matrix Code which is scanned
in 660nm red light, QR Code is usually scanned in a white light environment
by a smart phone, not an ISO compliant industrial type of scanner.
Consequently “contrast” in QR Code is a matter of contrast difference
between the reflective value of the symbol and its background without the
added assumption that the background is the Rmax or highly reflective
value and the symbol is the Rmin or low reflectance value.
ISO 16022 (2000) was adopted by the ISO as a standard in 2000, shortly
after the Data Matrix Code was invented. It defines quality of the imaged

4 ©2014 Barcode-Test LLC
symbol based on a limited number of parameters, making it applicable only
to Data Matrix symbols printed in black on a white background. Although
most Data Matrix codes are printed this way, not all of them are (dot peen,
acid etch and laser ablated for example) which limits the applicability of this
standard
AS9132 is an Aerospace Standard which describes the unique quality
requirements of imaging this symbology on metallic parts. This
specification does not accommodate Direct Part Mark (DPM) lighting and
does not check Decode, Quiet Zone or Unused Error Correction (UEC). See
Glossary.
AIM-DPM forms the technical basis for defining the quality of Data Matrix
Codes marked directly onto the surface of a part—usually a metal part such
as an engine block or subassembly. What is unique about DPM (Direct Part
Mark) technology is the characteristically low contrast difference between
the Data Matrix Code and the substrate. Thus, the AIM-DPM specification
includes a scanning implementation methodology which describes special
scanner lighting to achieve consistent results.
Further complicating this is the creation of “designer” QR Codes where artistic
changes are imposed into the QR Code symbol, often by designers who do not
understand how the symbol works. This can include changing the color of the
symbol, inserting a graphic somewhere inside the symbol, or geometrically
distorting the cells of the symbol. Such modifications can work if they do not
damage the key components or exceed the design (error correction) tolerance of
the symbol structure.
In addition to ISO 15415, ISO 18004 (2006) addresses symbology attributes of the
QR Code having to do with dimensional and other characteristics for usage in
various applications where scanning distances are a consideration: for example, in
print advertising, store front posters or roadway signage.
Dr. Kevin Berisso, Director of the Automatic Identification Lab at University of
Memphis, conducted a study of designer QR Codes and its effect on scanability in
an attempt to answer the question “Can a majority of smart phones scan designer

5 ©2014 Barcode-Test LLC
QR Codes?” The study concluded that there is not a simple answer to this simple
question. But the read rates for the test samples of designer QR Codes used in the
study ranged from 9.6% to 88.6%, implying that at best, 11% of the target
audience will not be able to read designer QR Codes, and that nearly half of the
designer QR Code samples would not be readable by the public.
Follow this link to view the white paper:
http://www.aidc100.org/files/Designer-QR-Code-White-Paper.pdf
6 ©2014 Barcode-Test LLC
The Expanding Importance of Verification
The 1D barcode is 40 years old as of this writing. For most of those 40 years
verification has meant testing and grading the physical quality of the
printed image—things like Symbol Contrast and Modulation as it relates to
bar and space widths and their tolerances. Except for the presence of
dimensionally-correct start and stop patterns and mathematically correct
check digits, little consideration was given to the data encoded in the
barcode. In recent years this has become a more important factor as 1D
barcodes have taken on new roles requiring the encoding of more and
more data.
The venerable UPC symbol is a well known example. It is a string of 12
numerical digits arranged in two parts, the first part representing the brand
owner, the second part representing the product itself. As UPC’s took on
more complicated roles, the amount of encoded data increased through
use of addendum codes: one for book pricing in ISBN codes, another for
simple coupon offers, and another for periodical issue identification, etc.
With more data came the need to arrange the data in a precise sequence
and to conceive of ways to deal with variable data. Today’s GS1 Databar
Stacked Expanded coupon code exemplifies what must be the outer limits
of 1D barcode data capacity and complexity.
The greater data capacity of 2D symbols resolves this limitation of 1D
barcodes but makes the issue of data structure more important. More data
is pointless if it isn’t presented in the correct sequence and format. This has
expanded the role of the verifier from just a checker of the print quality of
the symbol; 2D verifiers are also expected to validate the encoded data, as
some 1D verifiers already do for some barcodes.
For example, at present there over 100 Application Identifiers (AI) that can
be used in GS1 UID symbol structure alone. This includes AI’s for Expiry,
7 ©2014 Barcode-Test LLC
Production Date, GTIN, Batch or Lot, Serial Number. There is a fixed-length
field AI and a variable field length AI. Adding to the confusion, there is
controversy on how to format the date—should it be YYMMDD or
YYYYMMDD? Furthermore there really is no specific barcode standard for
medical device. The GS1 General Specification (Version 14) is a one size fits
all resource at least for now.
2D symbols will play critical roles in food safety, pharmaceutical supply
chain security and anti-counterfeit measures which will rely on the integrity
not only of the data itself but the way in which it is parsed and sequenced
in the symbol. Error correction algorithms such as Reed Solomon do not
correct for mistakes in data structure.
Verification is the only way to test for these critical attributes.
8 ©2014 Barcode-Test LLC
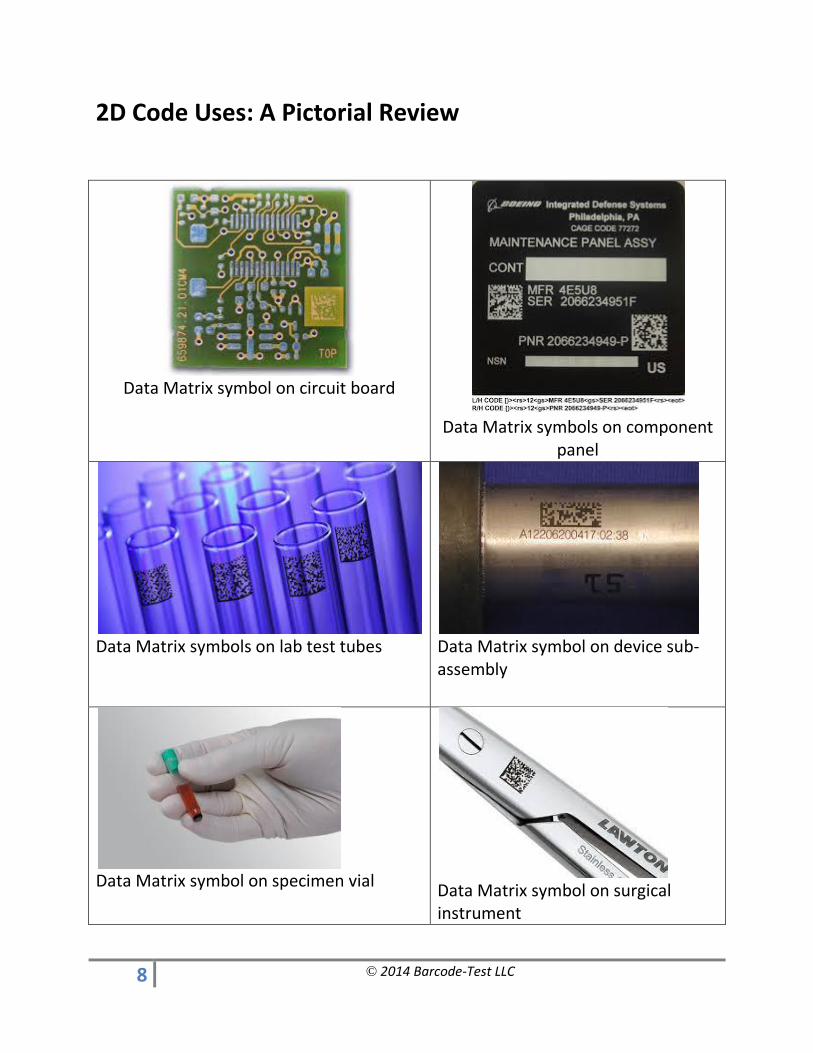
2D Code Uses: A Pictorial Review
Data Matrix symbol on circuit board
Data Matrix symbols on component
panel
Data Matrix symbols on lab test tubes
Data Matrix symbol on device sub-assembly
Data Matrix symbol on specimen vial
Data Matrix symbol on surgical instrument
9 ©2014 Barcode-Test LLC
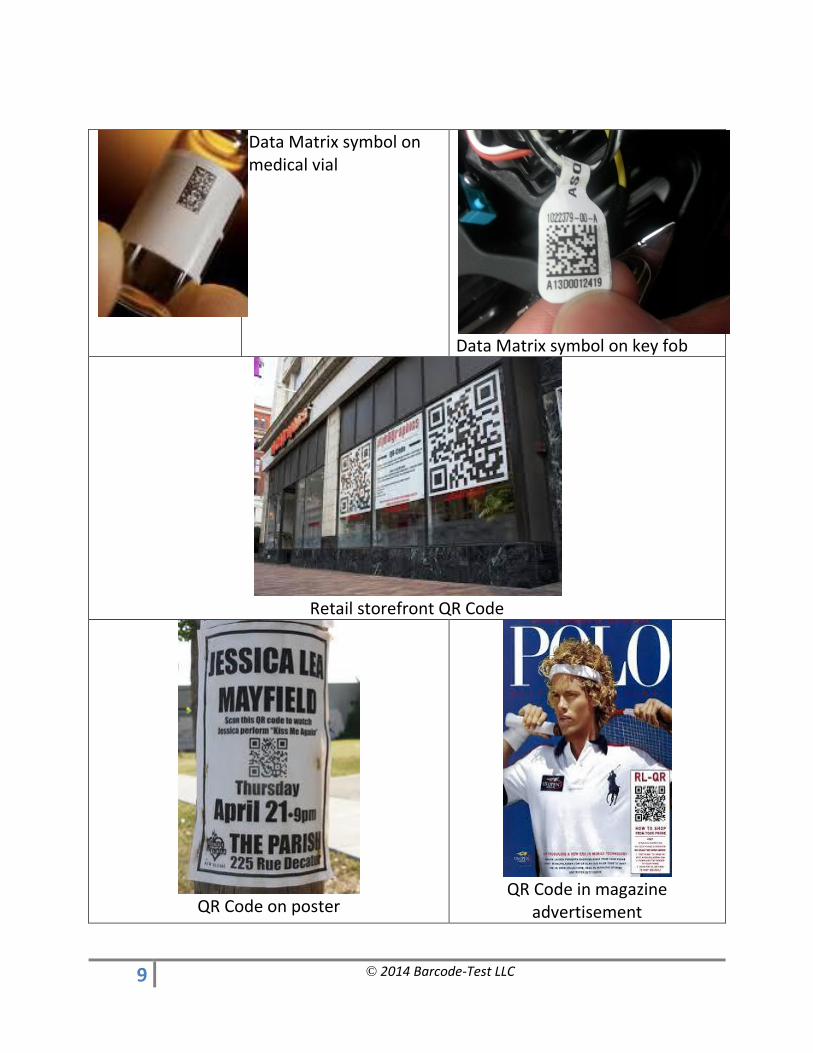
Data Matrix symbol on medical vial
Data Matrix symbol on key fob
Retail storefront QR Code
QR Code on poster
QR Code in magazine
advertisement
10 ©2014 Barcode-Test LLC
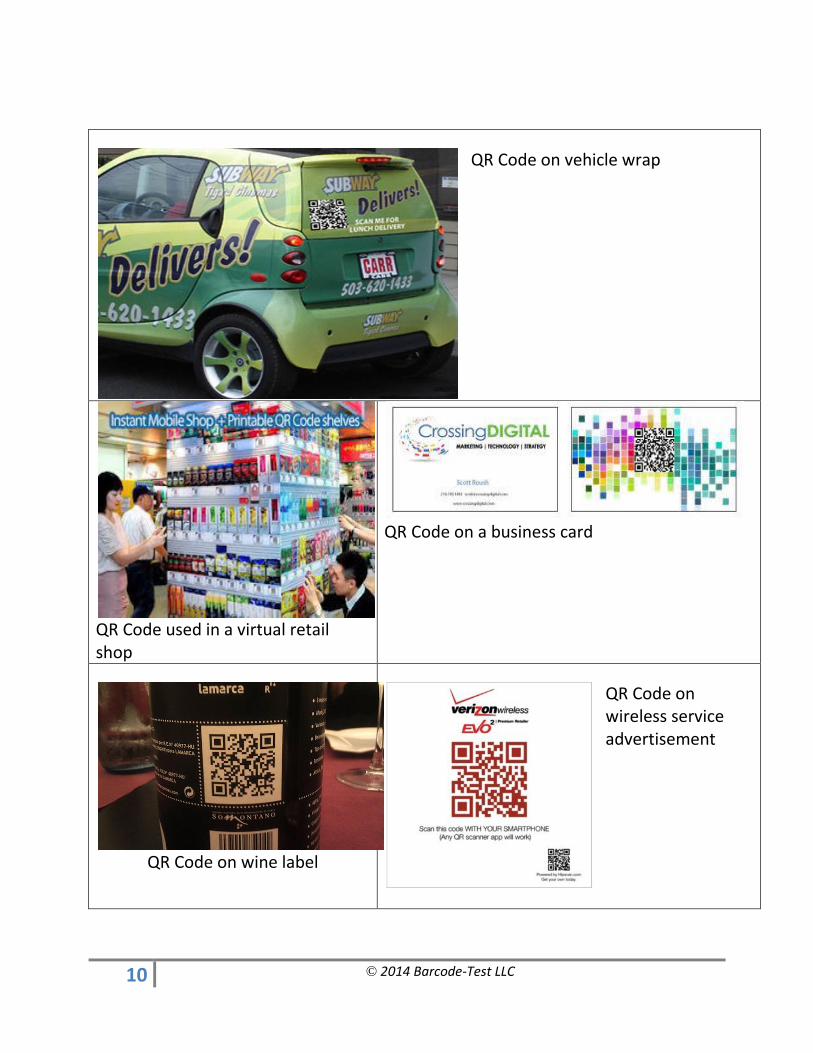
QR Code on vehicle wrap
QR Code used in a virtual retail shop
QR Code on a business card
QR Code on wine label
QR Code on wireless service advertisement
11 ©2014 Barcode-Test LLC
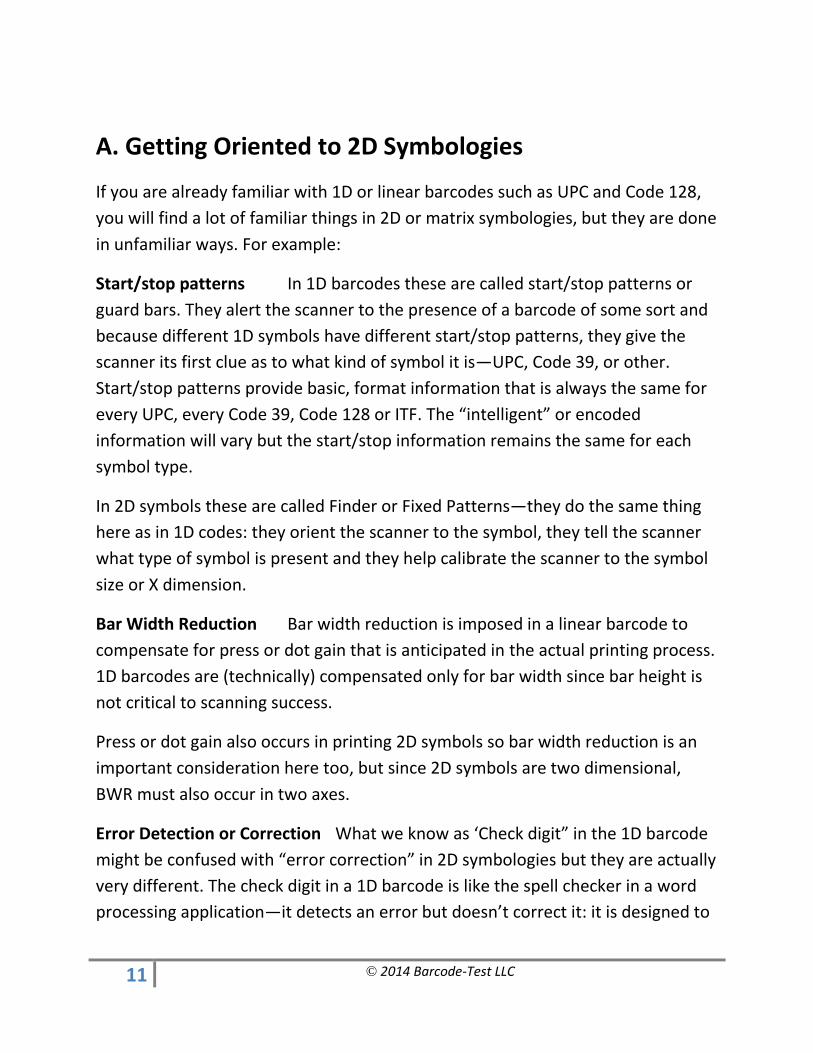
A. Getting Oriented to 2D Symbologies
If you are already familiar with 1D or linear barcodes such as UPC and Code 128,
you will find a lot of familiar things in 2D or matrix symbologies, but they are done
in unfamiliar ways. For example:
Start/stop patterns In 1D barcodes these are called start/stop patterns or
guard bars. They alert the scanner to the presence of a barcode of some sort and
because different 1D symbols have different start/stop patterns, they give the
scanner its first clue as to what kind of symbol it is—UPC, Code 39, or other.
Start/stop patterns provide basic, format information that is always the same for
every UPC, every Code 39, Code 128 or ITF. The “intelligent” or encoded
information will vary but the start/stop information remains the same for each
symbol type.
In 2D symbols these are called Finder or Fixed Patterns—they do the same thing
here as in 1D codes: they orient the scanner to the symbol, they tell the scanner
what type of symbol is present and they help calibrate the scanner to the symbol
size or X dimension.
Bar Width Reduction Bar width reduction is imposed in a linear barcode to
compensate for press or dot gain that is anticipated in the actual printing process.
1D barcodes are (technically) compensated only for bar width since bar height is
not critical to scanning success.
Press or dot gain also occurs in printing 2D symbols so bar width reduction is an
important consideration here too, but since 2D symbols are two dimensional,
BWR must also occur in two axes.
Error Detection or Correction What we know as ‘Check digit” in the 1D barcode
might be confused with “error correction” in 2D symbologies but they are actually
very different. The check digit in a 1D barcode is like the spell checker in a word
processing application—it detects an error but doesn’t correct it: it is designed to
12 ©2014 Barcode-Test LLC
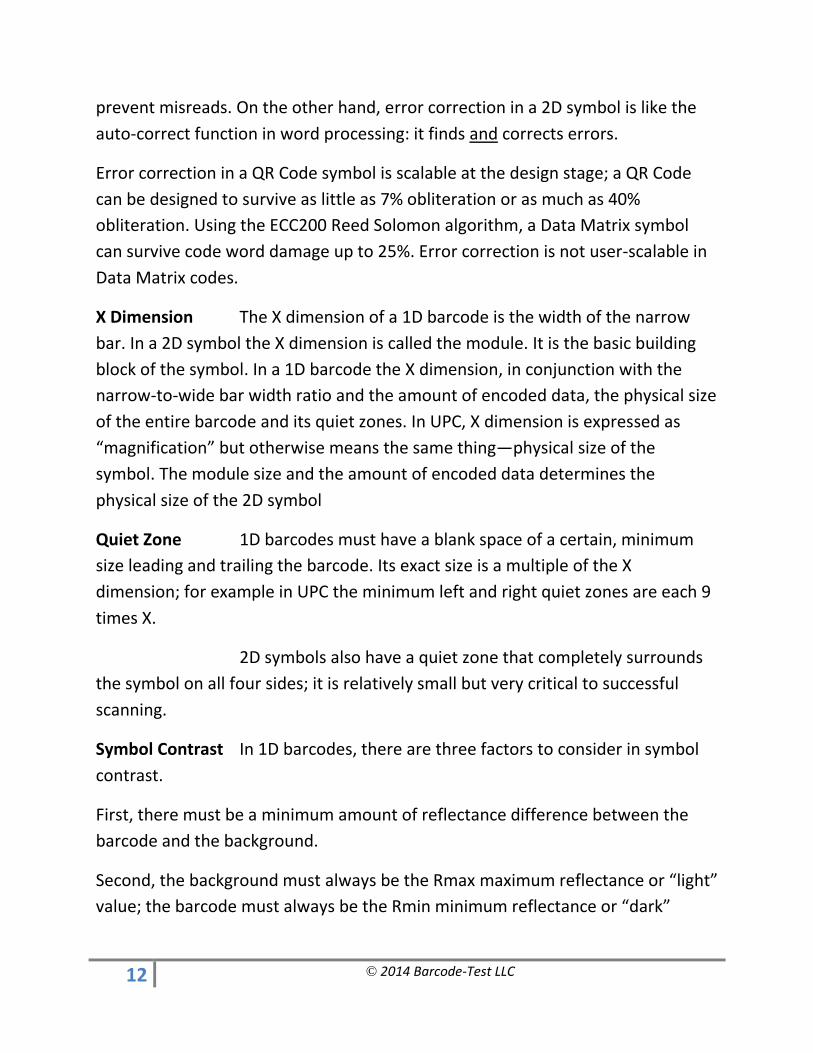
prevent misreads. On the other hand, error correction in a 2D symbol is like the
auto-correct function in word processing: it finds and corrects errors.
Error correction in a QR Code symbol is scalable at the design stage; a QR Code
can be designed to survive as little as 7% obliteration or as much as 40%
obliteration. Using the ECC200 Reed Solomon algorithm, a Data Matrix symbol
can survive code word damage up to 25%. Error correction is not user-scalable in
Data Matrix codes.
X Dimension The X dimension of a 1D barcode is the width of the narrow
bar. In a 2D symbol the X dimension is called the module. It is the basic building
block of the symbol. In a 1D barcode the X dimension, in conjunction with the
narrow-to-wide bar width ratio and the amount of encoded data, the physical size
of the entire barcode and its quiet zones. In UPC, X dimension is expressed as
“magnification” but otherwise means the same thing—physical size of the
symbol. The module size and the amount of encoded data determines the
physical size of the 2D symbol
Quiet Zone 1D barcodes must have a blank space of a certain, minimum
size leading and trailing the barcode. Its exact size is a multiple of the X
dimension; for example in UPC the minimum left and right quiet zones are each 9
times X.
2D symbols also have a quiet zone that completely surrounds
the symbol on all four sides; it is relatively small but very critical to successful
scanning.
Symbol Contrast In 1D barcodes, there are three factors to consider in symbol
contrast.
First, there must be a minimum amount of reflectance difference between the
barcode and the background.
Second, the background must always be the Rmax maximum reflectance or “light”
value; the barcode must always be the Rmin minimum reflectance or “dark”
13 ©2014 Barcode-Test LLC
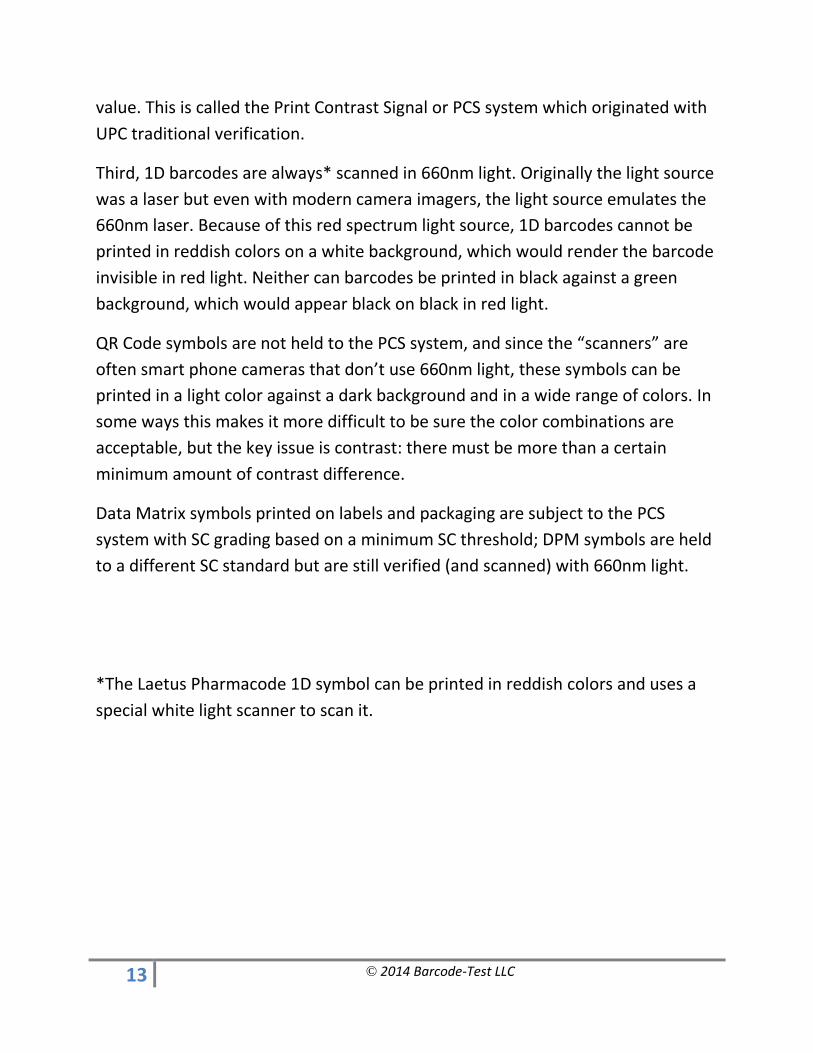
value. This is called the Print Contrast Signal or PCS system which originated with
UPC traditional verification.
Third, 1D barcodes are always* scanned in 660nm light. Originally the light source
was a laser but even with modern camera imagers, the light source emulates the
660nm laser. Because of this red spectrum light source, 1D barcodes cannot be
printed in reddish colors on a white background, which would render the barcode
invisible in red light. Neither can barcodes be printed in black against a green
background, which would appear black on black in red light.
QR Code symbols are not held to the PCS system, and since the “scanners” are
often smart phone cameras that don’t use 660nm light, these symbols can be
printed in a light color against a dark background and in a wide range of colors. In
some ways this makes it more difficult to be sure the color combinations are
acceptable, but the key issue is contrast: there must be more than a certain
minimum amount of contrast difference.
Data Matrix symbols printed on labels and packaging are subject to the PCS
system with SC grading based on a minimum SC threshold; DPM symbols are held
to a different SC standard but are still verified (and scanned) with 660nm light.
*The Laetus Pharmacode 1D symbol can be printed in reddish colors and uses a
special white light scanner to scan it.
14 ©2014 Barcode-Test LLC
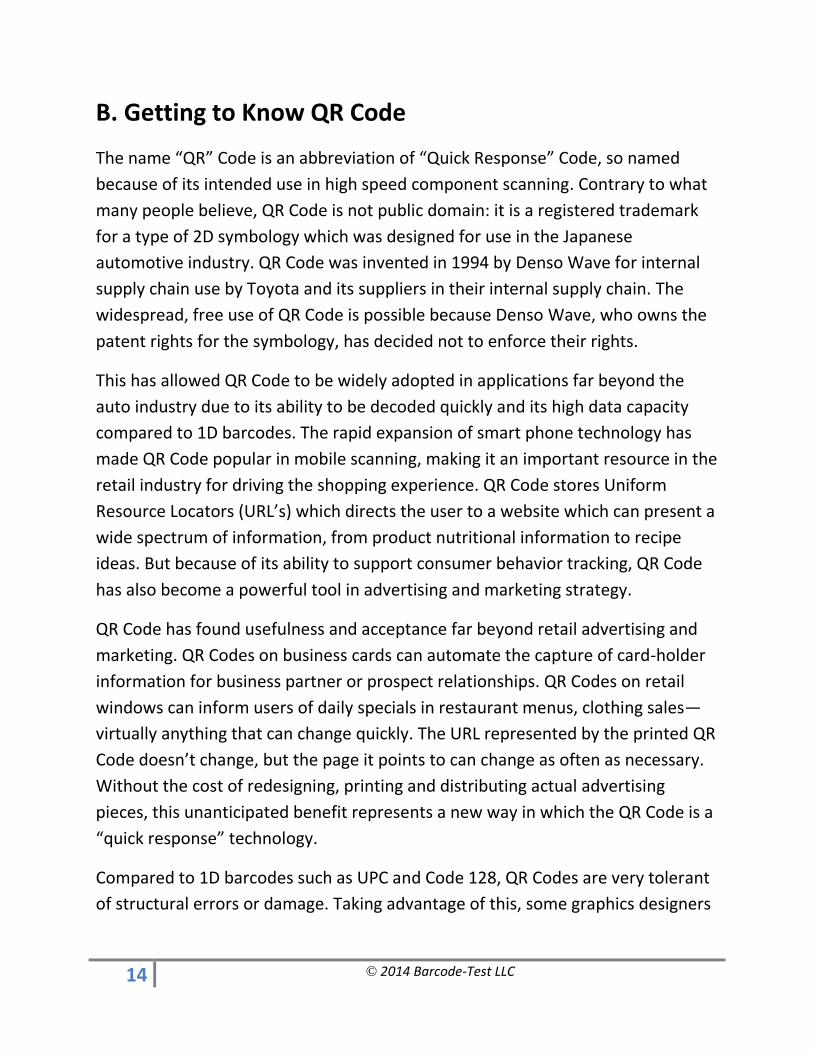
B. Getting to Know QR Code
The name “QR” Code is an abbreviation of “Quick Response” Code, so named
because of its intended use in high speed component scanning. Contrary to what
many people believe, QR Code is not public domain: it is a registered trademark
for a type of 2D symbology which was designed for use in the Japanese
automotive industry. QR Code was invented in 1994 by Denso Wave for internal
supply chain use by Toyota and its suppliers in their internal supply chain. The
widespread, free use of QR Code is possible because Denso Wave, who owns the
patent rights for the symbology, has decided not to enforce their rights.
This has allowed QR Code to be widely adopted in applications far beyond the
auto industry due to its ability to be decoded quickly and its high data capacity
compared to 1D barcodes. The rapid expansion of smart phone technology has
made QR Code popular in mobile scanning, making it an important resource in the
retail industry for driving the shopping experience. QR Code stores Uniform
Resource Locators (URL’s) which directs the user to a website which can present a
wide spectrum of information, from product nutritional information to recipe
ideas. But because of its ability to support consumer behavior tracking, QR Code
has also become a powerful tool in advertising and marketing strategy.
QR Code has found usefulness and acceptance far beyond retail advertising and
marketing. QR Codes on business cards can automate the capture of card-holder
information for business partner or prospect relationships. QR Codes on retail
windows can inform users of daily specials in restaurant menus, clothing sales—
virtually anything that can change quickly. The URL represented by the printed QR
Code doesn’t change, but the page it points to can change as often as necessary.
Without the cost of redesigning, printing and distributing actual advertising
pieces, this unanticipated benefit represents a new way in which the QR Code is a
“quick response” technology.
Compared to 1D barcodes such as UPC and Code 128, QR Codes are very tolerant
of structural errors or damage. Taking advantage of this, some graphics designers
15 ©2014 Barcode-Test LLC
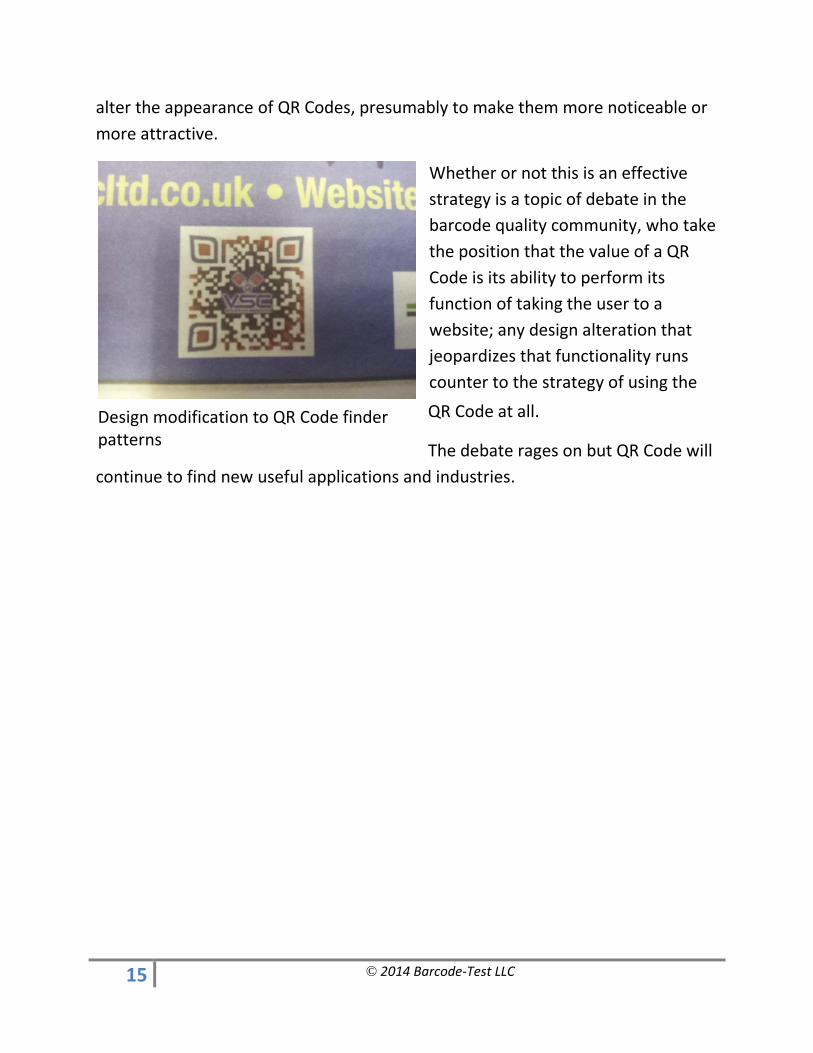
alter the appearance of QR Codes, presumably to make them more noticeable or
more attractive.
Whether or not this is an effective
strategy is a topic of debate in the
barcode quality community, who take
the position that the value of a QR
Code is its ability to perform its
function of taking the user to a
website; any design alteration that
jeopardizes that functionality runs
counter to the strategy of using the
QR Code at all.
The debate rages on but QR Code will
continue to find new useful applications and industries.
Design modification to QR Code finder patterns
16 ©2014 Barcode-Test LLC
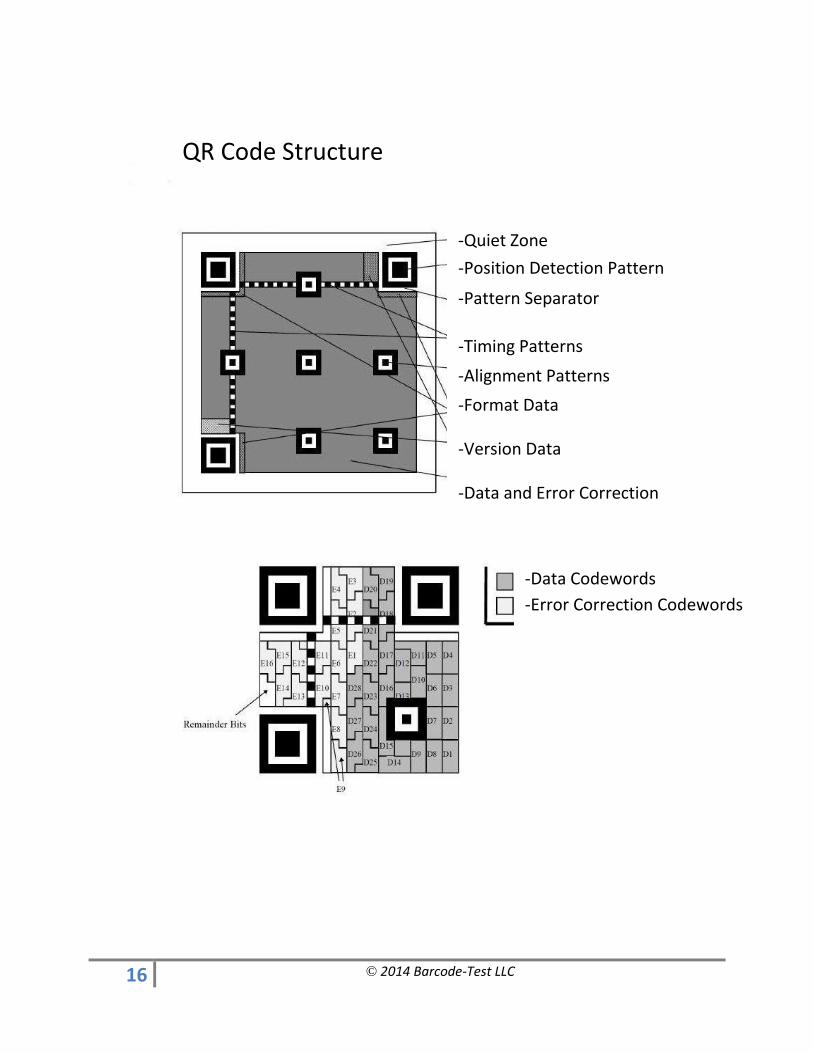
-Quiet Zone -Position Detection Pattern -Pattern Separator -Timing Patterns -Alignment Patterns -Format Data -Version Data -Data and Error Correction
-Data Codewords
-Error Correction Codewords
QR Code Structure
17 ©2014 Barcode-Test LLC
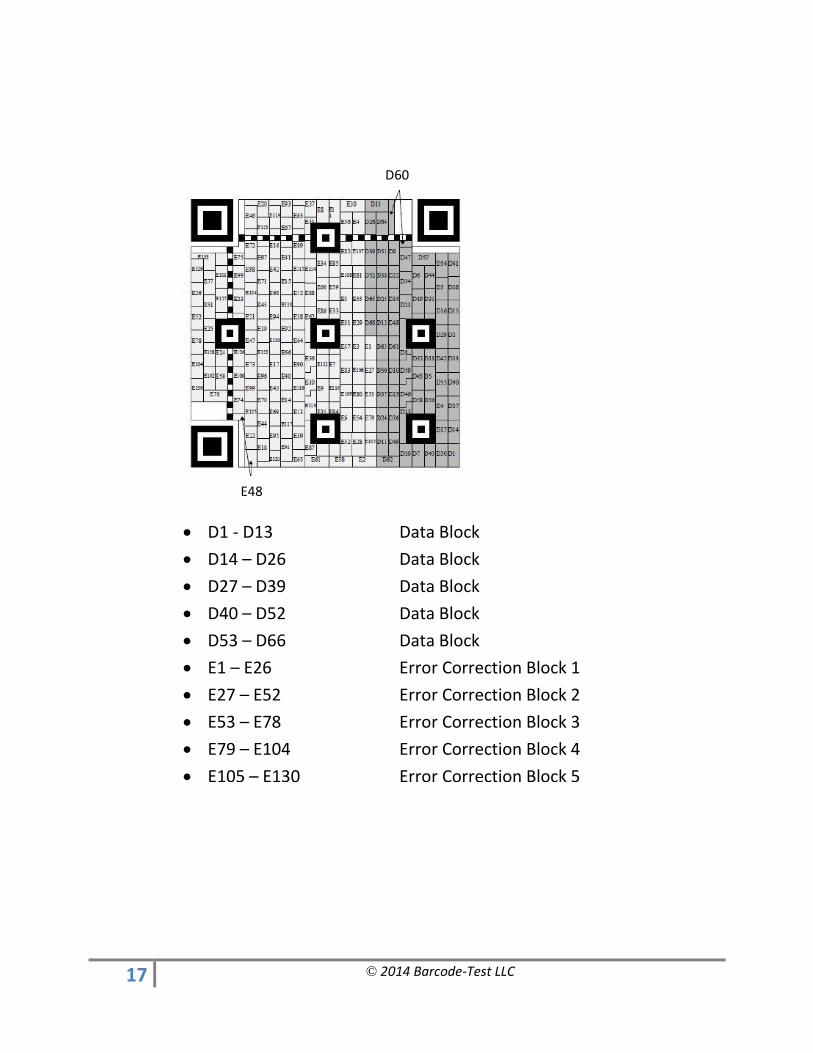
D1 - D13 Data Block
D14 – D26 Data Block
D27 – D39 Data Block
D40 – D52 Data Block
D53 – D66 Data Block
E1 – E26 Error Correction Block 1
E27 – E52 Error Correction Block 2
E53 – E78 Error Correction Block 3
E79 – E104 Error Correction Block 4
E105 – E130 Error Correction Block 5
E48
D60
18 ©2014 Barcode-Test LLC
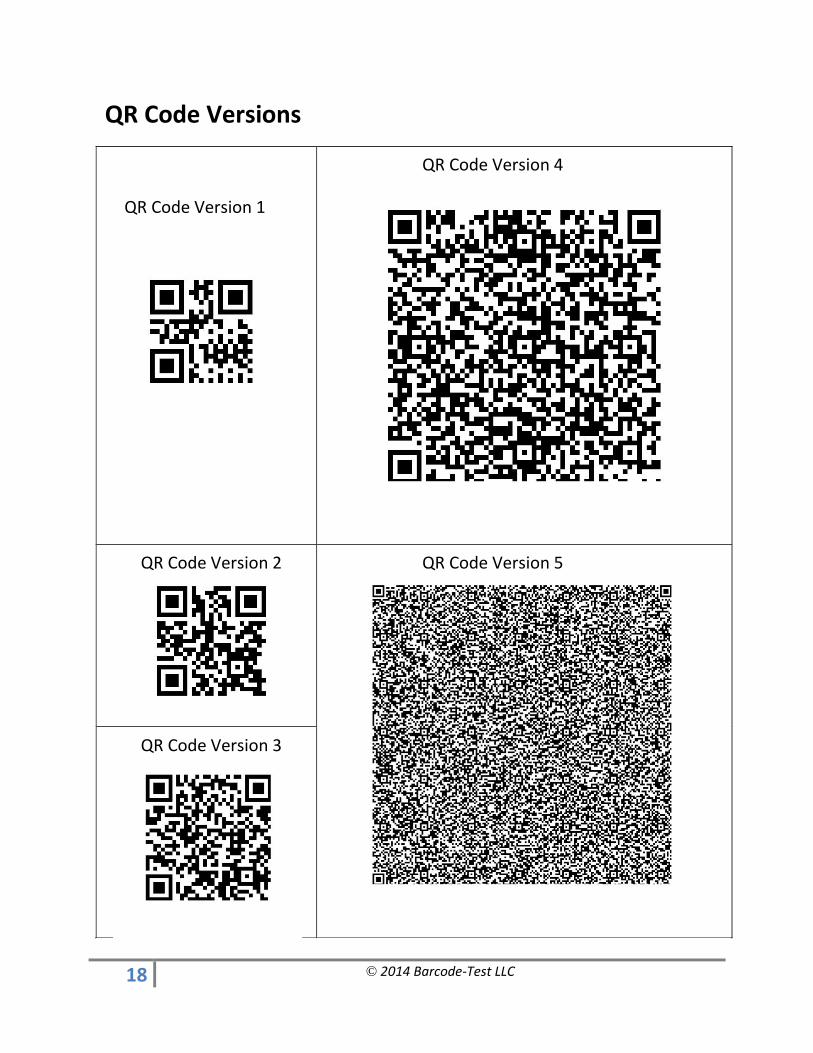
QR Code Versions
QR Code Version 1
QR Code Version 4
QR Code Version 2
QR Code Version 5
QR Code Version 3
QR Code Versions
QR Code Version 1
QR Code Version 4
QR Code Version 2 QR Code Version 5
QR Code Version 3
19 ©2014 Barcode-Test LLC
C. Getting to Know Data Matrix Code
The Data Matrix symbology was invented by International Data Matrix, Inc.
Their president, Dennis Priddy felt the symbology should be standardized to
make it attractive and applicable in the world-wide marketplace. In 1994 he
submitted the specification to AIM International for standardization. AIM is a
global trade association for companies who manufacture barcode products. A
technical committee within AIM was formed and released the standards
document for Data Matrix Code at the Scan-Tech trade show in November,
1996.
The rights to Data Matrix code were purchased from International Data Matrix,
Inc, by machine vision innovator RVSI, who was acquired by Microscan Systems
in 2008.
Like QR Code, Data Matrix encodes the full alphabetical and numerical set of
characters as well as special characters. Unlike QR Code, Data Matrix is widely
variable in size and data capacity, the smallest format being 10x10 elements up
to 144x144 elements (in the newest ECC 200 version). This makes the Data
Matrix symbol capable of marking small items since it can encode 50 characters
in a symbol that is a mere 2-3mm square. Data Matrix is also adaptable to very
low contrast applications such as Direct Part Mark (DPM) which makes it
possible to mark parts and subassemblies that would otherwise be impossible
to mark using conventional labels or tags.
Reed-Solomon ECC 200 error recovery algorithms make it possible for Data
Matrix codes to survive up to 30% damage. These unique capabilities make
Data Matrix code applicable is a wide variety of situations such as medical
devices, military hardware, electronics and document control.
20 ©2014 Barcode-Test LLC
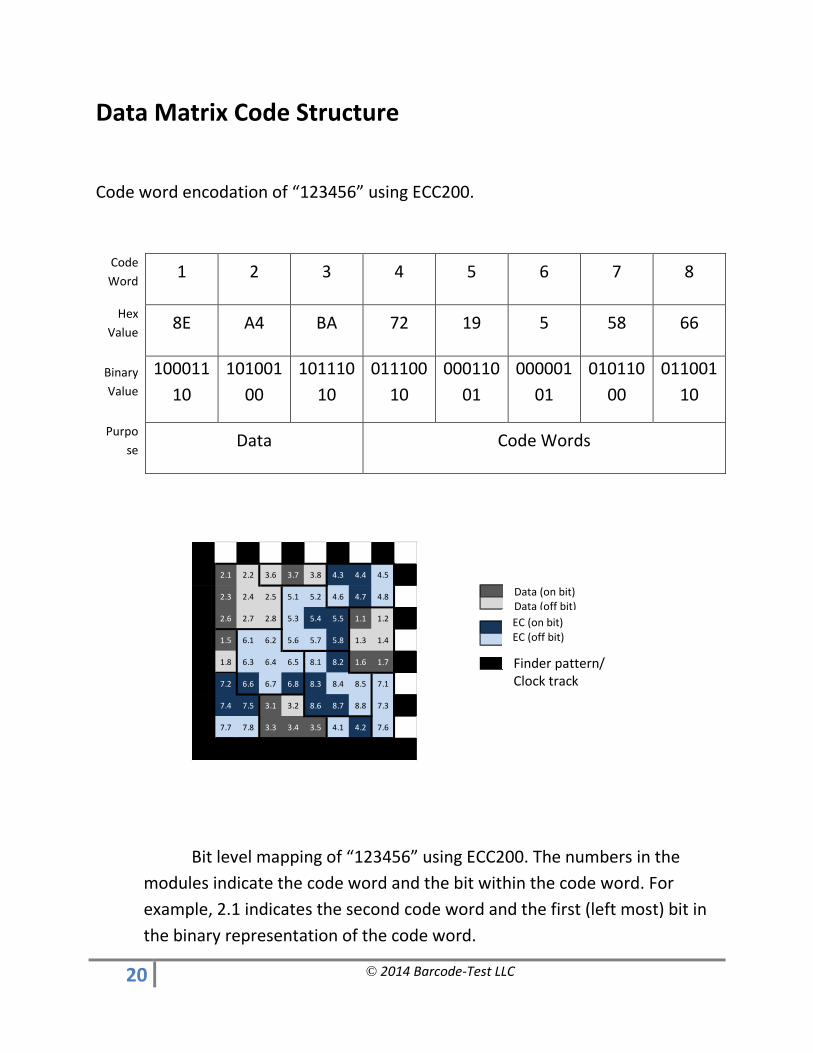
Data Matrix Code Structure
Code word encodation of “123456” using ECC200.
Code
Word 1 2 3 4 5 6 7 8
Hex
Value 8E A4 BA 72 19 5 58 66
Binary
Value
100011
10
101001
00
101110
10
011100
10
000110
01
000001
01
010110
00
011001
10
Purpo
se Data Code Words
Bit level mapping of “123456” using ECC200. The numbers in the
modules indicate the code word and the bit within the code word. For
example, 2.1 indicates the second code word and the first (left most) bit in
the binary representation of the code word.
2.1 2.2 3.6 3.7 3.8 4.3 4.4 4.5
2.3 2.4 2.5 5.1 5.2 4.6 4.7 4.8
2.6 2.7 2.8 5.3 5.4 5.5 1.1 1.2
1.5 6.1 6.2 5.6 5.7 5.8 1.3 1.4
1.8 6.3 6.4 6.5 8.1 8.2 1.6 1.7
7.2 6.6 6.7 6.8 8.3 8.4 8.5 7.1
7.4 7.5 3.1 3.2 8.6 8.7 8.8 7.3
7.7 7.8 3.3 3.4 3.5 4.1 4.2 7.6
Data (on bit) Data (off bit)
Error Correction Code Word (on bit) Error Correction Code Word (off
bit)
EC (on bit) EC (off bit)
Finder pattern/ Clock track Clock track
Data (on bit) Data (off bit)
21 ©2014 Barcode-Test LLC
Data Matrix Code Types
The current version of Data Matrix Code is ECC 200. This designation refers to the
method used for error correction. ECC200 error correction is based on Reed-
Solomon codes which enable the encoded Data Matrix data to recover from
errors and obliterations of portions of the symbol. Error correction can
accommodate for up to 30% damage as long as the finder patterns are sufficiently
intact to enable the scanner to locate it.
Like QR Code, Data Matrix elements can be round or square, which makes it
possible to image Data Matrix Codes with dot-peen methods. Data Matrix Code is
used in a wide variety of industrial and other specialty situations where other
forms of marking are impractical.
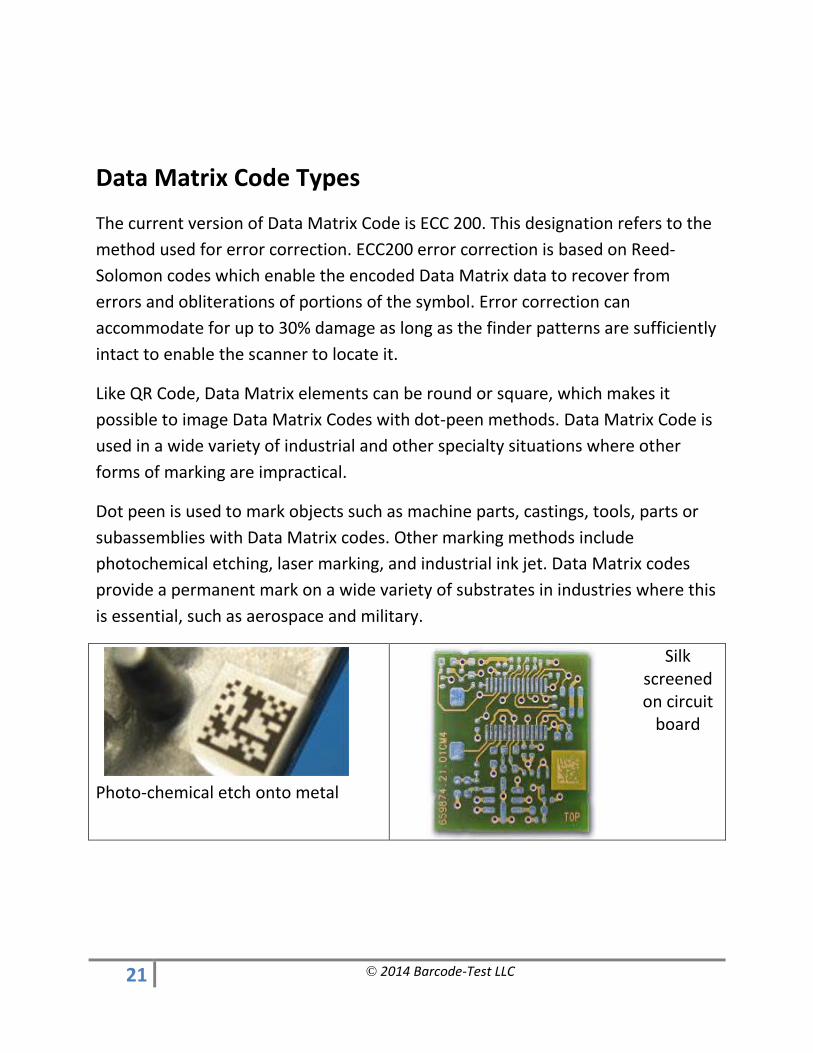
Dot peen is used to mark objects such as machine parts, castings, tools, parts or
subassemblies with Data Matrix codes. Other marking methods include
photochemical etching, laser marking, and industrial ink jet. Data Matrix codes
provide a permanent mark on a wide variety of substrates in industries where this
is essential, such as aerospace and military.
Photo-chemical etch onto metal
Silk screened on circuit
board
22 ©2014 Barcode-Test LLC
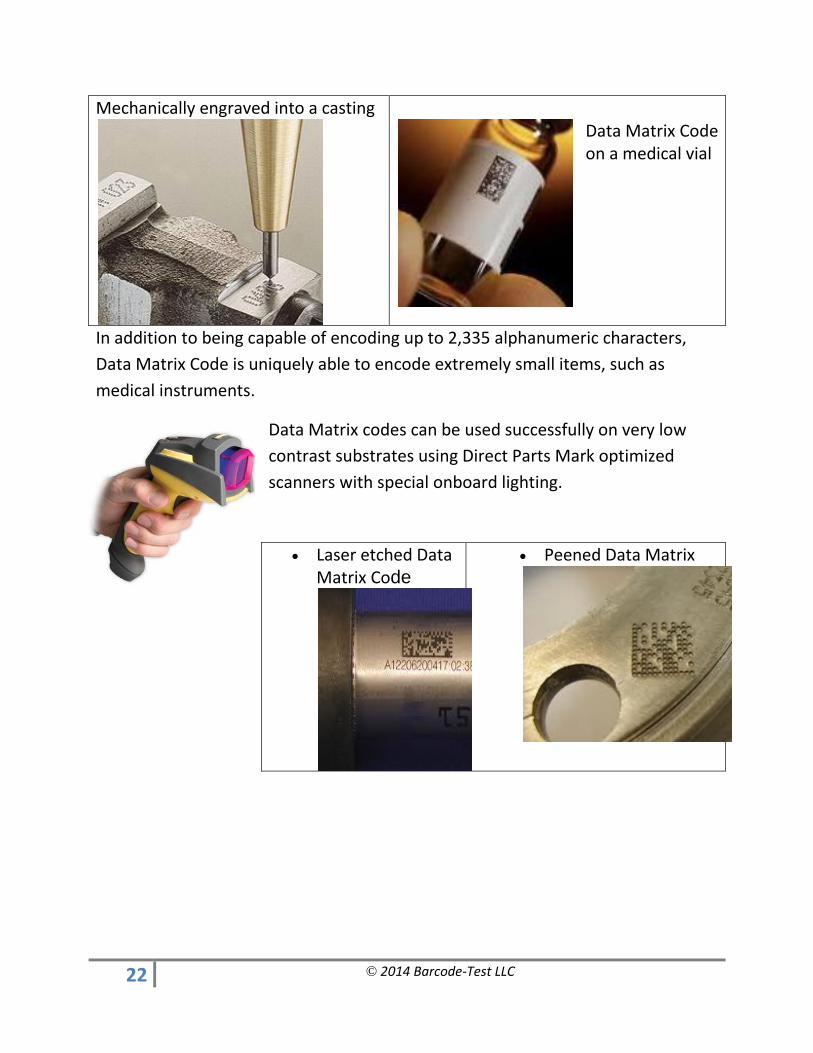
Mechanically engraved into a casting
Data Matrix Code on a medical vial
In addition to being capable of encoding up to 2,335 alphanumeric characters,
Data Matrix Code is uniquely able to encode extremely small items, such as
medical instruments.
Data Matrix codes can be used successfully on very low
contrast substrates using Direct Parts Mark optimized
scanners with special onboard lighting.
Laser etched Data Matrix Code
Peened Data Matrix
23 ©2014 Barcode-Test LLC
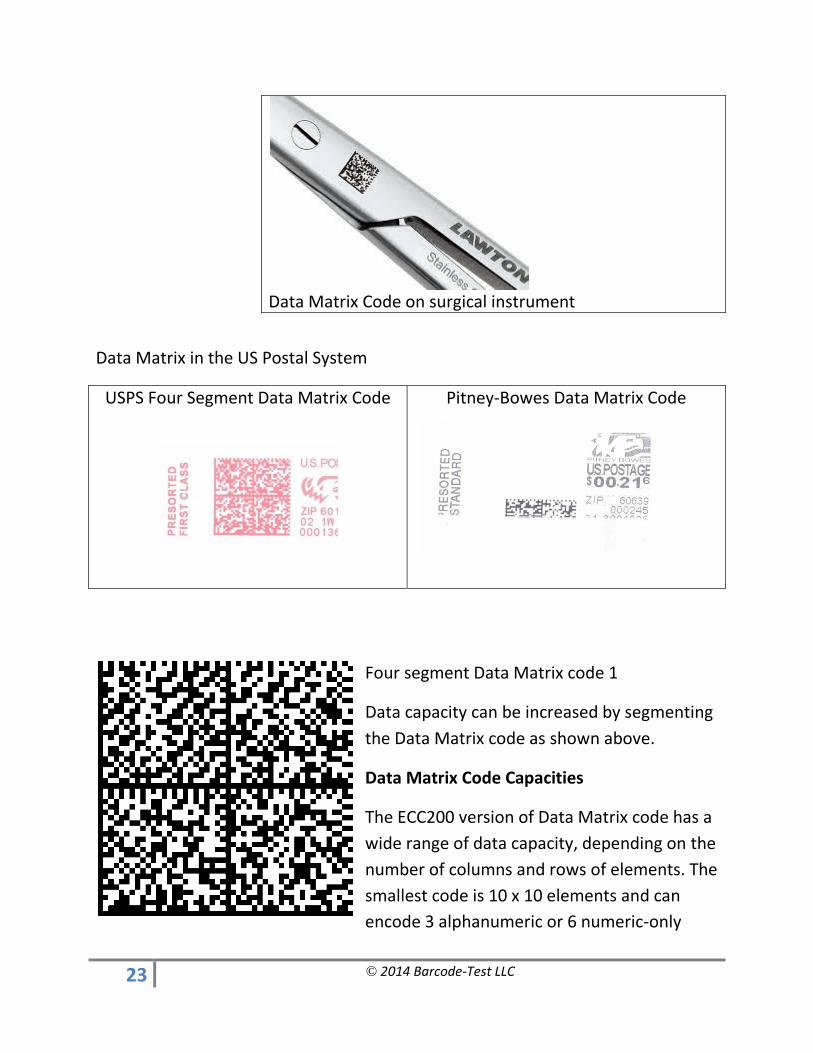
Data Matrix Code on surgical instrument
Data Matrix in the US Postal System
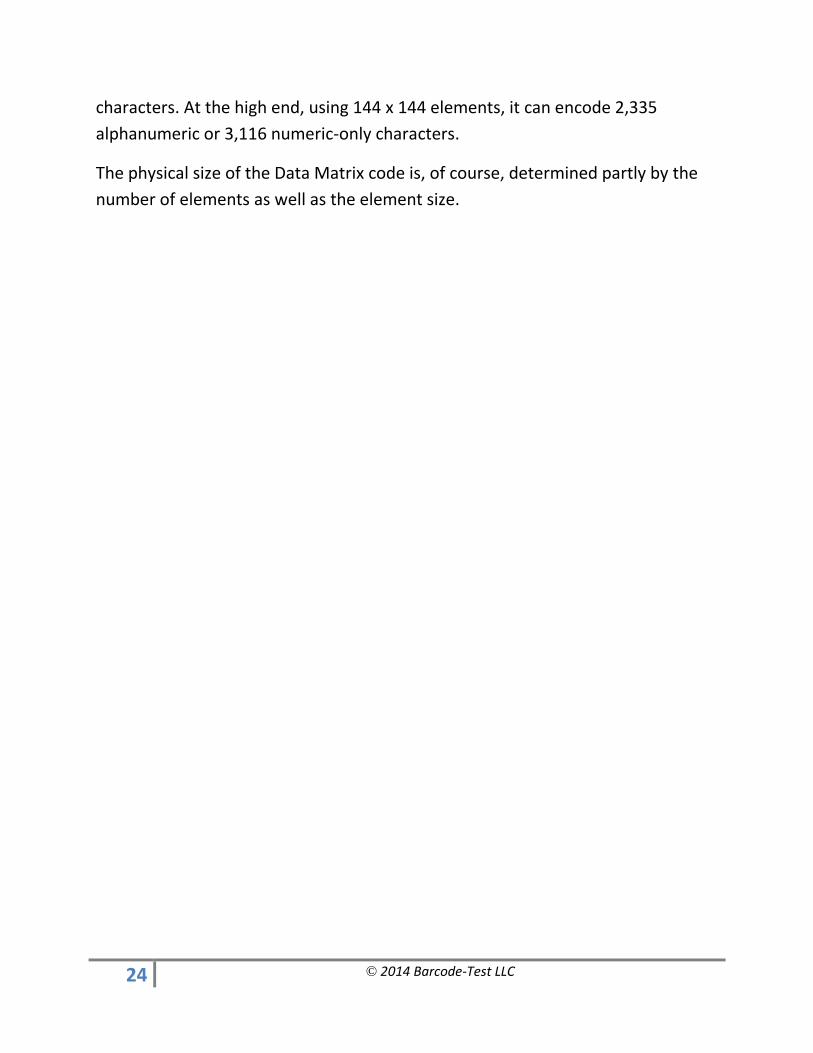
USPS Four Segment Data Matrix Code
Pitney-Bowes Data Matrix Code
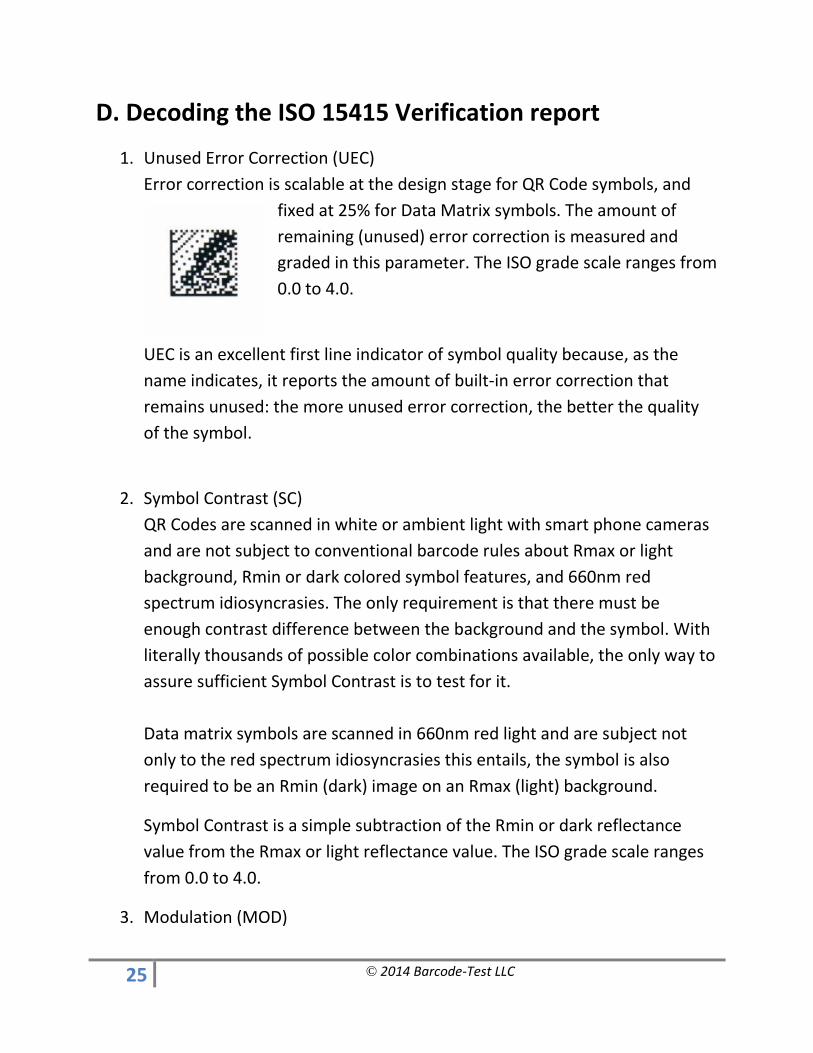
Four segment Data Matrix code 1
Data capacity can be increased by segmenting
the Data Matrix code as shown above.
Data Matrix Code Capacities
The ECC200 version of Data Matrix code has a
wide range of data capacity, depending on the
number of columns and rows of elements. The
smallest code is 10 x 10 elements and can
encode 3 alphanumeric or 6 numeric-only
24 ©2014 Barcode-Test LLC
characters. At the high end, using 144 x 144 elements, it can encode 2,335
alphanumeric or 3,116 numeric-only characters.
The physical size of the Data Matrix code is, of course, determined partly by the
number of elements as well as the element size.
25 ©2014 Barcode-Test LLC
D. Decoding the ISO 15415 Verification report
1. Unused Error Correction (UEC)
Error correction is scalable at the design stage for QR Code symbols, and
fixed at 25% for Data Matrix symbols. The amount of
remaining (unused) error correction is measured and
graded in this parameter. The ISO grade scale ranges from
0.0 to 4.0.
UEC is an excellent first line indicator of symbol quality because, as the
name indicates, it reports the amount of built-in error correction that
remains unused: the more unused error correction, the better the quality
of the symbol.
2. Symbol Contrast (SC)
QR Codes are scanned in white or ambient light with smart phone cameras
and are not subject to conventional barcode rules about Rmax or light
background, Rmin or dark colored symbol features, and 660nm red
spectrum idiosyncrasies. The only requirement is that there must be
enough contrast difference between the background and the symbol. With
literally thousands of possible color combinations available, the only way to
assure sufficient Symbol Contrast is to test for it.
Data matrix symbols are scanned in 660nm red light and are subject not
only to the red spectrum idiosyncrasies this entails, the symbol is also
required to be an Rmin (dark) image on an Rmax (light) background.
Symbol Contrast is a simple subtraction of the Rmin or dark reflectance
value from the Rmax or light reflectance value. The ISO grade scale ranges
from 0.0 to 4.0.
3. Modulation (MOD)
26 ©2014 Barcode-Test LLC
Modulation is derived from Symbol Contrast measurements, and evaluates
the range of difference in Rmin and Rmax values within the symbol. To be
clear, this means variations within Rmax readings in different areas of the
symbol, and variations in Rmin readings different areas of the symbol—not
variations based on direct comparisons of Rmax to Rmin values.
For example, a symbol that is printed over a gradient or patterned
background will be downgraded based on the Modulation parameter; a
symbol that is printed in more than one color will also be downgraded for
Modulation.
The ISO grade scale ranges from 0.0 to 4.0.
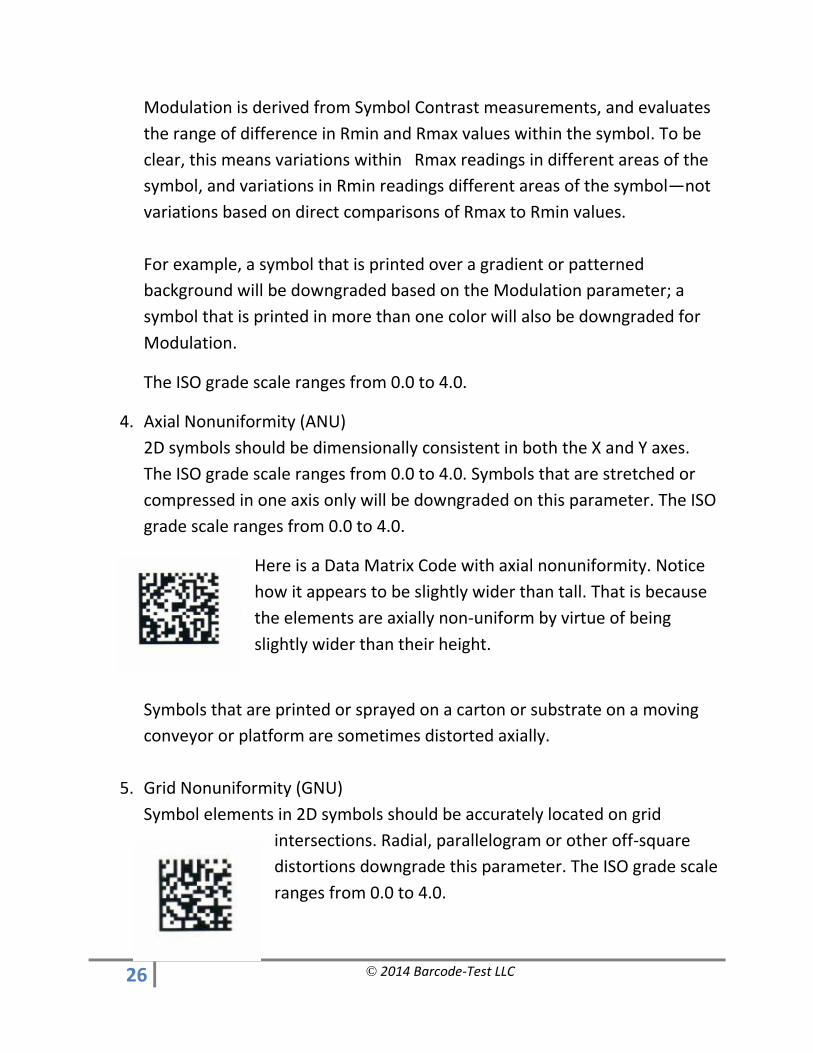
4. Axial Nonuniformity (ANU)
2D symbols should be dimensionally consistent in both the X and Y axes.
The ISO grade scale ranges from 0.0 to 4.0. Symbols that are stretched or
compressed in one axis only will be downgraded on this parameter. The ISO
grade scale ranges from 0.0 to 4.0.
Here is a Data Matrix Code with axial nonuniformity. Notice
how it appears to be slightly wider than tall. That is because
the elements are axially non-uniform by virtue of being
slightly wider than their height.
Symbols that are printed or sprayed on a carton or substrate on a moving
conveyor or platform are sometimes distorted axially.
5. Grid Nonuniformity (GNU)
Symbol elements in 2D symbols should be accurately located on grid
intersections. Radial, parallelogram or other off-square
distortions downgrade this parameter. The ISO grade scale
ranges from 0.0 to 4.0.
27 ©2014 Barcode-Test LLC
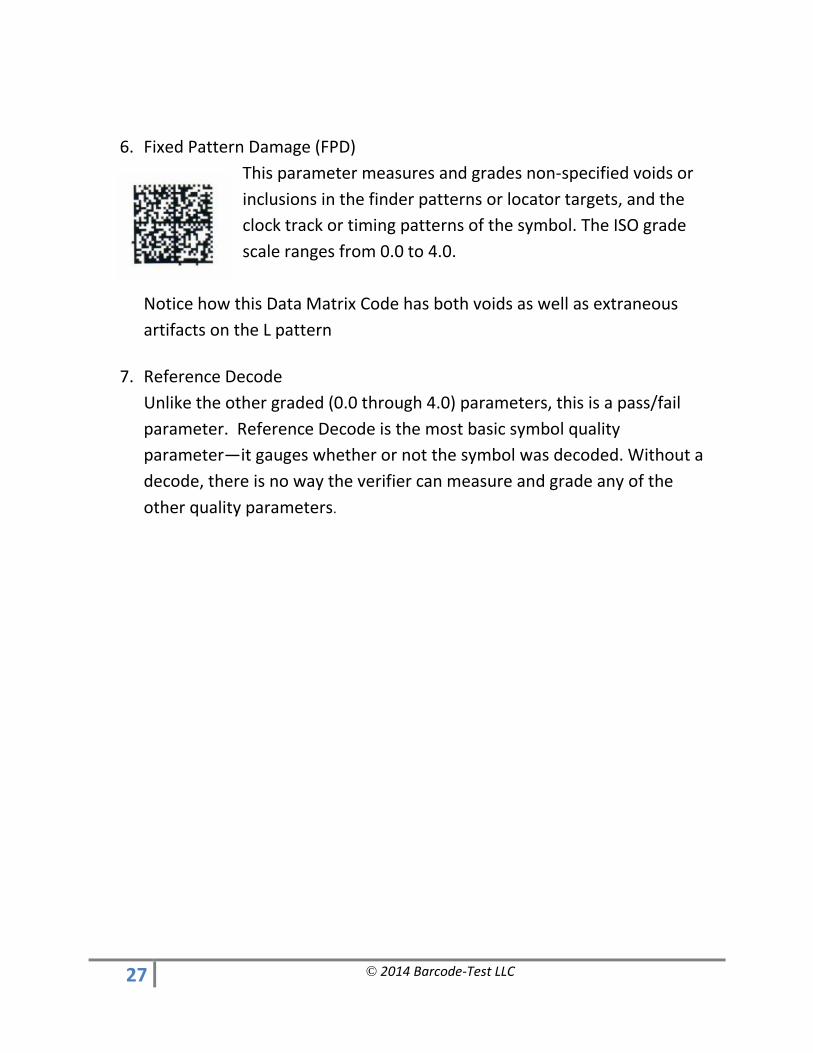
6. Fixed Pattern Damage (FPD)
This parameter measures and grades non-specified voids or
inclusions in the finder patterns or locator targets, and the
clock track or timing patterns of the symbol. The ISO grade
scale ranges from 0.0 to 4.0.
Notice how this Data Matrix Code has both voids as well as extraneous
artifacts on the L pattern
7. Reference Decode
Unlike the other graded (0.0 through 4.0) parameters, this is a pass/fail
parameter. Reference Decode is the most basic symbol quality
parameter—it gauges whether or not the symbol was decoded. Without a
decode, there is no way the verifier can measure and grade any of the
other quality parameters.
28 ©2014 Barcode-Test LLC
Non Graded Report Information
1. Print Growth
This is similar to Bar Width Gain in 1D barcodes except that it may occur on
both axes of 2D symbols. Because print-reproduction is often (but not
always) an on-the-fly operation, Print Growth will often be greater in the
direction of travel and lesser in the perpendicular axis. Compensating for
Print Growth with Bar Width Reduction on a 2D symbol must take this into
account.
The specification recommends that print growth be reported, but does not
require it to be included as part of the final symbol grade.
2. Average Grade
Technically speaking the average grade is not a part of the specification; it is
a required part of the verification report. In other words the specification
does not require the achievement of a minimum grade level; it simply
requires that a grade be reported based on the parameters within the
specification.
3. Aperture
The diameter of the verifier’s artificial aperture must be reported to the
nearest .0010”
4. Wavelength of light in nanometers (nm) must be reported
5. Angle of light (if other than 45⁰) must be reported
29 ©2014 Barcode-Test LLC
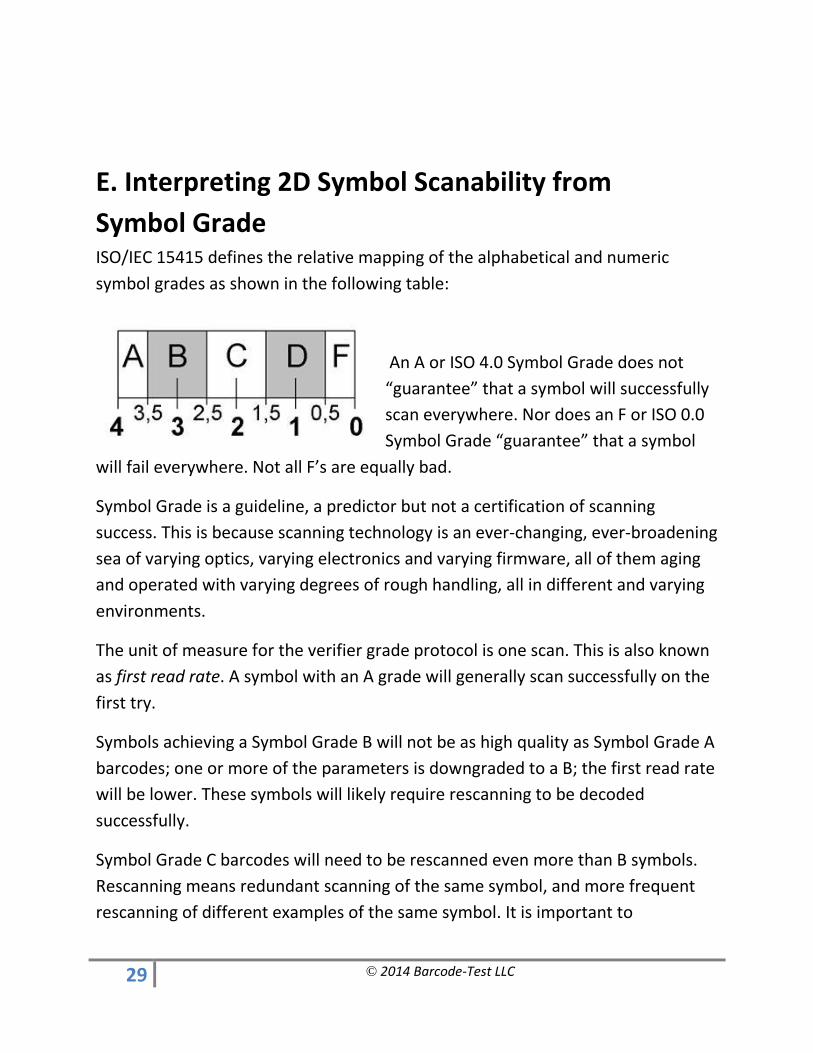
E. Interpreting 2D Symbol Scanability from
Symbol Grade ISO/IEC 15415 defines the relative mapping of the alphabetical and numeric
symbol grades as shown in the following table:
An A or ISO 4.0 Symbol Grade does not
“guarantee” that a symbol will successfully
scan everywhere. Nor does an F or ISO 0.0
Symbol Grade “guarantee” that a symbol
will fail everywhere. Not all F’s are equally bad.
Symbol Grade is a guideline, a predictor but not a certification of scanning
success. This is because scanning technology is an ever-changing, ever-broadening
sea of varying optics, varying electronics and varying firmware, all of them aging
and operated with varying degrees of rough handling, all in different and varying
environments.
The unit of measure for the verifier grade protocol is one scan. This is also known
as first read rate. A symbol with an A grade will generally scan successfully on the
first try.
Symbols achieving a Symbol Grade B will not be as high quality as Symbol Grade A
barcodes; one or more of the parameters is downgraded to a B; the first read rate
will be lower. These symbols will likely require rescanning to be decoded
successfully.
Symbol Grade C barcodes will need to be rescanned even more than B symbols.
Rescanning means redundant scanning of the same symbol, and more frequent
rescanning of different examples of the same symbol. It is important to
30 ©2014 Barcode-Test LLC
understand that the performance of a single barcode does not necessarily predict
the quality of an entire print run.
A symbol with a D will require multiple scans to decode successfully. F grade
symbols are unlikely to scan successful in most scanning environments. Attributes
that degrade symbol quality should be avoided—things such as gradient, variable
or patterned background color or designer features such as logos or graphics
within the symbol. Users sometimes believe that F grade symbols are actually
acceptable because the verifier was able to decode them. The significant thing is
the Symbol Grade, not the successful decode. Verifiers and scanners differ in this
regard.
How the Symbol Grade is obtained is an important consideration. The verification
process should never be “optimized”. The test samples should be representative
of the entire print run, usually drawn from the beginning and the end of the run,
with in-process samples pulled periodically during the run.
Tested samples should always be in their final form exactly as they are ultimately
presented to the end-user scanner. If they are laminated in final form, they
should be laminated when they are verified. If they are inserted into a page of
text, they should be in that form when verified.
The process is every bit as important as the verifier, which should be an ISO
compliant device. It is meaningless to use a quality testing tool with no
performance benchmark. For the same reason, the verifier should be recently
calibrated and challenged for conformance through use of performance
qualification test barcodes.
31 ©2014 Barcode-Test LLC
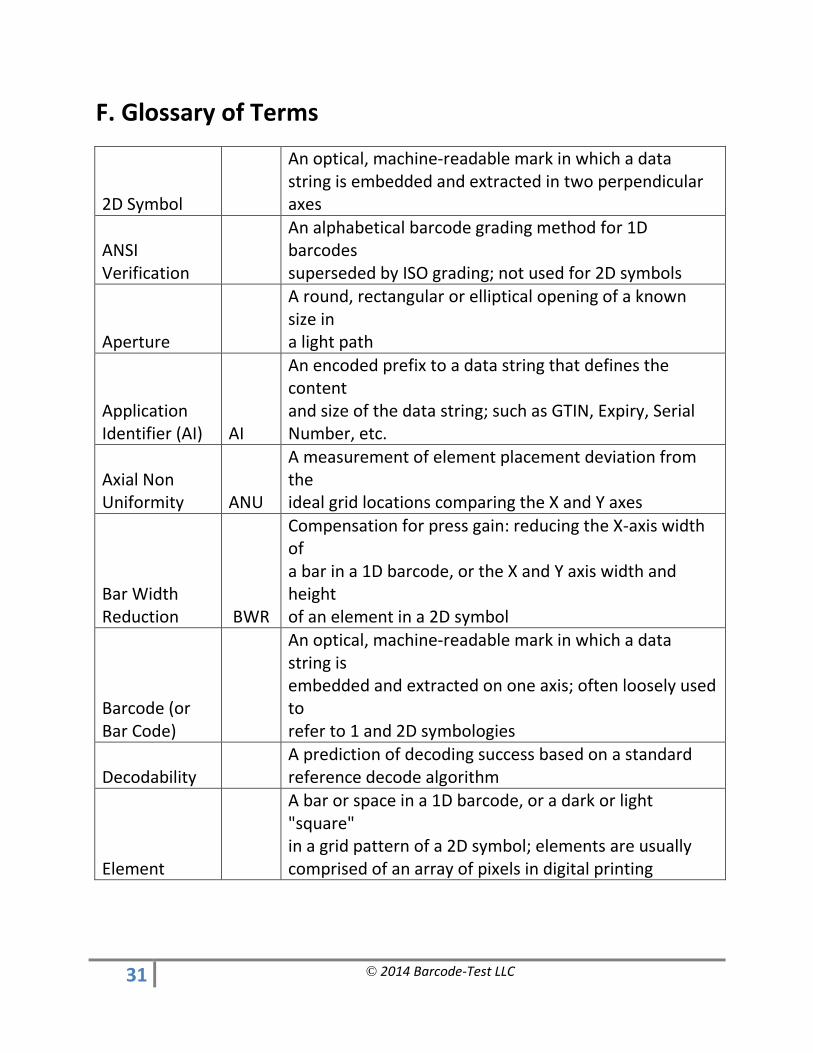
F. Glossary of Terms
2D Symbol
An optical, machine-readable mark in which a data string is embedded and extracted in two perpendicular axes
ANSI Verification
An alphabetical barcode grading method for 1D barcodes superseded by ISO grading; not used for 2D symbols
Aperture
A round, rectangular or elliptical opening of a known size in a light path
Application Identifier (AI) AI
An encoded prefix to a data string that defines the content and size of the data string; such as GTIN, Expiry, Serial Number, etc.
Axial Non Uniformity ANU
A measurement of element placement deviation from the ideal grid locations comparing the X and Y axes
Bar Width Reduction BWR
Compensation for press gain: reducing the X-axis width of a bar in a 1D barcode, or the X and Y axis width and height of an element in a 2D symbol
Barcode (or Bar Code)
An optical, machine-readable mark in which a data string is embedded and extracted on one axis; often loosely used to refer to 1 and 2D symbologies
Decodability A prediction of decoding success based on a standard reference decode algorithm
Element
A bar or space in a 1D barcode, or a dark or light "square" in a grid pattern of a 2D symbol; elements are usually comprised of an array of pixels in digital printing
32 ©2014 Barcode-Test LLC
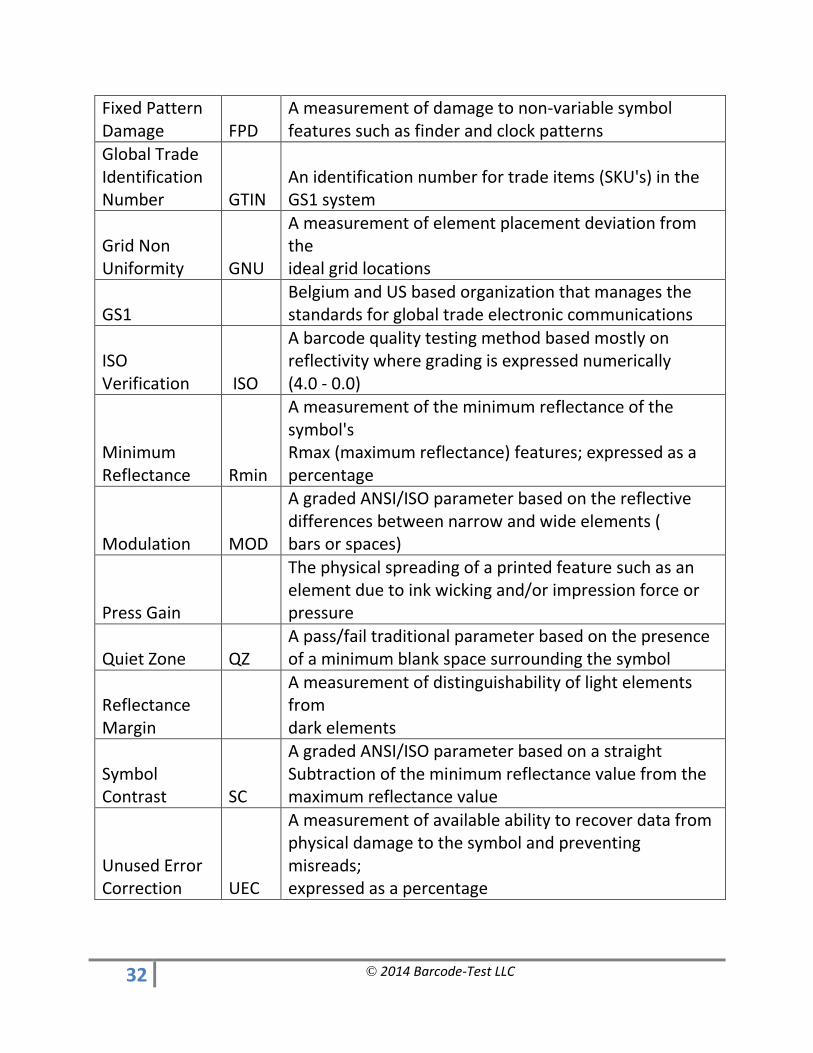
Fixed Pattern Damage FPD
A measurement of damage to non-variable symbol features such as finder and clock patterns
Global Trade Identification Number GTIN
An identification number for trade items (SKU's) in the GS1 system
Grid Non Uniformity GNU
A measurement of element placement deviation from the ideal grid locations
GS1 Belgium and US based organization that manages the standards for global trade electronic communications
ISO Verification ISO
A barcode quality testing method based mostly on reflectivity where grading is expressed numerically (4.0 - 0.0)
Minimum Reflectance Rmin
A measurement of the minimum reflectance of the symbol's Rmax (maximum reflectance) features; expressed as a percentage
Modulation MOD
A graded ANSI/ISO parameter based on the reflective differences between narrow and wide elements ( bars or spaces)
Press Gain
The physical spreading of a printed feature such as an element due to ink wicking and/or impression force or pressure
Quiet Zone QZ A pass/fail traditional parameter based on the presence of a minimum blank space surrounding the symbol
Reflectance Margin
A measurement of distinguishability of light elements from dark elements
Symbol Contrast SC
A graded ANSI/ISO parameter based on a straight Subtraction of the minimum reflectance value from the maximum reflectance value
Unused Error Correction UEC
A measurement of available ability to recover data from physical damage to the symbol and preventing misreads; expressed as a percentage
33 ©2014 Barcode-Test LLC
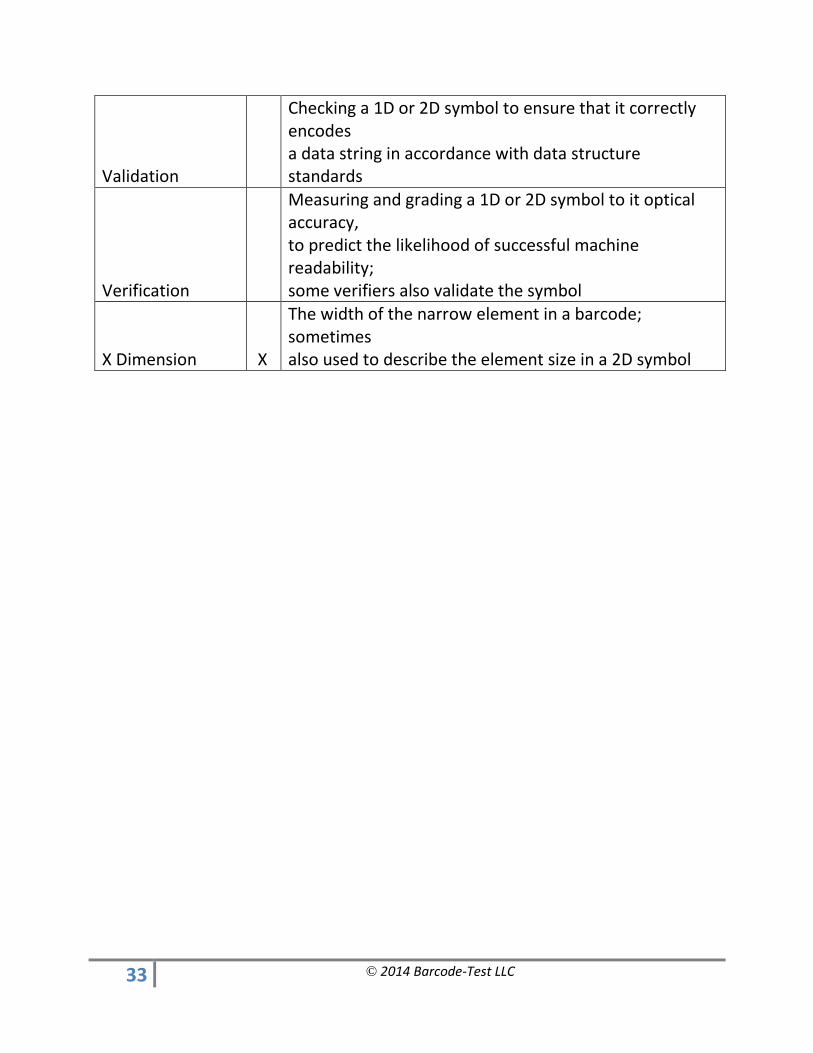
Validation
Checking a 1D or 2D symbol to ensure that it correctly encodes a data string in accordance with data structure standards
Verification
Measuring and grading a 1D or 2D symbol to it optical accuracy, to predict the likelihood of successful machine readability; some verifiers also validate the symbol
X Dimension X
The width of the narrow element in a barcode; sometimes also used to describe the element size in a 2D symbol

34 ©2014 Barcode-Test LLC
G. Resources
AIM the global trade association for the Automatic Identification and Data Capture industry
www.aimglobal.org
Axicon Auto ID LLC www.axicon.com Barcode-Test LLC www.barcode-test.com
GS1 develops and maintains global supply chains standards
www.gs1.org
HIBCC Health Industry Barcode Communications Council
www.hibcc.org
University of Memphis Herff School of Engineering
www.memphis.edu/herff/
35 ©2014 Barcode-Test LLC
For further information contact:
BARCODE-TEST LLC
Aurora, Illinois
630-235-6077
www.barcode-test.com
Axicon Auto ID LLC
Cincinnati, Ohio
513-871-6657
www.axicon.com