259 lecture 8 spring 2015 optimization with the excel solver
TRANSCRIPT
259 Lecture 8 Spring 2015
Optimization with the Excel Solver

2
Optimization Problems Many problems involve optimization
of a function by making an appropriate choice of inputs to get the best possible output.
Examples include: Maximizing an area enclosed by a fence. Minimizing error in an approximating
function. Maximizing office storage space.

3
Example 1 A farmer has 2400
feet of fencing and wants to fence off a rectangular field that borders a straight river. Find the dimensions of the fence to maximize the area enclosed by the fence.
x
y
River
4
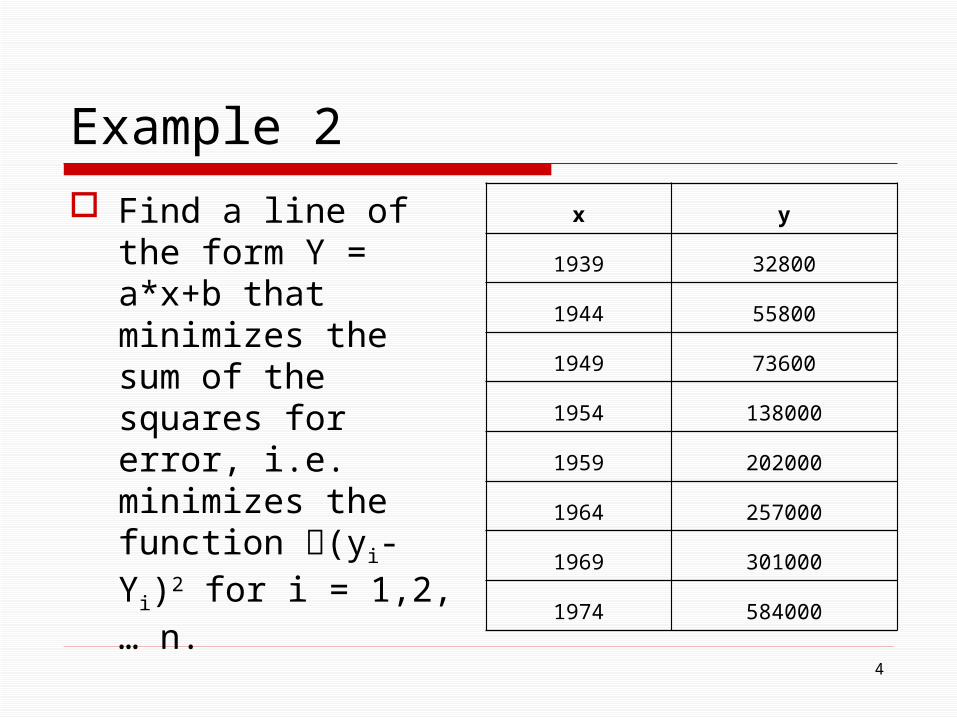
Example 2 Find a line of the
form Y = a*x+b that minimizes the sum of the squares for error, i.e. minimizes the function (yi-Yi)2 for i = 1,2, … n.
x y
1939 32800
1944 55800
1949 73600
1954 138000
1959 202000
1964 257000
1969 301000
1974 584000
5
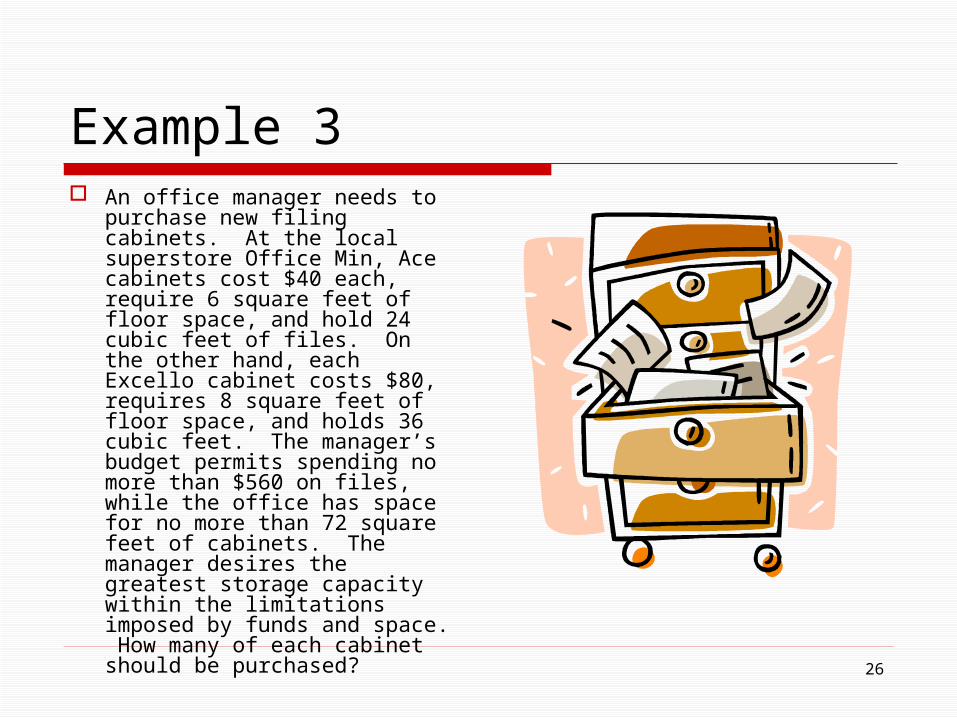
Example 3 An office manager needs to
purchase new filing cabinets. At the local superstore Office Min, Ace cabinets cost $40 each, require 6 square feet of floor space, and hold 24 cubic feet of files. On the other hand, each Excello cabinet costs $80, requires 8 square feet of floor space, and holds 36 cubic feet. The manager’s budget permits spending no more than $560 on files, while the office has space for no more than 72 square feet of cabinets. The manager desires the greatest storage capacity within the limitations imposed by funds and space. How many of each cabinet should be purchased?

6
Excel’s Solver Add-In One of the tools in Excel that
can be used for optimization problems is the Solver.
Click the Microsoft Office Button, and then click Excel Options.
Click the Add-Ins category. In the Manage box, click Excel
Add-ins, and then click Go. Check the Solver Add-in box
and choose OK. You may need to use you
Microsoft Office installation disk for this step.
Once loaded, the Solver can be accessed from the Data tab’s Analysis group.
7
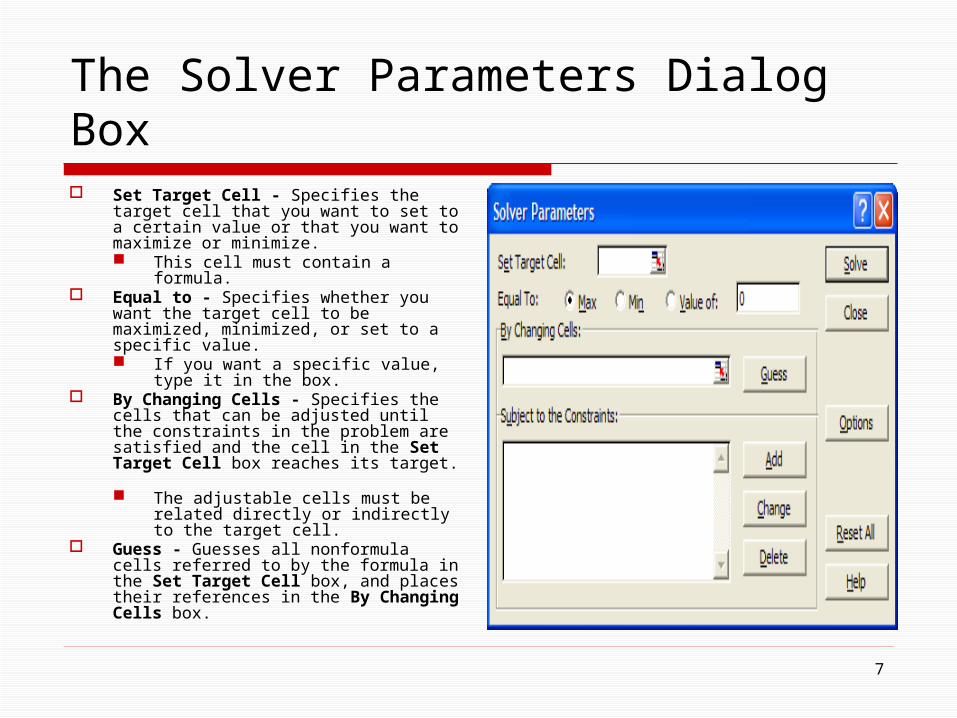
The Solver Parameters Dialog Box Set Target Cell - Specifies the
target cell that you want to set to a certain value or that you want to maximize or minimize. This cell must contain a formula.
Equal to - Specifies whether you want the target cell to be maximized, minimized, or set to a specific value. If you want a specific value, type
it in the box. By Changing Cells - Specifies the
cells that can be adjusted until the constraints in the problem are satisfied and the cell in the Set Target Cell box reaches its target. The adjustable cells must be
related directly or indirectly to the target cell.
Guess - Guesses all nonformula cells referred to by the formula in the Set Target Cell box, and places their references in the By Changing Cells box.
8
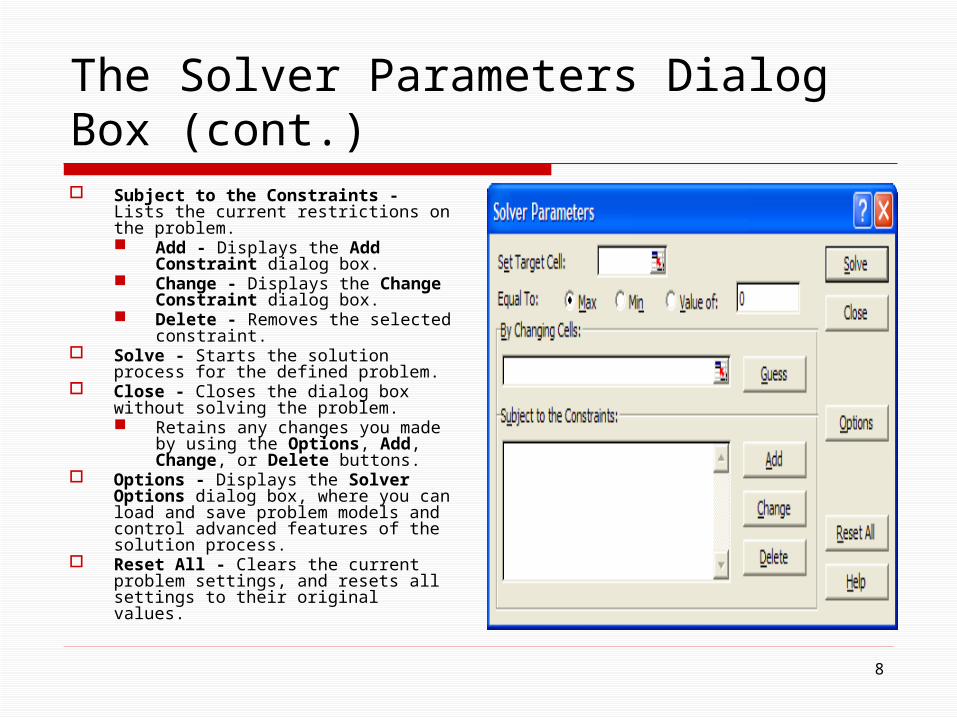
The Solver Parameters Dialog Box (cont.) Subject to the Constraints - Lists
the current restrictions on the problem. Add - Displays the Add
Constraint dialog box. Change - Displays the Change
Constraint dialog box. Delete - Removes the selected
constraint. Solve - Starts the solution process for
the defined problem. Close - Closes the dialog box without
solving the problem. Retains any changes you made
by using the Options, Add, Change, or Delete buttons.
Options - Displays the Solver Options dialog box, where you can load and save problem models and control advanced features of the solution process.
Reset All - Clears the current problem settings, and resets all settings to their original values.
9
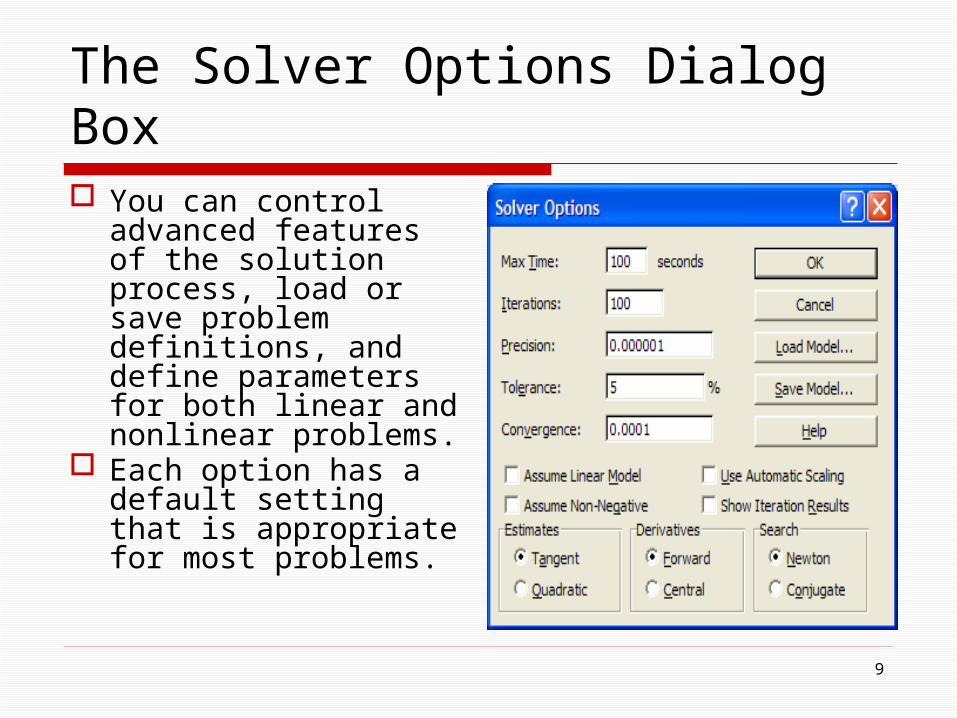
The Solver Options Dialog Box You can control
advanced features of the solution process, load or save problem definitions, and define parameters for both linear and nonlinear problems.
Each option has a default setting that is appropriate for most problems.

The Solver Options Dialog Box Max time - Limits the time taken by
the solution process. While you can enter a value as high as
32,767, the default value of 100 seconds is adequate for most small problems.
Iterations - Limits the time taken by the solution process by limiting the number of interim calculations. While you can enter a value as high as
32,767, the default value of 100 is adequate for most small problems.
Precision - Controls the precision of solutions by using the number you enter to determine whether the value of a constraint cell meets a target or satisfies a lower or upper bound. Precision must be indicated by a
fractional number between 0 (zero) and 1.
Higher precision is indicated when the number you enter has more decimal places — for example, 0.0001 is higher precision than 0.01.
10

11
The Solver Options Dialog Box (cont.) Tolerance - The percentage by
which the target cell of a solution satisfying the integer constraints can differ from the true optimal value and still be considered acceptable. This option applies only to problems with
integer constraints. A higher tolerance tends to speed up the
solution process. Convergence - When the relative
change in the target cell value is less than the number in the Convergence box for the last five iterations, Solver stops. Convergence applies only to nonlinear
problems and must be indicated by a fractional number between 0 (zero) and 1.
A smaller convergence is indicated when the number you enter has more decimal places — for example, 0.0001 is less relative change than 0.01.
The smaller the convergence value, the more time Solver takes to reach a solution.
12
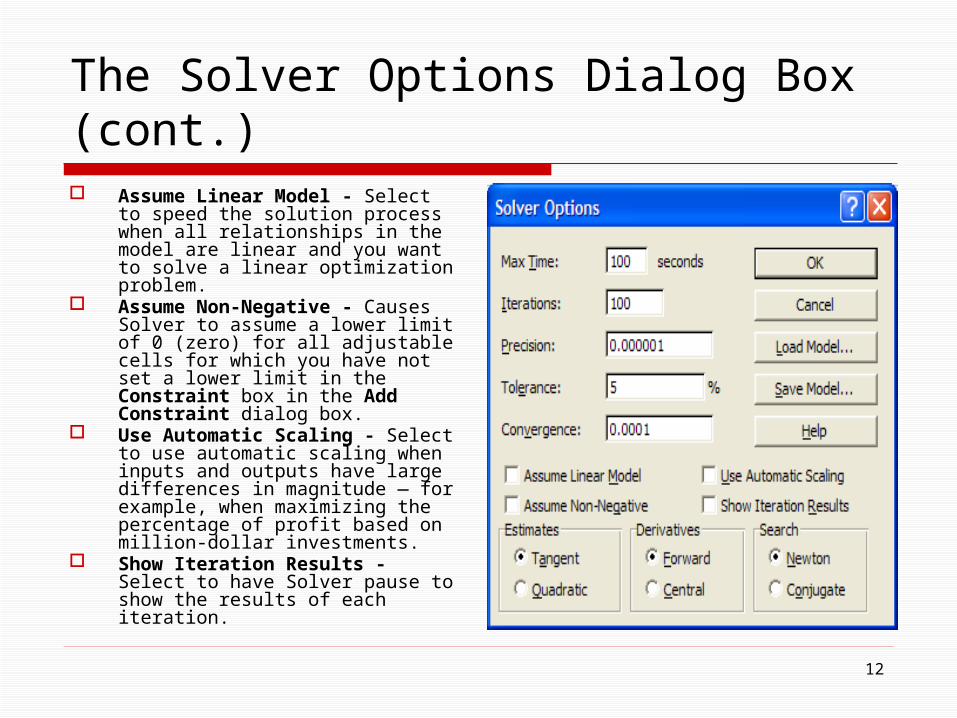
The Solver Options Dialog Box (cont.) Assume Linear Model - Select to
speed the solution process when all relationships in the model are linear and you want to solve a linear optimization problem.
Assume Non-Negative - Causes Solver to assume a lower limit of 0 (zero) for all adjustable cells for which you have not set a lower limit in the Constraint box in the Add Constraint dialog box.
Use Automatic Scaling - Select to use automatic scaling when inputs and outputs have large differences in magnitude — for example, when maximizing the percentage of profit based on million-dollar investments.
Show Iteration Results - Select to have Solver pause to show the results of each iteration.

13
The Solver Options Dialog Box (cont.) Estimates - Specifies the approach
used to obtain initial estimates of the basic variables in each one-dimensional search. Tangent - Uses linear extrapolation
from a tangent vector. Quadratic - Uses quadratic
extrapolation, which can improve the results on highly nonlinear problems.
Derivatives - Specifies the differencing used to estimate partial derivatives of the objective and constraint functions. Forward - Use for most problems,
in which the constraint values change relatively slowly.
Central - Use for problems in which the constraints change rapidly, especially near the limits. Although this option requires more calculations, it might help when Solver returns a message that it could not improve the solution.
14
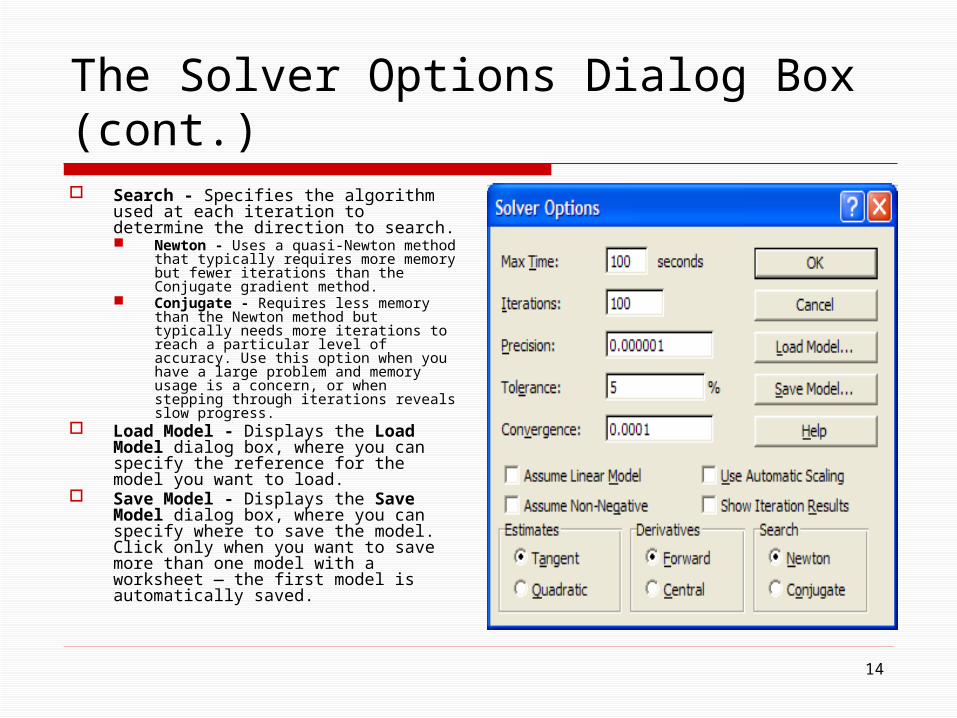
The Solver Options Dialog Box (cont.) Search - Specifies the algorithm
used at each iteration to determine the direction to search. Newton - Uses a quasi-Newton
method that typically requires more memory but fewer iterations than the Conjugate gradient method.
Conjugate - Requires less memory than the Newton method but typically needs more iterations to reach a particular level of accuracy. Use this option when you have a large problem and memory usage is a concern, or when stepping through iterations reveals slow progress.
Load Model - Displays the Load Model dialog box, where you can specify the reference for the model you want to load.
Save Model - Displays the Save Model dialog box, where you can specify where to save the model. Click only when you want to save more than one model with a worksheet — the first model is automatically saved.

15
Example 1 A farmer has 2400
feet of fencing and wants to fence off a rectangular field that borders a straight river. Find the dimensions of the fence to maximize the area enclosed by the fence.
x
y
River
16
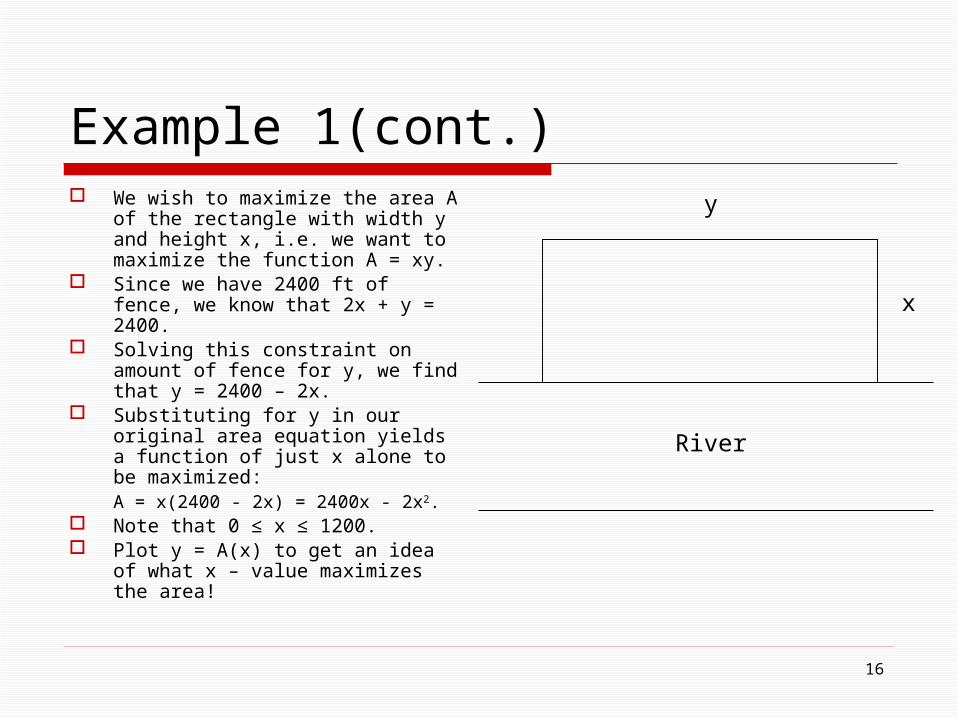
Example 1(cont.) We wish to maximize the area A
of the rectangle with width y and height x, i.e. we want to maximize the function A = xy.
Since we have 2400 ft of fence, we know that 2x + y = 2400.
Solving this constraint on amount of fence for y, we find that y = 2400 – 2x.
Substituting for y in our original area equation yields a function of just x alone to be maximized: A = x(2400 - 2x) = 2400x - 2x2.
Note that 0 ≤ x ≤ 1200. Plot y = A(x) to get an idea of
what x – value maximizes the area!
x
y
River
17
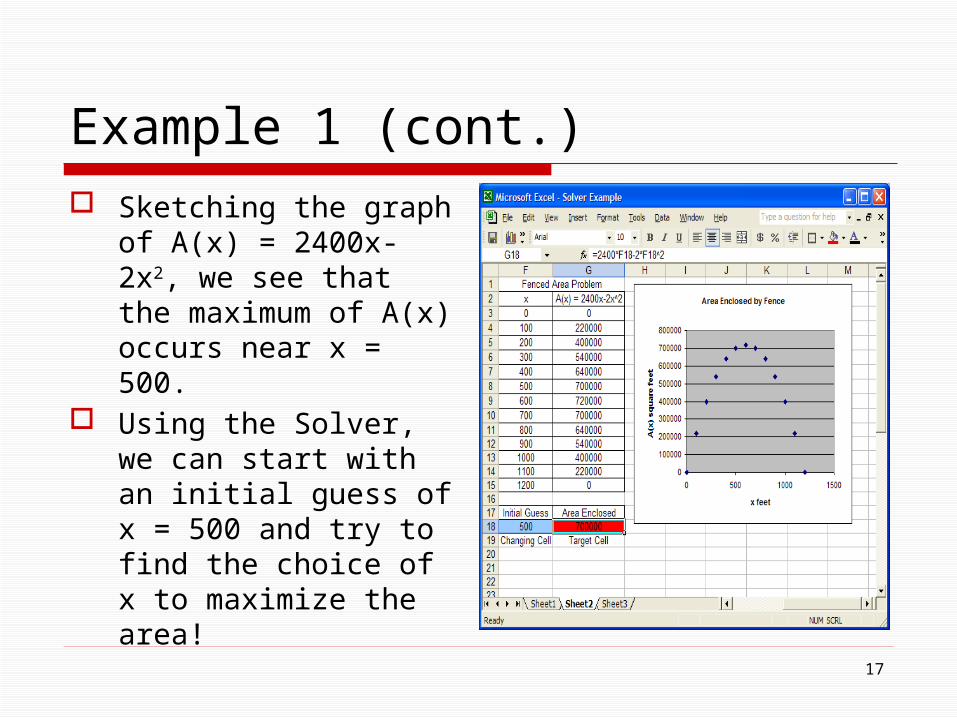
Example 1 (cont.) Sketching the graph of
A(x) = 2400x-2x2, we see that the maximum of A(x) occurs near x = 500.
Using the Solver, we can start with an initial guess of x = 500 and try to find the choice of x to maximize the area!
18
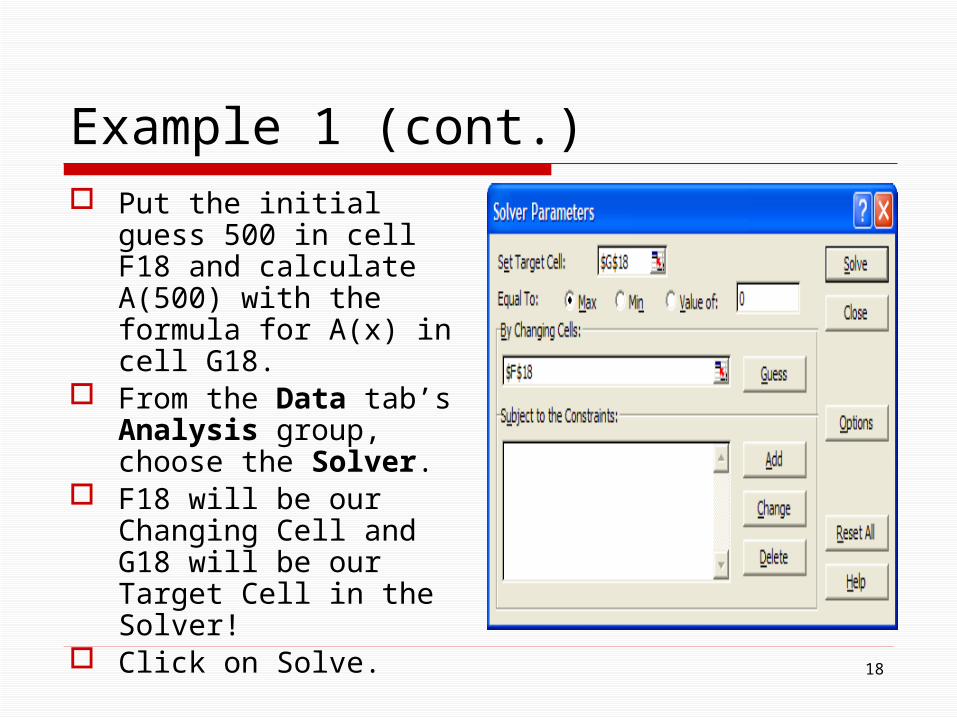
Example 1 (cont.) Put the initial guess
500 in cell F18 and calculate A(500) with the formula for A(x) in cell G18.
From the Data tab’s Analysis group, choose the Solver.
F18 will be our Changing Cell and G18 will be our Target Cell in the Solver!
Click on Solve.
19
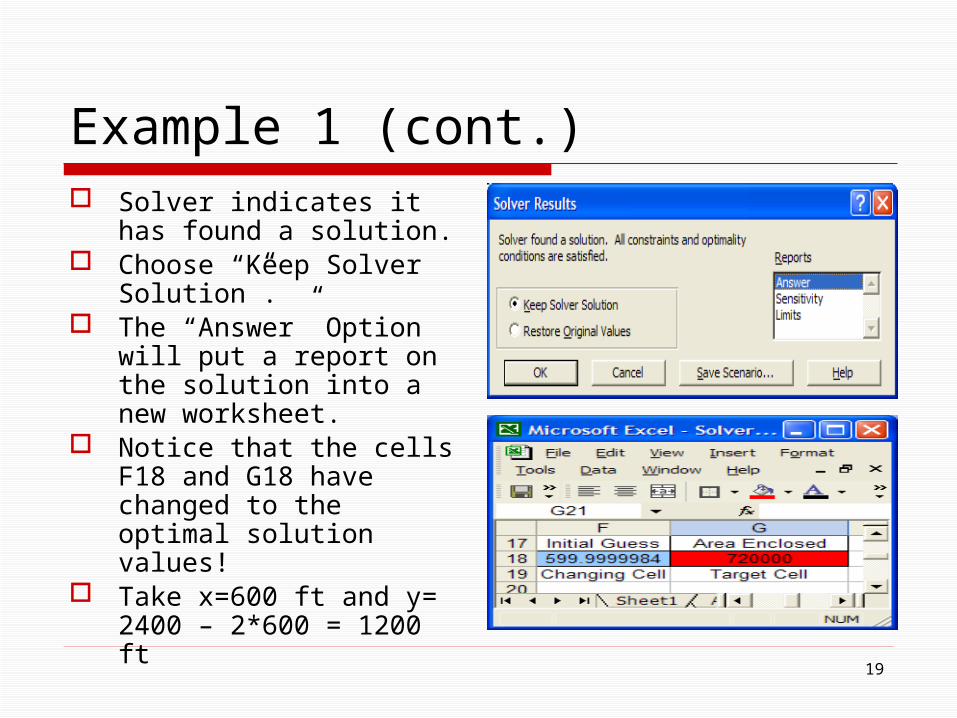
Example 1 (cont.) Solver indicates it has
found a solution. Choose “Keep Solver
Solution”. The “Answer” Option will
put a report on the solution into a new worksheet.
Notice that the cells F18 and G18 have changed to the optimal solution values!
Take x=600 ft and y= 2400 – 2*600 = 1200 ft

20
Example 2 Find a line of the
form Y = a*x+b that minimizes the sum of the squares for error, i.e. minimizes the function (yi-Yi)2 for i = 1,2, … n.
x y
1939 32800
1944 55800
1949 73600
1954 138000
1959 202000
1964 257000
1969 301000
1974 584000

Example 2 (cont.) Put the given table of data into Excel
and add a column labeled Y = a*x+b.
For initial guesses for a and b, use the points (1939,32800) and (1974,584000) to construct the point-slope form of the line through these points.
Thus, we can take: a = (584000-32800)/(1974-1939) b = 32800 - a*1939
Using these values for a and b, fill in the column for the best-fit line Y = a*x+b and plot the actual values along with the best-fit line values.
In the cell just below the best-fit line column, use the function SUMXMY2 to compute the sums of the squares of the differences between elements in the y – column and the Y – column.
21

22
Example 2 (cont.) Choose the sum of the
squares for error as the Target Cell, the cells containing a and b as the Changing Cells, and Minimum in the Solver!
Excel finds that the optimum choices are
a = 13568.094 and b = -26340456.1 Compare to the
numbers found with Excel’s Trendline!

23
Example 2 (cont.)

24
Example 2 (cont.)
Repeat example 2, but use a function of the form Y = A*e^(k*t), where t is the number of years after 1939.
Change the input values accordingly. Choose initial values of A = 32800 and
k = 0.07. If there is not convergence to a solution,
increase the number of iterations and choose Automatic Scaling!

25
Example 2 (cont.)
26
Example 3 An office manager needs to
purchase new filing cabinets. At the local superstore Office Min, Ace cabinets cost $40 each, require 6 square feet of floor space, and hold 24 cubic feet of files. On the other hand, each Excello cabinet costs $80, requires 8 square feet of floor space, and holds 36 cubic feet. The manager’s budget permits spending no more than $560 on files, while the office has space for no more than 72 square feet of cabinets. The manager desires the greatest storage capacity within the limitations imposed by funds and space. How many of each cabinet should be purchased?

27
Example 3 (cont.)We can formulate this situation as a linear
programming problem.Let x1= the number of Ace cabinets to be
bought.Let x2 = the number of Excello cabinets to
be bought.Let Z = the total storage capacity of
cabinets purchased. Summarize the given information in a table:
28
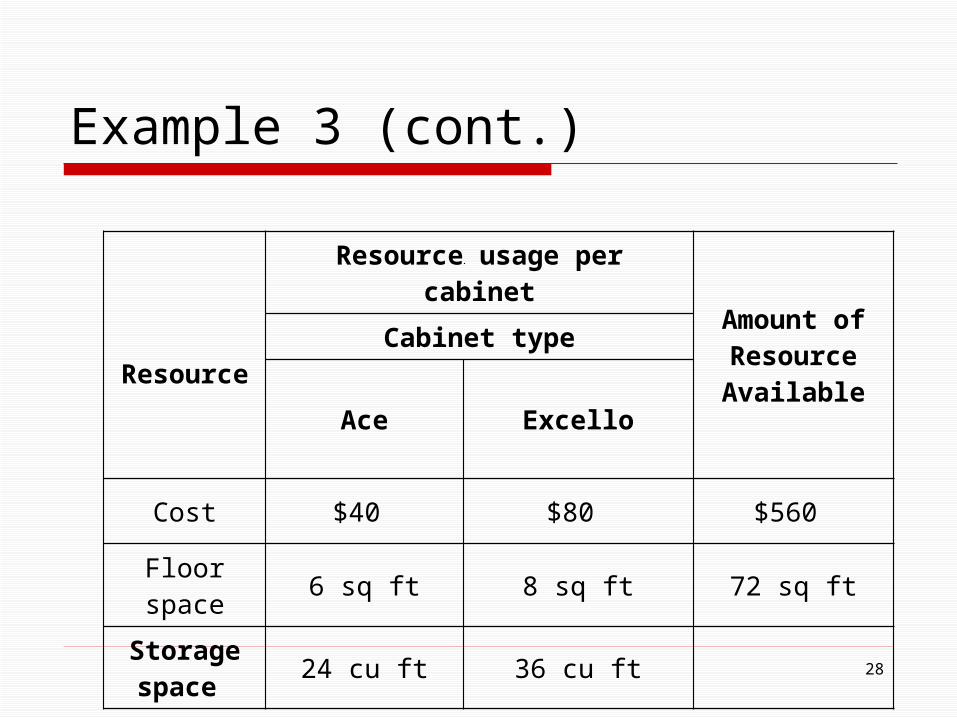
Example 3 (cont.)
Resource
Resource usage per cabinet
Amount of Resource Available
Cabinet type
Ace Excello
Cost $40 $80 $560
Floor space 6 sq ft 8 sq ft 72 sq ft
Storage space 24 cu ft 36 cu ft
29
Example 3 (cont.)We call x1 and x2 decision variables for this
model.From the bottom row of the table, we get the
objective function:Z = 24 x1 + 36 x2 (1)The objective function (1) gives the amount
of storage space in cubic feet for a choice of x1 and x2.
In this case, the objective is to maximize Z.

30
Example 3 (cont.) From rows 1 and 2 of the table, we get restrictions on
our choices of x1 and x2 due to a limit on what we can spend and the size of the office.40 x1 + 80 x2 ≤ 560 (2) 6 x1 + 8 x2 ≤ 72 (3)
We also wantx1 ≥ 0 (4)x2 ≥ 0 (5)
The last two restrictions on x1 and x2 make sense physically.
We call equations (2) - (5) constraint equations.

31
Example 3 (cont.)Our model for deciding how to allocate file
cabinets is as follows:Maximize: Z = 24 x1 + 36 x2
Subject to the restrictions:40 x1 + 80 x2 ≤ 560 (cost)
6 x1 + 8 x2 ≤ 72 (space)
andx1 ≥ 0; x2 ≥ 0.

32
Example 3 (cont.) From the Defined
Names group of the Formulas tab, use Define Name or the Name Manager to assign names to cells we will use in formulas.
This can also be done by right-clicking on a range of cells and choosing Name a Range.

33
Example 3 (cont.)

34
Example 3 (cont.)

35
Example 3 (cont.)
36
References Calculus with Early Transcendentals
(5th ed) by James Stewart Finite Mathematics and Calculus with
Applications (4th ed) by Margaret Lial, Charles Miller, and Raymond Greenwell
Introduction to Operations Research (8th ed) by Frederick Hillier and Gerald Leiberman