241 root cause analysis on a multistage centrifugal pump ... · root cause analysis on a multistage...
TRANSCRIPT

Root Cause Analysis on a
Multistage Centrifugal Pump in a
Power Plant due to Shaft Crack
Based on ODS and FEA
27th International Pump Users SymposiumGeorge R. Brown Convention Center
Houston, TXSeptember 12 - 15, 2011
By:
Maki OnariMechanical Solutions, Inc.
Whippany, NJ 07981 USA
Tel: (973) 326-9920
www.mechsol.com
241

• Two multistage barrel type pumps for each 1200 MW Unit were installed in 1986 in a large power plant.
• The 11 stage centrifugal pumps were designated as Pump(s) 1A/B and Pump(s) 2A/B. All impellers were designed with 6 vanes and 8 diffuser vanes.
• The pumps are driven by 600 HP four-pole induction motors (1,770 rpm or 29.5 Hz) through a gear increaser (output speed of 4,860 rpm or 81 Hz).
• Rated capacity: 350 GPM and 2,516 ft of TDH
• Normal capacity: 150 GPM (43% BEP).
Introduction
242
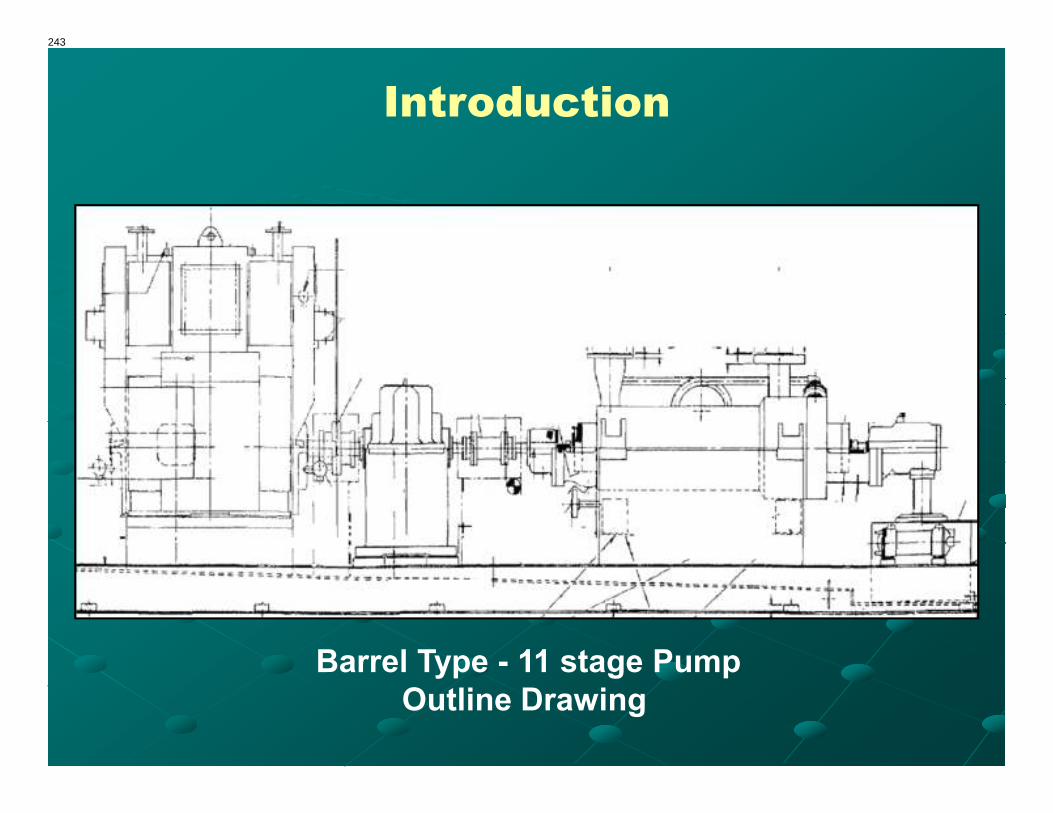
Barrel Type - 11 stage PumpOutline Drawing
Introduction
243

Barrel Type - 11 stage Pump
Introduction
244

• Three pump shaft failures (cracks) have been detected since Pump 1B installation (MTBF=7.7 years).
• In 1989, the first failure took place, but the failure analysis was not properly documented and the failed shaft was not saved.
• In 1999, a crack was found at the rear end of the 9th
stage hub.
• In December 2007, the last failure was discovered under the 11th stage impeller hub with evidence of fretting. A circumferential crack was found at the keyway with 132 degrees arc. The vibration level of the pump had been always considered low and adequate.
Background History
245

Background History
2007 Failure after 8 years of operation.Crack detected under 11th stage impeller hub.
246

Background History
2007 Failure after 8 years of operation.Crack detected under 11th
stage impeller hub with the origin away from the keyway.
247
Specialized Testing
� Experimental Modal Analysis (EMA) test to determine the natural frequencies of the impeller, pump structure, and the rotor system with their mode shapes.
� Monitoring test during transient and steady operation to monitor the vibration amplitude and natural frequencies.
� Dynamic pressure transducer data from suction, discharge, and balance line.
� Operating Deflection Shape (ODS) testing during steady operation.
248

11th Stage Impeller
EMA Testing
249

11th Stage Impeller Modal Impact Test
Vibration EMA Test
250

Vibration EMA Test
FRF Wet
Impeller Model
11th Stage Impeller Modal Impact Test
251

11th Stage Impeller Modal Impact Test
Vibration EMA Test
2 Nodal Diameter / 0 Nodal Circle at 2620 Hz
252

11th Stage Impeller Modal Impact Test (Wet)
Vibration EMA Test
Interference Diagram
Interference Diagram11th Stage of 2 1/2 RLIJ Pacific Pump (Wet Impeller)
6 Rotating Vanes and 8 Diffuser Vanes
0
1000
2000
3000
4000
5000
0 1 2 3 4 5 6
Nodal Diameter
Fre
qu
en
cy
(H
z)
1x VPF
1x Diff VPF
2x Diff VPF
1x V_Dir_Exc
1x V_Dif_Exc
2x V_Dir_Exc
0NC
253

Specialized Field Testing
254

Pump 1B Typical Spectrum OBB in theVertical Direction
Vibration Monitoring
Autospectrum(Signal 5) - Mark 1 (Magnitude)
Working : ODS2 : Input : FFT Analyzer
0 100 200 300 400 500 600 700 800
100u
300u
1m
3m
10m
30m
100m
300m
1
[Hz]
[g] Autospectrum(Signal 5) - Mark 1 (Magnitude)
Working : ODS2 : Input : FFT Analyzer
0 100 200 300 400 500 600 700 800
100u
300u
1m
3m
10m
30m
100m
300m
1
[Hz]
[g]
0.15 in/s peak @ 1x rpm 0.16 in/s peak @ 4x motor rpm
Pump Operating at 145 GPM
Pump 2B Typical Spectrum OBB in theVertical Direction
Autospectrum(Signal 1) - Mark 1 (Magnitude)
Working : 2B Linear Average : Input : FFT Analyzer
0 100 200 300 400 500 600 700 800
100u
300u
1m
3m
10m
30m
100m
300m
1
[Hz]
[g] Autospectrum(Signal 1) - Mark 1 (Magnitude)
Working : 2B Linear Average : Input : FFT Analyzer
0 100 200 300 400 500 600 700 800
100u
300u
1m
3m
10m
30m
100m
300m
1
[Hz]
[g]
0.06 in/s peak @ 1x rpm
0.06 in/s peak @ 4x motor rpm
Pump Operating at 160 GPM
255

Vibration Monitoring
Autospectrum(Signal 12) - Mark 1 (Magnitude)
Working : 1B Linear Ave at 100 GPM : Input : FFT Analyzer
0 100 200 300 400 500 600 700 800
10u
100u
1m
10m
100m
1
[Hz]
[mil] Autospectrum(Signal 12) - Mark 1 (Magnitude)
Working : 1B Linear Ave at 100 GPM : Input : FFT Analyzer
0 100 200 300 400 500 600 700 800
10u
100u
1m
10m
100m
1
[Hz]
[mil]
0.46 mils pk-pk @ ~30 Hz
Pump 1B Axial Proximity Probe FFT at OBB
Pump 1B Axial Proximity Probe Time Signature at OBB
Time(Signal 12) - Mark 1
Working : 1B Linear Ave at 100 GPM : Input : FFT Analyzer
0 100m 200m 300m 400m 500m 600m 700m 800m 900m
- 600m
- 400m
- 200m
0
200m
400m
600m
[s]
[mil] Time(Signal 12) - Mark 1
Working : 1B Linear Ave at 100 GPM : Input : FFT Analyzer
0 100m 200m 300m 400m 500m 600m 700m 800m 900m
- 600m
- 400m
- 200m
0
200m
400m
600m
[s]
[mil]
28.3 Hz29.5 Hz
256

Vibration Monitoring
Autospectrum(Signal 12) - Mark 1 (Magnitude)
Working : 2B Linear Average : Input : FFT Analyzer
0 100 200 300 400 500 600 700 800
100u
300u
1m
3m
10m
30m
100m
300m
[Hz]
[mil] Autospectrum(Signal 12) - Mark 1 (Magnitude)
Working : 2B Linear Average : Input : FFT Analyzer
0 100 200 300 400 500 600 700 800
100u
300u
1m
3m
10m
30m
100m
300m
[Hz]
[mil]
0.4 mils pk-pk @ 81 Hz
0.04 mils pk-pk @ ~30 Hz
Pump 2B Axial Proximity Probe FFT at OBB
Pump 2B Axial Proximity Probe Time Signature at OBB
Time(Signal 12) - Input
Working : Input : Input : FFT Analyzer
0 40m 80m 120m 160m 200m 240m 280m 320m 360m 400m 440m 480m
- 600m
- 400m
- 200m
0
200m
400m
600m
[s]
[mil] Time(Signal 12) - Input
Working : Input : Input : FFT Analyzer
0 40m 80m 120m 160m 200m 240m 280m 320m 360m 400m 440m 480m
- 600m
- 400m
- 200m
0
200m
400m
600m
[s]
[mil]
81 Hz
257

Pump Rotor Modal Impact
Testing During Operation
258

Pump 1B Axial Proximity Probe FRF
Experimental Modal Analysis
“Bump” Test
Pump operating at 160 GPM
Frequency Response(Signal 12,Signal 17) - Mark 1 (Magnitude)
Working : Axial Hits Channel 12 Axial Prox Probe 100 GPM : Input : Enhanced
0 100 200 300 400 500 600 700 800
10u
30u
100u
300u
1m
3m
[Hz]
[mil/lbf] Frequency Response(Signal 12,Signal 17) - Mark 1 (Magnitude)
Working : Axial Hits Channel 12 Axial Prox Probe 100 GPM : Input : Enhanced
0 100 200 300 400 500 600 700 800
10u
30u
100u
300u
1m
3m
[Hz]
[mil/lbf]
29.5 Hz (1x motor speed)
121.2 Hz
OBB natural
frequency
Frequency Response(Signal 12,Signal 17) - Input (Magnitude)
Working : Input : Input : Enhanced
0 100 200 300 400 500 600 700 800
10u
30u
100u
300u
1m
3m
10m
[Hz]
[mil/lbf] Frequency Response(Signal 12,Signal 17) - Input (Magnitude)
Working : Input : Input : Enhanced
0 100 200 300 400 500 600 700 800
10u
30u
100u
300u
1m
3m
10m
[Hz]
[mil/lbf]
81 Hz (1x pump speed)
118.2 Hz (4x motor speed)
OBB natural
frequency
Pump 2B Axial Proximity Probe FRF
259

Operating Deflection Shape
(ODS)
260

Operating Deflection Shape
• Natural excitation signature of the pump train structure.
• Over 700 vibration measurements.
• Data base of amplitude vs. frequency and phase angle.
• 3-D CAD model assigning motion to each individual vibration data point.
• Create animations of the pump
261

Operating Deflection Shape
Pump 1B ODS @ 29.9 Hz
262

Operating Deflection Shape
Pump 1B ODS @ 81 Hz
263

Operating Deflection Shape
Pump 2B ODS @ 29.9 Hz
264

Operating Deflection Shape
Pump 2B ODS @ 81 Hz
265

Finite Element Analysis
(FEA)
266

Axi-symmetric Model
and FEA Breakup
267

Time(Signal 12) - Mark 1
Working : 1B Linear Ave at 100 GPM : Input : FFT Analyzer
0 100m 200m 300m 400m 500m 600m 700m 800m 900m
- 600m
- 400m
- 200m
0
200m
400m
600m
[s]
[mil] Time(Signal 12) - Mark 1
Working : 1B Linear Ave at 100 GPM : Input : FFT Analyzer
0 100m 200m 300m 400m 500m 600m 700m 800m 900m
- 600m
- 400m
- 200m
0
200m
400m
600m
[s]
[mil]
28.3 Hz
Axi-symmetric Model
Impeller Loading
Axial displacement in displacement (mils pk-pk) and acceleration (g’s)
29.5 Hz
268

Load Step 1:
• Initiate and complete the interference fit between theimpeller and the shaft (2 mils diametral interference)
• Constrain the outboard end of shaft at the thrust bearingLoad Step 2:
• Ramp up an axially applied pressure of 75 psi load to theinboard end over 0.0001sec (30 g’s peak acceleration).
Load Step 3:• Ramp pressure down to a 0 psi over an additional
0.0001sec.Load Step 4:
• Run for an additional 0.001 sec to monitor the traveling ofthe acoustic waves and the impeller interface conditions.
Axi-symmetric Model
Impeller Loading
269

Axi-symmetric Model
FEA Results
• Transient dynamic analysis revealed that acoustic wavepropagation past the impellers can result in micro-motion at the press fit interfaces.
• An idealized axi-symmetric model of the pump shaft andthe last stage impeller predicted an impeller to shaftsliding condition.
• This sliding condition led to fretting damage and thecrack initiation.
270

Axi-symmetric Model
FEA Results
271

FEA-Based Fracture
Mechanics Approach• Assume that relative sliding velocity between the
impeller and shaft is equal to the peak axial shaft velocitymeasured on the end of shaft near the thrust bearing.
• Assume that fretting condition and asperities on shaftsurface cause the impeller to axially lock-up against theshaft.
• Model the lock-up behavior as an axial impact betweenthe shaft and impeller in the region of the assumed 5 milcrack.
• Using transient dynamic FEA predict the stressdistribution near the crack and calculate the stressintensity factor.
• Check whether crack propagation can be expected.
272

FEA-Based Fracture
Mechanics Approach
0.005 inch crackexplicitly modeled
Impact Velocity 31 in/s pk(15 g’s pk at 29.9Hz)
273

FEA-Based Fracture
Mechanics Approach
Double Peak due toImpeller Flexing andSpring-back
von Mises Stress (psi) at Rootof Crack During Impact Event
274

FEA-Based Fracture
Mechanics Approachvon Mises Stress Distribution (psi) Macro View
275

FEA-Based Fracture
Mechanics Approachvon Mises Stress Distribution (psi) In Vicinity of Crack
Crack Root
Impact Location
ANSYS Calculated Stress Intensity Factor ∆KI = 16.3 ksi√in
)1.1(aKZ
πσ∆=∆
276

FEA-Based Fracture
Mechanics Approach
ANSYS Ki Output
Calculate mixed-mode stress intensity factors• Assume plane strain conditions.• Assume a full-crack model (use 5 nodes)• Extrapolation path is defined by nodes: 2044520,
2044672, 2044683, 2047304, 2047315• With node 2044520 as the crack-tip node.• Use material properties for material number 1 with
Ex = 0.29e+08 µxy = 0.30 at temp = 0.00.
Ki = 16315. , Kii = 7826.4 , kiii = 0.0000
277

Implemented Fixes
• A new gear set was installed in the last outage in Fall 2009.
• Both gear couplings were replaced.
• New pump element installed.
• Monitoring of pump shaft axial vibration and gear drive vibration adjusted to address imposed duty on pump shaft due to less than smooth mesh of gears.
• Gear set removed mapped.
278

• The root cause of the repetitive cracking of the pumpshaft is due to a fatigue process while the pump shaft isoscillating axially driven by the gear tooth circumferentialrun-out.
• The axial mismatch of the helical gear set (apex) was thecause of the axial displacement of the pump shaft at thedriver’s operating speed, generating an impulsivedisplacement load due to a geometric abnormality of thegear teeth of the input shaft gear (axial run-out).
• The ODS test performed on Pump 1B at the runningspeed of the motor (30 Hz) indicated high axial motion ofthe pump shaft driving the OBB with a vertical rockingmotion. The gearbox moved axially with some phase lagwith respect to the pump shaft and the motor casing.
Conclusions
279

• The vibration test performed on Pump 2B did not indicateany abnormal axial motion of the pump shaft at therunning speed of the motor (0.04 mils pk-pk versus 0.5mils pk-pk measured on Pump 1B).
• Traditional troubleshooting approaches probably wouldnot have indicated a gear/pump inter-related problem,and would not have provided such clear visual evidencefor decision makers.
• ODS / EMA coupled with appropriate analysis is apowerful troubleshooting tool to facilitate and visuallyunderstand the most difficult vibration problems inturbomachinery and pumping systems.
Conclusions
280

281

Thank you
Any Questions…?
282