23 evolution of populations the smallest unit of evolution one misconception is that organisms...
TRANSCRIPT
23 Evolution of PopulationsThe Smallest Unit of Evolution
• One misconception is that organisms evolve during their lifetimes
• Natural selection acts on individuals, but only populations evolve
• Consider, for example, a population of medium ground finches on Daphne Major Island
– During a drought, large-beaked birds were more likely to crack large seeds and survive
– The finch population evolved by natural selection
© 2011 Pearson Education, Inc.
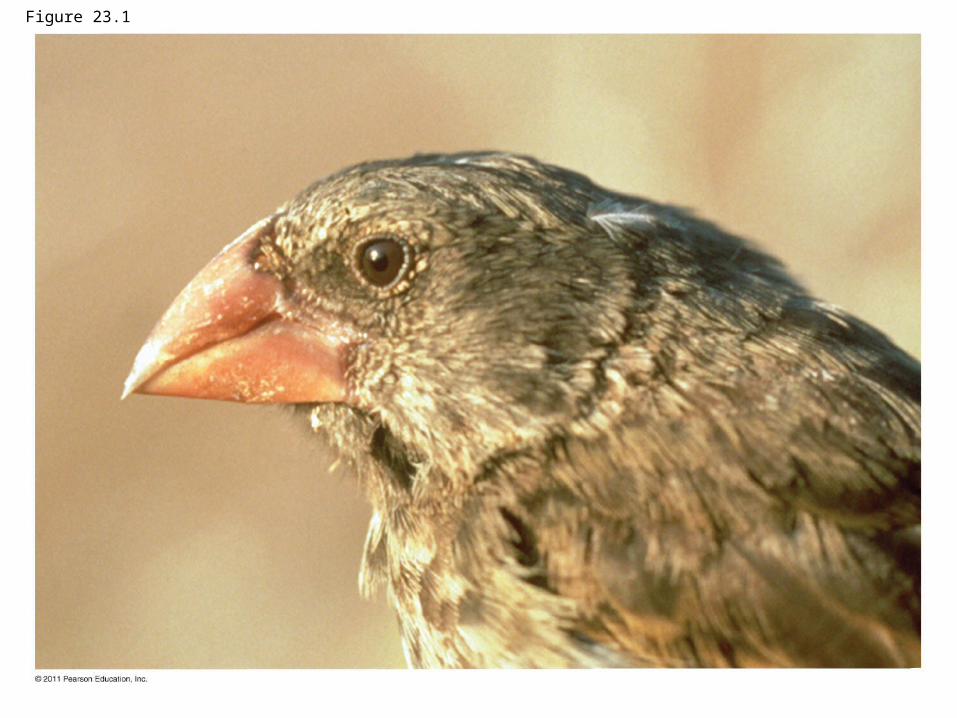
Figure 23.1
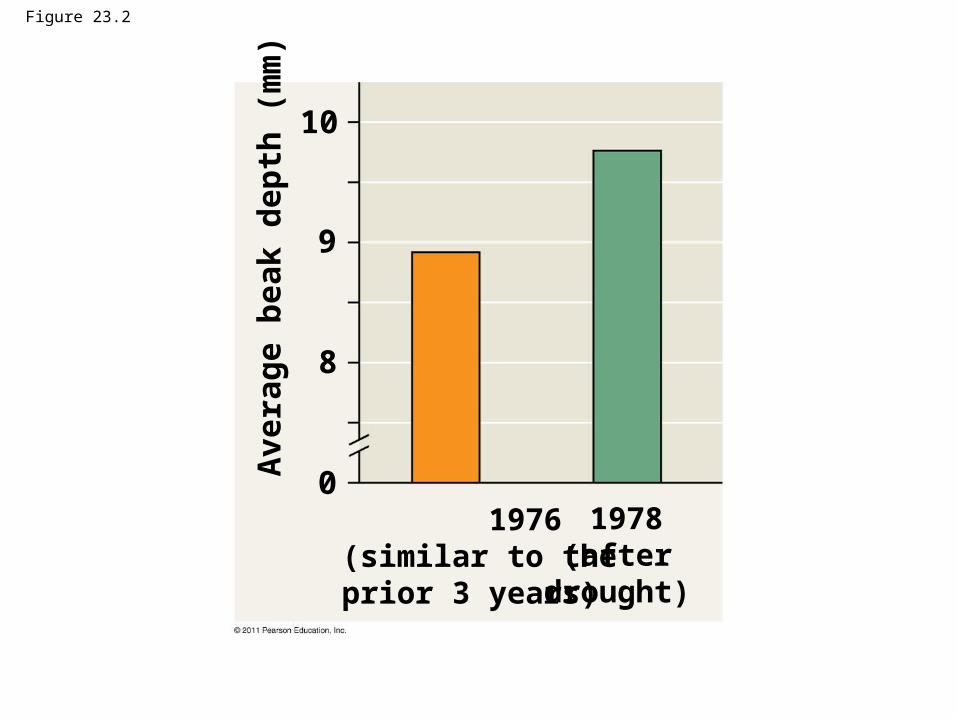
Figure 23.2
1976(similar to theprior 3 years)
1978(after
drought)
Ave
rag
e b
eak
dep
th (
mm
)
10
9
8
0
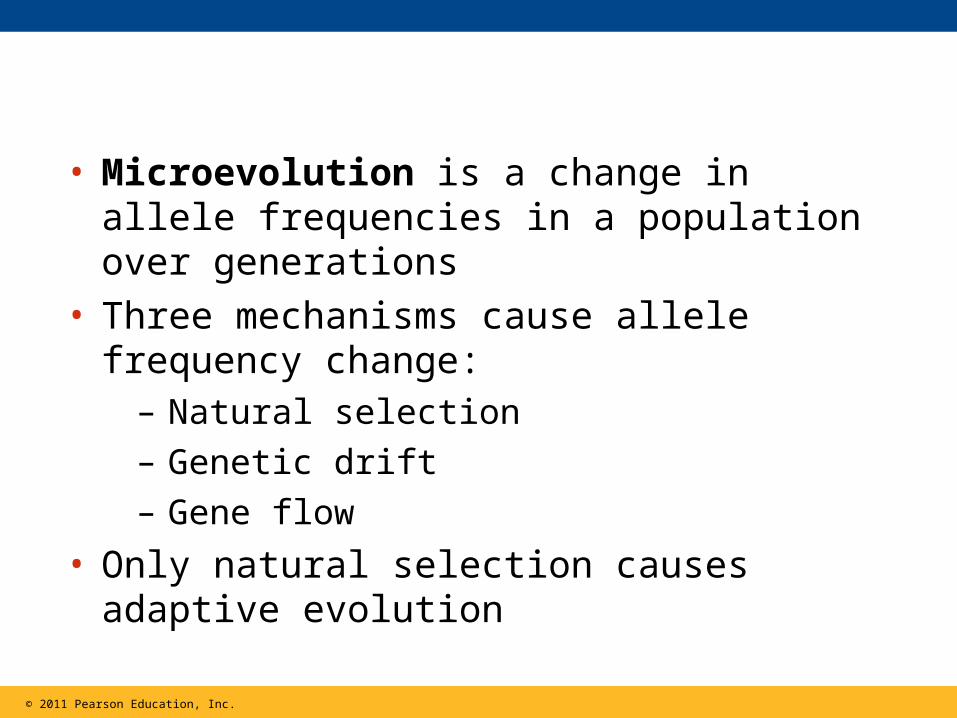
• Microevolution is a change in allele frequencies in a population over generations
• Three mechanisms cause allele frequency change:
– Natural selection
– Genetic drift
– Gene flow
• Only natural selection causes adaptive evolution
© 2011 Pearson Education, Inc.
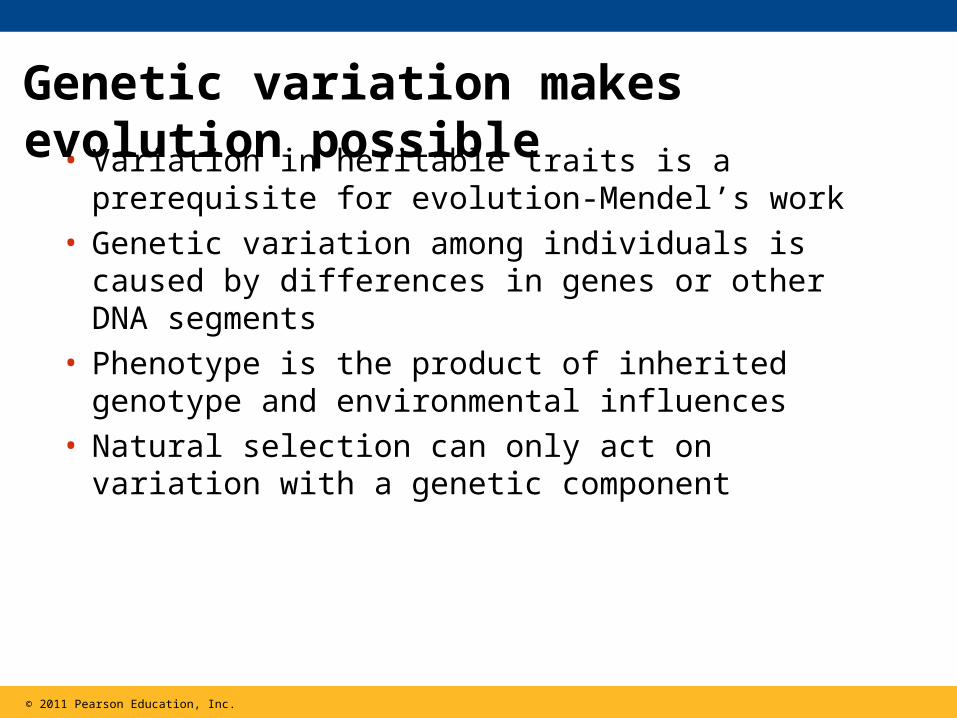
• Variation in heritable traits is a prerequisite for evolution-Mendel’s work
• Genetic variation among individuals is caused by differences in genes or other DNA segments
• Phenotype is the product of inherited genotype and environmental influences
• Natural selection can only act on variation with a genetic component
Genetic variation makes evolution possible
© 2011 Pearson Education, Inc.
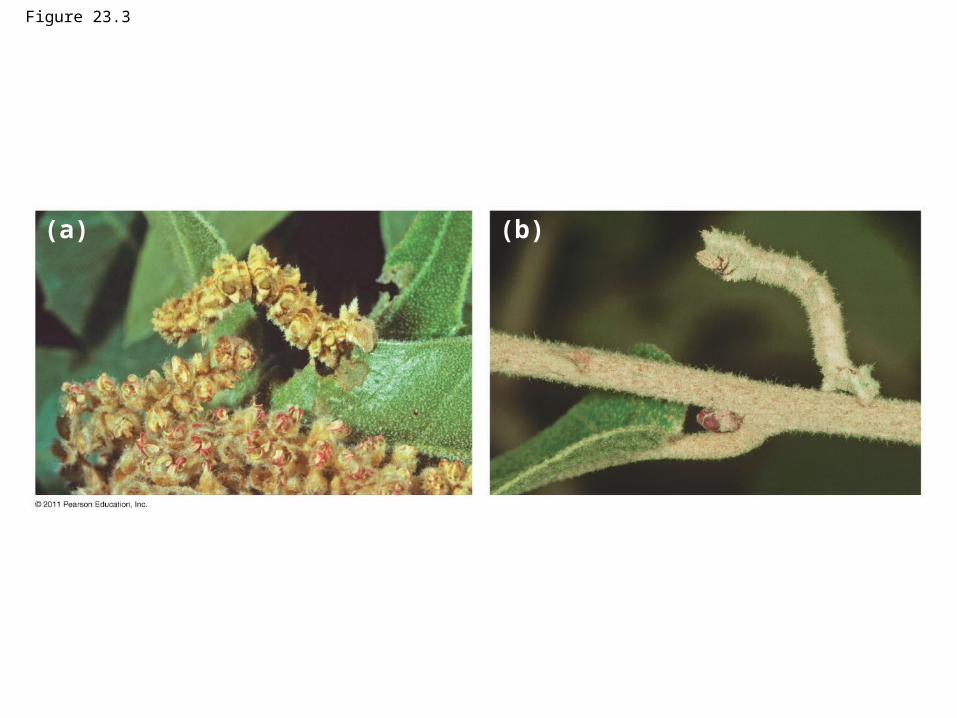
Figure 23.3
(a) (b)

Variation Within a Population
• Genetic variation can be measured as gene variability or nucleotide variability
• For gene variability, average heterozygosity measures the average percent of loci that are heterozygous in a population
• Nucleotide variability is measured by comparing the DNA sequences of pairs of individuals
© 2011 Pearson Education, Inc.
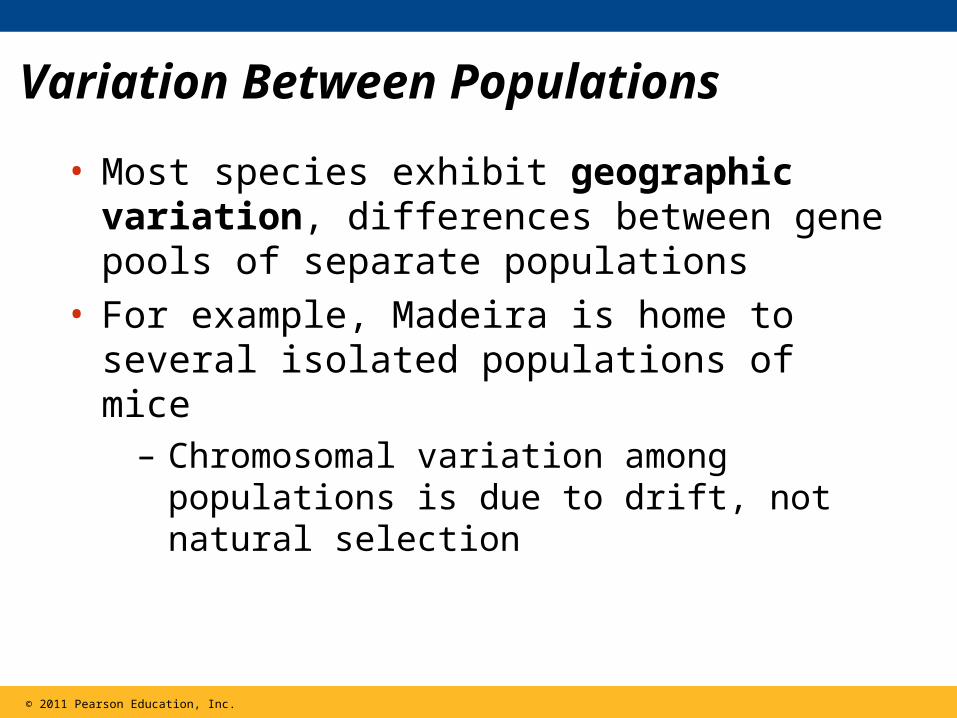
Variation Between Populations
• Most species exhibit geographic variation, differences between gene pools of separate populations
• For example, Madeira is home to several isolated populations of mice
– Chromosomal variation among populations is due to drift, not natural selection
© 2011 Pearson Education, Inc.
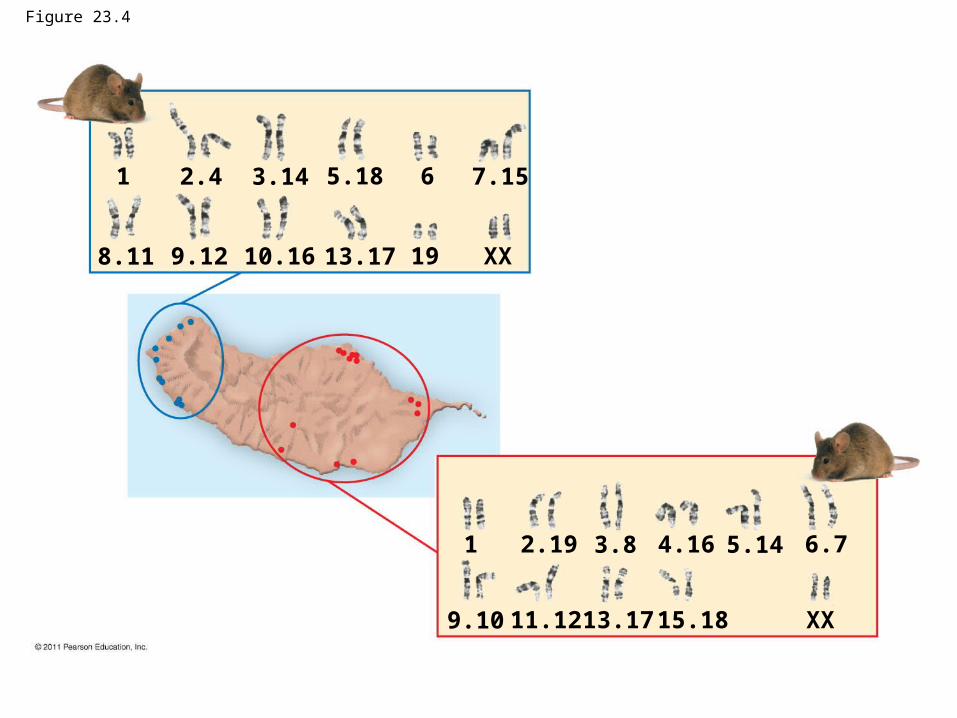
Figure 23.4
1 2.4
8.11 9.12 10.16
3.14
13.17
5.18
19
6
XX
7.15
1 2.19
9.10 11.12 13.17
3.8
15.18
4.16 5.14
XX
6.7
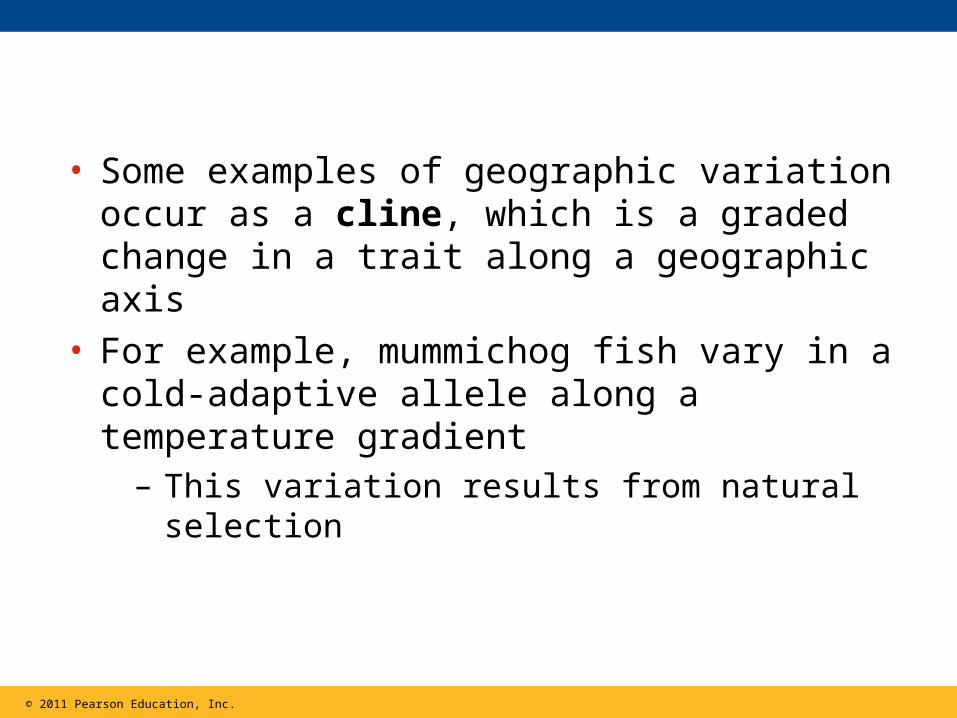
• Some examples of geographic variation occur as a cline, which is a graded change in a trait along a geographic axis
• For example, mummichog fish vary in a cold-adaptive allele along a temperature gradient
– This variation results from natural selection
© 2011 Pearson Education, Inc.
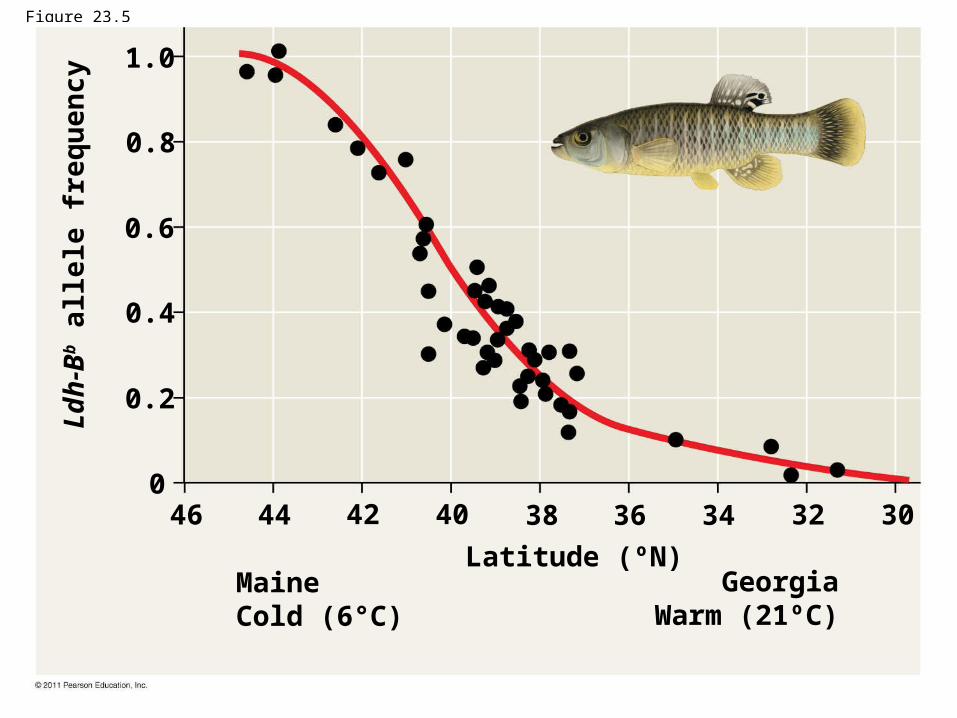
Figure 23.5
1.0
0.8
0.6
0.4
0.2
046 44 42 40 38 36 34 32
MaineCold (6°C)
Latitude (ºN)Georgia
Warm (21ºC)
Ld
h-B
b a
llel
e fr
equ
ency
30
Sources of Genetic Variation
• New genes and alleles can arise by mutation or gene duplication
• The effects of point mutations can vary:– Mutations in noncoding regions of DNA are often
harmless
– Mutations in a genes can be neutral because of redundancy in the genetic code
© 2011 Pearson Education, Inc.
Altering Gene Number or Position
• Chromosomal mutations that delete, disrupt, or rearrange many loci are typically harmful
• Duplication of small pieces of DNA increases genome size and is usually less harmful
• Duplicated genes can take on new functions by further mutation
• An ancestral odor-detecting gene has been duplicated many times: humans have 1,000 copies of the gene, mice have 1,300
© 2011 Pearson Education, Inc.
Rapid Reproduction
• Mutation rates are low in animals and plants• The average is about one mutation in every
100,000 genes per generation• Mutations rates are often lower in prokaryotes
and higher in viruses
© 2011 Pearson Education, Inc.
Sexual Reproduction
• Sexual reproduction can shuffle existing alleles into new combinations
• In organisms that reproduce sexually, recombination of alleles is more important than mutation in producing the genetic differences that make adaptation possible
© 2011 Pearson Education, Inc.
The Hardy-Weinberg equation can be used to test whether a population is evolving
• The first step in testing whether evolution is occurring in a population is to clarify what we mean by a population
© 2011 Pearson Education, Inc.
Gene Pools and Allele Frequencies
• A population is a localized group of individuals capable of interbreeding and producing fertile offspring
• A gene pool consists of all the alleles for all loci in a population
• A locus is fixed if all individuals in a population are homozygous for the same allele
© 2011 Pearson Education, Inc.

Figure 23.6
Porcupine herd
Beaufort Sea
Porcupine herd range
Fortymile herd range
Fortymile herd
NO
RTH
WEST
TERR
ITOR
IES
AL
AS
KA
CA
NA
DA
MAPAREA
AL
AS
KA
YU
KO
N
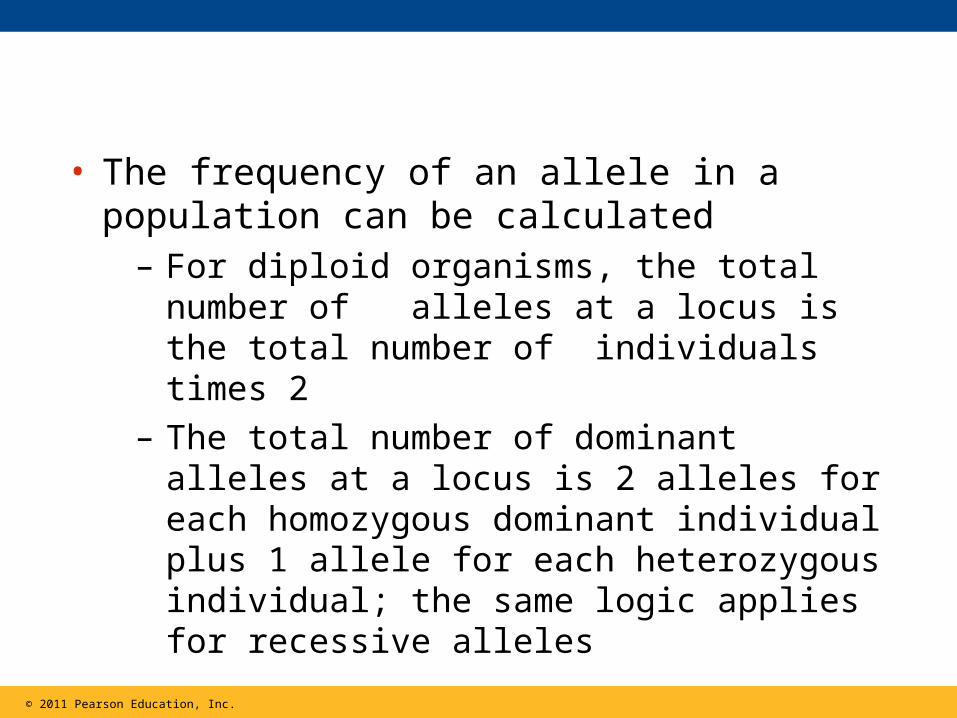
• The frequency of an allele in a population can be calculated
– For diploid organisms, the total number of alleles at a locus is the total number of individuals times 2
– The total number of dominant alleles at a locus is 2 alleles for each homozygous dominant individual plus 1 allele for each heterozygous individual; the same logic applies for recessive alleles
© 2011 Pearson Education, Inc.
• By convention, if there are 2 alleles at a locus, p and q are used to represent their frequencies
• The frequency of all alleles in a population will add up to 1
– For example, p + q = 1
© 2011 Pearson Education, Inc.
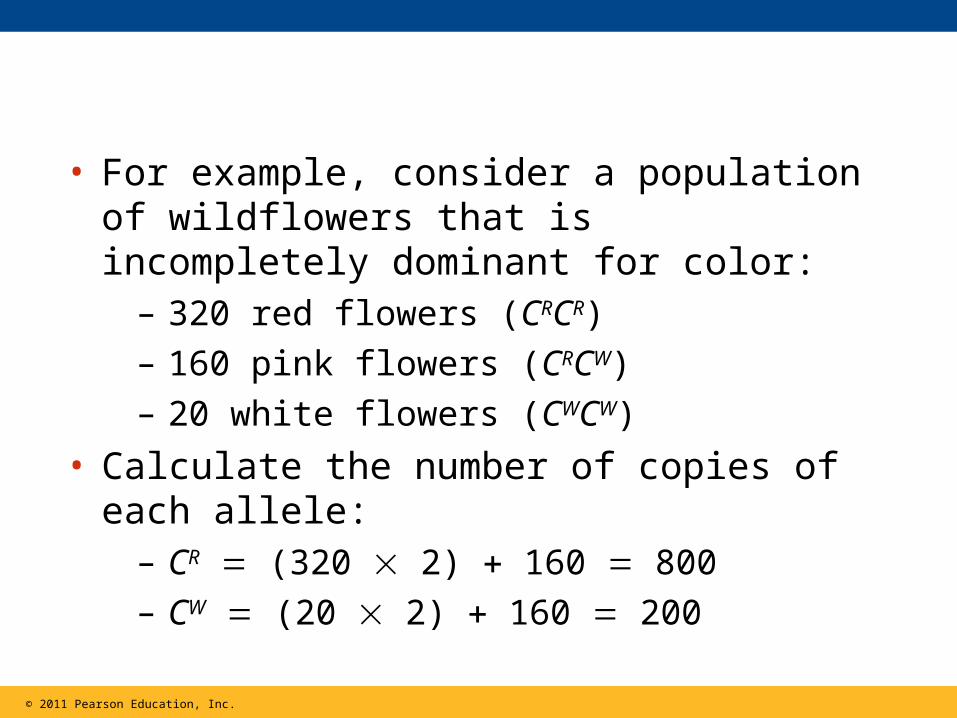
• For example, consider a population of wildflowers that is incompletely dominant for color:
– 320 red flowers (CRCR)
– 160 pink flowers (CRCW)
– 20 white flowers (CWCW)
• Calculate the number of copies of each allele:– CR (320 2) 160 800
– CW (20 2) 160 200
© 2011 Pearson Education, Inc.
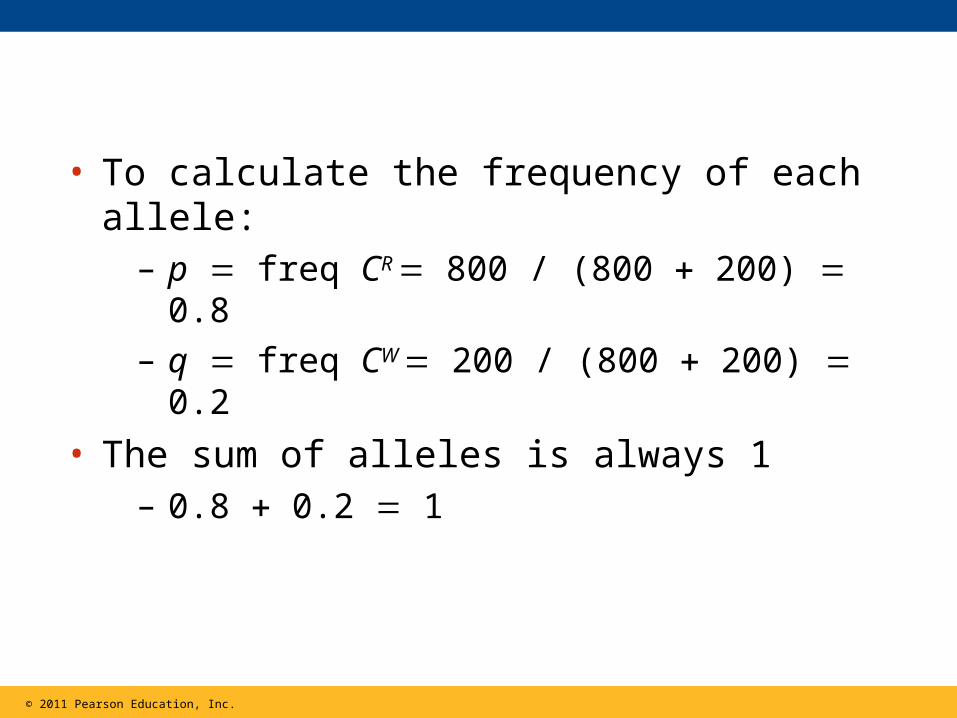
• To calculate the frequency of each allele:– p freq CR 800 / (800 200) 0.8
– q freq CW 200 / (800 200) 0.2
• The sum of alleles is always 1– 0.8 0.2 1
© 2011 Pearson Education, Inc.
The Hardy-Weinberg Principle
• The Hardy-Weinberg principle describes a population that is not evolving
• If a population does not meet the criteria of the Hardy-Weinberg principle, it can be concluded that the population is evolving
© 2011 Pearson Education, Inc.
Hardy-Weinberg Equilibrium
• The Hardy-Weinberg principle states that frequencies of alleles and genotypes in a population remain constant from generation to generation
• In a given population where gametes contribute to the next generation randomly, allele frequencies will not change
• Mendelian inheritance preserves genetic variation in a population
© 2011 Pearson Education, Inc.
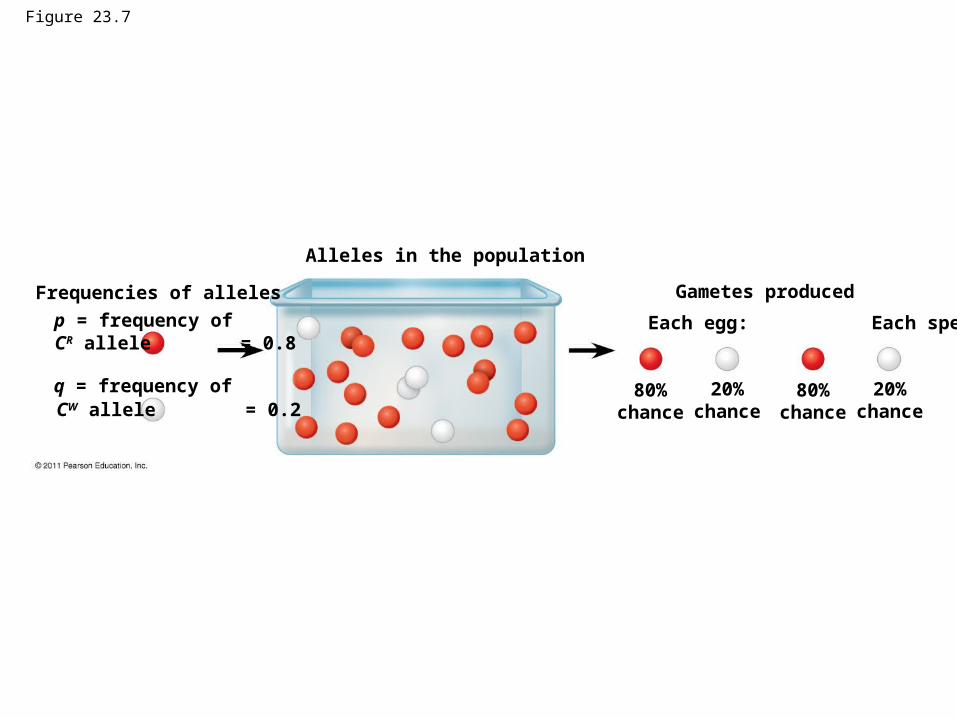
Figure 23.7
Alleles in the population
Gametes produced
Each egg: Each sperm:
80%chance
20%chance
80%chance
20%chance
Frequencies of alleles
p = frequency of
q = frequency ofCW allele = 0.2
CR allele = 0.8
• Hardy-Weinberg equilibrium describes the constant frequency of alleles in such a gene pool
• Consider, for example, the same population of 500 wildflowers and 100 alleles where
– p freq CR 0.8– q freq CW 0.2
© 2011 Pearson Education, Inc.
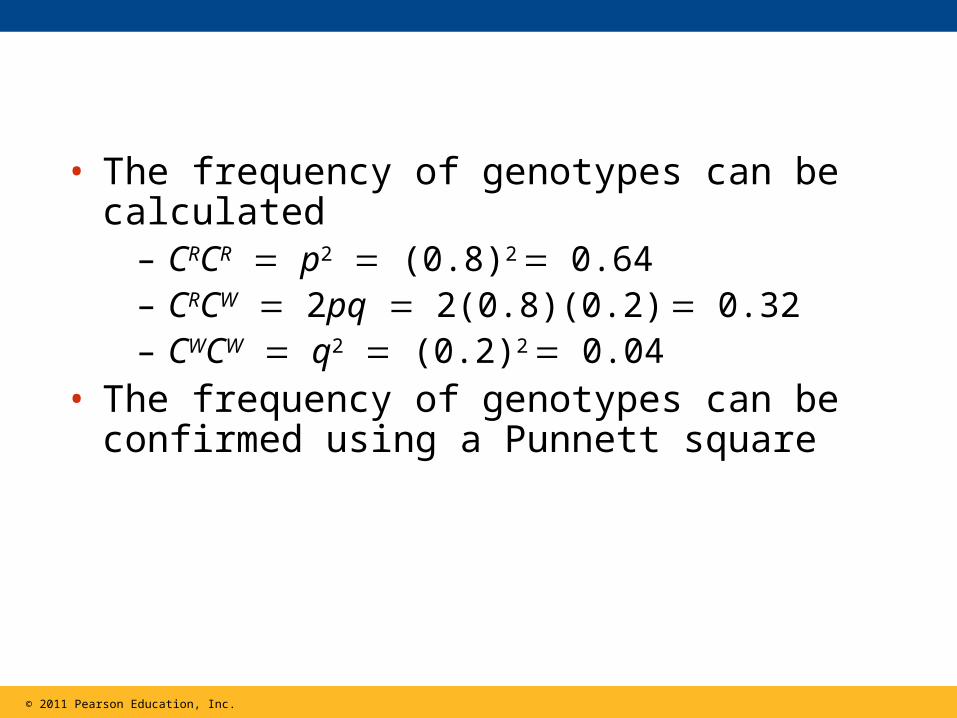
• The frequency of genotypes can be calculated
– CRCR p2 (0.8)2 0.64– CRCW 2pq 2(0.8)(0.2) 0.32– CWCW q2 (0.2)2 0.04
• The frequency of genotypes can be confirmed using a Punnett square
© 2011 Pearson Education, Inc.
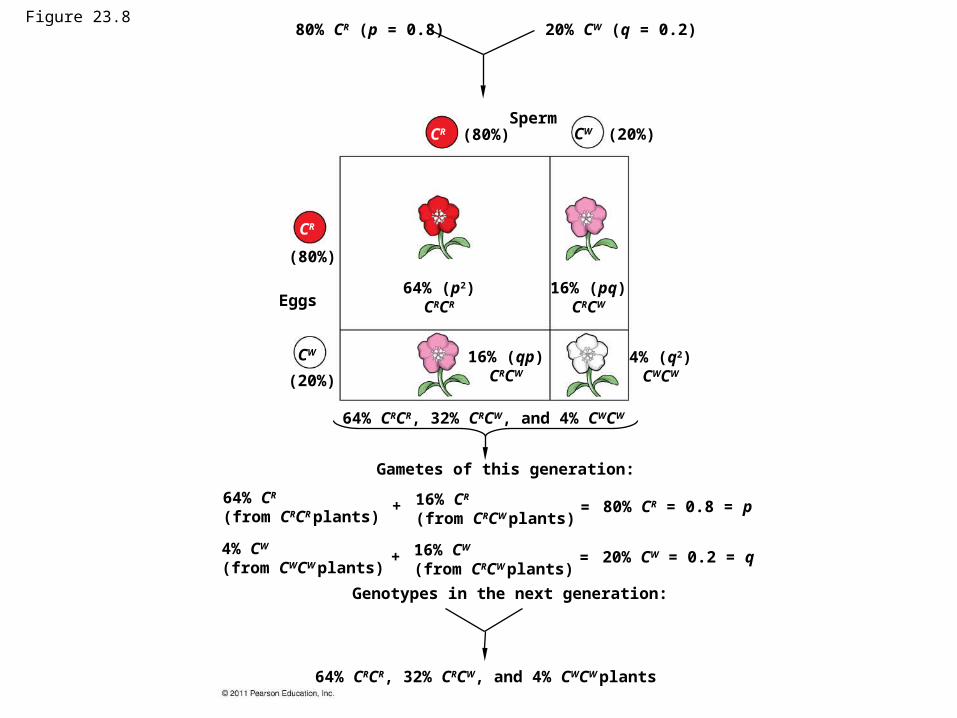
Figure 23.880% CR (p = 0.8)
(80%) (20%)Sperm
20% CW (q = 0.2)
CR CW
(80%)
(20%)
CR
CW
Eggs64% (p2)
CRCR
16% (pq)CRCW
16% (qp)CRCW
4% (q2)CWCW
64% CRCR, 32% CRCW, and 4% CWCW
Gametes of this generation:
64% CR
(from CRCR plants)
4% CW
(from CWCW plants)
16% CR
(from CRCW plants)+
+
Genotypes in the next generation:
16% CW
(from CRCW plants)
=
=
80% CR = 0.8 = p
20% CW = 0.2 = q
64% CRCR, 32% CRCW, and 4% CWCW plants
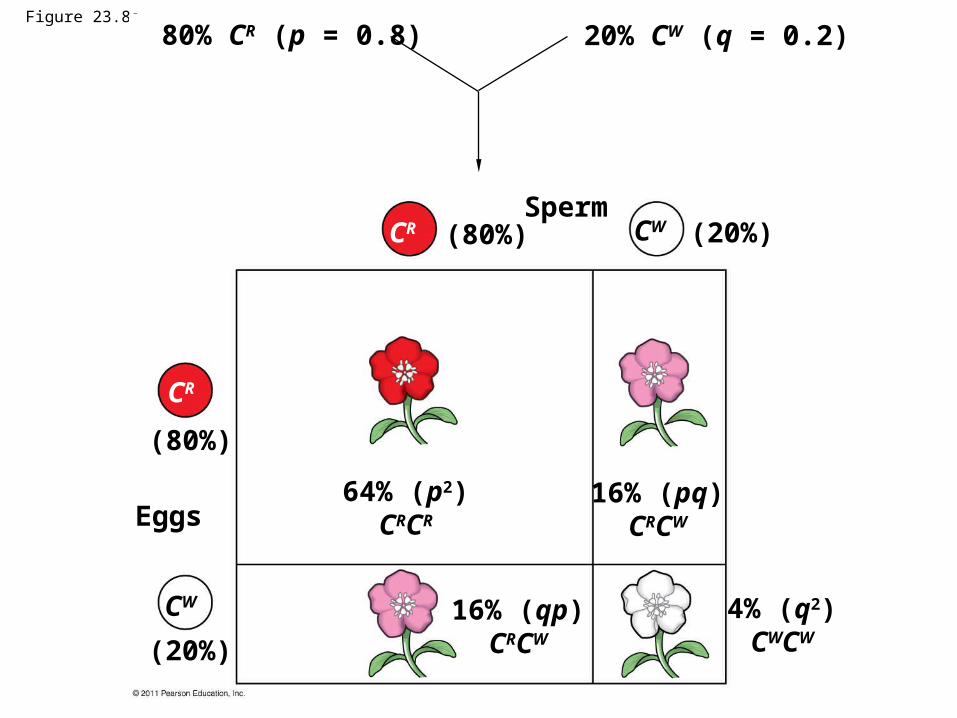
Figure 23.8a
80% CR (p = 0.8)
(80%) (20%)
20% CW (q = 0.2)
CR CWSperm
(80%)
(20%)
CR
CW
Eggs64% (p2)
CRCR
16% (pq)CRCW
16% (qp)CRCW
4% (q2)CWCW
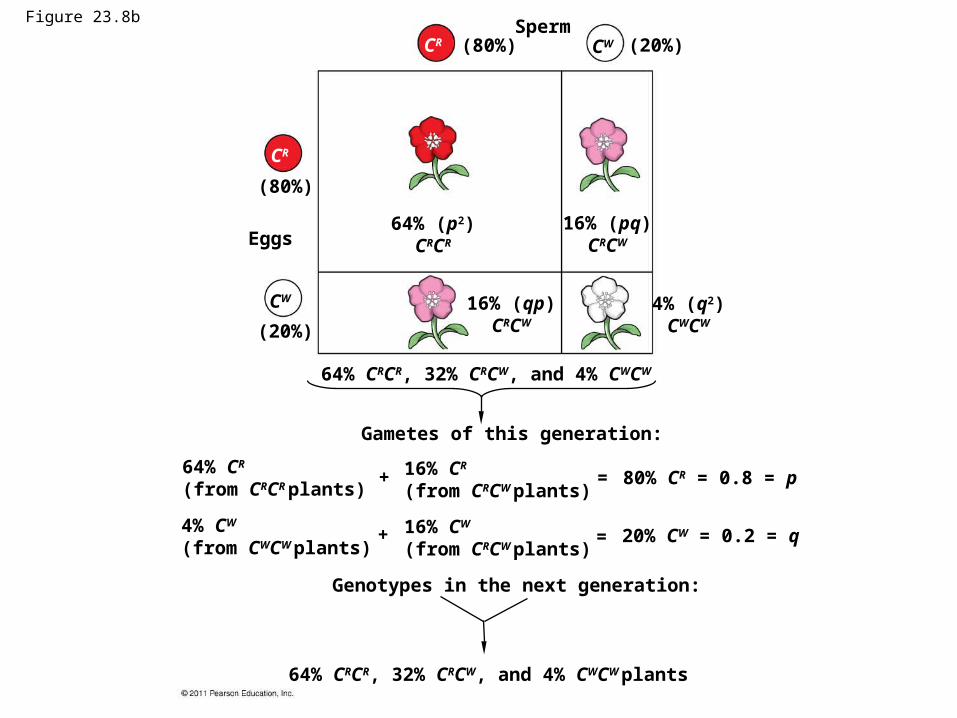
Figure 23.8b
(20%)CRSperm
(80%)
(20%)
CR
CW
Eggs64% (p2)
CRCR
16% (pq)CRCW
16% (qp)CRCW
4% (q2)CWCW
64% CRCR, 32% CRCW, and 4% CWCW
Gametes of this generation:
64% CR
(from CRCR plants)
4% CW
(from CWCW plants)
16% CR
(from CRCW plants)+
+
Genotypes in the next generation:
16% CW
(from CRCW plants)
=
=
80% CR = 0.8 = p
20% CW = 0.2 = q
64% CRCR, 32% CRCW, and 4% CWCW plants
CW(80%)
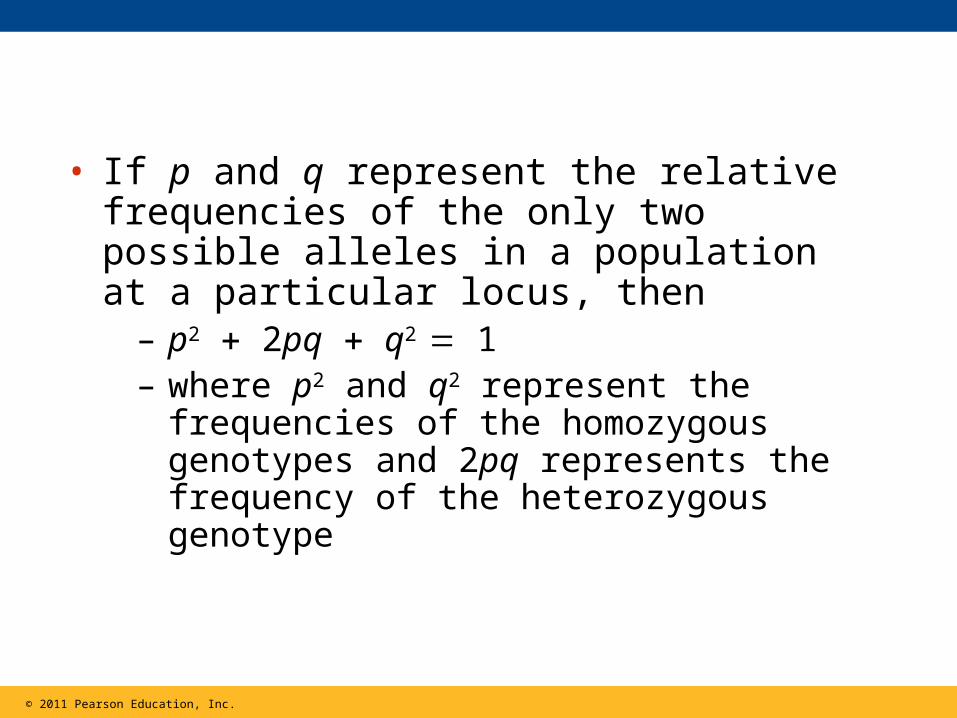
• If p and q represent the relative frequencies of the only two possible alleles in a population at a particular locus, then
– p2 2pq q2 1– where p2 and q2 represent the frequencies of
the homozygous genotypes and 2pq represents the frequency of the heterozygous genotype
© 2011 Pearson Education, Inc.
Conditions for Hardy-Weinberg Equilibrium
• The Hardy-Weinberg theorem describes a hypothetical population that is not evolving
• In real populations, allele and genotype frequencies do change over time
© 2011 Pearson Education, Inc.
• The five conditions for nonevolving populations are rarely met in nature:
© 2011 Pearson Education, Inc.
1. No mutations
2. Random mating
3. No natural selection
4. Extremely large population size
5. No gene flow
• Natural populations can evolve at some loci, while being in Hardy-Weinberg equilibrium at other loci
Applying the Hardy-Weinberg Principle
• We can assume the locus that causes phenylketonuria (PKU) is in Hardy-Weinberg equilibrium given that:
© 2011 Pearson Education, Inc.
1. The PKU gene mutation rate is low
2. Mate selection is random with respect to whether or not an individual is a carrier for the PKU allele
3. Natural selection can only act on rare homozygous individuals who do not follow dietary restrictions
4. The population is large
5. Migration has no effect as many other populations have similar allele frequencies
© 2011 Pearson Education, Inc.

• The occurrence of PKU is 1 per 10,000 births
– q2 0.0001
– q 0.01
• The frequency of normal alleles is
– p 1 – q 1 – 0.01 0.99
• The frequency of carriers is
– 2pq 2 0.99 0.01 0.0198
– or approximately 2% of the U.S. population
© 2011 Pearson Education, Inc.
• Three major factors alter allele frequencies and bring about most evolutionary change:
– Natural selection
– Genetic drift
– Gene flow
Concept 23.3: Natural selection, genetic drift, and gene flow can alter allele frequencies in a population
© 2011 Pearson Education, Inc.
Natural Selection
• Differential success in reproduction results in certain alleles being passed to the next generation in greater proportions
• For example, an allele that confers resistance to DDT increased in frequency after DDT was used widely in agriculture
© 2011 Pearson Education, Inc.
Genetic Drift
• The smaller a sample, the greater the chance of deviation from a predicted result
• Genetic drift describes how allele frequencies fluctuate unpredictably from one generation to the next
• Genetic drift tends to reduce genetic variation through losses of alleles
© 2011 Pearson Education, Inc.
Animation: Causes of Evolutionary ChangeCauses of Evolutionary Change
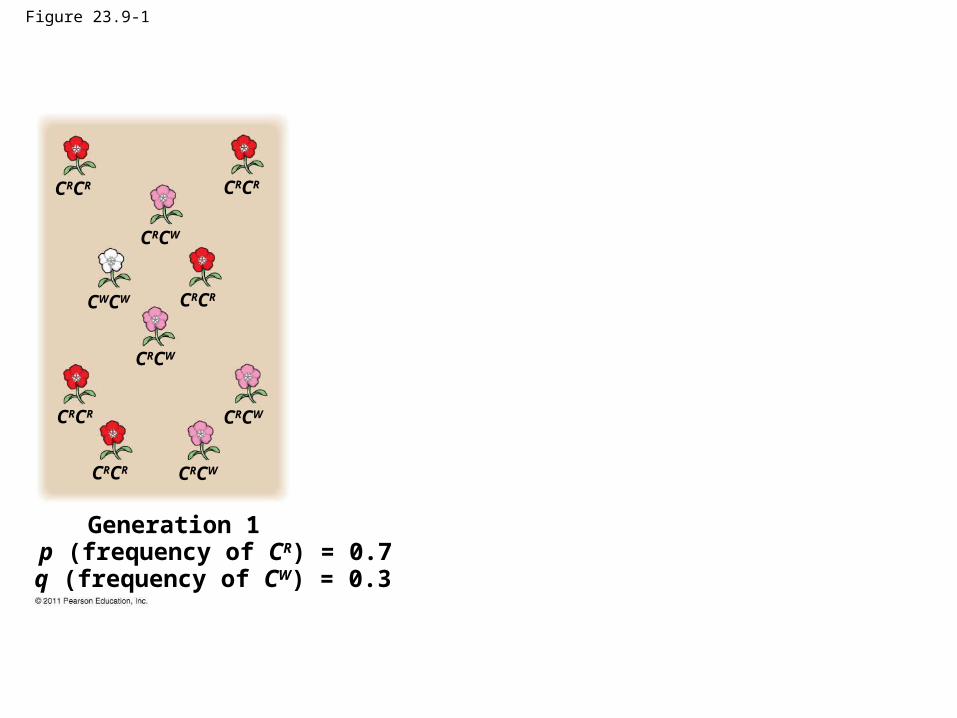
Figure 23.9-1
Generation 1p (frequency of CR) = 0.7 q (frequency of CW) = 0.3
CRCR CRCR
CRCW
CWCW CRCR
CRCW
CRCR CRCW
CRCR CRCW
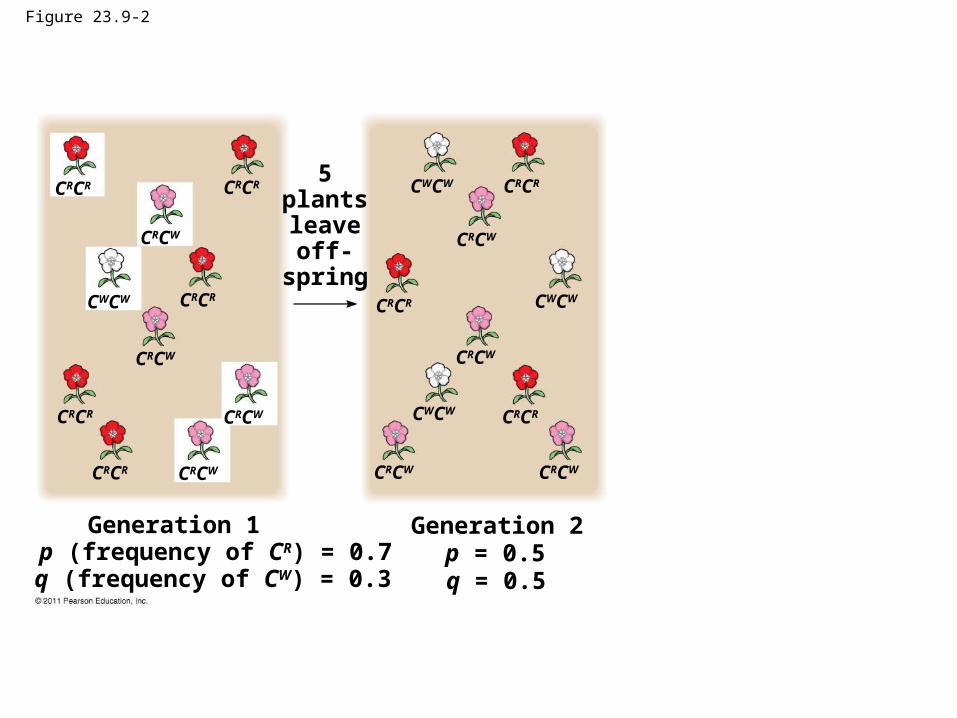
Figure 23.9-2
5plantsleaveoff-
spring
Generation 1p (frequency of CR) = 0.7 q (frequency of CW) = 0.3
CRCR CRCR
CRCW
CWCW CRCR
CRCW
CRCR CRCW
CRCR CRCW
CRCRCWCW
CRCW
CRCR CWCW
CRCW
CWCW CRCR
CRCW CRCW
Generation 2p = 0.5 q = 0.5
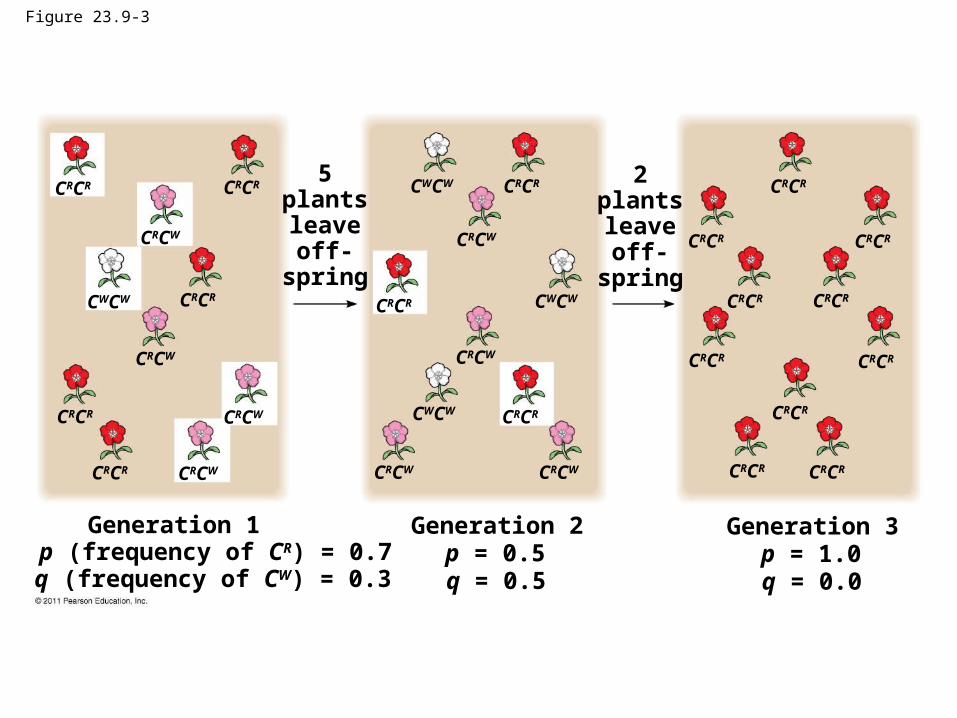
Figure 23.9-3
5plantsleaveoff-
spring
Generation 1p (frequency of CR) = 0.7 q (frequency of CW) = 0.3
CRCR CRCR
CRCW
CWCW CRCR
CRCW
CRCR CRCW
CRCR CRCW
CRCRCWCW
CRCW
CRCR CWCW
CRCW
CWCW CRCR
CRCW CRCW
Generation 2p = 0.5 q = 0.5
2plantsleaveoff-
spring
CRCR
CRCR CRCR
CRCRCRCR
CRCR CRCR
CRCR
CRCR CRCR
Generation 3p = 1.0 q = 0.0

The Founder Effect
• The founder effect occurs when a few individuals become isolated from a larger population
• Allele frequencies in the small founder population can be different from those in the larger parent population
© 2011 Pearson Education, Inc.
The Bottleneck Effect
• The bottleneck effect is a sudden reduction in population size due to a change in the environment
• The resulting gene pool may no longer be reflective of the original population’s gene pool
• If the population remains small, it may be further affected by genetic drift
© 2011 Pearson Education, Inc.
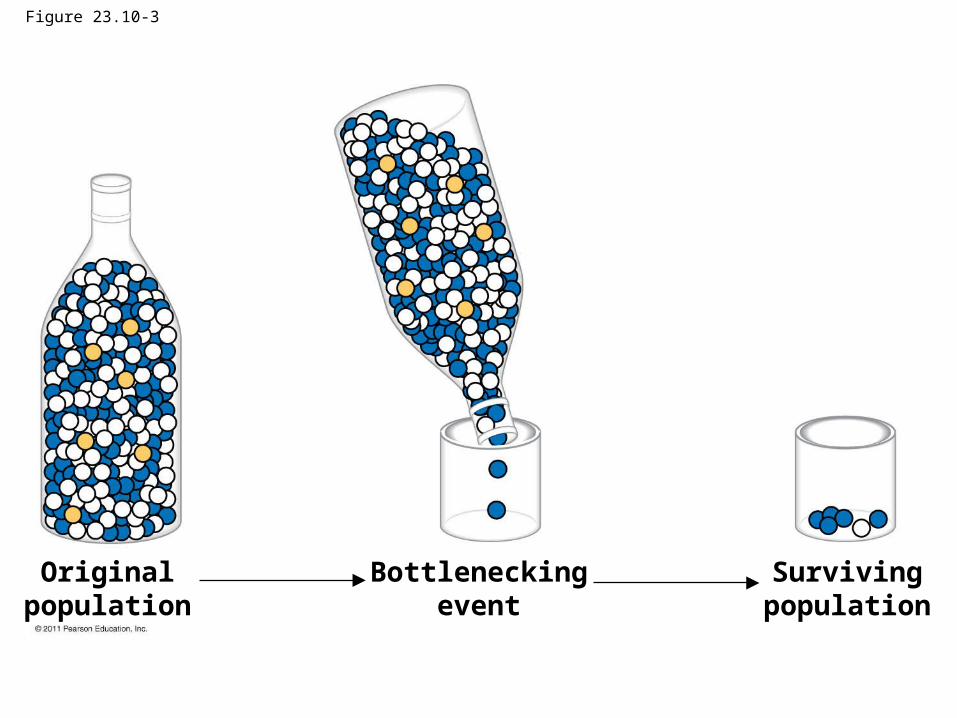
Figure 23.10-3
Originalpopulation
Bottleneckingevent
Survivingpopulation

• Understanding the bottleneck effect can increase understanding of how human activity affects other species
© 2011 Pearson Education, Inc.
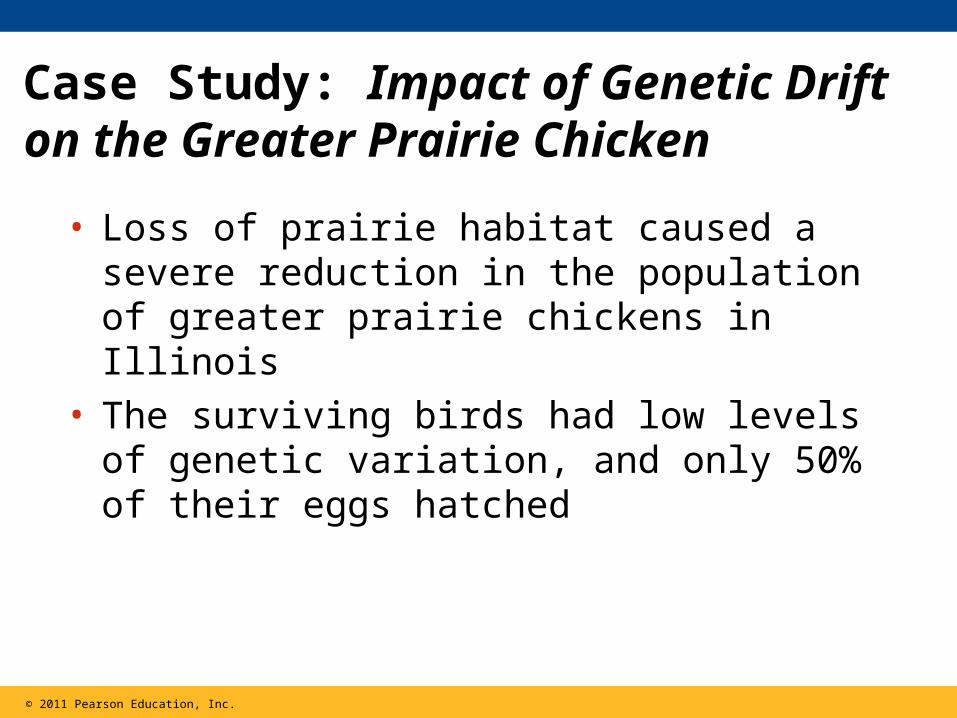
Case Study: Impact of Genetic Drift on the Greater Prairie Chicken
• Loss of prairie habitat caused a severe reduction in the population of greater prairie chickens in Illinois
• The surviving birds had low levels of genetic variation, and only 50% of their eggs hatched
© 2011 Pearson Education, Inc.
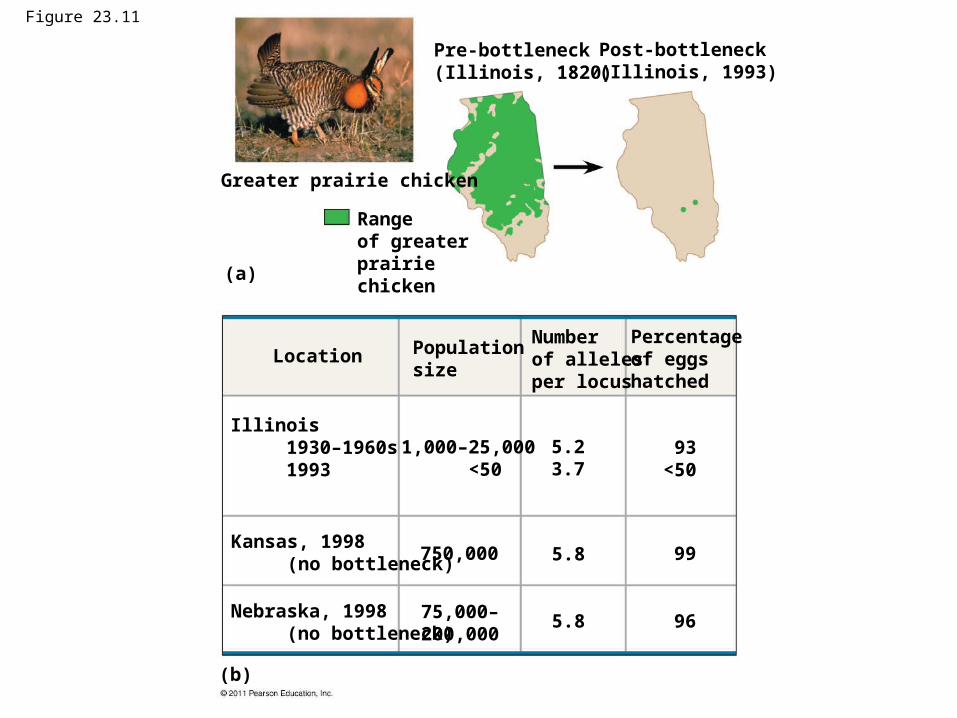
Figure 23.11
Pre-bottleneck(Illinois, 1820)
Post-bottleneck(Illinois, 1993)
Greater prairie chicken
Range of greater prairie chicken
(a)
Location Population size
Number of alleles per locus
Percentage of eggs hatched
93<50
5.23.7
5.8
5.8
99
96
1,000–25,000 <50
750,000
75,000–200,000
Nebraska, 1998 (no bottleneck)
(b)
Kansas, 1998 (no bottleneck)
Illinois 1930–1960s 1993

Figure 23.11a
Pre-bottleneck(Illinois, 1820)
Post-bottleneck(Illinois, 1993)
Greater prairie chicken
Range of greater prairie chicken
(a)
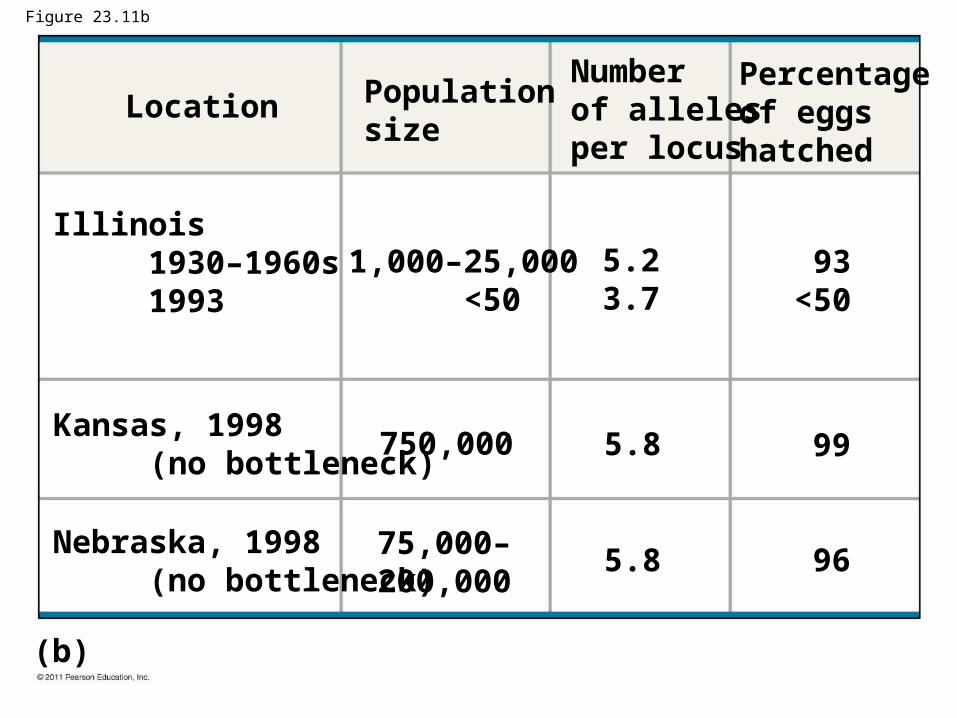
Figure 23.11b
Location Population size
Number of alleles per locus
Percentage of eggs hatched
93<50
5.23.7
5.8
5.8
99
96
1,000–25,000 <50
750,000
75,000–200,000
Nebraska, 1998 (no bottleneck)
(b)
Kansas, 1998 (no bottleneck)
Illinois 1930–1960s 1993
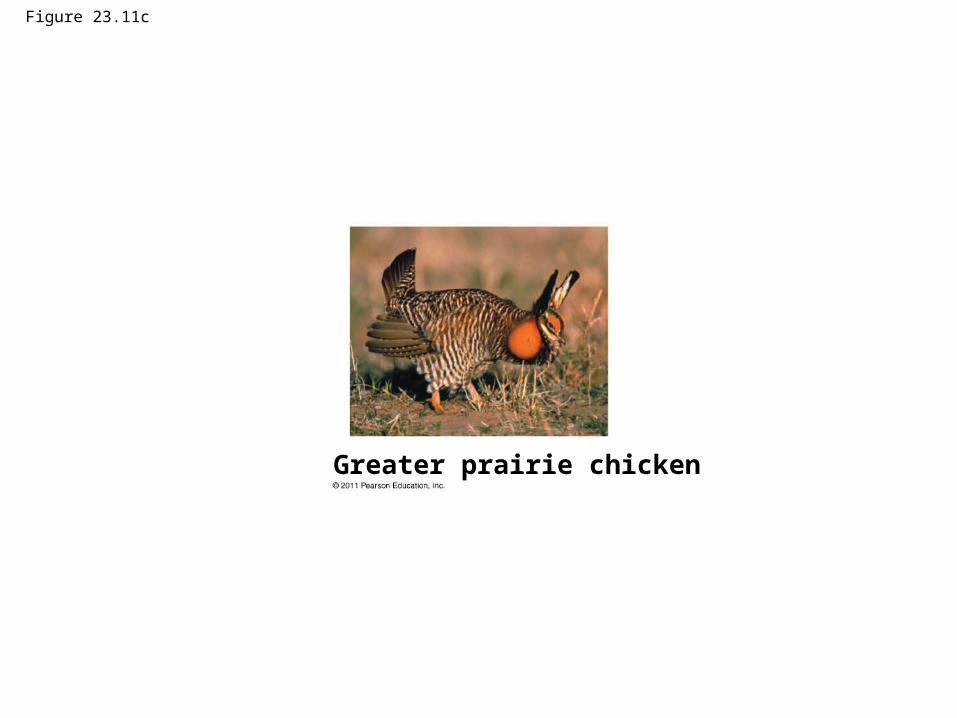
Figure 23.11c
Greater prairie chicken
• Researchers used DNA from museum specimens to compare genetic variation in the population before and after the bottleneck
• The results showed a loss of alleles at several loci
• Researchers introduced greater prairie chickens from population in other states and were successful in introducing new alleles and increasing the egg hatch rate to 90%
© 2011 Pearson Education, Inc.
Effects of Genetic Drift: A Summary
1. Genetic drift is significant in small populations
2. Genetic drift causes allele frequencies to change at random
3. Genetic drift can lead to a loss of genetic variation within populations
4. Genetic drift can cause harmful alleles to become fixed
© 2011 Pearson Education, Inc.
Gene Flow
• Gene flow consists of the movement of alleles among populations
• Alleles can be transferred through the movement of fertile individuals or gametes (for example, pollen)
• Gene flow tends to reduce variation among populations over time
© 2011 Pearson Education, Inc.
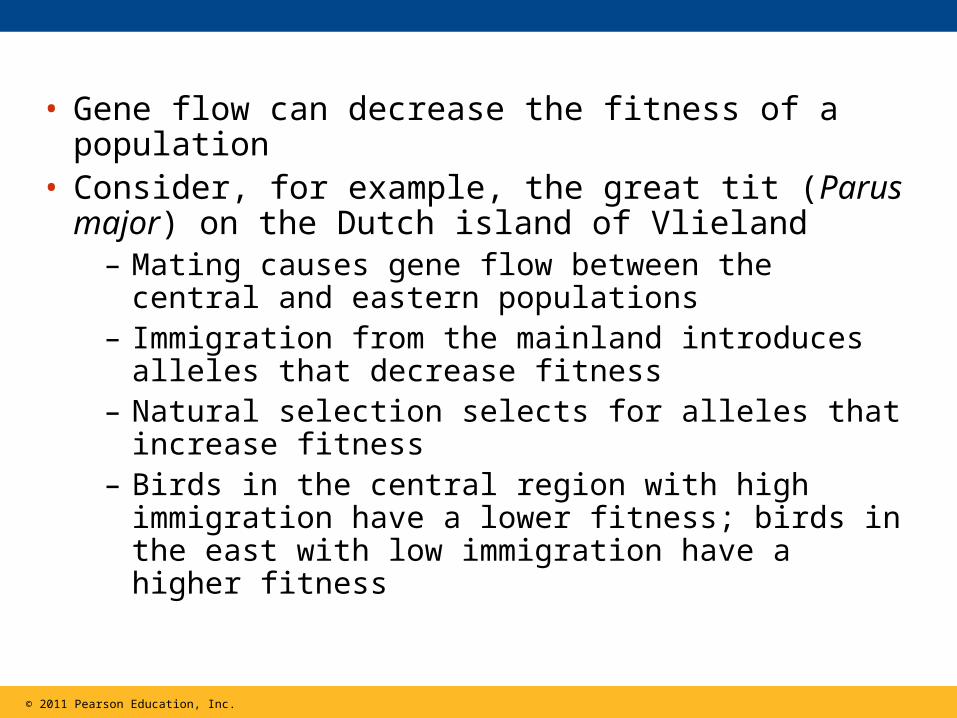
• Gene flow can decrease the fitness of a population• Consider, for example, the great tit (Parus major)
on the Dutch island of Vlieland– Mating causes gene flow between the central and
eastern populations– Immigration from the mainland introduces alleles
that decrease fitness– Natural selection selects for alleles that increase
fitness– Birds in the central region with high immigration
have a lower fitness; birds in the east with low immigration have a higher fitness
© 2011 Pearson Education, Inc.
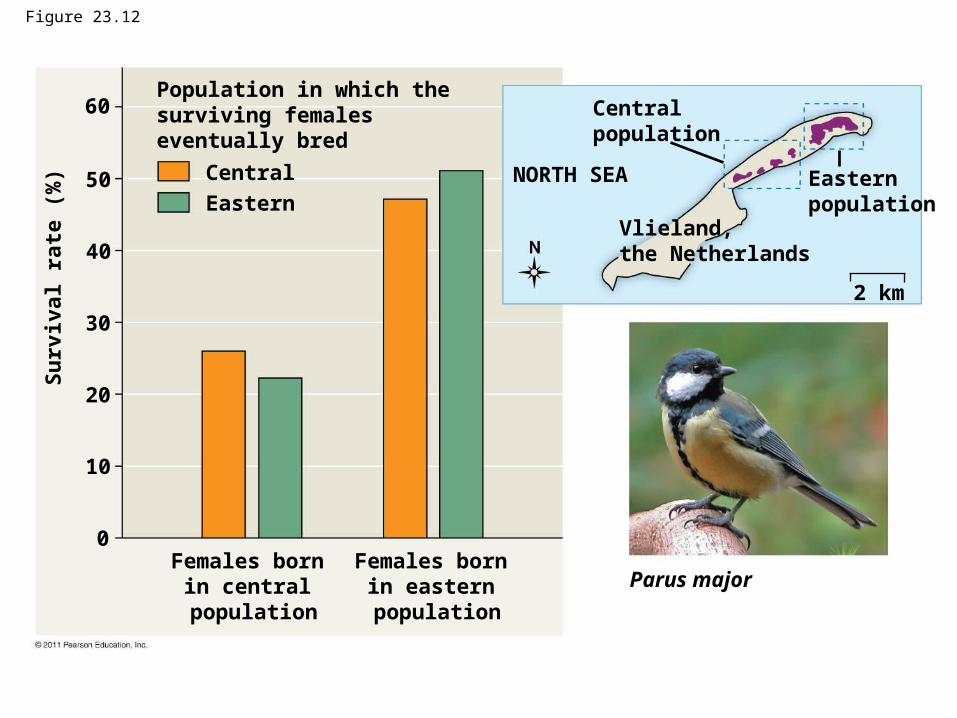
Figure 23.12
Population in which the surviving females eventually bred
Central
Eastern
Su
rviv
al r
ate
(%)
Females born in central population
Females born in eastern population
Parus major
60
50
40
30
20
10
0
Central population
NORTH SEA Eastern population
Vlieland, the Netherlands
2 km
Figure 23.12a
Parus major
• Gene flow can increase the fitness of a population• Consider, for example, the spread of alleles for
resistance to insecticides– Insecticides have been used to target mosquitoes
that carry West Nile virus and malaria
– Alleles have evolved in some populations that confer insecticide resistance to these mosquitoes
– The flow of insecticide resistance alleles into a population can cause an increase in fitness
• Gene flow is an important agent of evolutionary change in human populations
© 2011 Pearson Education, Inc.
• Evolution by natural selection involves both change and “sorting”
– New genetic variations arise by chance
– Beneficial alleles are “sorted” and favored by natural selection
• Only natural selection consistently results in adaptive evolution
Concept 23.4: Natural selection is the only mechanism that consistently causes adaptive evolution
© 2011 Pearson Education, Inc.
A Closer Look at Natural Selection
• Natural selection brings about adaptive evolution by acting on an organism’s phenotype
© 2011 Pearson Education, Inc.
Relative Fitness
• The phrases “struggle for existence” and “survival of the fittest” are misleading as they imply direct competition among individuals
• Reproductive success is generally more subtle and depends on many factors
• Relative fitness is the contribution an individual makes to the gene pool of the next generation, relative to the contributions of other individuals
• Selection favors certain genotypes by acting on the phenotypes of certain organisms
© 2011 Pearson Education, Inc.
Directional, Disruptive, and Stabilizing Selection
• Three modes of selection:– Directional selection favors individuals at one
end of the phenotypic range
– Disruptive selection favors individuals at both extremes of the phenotypic range
– Stabilizing selection favors intermediate variants and acts against extreme phenotypes
© 2011 Pearson Education, Inc.
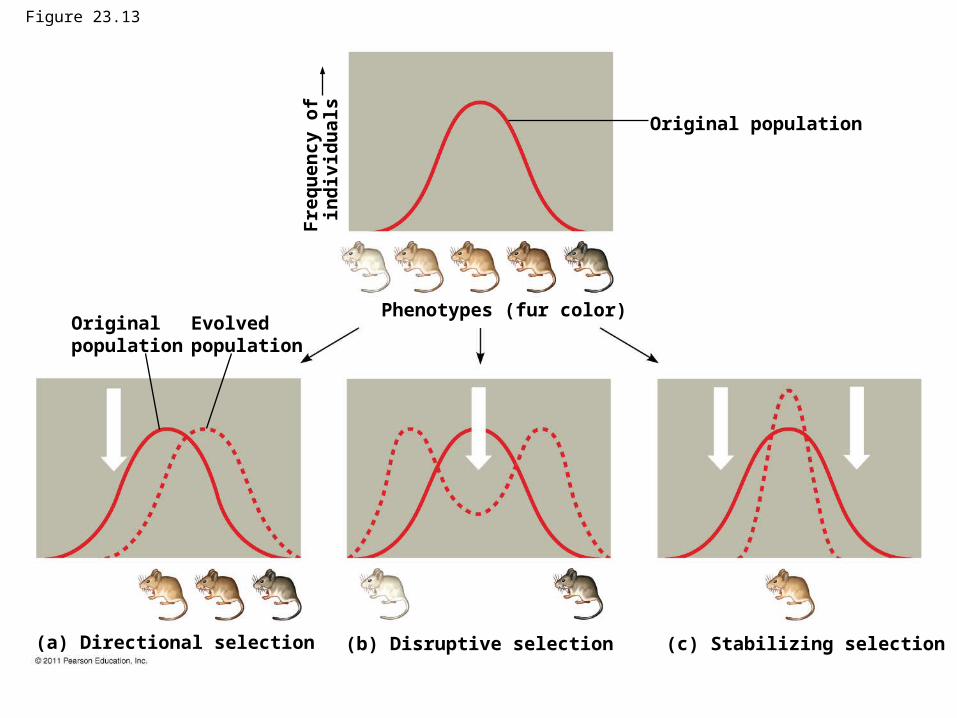
Figure 23.13
Original population
Phenotypes (fur color)F
req
uen
cy
of
ind
ivid
ual
sOriginal population
Evolved population
(a) Directional selection (b) Disruptive selection (c) Stabilizing selection
The Key Role of Natural Selection in Adaptive Evolution
• Striking adaptation have arisen by natural selection
– For example, cuttlefish can change color rapidly for camouflage
– For example, the jaws of snakes allow them to swallow prey larger than their heads
© 2011 Pearson Education, Inc.
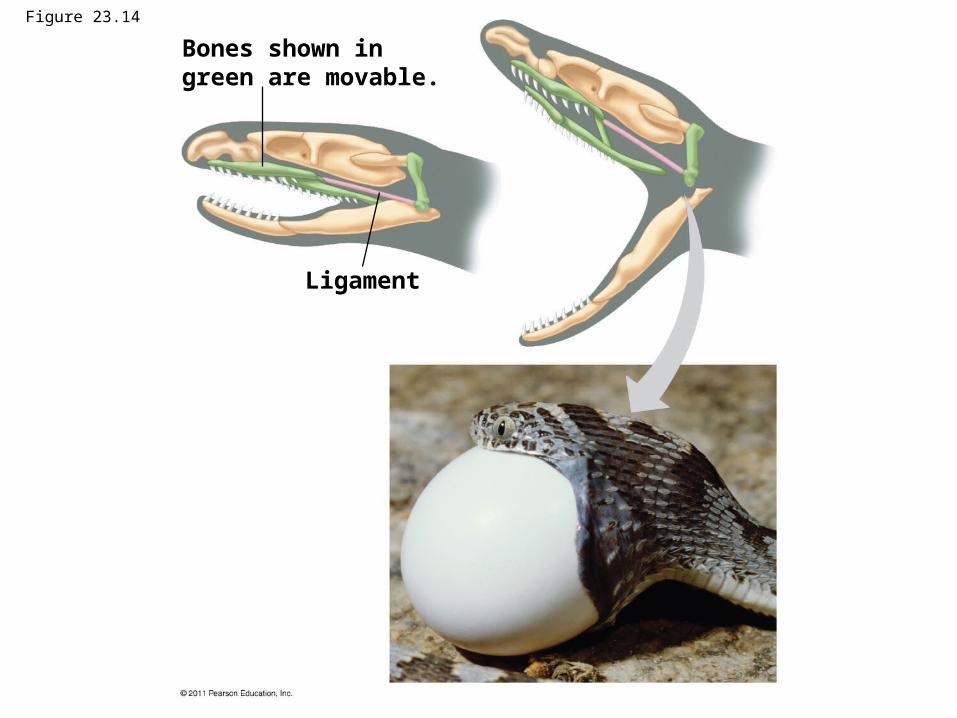
Figure 23.14
Bones shown in green are movable.
Ligament
• Natural selection increases the frequencies of alleles that enhance survival and reproduction
• Adaptive evolution occurs as the match between an organism and its environment increases
• Because the environment can change, adaptive evolution is a continuous process
© 2011 Pearson Education, Inc.
• Genetic drift and gene flow do not consistently lead to adaptive evolution as they can increase or decrease the match between an organism and its environment
© 2011 Pearson Education, Inc.
Sexual Selection
• Sexual selection is natural selection for mating success
• It can result in sexual dimorphism, marked differences between the sexes in secondary sexual characteristics
© 2011 Pearson Education, Inc.
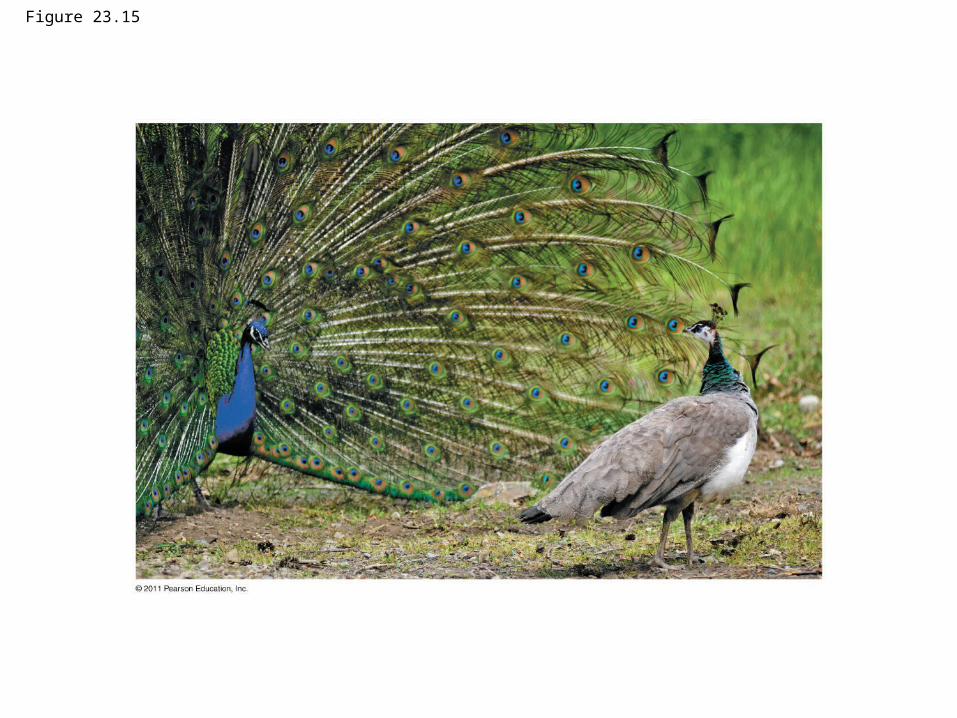
Figure 23.15
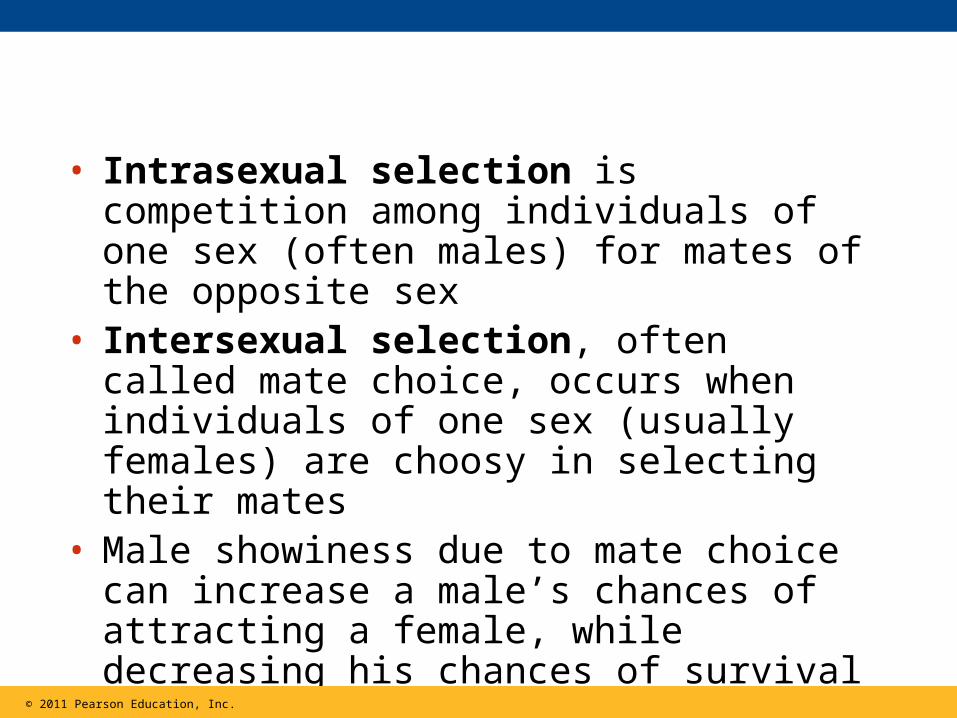
• Intrasexual selection is competition among individuals of one sex (often males) for mates of the opposite sex
• Intersexual selection, often called mate choice, occurs when individuals of one sex (usually females) are choosy in selecting their mates
• Male showiness due to mate choice can increase a male’s chances of attracting a female, while decreasing his chances of survival
© 2011 Pearson Education, Inc.
• How do female preferences evolve?• The good genes hypothesis suggests that if a
trait is related to male health, both the male trait and female preference for that trait should increase in frequency
© 2011 Pearson Education, Inc.
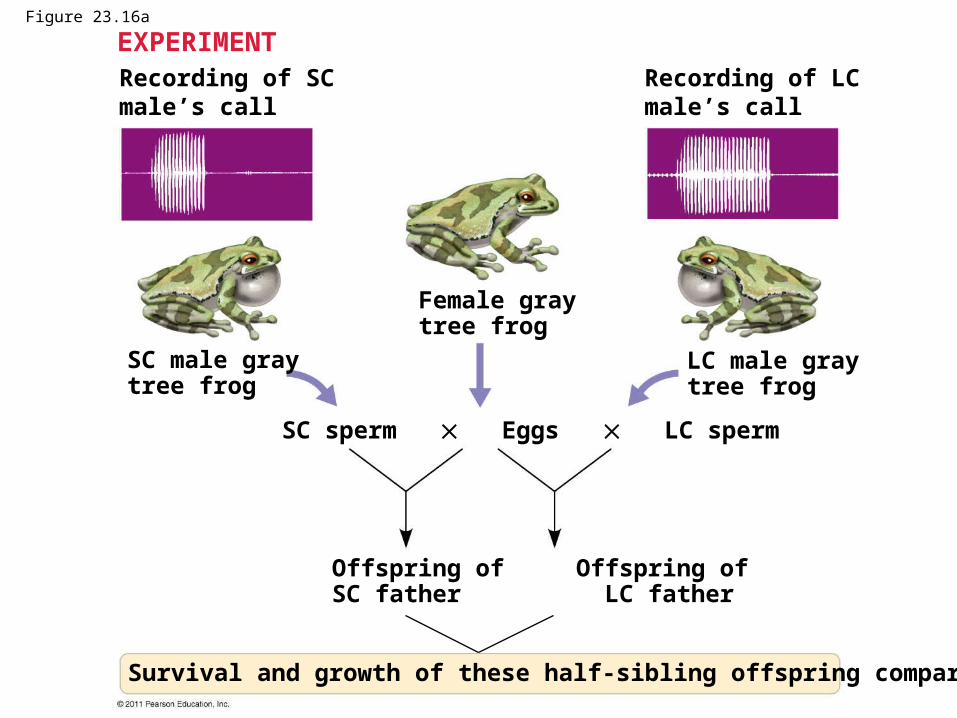
Figure 23.16a
EXPERIMENTRecording of SC male’s call
Recording of LC male’s call
LC male gray tree frog
SC male gray tree frog
Female gray tree frog
SC sperm Eggs LC sperm
Offspring of Offspring ofSC father LC father
Survival and growth of these half-sibling offspring compared
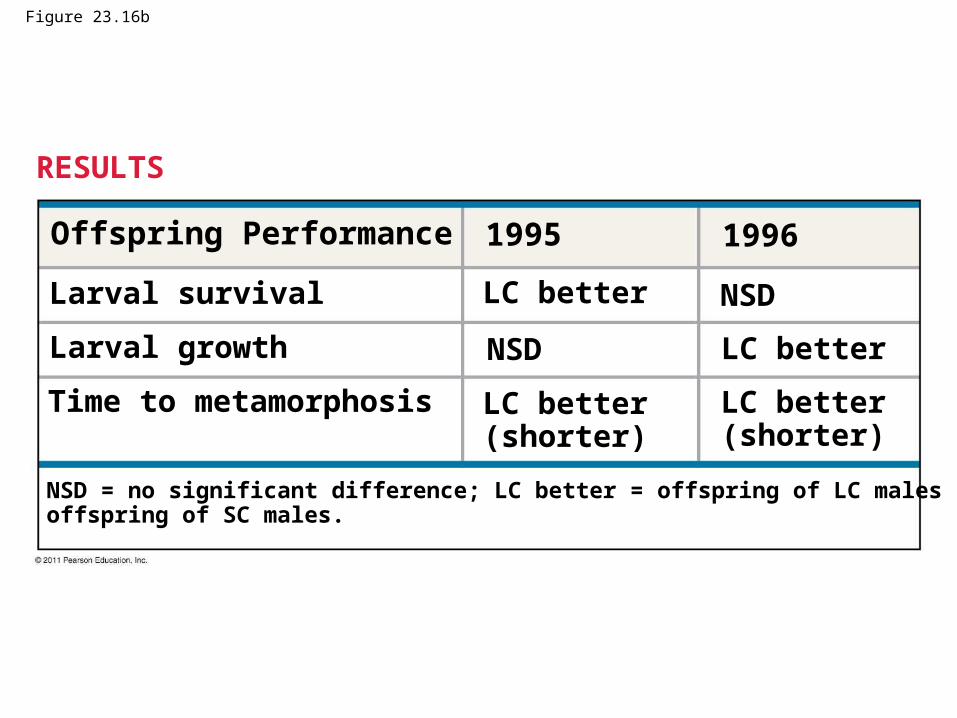
Figure 23.16b
RESULTS
Time to metamorphosis
Larval survival
Larval growth
NSD = no significant difference; LC better = offspring of LC males superior to offspring of SC males.
Offspring Performance 1995 1996
LC better NSD
NSD
LC better (shorter)
LC better (shorter)
LC better
The Preservation of Genetic Variation
• Neutral variation is genetic variation that does not confer a selective advantage or disadvantage
• Various mechanisms help to preserve genetic variation in a population
© 2011 Pearson Education, Inc.
Diploidy
• Diploidy maintains genetic variation in the form of hidden recessive alleles
• Heterozygotes can carry recessive alleles that are hidden from the effects of selection
© 2011 Pearson Education, Inc.
Balancing Selection
• Balancing selection occurs when natural selection maintains stable frequencies of two or more phenotypic forms in a population
• Balancing selection includes– Heterozygote advantage
– Frequency-dependent selection
© 2011 Pearson Education, Inc.
• Heterozygote advantage occurs when heterozygotes have a higher fitness than do both homozygotes
• Natural selection will tend to maintain two or more alleles at that locus
• The sickle-cell allele causes mutations in hemoglobin but also confers malaria resistance
Heterozygote Advantage
© 2011 Pearson Education, Inc.
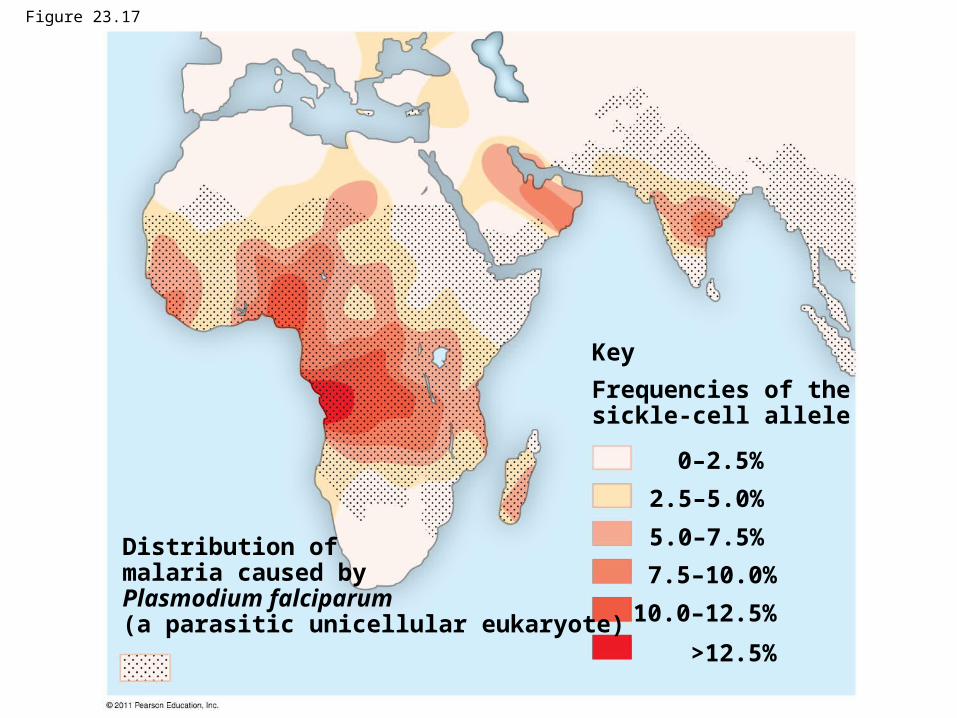
Figure 23.17
Distribution of malaria caused byPlasmodium falciparum (a parasitic unicellular eukaryote)
Key
Frequencies of thesickle-cell allele
0–2.5%
2.5–5.0%
5.0–7.5%
7.5–10.0%
10.0–12.5%
>12.5%
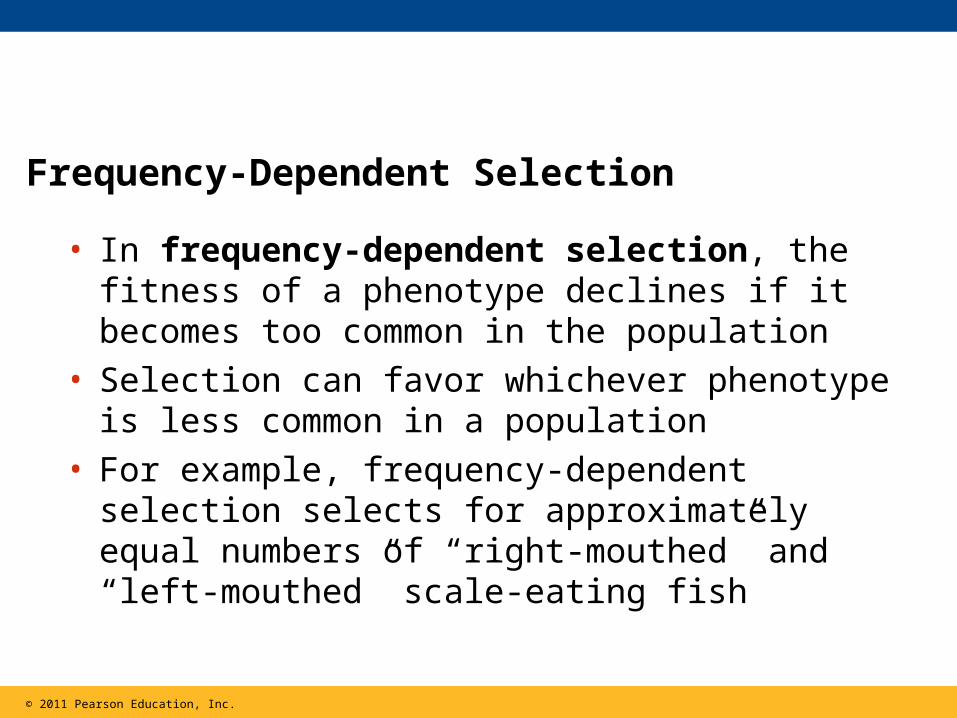
• In frequency-dependent selection, the fitness of a phenotype declines if it becomes too common in the population
• Selection can favor whichever phenotype is less common in a population
• For example, frequency-dependent selection selects for approximately equal numbers of “right-mouthed” and “left-mouthed” scale-eating fish
Frequency-Dependent Selection
© 2011 Pearson Education, Inc.
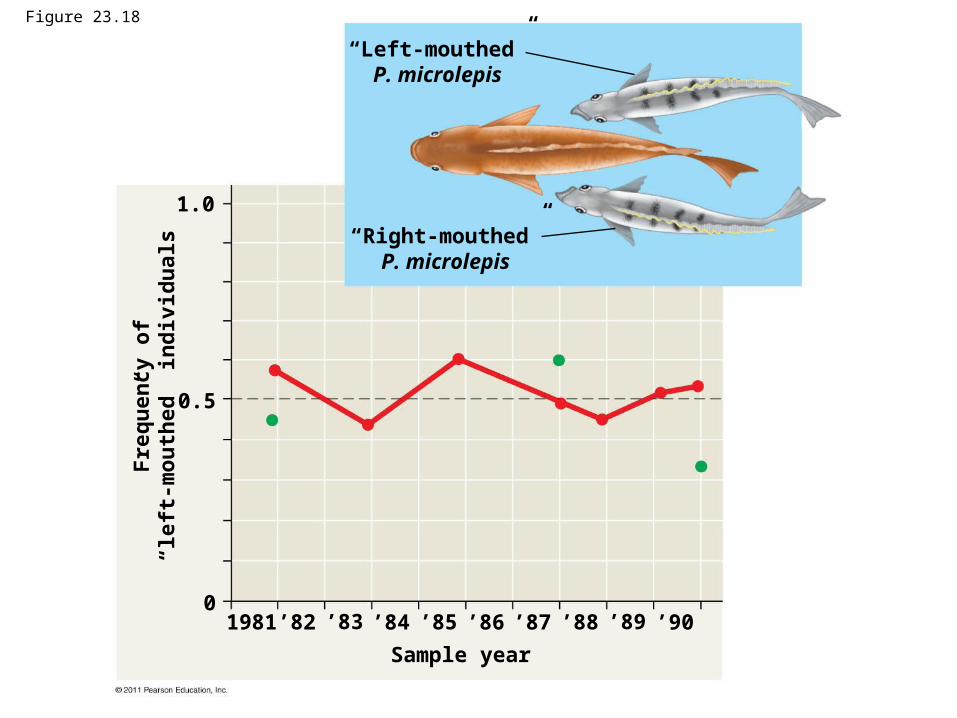
“Left-mouthed”P. microlepis
“Right-mouthed”P. microlepis
1.0
0.5
01981
Sample year
’82 ’83 ’84 ’85 ’86 ’87 ’88 ’89 ’90
Fre
qu
ency
of
“lef
t-m
ou
thed
” in
div
idu
als
Figure 23.18
Why Natural Selection Cannot Fashion Perfect Organisms
1. Selection can act only on existing variations
2. Evolution is limited by historical constraints
3. Adaptations are often compromises
4. Chance, natural selection, and the environment interact
© 2011 Pearson Education, Inc.
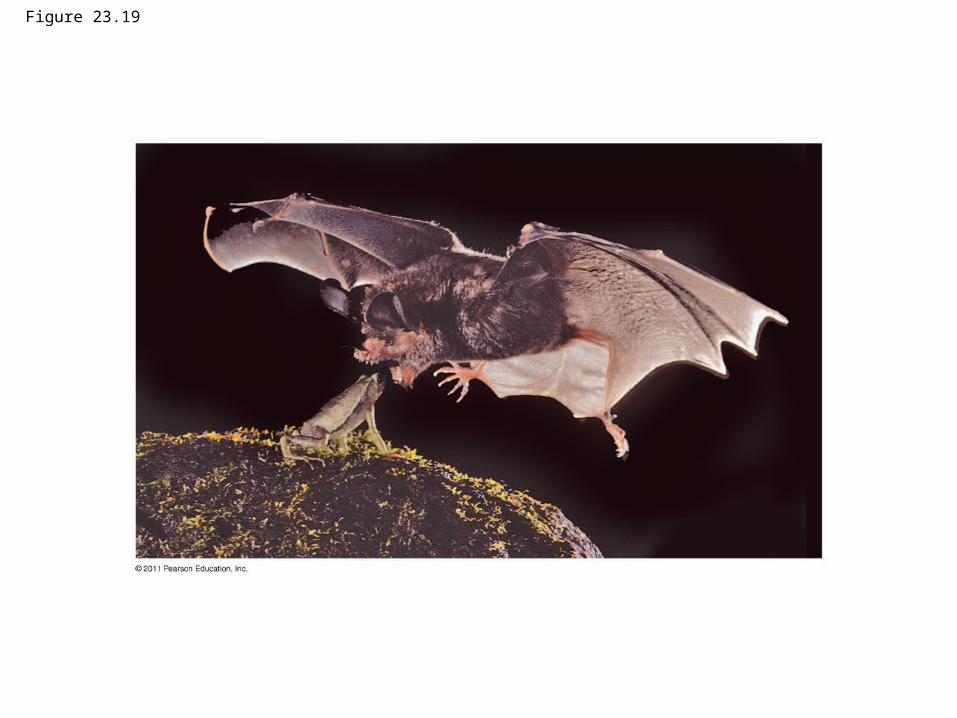
Figure 23.19
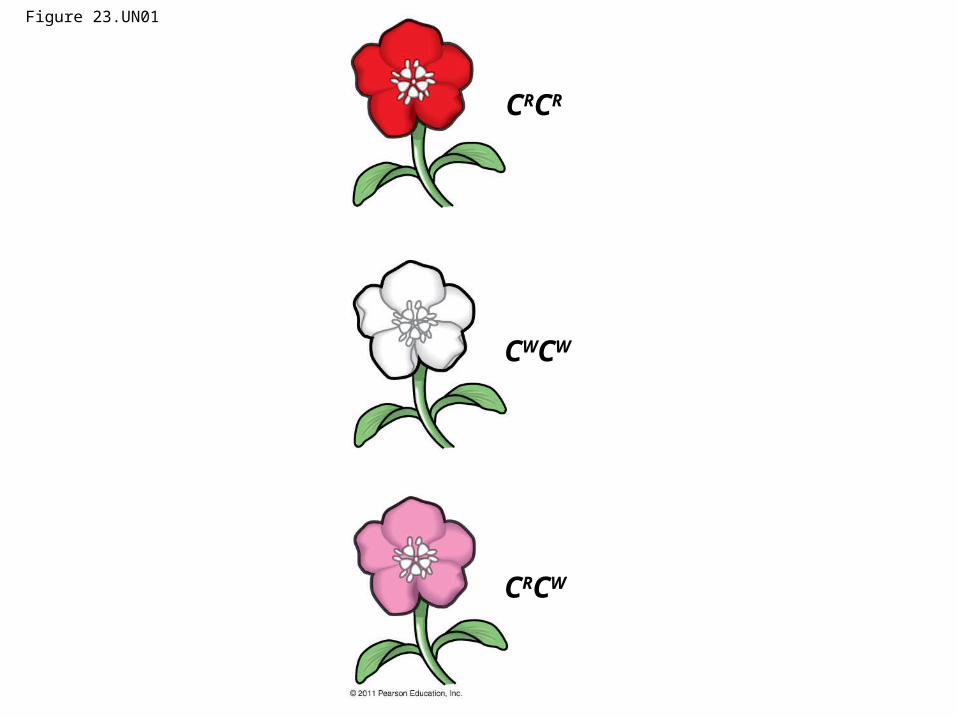
Figure 23.UN01
CRCR
CWCW
CRCW
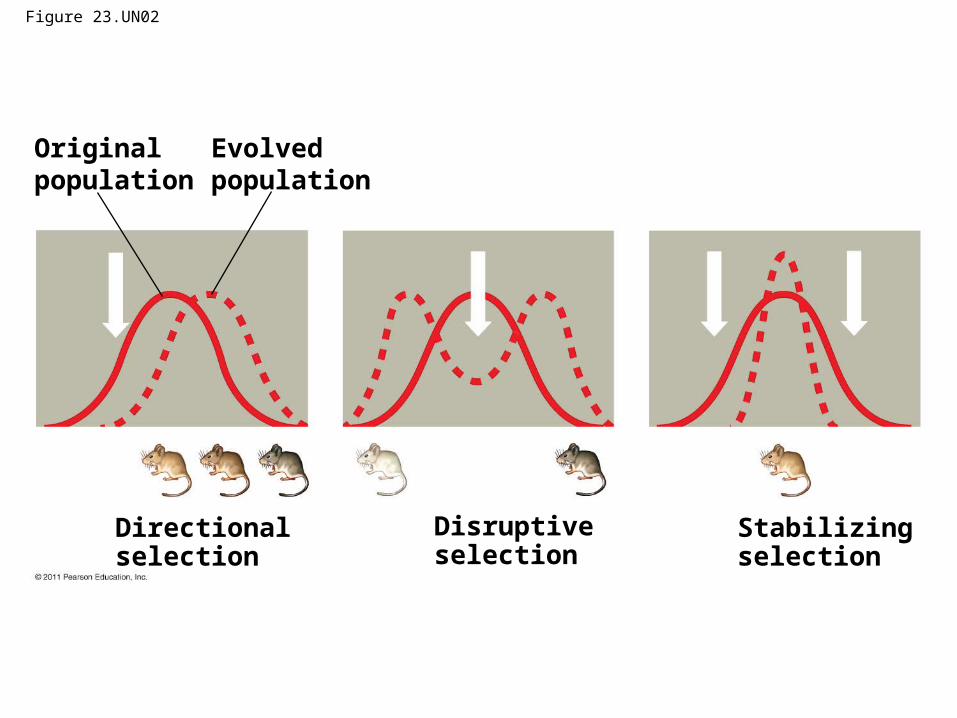
Figure 23.UN02
Original population
Evolved population
Directional selection
Disruptive selection
Stabilizing selection
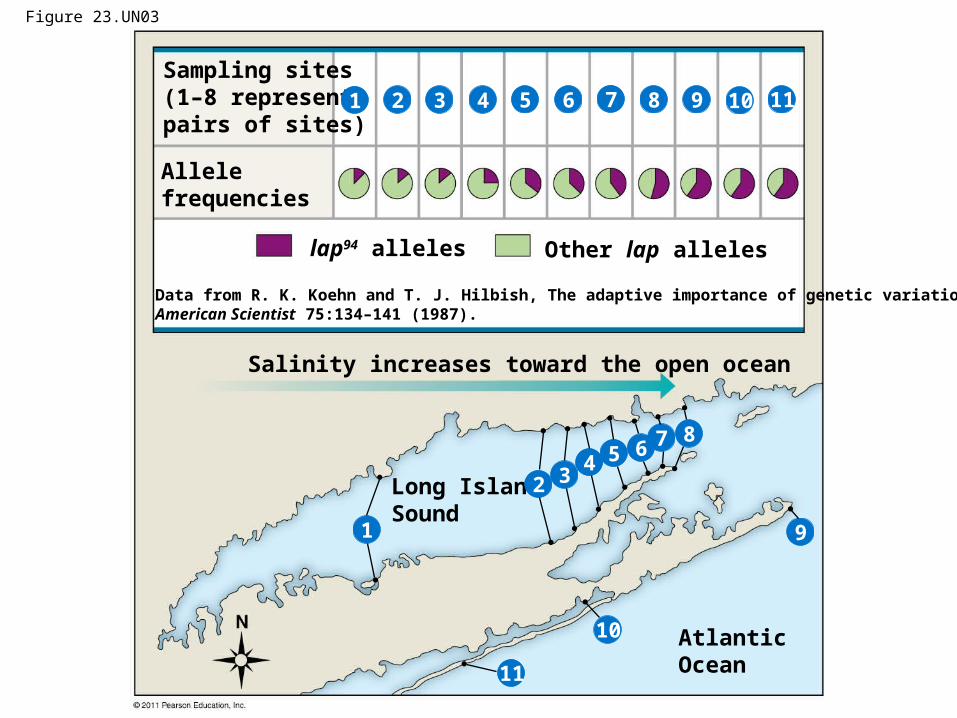
Figure 23.UN03
Sampling sites (1–8 represent pairs of sites)
Allele frequencies
lap94 alleles Other lap alleles
Salinity increases toward the open ocean
Long IslandSound
AtlanticOcean
Data from R. K. Koehn and T. J. Hilbish, The adaptive importance of genetic variation, American Scientist 75:134–141 (1987).
1
2
2 3 4 5 6 7 8 9 10 11
1
2 34 5 6 7 8
9
10
11