22278098 lab report performance characteristics of centrifugal pump
TRANSCRIPT
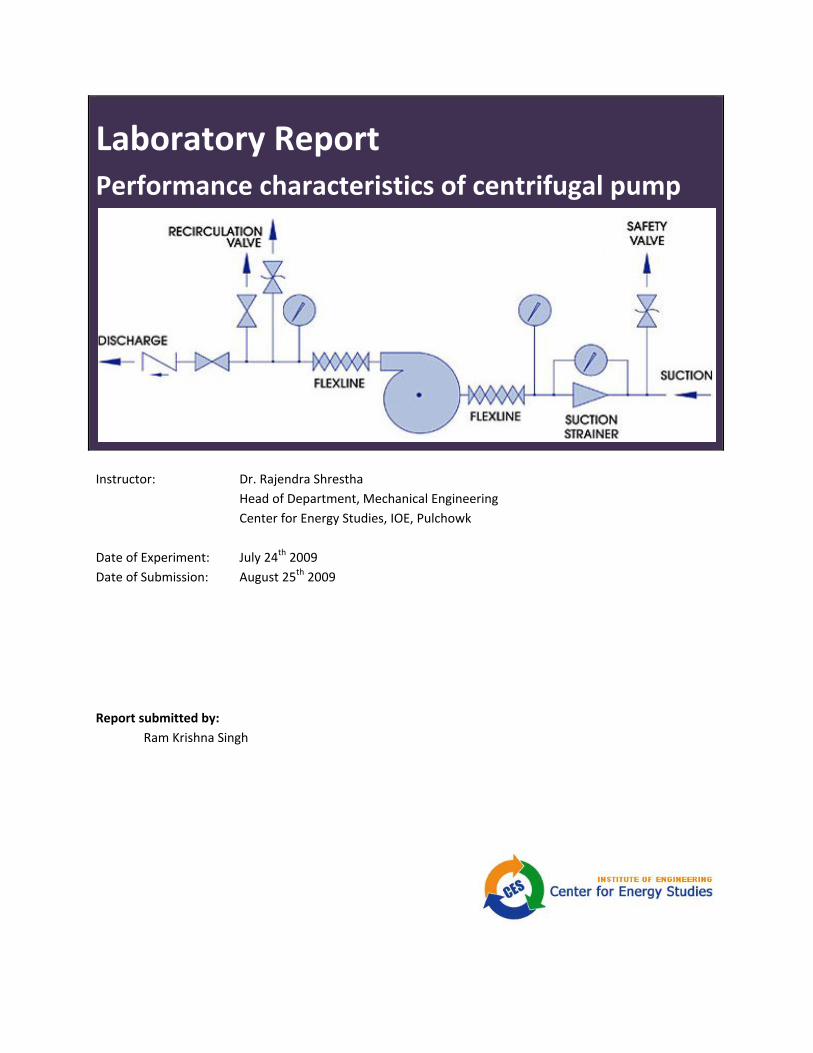
Laboratory Report Performance characteristics of centrifugal pump
Instructor: Dr. Rajendra Shrestha
Head of Department, Mechanical Engineering Center for Energy Studies, IOE, Pulchowk
Date of Experiment: July 24th 2009 Date of Submission: August 25th 2009
Report submitted by:
Ram Krishna Singh

Objective
To draw the performance characteristics of
• single pump
• pumps combination in series
• pumps combination in parallel
Apparatus
• Centrifugal pump apparatus bench
• Stop watch
Procedure
First of all, operation was done for single pump. A pump was operated with control rate of flow taken for 0, 10, 15, 30, 30 liters per minute observed in V notch. To assure the exact flow rate, pipe reading with stop watch was taken for each case. Correspondingly, measurements of pressures were taken for suction and delivery side. Also corresponding power was observed.
Similar operations were done for two pumps arranged in series as well as parallel.
Theory
A centrifugal pump converts the input power to kinetic energy in the liquid by accelerating the liquid by a revolving device ‐ an impeller. Fluid enters the pump through the eye of the impeller which rotates at high speed. The fluid is accelerated radially outward from the pump chasing. A vacuum is created at the impellers eye that continuously draws more fluid into the pump.
The energy created by the pump is kinetic energy according the Bernoulli Equation. The energy transferred to the liquid corresponds to the velocity at the edge or vane tip of the impeller. The faster the impeller revolves or the bigger the impeller is, the higher will the velocity of the liquid energy transferred to the liquid be. This is described by the Affinity Laws.
it is important to understand that the pump will pump all fluids to the same height if the shaft is turning at the same rpm.
Centrifugal Pumps are "constant head machines". The head of a pump in metric units can be expressed in metric units as:
h = (p2 ‐ p1)/(ρ g) + v22/(2 g) (1)
where h = total head developed (m) p2 = pressure at outlet (N/m
2) p1 = pressure at inlet (N/m
2)

ρ = density (kg/m3) g = acceleration of gravity (9.81) m/s2 v2 = velocity at the outlet (m/s)
Energy Usage
The energy usage in a pumping installation is determined by the flow required, the height lifted and the length and characteristics of the pipeline. The power required to drive a pump (Pi), is defined simply using SI units by: by:
where:
Pi is the input power required (W) ρ is the fluid density (kg/m3) g is the gravitational constant (9.81 m/s2) H is the energy Head added to the flow (m) Q is the flow rate (m3/s) η is the efficiency of the pump plant as a decimal
The head added by the pump (H) is a sum of the the static lift, the head loss due to friction and any losses due to valves or pipe bends all expressed in metres of water. Power is more commonly expressed as kW (103 W) or horsepower (multiply kW by 0.746). The value for the pump efficiency η may be stated for the pump itself or as a combined efficiency of the pump and motor system.
The energy usage is determined by multiplying the power requirement by the length of time the pump is operating.
Performance curve:
The performance curve is the easiest and most satisfactory way to show graphically the relationship between head, capacity, horsepower, etc., of any pump. For a given rotational speed and impeller size, the performance of a pump can be represented on a head‐capacity curve of total developed head in feet of water versus flow in gallons per minute.
Total dynamic head (TDH) is the difference between suction and discharge pressure and includes the difference between the velocity head at the suction and discharge connection. The lines sloping downward from left to right represent the varying quantities of water delivered by the pump with variations in head or pressure for a given impeller size.
The intersection of this line with zero delivery line shows the “shut‐off head”, which is the pressure developed by the pump when the discharge valve is shut.

Starting from the shut‐off head, as the pump delivers more water, the mechanical efficiency of the pump increases until a “best efficiency point” (BEP) is reached. Increasing the flow further decreases the efficiency until a point known as “end of curve” where the manufacturer no longer publishes the performance. As the impeller gets smaller, the pump efficiency also decreases.
The power requirements are also shown on the performance curve. The horsepower line that does not cross the pump curve is called “non‐overloading” horsepower because operation at any point on the published pump curve will not overload the motor.
Parallel Operation
The primary purpose of operating pumps in parallel is to allow a wider range of flow than would be possible with a single fixed speed pump for systems with widely flow demand.
Usually there are no more than three or four pumps operating in parallel.
The combined parallel pump curve can be drawn holding the head constant and adding the flow. Fig. shows a combined pump curve of a system with three identical pumps operating in parallel.
Curve A represents the head‐flow curve for any one of the pumps. Curve B is the combined pump curve for two pumps operating at the same time in parallel and curve C represents the combined performance for the three pumps. Notice that at any head value, the flow on curve B is twice the flow at the same head on curve A. Likewise, flow on curve C is three times the flow on curve A for the same head value. Curve X represents the system head curve. Points a, b, and c represents the flow that is delivered by the

pumps at the three operating conditions which are: a single pump, two pumps and all (three) pumps operating at the same time.
Series Operation
In series operation, the discharge of one pump feeds the suction of a second pump (Fig 97). Unlike parallel operation, series pump curve can be drawn holding the flow constant and adding the head. Series operation allows that commercially available equipment can be used in a particular system because sometimes a single pump operation would result in a pump with an extremely high head and thus an equally high horsepower. For example, distributing pumping schemes applied in chilled water plants avoid using to big pumps for chilled water circulation that create unnecessary overpressure at the buildings close to the plant. Small pumps situated just at the building they feed mitigate the overpressure problem and at the same time save considerable pumping energy. Such schemes are based on the series pumps operation principles.


Observation
Single centrifugal pump
Pump speed: 70 rps
S.N Volume flow rate
(Q liters/min)
Inlet pressure (bar)
Outlet pressure (bar)
Electric power input (watt)
Head (m)
Pump Hydraulic power
(Wh watt) 1 0 0 0.6 90 6.11 0 2 8.05 0 0.5 110 5.09 8.313667 3 12.5 0 0.48 118 4.89 11.9805 4 21.42 0 0.38 142 3.87 12.642 5 28 0 0.3 155 3.05 15.94133
Centrifugal pumps in parallel combination
S.N Volume flow rate
(Q liters/min)
Inlet pressure (bar)
Outlet pressure (bar)
power input (watt)
Head (m)
Pump Hydraulic power
(Wh watt) 1 0 0 0.6 190 6.11 2 8.57 0 0.53 225 5.4 3 15.65 0 0.51 232 5.19 4 21.17 0 0.50 250 5.09 5 36 0 0.49 295 4.99
Pumps in series combination
S.N Volume flow rate
(Q liters/min)
Inlet pressure (bar)
Outlet pressure (bar)
power input (watt)
Head (m)
Pump Hydraulic power
(Wh watt) 1 0 0 0.6 210 6.11 2 8.57 0 0.55 235 5.6 3 15 0 0.50 250 5.09 4 18 0 0.49 300 4.99 5 32.72 0 0.2 390 2.03

Head vs Flow rate
Discharge vs Efficiency
0
1
2
3
4
5
6
7
0 10 20 30 40
single
parallel combination
series combination
0
2
4
6
8
10
12
0 5 10 15 20 25 30 35
single
parallel
series

Hydraulic efficiency vs Flow rate
Input power vs flow rate
0
5
10
15
20
25
30
0 5 10 15 20 25 30 35
single
parallel
series
0
50
100
150
200
250
300
350
400
450
0 5 10 15 20 25 30 35
single
parallel
series
Analysis
From the experiments, characteristics of pumps ran at different conditions are observed and drawn in graphs. These characteristics curves are essential in defining the properties of a pump, since only size and shape cannot be sufficient to select a pump for certain purpose. Standard test were done according to the procedures defined by the lab manual and characteristics curves are drawn.
Initially, we study the variation of head available with change in flow rate. With pumps in parallel we can increase the flow almost twice for the same head delivered, while head delivered can be increased twice by arranging pumps in series. Hence, where a single pump is inappropriate for large flow rate or high head, pumps can be arranged in series and parallel or combination of both to suite our requirement.
we see that overall efficiency of the pumps against flow rate. It should be efficiency of pumps in combination is higher than a single pump. Even, efficiency of pumps in series is higher than that in parallel. More closely, we can also see that efficiency of pumps in series is better in lower flow rate ie at higher head delivered and pumps in parallel is better for higher flow rates and low head delivered.
The hydraulic power produced by pumps against flow rate are drawn. In case of series connection the hydraulic power produced by a pump is higher than that of parallel connection at lower flow rates. At higher flow rates we can predict that curve of pumps in parallel will cross that of in series.
As the pumps are connected in series or parallel, the input power to the pumps increases than that of a single pump.
In case of field operation to select a particular type of pump or a particular combination of the pump, first of all the characteristics curves, provided by manufacturer, should be studied carefully and then only it should be use in field.
The main aim of the practical was to drawn up the characteristics curve. With the help of characteristics curve and the actual field conditions (ie. Head available, input power required, required flow rate). We should have to compromise in efficiency for the fulfillment of the actual field condition situations. So the characteristics curve helps to optimize the field conditions and to select a particular type of pump or a combination of pump for a particular site.