20mph speed limit consultation
TRANSCRIPT
S
Date: February 21, 2020
20mph Speed Limit Consultation
Westco – Research & Insights Team
2
Contents 1. INTRODUCTION ....................................................................................................................................... 3
2. EXECUTIVE SUMMARY ............................................................................................................................. 4
2.1 OVERVIEW ................................................................................................................................................ 4
2.2 KEY CONSULTATION FINDINGS ....................................................................................................................... 5
2.3 NEXT STEPS ............................................................................................................................................... 7
3. COMMUNICATIONS PROGRAMME .......................................................................................................... 8
4. CONSULTATION PROGRAMME ................................................................................................................ 9
5. CONSULTATION RESPONSE .................................................................................................................... 11
6. KEY FINDINGS FROM THE CONSULTATION QUESTIONNAIRE ................................................................. 13
6.1 VIEWS OF THE PROPOSAL ........................................................................................................................... 13
6.2 GETTING AROUND WESTMINSTER ............................................................................................................... 21
6.3 AREAS OF CONCERN .................................................................................................................................. 25
6.4 CONSEQUENCES OF THE 20MPH SPEED LIMIT ................................................................................................. 29
6.5 FURTHER COMMENTS................................................................................................................................ 34
7. CITY FOR ALL: A HEATHIER AND GREENER WESTMINSTER ..................................................................... 38
7.1 ENVIRONMENTAL PRIORITIES FOR THE COUNCIL .............................................................................................. 38
7.2 RESPONDENTS’ SUGGESTIONS FOR A HEALTHIER AND GREENER WESTMINSTER ..................................................... 41
7.3 CAMPAIGN AWARENESS ............................................................................................................................ 42
7.4 COMMUNICATION CHANNELS ..................................................................................................................... 43
8. RESPONDENT ANALYSIS – DEMOGRAPHICS ........................................................................................... 47
9. EMAIL AND LETTER RESPONSES ............................................................................................................. 48
10. APPENDICES ...................................................................................................................................... 51
APPENDIX A – MAP ............................................................................................................................................... 51
APPENDIX B – LEAFLET ........................................................................................................................................... 52
APPENDIX C – BANNER .......................................................................................................................................... 53
APPENDIX D – ANIMATION ..................................................................................................................................... 54
APPENDIX E – INFOGRAPHICS .................................................................................................................................. 55
APPENDIX F – SOCIAL MEDIA ................................................................................................................................... 56
APPENDIX G – QUESTIONNAIRE ............................................................................................................................... 57
APPENDIX H – ENGAGEMENT .................................................................................................................................. 65
APPENDIX I – WARD RESPONSE ................................................................................................................................ 66
3
1. Introduction This report summarises the responses to an extensive public consultation on a proposed 20mph City-wide speed limit across Westminster City Council’s roads. As a part of Westminster City Council’s drive to create a healthier and greener Westminster, the council is proposing the introduction of a 20mph speed limit across the City (except for Transport for London’s Red Routes) in order to make Westminster a safer, healthier and cleaner environment for everyone. The aims of a City-wide 20mph limit are to:
a) Make Westminster a safer, healthier and cleaner environment for everyone b) Limit speed to reduce the severity of accidents, which make walking and cycling safer c) Encourage the use of alternative forms of transport such as walking and cycling d) Encourage healthier and more active lifestyles.
The aims of the public consultation were to understand:
• What people think about the proposed speed limit and the reasons why they support or oppose the scheme
• What people’s concerns are in relation to the proposed scheme
• Perception of the impact that a 20mph speed limit would have on safety, forms of transport, air quality, noise levels and overall health
• Whether the proposed scheme encourages the use of alternative forms of transport
• People’s priorities and ideas on how to achieve a healthier and greener City
• Campaign awareness and people’s preferred communication channels
4
2. Executive Summary
Following a trial where 20mph speed limits were introduced around 39 schools in Westminster, the council decided to consult on a City-wide 20mph speed limit. The public consultation opened on the 17th of September and ran for 12 weeks until the 10th of December 2019. The council chose a consultation period of 12 weeks to enable a broad range of views to be gathered.
2.1 Overview
The council received a large number of responses to the consultation through a variety of channels, with a high number of responses coming from the online consultation questionnaire. This report covers the findings from responses received through the consultation questionnaire and written responses by email and letter. The consultation questionnaire was available online and in paper and participants were self-selecting. Consequently, the profile of people responding to the questionnaire is not representative of the local population. However, as the council received over 1,500 responses, we are confident we have captured a wide range of views and covered all the major issues which need to be considered. The consultation response analysis in section 2.2 is based on the feedback we received from a mix of residents, workers, visitors, local businesses and stakeholder groups. The profile of questionnaire responses is below:
• 1,022 residents
• 223 workers or students
• 244 visitors
• 24 business owners / representatives
• 42 stakeholders and representatives of local organisations
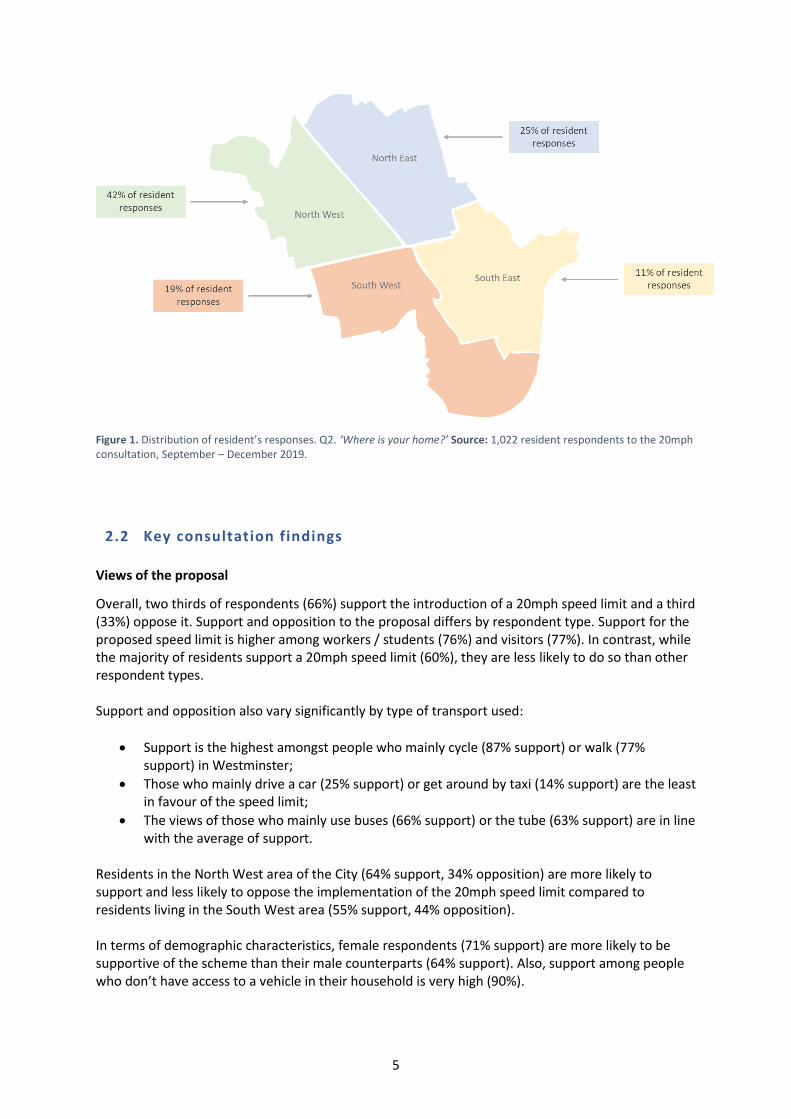
The geographical distribution of the 1,022 respondents who identified themselves as residents is as follows:
• 434 in the North West (42% of responses)
• 258 in the North East (25% of responses)
• 109 in the South East (11% of responses)
• 194 in the South West (19% of responses)
• 27 were not identifiable geographically (3% of responses)
5
Figure 1. Distribution of resident’s responses. Q2. ‘Where is your home?’ Source: 1,022 resident respondents to the 20mph consultation, September – December 2019.
2.2 Key consultation findings
Views of the proposal
Overall, two thirds of respondents (66%) support the introduction of a 20mph speed limit and a third (33%) oppose it. Support and opposition to the proposal differs by respondent type. Support for the proposed speed limit is higher among workers / students (76%) and visitors (77%). In contrast, while the majority of residents support a 20mph speed limit (60%), they are less likely to do so than other respondent types. Support and opposition also vary significantly by type of transport used:
• Support is the highest amongst people who mainly cycle (87% support) or walk (77% support) in Westminster;
• Those who mainly drive a car (25% support) or get around by taxi (14% support) are the least in favour of the speed limit;
• The views of those who mainly use buses (66% support) or the tube (63% support) are in line with the average of support.
Residents in the North West area of the City (64% support, 34% opposition) are more likely to support and less likely to oppose the implementation of the 20mph speed limit compared to residents living in the South West area (55% support, 44% opposition). In terms of demographic characteristics, female respondents (71% support) are more likely to be supportive of the scheme than their male counterparts (64% support). Also, support among people who don’t have access to a vehicle in their household is very high (90%).
6
Concerns
People’s main concern when responding to the consultation was the safety of pedestrians (75%). This was followed by concerns about air quality (64%) and the safety of cyclists (62%). The areas of concern differed by support and opposition groups and by type of respondents. Those who support the scheme are mainly concerned about safety, the environment and speeding: their top concerns were the safety of pedestrians (95%) and cyclists (79%), air quality (74%), the quality of the street environment (69%) and the speed of vehicles (54%).Those who oppose the introduction of the speed limit are primarily concerned about traffic issues and the environment, such as the impact it would have on their journey (76%), traffic congestions (74%), air quality (44%) and access to and from the area (40%). Residents are less concerned about safety (76% of resident concern, compared to 80% overall) and about the environment (71% compared to 73% overall) than the average of respondents. On the other hand, they are the most concerned about the impact that the speed limit will have on their home (33% compared to an average of 23%). Both visitors (88%) and workers / students (88%) are the most concerned about safety. Consequences on Westminster
Around two in three respondents agree with the following statements about the introduction of the speed limit:
• It would reduce the number and severity of collisions on the road (67% agreement)
• It would reduce noise levels (63% agreement)
• It would improve overall health and wellbeing (63% agreement)
Less people (58%) agree that the scheme would improve air quality and around half (49%) think that it would reduce the use of cars by promoting walking and cycling.
Agreement with the above statements differed by respondent type, with workers / students and visitors being more likely to agree with these statements than residents:
• Around three quarters of workers / students (77%) and of visitors (77%) agree that the speed limit would reduce the number and severity of collisions compared with 62% of residents;
• Around seven out of ten of worker / student (70%) and visitor (73%) agree that the proposal would reduce noise levels, compared to 58% of residents;
• Roughly three quarters of workers / students (72%) and visitors (76%) agree that the speed limit would improve overall health and wellbeing, compared with 58% of residents;
• Over two thirds of ten of workers / students (67%) and of visitors (71%) agree that the scheme would improve air quality, compared with half of residents (52%);
• A similar proportion of workers / students (61%) and visitors (64%) agree that the scheme would reduce the use of cars by promoting walking and cycling, compared to 42% of residents.
Consequences on journey choice
Less than half of respondents think that the scheme would encourage people to walk (44%) and cycle (42%). A further third (31%) of participants think that it would encourage the use of public transport.
7
On average, residents are less likely than other respondents to say that the proposed speed limit would encourage them to walk (35%) or cycle (33%), whereas agreement for workers / students (58% would walk more, 55% would cycle more) and visitors (66% would walk and 70% would cycle more) is higher than average. Also, whilst residents are less likely to think that the scheme would encourage the use of public transport (27%), visitors (45%) are more likely to agree that it would. Environmental priorities
Most people (62%) think that the council should prioritise cutting down harmful emissions and
improve air quality. The other top priorities are:
• improving facilities for cycling (36%)
• reducing vehicles on the road (33%)
• protecting and increasing green spaces (33%)
• improving facilities for walking (32%)
Environmental priorities varied across respondent types. Residents are more likely than others to
prioritise the availability of green spaces (37%) and open spaces (17%), reducing noise pollution
(28%), increasing recycling rates (26%) and improving the infrastructure for electric vehicles (22%).
On the other hand, they are less likely than others to choose improving facilities for both walking
(25%) and cycling (25%) as a priority.
The visitors’ group is the most concerned about cycling facilities (64%), and they are more likely than
others to prioritise the improvement of walking facilities (48%). On the other hand, they are the
least interested group in the City’s recycling rates and waste (11%).
2.3 Next steps
The results of Westminster’s 20mph consultation will inform the council’s decision on whether to implement a City-wide speed limit. A decision will be made in March 2020. Subject to the Cabinet Member’s consideration, a Traffic Management Order (TMO) proposing a permanent change to the speed limit would then be issued for consultation. This statutory decision process takes one month and will be advertised online and in the Westminster Gazette. Subject to a formal decision to progress, implementation of the scheme is anticipated to take place in Spring and Summer 2020 and should take up to two months to complete.
8
3. Communications Programme In order to widely publicise the consultation, a range of online and offline communications channels were used. These included:
• Consultation leaflets and posters • Emails to residents’ groups, housing associations and an extensive list of stakeholders that
were identified at a stakeholder mapping workshop • Content in council e-newsletters sent to residents and businesses • Drop-in sessions across the City • Pull-up banners to promote drop-in sessions on the day they took place • Media / press programme • Promotion on social media (Appendix E and Appendix F)
Consultation brochure / leaflet
This provided an explanation of the proposed speed limit. It included dates and times for drop-in sessions and the survey link. Printed copies were distributed to libraries, community centres, provided at the drop-in sessions and on request. Information was also shared widely via social media and council e-newsletters. Materials
A full list of the printed consultation materials that were produced is detailed below:
• Maps showing the current speed limits across the City of Westminster (Appendix A)
• Poster with dates and times for drop-in sessions and survey link
• Leaflet with dates and times for drop-in sessions and survey link (Appendix B)
• Two roll-up banners used at the drop-in sessions and in libraries (Appendix C)
• Hard copies of the consultation questionnaire (Appendix G) The above printed material was also made available in libraries, community centres and at the drop-in sessions. Website
All information about the consultation was hosted on a dedicated webpage – www.westminster.gov.uk/20mph. On the page respondents could see a brief animated video with information about the proposed 20mph scheme (see Appendix D).
9
4. Consultation Programme Public consultation on the proposed 20mph speed limit commenced on the 17th of September and lasted for 12 weeks until the 10th of December 2019. The council chose a consultation period of 12 weeks to enable a broad range of views to be gathered. Respondents were asked whether they supported or opposed the implementation of a City-wide 20mph speed limit on all of Westminster’s roads. Some of the roads in the City of Westminster are controlled by Transport for London (TfL), and the implementation of the scheme would not apply to those roads. The map in Appendix A shows which roads are controlled by Westminster City Council and what the current speed limits are. The consultation programme covered both online, printed and face-to face channels in order to encourage a broad range of responses from different groups, including residents, workers and students in the area, regular visitors, businesses, organisations and campaign groups in Westminster. Early Engagement
Before the consultation began, Westminster City Council and Westco ran a stakeholder mapping workshop to identify the key stakeholders that would require early engagement in preparation for the consultation. Also, the workshop served to identify the potential risks of the consultation and their mitigation. This informed the communications plan and some stakeholders were informed about the consultation in advance as a consequence. Over 450 stakeholders, businesses and organisations were contacted and informed about the 20mph Consultation. Consultation Questionnaire
The consultation questionnaire consisted of mainly closed questions in order to understand agreement / disagreement with the proposed 20mph speed limit. Closed questions used 5-point scales from ‘strongly agree’ to ‘strongly disagree’, from ‘strongly support’ to ‘strongly oppose’ or from ‘much more likely’ to ‘much less likely’. There was an opportunity to leave open comments on the plans within the survey. Survey themes included: • How respondents get around the City of Westminster • Support of the proposed 20mph speed limit • Key areas of concern • The impact of the scheme on the environment, society and individuals • The council’s environmental priorities
The consultation questionnaire was accessible online via the dedicated 20mph webpage (www.westminster.gov.uk/20mph). Additionally, paper copies of the questionnaire (see Appendix G) were made available at all drop-in sessions, in libraries, community centres and at the Open Forum public event. They could also be requested by phone as and when needed. Completed hard copies could be returned to Westminster City Council via Freepost or could be handed in at the drop-in sessions. The consultation brochure and questionnaire could also be requested in other languages and large print.
10
The questionnaire website link was included on the consultation leaflet and posters distributed in libraries, community centres, drop-in events and online newsletters as well as on social media throughout the consultation. Email and Phone Number
A dedicated email address ([email protected]) and a phone number were provided to allow members of the public to request paper copies of the questionnaire, ask questions and put forward their views and comments. Drop-In Sessions and Open Forum
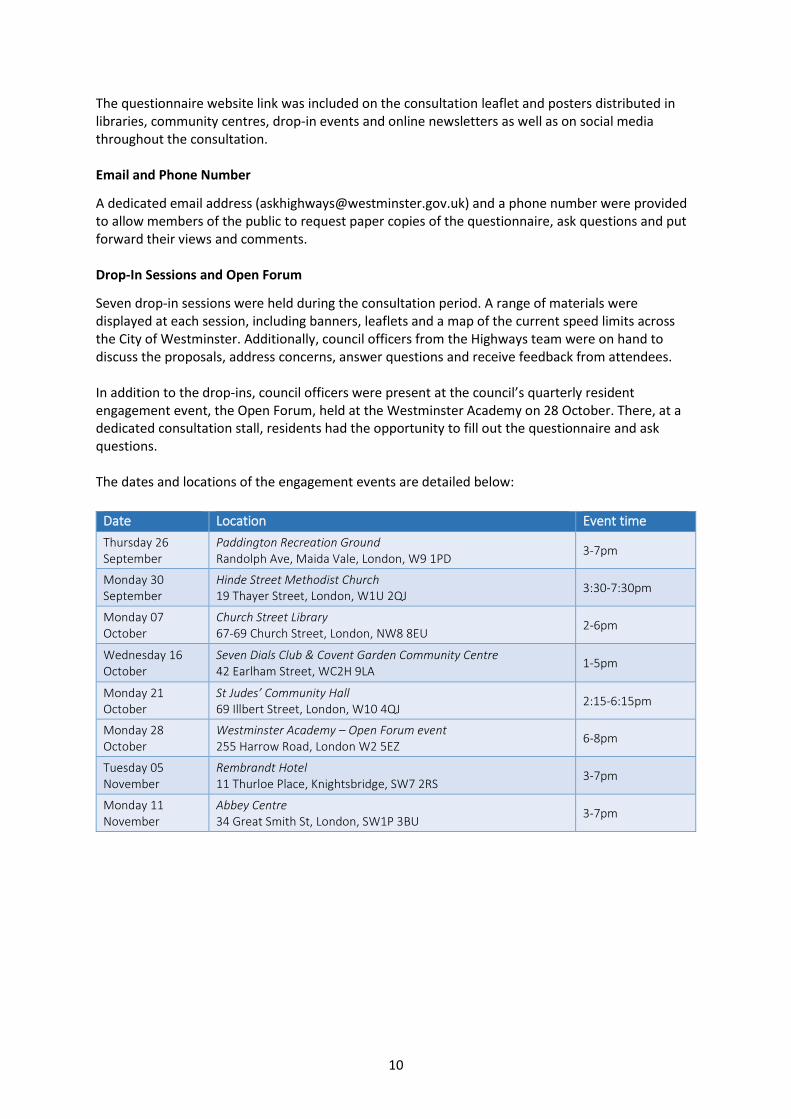
Seven drop-in sessions were held during the consultation period. A range of materials were displayed at each session, including banners, leaflets and a map of the current speed limits across the City of Westminster. Additionally, council officers from the Highways team were on hand to discuss the proposals, address concerns, answer questions and receive feedback from attendees. In addition to the drop-ins, council officers were present at the council’s quarterly resident engagement event, the Open Forum, held at the Westminster Academy on 28 October. There, at a dedicated consultation stall, residents had the opportunity to fill out the questionnaire and ask questions. The dates and locations of the engagement events are detailed below:
Date Location Event time
Thursday 26 September
Paddington Recreation Ground Randolph Ave, Maida Vale, London, W9 1PD
3-7pm
Monday 30 September
Hinde Street Methodist Church 19 Thayer Street, London, W1U 2QJ
3:30-7:30pm
Monday 07 October
Church Street Library 67-69 Church Street, London, NW8 8EU
2-6pm
Wednesday 16 October
Seven Dials Club & Covent Garden Community Centre 42 Earlham Street, WC2H 9LA
1-5pm
Monday 21 October
St Judes’ Community Hall 69 Illbert Street, London, W10 4QJ
2:15-6:15pm
Monday 28 October
Westminster Academy – Open Forum event 255 Harrow Road, London W2 5EZ
6-8pm
Tuesday 05 November
Rembrandt Hotel 11 Thurloe Place, Knightsbridge, SW7 2RS
3-7pm
Monday 11 November
Abbey Centre 34 Great Smith St, London, SW1P 3BU
3-7pm
11
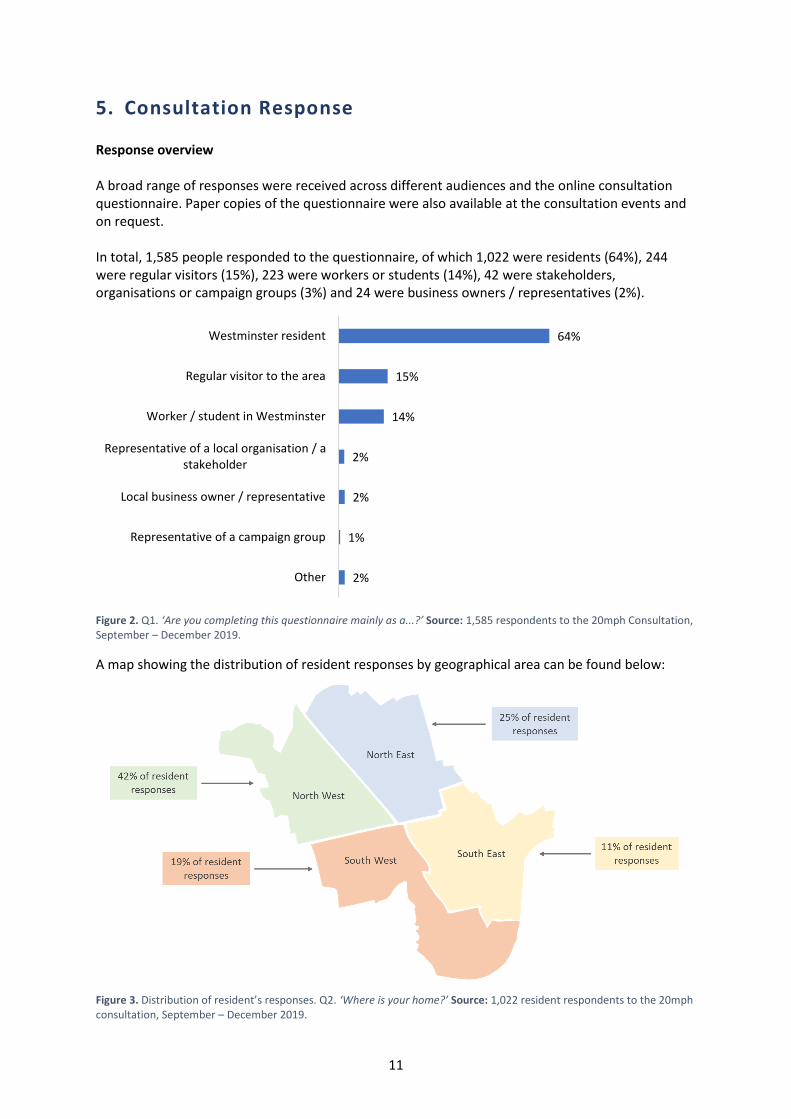
5. Consultation Response Response overview A broad range of responses were received across different audiences and the online consultation questionnaire. Paper copies of the questionnaire were also available at the consultation events and on request. In total, 1,585 people responded to the questionnaire, of which 1,022 were residents (64%), 244 were regular visitors (15%), 223 were workers or students (14%), 42 were stakeholders, organisations or campaign groups (3%) and 24 were business owners / representatives (2%).
Figure 2. Q1. ‘Are you completing this questionnaire mainly as a...?’ Source: 1,585 respondents to the 20mph Consultation, September – December 2019.
A map showing the distribution of resident responses by geographical area can be found below:
Figure 3. Distribution of resident’s responses. Q2. ‘Where is your home?’ Source: 1,022 resident respondents to the 20mph consultation, September – December 2019.
2%
1%
2%
2%
14%
15%
64%
Other
Representative of a campaign group
Local business owner / representative
Representative of a local organisation / astakeholder
Worker / student in Westminster
Regular visitor to the area
Westminster resident
12
The consultation questionnaire was self-selecting and so it is not representative of the population who lives, works, studies or visits Westminster. However, as the council received over 1,500 responses, we are confident we have captured all the major issues which need to be considered. In addition, responses were received via the following channels:
• Email responses
24 emails were received during the consultation to the consultation inbox, from a mixture of residents and stakeholders.
• Pop-up events engagement
Over the eight pop-up events, council officers engaged with around 240 people by handing out flyers, paper questionnaires and answering to people’s questions in regard to the proposed 20mph speed limit. In order to maximise engagement, council officers would go outside to distribute leaflets and talk to businesses and people in the area. A breakdown of the number of people reached at each event can be found in Appendix H. Business and stakeholder responses
There was a mix of businesses that responded to the consultation from the office, retail, food and beverage and other sectors. Also, stakeholders and organisations were contacted as part of this consultation. Analysis Methodology
A total of 1,585 people responded to the online consultation questionnaire or completed the paper version. Some of the questions in the consultation questionnaire allowed the respondent to tick multiple answers. Therefore, in some of the analysis, the sum of the response to a question may be higher than 100%. In other cases, the total response to a single-answer question may add up to slightly over 100% due to rounding of decimal points. Questions are based on the total number of respondents per question, as not all respondents answered every question. At times throughout the report we will compare the response to a particular question by different groups. These comparisons are only possible where enough members of a group have responded to the questionnaire. Therefore, in most of this report we avoided describing and comparing figures for groups with a base size of below 50. When a base size is below 50 it does not allow for reliable statistical comparisons against other samples. All the open-ended questions in the consultation questionnaire were coded into themes to allow the responses to be quantified. This encompassed reading every response to these questions and creating a code frame.
13
6. Key Findings from the Consultation Questionnaire
6.1 Views of the proposal
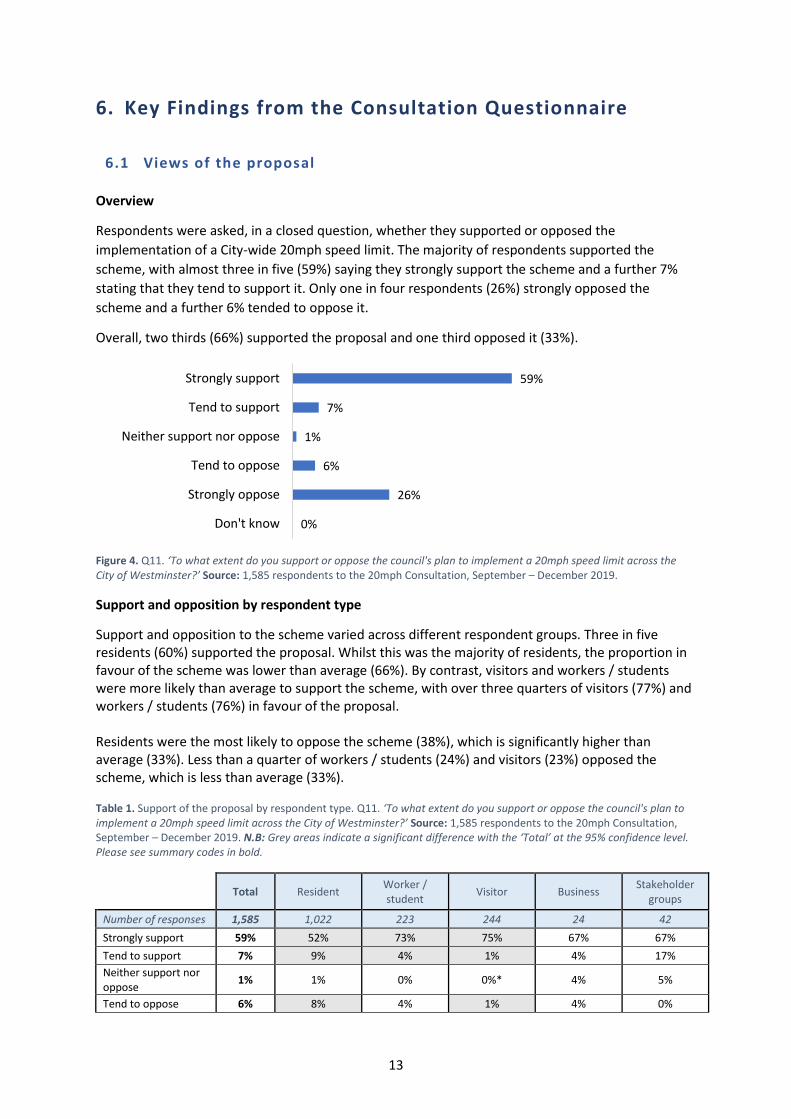
Overview
Respondents were asked, in a closed question, whether they supported or opposed the
implementation of a City-wide 20mph speed limit. The majority of respondents supported the
scheme, with almost three in five (59%) saying they strongly support the scheme and a further 7%
stating that they tend to support it. Only one in four respondents (26%) strongly opposed the
scheme and a further 6% tended to oppose it.
Overall, two thirds (66%) supported the proposal and one third opposed it (33%).
Figure 4. Q11. ‘To what extent do you support or oppose the council's plan to implement a 20mph speed limit across the City of Westminster?’ Source: 1,585 respondents to the 20mph Consultation, September – December 2019.
Support and opposition by respondent type
Support and opposition to the scheme varied across different respondent groups. Three in five residents (60%) supported the proposal. Whilst this was the majority of residents, the proportion in favour of the scheme was lower than average (66%). By contrast, visitors and workers / students were more likely than average to support the scheme, with over three quarters of visitors (77%) and workers / students (76%) in favour of the proposal. Residents were the most likely to oppose the scheme (38%), which is significantly higher than average (33%). Less than a quarter of workers / students (24%) and visitors (23%) opposed the scheme, which is less than average (33%). Table 1. Support of the proposal by respondent type. Q11. ‘To what extent do you support or oppose the council's plan to implement a 20mph speed limit across the City of Westminster?’ Source: 1,585 respondents to the 20mph Consultation, September – December 2019. N.B: Grey areas indicate a significant difference with the ‘Total’ at the 95% confidence level. Please see summary codes in bold.
Total Resident Worker / student
Visitor Business Stakeholder
groups
Number of responses 1,585 1,022 223 244 24 42
Strongly support 59% 52% 73% 75% 67% 67%
Tend to support 7% 9% 4% 1% 4% 17%
Neither support nor oppose
1% 1% 0% 0%* 4% 5%
Tend to oppose 6% 8% 4% 1% 4% 0%
59%
7%
1%
6%
26%
0%
Strongly support
Tend to support
Neither support nor oppose
Tend to oppose
Strongly oppose
Don't know
14
Strongly oppose 26% 30% 19% 22% 21% 10%
Don't know 0%* 0%* 0% 0% 0% 2%
Support 66% 60% 76% 77% 71% 83%
Oppose 33% 38% 24% 23% 25% 10%
Net support 33% 22% 52% 54% 46% 74%
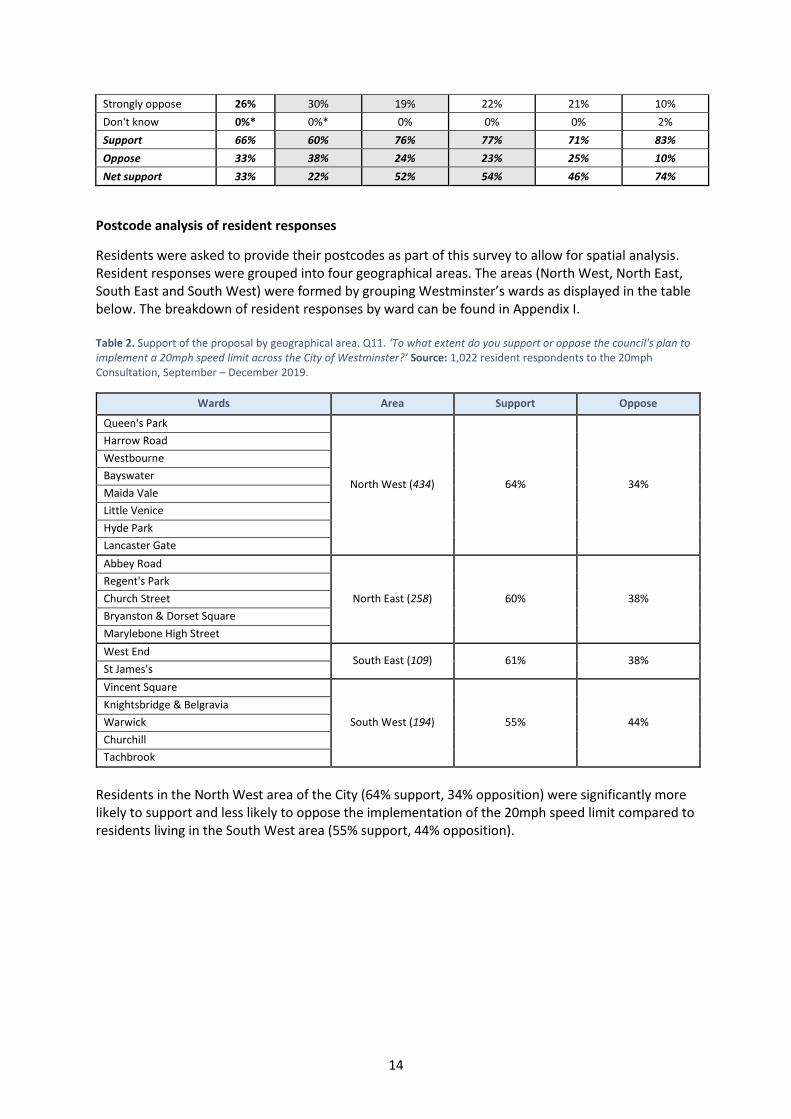
Postcode analysis of resident responses
Residents were asked to provide their postcodes as part of this survey to allow for spatial analysis. Resident responses were grouped into four geographical areas. The areas (North West, North East, South East and South West) were formed by grouping Westminster’s wards as displayed in the table below. The breakdown of resident responses by ward can be found in Appendix I. Table 2. Support of the proposal by geographical area. Q11. ‘To what extent do you support or oppose the council's plan to implement a 20mph speed limit across the City of Westminster?’ Source: 1,022 resident respondents to the 20mph Consultation, September – December 2019.
Wards Area Support Oppose
Queen's Park
North West (434) 64% 34%
Harrow Road
Westbourne
Bayswater
Maida Vale
Little Venice
Hyde Park
Lancaster Gate
Abbey Road
North East (258) 60% 38%
Regent's Park
Church Street
Bryanston & Dorset Square
Marylebone High Street
West End South East (109) 61% 38%
St James's
Vincent Square
South West (194) 55% 44%
Knightsbridge & Belgravia
Warwick
Churchill
Tachbrook
Residents in the North West area of the City (64% support, 34% opposition) were significantly more likely to support and less likely to oppose the implementation of the 20mph speed limit compared to residents living in the South West area (55% support, 44% opposition).
15
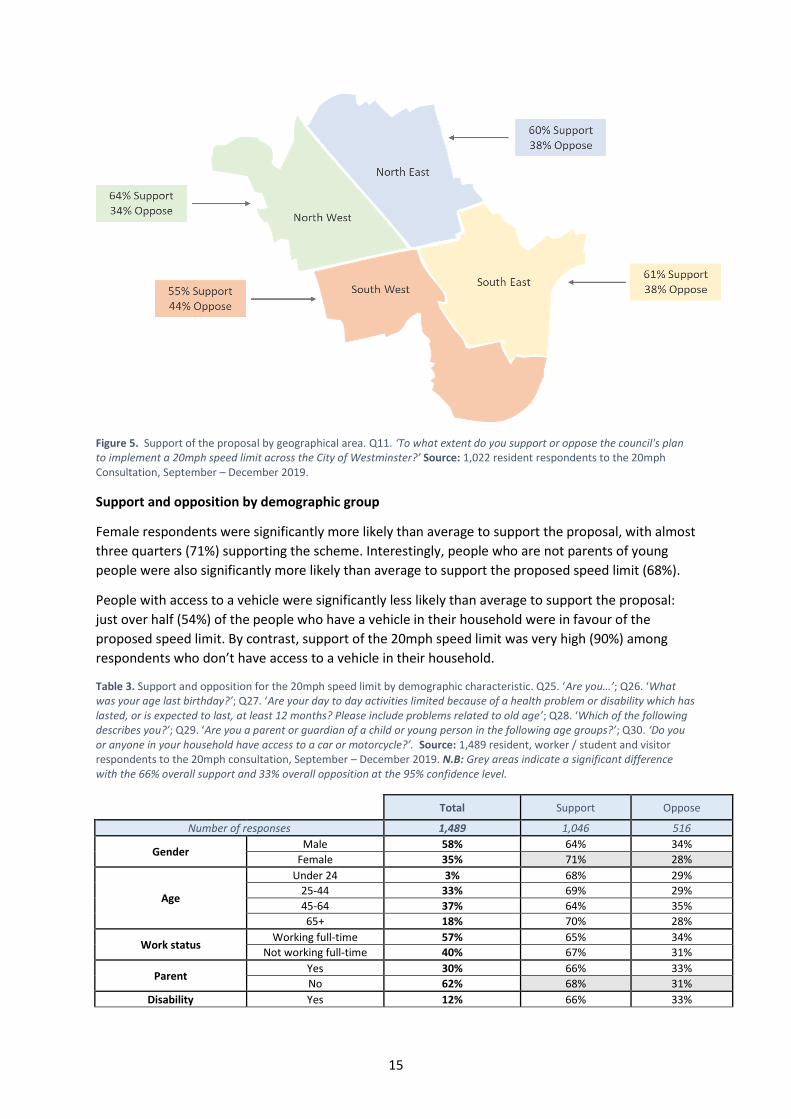
Figure 5. Support of the proposal by geographical area. Q11. ‘To what extent do you support or oppose the council's plan to implement a 20mph speed limit across the City of Westminster?’ Source: 1,022 resident respondents to the 20mph Consultation, September – December 2019.
Support and opposition by demographic group
Female respondents were significantly more likely than average to support the proposal, with almost
three quarters (71%) supporting the scheme. Interestingly, people who are not parents of young
people were also significantly more likely than average to support the proposed speed limit (68%).
People with access to a vehicle were significantly less likely than average to support the proposal:
just over half (54%) of the people who have a vehicle in their household were in favour of the
proposed speed limit. By contrast, support of the 20mph speed limit was very high (90%) among
respondents who don’t have access to a vehicle in their household.
Table 3. Support and opposition for the 20mph speed limit by demographic characteristic. Q25. ‘Are you…’; Q26. ‘What was your age last birthday?’; Q27. ‘Are your day to day activities limited because of a health problem or disability which has lasted, or is expected to last, at least 12 months? Please include problems related to old age’; Q28. ‘Which of the following describes you?’; Q29. ‘Are you a parent or guardian of a child or young person in the following age groups?’; Q30. ‘Do you or anyone in your household have access to a car or motorcycle?’. Source: 1,489 resident, worker / student and visitor respondents to the 20mph consultation, September – December 2019. N.B: Grey areas indicate a significant difference with the 66% overall support and 33% overall opposition at the 95% confidence level.
Total Support Oppose
Number of responses 1,489 1,046 516
Gender Male 58% 64% 34%
Female 35% 71% 28%
Age
Under 24 3% 68% 29%
25-44 33% 69% 29%
45-64 37% 64% 35%
65+ 18% 70% 28%
Work status Working full-time 57% 65% 34%
Not working full-time 40% 67% 31%
Parent Yes 30% 66% 33%
No 62% 68% 31%
Disability Yes 12% 66% 33%
16
No 86% 66% 33%
Vehicle access Yes 65% 54% 44%
No 33% 90% 10%
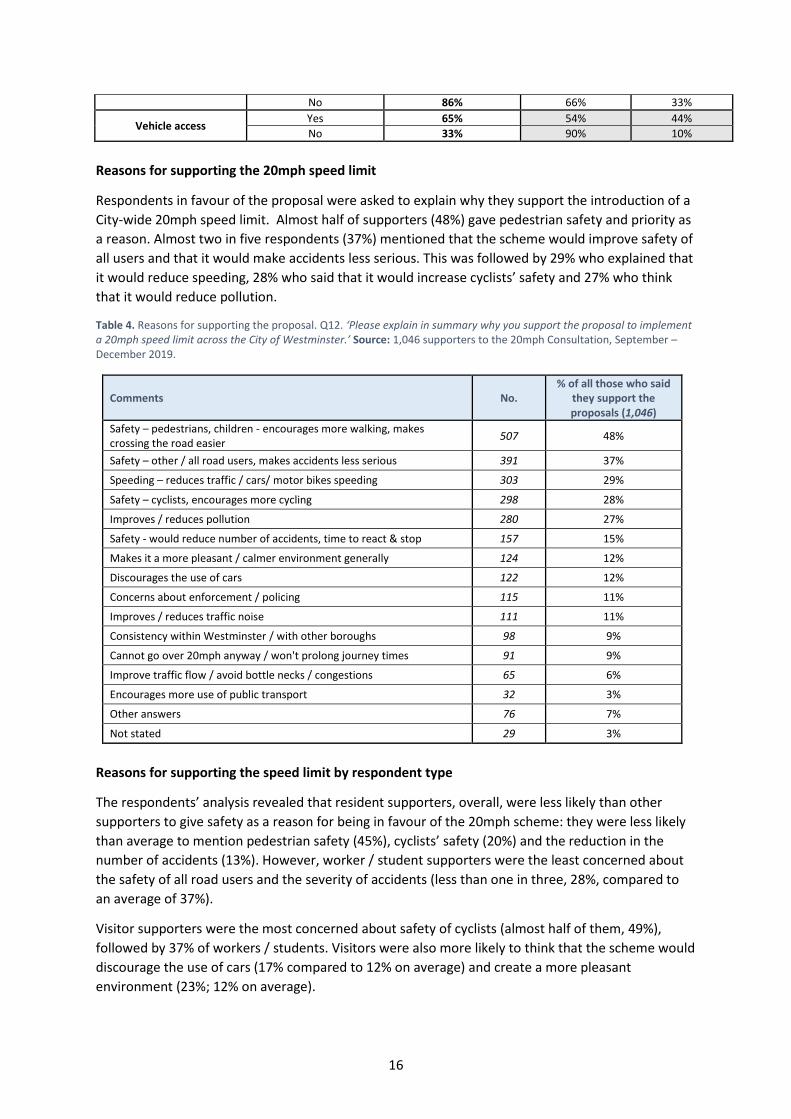
Reasons for supporting the 20mph speed limit
Respondents in favour of the proposal were asked to explain why they support the introduction of a
City-wide 20mph speed limit. Almost half of supporters (48%) gave pedestrian safety and priority as
a reason. Almost two in five respondents (37%) mentioned that the scheme would improve safety of
all users and that it would make accidents less serious. This was followed by 29% who explained that
it would reduce speeding, 28% who said that it would increase cyclists’ safety and 27% who think
that it would reduce pollution.
Table 4. Reasons for supporting the proposal. Q12. ‘Please explain in summary why you support the proposal to implement a 20mph speed limit across the City of Westminster.’ Source: 1,046 supporters to the 20mph Consultation, September – December 2019.
Comments No. % of all those who said
they support the proposals (1,046)
Safety – pedestrians, children - encourages more walking, makes crossing the road easier
507 48%
Safety – other / all road users, makes accidents less serious 391 37%
Speeding – reduces traffic / cars/ motor bikes speeding 303 29%
Safety – cyclists, encourages more cycling 298 28%
Improves / reduces pollution 280 27%
Safety - would reduce number of accidents, time to react & stop 157 15%
Makes it a more pleasant / calmer environment generally 124 12%
Discourages the use of cars 122 12%
Concerns about enforcement / policing 115 11%
Improves / reduces traffic noise 111 11%
Consistency within Westminster / with other boroughs 98 9%
Cannot go over 20mph anyway / won't prolong journey times 91 9%
Improve traffic flow / avoid bottle necks / congestions 65 6%
Encourages more use of public transport 32 3%
Other answers 76 7%
Not stated 29 3%
Reasons for supporting the speed limit by respondent type
The respondents’ analysis revealed that resident supporters, overall, were less likely than other
supporters to give safety as a reason for being in favour of the 20mph scheme: they were less likely
than average to mention pedestrian safety (45%), cyclists’ safety (20%) and the reduction in the
number of accidents (13%). However, worker / student supporters were the least concerned about
the safety of all road users and the severity of accidents (less than one in three, 28%, compared to
an average of 37%).
Visitor supporters were the most concerned about safety of cyclists (almost half of them, 49%),
followed by 37% of workers / students. Visitors were also more likely to think that the scheme would
discourage the use of cars (17% compared to 12% on average) and create a more pleasant
environment (23%; 12% on average).
17
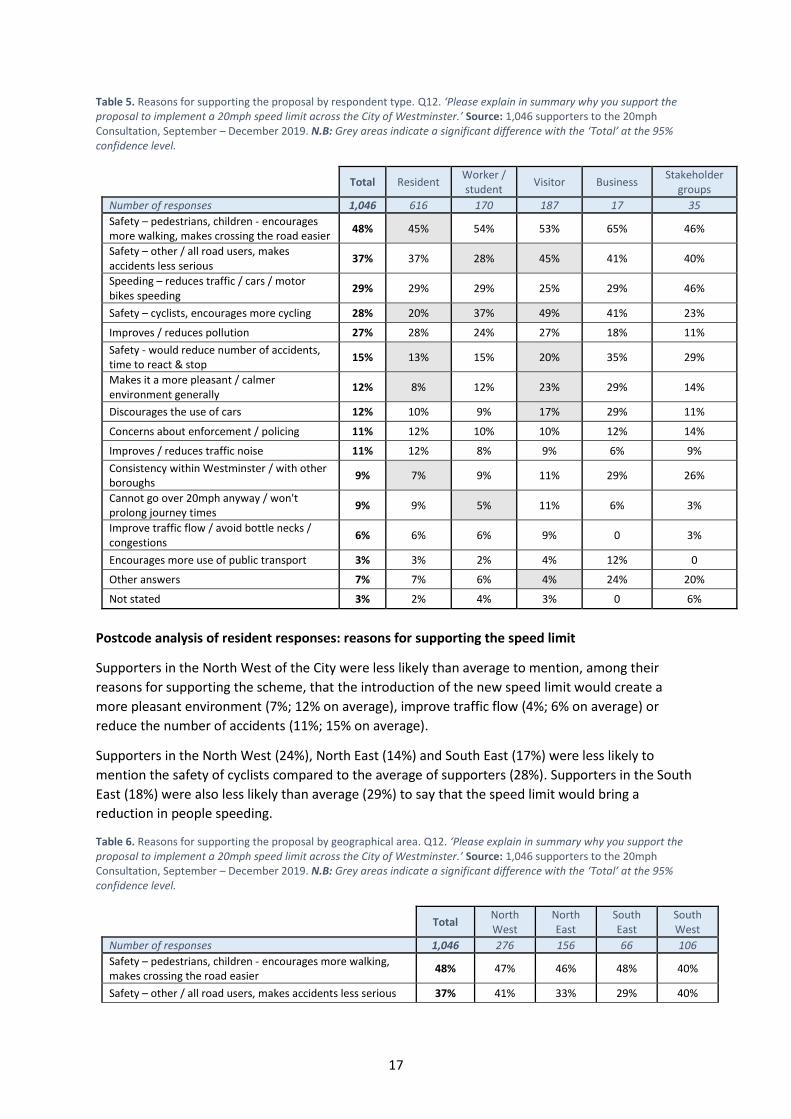
Table 5. Reasons for supporting the proposal by respondent type. Q12. ‘Please explain in summary why you support the proposal to implement a 20mph speed limit across the City of Westminster.’ Source: 1,046 supporters to the 20mph Consultation, September – December 2019. N.B: Grey areas indicate a significant difference with the ‘Total’ at the 95% confidence level.
Total Resident Worker / student
Visitor Business Stakeholder
groups
Number of responses 1,046 616 170 187 17 35
Safety – pedestrians, children - encourages more walking, makes crossing the road easier
48% 45% 54% 53% 65% 46%
Safety – other / all road users, makes accidents less serious
37% 37% 28% 45% 41% 40%
Speeding – reduces traffic / cars / motor bikes speeding
29% 29% 29% 25% 29% 46%
Safety – cyclists, encourages more cycling 28% 20% 37% 49% 41% 23%
Improves / reduces pollution 27% 28% 24% 27% 18% 11%
Safety - would reduce number of accidents, time to react & stop
15% 13% 15% 20% 35% 29%
Makes it a more pleasant / calmer environment generally
12% 8% 12% 23% 29% 14%
Discourages the use of cars 12% 10% 9% 17% 29% 11%
Concerns about enforcement / policing 11% 12% 10% 10% 12% 14%
Improves / reduces traffic noise 11% 12% 8% 9% 6% 9%
Consistency within Westminster / with other boroughs
9% 7% 9% 11% 29% 26%
Cannot go over 20mph anyway / won't prolong journey times
9% 9% 5% 11% 6% 3%
Improve traffic flow / avoid bottle necks / congestions
6% 6% 6% 9% 0 3%
Encourages more use of public transport 3% 3% 2% 4% 12% 0
Other answers 7% 7% 6% 4% 24% 20%
Not stated 3% 2% 4% 3% 0 6%
Postcode analysis of resident responses: reasons for supporting the speed limit
Supporters in the North West of the City were less likely than average to mention, among their
reasons for supporting the scheme, that the introduction of the new speed limit would create a
more pleasant environment (7%; 12% on average), improve traffic flow (4%; 6% on average) or
reduce the number of accidents (11%; 15% on average).
Supporters in the North West (24%), North East (14%) and South East (17%) were less likely to
mention the safety of cyclists compared to the average of supporters (28%). Supporters in the South
East (18%) were also less likely than average (29%) to say that the speed limit would bring a
reduction in people speeding.
Table 6. Reasons for supporting the proposal by geographical area. Q12. ‘Please explain in summary why you support the proposal to implement a 20mph speed limit across the City of Westminster.’ Source: 1,046 supporters to the 20mph Consultation, September – December 2019. N.B: Grey areas indicate a significant difference with the ‘Total’ at the 95% confidence level.
Total North West
North East
South East
South West
Number of responses 1,046 276 156 66 106
Safety – pedestrians, children - encourages more walking, makes crossing the road easier
48% 47% 46% 48% 40%
Safety – other / all road users, makes accidents less serious 37% 41% 33% 29% 40%
18
Speeding – reduces traffic / cars / motor bikes speeding 29% 31% 31% 18% 26%
Safety – cyclists, encourages more cycling 28% 24% 14% 17% 24%
Improves / reduces pollution 27% 28% 33% 32% 22%
Safety - would reduce number of accidents, time to react & stop
15% 11% 14% 12% 16%
Makes it a more pleasant / calmer environment generally 12% 7% 8% 6% 11%
Discourages the use of cars 12% 9% 10% 11% 12%
Concerns about enforcement / policing 11% 14% 9% 9% 13%
Improves / reduces traffic noise 11% 11% 15% 11% 11%
Consistency within Westminster / with other boroughs 9% 8% 6% 3% 10%
Cannot go over 20mph anyway / won't prolong journey times 9% 8% 10% 11% 12%
Improve traffic flow / avoid bottle necks / congestions 6% 4% 7% 8% 8%
Encourages more use of public transport 3% 4% 1% 2% 5%
Other answers 7% 6% 7% 11% 8%
Not stated 3% 2% 1% 3% 5%
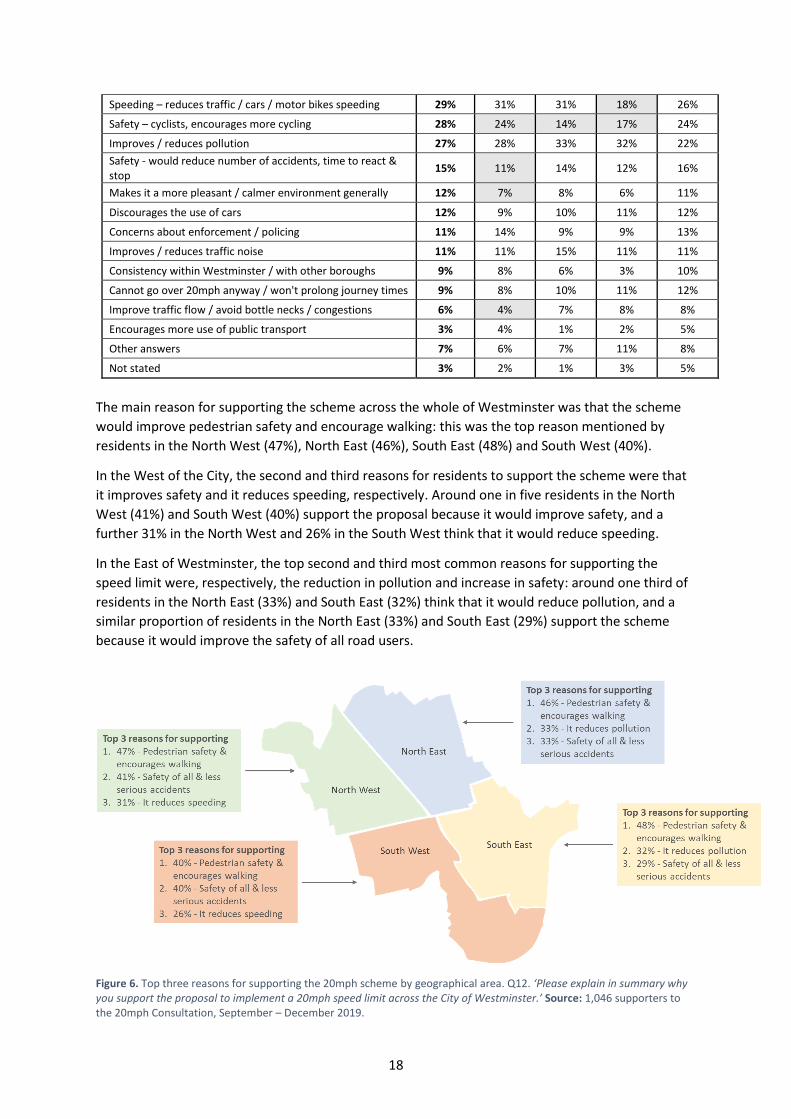
The main reason for supporting the scheme across the whole of Westminster was that the scheme
would improve pedestrian safety and encourage walking: this was the top reason mentioned by
residents in the North West (47%), North East (46%), South East (48%) and South West (40%).
In the West of the City, the second and third reasons for residents to support the scheme were that
it improves safety and it reduces speeding, respectively. Around one in five residents in the North
West (41%) and South West (40%) support the proposal because it would improve safety, and a
further 31% in the North West and 26% in the South West think that it would reduce speeding.
In the East of Westminster, the top second and third most common reasons for supporting the
speed limit were, respectively, the reduction in pollution and increase in safety: around one third of
residents in the North East (33%) and South East (32%) think that it would reduce pollution, and a
similar proportion of residents in the North East (33%) and South East (29%) support the scheme
because it would improve the safety of all road users.
Figure 6. Top three reasons for supporting the 20mph scheme by geographical area. Q12. ‘Please explain in summary why you support the proposal to implement a 20mph speed limit across the City of Westminster.’ Source: 1,046 supporters to the 20mph Consultation, September – December 2019.
19
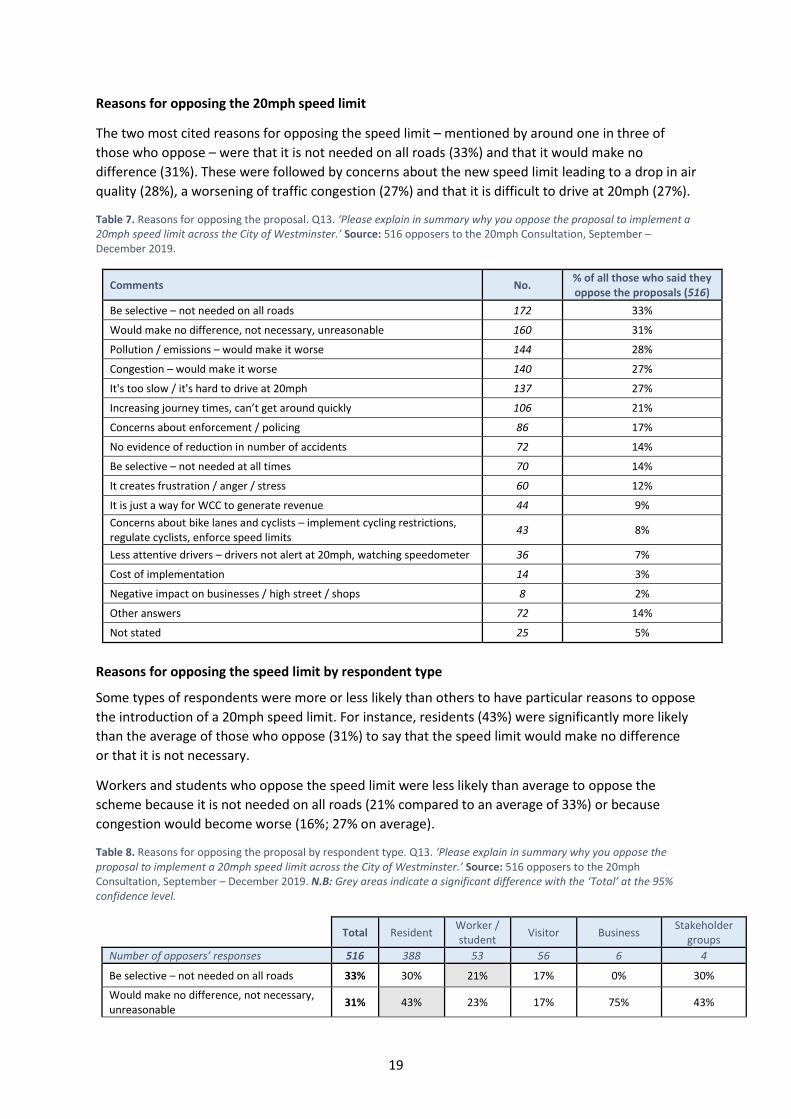
Reasons for opposing the 20mph speed limit
The two most cited reasons for opposing the speed limit – mentioned by around one in three of
those who oppose – were that it is not needed on all roads (33%) and that it would make no
difference (31%). These were followed by concerns about the new speed limit leading to a drop in air
quality (28%), a worsening of traffic congestion (27%) and that it is difficult to drive at 20mph (27%).
Table 7. Reasons for opposing the proposal. Q13. ‘Please explain in summary why you oppose the proposal to implement a 20mph speed limit across the City of Westminster.’ Source: 516 opposers to the 20mph Consultation, September – December 2019.
Comments No. % of all those who said they oppose the proposals (516)
Be selective – not needed on all roads 172 33%
Would make no difference, not necessary, unreasonable 160 31%
Pollution / emissions – would make it worse 144 28%
Congestion – would make it worse 140 27%
It's too slow / it's hard to drive at 20mph 137 27%
Increasing journey times, can’t get around quickly 106 21%
Concerns about enforcement / policing 86 17%
No evidence of reduction in number of accidents 72 14%
Be selective – not needed at all times 70 14%
It creates frustration / anger / stress 60 12%
It is just a way for WCC to generate revenue 44 9%
Concerns about bike lanes and cyclists – implement cycling restrictions, regulate cyclists, enforce speed limits
43 8%
Less attentive drivers – drivers not alert at 20mph, watching speedometer 36 7%
Cost of implementation 14 3%
Negative impact on businesses / high street / shops 8 2%
Other answers 72 14%
Not stated 25 5%
Reasons for opposing the speed limit by respondent type
Some types of respondents were more or less likely than others to have particular reasons to oppose
the introduction of a 20mph speed limit. For instance, residents (43%) were significantly more likely
than the average of those who oppose (31%) to say that the speed limit would make no difference
or that it is not necessary.
Workers and students who oppose the speed limit were less likely than average to oppose the
scheme because it is not needed on all roads (21% compared to an average of 33%) or because
congestion would become worse (16%; 27% on average).
Table 8. Reasons for opposing the proposal by respondent type. Q13. ‘Please explain in summary why you oppose the proposal to implement a 20mph speed limit across the City of Westminster.’ Source: 516 opposers to the 20mph Consultation, September – December 2019. N.B: Grey areas indicate a significant difference with the ‘Total’ at the 95% confidence level.
Total Resident Worker / student
Visitor Business Stakeholder
groups
Number of opposers’ responses 516 388 53 56 6 4
Be selective – not needed on all roads 33% 30% 21% 17% 0% 30%
Would make no difference, not necessary, unreasonable
31% 43% 23% 17% 75% 43%
20
Pollution / emissions – would make it worse 28% 21% 20% 0% 25% 21%
Congestion – would make it worse 27% 25% 16% 33% 0% 25%
It's too slow / it's hard to drive at 20mph 27% 28% 18% 0% 0% 28%
Increasing journey times, can’t get around quickly
21% 13% 14% 33% 25% 13%
Concerns about enforcement / policing 17% 8% 11% 0% 0% 8%
No evidence of reduction in number of accidents
14% 11% 13% 0% 25% 11%
Be selective – not needed at all times 14% 19% 9% 17% 0% 19%
It creates frustration / anger / stress 12% 9% 16% 17% 0% 9%
It is just a way for WCC to generate revenue 9% 6% 9% 0% 0% 6%
Concerns about bike lanes and cyclists – implement cycling restrictions, regulate cyclists, enforce speed limits
8% 13% 7% 0% 0% 13%
Less attentive drivers – drivers not alert at 20mph, watching speedometer
7% 4% 5% 17% 0% 4%
Cost of implementation 3% 4% 2% 0% 0% 4%
Negative impact on businesses / high street / shops
2% 0% 2% 0% 25% 0%
Other answers 14% 13% 14% 0% 25% 13%
Not stated 5% 4% 16% 0% 0% 4%
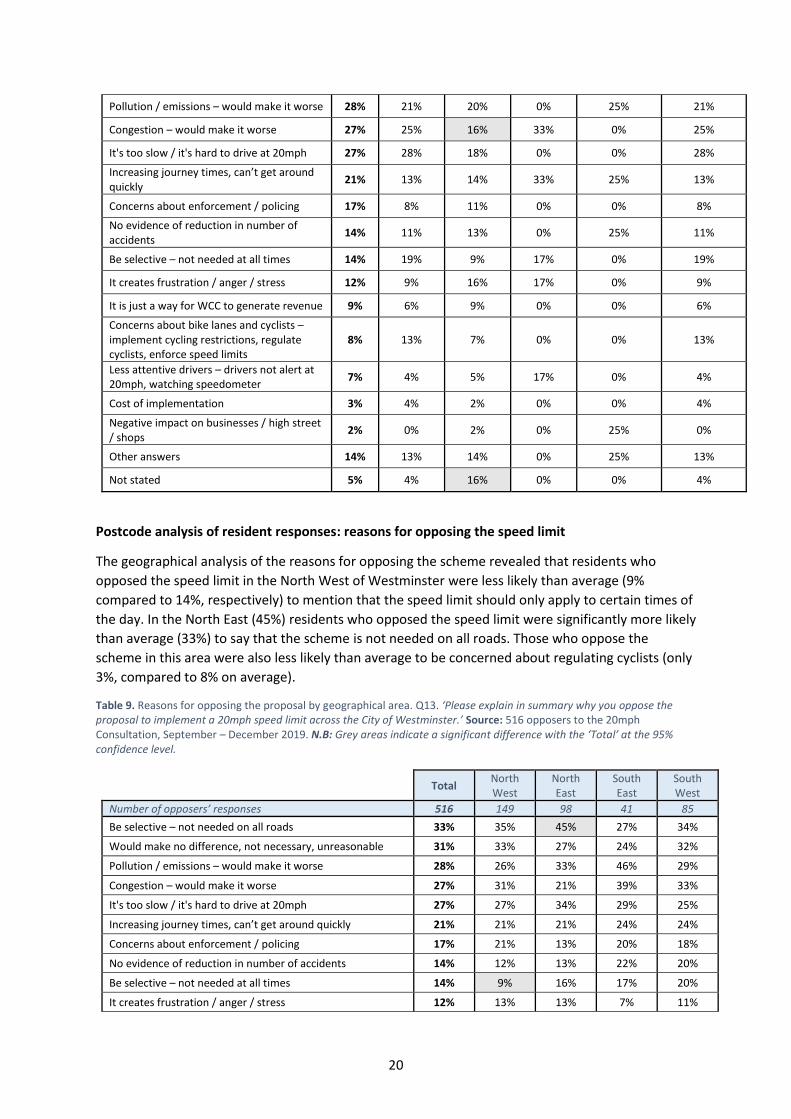
Postcode analysis of resident responses: reasons for opposing the speed limit
The geographical analysis of the reasons for opposing the scheme revealed that residents who
opposed the speed limit in the North West of Westminster were less likely than average (9%
compared to 14%, respectively) to mention that the speed limit should only apply to certain times of
the day. In the North East (45%) residents who opposed the speed limit were significantly more likely
than average (33%) to say that the scheme is not needed on all roads. Those who oppose the
scheme in this area were also less likely than average to be concerned about regulating cyclists (only
3%, compared to 8% on average).
Table 9. Reasons for opposing the proposal by geographical area. Q13. ‘Please explain in summary why you oppose the proposal to implement a 20mph speed limit across the City of Westminster.’ Source: 516 opposers to the 20mph Consultation, September – December 2019. N.B: Grey areas indicate a significant difference with the ‘Total’ at the 95% confidence level.
Total North West
North East
South East
South West
Number of opposers’ responses 516 149 98 41 85
Be selective – not needed on all roads 33% 35% 45% 27% 34%
Would make no difference, not necessary, unreasonable 31% 33% 27% 24% 32%
Pollution / emissions – would make it worse 28% 26% 33% 46% 29%
Congestion – would make it worse 27% 31% 21% 39% 33%
It's too slow / it's hard to drive at 20mph 27% 27% 34% 29% 25%
Increasing journey times, can’t get around quickly 21% 21% 21% 24% 24%
Concerns about enforcement / policing 17% 21% 13% 20% 18%
No evidence of reduction in number of accidents 14% 12% 13% 22% 20%
Be selective – not needed at all times 14% 9% 16% 17% 20%
It creates frustration / anger / stress 12% 13% 13% 7% 11%
21
It is just a way for WCC to generate revenue 9% 12% 10% 7% 6%
Concerns about bike lanes and cyclists – implement cycling restrictions, regulate cyclists, enforce speed limits
8% 9% 3% 15% 9%
Less attentive drivers – drivers not alert at 20mph, watching speedometer
7% 5% 9% 17% 4%
Cost of implementation 3% 3% 1% 2% 5%
Negative impact on businesses / high street / shops 2% 2% 1% 0 2%
Other answers 14% 13% 11% 17% 14%
Not stated 5% 4% 2% 2% 5%
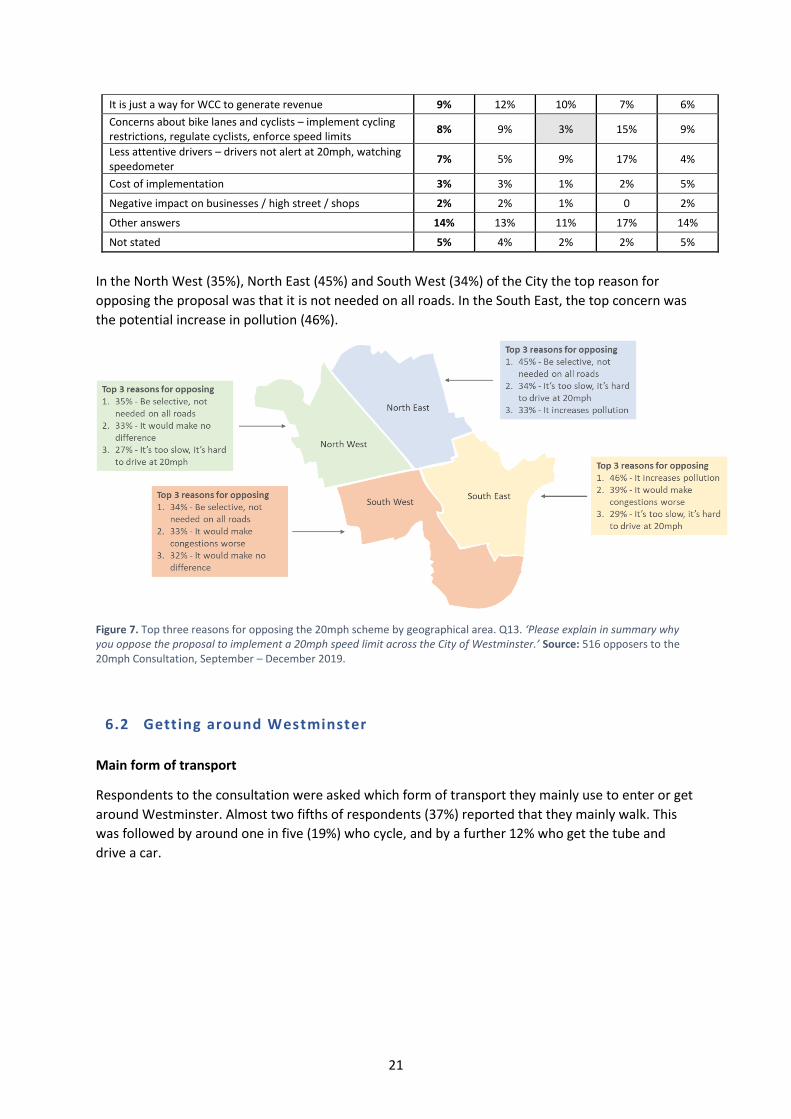
In the North West (35%), North East (45%) and South West (34%) of the City the top reason for
opposing the proposal was that it is not needed on all roads. In the South East, the top concern was
the potential increase in pollution (46%).
Figure 7. Top three reasons for opposing the 20mph scheme by geographical area. Q13. ‘Please explain in summary why you oppose the proposal to implement a 20mph speed limit across the City of Westminster.’ Source: 516 opposers to the 20mph Consultation, September – December 2019.
6.2 Getting around Westminster
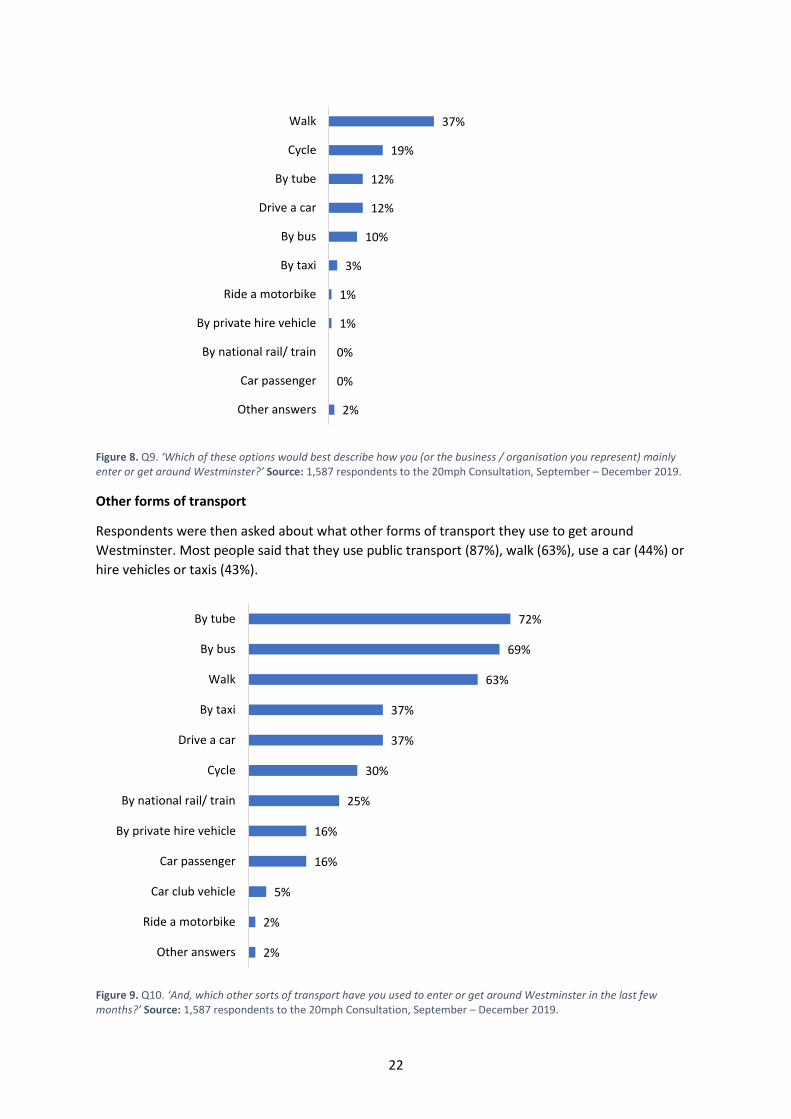
Main form of transport
Respondents to the consultation were asked which form of transport they mainly use to enter or get
around Westminster. Almost two fifths of respondents (37%) reported that they mainly walk. This
was followed by around one in five (19%) who cycle, and by a further 12% who get the tube and
drive a car.
22
Figure 8. Q9. ‘Which of these options would best describe how you (or the business / organisation you represent) mainly enter or get around Westminster?’ Source: 1,587 respondents to the 20mph Consultation, September – December 2019.
Other forms of transport
Respondents were then asked about what other forms of transport they use to get around
Westminster. Most people said that they use public transport (87%), walk (63%), use a car (44%) or
hire vehicles or taxis (43%).
Figure 9. Q10. ‘And, which other sorts of transport have you used to enter or get around Westminster in the last few months?’ Source: 1,587 respondents to the 20mph Consultation, September – December 2019.
37%
19%
12%
12%
10%
3%
1%
1%
0%
0%
2%
Walk
Cycle
By tube
Drive a car
By bus
By taxi
Ride a motorbike
By private hire vehicle
By national rail/ train
Car passenger
Other answers
72%
69%
63%
37%
37%
30%
25%
16%
16%
5%
2%
2%
By tube
By bus
Walk
By taxi
Drive a car
Cycle
By national rail/ train
By private hire vehicle
Car passenger
Car club vehicle
Ride a motorbike
Other answers
23
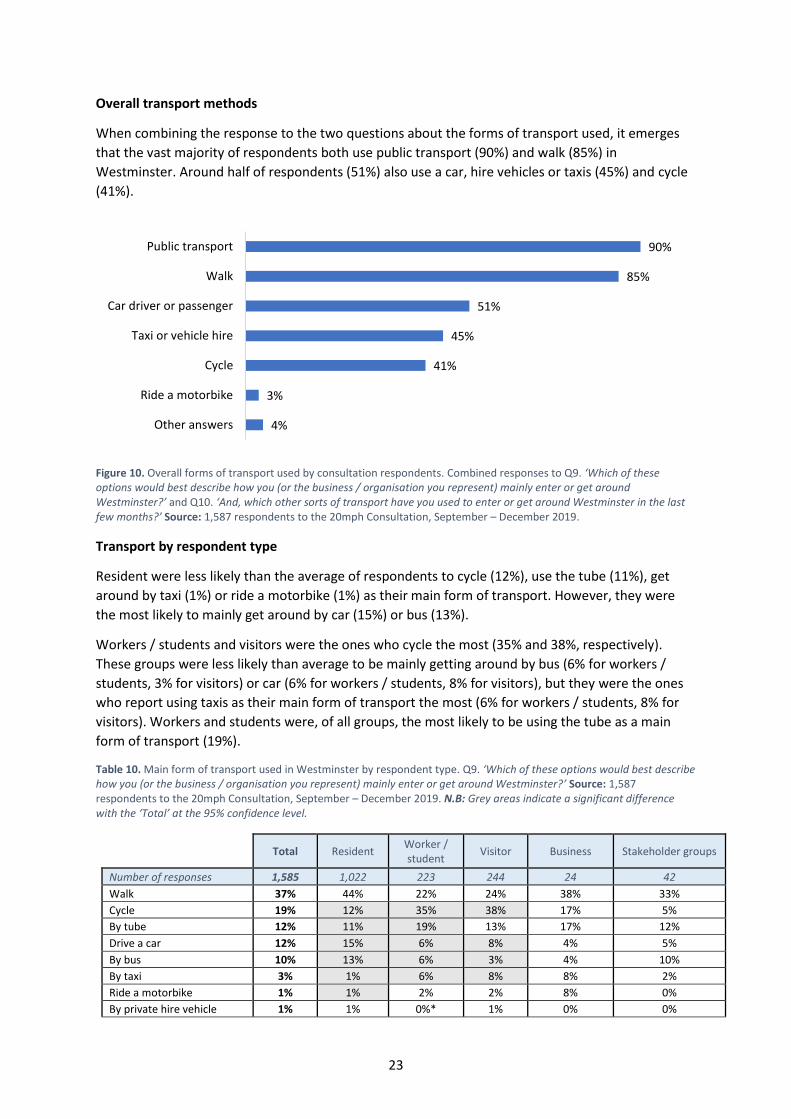
Overall transport methods
When combining the response to the two questions about the forms of transport used, it emerges
that the vast majority of respondents both use public transport (90%) and walk (85%) in
Westminster. Around half of respondents (51%) also use a car, hire vehicles or taxis (45%) and cycle
(41%).
Figure 10. Overall forms of transport used by consultation respondents. Combined responses to Q9. ‘Which of these options would best describe how you (or the business / organisation you represent) mainly enter or get around Westminster?’ and Q10. ‘And, which other sorts of transport have you used to enter or get around Westminster in the last few months?’ Source: 1,587 respondents to the 20mph Consultation, September – December 2019.
Transport by respondent type
Resident were less likely than the average of respondents to cycle (12%), use the tube (11%), get
around by taxi (1%) or ride a motorbike (1%) as their main form of transport. However, they were
the most likely to mainly get around by car (15%) or bus (13%).
Workers / students and visitors were the ones who cycle the most (35% and 38%, respectively).
These groups were less likely than average to be mainly getting around by bus (6% for workers /
students, 3% for visitors) or car (6% for workers / students, 8% for visitors), but they were the ones
who report using taxis as their main form of transport the most (6% for workers / students, 8% for
visitors). Workers and students were, of all groups, the most likely to be using the tube as a main
form of transport (19%).
Table 10. Main form of transport used in Westminster by respondent type. Q9. ‘Which of these options would best describe how you (or the business / organisation you represent) mainly enter or get around Westminster?’ Source: 1,587 respondents to the 20mph Consultation, September – December 2019. N.B: Grey areas indicate a significant difference with the ‘Total’ at the 95% confidence level.
Total Resident Worker / student
Visitor Business Stakeholder groups
Number of responses 1,585 1,022 223 244 24 42
Walk 37% 44% 22% 24% 38% 33%
Cycle 19% 12% 35% 38% 17% 5%
By tube 12% 11% 19% 13% 17% 12%
Drive a car 12% 15% 6% 8% 4% 5%
By bus 10% 13% 6% 3% 4% 10%
By taxi 3% 1% 6% 8% 8% 2%
Ride a motorbike 1% 1% 2% 2% 8% 0%
By private hire vehicle 1% 1% 0%* 1% 0% 0%
90%
85%
51%
45%
41%
3%
4%
Public transport
Walk
Car driver or passenger
Taxi or vehicle hire
Cycle
Ride a motorbike
Other answers
24
By national rail/ train 0%* 0% 1% 2% 0% 2%
Car passenger 0%* 0%* 0% 0% 0% 2%
Other answers 2% 2% 3% 1% 0% 14%
Not stated 1% 0%* 0% 0% 4% 14%
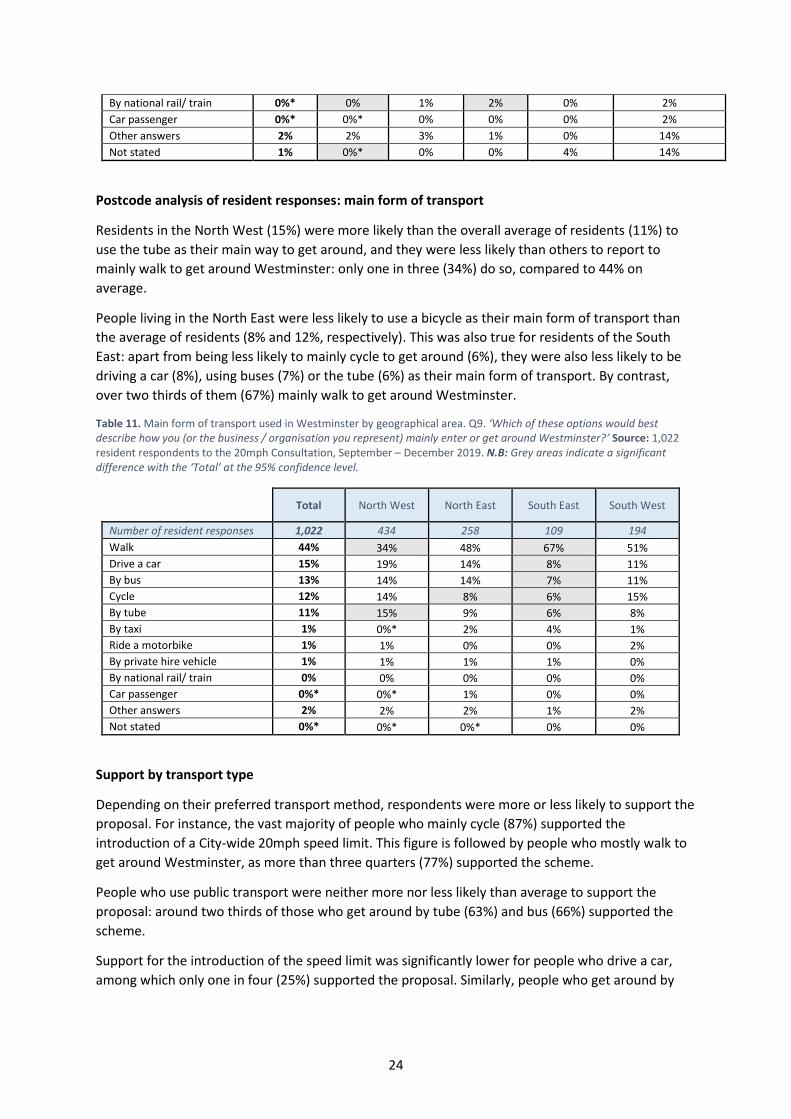
Postcode analysis of resident responses: main form of transport
Residents in the North West (15%) were more likely than the overall average of residents (11%) to
use the tube as their main way to get around, and they were less likely than others to report to
mainly walk to get around Westminster: only one in three (34%) do so, compared to 44% on
average.
People living in the North East were less likely to use a bicycle as their main form of transport than
the average of residents (8% and 12%, respectively). This was also true for residents of the South
East: apart from being less likely to mainly cycle to get around (6%), they were also less likely to be
driving a car (8%), using buses (7%) or the tube (6%) as their main form of transport. By contrast,
over two thirds of them (67%) mainly walk to get around Westminster.
Table 11. Main form of transport used in Westminster by geographical area. Q9. ‘Which of these options would best describe how you (or the business / organisation you represent) mainly enter or get around Westminster?’ Source: 1,022 resident respondents to the 20mph Consultation, September – December 2019. N.B: Grey areas indicate a significant difference with the ‘Total’ at the 95% confidence level.
Total North West North East South East South West
Number of resident responses 1,022 434 258 109 194
Walk 44% 34% 48% 67% 51%
Drive a car 15% 19% 14% 8% 11%
By bus 13% 14% 14% 7% 11%
Cycle 12% 14% 8% 6% 15%
By tube 11% 15% 9% 6% 8%
By taxi 1% 0%* 2% 4% 1%
Ride a motorbike 1% 1% 0% 0% 2%
By private hire vehicle 1% 1% 1% 1% 0%
By national rail/ train 0% 0% 0% 0% 0%
Car passenger 0%* 0%* 1% 0% 0%
Other answers 2% 2% 2% 1% 2%
Not stated 0%* 0%* 0%* 0% 0%
Support by transport type
Depending on their preferred transport method, respondents were more or less likely to support the
proposal. For instance, the vast majority of people who mainly cycle (87%) supported the
introduction of a City-wide 20mph speed limit. This figure is followed by people who mostly walk to
get around Westminster, as more than three quarters (77%) supported the scheme.
People who use public transport were neither more nor less likely than average to support the
proposal: around two thirds of those who get around by tube (63%) and bus (66%) supported the
scheme.
Support for the introduction of the speed limit was significantly lower for people who drive a car,
among which only one in four (25%) supported the proposal. Similarly, people who get around by
25
taxi (either as drivers or passengers) were the least likely to support the proposed speed limit, with
only 14% in favour of the scheme.
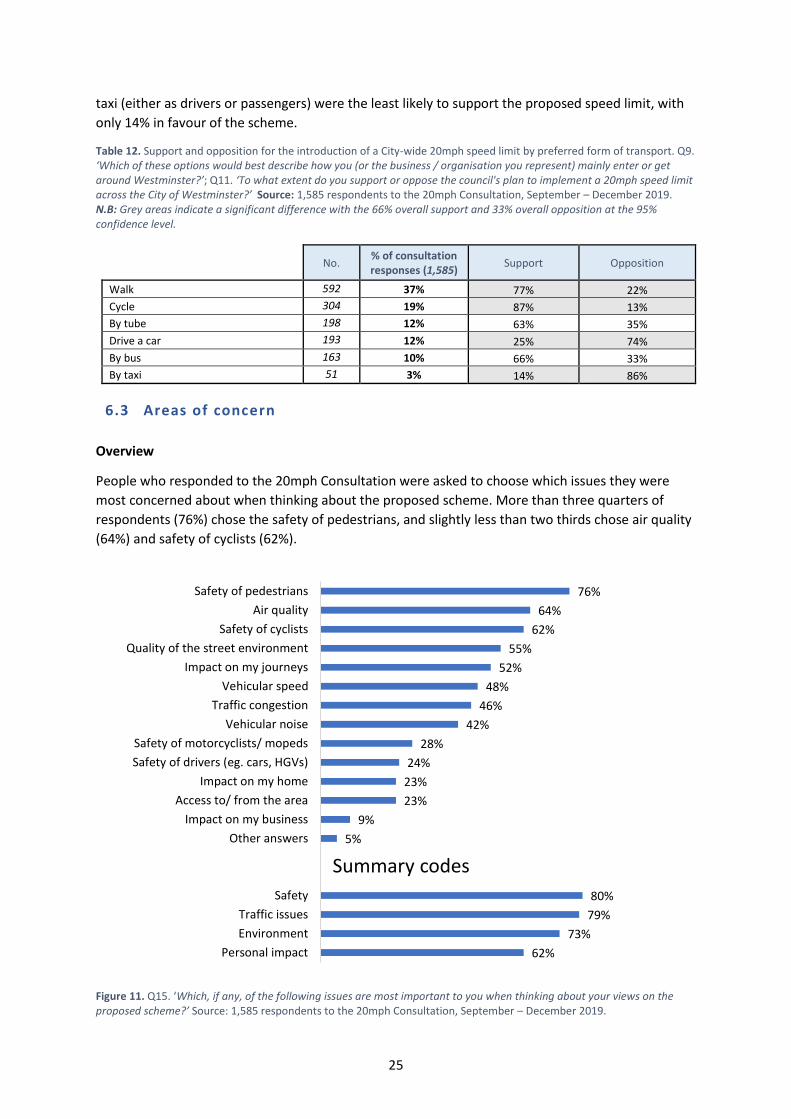
Table 12. Support and opposition for the introduction of a City-wide 20mph speed limit by preferred form of transport. Q9. ‘Which of these options would best describe how you (or the business / organisation you represent) mainly enter or get around Westminster?’; Q11. ‘To what extent do you support or oppose the council's plan to implement a 20mph speed limit across the City of Westminster?’ Source: 1,585 respondents to the 20mph Consultation, September – December 2019. N.B: Grey areas indicate a significant difference with the 66% overall support and 33% overall opposition at the 95% confidence level.
No. % of consultation responses (1,585)
Support Opposition
Walk 592 37% 77% 22%
Cycle 304 19% 87% 13%
By tube 198 12% 63% 35%
Drive a car 193 12% 25% 74%
By bus 163 10% 66% 33%
By taxi 51 3% 14% 86%
6.3 Areas of concern
Overview
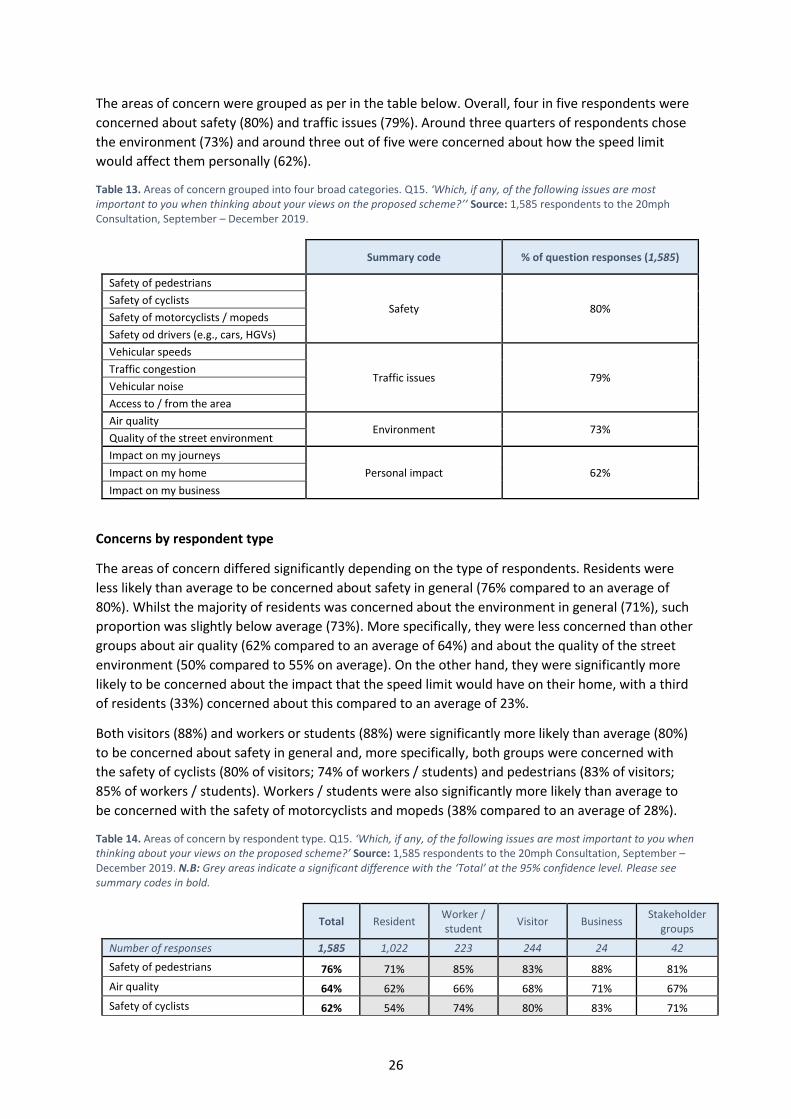
People who responded to the 20mph Consultation were asked to choose which issues they were
most concerned about when thinking about the proposed scheme. More than three quarters of
respondents (76%) chose the safety of pedestrians, and slightly less than two thirds chose air quality
(64%) and safety of cyclists (62%).
Figure 11. Q15. ‘Which, if any, of the following issues are most important to you when thinking about your views on the proposed scheme?’ Source: 1,585 respondents to the 20mph Consultation, September – December 2019.
76%
64%
62%
55%
52%
48%
46%
42%
28%
24%
23%
23%
9%
5%
80%
79%
73%
62%
Safety of pedestrians
Air quality
Safety of cyclists
Quality of the street environment
Impact on my journeys
Vehicular speed
Traffic congestion
Vehicular noise
Safety of motorcyclists/ mopeds
Safety of drivers (eg. cars, HGVs)
Impact on my home
Access to/ from the area
Impact on my business
Other answers
Safety
Traffic issues
Environment
Personal impact
Summary codes
26
The areas of concern were grouped as per in the table below. Overall, four in five respondents were
concerned about safety (80%) and traffic issues (79%). Around three quarters of respondents chose
the environment (73%) and around three out of five were concerned about how the speed limit
would affect them personally (62%).
Table 13. Areas of concern grouped into four broad categories. Q15. ‘Which, if any, of the following issues are most important to you when thinking about your views on the proposed scheme?’’ Source: 1,585 respondents to the 20mph Consultation, September – December 2019.
Summary code % of question responses (1,585)
Safety of pedestrians
Safety 80% Safety of cyclists
Safety of motorcyclists / mopeds
Safety od drivers (e.g., cars, HGVs)
Vehicular speeds
Traffic issues 79% Traffic congestion
Vehicular noise
Access to / from the area
Air quality Environment 73%
Quality of the street environment
Impact on my journeys
Personal impact 62% Impact on my home
Impact on my business
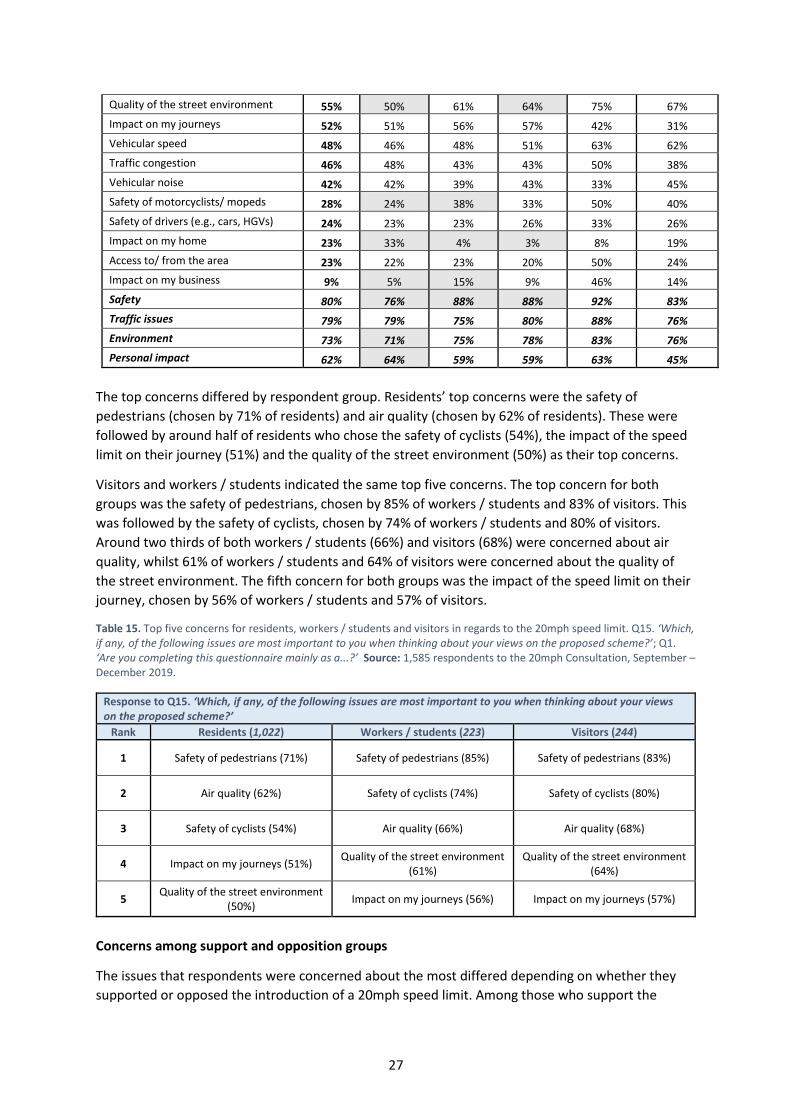
Concerns by respondent type
The areas of concern differed significantly depending on the type of respondents. Residents were
less likely than average to be concerned about safety in general (76% compared to an average of
80%). Whilst the majority of residents was concerned about the environment in general (71%), such
proportion was slightly below average (73%). More specifically, they were less concerned than other
groups about air quality (62% compared to an average of 64%) and about the quality of the street
environment (50% compared to 55% on average). On the other hand, they were significantly more
likely to be concerned about the impact that the speed limit would have on their home, with a third
of residents (33%) concerned about this compared to an average of 23%.
Both visitors (88%) and workers or students (88%) were significantly more likely than average (80%)
to be concerned about safety in general and, more specifically, both groups were concerned with
the safety of cyclists (80% of visitors; 74% of workers / students) and pedestrians (83% of visitors;
85% of workers / students). Workers / students were also significantly more likely than average to
be concerned with the safety of motorcyclists and mopeds (38% compared to an average of 28%).
Table 14. Areas of concern by respondent type. Q15. ‘Which, if any, of the following issues are most important to you when thinking about your views on the proposed scheme?’ Source: 1,585 respondents to the 20mph Consultation, September – December 2019. N.B: Grey areas indicate a significant difference with the ‘Total’ at the 95% confidence level. Please see summary codes in bold.
Total Resident
Worker / student
Visitor Business Stakeholder
groups
Number of responses 1,585 1,022 223 244 24 42
Safety of pedestrians 76% 71% 85% 83% 88% 81%
Air quality 64% 62% 66% 68% 71% 67%
Safety of cyclists 62% 54% 74% 80% 83% 71%
27
Quality of the street environment 55% 50% 61% 64% 75% 67%
Impact on my journeys 52% 51% 56% 57% 42% 31%
Vehicular speed 48% 46% 48% 51% 63% 62%
Traffic congestion 46% 48% 43% 43% 50% 38%
Vehicular noise 42% 42% 39% 43% 33% 45%
Safety of motorcyclists/ mopeds 28% 24% 38% 33% 50% 40%
Safety of drivers (e.g., cars, HGVs) 24% 23% 23% 26% 33% 26%
Impact on my home 23% 33% 4% 3% 8% 19%
Access to/ from the area 23% 22% 23% 20% 50% 24%
Impact on my business 9% 5% 15% 9% 46% 14%
Safety 80% 76% 88% 88% 92% 83%
Traffic issues 79% 79% 75% 80% 88% 76%
Environment 73% 71% 75% 78% 83% 76%
Personal impact 62% 64% 59% 59% 63% 45%
The top concerns differed by respondent group. Residents’ top concerns were the safety of
pedestrians (chosen by 71% of residents) and air quality (chosen by 62% of residents). These were
followed by around half of residents who chose the safety of cyclists (54%), the impact of the speed
limit on their journey (51%) and the quality of the street environment (50%) as their top concerns.
Visitors and workers / students indicated the same top five concerns. The top concern for both
groups was the safety of pedestrians, chosen by 85% of workers / students and 83% of visitors. This
was followed by the safety of cyclists, chosen by 74% of workers / students and 80% of visitors.
Around two thirds of both workers / students (66%) and visitors (68%) were concerned about air
quality, whilst 61% of workers / students and 64% of visitors were concerned about the quality of
the street environment. The fifth concern for both groups was the impact of the speed limit on their
journey, chosen by 56% of workers / students and 57% of visitors.
Table 15. Top five concerns for residents, workers / students and visitors in regards to the 20mph speed limit. Q15. ‘Which, if any, of the following issues are most important to you when thinking about your views on the proposed scheme?’; Q1. ‘Are you completing this questionnaire mainly as a...?’ Source: 1,585 respondents to the 20mph Consultation, September – December 2019.
Response to Q15. ‘Which, if any, of the following issues are most important to you when thinking about your views on the proposed scheme?’
Rank Residents (1,022) Workers / students (223) Visitors (244)
1 Safety of pedestrians (71%) Safety of pedestrians (85%) Safety of pedestrians (83%)
2 Air quality (62%) Safety of cyclists (74%) Safety of cyclists (80%)
3 Safety of cyclists (54%) Air quality (66%) Air quality (68%)
4 Impact on my journeys (51%) Quality of the street environment
(61%) Quality of the street environment
(64%)
5 Quality of the street environment
(50%) Impact on my journeys (56%) Impact on my journeys (57%)
Concerns among support and opposition groups
The issues that respondents were concerned about the most differed depending on whether they
supported or opposed the introduction of a 20mph speed limit. Among those who support the
28
scheme, the two top priorities were the safety of pedestrians and cyclists, chosen by 95% and 79% of
supporters, respectively. These were followed by concerns about the environment, with air quality
(74%) and quality of the street environment (69%) chosen by just less than three quarters of
supporters. The fifth concern was vehicular speed, chosen by just over half (54%) of supporters.
People who oppose the scheme were more likely to be concerned about traffic issues, with around
three in four choosing the impact of the speed limit on their journeys (76%) and congestions (74%).
Their third concern, as with supporters, was air quality (44%), and the fourth was access to and from
the area (40%) – another traffic concern. In fifth position there was the concern about the safety of
pedestrians, chosen by around one third of those who oppose the proposal (36%).
Table 16. Top five areas of concern by support and opposition groups. Q15. ‘Which, if any, of the following issues are most important to you when thinking about your views on the proposed scheme?’; Q11. ‘To what extent do you support or oppose the council's plan to implement a 20mph speed limit across the City of Westminster?’. Source: 1,585 respondents to the 20mph Consultation, September – December 2019.
Response to Q11. ‘To what extent do you support or oppose the council's plan to implement a 20mph speed limit across the City of Westminster?’
Rank Support (1,046) Oppose (516)
1 Safety of pedestrians (95%) Impact on my journey (76%)
2 Safety of cyclists (79%) Traffic congestion (74%)
3 Air quality (74%) Air quality (44%)
4 Quality of street environment (69%) Access to / from the area (40%)
5 Vehicular speed (54%) Safety of pedestrians (36%)
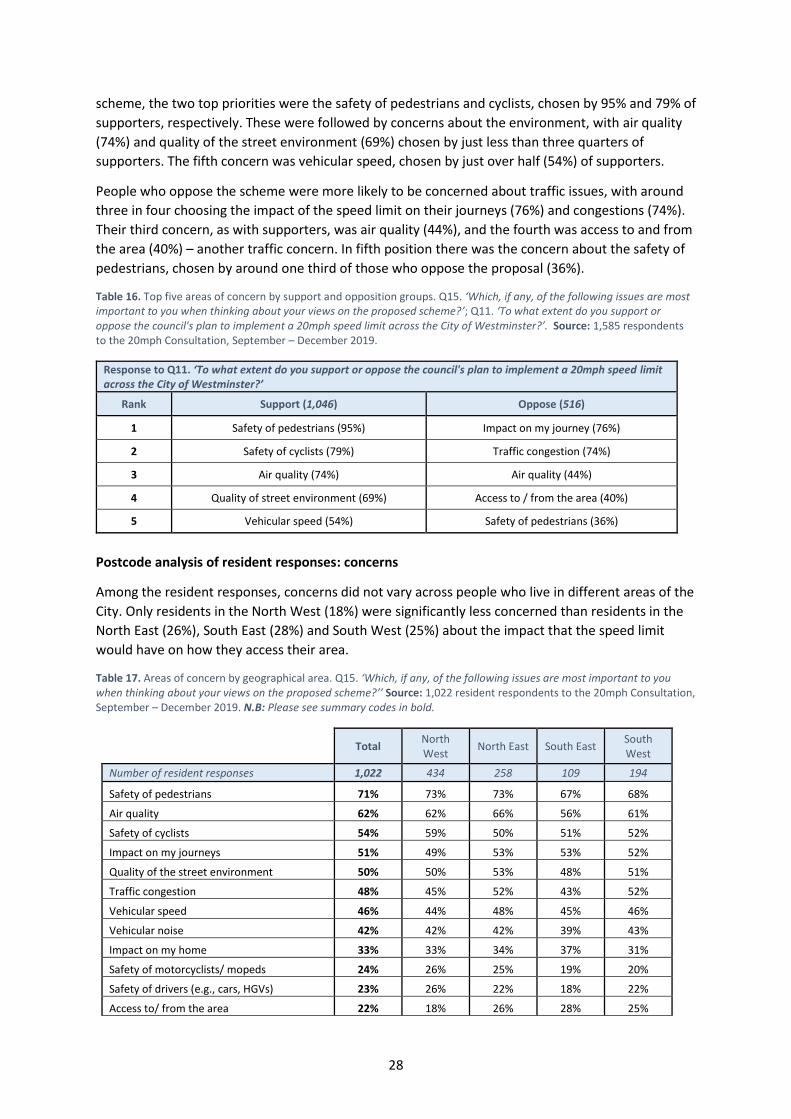
Postcode analysis of resident responses: concerns
Among the resident responses, concerns did not vary across people who live in different areas of the
City. Only residents in the North West (18%) were significantly less concerned than residents in the
North East (26%), South East (28%) and South West (25%) about the impact that the speed limit
would have on how they access their area.
Table 17. Areas of concern by geographical area. Q15. ‘Which, if any, of the following issues are most important to you when thinking about your views on the proposed scheme?’’ Source: 1,022 resident respondents to the 20mph Consultation, September – December 2019. N.B: Please see summary codes in bold.
Total
North West
North East South East South West
Number of resident responses 1,022 434 258 109 194
Safety of pedestrians 71% 73% 73% 67% 68%
Air quality 62% 62% 66% 56% 61%
Safety of cyclists 54% 59% 50% 51% 52%
Impact on my journeys 51% 49% 53% 53% 52%
Quality of the street environment 50% 50% 53% 48% 51%
Traffic congestion 48% 45% 52% 43% 52%
Vehicular speed 46% 44% 48% 45% 46%
Vehicular noise 42% 42% 42% 39% 43%
Impact on my home 33% 33% 34% 37% 31%
Safety of motorcyclists/ mopeds 24% 26% 25% 19% 20%
Safety of drivers (e.g., cars, HGVs) 23% 26% 22% 18% 22%
Access to/ from the area 22% 18% 26% 28% 25%
29
Impact on my business 5% 4% 7% 7% 4%
Traffic issues 79% 78% 81% 78% 81%
Safety 76% 78% 76% 72% 75%
Environment 71% 72% 73% 66% 71%
Personal impact 64% 62% 66% 66% 65%
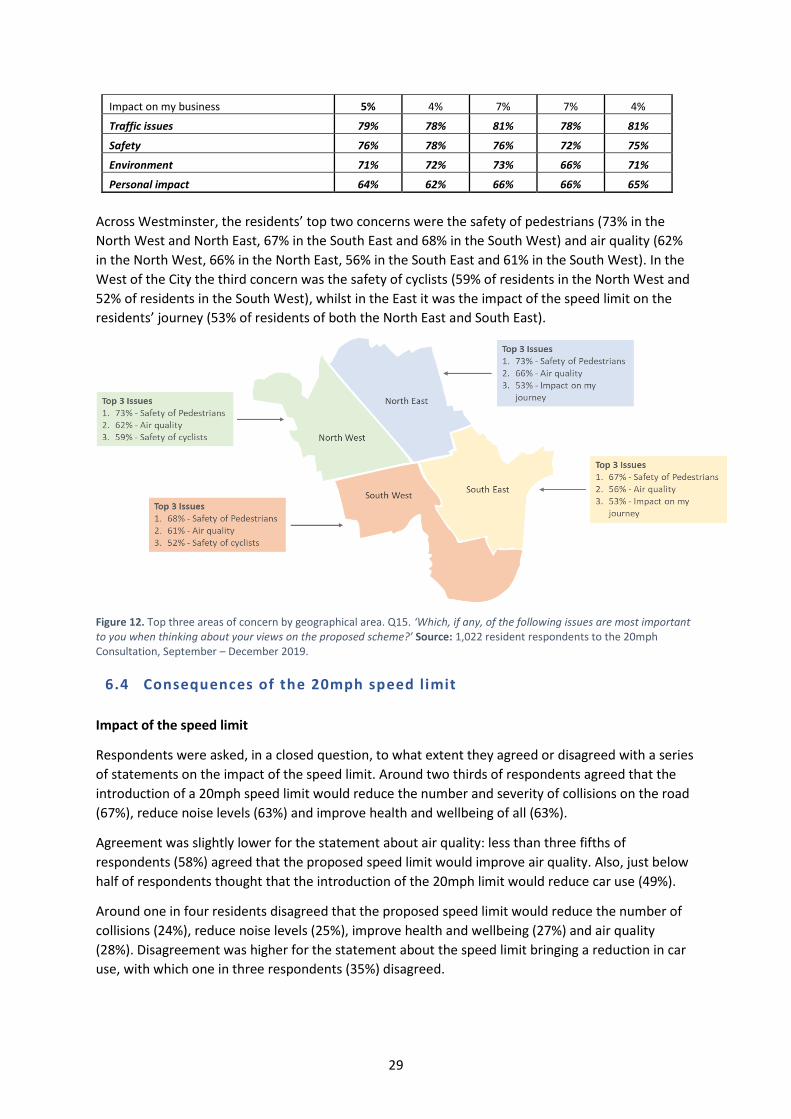
Across Westminster, the residents’ top two concerns were the safety of pedestrians (73% in the
North West and North East, 67% in the South East and 68% in the South West) and air quality (62%
in the North West, 66% in the North East, 56% in the South East and 61% in the South West). In the
West of the City the third concern was the safety of cyclists (59% of residents in the North West and
52% of residents in the South West), whilst in the East it was the impact of the speed limit on the
residents’ journey (53% of residents of both the North East and South East).
Figure 12. Top three areas of concern by geographical area. Q15. ‘Which, if any, of the following issues are most important to you when thinking about your views on the proposed scheme?’ Source: 1,022 resident respondents to the 20mph Consultation, September – December 2019.
6.4 Consequences of the 20mph speed limit
Impact of the speed limit
Respondents were asked, in a closed question, to what extent they agreed or disagreed with a series
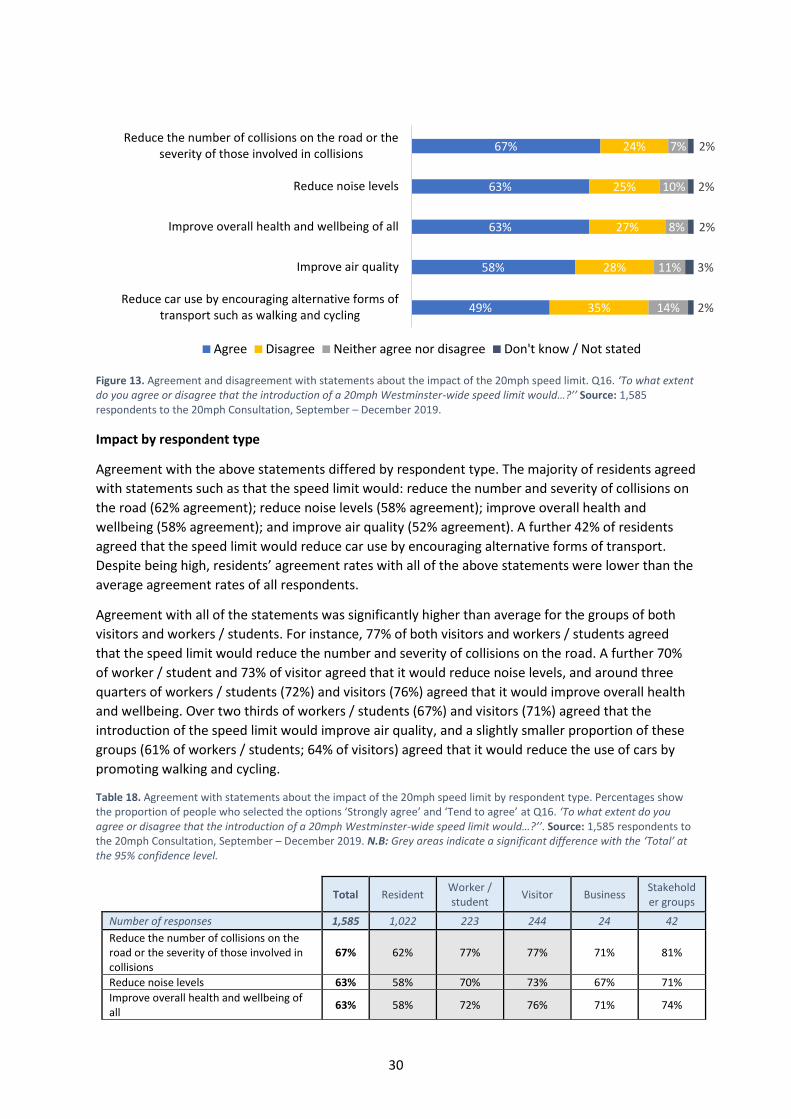
of statements on the impact of the speed limit. Around two thirds of respondents agreed that the
introduction of a 20mph speed limit would reduce the number and severity of collisions on the road
(67%), reduce noise levels (63%) and improve health and wellbeing of all (63%).
Agreement was slightly lower for the statement about air quality: less than three fifths of
respondents (58%) agreed that the proposed speed limit would improve air quality. Also, just below
half of respondents thought that the introduction of the 20mph limit would reduce car use (49%).
Around one in four residents disagreed that the proposed speed limit would reduce the number of
collisions (24%), reduce noise levels (25%), improve health and wellbeing (27%) and air quality
(28%). Disagreement was higher for the statement about the speed limit bringing a reduction in car
use, with which one in three respondents (35%) disagreed.
30
Figure 13. Agreement and disagreement with statements about the impact of the 20mph speed limit. Q16. ‘To what extent do you agree or disagree that the introduction of a 20mph Westminster-wide speed limit would…?’’ Source: 1,585 respondents to the 20mph Consultation, September – December 2019.
Impact by respondent type
Agreement with the above statements differed by respondent type. The majority of residents agreed
with statements such as that the speed limit would: reduce the number and severity of collisions on
the road (62% agreement); reduce noise levels (58% agreement); improve overall health and
wellbeing (58% agreement); and improve air quality (52% agreement). A further 42% of residents
agreed that the speed limit would reduce car use by encouraging alternative forms of transport.
Despite being high, residents’ agreement rates with all of the above statements were lower than the
average agreement rates of all respondents.
Agreement with all of the statements was significantly higher than average for the groups of both
visitors and workers / students. For instance, 77% of both visitors and workers / students agreed
that the speed limit would reduce the number and severity of collisions on the road. A further 70%
of worker / student and 73% of visitor agreed that it would reduce noise levels, and around three
quarters of workers / students (72%) and visitors (76%) agreed that it would improve overall health
and wellbeing. Over two thirds of workers / students (67%) and visitors (71%) agreed that the
introduction of the speed limit would improve air quality, and a slightly smaller proportion of these
groups (61% of workers / students; 64% of visitors) agreed that it would reduce the use of cars by
promoting walking and cycling.
Table 18. Agreement with statements about the impact of the 20mph speed limit by respondent type. Percentages show the proportion of people who selected the options ‘Strongly agree’ and ‘Tend to agree’ at Q16. ‘To what extent do you agree or disagree that the introduction of a 20mph Westminster-wide speed limit would…?’’. Source: 1,585 respondents to the 20mph Consultation, September – December 2019. N.B: Grey areas indicate a significant difference with the ‘Total’ at the 95% confidence level.
Total Resident
Worker / student
Visitor Business Stakeholder groups
Number of responses 1,585 1,022 223 244 24 42
Reduce the number of collisions on the road or the severity of those involved in collisions
67% 62% 77% 77% 71% 81%
Reduce noise levels 63% 58% 70% 73% 67% 71%
Improve overall health and wellbeing of all
63% 58% 72% 76% 71% 74%
67%
63%
63%
58%
49%
24%
25%
27%
28%
35%
7%
10%
8%
11%
14%
2%
2%
2%
3%
2%
Reduce the number of collisions on the road or theseverity of those involved in collisions
Reduce noise levels
Improve overall health and wellbeing of all
Improve air quality
Reduce car use by encouraging alternative forms oftransport such as walking and cycling
Agree Disagree Neither agree nor disagree Don't know / Not stated
31
Improve air quality 58% 52% 67% 71% 58% 64%
Reduce car use by encouraging alternative forms of transport such as walking and cycling
49% 42% 61% 64% 54% 67%
Postcode analysis of resident responses: impact of the speed limit
Agreement with the statements about the impact of the speed limit did not differ across residents.
The only significant differences were between residents in the North West and the South West: in
the North West, residents were significantly more likely to agree that the introduction of a 20mph
speed limit would improve overall health and wellbeing of all (62%) and air quality (57%) compared
to residents in the South West (52% and 45% agreement, respectively).
Table 19. Agreement with statements about the impact of the 20mph speed limit by geographical area. Percentages show the proportion of residents who selected the options ‘Strongly agree’ and ‘Tend to agree’ at Q16. ‘To what extent do you agree or disagree that the introduction of a 20mph Westminster-wide speed limit would…?’’. Source: 1,022 resident respondents to the 20mph Consultation, September – December 2019.
Total North West North East South East
South West
Number of resident responses 1,022 434 258 109 194
Reduce the number of collisions on the road or the severity of those involved in collisions
62% 66% 60% 62% 59%
Reduce noise levels 58% 62% 56% 54% 56%
Improve overall health and wellbeing of all 58% 62% 57% 58% 52%
Improve air quality 52% 57% 52% 50% 45%
Reduce car use by encouraging alternative forms of transport such as walking and cycling
42% 44% 42% 40% 39%
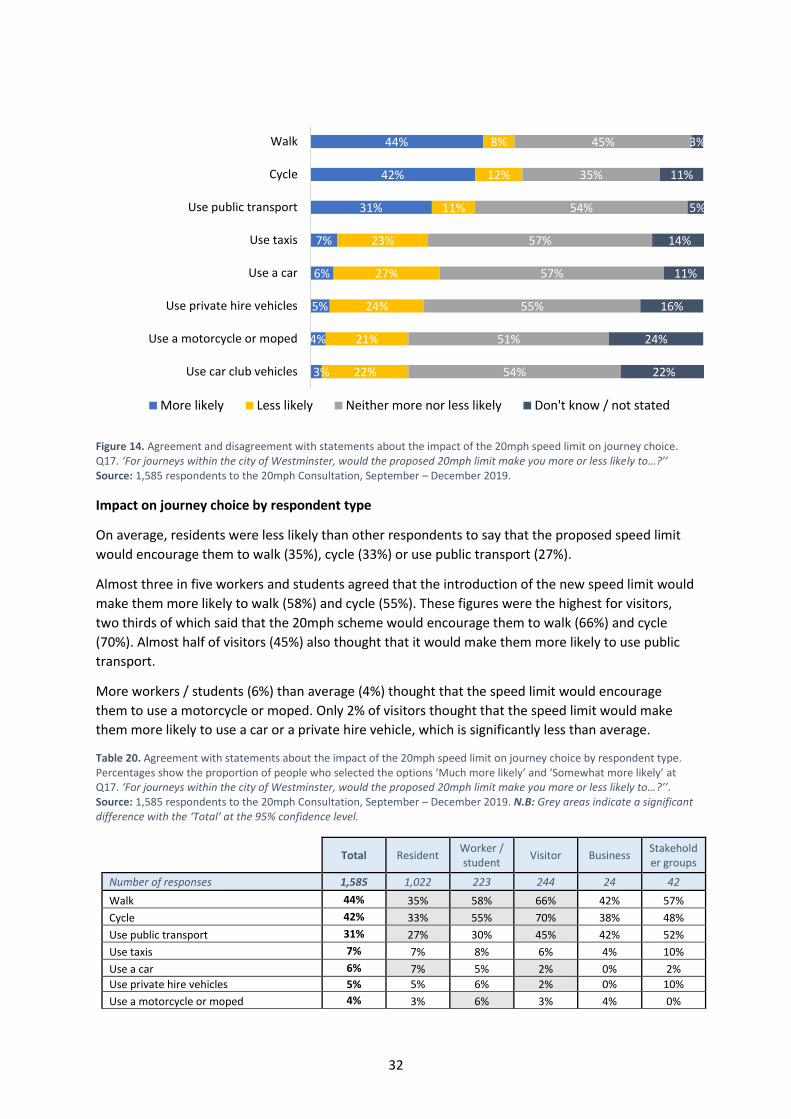
Impact of the speed limit on journey choice
Respondents were asked how the introduction of a City-wide 20mph speed limit would impact their
journey choices. According to over two fifths of respondents, the introduction of the proposed
speed limit would make them more likely to walk (44%) and cycle (42%). A further third of
respondents (31%) thought that the speed limit would make them more likely to use public
transport.
Around one in four respondents think that the proposed 20mph speed limit would make them less
likely to use taxis (23%), a car (27%), private hire vehicles (24%), motorcycles or mopeds (21%) or car
club vehicles (22%).
32
Figure 14. Agreement and disagreement with statements about the impact of the 20mph speed limit on journey choice. Q17. ‘For journeys within the city of Westminster, would the proposed 20mph limit make you more or less likely to…?’’ Source: 1,585 respondents to the 20mph Consultation, September – December 2019.
Impact on journey choice by respondent type
On average, residents were less likely than other respondents to say that the proposed speed limit
would encourage them to walk (35%), cycle (33%) or use public transport (27%).
Almost three in five workers and students agreed that the introduction of the new speed limit would
make them more likely to walk (58%) and cycle (55%). These figures were the highest for visitors,
two thirds of which said that the 20mph scheme would encourage them to walk (66%) and cycle
(70%). Almost half of visitors (45%) also thought that it would make them more likely to use public
transport.
More workers / students (6%) than average (4%) thought that the speed limit would encourage
them to use a motorcycle or moped. Only 2% of visitors thought that the speed limit would make
them more likely to use a car or a private hire vehicle, which is significantly less than average.
Table 20. Agreement with statements about the impact of the 20mph speed limit on journey choice by respondent type. Percentages show the proportion of people who selected the options ‘Much more likely’ and ‘Somewhat more likely’ at Q17. ‘For journeys within the city of Westminster, would the proposed 20mph limit make you more or less likely to…?’’. Source: 1,585 respondents to the 20mph Consultation, September – December 2019. N.B: Grey areas indicate a significant difference with the ‘Total’ at the 95% confidence level.
Total Resident
Worker / student
Visitor Business Stakeholder groups
Number of responses 1,585 1,022 223 244 24 42
Walk 44% 35% 58% 66% 42% 57%
Cycle 42% 33% 55% 70% 38% 48%
Use public transport 31% 27% 30% 45% 42% 52%
Use taxis 7% 7% 8% 6% 4% 10%
Use a car 6% 7% 5% 2% 0% 2%
Use private hire vehicles 5% 5% 6% 2% 0% 10%
Use a motorcycle or moped 4% 3% 6% 3% 4% 0%
44%
42%
31%
7%
6%
5%
4%
3%
8%
12%
11%
23%
27%
24%
21%
22%
45%
35%
54%
57%
57%
55%
51%
54%
3%
11%
5%
14%
11%
16%
24%
22%
Walk
Cycle
Use public transport
Use taxis
Use a car
Use private hire vehicles
Use a motorcycle or moped
Use car club vehicles
More likely Less likely Neither more nor less likely Don't know / not stated
33
Use car club vehicles 3% 4% 3% 1% 0% 5%
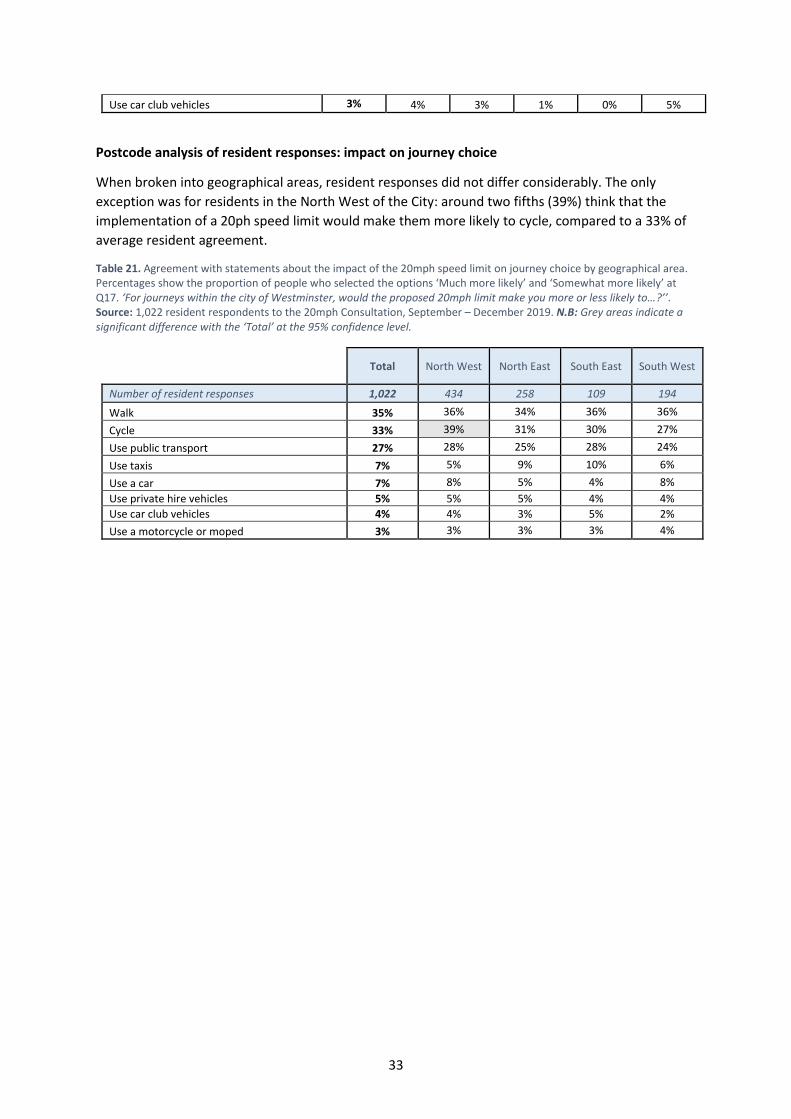
Postcode analysis of resident responses: impact on journey choice
When broken into geographical areas, resident responses did not differ considerably. The only
exception was for residents in the North West of the City: around two fifths (39%) think that the
implementation of a 20ph speed limit would make them more likely to cycle, compared to a 33% of
average resident agreement.
Table 21. Agreement with statements about the impact of the 20mph speed limit on journey choice by geographical area. Percentages show the proportion of people who selected the options ‘Much more likely’ and ‘Somewhat more likely’ at Q17. ‘For journeys within the city of Westminster, would the proposed 20mph limit make you more or less likely to…?’’. Source: 1,022 resident respondents to the 20mph Consultation, September – December 2019. N.B: Grey areas indicate a significant difference with the ‘Total’ at the 95% confidence level.
Total North West North East South East South West
Number of resident responses 1,022 434 258 109 194
Walk 35% 36% 34% 36% 36%
Cycle 33% 39% 31% 30% 27%
Use public transport 27% 28% 25% 28% 24%
Use taxis 7% 5% 9% 10% 6%
Use a car 7% 8% 5% 4% 8%
Use private hire vehicles 5% 5% 5% 4% 4%
Use car club vehicles 4% 4% 3% 5% 2%
Use a motorcycle or moped 3% 3% 3% 3% 4%
34
6.5 Further comments
Overview
Respondents were asked whether they wished to leave further comments to the 20mph
consultation. Around one in three (31%) agreed to leave further comments.
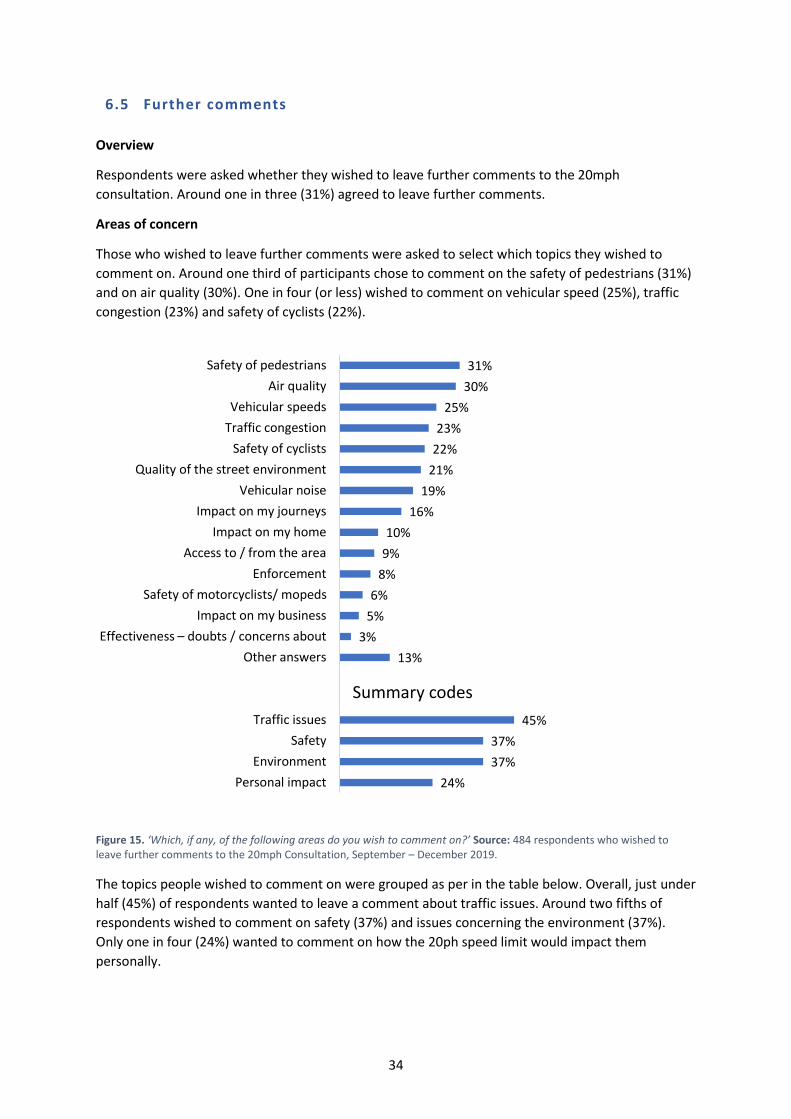
Areas of concern
Those who wished to leave further comments were asked to select which topics they wished to
comment on. Around one third of participants chose to comment on the safety of pedestrians (31%)
and on air quality (30%). One in four (or less) wished to comment on vehicular speed (25%), traffic
congestion (23%) and safety of cyclists (22%).
Figure 15. ‘Which, if any, of the following areas do you wish to comment on?’ Source: 484 respondents who wished to leave further comments to the 20mph Consultation, September – December 2019.
The topics people wished to comment on were grouped as per in the table below. Overall, just under
half (45%) of respondents wanted to leave a comment about traffic issues. Around two fifths of
respondents wished to comment on safety (37%) and issues concerning the environment (37%).
Only one in four (24%) wanted to comment on how the 20ph speed limit would impact them
personally.
31%
30%
25%
23%
22%
21%
19%
16%
10%
9%
8%
6%
5%
3%
13%
45%
37%
37%
24%
Safety of pedestrians
Air quality
Vehicular speeds
Traffic congestion
Safety of cyclists
Quality of the street environment
Vehicular noise
Impact on my journeys
Impact on my home
Access to / from the area
Enforcement
Safety of motorcyclists/ mopeds
Impact on my business
Effectiveness – doubts / concerns about
Other answers
Traffic issues
Safety
Environment
Personal impact
Summary codes
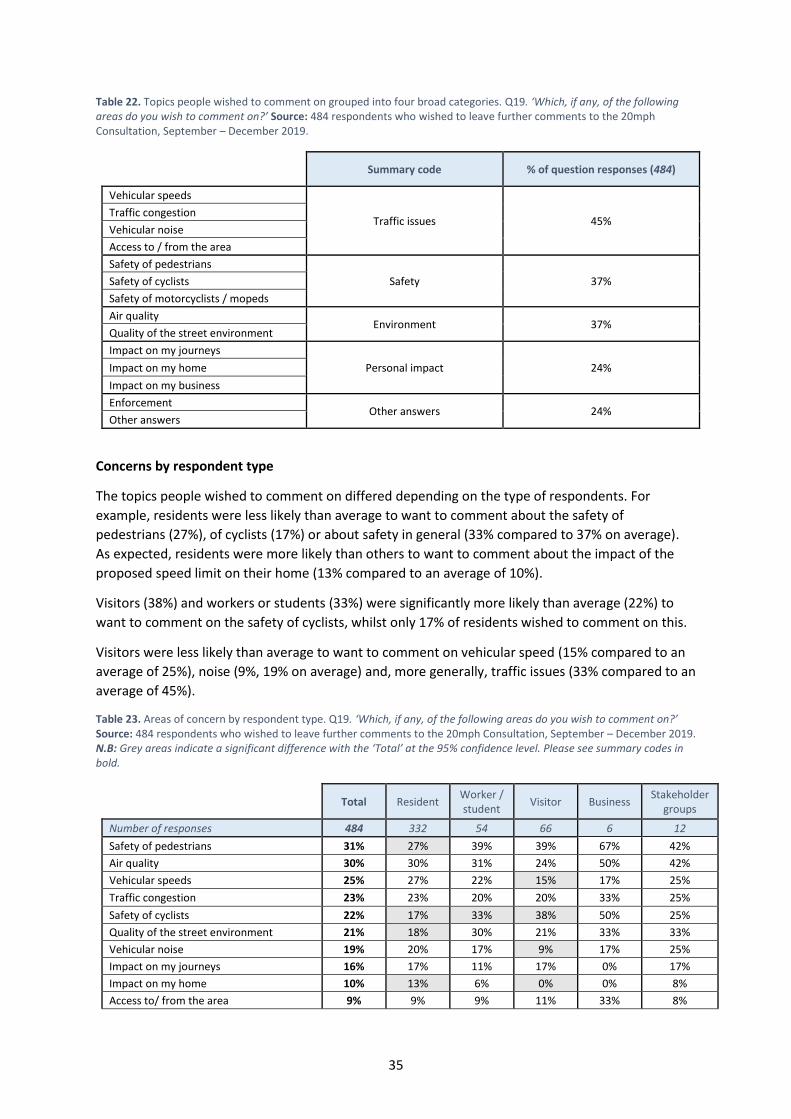
35
Table 22. Topics people wished to comment on grouped into four broad categories. Q19. ‘Which, if any, of the following areas do you wish to comment on?’ Source: 484 respondents who wished to leave further comments to the 20mph Consultation, September – December 2019.
Summary code % of question responses (484)
Vehicular speeds
Traffic issues 45% Traffic congestion
Vehicular noise
Access to / from the area
Safety of pedestrians
Safety 37% Safety of cyclists
Safety of motorcyclists / mopeds
Air quality Environment 37%
Quality of the street environment
Impact on my journeys
Personal impact 24% Impact on my home
Impact on my business
Enforcement Other answers 24%
Other answers
Concerns by respondent type
The topics people wished to comment on differed depending on the type of respondents. For
example, residents were less likely than average to want to comment about the safety of
pedestrians (27%), of cyclists (17%) or about safety in general (33% compared to 37% on average).
As expected, residents were more likely than others to want to comment about the impact of the
proposed speed limit on their home (13% compared to an average of 10%).
Visitors (38%) and workers or students (33%) were significantly more likely than average (22%) to
want to comment on the safety of cyclists, whilst only 17% of residents wished to comment on this.
Visitors were less likely than average to want to comment on vehicular speed (15% compared to an
average of 25%), noise (9%, 19% on average) and, more generally, traffic issues (33% compared to an
average of 45%).
Table 23. Areas of concern by respondent type. Q19. ‘Which, if any, of the following areas do you wish to comment on?’ Source: 484 respondents who wished to leave further comments to the 20mph Consultation, September – December 2019. N.B: Grey areas indicate a significant difference with the ‘Total’ at the 95% confidence level. Please see summary codes in bold.
Total Resident
Worker / student
Visitor Business Stakeholder
groups
Number of responses 484 332 54 66 6 12
Safety of pedestrians 31% 27% 39% 39% 67% 42%
Air quality 30% 30% 31% 24% 50% 42%
Vehicular speeds 25% 27% 22% 15% 17% 25%
Traffic congestion 23% 23% 20% 20% 33% 25%
Safety of cyclists 22% 17% 33% 38% 50% 25%
Quality of the street environment 21% 18% 30% 21% 33% 33%
Vehicular noise 19% 20% 17% 9% 17% 25%
Impact on my journeys 16% 17% 11% 17% 0% 17%
Impact on my home 10% 13% 6% 0% 0% 8%
Access to/ from the area 9% 9% 9% 11% 33% 8%

36
Enforcement 8% 9% 4% 6% 17% 8%
Safety of motorcyclists/ mopeds 6% 6% 9% 6% 0% 0%
Impact on my business 5% 3% 15% 5% 33% 8%
Traffic issues 45% 48% 39% 33% 50% 33%
Environment 37% 37% 37% 38% 50% 42%
Safety 37% 33% 44% 45% 67% 42%
Personal impact 24% 24% 22% 20% 33% 25%
Postcode analysis of resident responses: concerns
The breakdown of the resident responses by geographical areas shows that residents of different
parts of the City wished to comment on different topics.
Residents in the North West were less likely than average to choose to comment on the safety of
pedestrians (24%; 27% on average) or cyclists (13% compared to an average of 17%). Furthermore,
whilst safety was chosen by one third of residents (33%), only 27% of people who live in the North
West of Westminster wanted to comment on safety. In the North West residents were less likely
than the average to want to comment on the impact of the speed limit on their business (1%; 3% on
average) or on the way they access the area (5%; 9% on average).
One in four (26%) residents in the South West, compared to an average of 17% respondents, wanted
to comment on the impact of the speed limit on their journey. A further 18% wanted to comment on
how it will affect access to and from the area, which on average was chosen by only 9% of
respondents.
Table 24. Areas of concern by geographical area. Q15. ‘Which, if any, of the following areas do you wish to comment on?’’ Source: 484 respondents who wished to leave further comments to the 20mph Consultation, September – December 2019. N.B: Grey areas indicate a significant difference with the ‘Total’ at the 95% confidence level. Please see summary codes in bold.
Total North West North East South East South West
Number of responses 484 142 83 38 62
Air quality 30% 32% 34% 11% 34%
Safety of pedestrians 27% 24% 35% 24% 31%
Vehicular speeds 27% 30% 22% 26% 29%
Traffic congestion 23% 20% 20% 21% 37%
Vehicular noise 20% 22% 22% 13% 21%
Quality of the street environment 18% 17% 23% 8% 24%
Safety of cyclists 17% 13% 19% 24% 21%
Impact on my journeys 17% 15% 17% 8% 26%
Impact on my home 13% 11% 13% 21% 13%
Access to/ from the area 9% 5% 10% 5% 18%
Enforcement 9% 11% 11% 8% 5%
Safety of motorcyclists/ mopeds 6% 6% 4% 5% 10%
Impact on my business 3% 1% 5% 5% 3%
Traffic issues 48% 50% 42% 45% 56%
Environment 37% 39% 43% 16% 37%
Safety 33% 27% 35% 37% 44%
Personal impact 24% 20% 27% 32% 27%
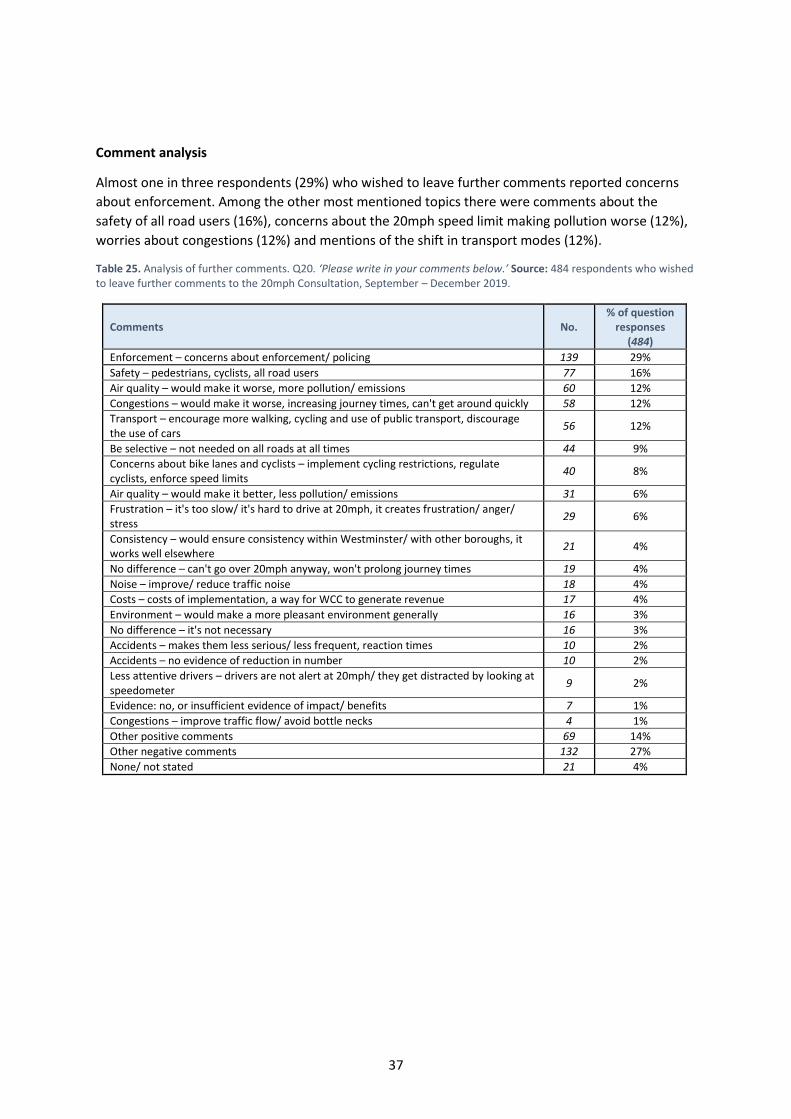
37
Comment analysis
Almost one in three respondents (29%) who wished to leave further comments reported concerns
about enforcement. Among the other most mentioned topics there were comments about the
safety of all road users (16%), concerns about the 20mph speed limit making pollution worse (12%),
worries about congestions (12%) and mentions of the shift in transport modes (12%).
Table 25. Analysis of further comments. Q20. ‘Please write in your comments below.’ Source: 484 respondents who wished to leave further comments to the 20mph Consultation, September – December 2019.
Comments No. % of question
responses (484)
Enforcement – concerns about enforcement/ policing 139 29%
Safety – pedestrians, cyclists, all road users 77 16%
Air quality – would make it worse, more pollution/ emissions 60 12%
Congestions – would make it worse, increasing journey times, can't get around quickly 58 12%
Transport – encourage more walking, cycling and use of public transport, discourage the use of cars
56 12%
Be selective – not needed on all roads at all times 44 9%
Concerns about bike lanes and cyclists – implement cycling restrictions, regulate cyclists, enforce speed limits
40 8%
Air quality – would make it better, less pollution/ emissions 31 6%
Frustration – it's too slow/ it's hard to drive at 20mph, it creates frustration/ anger/ stress
29 6%
Consistency – would ensure consistency within Westminster/ with other boroughs, it works well elsewhere
21 4%
No difference – can't go over 20mph anyway, won't prolong journey times 19 4%
Noise – improve/ reduce traffic noise 18 4%
Costs – costs of implementation, a way for WCC to generate revenue 17 4%
Environment – would make a more pleasant environment generally 16 3%
No difference – it's not necessary 16 3%
Accidents – makes them less serious/ less frequent, reaction times 10 2%
Accidents – no evidence of reduction in number 10 2%
Less attentive drivers – drivers are not alert at 20mph/ they get distracted by looking at speedometer
9 2%
Evidence: no, or insufficient evidence of impact/ benefits 7 1%
Congestions – improve traffic flow/ avoid bottle necks 4 1%
Other positive comments 69 14%
Other negative comments 132 27%
None/ not stated 21 4%
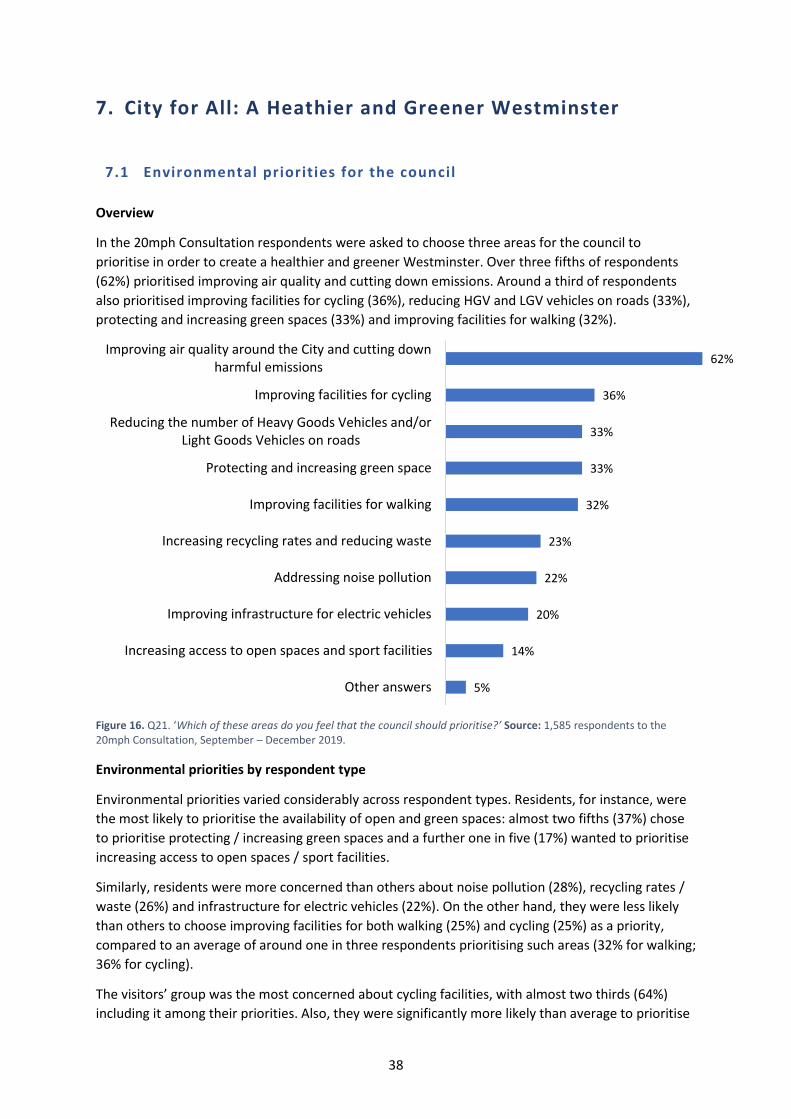
38
7. City for All: A Heathier and Greener Westminster
7.1 Environmental priorities for the council
Overview
In the 20mph Consultation respondents were asked to choose three areas for the council to
prioritise in order to create a healthier and greener Westminster. Over three fifths of respondents
(62%) prioritised improving air quality and cutting down emissions. Around a third of respondents
also prioritised improving facilities for cycling (36%), reducing HGV and LGV vehicles on roads (33%),
protecting and increasing green spaces (33%) and improving facilities for walking (32%).
Figure 16. Q21. ‘Which of these areas do you feel that the council should prioritise?’ Source: 1,585 respondents to the 20mph Consultation, September – December 2019.
Environmental priorities by respondent type
Environmental priorities varied considerably across respondent types. Residents, for instance, were
the most likely to prioritise the availability of open and green spaces: almost two fifths (37%) chose
to prioritise protecting / increasing green spaces and a further one in five (17%) wanted to prioritise
increasing access to open spaces / sport facilities.
Similarly, residents were more concerned than others about noise pollution (28%), recycling rates /
waste (26%) and infrastructure for electric vehicles (22%). On the other hand, they were less likely
than others to choose improving facilities for both walking (25%) and cycling (25%) as a priority,
compared to an average of around one in three respondents prioritising such areas (32% for walking;
36% for cycling).
The visitors’ group was the most concerned about cycling facilities, with almost two thirds (64%)
including it among their priorities. Also, they were significantly more likely than average to prioritise
62%
36%
33%
33%
32%
23%
22%
20%
14%
5%
Improving air quality around the City and cutting downharmful emissions
Improving facilities for cycling
Reducing the number of Heavy Goods Vehicles and/orLight Goods Vehicles on roads
Protecting and increasing green space
Improving facilities for walking
Increasing recycling rates and reducing waste
Addressing noise pollution
Improving infrastructure for electric vehicles
Increasing access to open spaces and sport facilities
Other answers
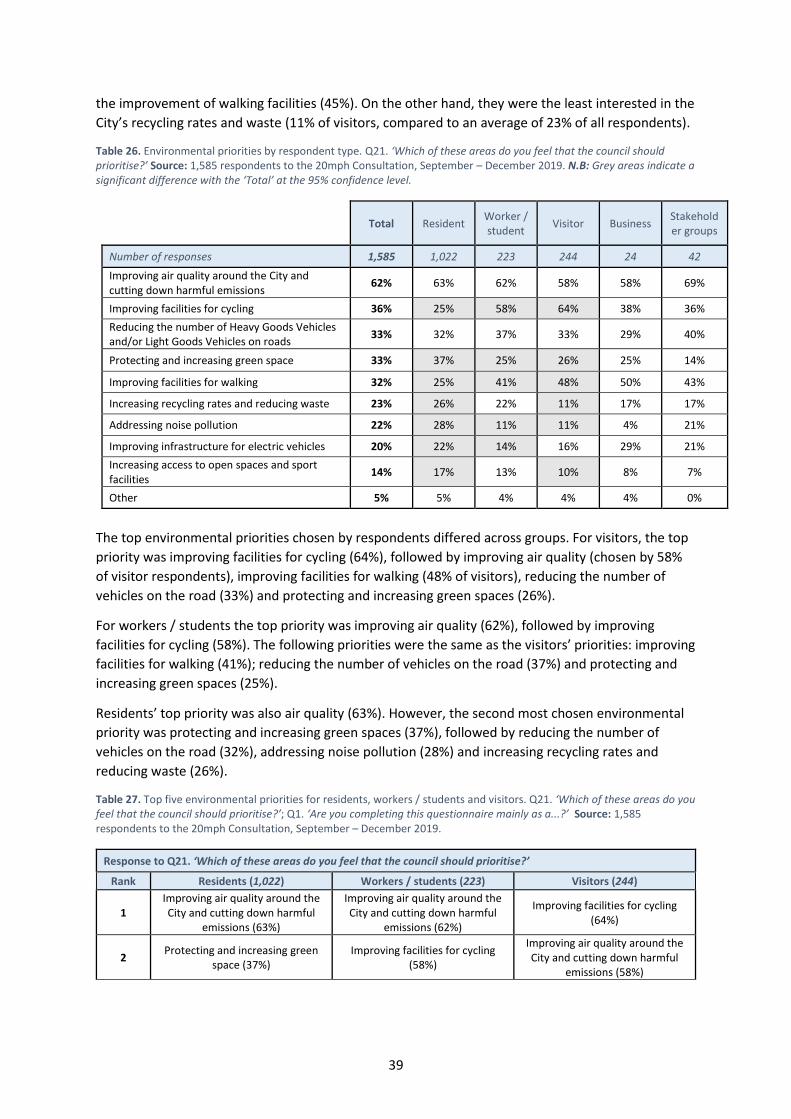
39
the improvement of walking facilities (45%). On the other hand, they were the least interested in the
City’s recycling rates and waste (11% of visitors, compared to an average of 23% of all respondents).
Table 26. Environmental priorities by respondent type. Q21. ‘Which of these areas do you feel that the council should prioritise?’ Source: 1,585 respondents to the 20mph Consultation, September – December 2019. N.B: Grey areas indicate a significant difference with the ‘Total’ at the 95% confidence level.
Total Resident Worker / student
Visitor Business Stakeholder groups
Number of responses 1,585 1,022 223 244 24 42
Improving air quality around the City and cutting down harmful emissions
62% 63% 62% 58% 58% 69%
Improving facilities for cycling 36% 25% 58% 64% 38% 36%
Reducing the number of Heavy Goods Vehicles and/or Light Goods Vehicles on roads
33% 32% 37% 33% 29% 40%
Protecting and increasing green space 33% 37% 25% 26% 25% 14%
Improving facilities for walking 32% 25% 41% 48% 50% 43%
Increasing recycling rates and reducing waste 23% 26% 22% 11% 17% 17%
Addressing noise pollution 22% 28% 11% 11% 4% 21%
Improving infrastructure for electric vehicles 20% 22% 14% 16% 29% 21%
Increasing access to open spaces and sport facilities
14% 17% 13% 10% 8% 7%
Other 5% 5% 4% 4% 4% 0%
The top environmental priorities chosen by respondents differed across groups. For visitors, the top
priority was improving facilities for cycling (64%), followed by improving air quality (chosen by 58%
of visitor respondents), improving facilities for walking (48% of visitors), reducing the number of
vehicles on the road (33%) and protecting and increasing green spaces (26%).
For workers / students the top priority was improving air quality (62%), followed by improving
facilities for cycling (58%). The following priorities were the same as the visitors’ priorities: improving
facilities for walking (41%); reducing the number of vehicles on the road (37%) and protecting and
increasing green spaces (25%).
Residents’ top priority was also air quality (63%). However, the second most chosen environmental
priority was protecting and increasing green spaces (37%), followed by reducing the number of
vehicles on the road (32%), addressing noise pollution (28%) and increasing recycling rates and
reducing waste (26%).
Table 27. Top five environmental priorities for residents, workers / students and visitors. Q21. ‘Which of these areas do you feel that the council should prioritise?’; Q1. ‘Are you completing this questionnaire mainly as a...?’ Source: 1,585 respondents to the 20mph Consultation, September – December 2019.
Response to Q21. ‘Which of these areas do you feel that the council should prioritise?’
Rank Residents (1,022) Workers / students (223) Visitors (244)
1 Improving air quality around the City and cutting down harmful
emissions (63%)
Improving air quality around the City and cutting down harmful
emissions (62%)
Improving facilities for cycling (64%)
2 Protecting and increasing green
space (37%) Improving facilities for cycling
(58%)
Improving air quality around the City and cutting down harmful
emissions (58%)
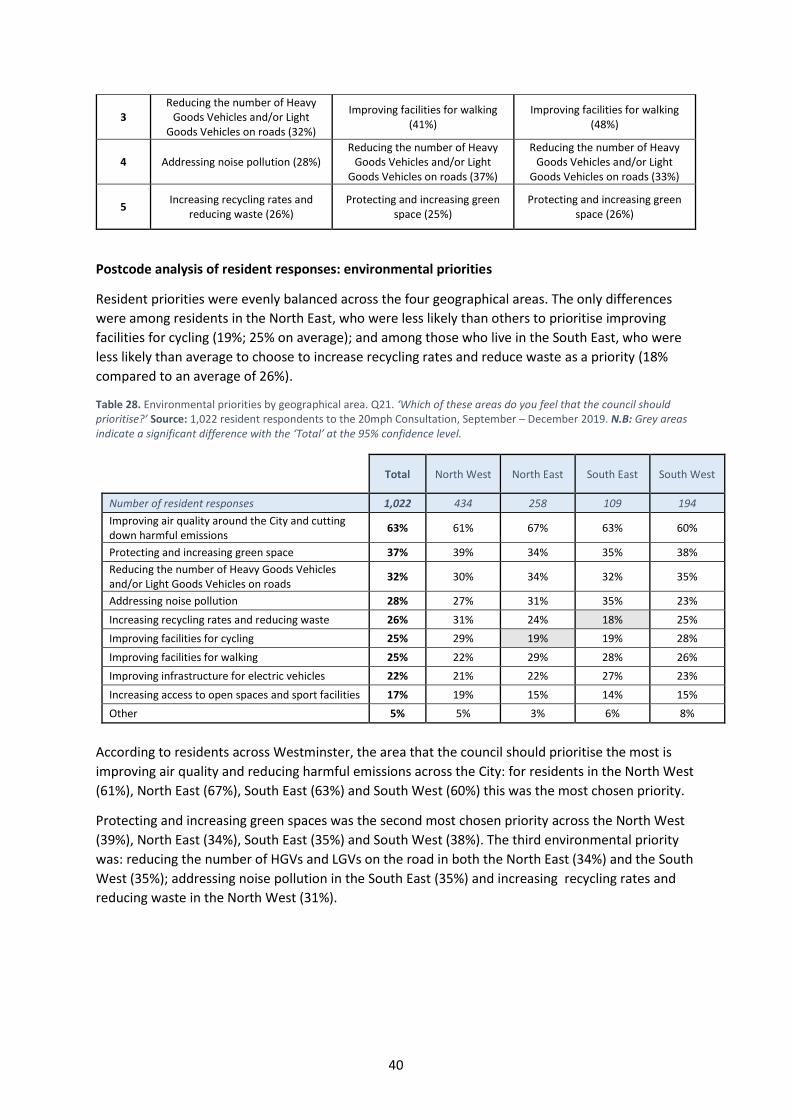
40
3 Reducing the number of Heavy
Goods Vehicles and/or Light Goods Vehicles on roads (32%)
Improving facilities for walking (41%)
Improving facilities for walking (48%)
4 Addressing noise pollution (28%) Reducing the number of Heavy
Goods Vehicles and/or Light Goods Vehicles on roads (37%)
Reducing the number of Heavy Goods Vehicles and/or Light
Goods Vehicles on roads (33%)
5 Increasing recycling rates and
reducing waste (26%) Protecting and increasing green
space (25%) Protecting and increasing green
space (26%)
Postcode analysis of resident responses: environmental priorities
Resident priorities were evenly balanced across the four geographical areas. The only differences
were among residents in the North East, who were less likely than others to prioritise improving
facilities for cycling (19%; 25% on average); and among those who live in the South East, who were
less likely than average to choose to increase recycling rates and reduce waste as a priority (18%
compared to an average of 26%).
Table 28. Environmental priorities by geographical area. Q21. ‘Which of these areas do you feel that the council should prioritise?’ Source: 1,022 resident respondents to the 20mph Consultation, September – December 2019. N.B: Grey areas indicate a significant difference with the ‘Total’ at the 95% confidence level.
Total North West North East South East South West
Number of resident responses 1,022 434 258 109 194
Improving air quality around the City and cutting down harmful emissions
63% 61% 67% 63% 60%
Protecting and increasing green space 37% 39% 34% 35% 38%
Reducing the number of Heavy Goods Vehicles and/or Light Goods Vehicles on roads
32% 30% 34% 32% 35%
Addressing noise pollution 28% 27% 31% 35% 23%
Increasing recycling rates and reducing waste 26% 31% 24% 18% 25%
Improving facilities for cycling 25% 29% 19% 19% 28%
Improving facilities for walking 25% 22% 29% 28% 26%
Improving infrastructure for electric vehicles 22% 21% 22% 27% 23%
Increasing access to open spaces and sport facilities 17% 19% 15% 14% 15%
Other 5% 5% 3% 6% 8%
According to residents across Westminster, the area that the council should prioritise the most is
improving air quality and reducing harmful emissions across the City: for residents in the North West
(61%), North East (67%), South East (63%) and South West (60%) this was the most chosen priority.
Protecting and increasing green spaces was the second most chosen priority across the North West
(39%), North East (34%), South East (35%) and South West (38%). The third environmental priority
was: reducing the number of HGVs and LGVs on the road in both the North East (34%) and the South
West (35%); addressing noise pollution in the South East (35%) and increasing recycling rates and
reducing waste in the North West (31%).
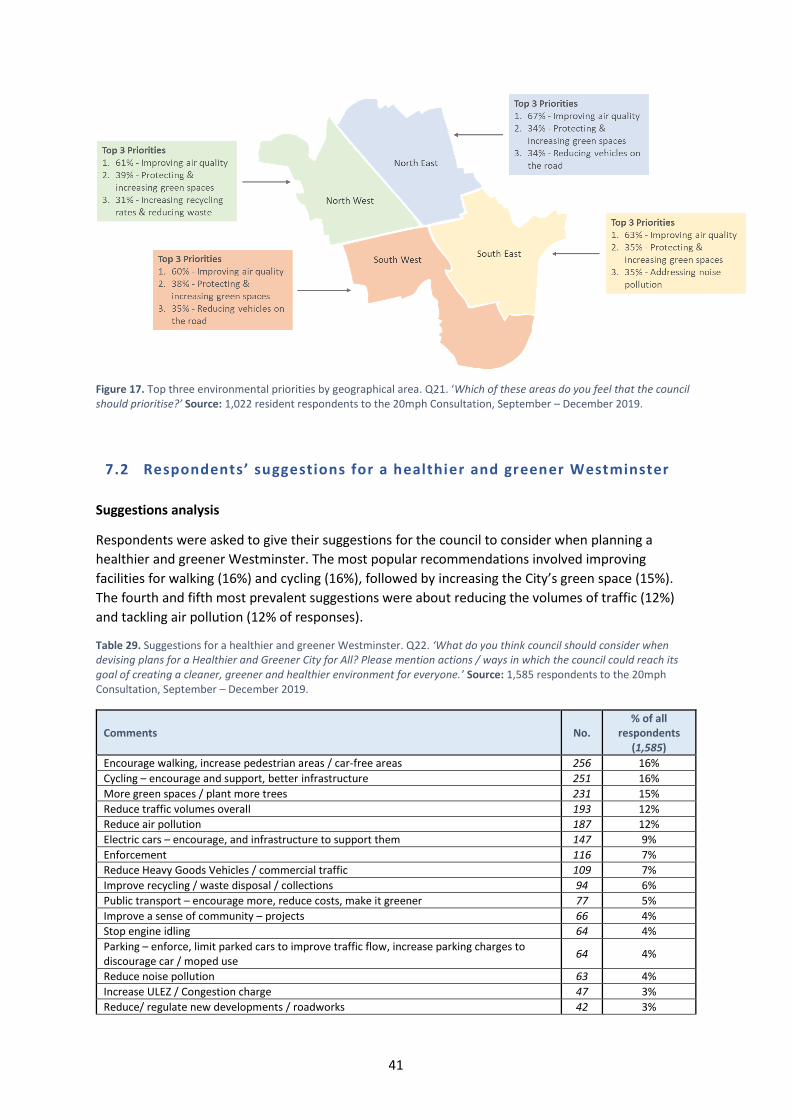
41
Figure 17. Top three environmental priorities by geographical area. Q21. ‘Which of these areas do you feel that the council should prioritise?’ Source: 1,022 resident respondents to the 20mph Consultation, September – December 2019.
7.2 Respondents’ suggestions for a healthier and greener Westminster
Suggestions analysis
Respondents were asked to give their suggestions for the council to consider when planning a
healthier and greener Westminster. The most popular recommendations involved improving
facilities for walking (16%) and cycling (16%), followed by increasing the City’s green space (15%).
The fourth and fifth most prevalent suggestions were about reducing the volumes of traffic (12%)
and tackling air pollution (12% of responses).
Table 29. Suggestions for a healthier and greener Westminster. Q22. ‘What do you think council should consider when devising plans for a Healthier and Greener City for All? Please mention actions / ways in which the council could reach its goal of creating a cleaner, greener and healthier environment for everyone.’ Source: 1,585 respondents to the 20mph Consultation, September – December 2019.
Comments No. % of all
respondents (1,585)
Encourage walking, increase pedestrian areas / car-free areas 256 16%
Cycling – encourage and support, better infrastructure 251 16%
More green spaces / plant more trees 231 15%
Reduce traffic volumes overall 193 12%
Reduce air pollution 187 12%
Electric cars – encourage, and infrastructure to support them 147 9%
Enforcement 116 7%
Reduce Heavy Goods Vehicles / commercial traffic 109 7%
Improve recycling / waste disposal / collections 94 6%
Public transport – encourage more, reduce costs, make it greener 77 5%
Improve a sense of community – projects 66 4%
Stop engine idling 64 4%
Parking – enforce, limit parked cars to improve traffic flow, increase parking charges to discourage car / moped use
64 4%
Reduce noise pollution 63 4%
Increase ULEZ / Congestion charge 47 3%
Reduce/ regulate new developments / roadworks 42 3%
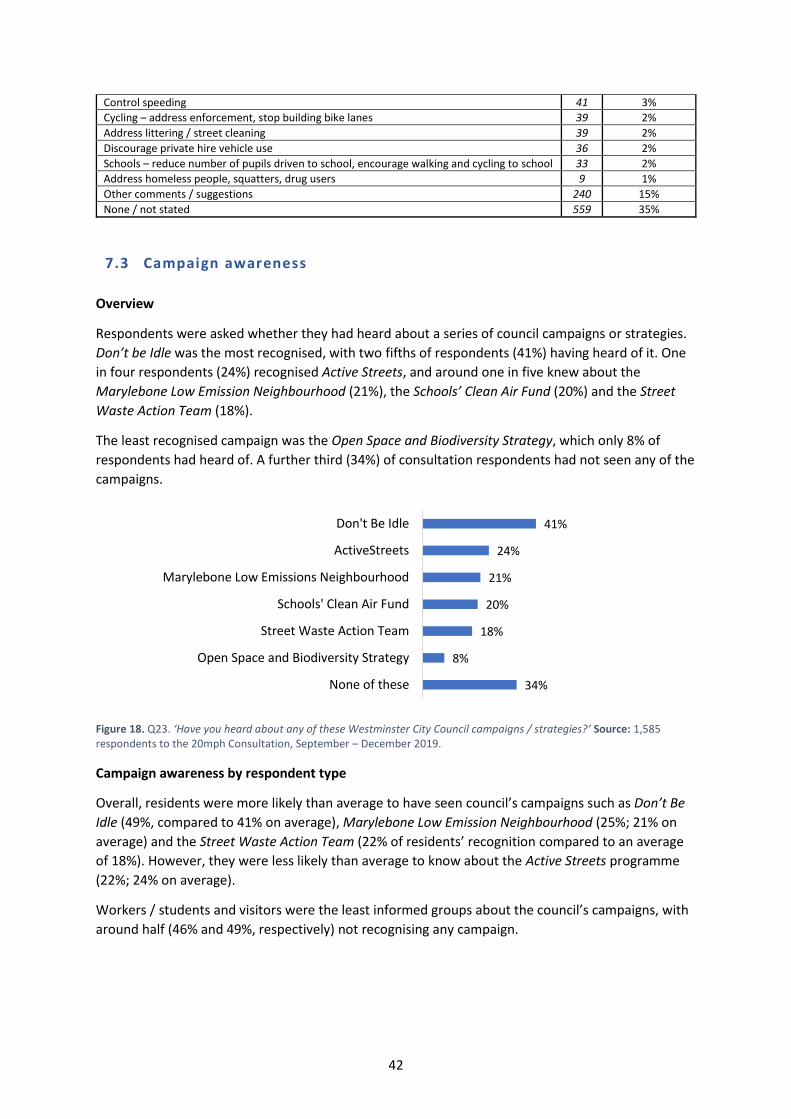
42
Control speeding 41 3%
Cycling – address enforcement, stop building bike lanes 39 2%
Address littering / street cleaning 39 2%
Discourage private hire vehicle use 36 2%
Schools – reduce number of pupils driven to school, encourage walking and cycling to school 33 2%
Address homeless people, squatters, drug users 9 1%
Other comments / suggestions 240 15%
None / not stated 559 35%
7.3 Campaign awareness
Overview
Respondents were asked whether they had heard about a series of council campaigns or strategies.
Don’t be Idle was the most recognised, with two fifths of respondents (41%) having heard of it. One
in four respondents (24%) recognised Active Streets, and around one in five knew about the
Marylebone Low Emission Neighbourhood (21%), the Schools’ Clean Air Fund (20%) and the Street
Waste Action Team (18%).
The least recognised campaign was the Open Space and Biodiversity Strategy, which only 8% of
respondents had heard of. A further third (34%) of consultation respondents had not seen any of the
campaigns.
Figure 18. Q23. ‘Have you heard about any of these Westminster City Council campaigns / strategies?’ Source: 1,585 respondents to the 20mph Consultation, September – December 2019.
Campaign awareness by respondent type
Overall, residents were more likely than average to have seen council’s campaigns such as Don’t Be
Idle (49%, compared to 41% on average), Marylebone Low Emission Neighbourhood (25%; 21% on
average) and the Street Waste Action Team (22% of residents’ recognition compared to an average
of 18%). However, they were less likely than average to know about the Active Streets programme
(22%; 24% on average).
Workers / students and visitors were the least informed groups about the council’s campaigns, with
around half (46% and 49%, respectively) not recognising any campaign.
41%
24%
21%
20%
18%
8%
34%
Don't Be Idle
ActiveStreets
Marylebone Low Emissions Neighbourhood
Schools' Clean Air Fund
Street Waste Action Team
Open Space and Biodiversity Strategy
None of these
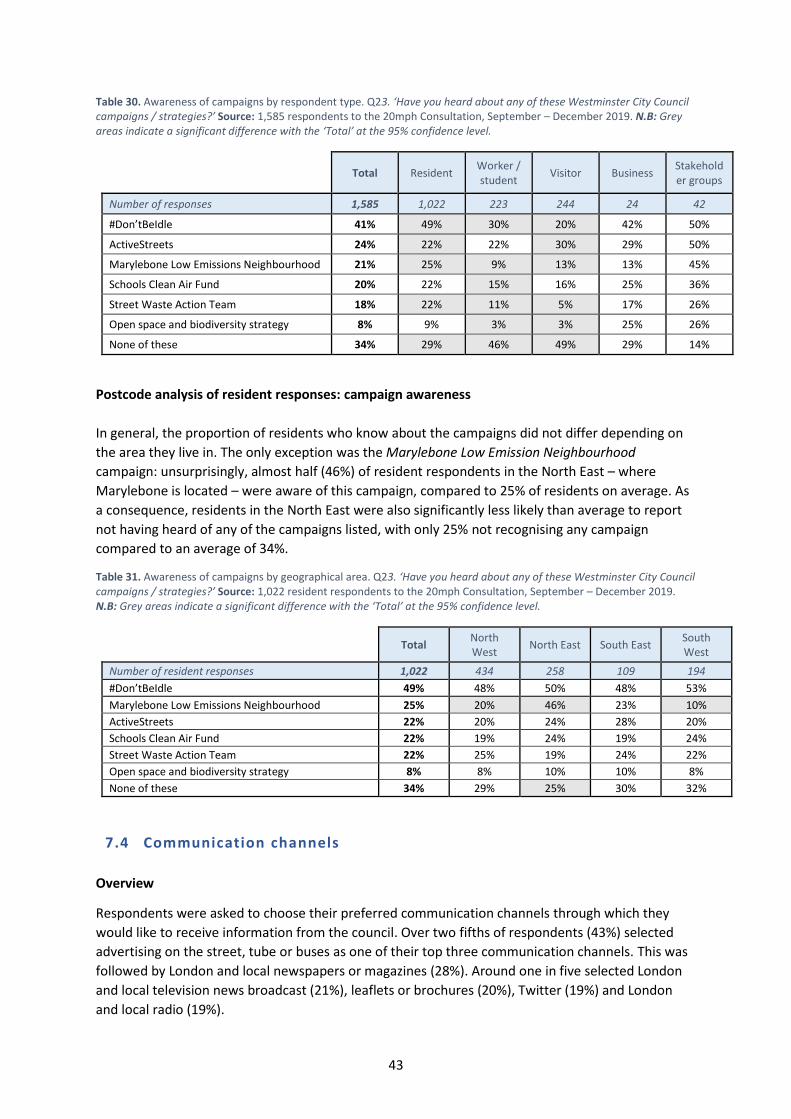
43
Table 30. Awareness of campaigns by respondent type. Q23. ‘Have you heard about any of these Westminster City Council campaigns / strategies?’ Source: 1,585 respondents to the 20mph Consultation, September – December 2019. N.B: Grey areas indicate a significant difference with the ‘Total’ at the 95% confidence level.
Total Resident Worker / student
Visitor Business Stakeholder groups
Number of responses 1,585 1,022 223 244 24 42
#Don’tBeIdle 41% 49% 30% 20% 42% 50%
ActiveStreets 24% 22% 22% 30% 29% 50%
Marylebone Low Emissions Neighbourhood 21% 25% 9% 13% 13% 45%
Schools Clean Air Fund 20% 22% 15% 16% 25% 36%
Street Waste Action Team 18% 22% 11% 5% 17% 26%
Open space and biodiversity strategy 8% 9% 3% 3% 25% 26%
None of these 34% 29% 46% 49% 29% 14%
Postcode analysis of resident responses: campaign awareness
In general, the proportion of residents who know about the campaigns did not differ depending on
the area they live in. The only exception was the Marylebone Low Emission Neighbourhood
campaign: unsurprisingly, almost half (46%) of resident respondents in the North East – where
Marylebone is located – were aware of this campaign, compared to 25% of residents on average. As
a consequence, residents in the North East were also significantly less likely than average to report
not having heard of any of the campaigns listed, with only 25% not recognising any campaign
compared to an average of 34%.
Table 31. Awareness of campaigns by geographical area. Q23. ‘Have you heard about any of these Westminster City Council campaigns / strategies?’ Source: 1,022 resident respondents to the 20mph Consultation, September – December 2019. N.B: Grey areas indicate a significant difference with the ‘Total’ at the 95% confidence level.
Total
North West
North East South East South West
Number of resident responses 1,022 434 258 109 194
#Don’tBeIdle 49% 48% 50% 48% 53%
Marylebone Low Emissions Neighbourhood 25% 20% 46% 23% 10%
ActiveStreets 22% 20% 24% 28% 20%
Schools Clean Air Fund 22% 19% 24% 19% 24%
Street Waste Action Team 22% 25% 19% 24% 22%
Open space and biodiversity strategy 8% 8% 10% 10% 8%
None of these 34% 29% 25% 30% 32%
7.4 Communication channels
Overview
Respondents were asked to choose their preferred communication channels through which they
would like to receive information from the council. Over two fifths of respondents (43%) selected
advertising on the street, tube or buses as one of their top three communication channels. This was
followed by London and local newspapers or magazines (28%). Around one in five selected London
and local television news broadcast (21%), leaflets or brochures (20%), Twitter (19%) and London
and local radio (19%).
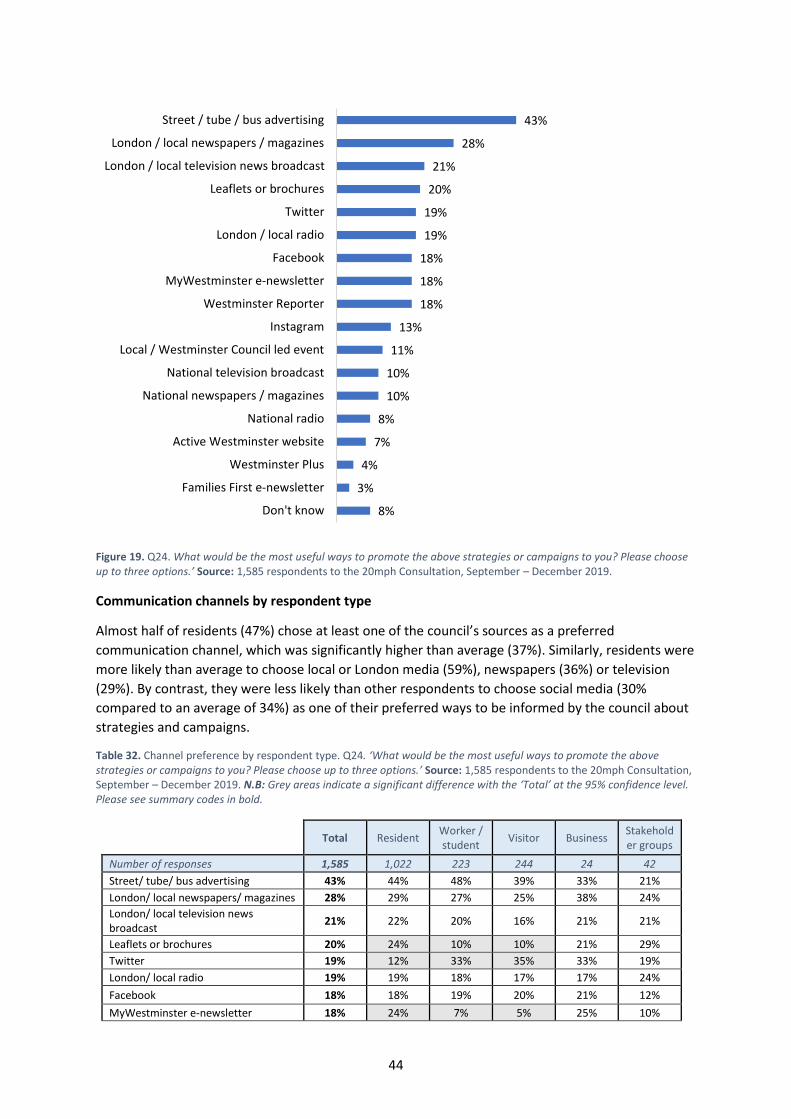
44
Figure 19. Q24. What would be the most useful ways to promote the above strategies or campaigns to you? Please choose up to three options.’ Source: 1,585 respondents to the 20mph Consultation, September – December 2019.
Communication channels by respondent type
Almost half of residents (47%) chose at least one of the council’s sources as a preferred
communication channel, which was significantly higher than average (37%). Similarly, residents were
more likely than average to choose local or London media (59%), newspapers (36%) or television
(29%). By contrast, they were less likely than other respondents to choose social media (30%
compared to an average of 34%) as one of their preferred ways to be informed by the council about
strategies and campaigns.
Table 32. Channel preference by respondent type. Q24. ‘What would be the most useful ways to promote the above strategies or campaigns to you? Please choose up to three options.’ Source: 1,585 respondents to the 20mph Consultation, September – December 2019. N.B: Grey areas indicate a significant difference with the ‘Total’ at the 95% confidence level. Please see summary codes in bold.
Total Resident Worker / student
Visitor Business Stakeholder groups
Number of responses 1,585 1,022 223 244 24 42
Street/ tube/ bus advertising 43% 44% 48% 39% 33% 21%
London/ local newspapers/ magazines 28% 29% 27% 25% 38% 24%
London/ local television news broadcast
21% 22% 20% 16% 21% 21%
Leaflets or brochures 20% 24% 10% 10% 21% 29%
Twitter 19% 12% 33% 35% 33% 19%
London/ local radio 19% 19% 18% 17% 17% 24%
Facebook 18% 18% 19% 20% 21% 12%
MyWestminster e-newsletter 18% 24% 7% 5% 25% 10%
43%
28%
21%
20%
19%
19%
18%
18%
18%
13%
11%
10%
10%
8%
7%
4%
3%
8%
Street / tube / bus advertising
London / local newspapers / magazines
London / local television news broadcast
Leaflets or brochures
London / local radio
MyWestminster e-newsletter
Westminster Reporter
Local / Westminster Council led event
National television broadcast
National newspapers / magazines
National radio
Active Westminster website
Westminster Plus
Families First e-newsletter
Don't know
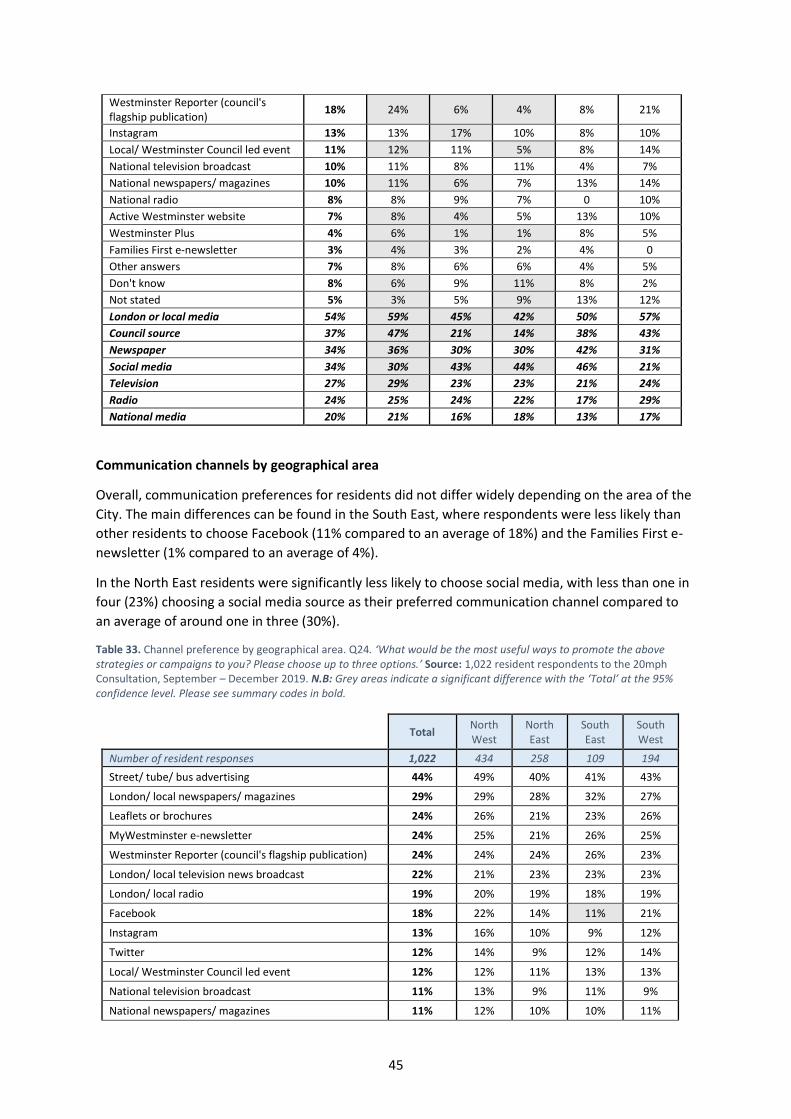
45
Westminster Reporter (council's flagship publication)
18% 24% 6% 4% 8% 21%
Instagram 13% 13% 17% 10% 8% 10%
Local/ Westminster Council led event 11% 12% 11% 5% 8% 14%
National television broadcast 10% 11% 8% 11% 4% 7%
National newspapers/ magazines 10% 11% 6% 7% 13% 14%
National radio 8% 8% 9% 7% 0 10%
Active Westminster website 7% 8% 4% 5% 13% 10%
Westminster Plus 4% 6% 1% 1% 8% 5%
Families First e-newsletter 3% 4% 3% 2% 4% 0
Other answers 7% 8% 6% 6% 4% 5%
Don't know 8% 6% 9% 11% 8% 2%
Not stated 5% 3% 5% 9% 13% 12%
London or local media 54% 59% 45% 42% 50% 57%
Council source 37% 47% 21% 14% 38% 43%
Newspaper 34% 36% 30% 30% 42% 31%
Social media 34% 30% 43% 44% 46% 21%
Television 27% 29% 23% 23% 21% 24%
Radio 24% 25% 24% 22% 17% 29%
National media 20% 21% 16% 18% 13% 17%
Communication channels by geographical area
Overall, communication preferences for residents did not differ widely depending on the area of the
City. The main differences can be found in the South East, where respondents were less likely than
other residents to choose Facebook (11% compared to an average of 18%) and the Families First e-
newsletter (1% compared to an average of 4%).
In the North East residents were significantly less likely to choose social media, with less than one in
four (23%) choosing a social media source as their preferred communication channel compared to
an average of around one in three (30%).
Table 33. Channel preference by geographical area. Q24. ‘What would be the most useful ways to promote the above strategies or campaigns to you? Please choose up to three options.’ Source: 1,022 resident respondents to the 20mph Consultation, September – December 2019. N.B: Grey areas indicate a significant difference with the ‘Total’ at the 95% confidence level. Please see summary codes in bold.
Total
North West
North East
South East
South West
Number of resident responses 1,022 434 258 109 194
Street/ tube/ bus advertising 44% 49% 40% 41% 43%
London/ local newspapers/ magazines 29% 29% 28% 32% 27%
Leaflets or brochures 24% 26% 21% 23% 26%
MyWestminster e-newsletter 24% 25% 21% 26% 25%
Westminster Reporter (council's flagship publication) 24% 24% 24% 26% 23%
London/ local television news broadcast 22% 21% 23% 23% 23%
London/ local radio 19% 20% 19% 18% 19%
Facebook 18% 22% 14% 11% 21%
Instagram 13% 16% 10% 9% 12%
Twitter 12% 14% 9% 12% 14%
Local/ Westminster Council led event 12% 12% 11% 13% 13%
National television broadcast 11% 13% 9% 11% 9%
National newspapers/ magazines 11% 12% 10% 10% 11%
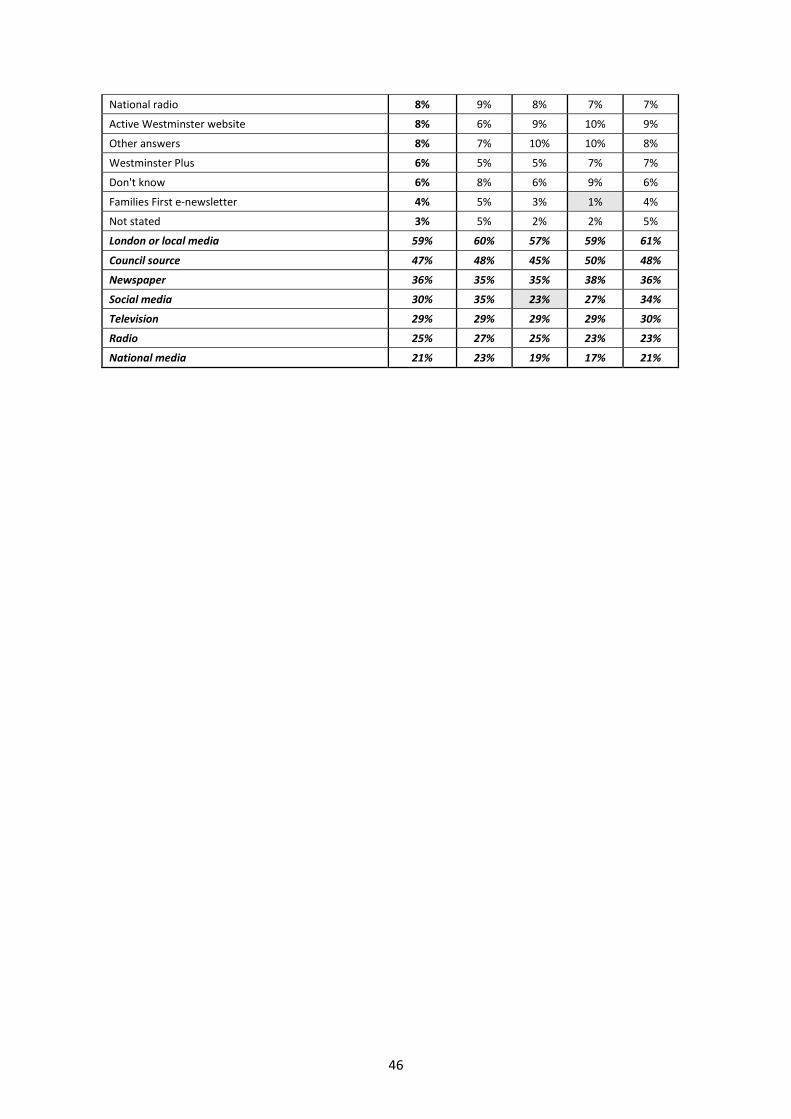
46
National radio 8% 9% 8% 7% 7%
Active Westminster website 8% 6% 9% 10% 9%
Other answers 8% 7% 10% 10% 8%
Westminster Plus 6% 5% 5% 7% 7%
Don't know 6% 8% 6% 9% 6%
Families First e-newsletter 4% 5% 3% 1% 4%
Not stated 3% 5% 2% 2% 5%
London or local media 59% 60% 57% 59% 61%
Council source 47% 48% 45% 50% 48%
Newspaper 36% 35% 35% 38% 36%
Social media 30% 35% 23% 27% 34%
Television 29% 29% 29% 29% 30%
Radio 25% 27% 25% 23% 23%
National media 21% 23% 19% 17% 21%
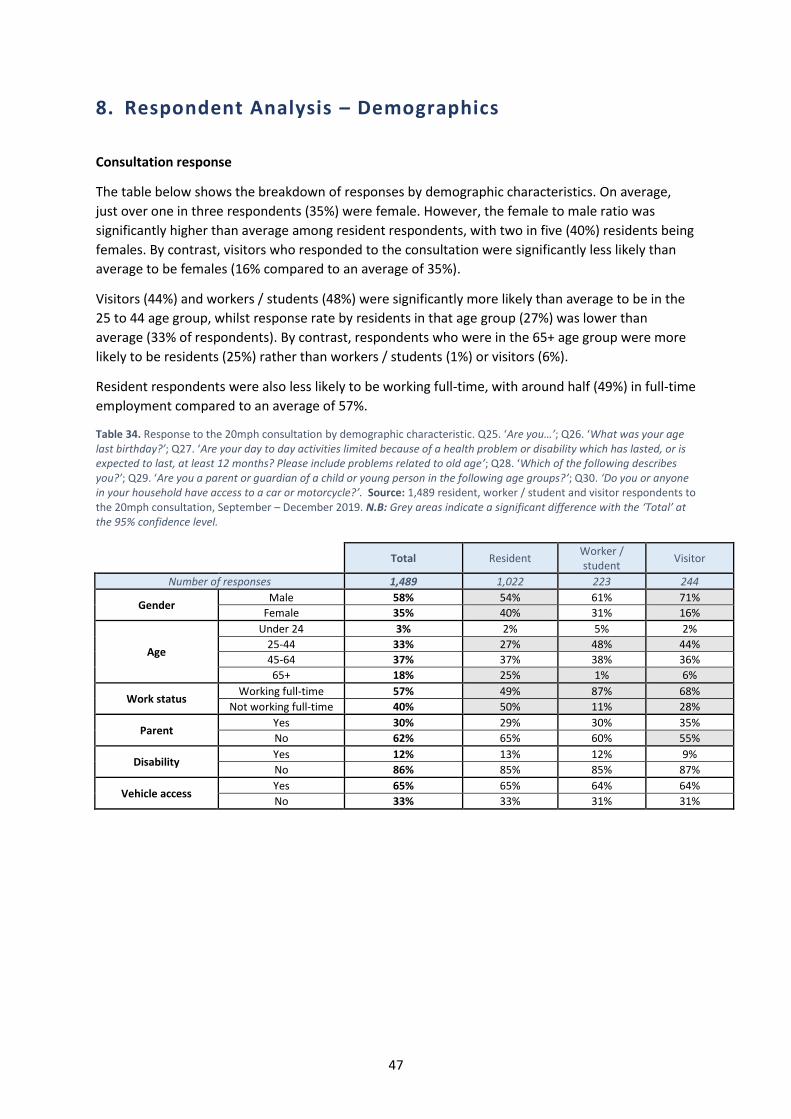
47
8. Respondent Analysis – Demographics
Consultation response
The table below shows the breakdown of responses by demographic characteristics. On average,
just over one in three respondents (35%) were female. However, the female to male ratio was
significantly higher than average among resident respondents, with two in five (40%) residents being
females. By contrast, visitors who responded to the consultation were significantly less likely than
average to be females (16% compared to an average of 35%).
Visitors (44%) and workers / students (48%) were significantly more likely than average to be in the
25 to 44 age group, whilst response rate by residents in that age group (27%) was lower than
average (33% of respondents). By contrast, respondents who were in the 65+ age group were more
likely to be residents (25%) rather than workers / students (1%) or visitors (6%).
Resident respondents were also less likely to be working full-time, with around half (49%) in full-time
employment compared to an average of 57%.
Table 34. Response to the 20mph consultation by demographic characteristic. Q25. ‘Are you…’; Q26. ‘What was your age last birthday?’; Q27. ‘Are your day to day activities limited because of a health problem or disability which has lasted, or is expected to last, at least 12 months? Please include problems related to old age’; Q28. ‘Which of the following describes you?’; Q29. ‘Are you a parent or guardian of a child or young person in the following age groups?’; Q30. ‘Do you or anyone in your household have access to a car or motorcycle?’. Source: 1,489 resident, worker / student and visitor respondents to the 20mph consultation, September – December 2019. N.B: Grey areas indicate a significant difference with the ‘Total’ at the 95% confidence level.
Total Resident Worker / student
Visitor
Number of responses 1,489 1,022 223 244
Gender Male 58% 54% 61% 71%
Female 35% 40% 31% 16%
Age
Under 24 3% 2% 5% 2%
25-44 33% 27% 48% 44%
45-64 37% 37% 38% 36%
65+ 18% 25% 1% 6%
Work status Working full-time 57% 49% 87% 68%
Not working full-time 40% 50% 11% 28%
Parent Yes 30% 29% 30% 35%
No 62% 65% 60% 55%
Disability Yes 12% 13% 12% 9%
No 86% 85% 85% 87%
Vehicle access Yes 65% 65% 64% 64%
No 33% 33% 31% 31%

48
9. Email and letter responses In addition to feedback through the online and paper questionnaires, residents and interested parties responded to the consultations via emails to Westminster City Council. These responses were collated and catalogued based on the concerns raised.
• 30 emails were logged
• 24 individual respondents were noted All emails and letters were read so that any issues or concerns they raised could be categorised according to whether they supported or opposed the scheme, and then logged under specific categories (such as concerns with enforcement, safety & accidents etc.) Overall, around four fifths of email respondents (79%) support the 20mph proposal, whilst just less than one in five (17%) oppose the scheme.
Figure 20. Support and opposition for the proposed 20mph speed limit in the email received by Westminster City Council. Source: 24 email respondents to the WCC 20mph Consultation, September – December 2019.
Issues
Almost three in five email respondents (58%) mentioned being concerned about how the 20mph scheme is going to be enforced. This was followed by concerns about safety and accidents, with half of respondents (50%) bringing up safety in their emails. The other main concerns raised were:
• Street design at 33% (8 respondents)
• Speeding at 33% (8 respondents)
• Pollution at 26% (7 respondents)
• Walking at 29% (7 respondents)
• Cycling at 29% (7 respondents)
79% 17%Support for the 20mph speed limit
Support Oppose

49
Figure 21. Top 12 issues raised in the email responses received by Westminster City Council in regards to the 20mph consultation. The issues raised by less than three people have been excluded from this graph. Source: 24 email respondents to the WCC 20mph Consultation, September – December 2019.
For many respondents these issues were interlinked. For instance, many of the respondents who said that the 20mph speed limit improves safety and reduces accidents also mentioned that the increased sense of safety would encourage both walking and cycling. Table 35. Comments of respondents who emailed WCC in regards to the 20mph Consultation. Source: 24 email respondents to the 20mph Consultation, September – December 2019.
Comment No. of topics
coded % of email
responses (24)
% of those who support the
proposal (19)
Concerns with enforcement 14 58% 53%
Safety & accidents – pedestrians, cyclists, all road users; makes them less serious / less frequent, reaction times
12 50% 63%
Speeding – reduces traffic / cars/ motor bikes speeding 8 33% 32%
Re-design streets / use tools to ensure compliance 8 33% 37%
It would reduce pollution / emissions 7 29% 37%
It would encourage / give priority to walking 7 29% 32%
It would encourage / give priority to cycling 7 29% 32%
Be selective – not needed on all roads 4 17% 11%
Noise – improve / reduce traffic noise 3 13% 11%
It would prevent rat runs 3 13% 16%
Health benefits 3 13% 16%
15mph limit instead 3 13% 16%
Concerns about bike lanes and cyclists – implement cycling restrictions, regulate cyclists, enforce speed limits
2 8% 11%
Improve cycling facilities 2 8% 11%
Discourage use of cars 2 8% 11%
Slows traffic down too much 2 8% 5%
Environment – would make a more pleasant environment generally
2 8% 11%
No difference – it’s not necessary, can't go over 20mph anyway 1 4% 0%
Speeding – doesn't reduce speeding 1 4% 0%
Pollution / emissions – would make it worse 1 4% 0%
It would discourage the use of public transport 1 4% 0%
58%
50%
33%
33%
29%
29%
29%
13%
13%
13%
13%
13%
Concerns with enforcement
Safety & accidents
Speeding – reduces traffic / cars / motor bikes speeding
Re-design streets / use tools to ensure compliance
It would reduce pollution / emissions
It would encourage / give priority to walking
It would encourage / give priority to cycling
Be selective – not needed on all roads
Noise – improve / reduce traffic noise
It would prevent rat runs
Health benefits
15mph limit instead
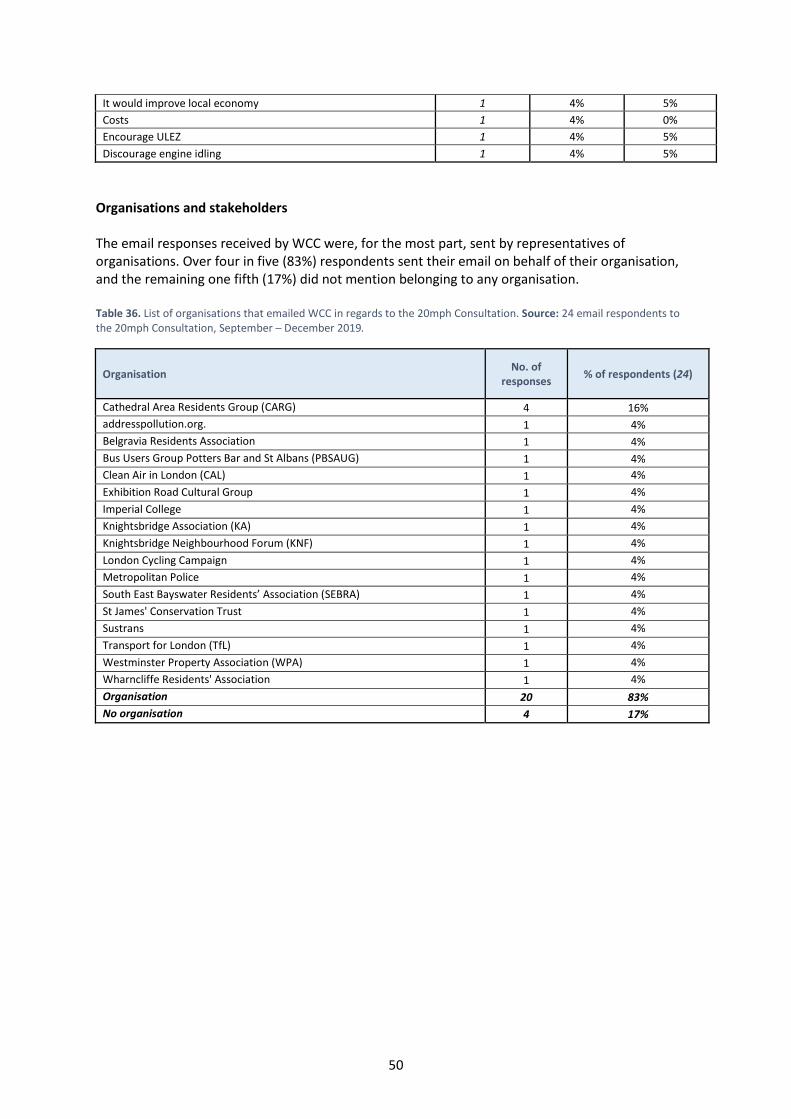
50
It would improve local economy 1 4% 5%
Costs 1 4% 0%
Encourage ULEZ 1 4% 5%
Discourage engine idling 1 4% 5%
Organisations and stakeholders The email responses received by WCC were, for the most part, sent by representatives of organisations. Over four in five (83%) respondents sent their email on behalf of their organisation, and the remaining one fifth (17%) did not mention belonging to any organisation. Table 36. List of organisations that emailed WCC in regards to the 20mph Consultation. Source: 24 email respondents to the 20mph Consultation, September – December 2019.
Organisation No. of
responses % of respondents (24)
Cathedral Area Residents Group (CARG) 4 16%
addresspollution.org. 1 4%
Belgravia Residents Association 1 4%
Bus Users Group Potters Bar and St Albans (PBSAUG) 1 4%
Clean Air in London (CAL) 1 4%
Exhibition Road Cultural Group 1 4%
Imperial College 1 4%
Knightsbridge Association (KA) 1 4%
Knightsbridge Neighbourhood Forum (KNF) 1 4%
London Cycling Campaign 1 4%
Metropolitan Police 1 4%
South East Bayswater Residents’ Association (SEBRA) 1 4%
St James' Conservation Trust 1 4%
Sustrans 1 4%
Transport for London (TfL) 1 4%
Westminster Property Association (WPA) 1 4%
Wharncliffe Residents' Association 1 4%
Organisation 20 83%
No organisation 4 17%
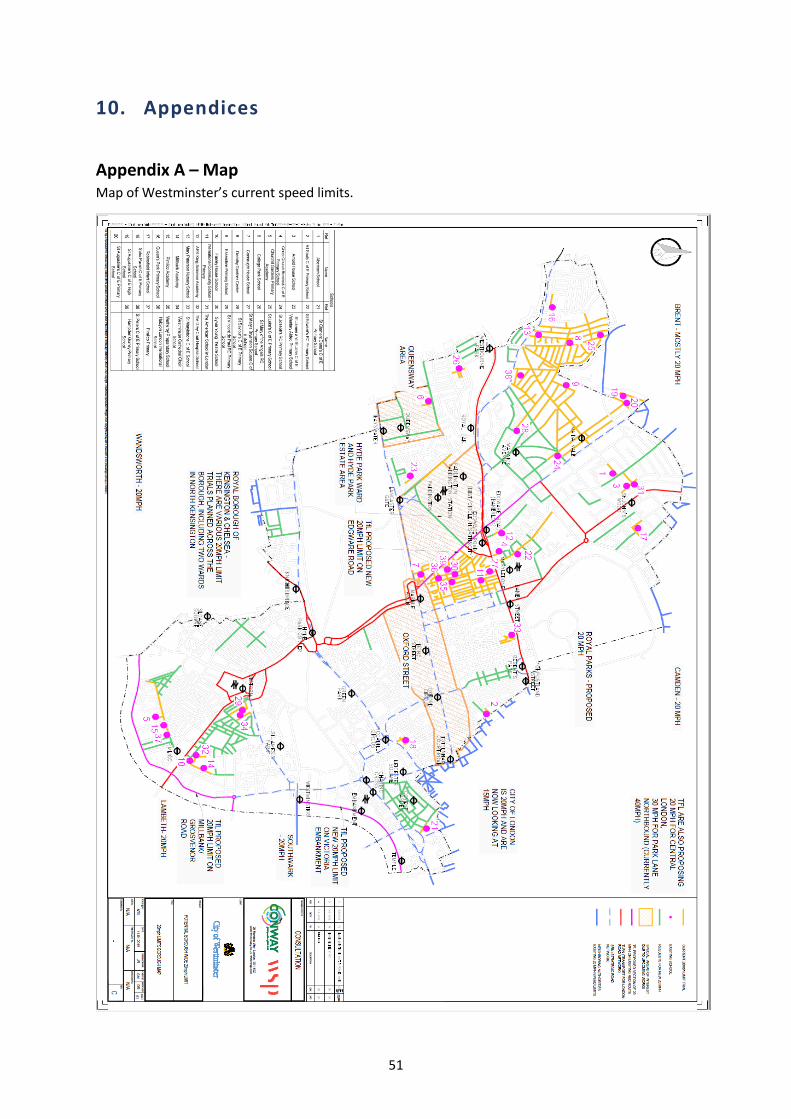
51
10. Appendices
Appendix A – Map Map of Westminster’s current speed limits.
52
Appendix B – Leaflet Leaflet used to promote the 20mph consultation.
53
Appendix C – Banner Pull-up banner used at the 20mph consultation events.
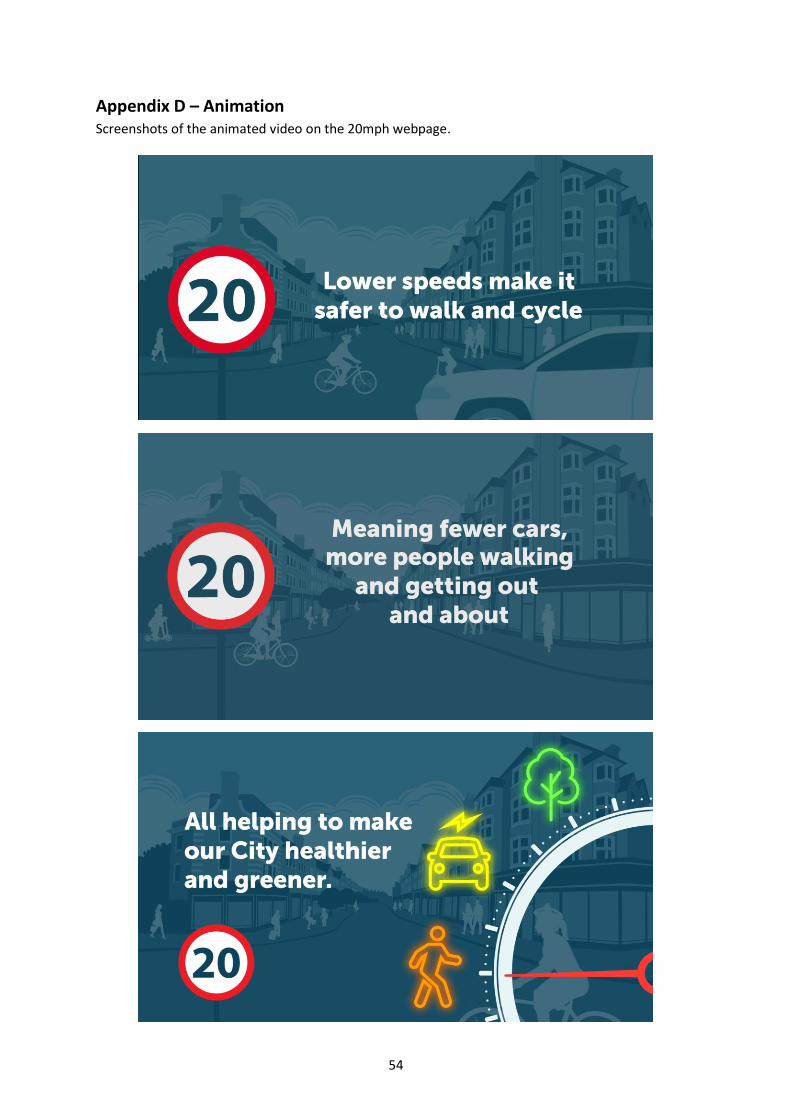
54
Appendix D – Animation Screenshots of the animated video on the 20mph webpage.
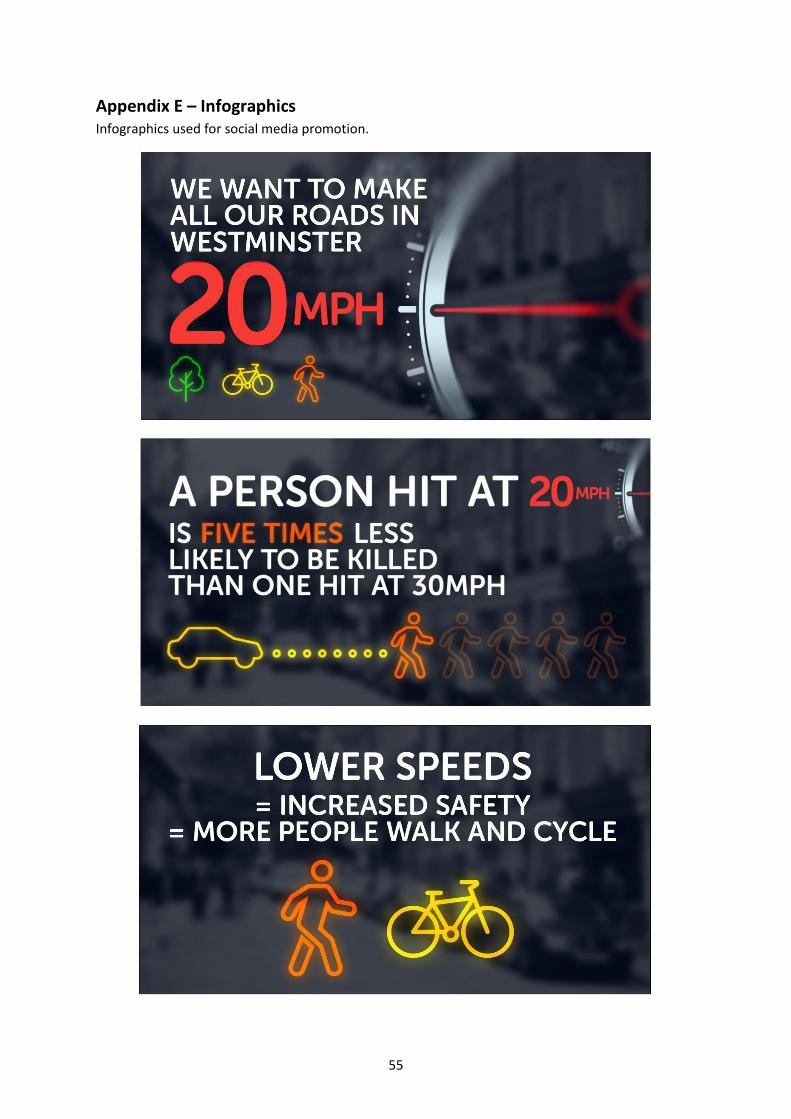
55
Appendix E – Infographics Infographics used for social media promotion.
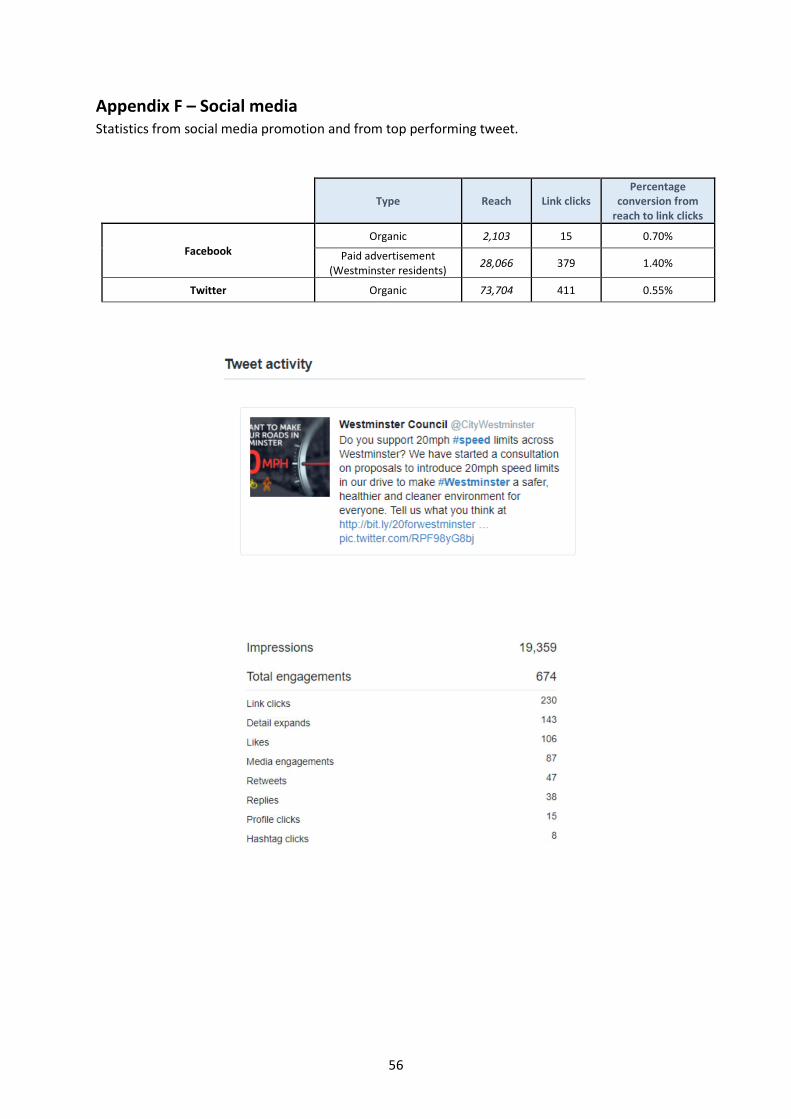
56
Appendix F – Social media Statistics from social media promotion and from top performing tweet.
Type Reach Link clicks Percentage
conversion from reach to link clicks
Facebook Organic 2,103 15 0.70%
Paid advertisement (Westminster residents)
28,066 379 1.40%
Twitter Organic 73,704 411 0.55%
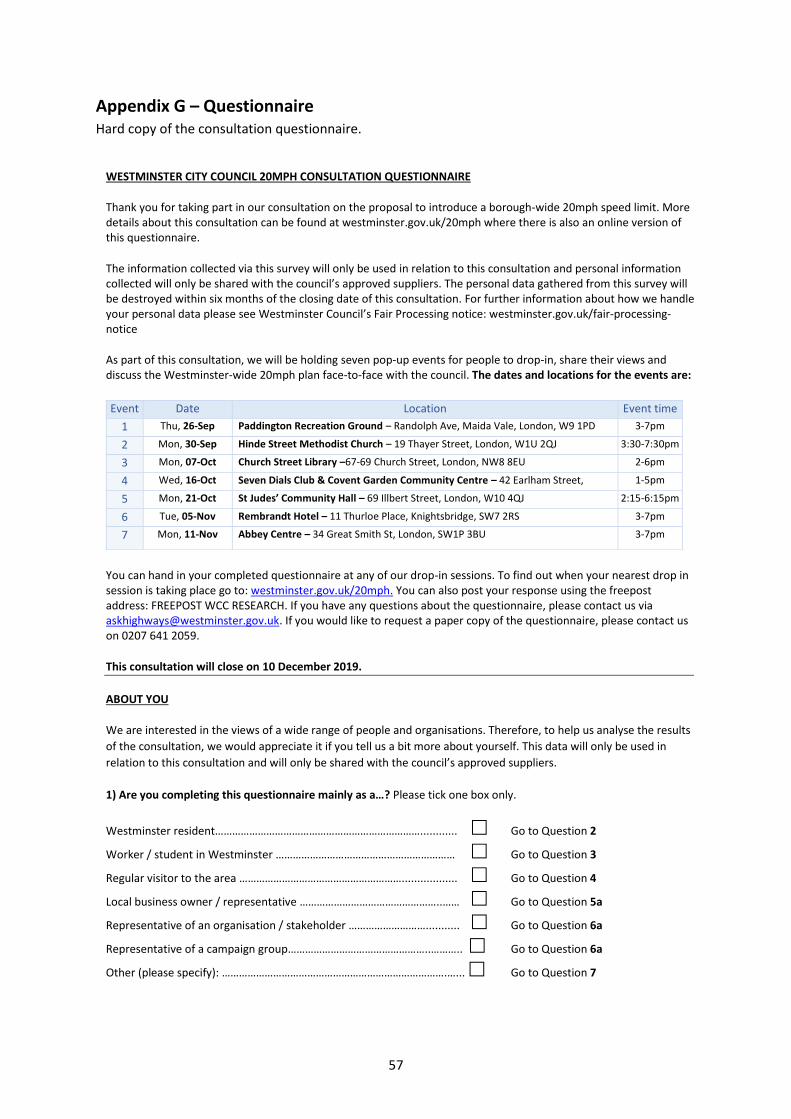
57
Appendix G – Questionnaire Hard copy of the consultation questionnaire.
WESTMINSTER CITY COUNCIL 20MPH CONSULTATION QUESTIONNAIRE
Thank you for taking part in our consultation on the proposal to introduce a borough-wide 20mph speed limit. More details about this consultation can be found at westminster.gov.uk/20mph where there is also an online version of this questionnaire.
The information collected via this survey will only be used in relation to this consultation and personal information collected will only be shared with the council’s approved suppliers. The personal data gathered from this survey will be destroyed within six months of the closing date of this consultation. For further information about how we handle your personal data please see Westminster Council’s Fair Processing notice: westminster.gov.uk/fair-processing-notice
As part of this consultation, we will be holding seven pop-up events for people to drop-in, share their views and discuss the Westminster-wide 20mph plan face-to-face with the council. The dates and locations for the events are:
You can hand in your completed questionnaire at any of our drop-in sessions. To find out when your nearest drop in session is taking place go to: westminster.gov.uk/20mph. You can also post your response using the freepost address: FREEPOST WCC RESEARCH. If you have any questions about the questionnaire, please contact us via [email protected]. If you would like to request a paper copy of the questionnaire, please contact us on 0207 641 2059.
This consultation will close on 10 December 2019.
ABOUT YOU
We are interested in the views of a wide range of people and organisations. Therefore, to help us analyse the results
of the consultation, we would appreciate it if you tell us a bit more about yourself. This data will only be used in
relation to this consultation and will only be shared with the council’s approved suppliers.
1) Are you completing this questionnaire mainly as a…? Please tick one box only.
Westminster resident………………………………………………………………............ Go to Question 2
Worker / student in Westminster ……………………………………………………… Go to Question 3
Regular visitor to the area ………………………………………………….................. Go to Question 4
Local business owner / representative …………………………………………..…… Go to Question 5a
Representative of an organisation / stakeholder ………………………........... Go to Question 6a
Representative of a campaign group…………………………………………..……….. Go to Question 6a Other (please specify): …………………………………………………………………….…... Go to Question 7
Event Date Location Event time
1 Thu, 26-Sep Paddington Recreation Ground – Randolph Ave, Maida Vale, London, W9 1PD 3-7pm
2 Mon, 30-Sep Hinde Street Methodist Church – 19 Thayer Street, London, W1U 2QJ 3:30-7:30pm
3 Mon, 07-Oct Church Street Library –67-69 Church Street, London, NW8 8EU 2-6pm
4 Wed, 16-Oct Seven Dials Club & Covent Garden Community Centre – 42 Earlham Street,
WC2H 9LA
1-5pm
5 Mon, 21-Oct St Judes’ Community Hall – 69 Illbert Street, London, W10 4QJ 2:15-6:15pm
6 Tue, 05-Nov Rembrandt Hotel – 11 Thurloe Place, Knightsbridge, SW7 2RS 3-7pm
7 Mon, 11-Nov Abbey Centre – 34 Great Smith St, London, SW1P 3BU 3-7pm
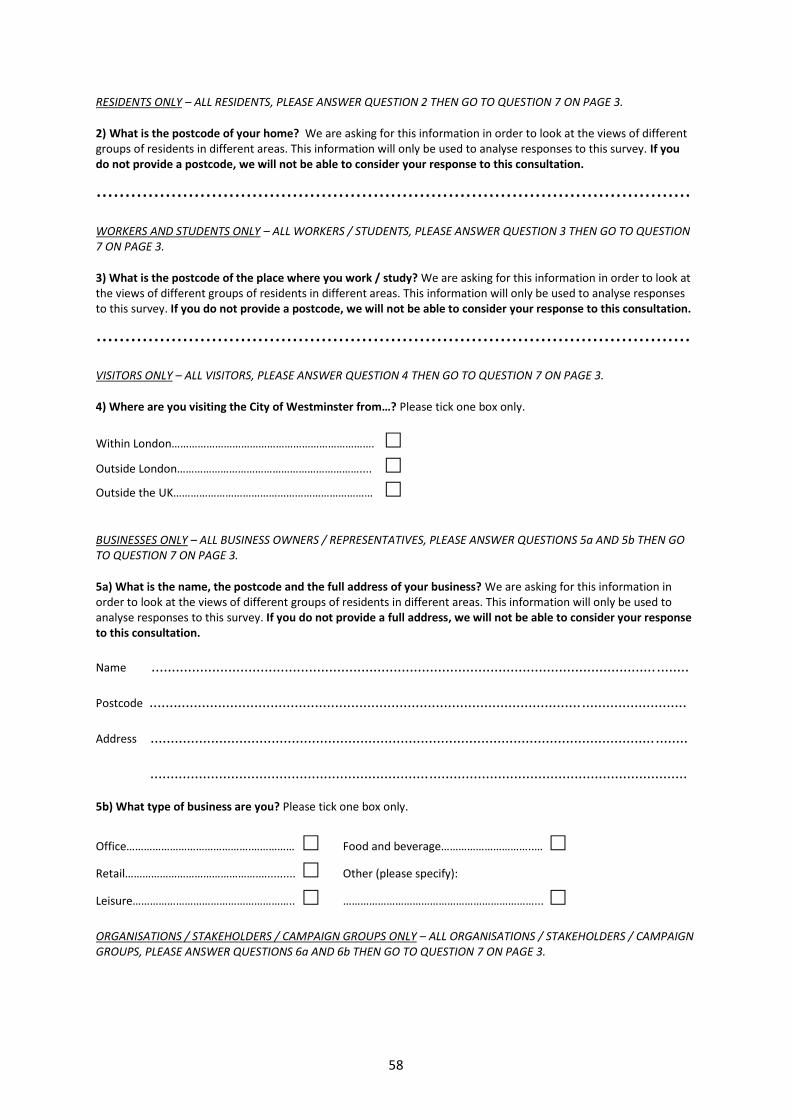
58
RESIDENTS ONLY – ALL RESIDENTS, PLEASE ANSWER QUESTION 2 THEN GO TO QUESTION 7 ON PAGE 3.
2) What is the postcode of your home? We are asking for this information in order to look at the views of different groups of residents in different areas. This information will only be used to analyse responses to this survey. If you do not provide a postcode, we will not be able to consider your response to this consultation.
.......................................................................................................
WORKERS AND STUDENTS ONLY – ALL WORKERS / STUDENTS, PLEASE ANSWER QUESTION 3 THEN GO TO QUESTION 7 ON PAGE 3.
3) What is the postcode of the place where you work / study? We are asking for this information in order to look at the views of different groups of residents in different areas. This information will only be used to analyse responses to this survey. If you do not provide a postcode, we will not be able to consider your response to this consultation.
.......................................................................................................
VISITORS ONLY – ALL VISITORS, PLEASE ANSWER QUESTION 4 THEN GO TO QUESTION 7 ON PAGE 3.
4) Where are you visiting the City of Westminster from…? Please tick one box only.
Within London…………………………………………………………….
Outside London………………………………………………………....
Outside the UK……………………………………………………………
BUSINESSES ONLY – ALL BUSINESS OWNERS / REPRESENTATIVES, PLEASE ANSWER QUESTIONS 5a AND 5b THEN GO TO QUESTION 7 ON PAGE 3.
5a) What is the name, the postcode and the full address of your business? We are asking for this information in order to look at the views of different groups of residents in different areas. This information will only be used to analyse responses to this survey. If you do not provide a full address, we will not be able to consider your response to this consultation.
Name .....................................................................................................................................
Postcode .....................................................................................................................................
Address .....................................................................................................................................
.....................................................................................................................................
5b) What type of business are you? Please tick one box only.
Office…………………………………….…………… Food and beverage…………………………..…
Retail……………………………………….…......... Other (please specify):
Leisure……………………………………………….. …………………………………………………………...
ORGANISATIONS / STAKEHOLDERS / CAMPAIGN GROUPS ONLY – ALL ORGANISATIONS / STAKEHOLDERS / CAMPAIGN GROUPS, PLEASE ANSWER QUESTIONS 6a AND 6b THEN GO TO QUESTION 7 ON PAGE 3.
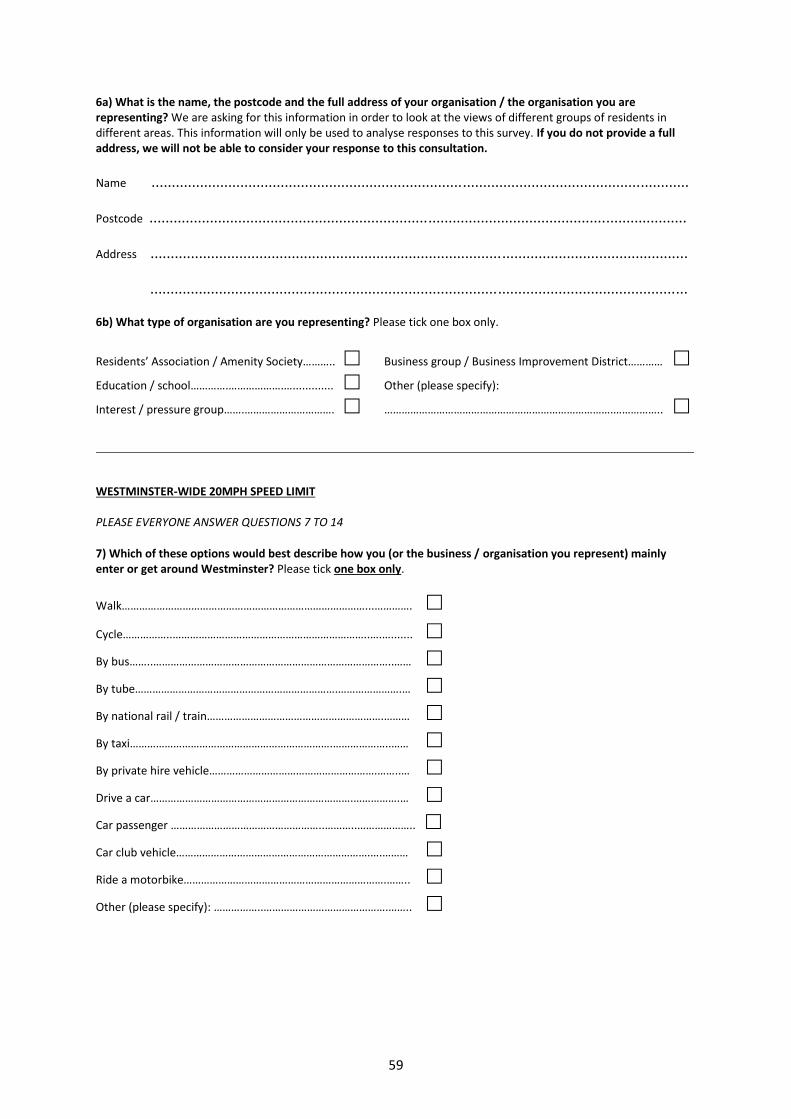
59
6a) What is the name, the postcode and the full address of your organisation / the organisation you are representing? We are asking for this information in order to look at the views of different groups of residents in different areas. This information will only be used to analyse responses to this survey. If you do not provide a full address, we will not be able to consider your response to this consultation.
Name .....................................................................................................................................
Postcode .....................................................................................................................................
Address .....................................................................................................................................
.....................................................................................................................................
6b) What type of organisation are you representing? Please tick one box only.
Residents’ Association / Amenity Society……….. Business group / Business Improvement District………… Education / school………….……………….…............. Other (please specify):
Interest / pressure group…….…………………………. …………………………………………………………………….……………..
WESTMINSTER-WIDE 20MPH SPEED LIMIT PLEASE EVERYONE ANSWER QUESTIONS 7 TO 14
7) Which of these options would best describe how you (or the business / organisation you represent) mainly enter or get around Westminster? Please tick one box only.
Walk…………………………………………………………………………...………….
Cycle……………..…………………………………………………………..….….......
By bus……..………………………………………………………………………..……
By tube…………………………………………………………….………………….…
By national rail / train…………………………………………………….………
By taxi…………………………………………………………….………………..……
By private hire vehicle………………………………………………….……..…
Drive a car…………………………………………………………….…………….…
Car passenger ……………………………………………..………..………………..
Car club vehicle………………………………………………………….….………
Ride a motorbike…………………………………………………………….……..
Other (please specify): ……………..…………………………………….……..
60
8) And, which other sorts of transports have you used to enter or get around Westminster in the last few months? Please select as many as apply.
Walk………………………………………………………………. By private hire vehicle.…………………………………................ Cycle……………..……………………………………………….. Drive a car………………………………………………...………………… By bus……..…………………………………………………….. Car passenger …………….………………………………………….... By tube…………………………………………………………... Car club vehicle……………………………….….………………………. By national rail / train…………………………………….. Ride a motorbike…………………………………………………………. By taxi…………………………………………………..………… Other (please specify):..……………………………………………....
9) To what extent do you support or oppose the Council's plan to implement a 20mph speed limit across the City of Westminster? Please tick one box only.
Strongly support……………………………………………………….
Tend to support……………..…………………………..….…........
Neither support nor oppose……..……………………………… Tend to oppose…………………………………………..………….… Strongly oppose…………………………………….………….……… Don’t know…………………………………………………………..……
10) Please explain in summary why you support or oppose the proposals to implement a 20mph speed limit across the City of Westminster.
.......................................................................................................
.......................................................................................................
.......................................................................................................
.......................................................................................................
.......................................................................................................
11) Which, if any, of the following issues are most important to you when thinking about your views on the proposed scheme? Please tick as many as apply.
Impact on my home…………………………….…………. Vehicular speeds……………………………….…………................
Impact on my business…………………………………... Vehicular noise………………………………….………………………..
Impact on my journeys…………………………………… Access to / from the area………………….………………………..
Safety of pedestrians………………………………….….. Quality of the street environment……………………………..
Safety of cyclists…………………………………………….. Air quality………………………………………………..………………..
Safety of motorcyclists / mopeds……………..……. Don’t know………………………………………….…….……………….. Safety of drivers (e.g., cars, HGV)……………………. Other (please specify):
Traffic congestion…………………………………………... ……………………………………………………………….……................
61
12) To what extent do you agree or disagree that the introduction of a 20mph Westminster-wide speed limit would… Please tick one box per row.
Strongly agree
Tend to agree
Neither agree nor disagree
Tend to disagree
Strongly disagree
Don’t know
Reduce the number of collisions on the road or the severity of those involved in collisions
Reduce car use by encouraging alternative forms of transport such as walking and cycling
Improve air quality
Reduce noise levels
Improve overall health and wellbeing of all
13) For journeys within the City of Westminster, would the proposed 20mph limit make you more or less likely to… Please tick one box per row.
Much more likely
Somewhat more likely
Neither more nor less likely
Somewhat less likely
Much less likely
Don’t know
Walk
Cycle
Use public transport
Use a car
Use a motorcycle or moped
Use taxis
Use private hire vehicles
Use car club vehicles
14) Do you have any other comments you would like to make about the proposed Westminster-wide 20mph speed limit? Please tick one box only.
Yes………………… No………….........
62
IF YOU WISH TO MAKE FURTHER COMMENTS, PLEASE ANSWER QUESTIONS 15 AND 16.
15) Which, if any, of the following areas do you wish to comment on? Please tick as many as apply.
Impact on my home……………………………………..…. Vehicular speeds……………………………….…............
Impact on my business……………………………………. Vehicular noise………………………………….…………….
Impact on my journeys………………………………...… Access to / from the area………………….…………....
Safety of pedestrians………………………….…………... Quality of the street environment…………...........
Safety of cyclists……………………………………………... Air quality………………………………………………………..
Safety of motorcyclists / mopeds …………………… Don’t know……………………………………….……………..
Traffic congestion…………………………………........... Other (please specify): ……………………..…….........
16) Please write your comments below.
.......................................................................................................
.......................................................................................................
.......................................................................................................
.......................................................................................................
.......................................................................................................
City for All – Healthier and Greener City What could a healthier and greener Westminster look like?
The Westminster-wide 20mph proposal is just one part of the council’s drive to create a healthier and greener Westminster, which also includes campaigns to tackle air pollution and engine idling, improve air quality around schools, create low emissions neighbourhoods, improve energy efficiency, enhance green space and much more. Below is your chance to tell us what you think is important.
PLEASE EVERYONE ANSWER QUESTIONS 17 TO 20
17) Which of these areas do you feel that the Council should prioritise? Please select the THREE that you consider most important.
Improving facilities for cycling………………………………………………………………..…………………………….….
Improving facilities for walking…………………………………………………………………..…………………………… Increasing recycling rates and reducing waste.……………………………………………………..………….……..
Improving air quality around the City and cutting down harmful emissions.……………………….….. Addressing noise pollution.………………………………………………………………………………………………..…...
Increasing access to open spaces and sport facilities………………………..…………………………………….. Protecting and increasing green space…………………………………..………………………………………………..
Improving infrastructure for electric vehicles……………………………………………………………..…………… Reducing the number of Heavy Goods Vehicles and/or Light Goods Vehicles on roads…….……..
Other (please specify): …………………………………………………………………………………………….……..……...
63
18) What do you think is vital for the council to consider when devising a Healthier and Greener City for All? Please mention actions / ways in which the council could reach its goal of creating a cleaner, greener and healthier environment for everyone.
.......................................................................................................
.......................................................................................................
.......................................................................................................
.......................................................................................................
.......................................................................................................
19) Have you heard about any of these Westminster Council’s campaigns/strategies? Please tick as many as apply.
Schools Clean Air Fund – £1m of funding over four years to help Westminster’s primary schools tackle air pollution
ActiveStreets – Initiative to encourage physical activity and improve air quality by enabling communities to reclaim their streets through different types of road closures (i.e., Play Streets, School Streets)
#Don’tBeIdle – Campaign to stop engine idling which has seen over 14,000 people pledge to turn off their engines while stationary
Open space and biodiversity strategy – Plan to protect, promote and enhance Westminster’s green spaces and diverse wildlife
Street Waste Action Team – Team that visits local areas across the City to help residents dispose of rubbish and recycling correctly
Marylebone Low Emissions Neighbourhood – Partnership project to improve public realm and trial schemes to increase green space and improve conditions for pedestrians and cyclists
None of these
20) What do you think would be the most useful ways to promote those strategies or campaigns to you? Please tick up to THREE options.
Facebook………………………………………………………. Street / tube / bus advertising………………………………..…. Twitter…………………………………………………………... Local / Westminster council led event………………………..
Instagram……………………………………………….……… Westminster Reporter (council’s flagship publication)..
National television broadcast…………………….….. Families First e-newsletter………………………………………....
London / local television news broadcast…….… Westminster Plus………..…………………….………………….…….
National radio……………………………………………….. MyWestminster e-newsletter..………….……………….……….
London / local radio…………………………………...... Active Westminster website..………………………...…………... National newspapers / magazines…………..……... Don’t know……....…………….……………………….……………..…. London / local newspapers / magazines………... Other (please specify):
Leaflets or brochures………………………………….…... …………………………………………..………………..………………………
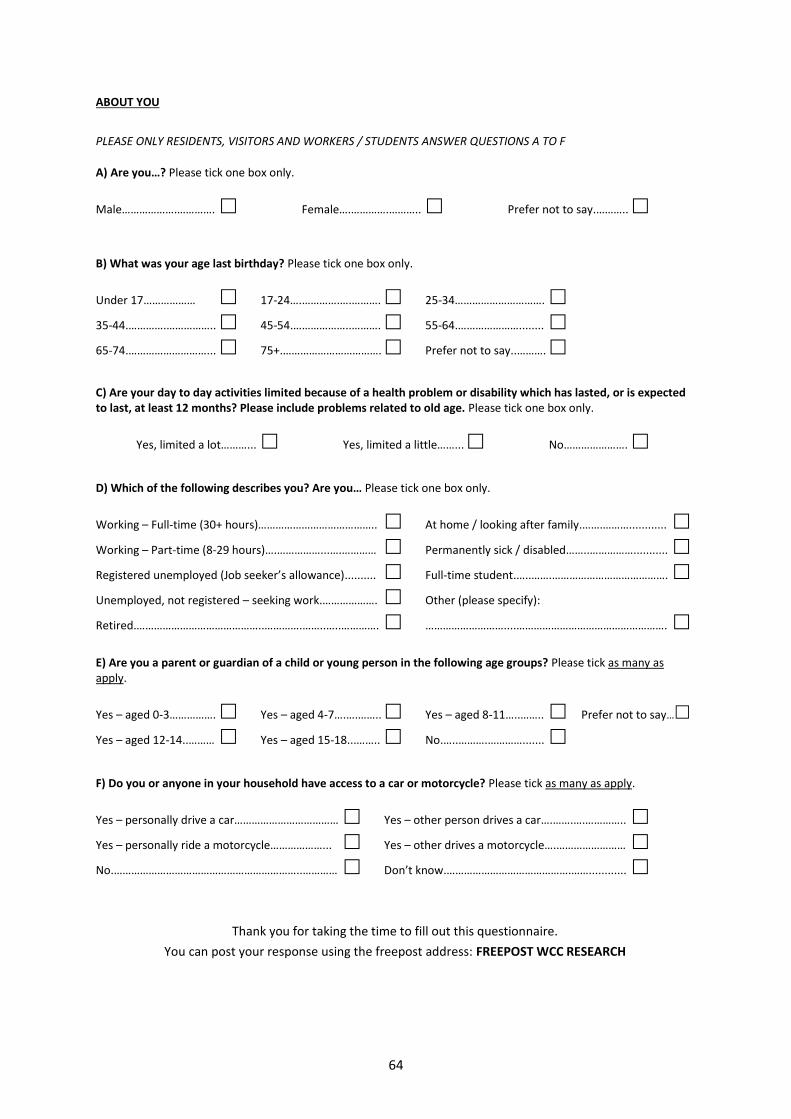
64
ABOUT YOU
PLEASE ONLY RESIDENTS, VISITORS AND WORKERS / STUDENTS ANSWER QUESTIONS A TO F
A) Are you…? Please tick one box only.
Male……………….…………. Female….………….……….. Prefer not to say.………..
B) What was your age last birthday? Please tick one box only.
Under 17……………… 17-24….………….….………. 25-34…………………………. 35-44.………….…………….. 45-54.………………..………. 55-64.…………………........ 65-74.………………………... 75+.……………………………. Prefer not to say..……….
C) Are your day to day activities limited because of a health problem or disability which has lasted, or is expected to last, at least 12 months? Please include problems related to old age. Please tick one box only.
Yes, limited a lot………... Yes, limited a little……... No………………….
D) Which of the following describes you? Are you… Please tick one box only.
Working – Full-time (30+ hours)………………………………….. At home / looking after family.…….………............ Working – Part-time (8-29 hours)….……………...….………… Permanently sick / disabled……..……………........... Registered unemployed (Job seeker’s allowance).......... Full-time student.…..…….…………………………………. Unemployed, not registered – seeking work.………………. Other (please specify): Retired.……………………………………..………….……..…..…………. ………………………....…………………………………………….
E) Are you a parent or guardian of a child or young person in the following age groups? Please tick as many as apply.
Yes – aged 0-3……………. Yes – aged 4-7….….…….. Yes – aged 8-11…..…….. Prefer not to say… Yes – aged 12-14..……… Yes – aged 15-18...…….. No.…..……….………….......
F) Do you or anyone in your household have access to a car or motorcycle? Please tick as many as apply.
Yes – personally drive a car……………………………… Yes – other person drives a car….…….….………….. Yes – personally ride a motorcycle………………... Yes – other drives a motorcycle….…………………… No.………………………………………………………..………… Don’t know.…………………………………….……............
Thank you for taking the time to fill out this questionnaire.
You can post your response using the freepost address: FREEPOST WCC RESEARCH
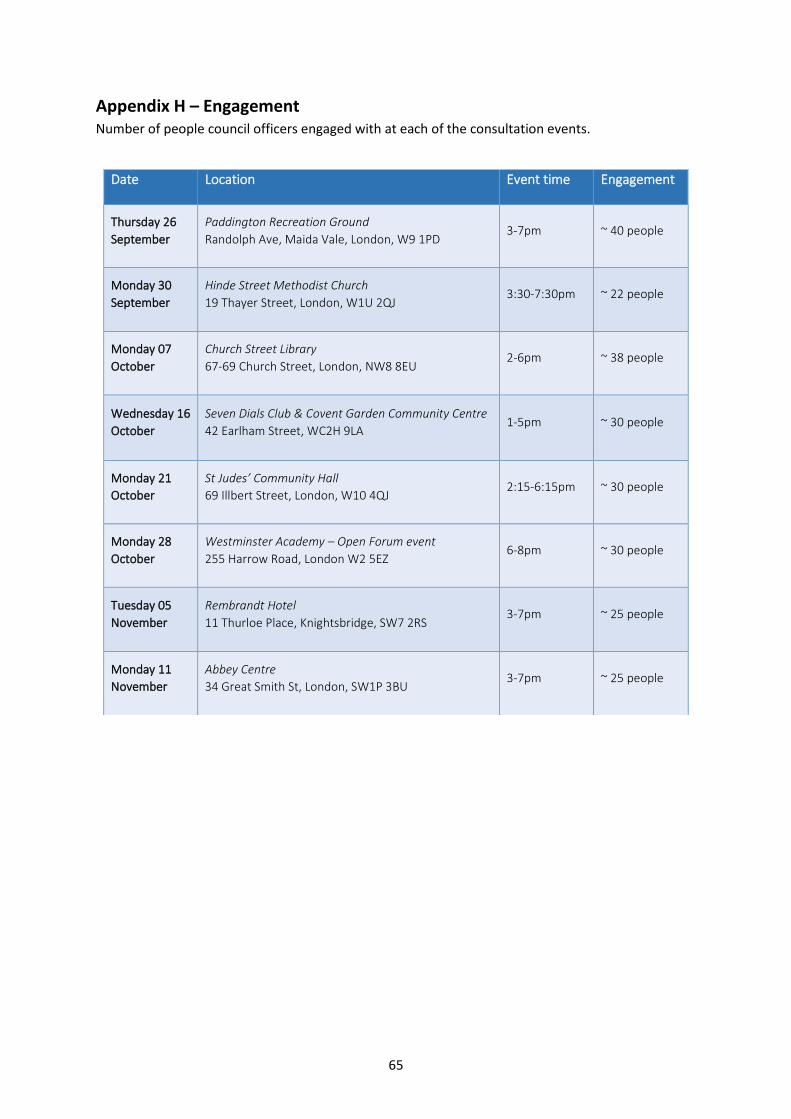
65
Appendix H – Engagement Number of people council officers engaged with at each of the consultation events.
Date Location Event time Engagement
Thursday 26
September
Paddington Recreation Ground
Randolph Ave, Maida Vale, London, W9 1PD 3-7pm ~ 40 people
Monday 30
September
Hinde Street Methodist Church
19 Thayer Street, London, W1U 2QJ 3:30-7:30pm ~ 22 people
Monday 07
October
Church Street Library
67-69 Church Street, London, NW8 8EU 2-6pm ~ 38 people
Wednesday 16
October
Seven Dials Club & Covent Garden Community Centre
42 Earlham Street, WC2H 9LA 1-5pm ~ 30 people
Monday 21
October
St Judes’ Community Hall
69 Illbert Street, London, W10 4QJ 2:15-6:15pm ~ 30 people
Monday 28
October
Westminster Academy – Open Forum event
255 Harrow Road, London W2 5EZ 6-8pm ~ 30 people
Tuesday 05
November
Rembrandt Hotel
11 Thurloe Place, Knightsbridge, SW7 2RS 3-7pm ~ 25 people
Monday 11
November
Abbey Centre
34 Great Smith St, London, SW1P 3BU 3-7pm ~ 25 people
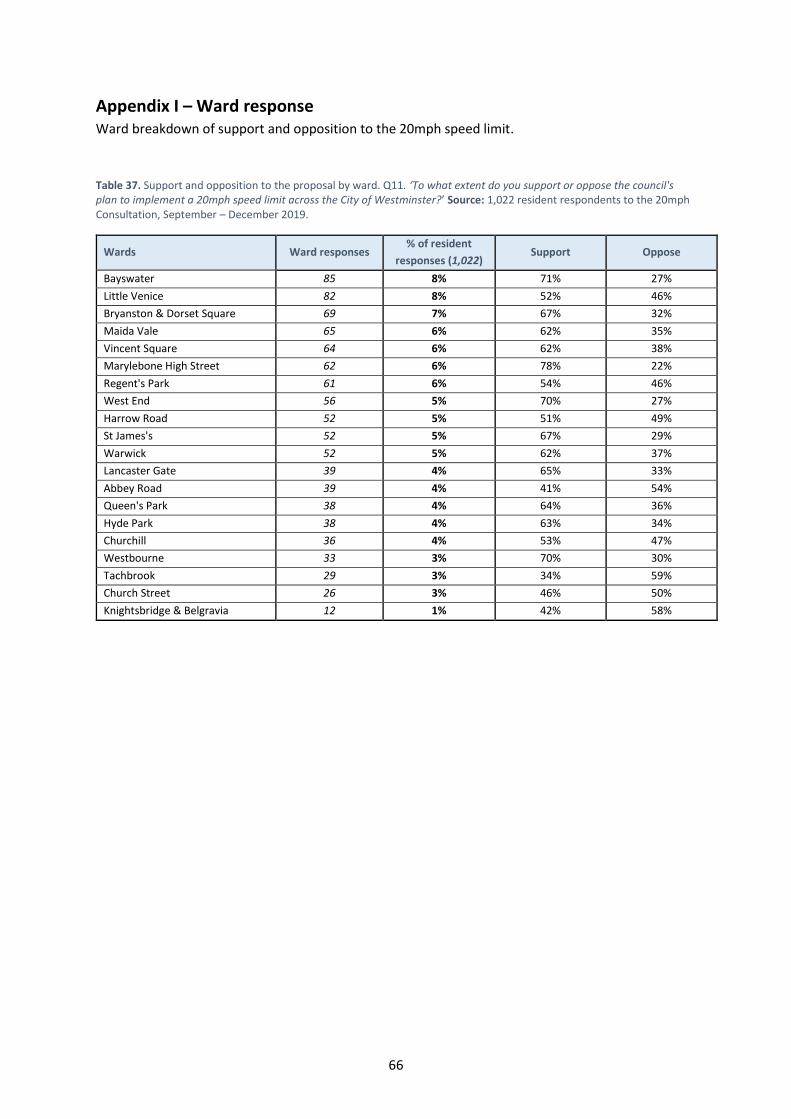
66
Appendix I – Ward response Ward breakdown of support and opposition to the 20mph speed limit.
Table 37. Support and opposition to the proposal by ward. Q11. ‘To what extent do you support or oppose the council's plan to implement a 20mph speed limit across the City of Westminster?’ Source: 1,022 resident respondents to the 20mph Consultation, September – December 2019.
Wards Ward responses % of resident
responses (1,022) Support Oppose
Bayswater 85 8% 71% 27%
Little Venice 82 8% 52% 46%
Bryanston & Dorset Square 69 7% 67% 32%
Maida Vale 65 6% 62% 35%
Vincent Square 64 6% 62% 38%
Marylebone High Street 62 6% 78% 22%
Regent's Park 61 6% 54% 46%
West End 56 5% 70% 27%
Harrow Road 52 5% 51% 49%
St James's 52 5% 67% 29%
Warwick 52 5% 62% 37%
Lancaster Gate 39 4% 65% 33%
Abbey Road 39 4% 41% 54%
Queen's Park 38 4% 64% 36%
Hyde Park 38 4% 63% 34%
Churchill 36 4% 53% 47%
Westbourne 33 3% 70% 30%
Tachbrook 29 3% 34% 59%
Church Street 26 3% 46% 50%
Knightsbridge & Belgravia 12 1% 42% 58%