204/11 - rohde & schwarz · 204/11. news. published by rohde & schwarz gmbh&co. kg...
TRANSCRIPT

New analyzers redefine the state of the art in signal and spectrum analysis
Oscilloscopes with digital chan-nels test complex embedded systems
Individually expandable radio-monitoring solution with PC-based signal analysis
With unique efficiency and market-leading power density, a new transmitter generation significantly reduces the energy and infrastruc-ture costs of broadcast networks.
Highly efficient transmitter networks
GENERAL PURPOSE GENERAL PURPOSE RADIOMONITORING / RADIOLOCATION
NEWS 204/11
NEWS
Published by Rohde & Schwarz GmbH&Co. KG Mühldorfstrasse 15 · 81671 München
Customer Support Europe, Africa, Middle East | +49 89 4129 123 45 [email protected] North America | 1 888 837 87 72 (1 888 TEST RSA) [email protected] Latin America | +1 410 910 79 88 [email protected] Asia/Pacific | +65 65 13 04 88 [email protected] www.rohde-schwarz.com Editor and layout: Redaktion Drexl&Knobloch GmbH (German) English translation: Dept. 5MC7 Photos: Rohde & Schwarz Printed in Germany Volume 51 Circulation (German, English, French, Spanish and Japanese) 75000 approx. three times a year ISSN 0028-9108 Supply free of charge through your nearest Rohde & Schwarz representative Reproduction of extracts permitted if source is stated and copy sent to Rohde & Schwarz München. PD 5214.3798.72
R&S® is a registered trademark of Rohde & Schwarz GmbH&Co. KG. Trade names are trademarks of the owners. CDMA2000® is a registered trademark of the Telecommunica-tions Industry Association (TIA-USA). The Bluetooth® word mark and logos are reg-istered trademarks owned by Bluetooth SIG, Inc. and any use of such marks by Rohde & Schwarz is under license. “WiMAX Forum“ is a registered trademark of the WiMAX Forum. “WiMAX,“ the WiMAX Forum logo, “WiMAX Forum Certified,“ and the WiMAX Forum Certified logo are trademarks of the WiMAX Forum. All other trademarks are the properties of their respective owners.
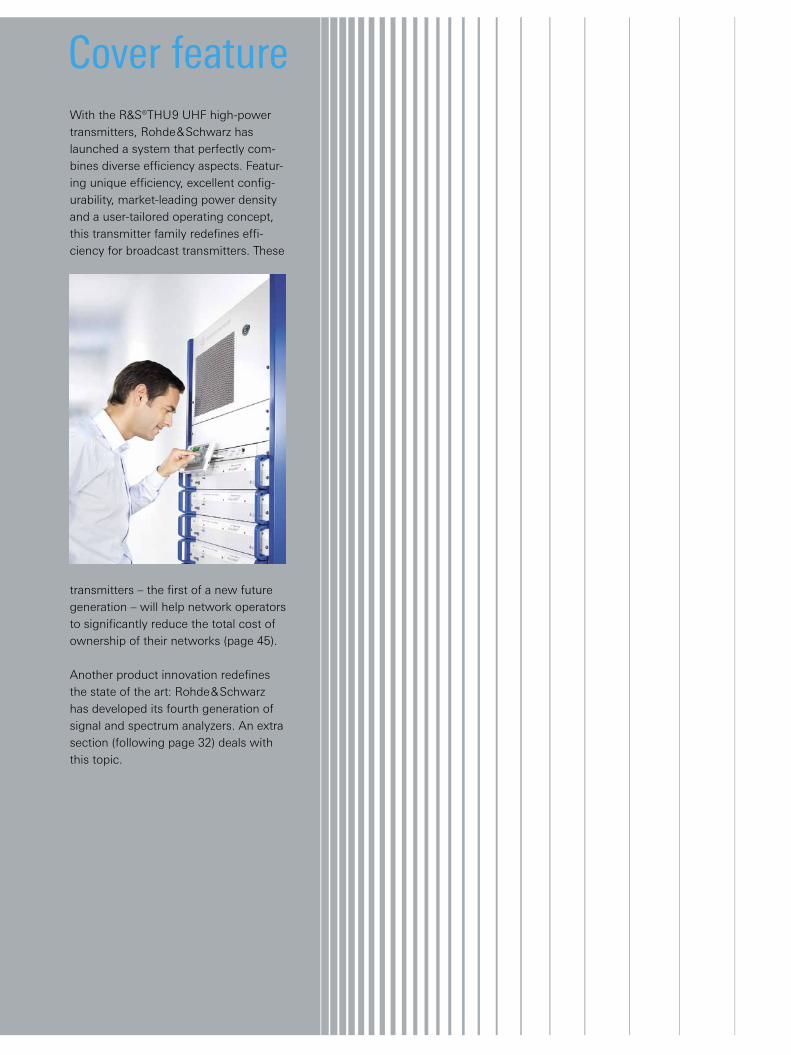
With the R&S®THU9 UHF high-power transmitters, Rohde&Schwarz has launched a system that perfectly com-bines diverse efficiency aspects. Featur-ing unique efficiency, excellent config-urability, market-leading power density and a user-tailored operating concept, this transmitter family redefines effi-ciency for broadcast transmitters. These
transmitters – the first of a new future generation – will help network operators to significantly reduce the total cost of ownership of their networks (page 45).
Another product innovation redefines the state of the art: Rohde&Schwarz has developed its fourth generation of signal and spectrum analyzers. An extra section (following page 32) deals with this topic.
Cover feature
4
TestersW R&S®CMW270 / R&S®CMW500WLAN signaling .........................page 6
Test methodsThe faster way to production for LTE and LTE-Advanced modules ...... page 9
Signal generatorsW K84 optionContinuing in the direction of LTE-Advanced: the latest test signals for LTE Rel. 9 ............................page 12
W R&S®SMU200A / R&S®SMBV100AIEEE 802.11ac standard: WLANs break through the Gigabit barrier ...........................page 16
OscilloscopesW R&S®RTOUsing R&S®RTO oscilloscopes with digital channels to test complex embedded systems ..................page 18
Power meters / voltmetersW R&S®NRPV virtual power meterUSB power sensors on the PC: easy to use – even witout a base unit ................................page 22
Data recorderW R&S®IQR I/Q data recorderI/Q recorder brings real radio scenarios cost-efficiently into the lab ................................page 26
Signal generatorsW R&S®SMB100A signal generatorMicrowave in a compact package: R&S®SMB100A generators up to 40 GHz ............................page 30
W R&S®SMBV100A vector signal generatorRF generator for all mobile radio standards plus GPS, Galileo and GLONASS ..........................page 33
W R&S®SMZ frequency multiplier
Frequency multiplier family up to 110 GHz with built-in attenuator .....................page 36
W R&S®SGS100A RF sourceIn brief ......................................page 38
Spectrum / signal analyzers W R&S®FSW
New signal and spectrum analyzers ........ extra section following page 32
From RF to microwave: Featuring two new
options, the R&S®SMB100A analog signal
generators can now generate frequencies
up to 20 GHz or 40 GHz (page 30).
WIRELESS TECHNOLOGIES GENERAL PURPOSE
OverviewNEWS 204/11
Test systemsW R&S®TS-EMF portable system
TV transmittersW R&S®THU9 UHF high-power transmittersA new high-power transmitterfamily conquers the market ......................................page 45
Broadcast monitoring systemsW R&S®DVMS1 and R&S®DVMS4 digital TV monitoring systemsFor perfect monitoring of DVB-T2 networks ......................page 53
Reference
COMINT systemsW R&S®GX435 multichannel signal analysis solution
W Masthead .............................. page 2 W Newsgrams ..........................page 62
EMF measurements on LTE signals ...........................page 39
Spectrum / signal analyzersW R&S®FSVR real-time spectrum analyzerRealtime spectrum analysis provides new insights for EMC diagnosis .........................page 42
Top-flight radio: communications systems for Cairo Airport’s control tower ....page 56
Individually expandable radiomonitoring solution with PC-based signal analysis ..........page 58
BROADCASTINGEMC / FIELD STRENGTH RADIOMONITORING / RADIOLOCATION
SECURE COMMUNICATIONS MISCELLANEOUS
NEWS 204 /11 5
6
WLAN signaling with the R&S®CMW270 and R&S®CMW500 testersJust as with other kinds of mobile radio devices, many characteristics of WLAN user equipment need
to be tested under realistic operating conditions. Using new software options, the R&S®CMW270 and
R&S®CMW500 testers running in signaling mode can emulate WLANs realistically and conduct transmitter,
receiver and other tests in addition to functional and performance measurements.
Reproducible measurements are essential to objective assessment of user equipmentHigh-end WLAN routers or access points that offer a wide variety of configuration options are commonly used to per-form functional tests on WLAN user equipment (referred to as devices under test or DUTs). Known as “golden devices”, these routers and access points are often less than ideal because as their transmitter characteristics are specified either imprecisely or not at all and they often cannot be con-figured to the extent required. They can also have a substan-tial effect on signal quality and therefore on test and mea-surement results if their technical parameters drift with temperature changes or over time.
Only professional test and measurement equipment can pro-vide the right conditions for achieving reliable results. Testers such as the R&S®CMW270 and the R&S®CMW500 allow the test conditions to be tailored individually wherever and when-ever required so as to deliver the kind of reproducible results that are essential to objective performance comparisons between different user equipment.
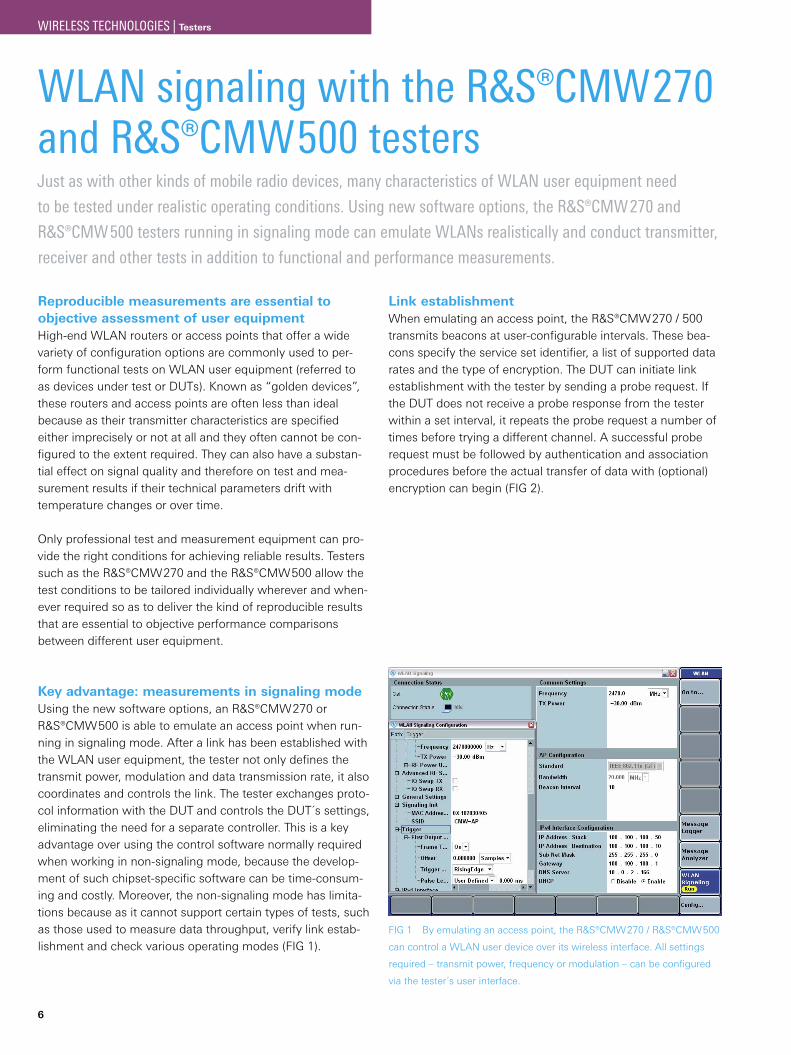
Key advantage: measurements in signaling modeUsing the new software options, an R&S®CMW270 or R&S®CMW500 is able to emulate an access point when run-ning in signaling mode. After a link has been established with the WLAN user equipment, the tester not only defines the transmit power, modulation and data transmission rate, it also coordinates and controls the link. The tester exchanges proto-col information with the DUT and controls the DUT´s settings, eliminating the need for a separate controller. This is a key advantage over using the control software normally required when working in non-signaling mode, because the develop-ment of such chipset-specific software can be time-consum-ing and costly. Moreover, the non-signaling mode has limita-tions because as it cannot support certain types of tests, such as those used to measure data throughput, verify link estab-lishment and check various operating modes (FIG 1).
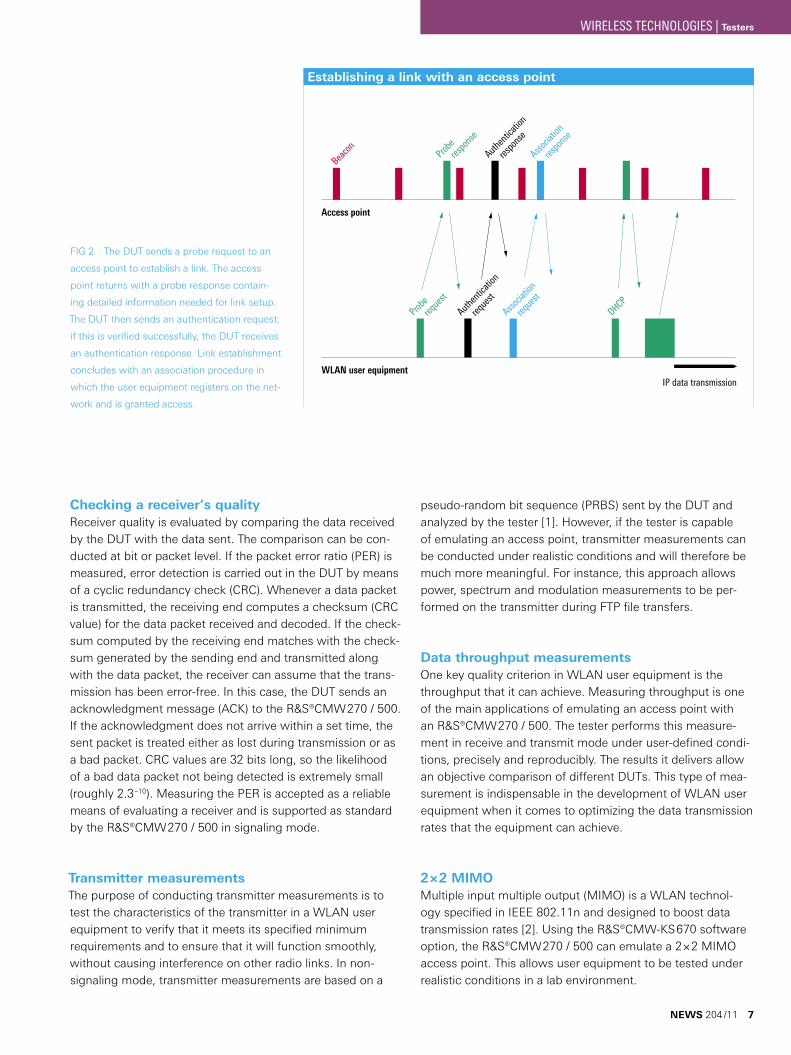
Link establishmentWhen emulating an access point, the R&S®CMW270 / 500 transmits beacons at user-configurable intervals. These bea-cons specify the service set identifier, a list of supported data rates and the type of encryption. The DUT can initiate link establishment with the tester by sending a probe request. If the DUT does not receive a probe response from the tester within a set interval, it repeats the probe request a number of times before trying a different channel. A successful probe request must be followed by authentication and association procedures before the actual transfer of data with (optional) encryption can begin (FIG 2).
FIG 1 By emulating an access point, the R&S®CMW270 / R&S®CMW500
can control a WLAN user device over its wireless interface. All settings
required – transmit power, frequency or modulation – can be configured
via the tester´s user interface.
WIRELESS TECHNOLOGIES | Testers
Establishing a link with an access point
Access point
WLAN user equipment
Beaco
nProb
e
res
pons
e
Authen
ticati
on
res
pons
e
Probe
req
uest
IP data transmission
DHCP
Associa
tion
res
pons
e
Authen
ticati
on
req
uest
Associa
tion
req
uest
Checking a receiver’s qualityReceiver quality is evaluated by comparing the data received by the DUT with the data sent. The comparison can be con-ducted at bit or packet level. If the packet error ratio (PER) is measured, error detection is carried out in the DUT by means of a cyclic redundancy check (CRC). Whenever a data packet is transmitted, the receiving end computes a checksum (CRC value) for the data packet received and decoded. If the check-sum computed by the receiving end matches with the check-sum generated by the sending end and transmitted along with the data packet, the receiver can assume that the trans-mission has been error-free. In this case, the DUT sends an acknowledgment message (ACK) to the R&S®CMW270 / 500. If the acknowledgment does not arrive within a set time, the sent packet is treated either as lost during transmission or as a bad packet. CRC values are 32 bits long, so the likelihood of a bad data packet not being detected is extremely small (roughly 2.3–10). Measuring the PER is accepted as a reliable means of evaluating a receiver and is supported as standard by the R&S®CMW270 / 500 in signaling mode.
Transmitter measurementsThe purpose of conducting transmitter measurements is to test the characteristics of the transmitter in a WLAN user equipment to verify that it meets its specified minimum requirements and to ensure that it will function smoothly, without causing interference on other radio links. In non-signaling mode, transmitter measurements are based on a
FIG 2 The DUT sends a probe request to an
access point to establish a link. The access
point returns with a probe response contain-
ing detailed information needed for link setup.
The DUT then sends an authentication request;
if this is verified successfully, the DUT receives
an authentication response. Link establishment
concludes with an association procedure in
which the user equipment registers on the net-
work and is granted access.
pseudo-random bit sequence (PRBS) sent by the DUT and analyzed by the tester [1]. However, if the tester is capable of emulating an access point, transmitter measurements can be conducted under realistic conditions and will therefore be much more meaningful. For instance, this approach allows power, spectrum and modulation measurements to be per-formed on the transmitter during FTP file transfers.
Data throughput measurementsOne key quality criterion in WLAN user equipment is the throughput that it can achieve. Measuring throughput is one of the main applications of emulating an access point with an R&S®CMW270 / 500. The tester performs this measure-ment in receive and transmit mode under user-defined condi-tions, precisely and reproducibly. The results it delivers allow an objective comparison of different DUTs. This type of mea-surement is indispensable in the development of WLAN user equipment when it comes to optimizing the data transmission rates that the equipment can achieve.
2×2 MIMOMultiple input multiple output (MIMO) is a WLAN technol-ogy specified in IEEE 802.11n and designed to boost data transmission rates [2]. Using the R&S®CMW-KS670 software option, the R&S®CMW270 / 500 can emulate a 2×2 MIMO access point. This allows user equipment to be tested under realistic conditions in a lab environment.
NEWS 204 /11 7
WIRELESS TECHNOLOGIES | Testers
Test setup
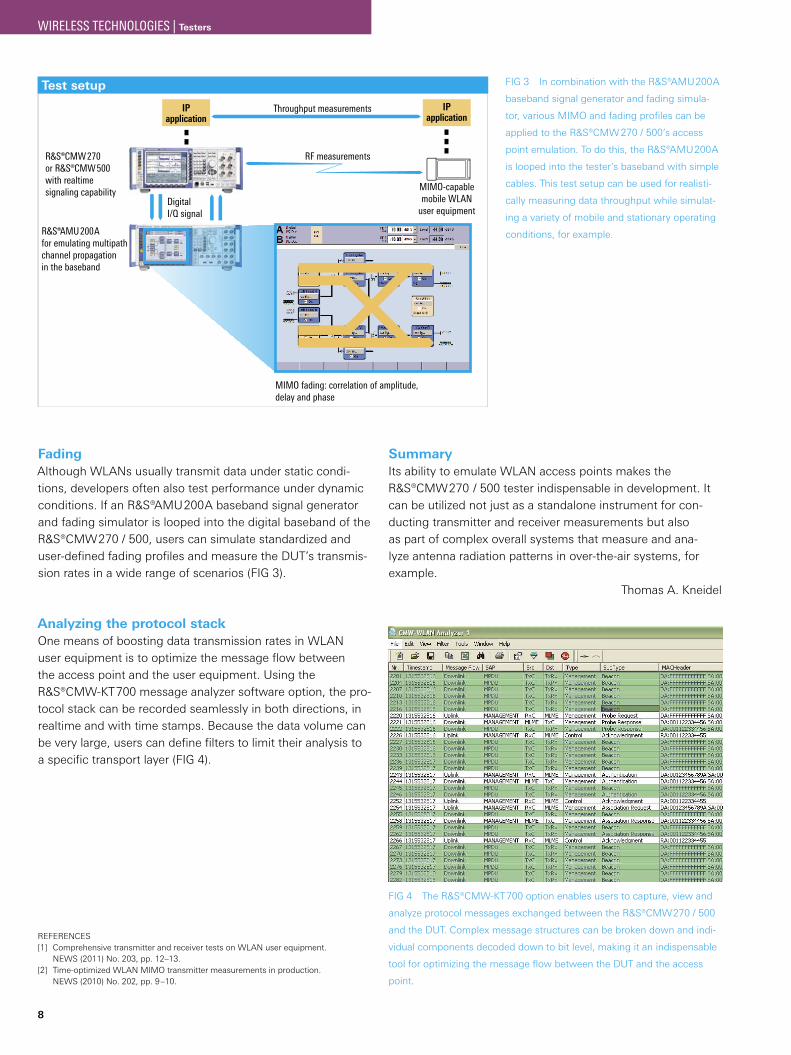
R&S®CMW270or R&S®CMW500 with realtimesignaling capability
RF measurements
Throughput measurements
MIMO fading: correlation of amplitude,delay and phase
R&S®AMU200A for emulating multipathchannel propagationin the baseband
DigitalI/Q signal
IPapplication
IPapplication
MIMO-capablemobile WLAN
user equipment
8
FadingAlthough WLANs usually transmit data under static condi-tions, developers often also test performance under dynamic conditions. If an R&S®AMU200A baseband signal generator and fading simulator is looped into the digital baseband of the R&S®CMW270 / 500, users can simulate standardized and user-defined fading profiles and measure the DUT’s transmis-sion rates in a wide range of scenarios (FIG 3).
Analyzing the protocol stackOne means of boosting data transmission rates in WLAN user equipment is to optimize the message flow between the access point and the user equipment. Using the R&S®CMW-KT700 message analyzer software option, the pro-tocol stack can be recorded seamlessly in both directions, in realtime and with time stamps. Because the data volume can be very large, users can define filters to limit their analysis to a specific transport layer (FIG 4).
FIG 4 The R&S®CMW-KT700 option enables users to capture, view and
analyze protocol messages exchanged between the R&S®CMW270 / 500
and the DUT. Complex message structures can be broken down and indi-
vidual components decoded down to bit level, making it an indispensable
tool for optimizing the message flow between the DUT and the access
point.
REFERENCES[1] Comprehensive transmitter and receiver tests on WLAN user equipment.
NEWS (2011) No. 203, pp. 12–13.[2] Time-optimized WLAN MIMO transmitter measurements in production.
NEWS (2010) No. 202, pp. 9–10.
FIG 3 In combination with the R&S®AMU200A
baseband signal generator and fading simula-
tor, various MIMO and fading profiles can be
applied to the R&S®CMW 270 / 500’s access
point emulation. To do this, the R&S®AMU200A
is looped into the tester’s baseband with simple
cables. This test setup can be used for realisti-
cally measuring data throughput while simulat-
ing a variety of mobile and stationary operating
conditions, for example.
SummaryIts ability to emulate WLAN access points makes the R&S®CMW270 / 500 tester indispensable in development. It can be utilized not just as a standalone instrument for con-ducting transmitter and receiver measurements but also as part of complex overall systems that measure and ana-lyze antenna radiation patterns in over-the-air systems, for example.
Thomas A. Kneidel
WIRELESS TECHNOLOGIES | Testers
Typical design flow
Time
Synopsys design and simulation tools
Rohde&Schwarz T&M instruments
Rohde&Schwarz T&M instruments
Specificatione.g. system on chip (SoC)
Digital signal processing, algorithm design
Emulation on an FPGA-based emulation platform
PrototypeSoC, board
Verification,test
Verification,test
Electronic system level design
Software simulation
Hardware simulation
Software development
Hardware development
The faster way to production for LTE and LTE-Advanced modulesModule design requires software tools to design the algorithms and T&M instruments to verify compliance
with specifications. In an effort to optimize the workflow between these two areas, Rohde&Schwarz has
developed a close collaboration with Synopsys, a leading provider of design tools. The result is a joint solu-
tion that successfully links the various stages in the design process: Test scenarios used for software-based
system simulation can now be reused without modification for hardware verification with signal generators.
Demanding design processModern mobile radio standards such as LTE or LTE-Advanced are significantly more complex than 2nd generation standards such as GSM. Not only are the physical transmission meth-ods different – OFDM and MIMO instead of single- carrier GMSK modulation, for example – the entire preprocessing stage for user data is much more demanding. This is a partic-ular challenge in the development of RF and baseband mod-ules. Accordingly, more emphasis is placed today on design verification at the various stages of the process.
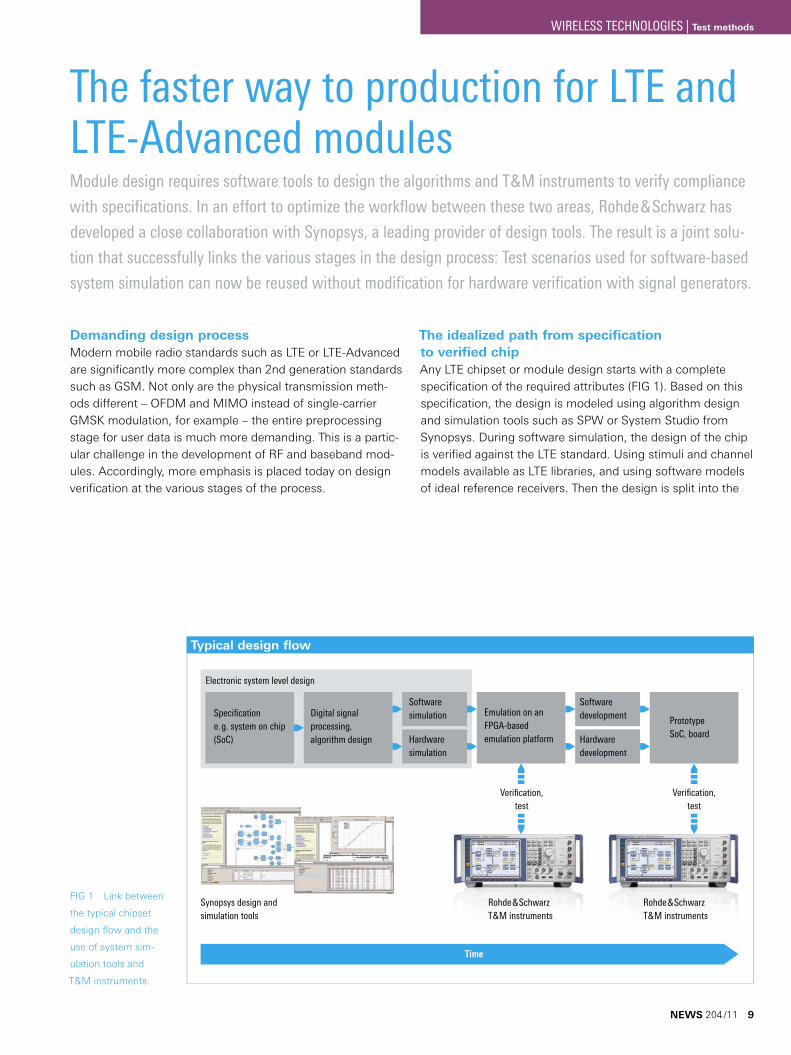
The idealized path from specification to verified chipAny LTE chipset or module design starts with a complete specification of the required attributes (FIG 1). Based on this specification, the design is modeled using algorithm design and simulation tools such as SPW or System Studio from Synopsys. During software simulation, the design of the chip is verified against the LTE standard. Using stimuli and channel models available as LTE libraries, and using software models of ideal reference receivers. Then the design is split into the
FIG 1 Link between
the typical chipset
design flow and the
use of system sim-
ulation tools and
T&M instruments.
NEWS 204 /11 9
WIRELESS TECHNOLOGIES | Test methods
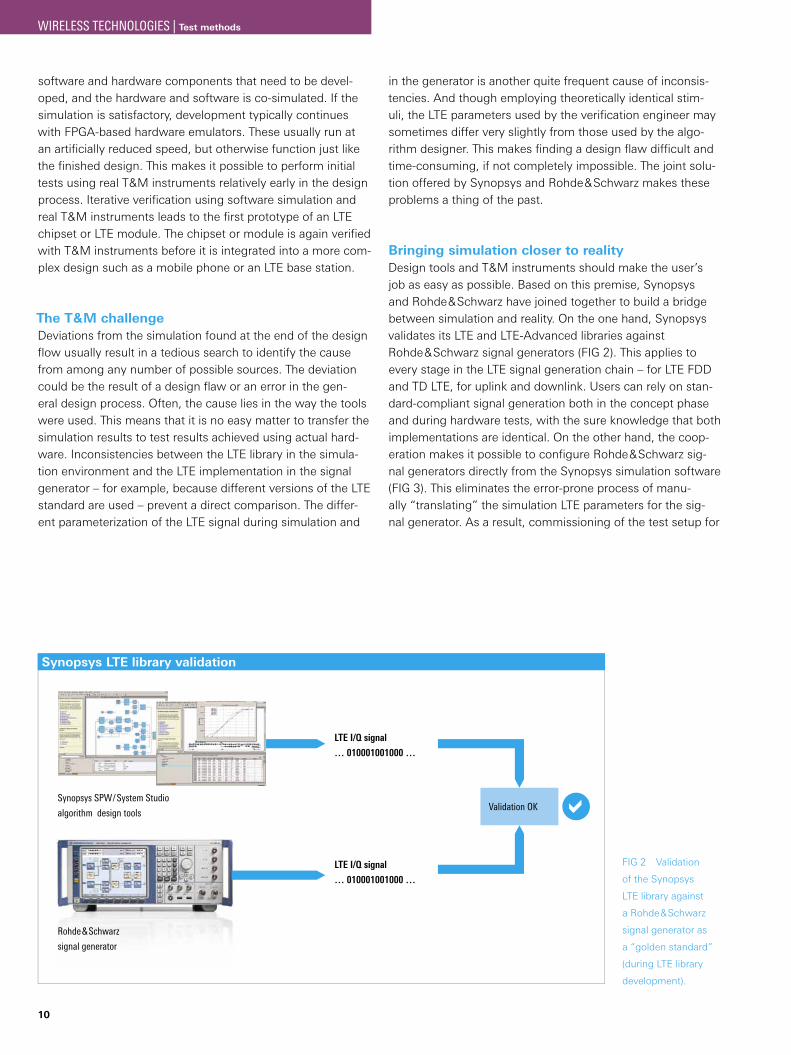
Synopsys LTE library validation
LTE I/Q signal
… 010001001000 …
Rohde&Schwarz
signal generator
Synopsys SPW/System Studio
algorithm design tools
LTE I/Q signal
… 010001001000 …
Validation OK
10
software and hardware components that need to be devel-oped, and the hardware and software is co-simulated. If the simulation is satisfactory, development typically continues with FPGA-based hardware emulators. These usually run at an artificially reduced speed, but otherwise function just like the finished design. This makes it possible to perform initial tests using real T&M instruments relatively early in the design process. Iterative verification using software simulation and real T&M instruments leads to the first prototype of an LTE chipset or LTE module. The chipset or module is again verified with T&M instruments before it is integrated into a more com-plex design such as a mobile phone or an LTE base station.
The T&M challengeDeviations from the simulation found at the end of the design flow usually result in a tedious search to identify the cause from among any number of possible sources. The deviation could be the result of a design flaw or an error in the gen-eral design process. Often, the cause lies in the way the tools were used. This means that it is no easy matter to transfer the simulation results to test results achieved using actual hard-ware. Inconsistencies between the LTE library in the simula-tion environment and the LTE implementation in the signal generator – for example, because different versions of the LTE standard are used – prevent a direct comparison. The differ-ent parameterization of the LTE signal during simulation and
FIG 2 Validation
of the Synopsys
LTE library against
a Rohde&Schwarz
signal generator as
a “golden standard”
(during LTE library
development).
in the generator is another quite frequent cause of inconsis-tencies. And though employing theoretically identical stim-uli, the LTE parameters used by the verification engineer may sometimes differ very slightly from those used by the algo-rithm designer. This makes finding a design flaw difficult and time-consuming, if not completely impossible. The joint solu-tion offered by Synopsys and Rohde&Schwarz makes these problems a thing of the past.
Bringing simulation closer to realityDesign tools and T&M instruments should make the user’s job as easy as possible. Based on this premise, Synopsys and Rohde&Schwarz have joined together to build a bridge between simulation and reality. On the one hand, Synopsys validates its LTE and LTE-Advanced libraries against Rohde&Schwarz signal generators (FIG 2). This applies to every stage in the LTE signal generation chain – for LTE FDD and TD LTE, for uplink and downlink. Users can rely on stan-dard-compliant signal generation both in the concept phase and during hardware tests, with the sure knowledge that both implementations are identical. On the other hand, the coop-eration makes it possible to configure Rohde&Schwarz sig-nal generators directly from the Synopsys simulation software (FIG 3). This eliminates the error-prone process of manu-ally “translating” the simulation LTE parameters for the sig-nal generator. As a result, commissioning of the test setup for
WIRELESS TECHNOLOGIES | Test methods
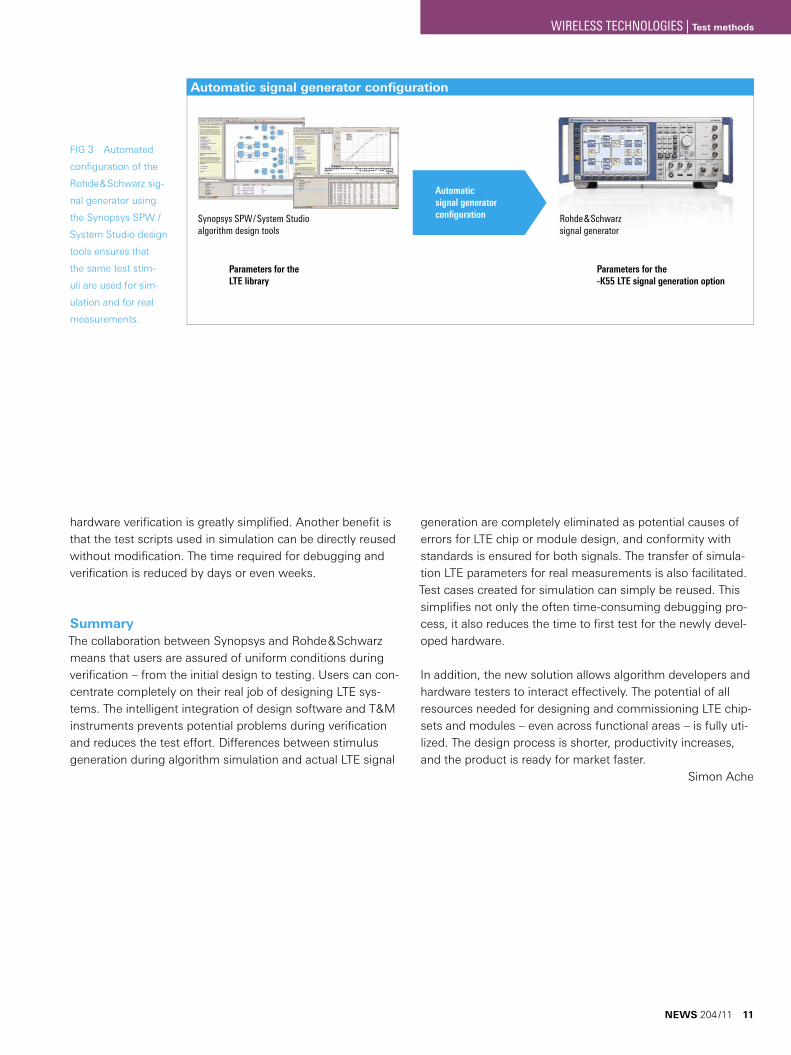
Automatic signal generator configuration
Parameters for the LTE library
Parameters for the-K55 LTE signal generation option
Automatic signal generator configurationSynopsys SPW/System Studio
algorithm design toolsRohde&Schwarzsignal generator
FIG 3 Automated
configuration of the
Rohde&Schwarz sig-
nal generator using
the Synopsys SPW /
System Studio design
tools ensures that
the same test stim-
uli are used for sim-
ulation and for real
measurements.
hardware verification is greatly simplified. Another benefit is that the test scripts used in simulation can be directly reused without modification. The time required for debugging and verification is reduced by days or even weeks.
SummaryThe collaboration between Synopsys and Rohde&Schwarz means that users are assured of uniform conditions during verification – from the initial design to testing. Users can con-centrate completely on their real job of designing LTE sys-tems. The intelligent integration of design software and T&M instruments prevents potential problems during verification and reduces the test effort. Differences between stimulus generation during algorithm simulation and actual LTE signal
generation are completely eliminated as potential causes of errors for LTE chip or module design, and conformity with standards is ensured for both signals. The transfer of simula-tion LTE parameters for real measurements is also facilitated. Test cases created for simulation can simply be reused. This simplifies not only the often time-consuming debugging pro-cess, it also reduces the time to first test for the newly devel-oped hardware.
In addition, the new solution allows algorithm developers and hardware testers to interact effectively. The potential of all resources needed for designing and commissioning LTE chip-sets and modules – even across functional areas – is fully uti-lized. The design process is shorter, productivity increases, and the product is ready for market faster.
Simon Ache
NEWS 204 /11 11
WIRELESS TECHNOLOGIES | Test methods

12
Continuing in the direction of LTE-Advanced: the latest test signals for LTE Rel. 9Vector signal generators from Rohde&Schwarz are keeping up the pace – with LTE Release 9, the latest
evolution stage of the mobile radio standard toward LTE-Advanced (Release 10). The new K84 option adds
the new dual-layer beamforming, MBSFN and LTE positioning features to the generators.
LTE development – always staying up frontThe LTE standard needs to meet the increasing demand for mobile communications and higher data rates (see box on page 13). Therefore, it must be continuously enhanced while networks are expanded. There is a general desire for bet-ter utilization of available resources, particularly in the down-link direction, which means increased effective cell capacity. Moreover, network operators intend to offer mobile televi-sion via their LTE networks in future. For example, scenarios are conceivable in which a base station smoothly switches from an IP-based live stream for an individual user to a broad-cast operating mode as soon as a certain number of users are watching the same program. It must also be possible to reliably determine the location of user equipment (UE). On the one hand, this results from governmental regulations, which require rapidly locating subscribers in the event of an
emergency. On the other hand, network operators want to use accurate position information to improve their resource management and clear the way for location-based services, which will be a source of future revenue. With Release 9 the LTE standard has been expanded in order to meet the require-ments that have arisen since Release 8. There are three new main features in the downlink direction regarding the physi-cal layer: dual-layer beamforming (transmission mode 8), mul-ticast broadcast single frequency network (MBSFN) and LTE positioning.
Dual-layer beamforming (transmission mode 8)Beamforming is mainly used to provide users with a bet-ter service at the cell boundary. In order to do this, the trans-mit signal is sent out in the direction of the user via several
The antenna ports in the LTE standardThe 3GPP TS 36.211 LTE standard defines antenna ports for the downlink. An antenna port is generally used as a generic term for signal transmission under identical channel conditions. For each LTE operating mode in the downlink direction for which an independent channel is assumed (e.g. SISO vs. MIMO), a separate logical antenna port is defined. LTE symbols that are transmitted via iden-tical antenna ports are subject to the same channel con-ditions. In order to determine the characteristic chan-nel for an antenna port, a UE must carry out a separate channel estimation for each antenna port. Separate refer-ence signals (pilot signals) that are suitable for estimating the respective channel are defined in the LTE standard for each antenna port. FIG 1 shows the antenna ports defined in the LTE standard in Releases 8 and 9.
The way in which these logical antenna ports are assigned to the physical transmit antennas of a base station is up to the base station, and can vary between base stations of the same type (because of different operating conditions) and also between base stations from different manufacturers. The base station does not explicitly notify the UE of the mapping that has been carried out, rather the UE must take this into account automatically during demodulation (FIG 2). As far as
Antenna port Downlink reference signal (RS)Ports 0 to 3 cell-specific reference signals (CS-RS)Port 4 MBSFN-RS
Port 5UE-specific reference signals (DM-RS): single layer (TX mode 7)
Port 6 positioning reference signals (PRS)
Ports 7 and 8UE-specific reference signals (DM-RS): dual layer (TX mode 8)
FIG 1 The antenna ports defined in the LTE standard in Releases 8 and 9.
WIRELESS TECHNOLOGIES | Signal generators
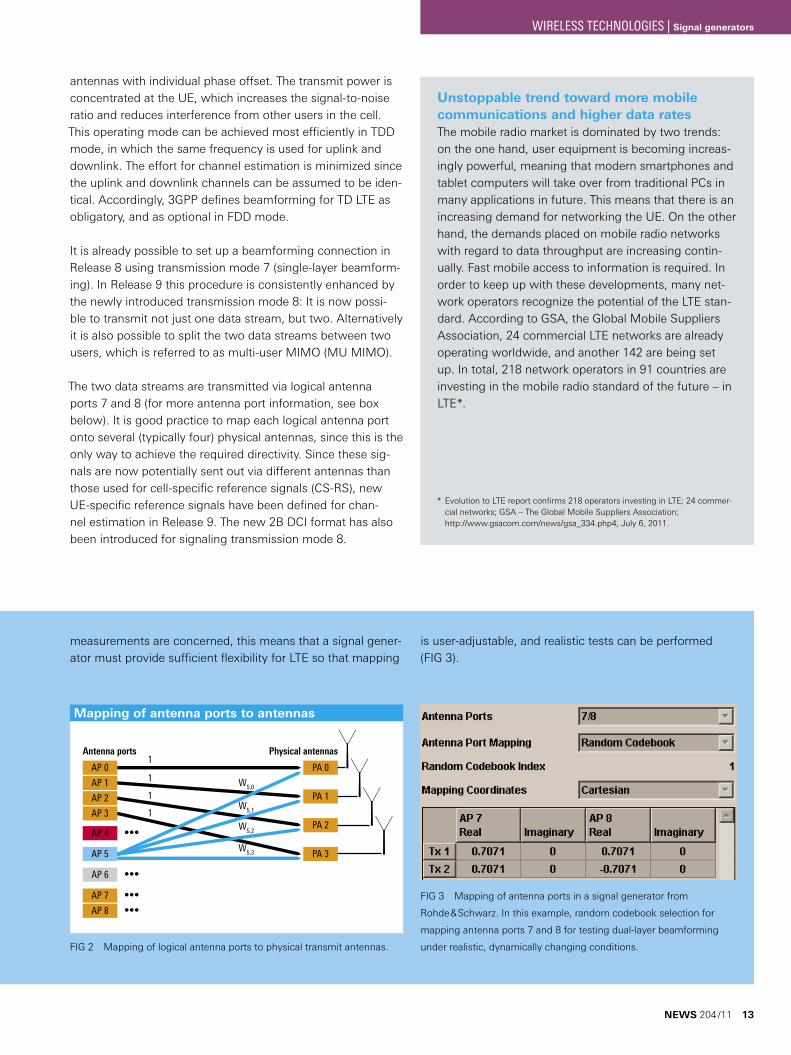
Mapping of antenna ports to antennas
AP 0
AP 1
AP 2
AP 3
AP 4
Antenna ports
PA 0
PA 1
PA 2
PA 3
Physical antennas1
1
1
1
•••
•••
•••
•••
W5,0
W5,1
W5,2
W5,3AP 5
AP 6
AP 7
AP 8
antennas with individual phase offset. The transmit power is concentrated at the UE, which increases the signal-to-noise ratio and reduces interference from other users in the cell. This operating mode can be achieved most efficiently in TDD mode, in which the same frequency is used for uplink and downlink. The effort for channel estimation is minimized since the uplink and downlink channels can be assumed to be iden-tical. Accordingly, 3GPP defines beamforming for TD LTE as obligatory, and as optional in FDD mode.
It is already possible to set up a beamforming connection in Release 8 using transmission mode 7 (single-layer beamform-ing). In Release 9 this procedure is consistently enhanced by the newly introduced transmission mode 8: It is now possi-ble to transmit not just one data stream, but two. Alternatively it is also possible to split the two data streams between two users, which is referred to as multi-user MIMO (MU MIMO).
The two data streams are transmitted via logical antenna ports 7 and 8 (for more antenna port information, see box below). It is good practice to map each logical antenna port onto several (typically four) physical antennas, since this is the only way to achieve the required directivity. Since these sig-nals are now potentially sent out via different antennas than those used for cell-specific reference signals (CS-RS), new UE-specific reference signals have been defined for chan-nel estimation in Release 9. The new 2B DCI format has also been introduced for signaling transmission mode 8.
FIG 2 Mapping of logical antenna ports to physical transmit antennas.
FIG 3 Mapping of antenna ports in a signal generator from
Rohde&Schwarz. In this example, random codebook selection for
mapping antenna ports 7 and 8 for testing dual-layer beamforming
under realistic, dynamically changing conditions.
measurements are concerned, this means that a signal gener-ator must provide sufficient flexibility for LTE so that mapping
is user-adjustable, and realistic tests can be performed (FIG 3).
Unstoppable trend toward more mobile communications and higher data ratesThe mobile radio market is dominated by two trends: on the one hand, user equipment is becoming increas-ingly powerful, meaning that modern smartphones and tablet computers will take over from traditional PCs in many applications in future. This means that there is an increasing demand for networking the UE. On the other hand, the demands placed on mobile radio networks with regard to data throughput are increasing contin-ually. Fast mobile access to information is required. In order to keep up with these developments, many net-work operators recognize the potential of the LTE stan-dard. According to GSA, the Global Mobile Suppliers Association, 24 commercial LTE networks are already operating worldwide, and another 142 are being set up. In total, 218 network operators in 91 countries are investing in the mobile radio standard of the future – in LTE*.
* Evolution to LTE report confirms 218 operators investing in LTE; 24 commer-cial networks; GSA – The Global Mobile Suppliers Association; http://www.gsacom.com/news/gsa_334.php4, July 6, 2011.
NEWS 204 /11 13
WIRELESS TECHNOLOGIES | Signal generators
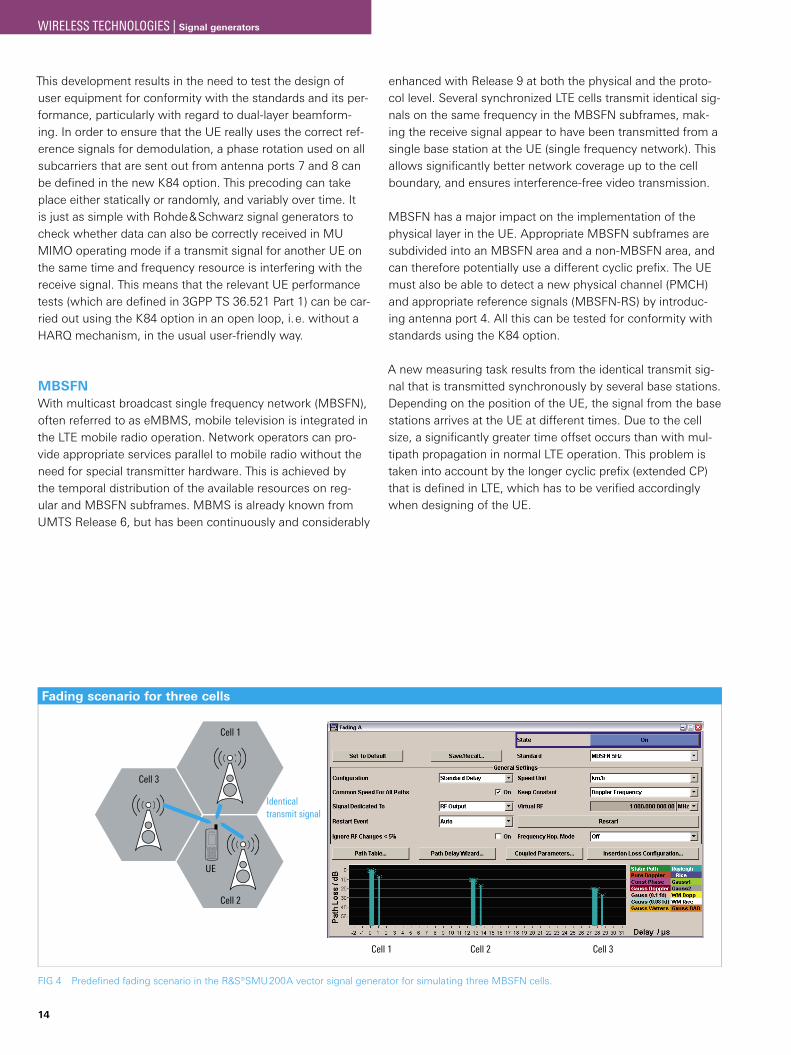
Fading scenario for three cells
Cell 1
Cell 3Cell 2Cell 1
Identicaltransmit signal
Cell 3
Cell 2
UE
14
This development results in the need to test the design of user equipment for conformity with the standards and its per-formance, particularly with regard to dual-layer beamform-ing. In order to ensure that the UE really uses the correct ref-erence signals for demodulation, a phase rotation used on all subcarriers that are sent out from antenna ports 7 and 8 can be defined in the new K84 option. This precoding can take place either statically or randomly, and variably over time. It is just as simple with Rohde&Schwarz signal generators to check whether data can also be correctly received in MU MIMO operating mode if a transmit signal for another UE on the same time and frequency resource is interfering with the receive signal. This means that the relevant UE performance tests (which are defined in 3GPP TS 36.521 Part 1) can be car-ried out using the K84 option in an open loop, i.e. without a HARQ mechanism, in the usual user-friendly way.
MBSFNWith multicast broadcast single frequency network (MBSFN), often referred to as eMBMS, mobile television is integrated in the LTE mobile radio operation. Network operators can pro-vide appropriate services parallel to mobile radio without the need for special transmitter hardware. This is achieved by the temporal distribution of the available resources on reg-ular and MBSFN subframes. MBMS is already known from UMTS Release 6, but has been continuously and considerably
FIG 4 Predefined fading scenario in the R&S®SMU200A vector signal generator for simulating three MBSFN cells.
enhanced with Release 9 at both the physical and the proto-col level. Several synchronized LTE cells transmit identical sig-nals on the same frequency in the MBSFN subframes, mak-ing the receive signal appear to have been transmitted from a single base station at the UE (single frequency network). This allows significantly better network coverage up to the cell boundary, and ensures interference-free video transmission.
MBSFN has a major impact on the implementation of the physical layer in the UE. Appropriate MBSFN subframes are subdivided into an MBSFN area and a non-MBSFN area, and can therefore potentially use a different cyclic prefix. The UE must also be able to detect a new physical channel (PMCH) and appropriate reference signals (MBSFN-RS) by introduc-ing antenna port 4. All this can be tested for conformity with standards using the K84 option.
A new measuring task results from the identical transmit sig-nal that is transmitted synchronously by several base stations. Depending on the position of the UE, the signal from the base stations arrives at the UE at different times. Due to the cell size, a significantly greater time offset occurs than with mul-tipath propagation in normal LTE operation. This problem is taken into account by the longer cyclic prefix (extended CP) that is defined in LTE, which has to be verified accordingly when designing of the UE.
WIRELESS TECHNOLOGIES | Signal generators
Abbreviations3GPP 3rd Generation Partnership ProjectA-GPS Assisted-GPSAWGN Additive white Gaussian noiseDCI Downlink control informationeMBMS enhanced multimedia broadcast multicast serviceFDD Frequency division duplexGPS Global positioning systemLTE Long term evolutionMBSFN Multicast broadcast single frequency networkMIMO Multiple input multiple outputMU-MIMO Multi-user MIMOOTDOA Observed timing difference of arrivalPRS Positioning reference signalsTDD Time division duplexUE User equipmentUMTS Universal mobile telecommunications system
By using the R&S®SMU200A vector signal generator and its integrated fading simulator, it is easy to simulate several LTE cells with individual signal delays. For configuration purposes it is sufficient to load an appropriate predefined scenario as shown in FIG 4.
LTE positioningExtremely accurate position fixing can be carried out using GPS/A-GPS, provided that there is a good line of sight to the satellites. However, the line of sight is often inadequate in urban areas and buildings. Localization via the radio cells that are visible to the UE is always available, but position estima-tion is rather inaccurate. In Release 9 the OTDOA approach has been further enhanced with the introduction of dedicated positioning reference signals (PRS). The UE measures the rel-ative delay of at least three base station signals and reports these to a location server. The position of a mobile phone can be determined by means of triangulation, similarly to GPS. In principle, this also works with normal cell-specific reference signals from Release 8, but PRS provides significantly greater accuracy.
For their Release 9 designs, the manufacturers of LTE UE must test whether the UE can receive the PRS in a way that conforms to the standards, and can carry out delay measure-ments of different base station signals. Both tests are easy to perform with the K84 option.
The following generators and software from Rohde&Schwarz are up to date for measure-ments in line with LTE Release 9:
– R&S®SMU200A vector signal generator – R&S®SMJ100A vector signal generator
– R&S®SMATE200A vector signal generator
– R&S®SMBV100A vector signal generator – R&S®AMU200A baseband signal generator and fading
simulator
– R&S®WinIQSIM2™ simulation software
Owing to the two-path architecture of the R&S®SMU200A vector signal generator, the complex test setup that is usually required for this kind of testing is simplified. A single instru-ment can simulate two base stations with independent chan-nel simulation including fading, AWGN and a definable time offset. If a simple, static channel model is sufficient, almost any number of LTE cells can be generated in one path of the R&S®SMU200A. This makes it possible to generate a suitable GPS scenario for multistandard tests in the second path.
SummaryThe proliferation of the LTE standard is progressing rapidly, with Release 9 as the basis for the subsequent success of LTE-Advanced. By using the new K84 option, the signal gen-erator family from Rohde&Schwarz keeps up pace with this development and provides a wide variety of measuring options to meet the diverse LTE Release 9 requirements.
Gerald Tietscher; Simon Ache
NEWS 204 /11 15
WIRELESS TECHNOLOGIES | Signal generators
16
IEEE 802.11ac standard: WLANs break through the Gigabit barrierThe new WLAN IEEE 802.11ac standard achieves a data throughput of 1 Gbit/s and higher. Rohde&Schwarz
vector signal generators can already generate the test signals needed for development and production.
Higher bandwidthsAt present, the IEEE 802.11ac standard (shortened to 11ac in this article) is still being defined, with standardization expected to be complete in 2012. Much of 11ac is based on 11n, such as channel coding and MIMO modes. New are the bandwidths of 80 MHz and 160 MHz (11n offered only 40 MHz), 256QAM, up to eight antennas and multi-user MIMO.
Gross data rates of 293 Mbit/s are possible with only 80 MHz bandwidth, one antenna and 64QAM 5/6; all 11ac devices must support this mode. Optional modes using 256QAM and eight antennas under optimal conditions permit gross data rates of 3.5 Gbit/s. 11ac is designed only for license-free 5 GHz bands and will no longer include the 2.4 GHz industrial scientific medical (ISM) band previously used primarily for WLANs.
Signals for 11ac with R&S®SMU200A and R&S®SMBV100AVector signal generators of the R&S®SMU200A and R&S®SMBV100A families already support the high 11ac band-widths. The new R&S®SMx-K86 option for internal signal gen-eration and R&S®SMx-K286 based on the R&S®WinIQSIM2™ simulation software expand existing 11n HT modes (high
throughput) offered by R&S®SMx-K54 / R&S®SMx-K254 options to include the new VHT modes (very high throughput) defined by the 11ac standard. As a result, high-quality 11ac signals are available for all receiver tests, whether for testing sensitivity, maximum input level or adjacent channel suppres-sion. The currently available firmware handles 80 MHz 11ac signals with up to four antennas plus 256QAM. Bandwidths of 160 MHz, eight antennas and multi-user MIMO will follow shortly.
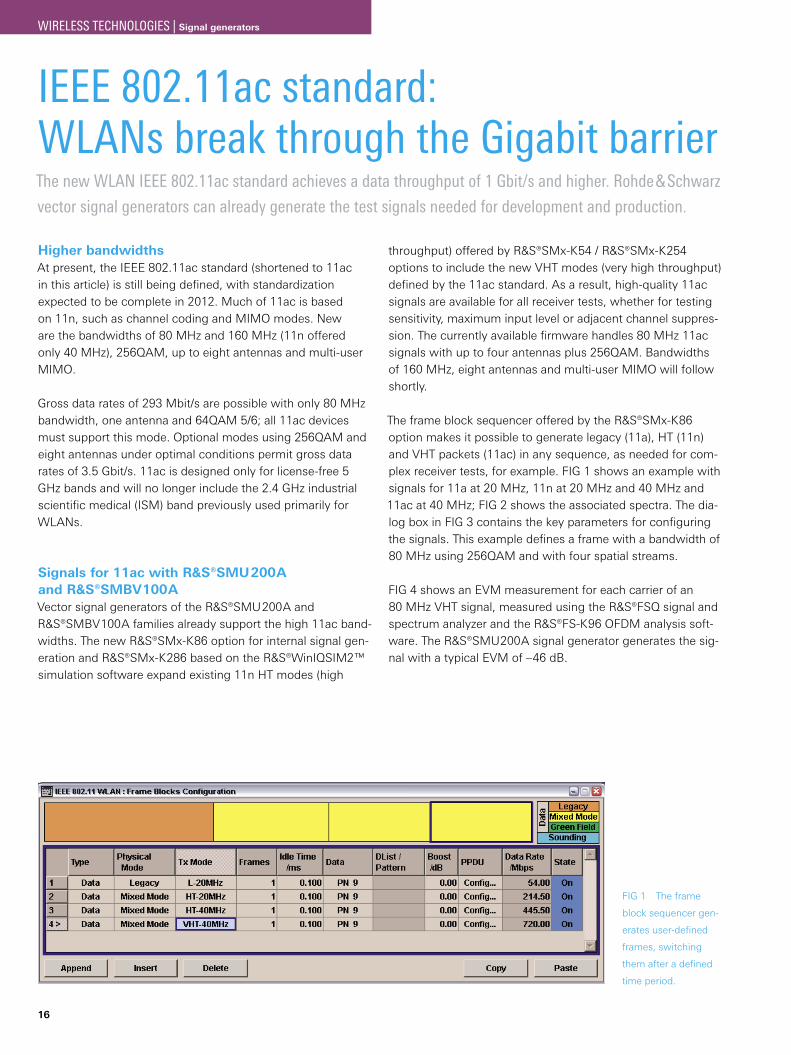
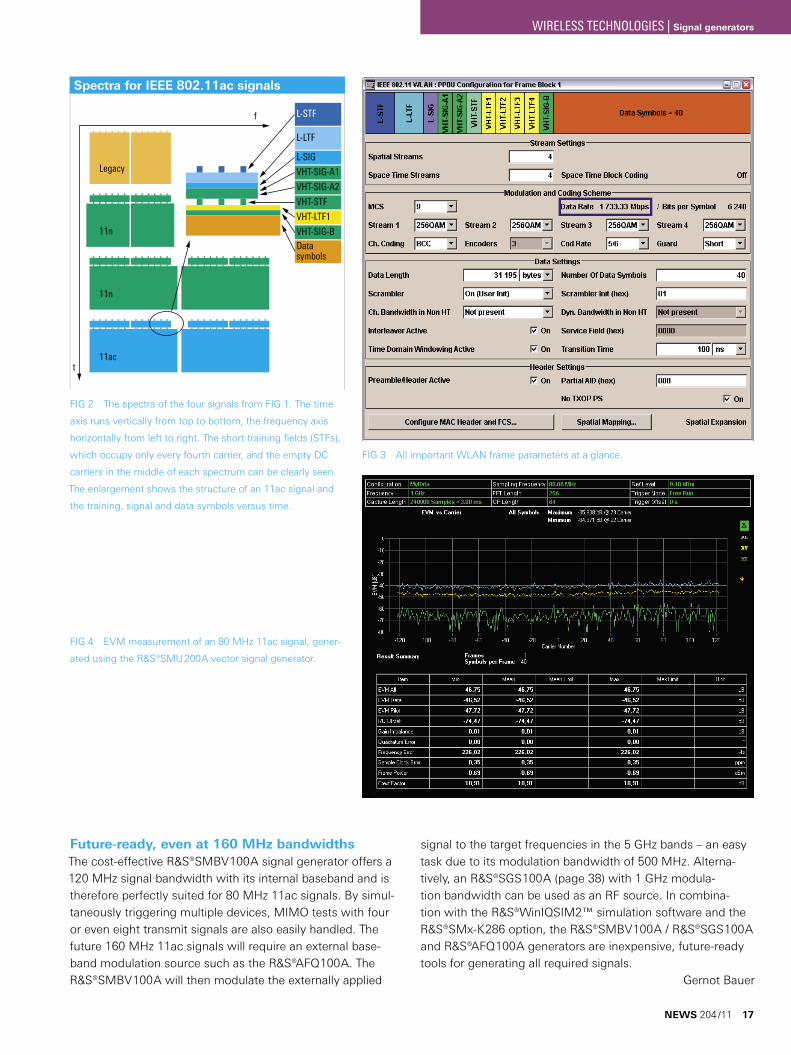
The frame block sequencer offered by the R&S®SMx-K86 option makes it possible to generate legacy (11a), HT (11n) and VHT packets (11ac) in any sequence, as needed for com-plex receiver tests, for example. FIG 1 shows an example with signals for 11a at 20 MHz, 11n at 20 MHz and 40 MHz and 11ac at 40 MHz; FIG 2 shows the associated spectra. The dia-log box in FIG 3 contains the key parameters for configuring the signals. This example defines a frame with a bandwidth of 80 MHz using 256QAM and with four spatial streams.
FIG 4 shows an EVM measurement for each carrier of an 80 MHz VHT signal, measured using the R&S®FSQ signal and spectrum analyzer and the R&S®FS-K96 OFDM analysis soft-ware. The R&S®SMU200A signal generator generates the sig-nal with a typical EVM of –46 dB.
FIG 1 The frame
block sequencer gen-
erates user-defined
frames, switching
them after a defined
time period.
WIRELESS TECHNOLOGIES | Signal generators
f
t
Spectra for IEEE 802.11ac signals
VHT-SIG-B
VHT-LTF1
VHT-STF
VHT-SIG-A2
VHT-SIG-A1
Datasymbols
L-SIG
L-LTF
L-STF
Legacy
11n
11n
11ac
Future-ready, even at 160 MHz bandwidthsThe cost-effective R&S®SMBV100A signal generator offers a 120 MHz signal bandwidth with its internal baseband and is therefore perfectly suited for 80 MHz 11ac signals. By simul-taneously triggering multiple devices, MIMO tests with four or even eight transmit signals are also easily handled. The future 160 MHz 11ac signals will require an external base-band modulation source such as the R&S®AFQ100A. The R&S®SMBV100A will then modulate the externally applied
FIG 2 The spectra of the four signals from FIG 1. The time
axis runs vertically from top to bottom, the frequency axis
horizontally from left to right. The short training fields (STFs),
which occupy only every fourth carrier, and the empty DC
carriers in the middle of each spectrum can be clearly seen.
The enlargement shows the structure of an 11ac signal and
the training, signal and data symbols versus time.
FIG 3 All important WLAN frame parameters at a glance.
FIG 4 EVM measurement of an 80 MHz 11ac signal, gener-
ated using the R&S®SMU200A vector signal generator.
signal to the target frequencies in the 5 GHz bands – an easy task due to its modulation bandwidth of 500 MHz. Alterna-tively, an R&S®SGS100A (page 38) with 1 GHz modula-tion bandwidth can be used as an RF source. In combina-tion with the R&S®WinIQSIM2™ simulation software and the R&S®SMx-K286 option, the R&S®SMBV100A / R&S®SGS100A and R&S®AFQ100A generators are inexpensive, future-ready tools for generating all required signals.
Gernot Bauer
NEWS 204 /11 17
WIRELESS TECHNOLOGIES | Signal generators
18
Using R&S®RTO oscilloscopes with digital channels to test complex embedded systemsThe R&S®RTO-B1 option turns the R&S®RTO oscilloscopes into precise, fast, easy-to-use mixed signal oscil-
loscopes (MSO). With two or four analog channels and 16 digital channels for extended logic analysis, plus
the option of protocol-specific triggering and decoding, these scopes offer hardware and software devel-
opers a powerful tool for analyzing embedded systems.
A tool for analyzing complex embedded systemsThe more tasks an embedded system is to accomplish, the more complex it becomes and the greater the variety and number of interfaces between its digital and analog compo-nents. It is not uncommon for a system design to combine 1-bit signals, clocked and unclocked parallel data buses and
serial data buses. To manage this growing complexity, devel-opers need to analyze all these interfaces at various levels of abstraction. This usually requires complex test setups with multiple instruments, each of which is operated differently: Analog waveforms are analyzed with an oscilloscope, digital signals with a logic analyzer and transmission protocols with a protocol analyzer.
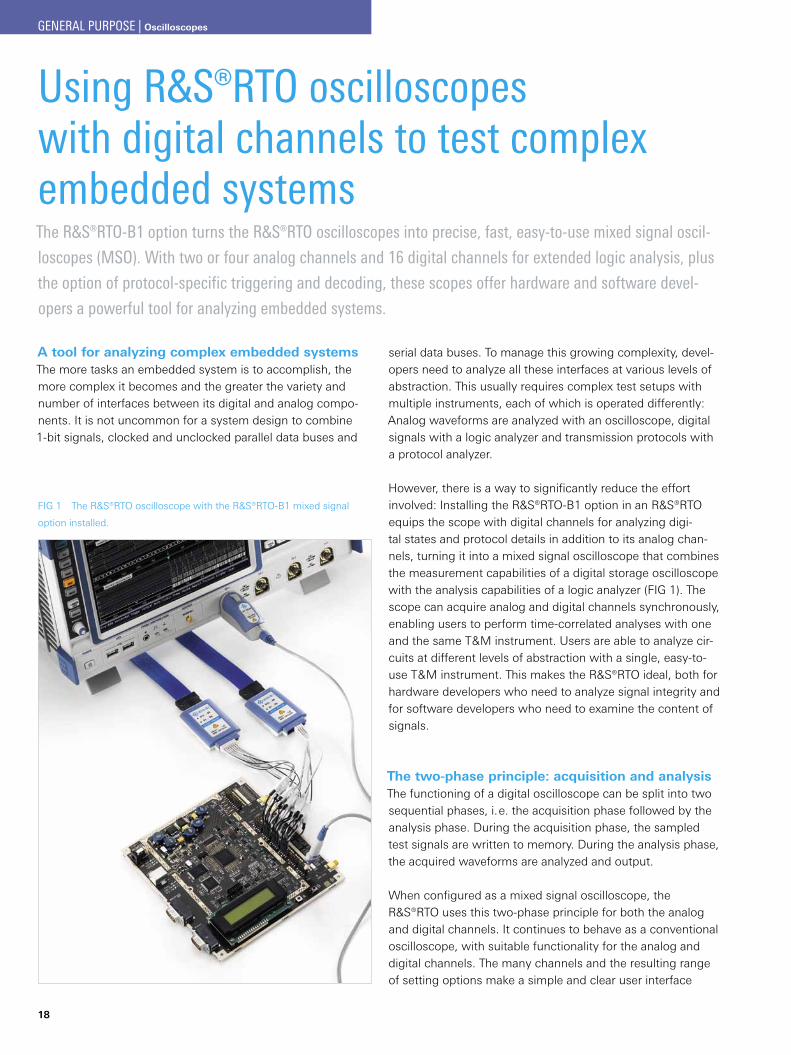
However, there is a way to significantly reduce the effort involved: Installing the R&S®RTO-B1 option in an R&S®RTO equips the scope with digital channels for analyzing digi-tal states and protocol details in addition to its analog chan-nels, turning it into a mixed signal oscilloscope that combines the measurement capabilities of a digital storage oscilloscope with the analysis capabilities of a logic analyzer (FIG 1). The scope can acquire analog and digital channels synchronously, enabling users to perform time-correlated analyses with one and the same T&M instrument. Users are able to analyze cir-cuits at different levels of abstraction with a single, easy-to-use T&M instrument. This makes the R&S®RTO ideal, both for hardware developers who need to analyze signal integrity and for software developers who need to examine the content of signals.
The two-phase principle: acquisition and analysisThe functioning of a digital oscilloscope can be split into two sequential phases, i.e. the acquisition phase followed by the analysis phase. During the acquisition phase, the sampled test signals are written to memory. During the analysis phase, the acquired waveforms are analyzed and output.
When configured as a mixed signal oscilloscope, the R&S®RTO uses this two-phase principle for both the analog and digital channels. It continues to behave as a conventional oscilloscope, with suitable functionality for the analog and digital channels. The many channels and the resulting range of setting options make a simple and clear user interface
FIG 1 The R&S®RTO oscilloscope with the R&S®RTO-B1 mixed signal
option installed.
GENERAL PURPOSE | Oscilloscopes
Data-to-clock trigger on up to 15 data channels
Data channel 0
Data channel 1
Data channel 2
Data channel 3
●
●
●
Data channel 14
Clock
Setup time
TriggerHold time
Setup time violation●
●
●
extremely important. This is where the R&S®RTO excels. Its flat menu structure and the signal flow diagrams make it highly intuitive to use, even with the R&S®RTO-B1 mixed sig-nal option installed. The operating menus are transparent so they do not hide the measurement windows. As a result, any adjustment to the settings that alters the waveforms is imme-diately visible. For improved clarity, waveforms can also be grouped together on the screen in separate windows.
High time resolution combined with long acquisition cyclesA high time resolution is an advantage for both the analog and the digital channels. It enables the oscilloscope to ana-lyze events in digital signals with the required precision to reli-ably detect even narrow glitches. When digital channels are used as the trigger source, the trigger point is still determined with a high degree of accuracy, ensuring that waveform jitter during visualization is minimal.
This is why the R&S®RTO-B1 mixed signal option offers a sampling rate of 5 Gsample/s on its 16 digital channels (and 10 Gsample/s on the analog channels). For the digital chan-nels, this translates into a time resolution of 200 ps over the entire acquisition depth of 200 Msample, which is exceptional for an instrument in this class. Even events that occur long after the trigger point are displayed with high time precision. The mixed signal option’s memory operates independently of the base unit, so the acquisition depth of 200 Msample is not affected by the number of analog and digital channels being used.
If the time resolution of the analog channels exceeds that of the digital channels (such as at a sampling rate of 10 Gsample/s or during interpolation), sample&hold interpola-tion is used to adjust the digital channels to the sampling rate of the analog channels. This allows analog waveforms and digital signals to be analyzed together.
The maximum acquisition depth of 200 Msample per digi-tal channel is sufficient for a large number of applications, including the acquisition of long data sequences on serial buses. At a bit rate of 400 Mbit/s and a sampling rate of 5 Gsample/s, the acquisition depth is 16 Mbit. This is enough to acquire long data sequences as well as a large number of sequential waveforms.
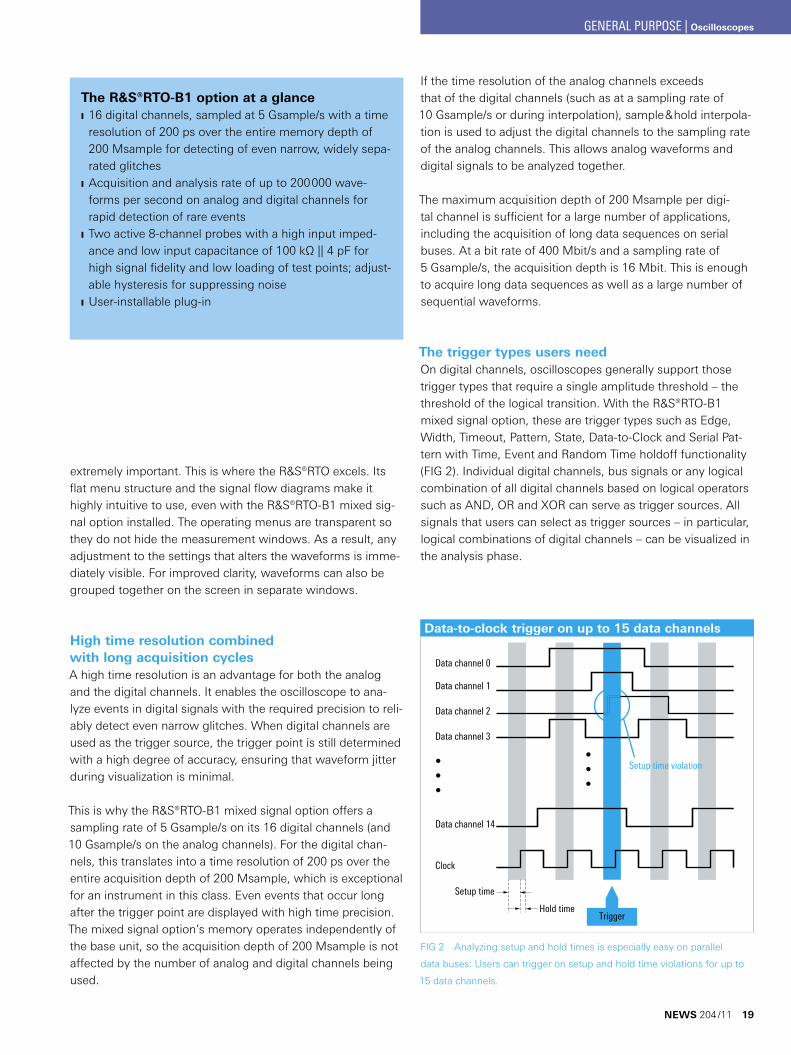
The trigger types users needOn digital channels, oscilloscopes generally support those trigger types that require a single amplitude threshold – the threshold of the logical transition. With the R&S®RTO-B1 mixed signal option, these are trigger types such as Edge, Width, Timeout, Pattern, State, Data-to-Clock and Serial Pat-tern with Time, Event and Random Time holdoff functionality (FIG 2). Individual digital channels, bus signals or any logical combination of all digital channels based on logical operators such as AND, OR and XOR can serve as trigger sources. All signals that users can select as trigger sources – in particular, logical combinations of digital channels – can be visualized in the analysis phase.
The R&S®RTO-B1 option at a glance ❙ 16 digital channels, sampled at 5 Gsample/s with a time resolution of 200 ps over the entire memory depth of 200 Msample for detecting of even narrow, widely sepa-rated glitches
❙ Acquisition and analysis rate of up to 200000 wave-forms per second on analog and digital channels for rapid detection of rare events
❙ Two active 8-channel probes with a high input imped-ance and low input capacitance of 100 kΩ || 4 pF for high signal fidelity and low loading of test points; adjust-able hysteresis for suppressing noise
❙ User-installable plug-in
FIG 2 Analyzing setup and hold times is especially easy on parallel
data buses: Users can trigger on setup and hold time violations for up to
15 data channels.
NEWS 204 /11 19
GENERAL PURPOSE | Oscilloscopes
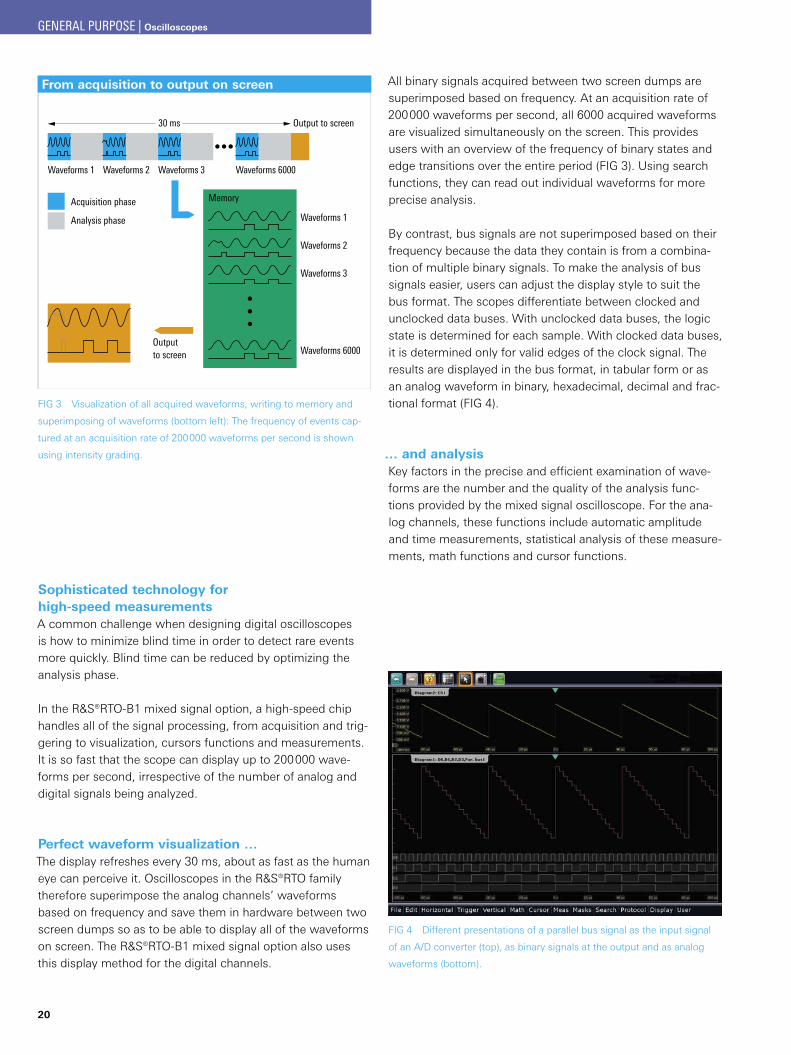
From acquisition to output on screen
Waveforms 1 Waveforms 2 Waveforms 3 Waveforms 6000
Output to screen30 ms
● ● ●Waveforms 1
Waveforms 2
Waveforms 3
Waveforms 6000
Acquisition phase
Analysis phase
Outputto screen
●●●
Memory
20
Sophisticated technology for high-speed measurementsA common challenge when designing digital oscilloscopes is how to minimize blind time in order to detect rare events more quickly. Blind time can be reduced by optimizing the analysis phase.
In the R&S®RTO-B1 mixed signal option, a high-speed chip handles all of the signal processing, from acquisition and trig-gering to visualization, cursors functions and measurements. It is so fast that the scope can display up to 200000 wave-forms per second, irrespective of the number of analog and digital signals being analyzed.
Perfect waveform visualization …The display refreshes every 30 ms, about as fast as the human eye can perceive it. Oscilloscopes in the R&S®RTO family therefore superimpose the analog channels’ waveforms based on frequency and save them in hardware between two screen dumps so as to be able to display all of the waveforms on screen. The R&S®RTO-B1 mixed signal option also uses this display method for the digital channels.
All binary signals acquired between two screen dumps are superimposed based on frequency. At an acquisition rate of 200000 waveforms per second, all 6000 acquired waveforms are visualized simultaneously on the screen. This provides users with an overview of the frequency of binary states and edge transitions over the entire period (FIG 3). Using search functions, they can read out individual waveforms for more precise analysis.
By contrast, bus signals are not superimposed based on their frequency because the data they contain is from a combina-tion of multiple binary signals. To make the analysis of bus signals easier, users can adjust the display style to suit the bus format. The scopes differentiate between clocked and unclocked data buses. With unclocked data buses, the logic state is determined for each sample. With clocked data buses, it is determined only for valid edges of the clock signal. The results are displayed in the bus format, in tabular form or as an analog waveform in binary, hexadecimal, decimal and frac-tional format (FIG 4).
… and analysisKey factors in the precise and efficient examination of wave-forms are the number and the quality of the analysis func-tions provided by the mixed signal oscilloscope. For the ana-log channels, these functions include automatic amplitude and time measurements, statistical analysis of these measure-ments, math functions and cursor functions.
FIG 4 Different presentations of a parallel bus signal as the input signal
of an A/D converter (top), as binary signals at the output and as analog
waveforms (bottom).
FIG 3 Visualization of all acquired waveforms, writing to memory and
superimposing of waveforms (bottom left): The frequency of events cap-
tured at an acquisition rate of 200000 waveforms per second is shown
using intensity grading.
GENERAL PURPOSE | Oscilloscopes
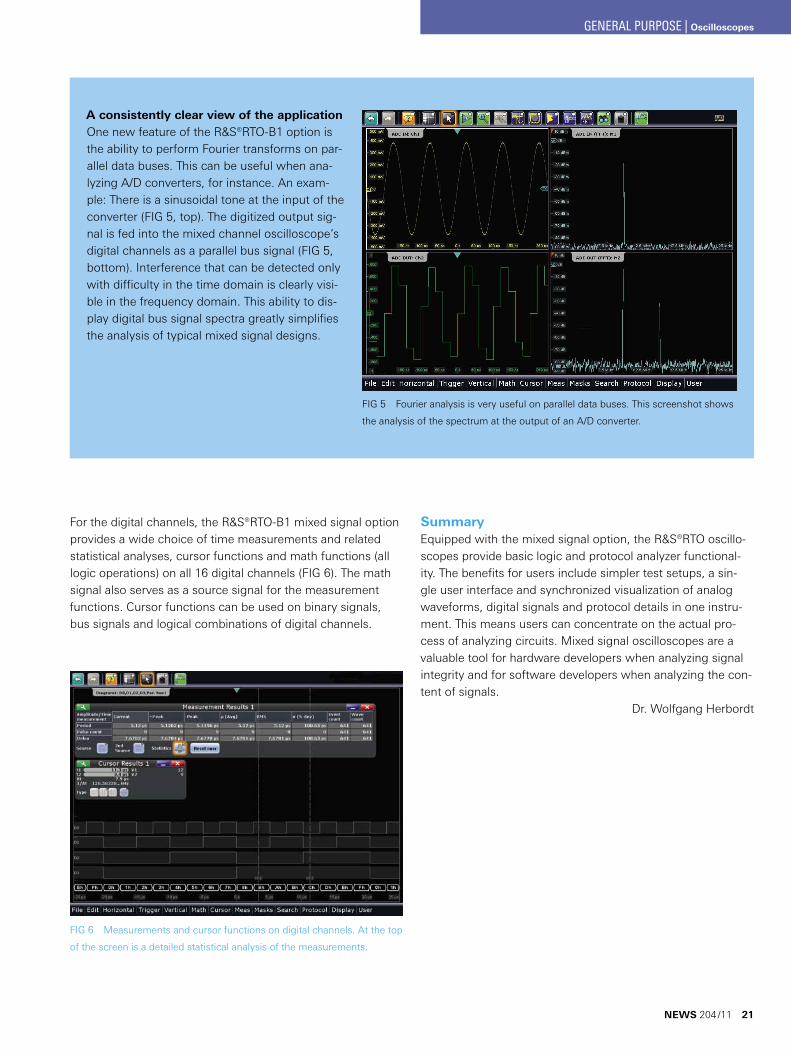
FIG 6 Measurements and cursor functions on digital channels. At the top
of the screen is a detailed statistical analysis of the measurements.
For the digital channels, the R&S®RTO-B1 mixed signal option provides a wide choice of time measurements and related statistical analyses, cursor functions and math functions (all logic operations) on all 16 digital channels (FIG 6). The math signal also serves as a source signal for the measurement functions. Cursor functions can be used on binary signals, bus signals and logical combinations of digital channels.
A consistently clear view of the applicationOne new feature of the R&S®RTO-B1 option is the ability to perform Fourier transforms on par-allel data buses. This can be useful when ana-lyzing A/D converters, for instance. An exam-ple: There is a sinusoidal tone at the input of the converter (FIG 5, top). The digitized output sig-nal is fed into the mixed channel oscilloscope’s digital channels as a parallel bus signal (FIG 5, bottom). Interference that can be detected only with difficulty in the time domain is clearly visi-ble in the frequency domain. This ability to dis-play digital bus signal spectra greatly simplifies the analysis of typical mixed signal designs.
FIG 5 Fourier analysis is very useful on parallel data buses. This screenshot shows
the analysis of the spectrum at the output of an A/D converter.
SummaryEquipped with the mixed signal option, the R&S®RTO oscillo-scopes provide basic logic and protocol analyzer functional-ity. The benefits for users include simpler test setups, a sin-gle user interface and synchronized visualization of analog waveforms, digital signals and protocol details in one instru-ment. This means users can concentrate on the actual pro-cess of analyzing circuits. Mixed signal oscilloscopes are a valuable tool for hardware developers when analyzing signal integrity and for software developers when analyzing the con-tent of signals.
Dr. Wolfgang Herbordt
NEWS 204 /11 21
GENERAL PURPOSE | Oscilloscopes
22
USB power sensors on the PC: easy to use – even without a base unitThe new PC-based R&S®NRPV virtual power meter makes it easy for users to unlock the potential offered by
the USB power sensors of the R&S®NRP-Z family. With its wide range of measurement and analysis func-
tions, it is a powerful software package that offers distinct advantages over conventional sensors requiring
a base unit for operation.
Easy to use – even without a base unitThe USB power sensors of the R&S®NRP-Z family offer a wide range of functions for measuring the power of multiple sig-nal waveforms in large frequency ranges. They are among the world´s fastest and most accurate power sensors, with char-acteristics unmatched by competitors. These extremely accu-rate power sensors are standalone measuring instruments with remote control interface. They are frequently used in automated test systems, but can also be operated manually.
Most of the R&S®NRP-Z power sensors recognize over 150 commands for the various measurement modes. To ensure that the full spectrum of measurement options offered by these instruments is used interactively, Rohde&Schwarz has developed a powerful PC software package, the R&S®NRPV virtual power meter. It provides access to almost all functions of the USB power sensors from Rohde&Schwarz in a single, easy-to-use application.
The R&S®NRPV software runs under the Windows XP, Windows Vista and Windows 7 operating systems. When installed on a PC, the software provides a wide variety of options and convenient measurement and analysis functions which go far beyond those conventionally available via base units. For example, the large monitors of today’s worksta-tions make it possible to provide detailed displays. The mouse can be used to move around and zoom in on signal traces on the graphical display. With the press of a single button, users can store the results from scalar measurements in CSV files, which can later be processed by common spreadsheet applications.
The virtual power meter offers six main measurement modes, each of which is displayed in a separate window:
Trace Power versus time in a graphical displayContinuous Continuous power as a scalar valueBurst Average Average power of pulsed signals with auto-
matic pulse recognitionGated Average Average power in defined time gatesTimeslot Power in up to 16 consecutive timeslotsStatistics Probability density function (PDF), cumu-
lative distribution function (CDF) and com-plementary cumulative distribution function (CCDF)
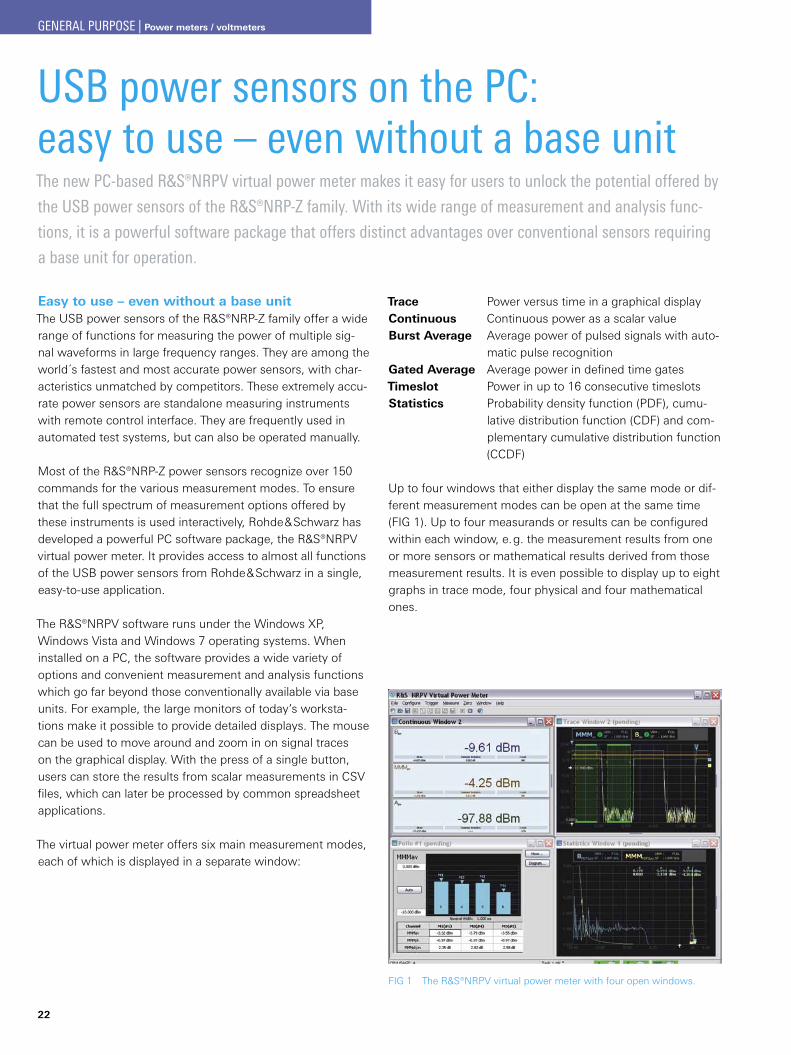
Up to four windows that either display the same mode or dif-ferent measurement modes can be open at the same time (FIG 1). Up to four measurands or results can be configured within each window, e.g. the measurement results from one or more sensors or mathematical results derived from those measurement results. It is even possible to display up to eight graphs in trace mode, four physical and four mathematical ones.
FIG 1 The R&S®NRPV virtual power meter with four open windows.
GENERAL PURPOSE | Power meters / voltmeters
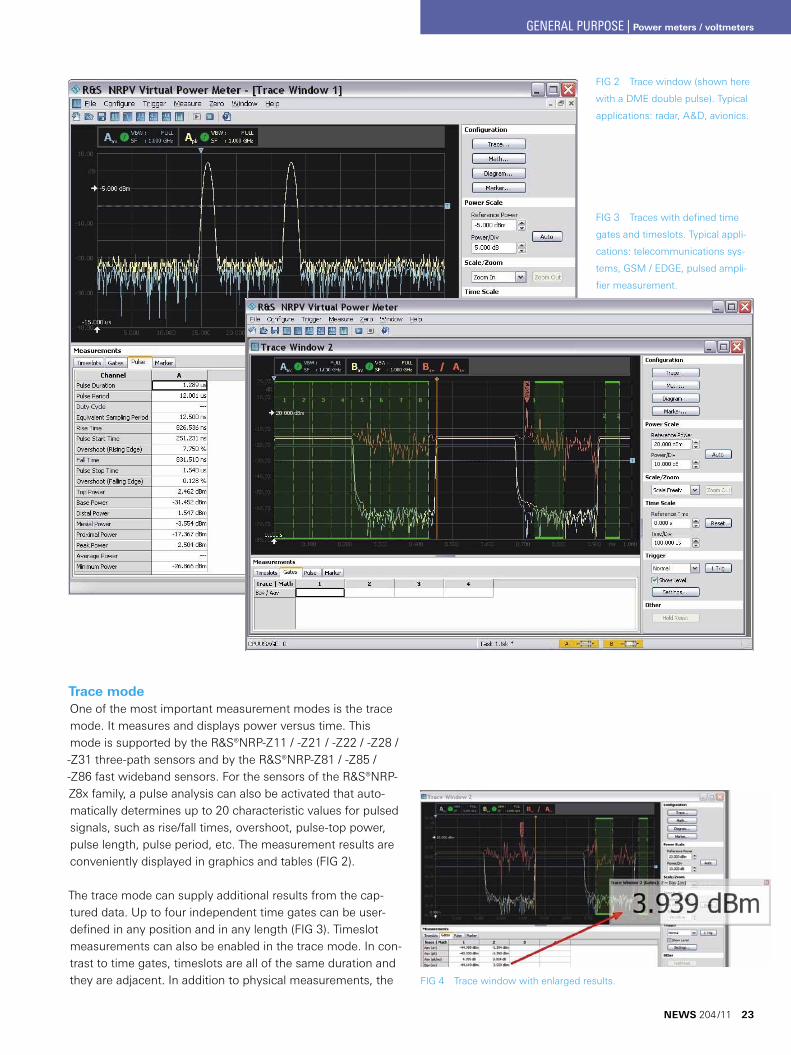
FIG 2 Trace window (shown here
with a DME double pulse). Typical
applications: radar, A&D, avionics.
FIG 3 Traces with defined time
gates and timeslots. Typical appli-
cations: telecommunications sys-
tems, GSM / EDGE, pulsed ampli-
fier measurement.
Trace modeOne of the most important measurement modes is the trace mode. It measures and displays power versus time. This mode is supported by the R&S®NRP-Z11 / -Z21 / -Z22 / -Z28 / -Z31 three-path sensors and by the R&S®NRP-Z81 / -Z85 / -Z86 fast wideband sensors. For the sensors of the R&S®NRP-Z8x family, a pulse analysis can also be activated that auto-matically determines up to 20 characteristic values for pulsed signals, such as rise/fall times, overshoot, pulse-top power, pulse length, pulse period, etc. The measurement results are conveniently displayed in graphics and tables (FIG 2).
The trace mode can supply additional results from the cap-tured data. Up to four independent time gates can be user-defined in any position and in any length (FIG 3). Timeslot measurements can also be enabled in the trace mode. In con-trast to time gates, timeslots are all of the same duration and they are adjacent. In addition to physical measurements, the FIG 4 Trace window with enlarged results.
NEWS 204 /11 23
GENERAL PURPOSE | Power meters / voltmeters
24
FIG 5 Marker functions with a variety of configuration options support the analysis of power traces.
trace window can also display mathematical traces. Mathe-matical traces show the ratio and the difference between two signal traces as well as the standing wave ratio (SWR).
The R&S®NRPV software also proves useful in test setups where the PC is located several meters from the DUT. To ensure optimum readability, all windows are fully scalable so that individual results can be enlarged and pinned to any spot on the monitor. One double-click on a table value is suf-ficient to permanently display the measurement results in any desired size on a transparent background, making it easy to read even from a large distance (FIG 4).
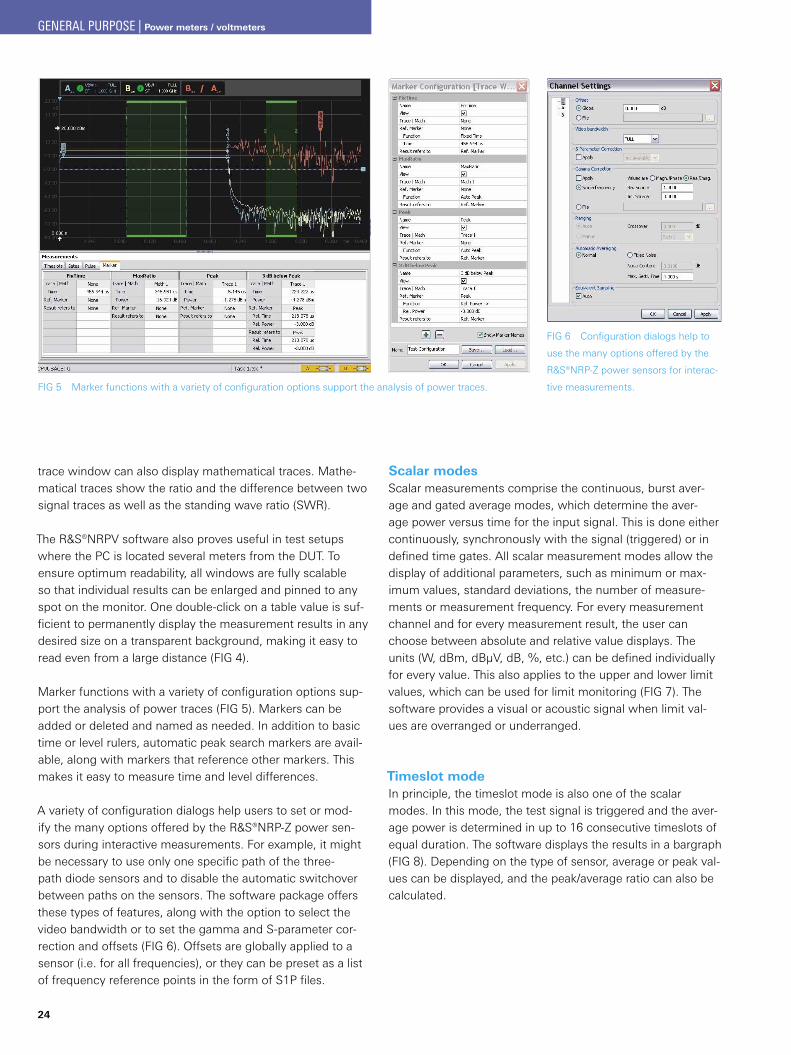
Marker functions with a variety of configuration options sup-port the analysis of power traces (FIG 5). Markers can be added or deleted and named as needed. In addition to basic time or level rulers, automatic peak search markers are avail-able, along with markers that reference other markers. This makes it easy to measure time and level differences.
A variety of configuration dialogs help users to set or mod-ify the many options offered by the R&S®NRP-Z power sen-sors during interactive measurements. For example, it might be necessary to use only one specific path of the three-path diode sensors and to disable the automatic switchover between paths on the sensors. The software package offers these types of features, along with the option to select the video bandwidth or to set the gamma and S-parameter cor-rection and offsets (FIG 6). Offsets are globally applied to a sensor (i.e. for all frequencies), or they can be preset as a list of frequency reference points in the form of S1P files.
FIG 6 Configuration dialogs help to
use the many options offered by the
R&S®NRP-Z power sensors for interac-
tive measurements.
Scalar modesScalar measurements comprise the continuous, burst aver-age and gated average modes, which determine the aver-age power versus time for the input signal. This is done either continuously, synchronously with the signal (triggered) or in defined time gates. All scalar measurement modes allow the display of additional parameters, such as minimum or max-imum values, standard deviations, the number of measure-ments or measurement frequency. For every measurement channel and for every measurement result, the user can choose between absolute and relative value displays. The units (W, dBm, dBµV, dB, %, etc.) can be defined individually for every value. This also applies to the upper and lower limit values, which can be used for limit monitoring (FIG 7). The software provides a visual or acoustic signal when limit val-ues are overranged or underranged.
Timeslot modeIn principle, the timeslot mode is also one of the scalar modes. In this mode, the test signal is triggered and the aver-age power is determined in up to 16 consecutive timeslots of equal duration. The software displays the results in a bargraph (FIG 8). Depending on the type of sensor, average or peak val-ues can be displayed, and the peak/average ratio can also be calculated.
GENERAL PURPOSE | Power meters / voltmeters
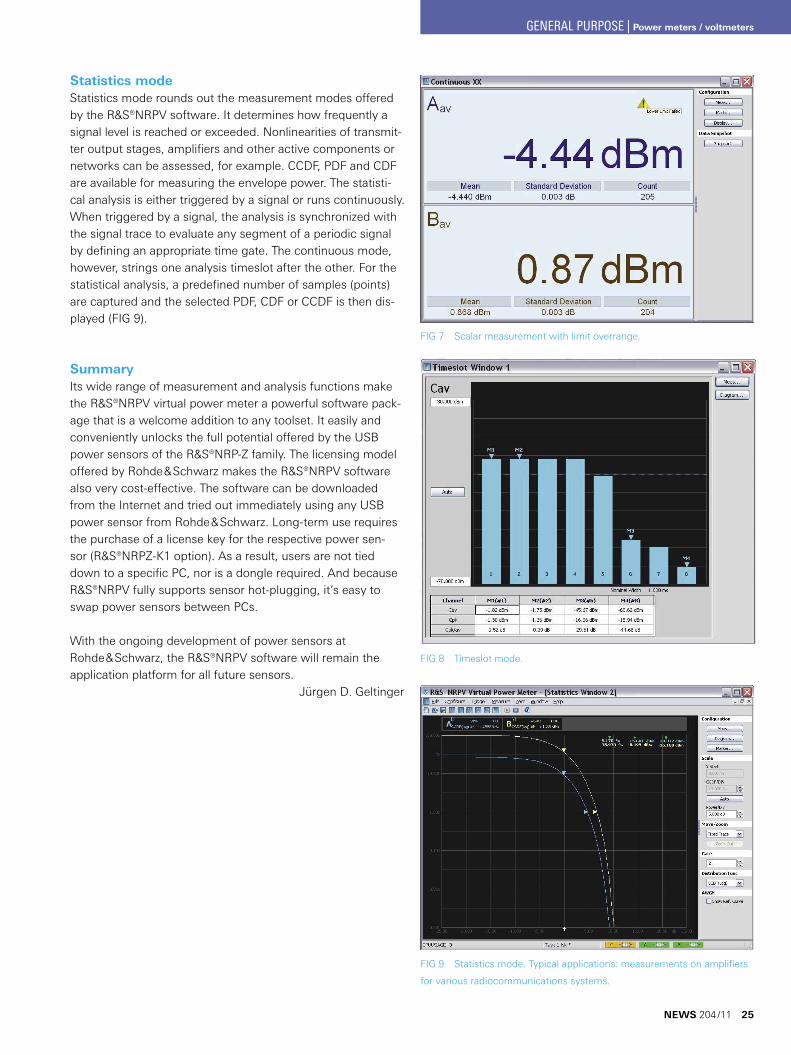
FIG 7 Scalar measurement with limit overrange.
FIG 8 Timeslot mode.
FIG 9 Statistics mode. Typical applications: measurements on amplifiers
for various radiocommunications systems.
Statistics modeStatistics mode rounds out the measurement modes offered by the R&S®NRPV software. It determines how frequently a signal level is reached or exceeded. Nonlinearities of transmit-ter output stages, amplifiers and other active components or networks can be assessed, for example. CCDF, PDF and CDF are available for measuring the envelope power. The statisti-cal analysis is either triggered by a signal or runs continuously. When triggered by a signal, the analysis is synchronized with the signal trace to evaluate any segment of a periodic signal by defining an appropriate time gate. The continuous mode, however, strings one analysis timeslot after the other. For the statistical analysis, a predefined number of samples (points) are captured and the selected PDF, CDF or CCDF is then dis-played (FIG 9).
SummaryIts wide range of measurement and analysis functions make the R&S®NRPV virtual power meter a powerful software pack-age that is a welcome addition to any toolset. It easily and conveniently unlocks the full potential offered by the USB power sensors of the R&S®NRP-Z family. The licensing model offered by Rohde&Schwarz makes the R&S®NRPV software also very cost-effective. The software can be downloaded from the Internet and tried out immediately using any USB power sensor from Rohde&Schwarz. Long-term use requires the purchase of a license key for the respective power sen-sor (R&S®NRPZ-K1 option). As a result, users are not tied down to a specific PC, nor is a dongle required. And because R&S®NRPV fully supports sensor hot-plugging, it’s easy to swap power sensors between PCs.
With the ongoing development of power sensors at Rohde&Schwarz, the R&S®NRPV software will remain the application platform for all future sensors.
Jürgen D. Geltinger
NEWS 204 /11 25
GENERAL PURPOSE | Power meters / voltmeters
26
I/Q recorder brings real radio scenarios cost-efficiently into the labThe R&S®IQR I/Q data recorder records and plays I/Q data in realtime. Upstream RF receivers record real
radio scenarios that are then faithfully reproduced by downstream RF generators or examined using
analyzers. The following text gives an example of how the spectra of GPS navigation systems are recorded
and later used on DUTs in the lab.
Realistic test conditions are vitalFor testing RF receivers such as are used in mobile phones, in navigation and TV receivers, Rohde&Schwarz provides an unrivaled range of T&M instruments that meet practically any requirement. However, the wide variety of coexisting radio scenarios such as GPS, WLAN, mobile radio networks, broad-cast and other signals makes such testing increasingly expen-sive and time-consuming and even calls for complex test set-ups or test systems. In spite of the effort and cost involved, the tests cannot cope with the full complexity of real scenar-ios, because too many parameters influence the operation of the DUTs. For example, navigation receivers are subject to a considerable amount of interference due to reflections and shadow effects between high-rise buildings while driv-ing; TV receivers and mobile radiotelephones have to work smoothly in fast moving cars or trains under difficult signal conditions. Only tests that are carried out under realistic con-ditions can definitely prove that the relevant devices are func-tioning properly.
Drive tests are a popular way of doing this but their ability to accurately test realistic scenarios come at a cost. Moreover, such drive tests must be carried out every time a new model is developed. If manufacturers also want to test their equip-ment under the specific radio scenarios of foreign target mar-kets, they are confronted with even higher additional costs.Therefore, it is better not to transport the DUTs, but do the opposite and bring real radio scenarios into the test lab. This is one of the typical applications for the R&S®IQR data recorder: It can record and play I/Q data for any RF scenario in realtime. Appropriate upstream RF receivers and down-stream analyzers and generators allow users to analyze real radio scenarios and test DUTs under realistic conditions. The tests can be repeated as often as required, e.g. in order to optimize design models.
RF spectra recording opens up a wide range of applications: Tests can be performed on radios, radio receivers, navigation systems and modules, the operator network coverage can be monitored, and RF spectra can be evaluated in accordance with military requirements.
Basic system setup for recording spectra during drive testsIrrespective of the specific application, a basic system setup includes – in addition to an R&S®IQR I/Q data recorder – an RF receiver, an instrument for generating the RF spec-trum or an instrument for analyzing I/Q data (FIG 1). Which T&M instrument is used depends on the frequencies and bandwidths of the spectrum to be recorded as well as on the analysis planned. The interface between these T&M instru-ments is the company´s proprietary digital I/Q interface, which allows an almost unlimited combination of Rohde&Schwarz equipment in accordance with requirements.
Depending on the bandwidth, either the R&S®TSMW univer-sal radio network analyzer or an R&S®FSV / R&S®FSVR spec-trum analyzer can be used as the RF receiver. A wide range of RF generators is available for playing the recorded spec-tra. Moreover, digital I/Q signals can be analyzed by a PC. The
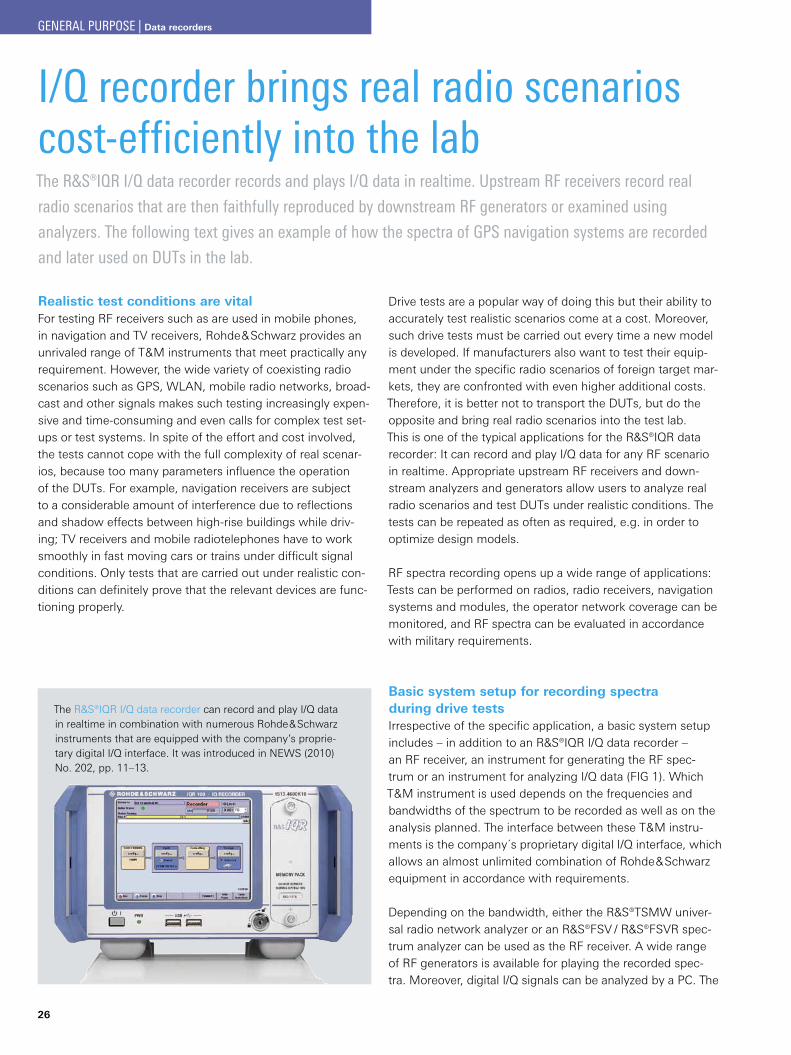
The R&S®IQR I/Q data recorder can record and play I/Q data in realtime in combination with numerous Rohde&Schwarz instruments that are equipped with the company’s proprie-tary digital I/Q interface. It was introduced in NEWS (2010) No. 202, pp. 11–13.
GENERAL PURPOSE | Data recorders
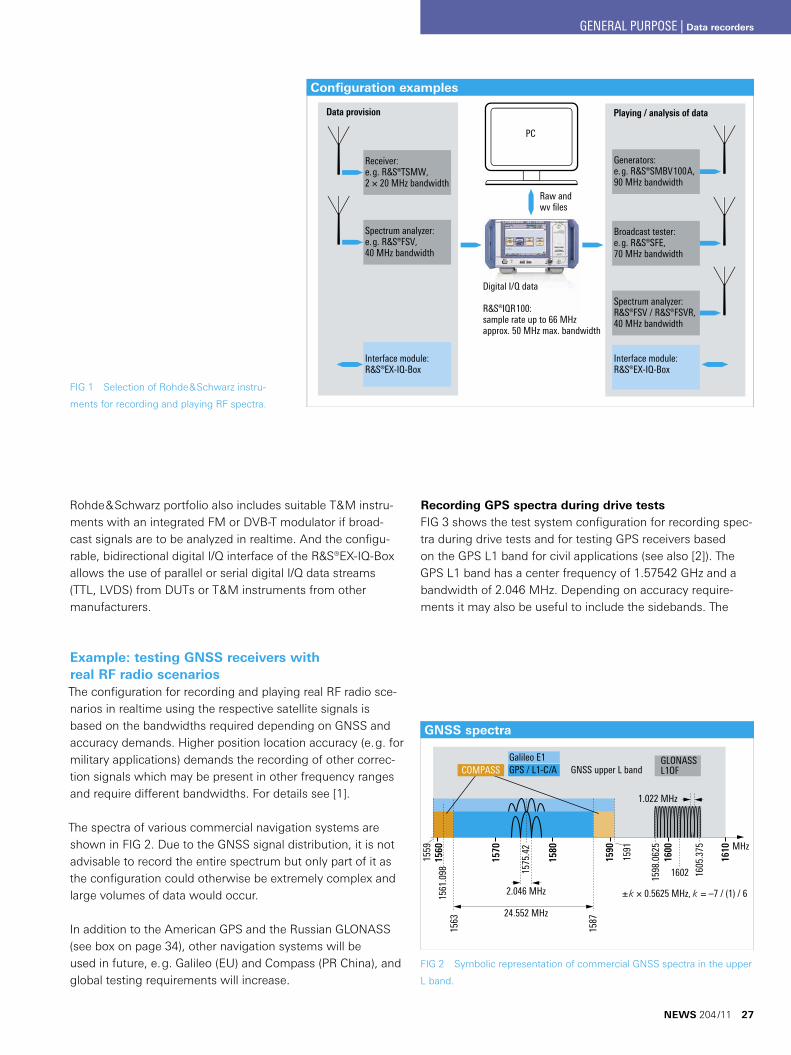
Configuration examples
Receiver:e.g. ¸TSMW,2 × 20 MHz bandwidth
Data provision
Spectrum analyzer:e.g. ¸FSV,40 MHz bandwidth
Interface module:¸EX-IQ-Box
Interface module:¸EX-IQ-Box
Generators:e.g. ¸SMBV100A,90 MHz bandwidth
Playing / analysis of data
Broadcast tester:e.g. ¸SFE,70 MHz bandwidth
Spectrum analyzer:R&S®FSV / ¸FSVR,40 MHz bandwidth
Raw and wv files
Digital I/Q data
¸IQR100:sample rate up to 66 MHzapprox. 50 MHz max. bandwidth
PC
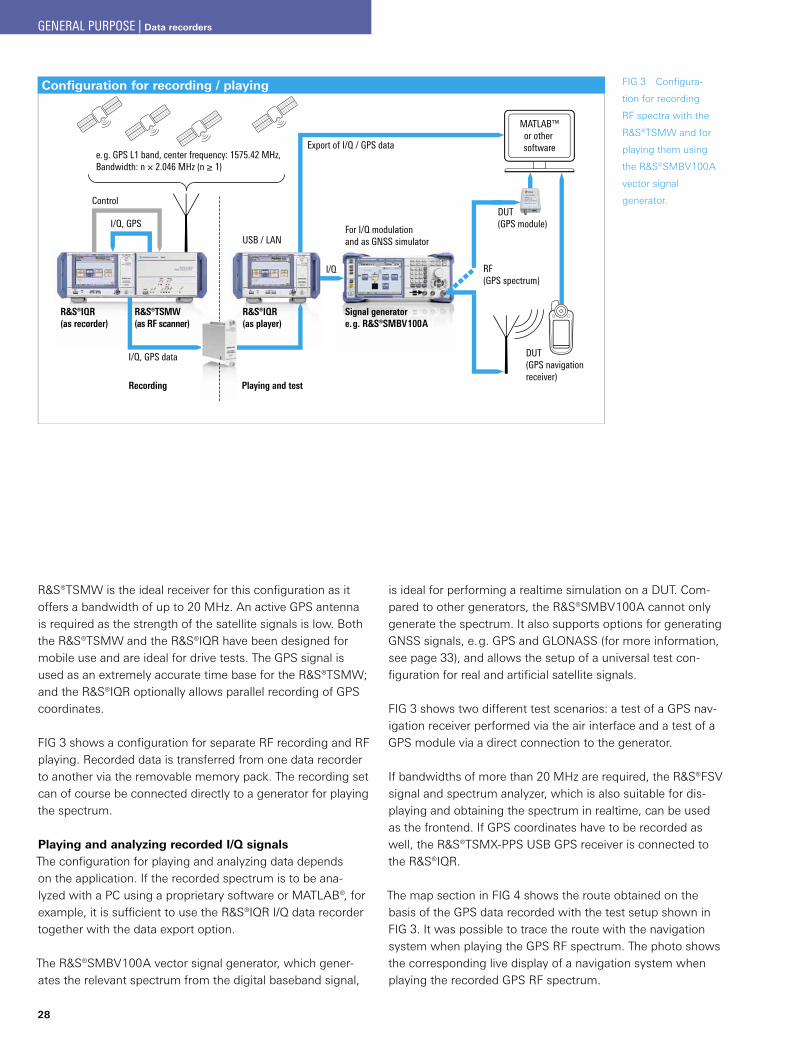
GNSS spectra
MHz
1561
.098 15
75.4
2
1598
.062
5
1605
.375
1559
1563
1591
1590
1600
1587
2.046 MHz
24.552 MHz
1610
±k × 0.5625 MHz, k = –7 / (1) / 6
1560
1570
1580
GPS / L1-C/AGalileo E1
1.022 MHz
GNSS upper L bandGLONASSL1OFCOMPASS
1602
Rohde&Schwarz portfolio also includes suitable T&M instru-ments with an integrated FM or DVB-T modulator if broad-cast signals are to be analyzed in realtime. And the configu-rable, bidirectional digital I/Q interface of the R&S®EX-IQ-Box allows the use of parallel or serial digital I/Q data streams (TTL, LVDS) from DUTs or T&M instruments from other manufacturers.
Example: testing GNSS receivers with real RF radio scenariosThe configuration for recording and playing real RF radio sce-narios in realtime using the respective satellite signals is based on the bandwidths required depending on GNSS and accuracy demands. Higher position location accuracy (e.g. for military applications) demands the recording of other correc-tion signals which may be present in other frequency ranges and require different bandwidths. For details see [1].
The spectra of various commercial navigation systems are shown in FIG 2. Due to the GNSS signal distribution, it is not advisable to record the entire spectrum but only part of it as the configuration could otherwise be extremely complex and large volumes of data would occur.
In addition to the American GPS and the Russian GLONASS (see box on page 34), other navigation systems will be used in future, e.g. Galileo (EU) and Compass (PR China), and global testing requirements will increase.
FIG 1 Selection of Rohde&Schwarz instru-
ments for recording and playing RF spectra.
FIG 2 Symbolic representation of commercial GNSS spectra in the upper
L band.
Recording GPS spectra during drive testsFIG 3 shows the test system configuration for recording spec-tra during drive tests and for testing GPS receivers based on the GPS L1 band for civil applications (see also [2]). The GPS L1 band has a center frequency of 1.57542 GHz and a bandwidth of 2.046 MHz. Depending on accuracy require-ments it may also be useful to include the sidebands. The
NEWS 204 /11 27
GENERAL PURPOSE | Data recorders
I/Q
¸IQR(as player)
Signal generatore.g. ¸SMBV100A
USB / LAN
Export of I/Q / GPS data
RF (GPS spectrum)
For I/Q modulation and as GNSS simulator
MATLAB™or other software
e.g. GPS L1 band, center frequency: 1575.42 MHz,Bandwidth: n × 2.046 MHz (n ≥ 1)
DUT(GPS navigation receiver)
I/Q, GPS
Control
¸IQR(as recorder)
Recording Playing and test
¸TSMW(as RF scanner)
I/Q, GPS data
DUT(GPS module)
Configuration for recording / playing
28
R&S®TSMW is the ideal receiver for this configuration as it offers a bandwidth of up to 20 MHz. An active GPS antenna is required as the strength of the satellite signals is low. Both the R&S®TSMW and the R&S®IQR have been designed for mobile use and are ideal for drive tests. The GPS signal is used as an extremely accurate time base for the R&S®TSMW; and the R&S®IQR optionally allows parallel recording of GPS coordinates.
FIG 3 shows a configuration for separate RF recording and RF playing. Recorded data is transferred from one data recorder to another via the removable memory pack. The recording set can of course be connected directly to a generator for playing the spectrum.
Playing and analyzing recorded I/Q signalsThe configuration for playing and analyzing data depends on the application. If the recorded spectrum is to be ana-lyzed with a PC using a proprietary software or MATLAB®, for example, it is sufficient to use the R&S®IQR I/Q data recorder together with the data export option.
The R&S®SMBV100A vector signal generator, which gener-ates the relevant spectrum from the digital baseband signal,
FIG 3 Configura-
tion for recording
RF spectra with the
R&S®TSMW and for
playing them using
the R&S®SMBV100A
vector signal
generator.
is ideal for performing a realtime simulation on a DUT. Com-pared to other generators, the R&S®SMBV100A cannot only generate the spectrum. It also supports options for generating GNSS signals, e.g. GPS and GLONASS (for more information, see page 33), and allows the setup of a universal test con-figuration for real and artificial satellite signals.
FIG 3 shows two different test scenarios: a test of a GPS nav-igation receiver performed via the air interface and a test of a GPS module via a direct connection to the generator.
If bandwidths of more than 20 MHz are required, the R&S®FSV signal and spectrum analyzer, which is also suitable for dis-playing and obtaining the spectrum in realtime, can be used as the frontend. If GPS coordinates have to be recorded as well, the R&S®TSMX-PPS USB GPS receiver is connected to the R&S®IQR.
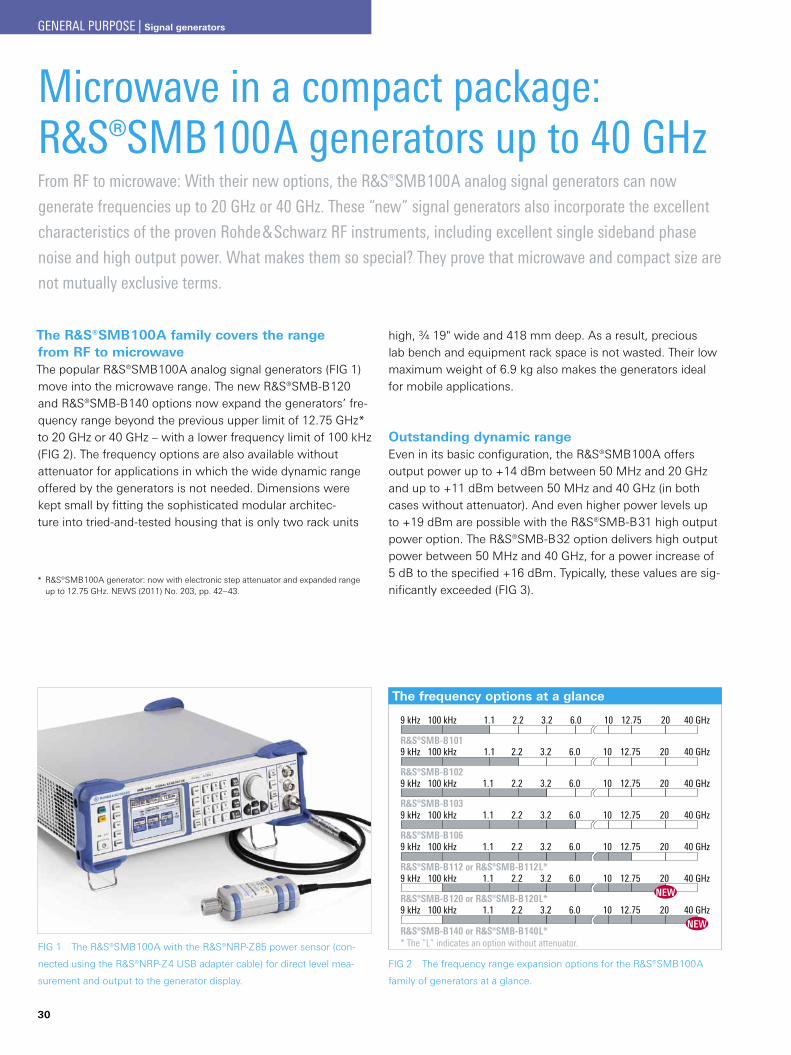
The map section in FIG 4 shows the route obtained on the basis of the GPS data recorded with the test setup shown in FIG 3. It was possible to trace the route with the navigation system when playing the GPS RF spectrum. The photo shows the corresponding live display of a navigation system when playing the recorded GPS RF spectrum.
GENERAL PURPOSE | Data recorders
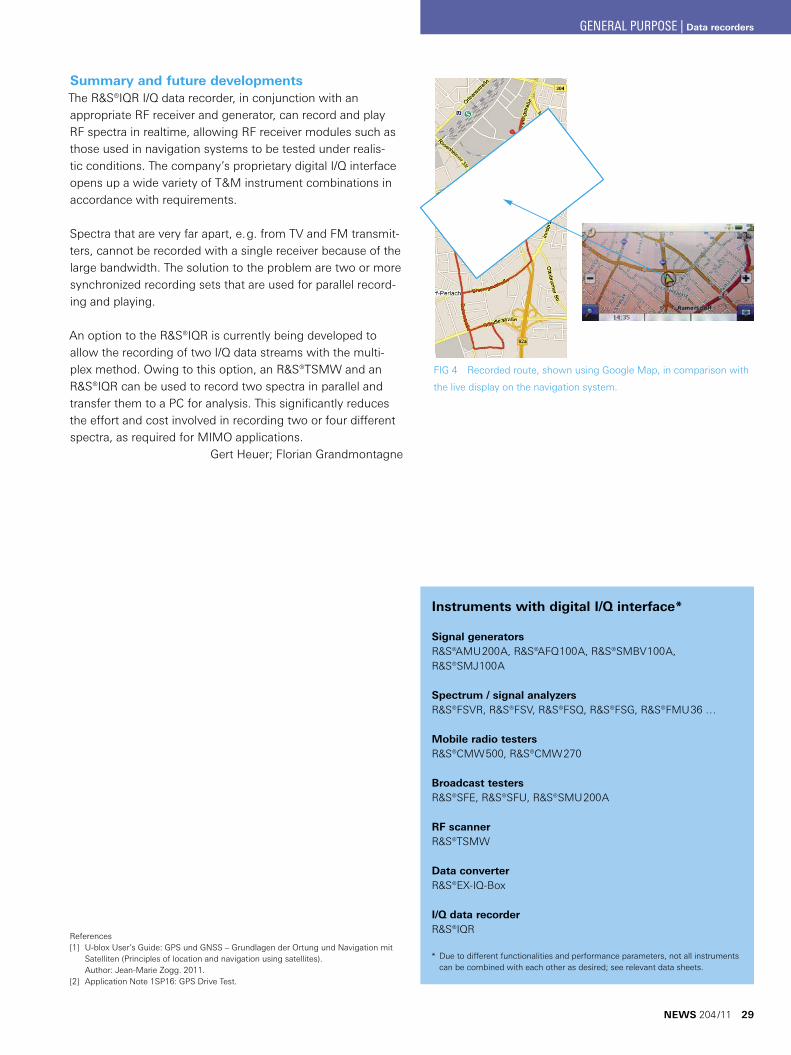
FIG 4 Recorded route, shown using Google Map, in comparison with
the live display on the navigation system.
Summary and future developmentsThe R&S®IQR I/Q data recorder, in conjunction with an appropriate RF receiver and generator, can record and play RF spectra in realtime, allowing RF receiver modules such as those used in navigation systems to be tested under realis-tic conditions. The company’s proprietary digital I/Q interface opens up a wide variety of T&M instrument combinations in accordance with requirements.
Spectra that are very far apart, e.g. from TV and FM transmit-ters, cannot be recorded with a single receiver because of the large bandwidth. The solution to the problem are two or more synchronized recording sets that are used for parallel record-ing and playing.
An option to the R&S®IQR is currently being developed to allow the recording of two I/Q data streams with the multi-plex method. Owing to this option, an R&S®TSMW and an R&S®IQR can be used to record two spectra in parallel and transfer them to a PC for analysis. This significantly reduces the effort and cost involved in recording two or four different spectra, as required for MIMO applications.
Gert Heuer; Florian Grandmontagne
Instruments with digital I/Q interface*
Signal generators R&S®AMU200A, R&S®AFQ100A, R&S®SMBV100A, R&S®SMJ100A
Spectrum / signal analyzersR&S®FSVR, R&S®FSV, R&S®FSQ, R&S®FSG, R&S®FMU36 …
Mobile radio testersR&S®CMW500, R&S®CMW270
Broadcast testersR&S®SFE, R&S®SFU, R&S®SMU200A
RF scannerR&S®TSMW
Data converterR&S®EX-IQ-Box
I/Q data recorderR&S®IQR
* Due to different functionalities and performance parameters, not all instruments can be combined with each other as desired; see relevant data sheets.
References[1] U-blox User’s Guide: GPS und GNSS – Grundlagen der Ortung und Navigation mit
Satelliten (Principles of location and navigation using satellites). Author: Jean-Marie Zogg. 2011.
[2] Application Note 1SP16: GPS Drive Test.
NEWS 204 /11 29
GENERAL PURPOSE | Data recorders
The frequency options at a glance
NEW
NEW
9 kHz 100 kHz 1.1 2.2 3.2 6.0 10 40 GHz
R&S®SMB-B101
R&S®SMB-B102
R&S®SMB-B103
R&S®SMB-B106
R&S®SMB-B112 or R&S®SMB-B112L*
R&S®SMB-B120 or R&S®SMB-B120L*
R&S®SMB-B140 or R&S®SMB-B140L** The “L” indicates an option without attenuator.
2012.75
9 kHz 100 kHz 1.1 2.2 3.2 6.0 10 40 GHz20 12.75
9 kHz 100 kHz 1.1 2.2 3.2 6.0 10 40 GHz20 12.75
9 kHz 100 kHz 1.1 2.2 3.2 6.0 10 40 GHz20 12.75
9 kHz 100 kHz 1.1 2.2 3.2 6.0 10 40 GHz20 12.75
9 kHz 100 kHz 1.1 2.2 3.2 6.0 10 40 GHz20 12.75
9 kHz 100 kHz 1.1 2.2 3.2 6.0 10 40 GHz20 12.75
30
Microwave in a compact package: R&S®SMB100A generators up to 40 GHzFrom RF to microwave: With their new options, the R&S®SMB100A analog signal generators can now
generate frequencies up to 20 GHz or 40 GHz. These “new” signal generators also incorporate the excellent
characteristics of the proven Rohde&Schwarz RF instruments, including excellent single sideband phase
noise and high output power. What makes them so special? They prove that microwave and compact size are
not mutually exclusive terms.
The R&S®SMB100A family covers the range from RF to microwaveThe popular R&S®SMB100A analog signal generators (FIG 1) move into the microwave range. The new R&S®SMB-B120 and R&S®SMB-B140 options now expand the generators’ fre-quency range beyond the previous upper limit of 12.75 GHz* to 20 GHz or 40 GHz – with a lower frequency limit of 100 kHz (FIG 2). The frequency options are also available without attenuator for applications in which the wide dynamic range offered by the generators is not needed. Dimensions were kept small by fitting the sophisticated modular architec-ture into tried-and-tested housing that is only two rack units
high, ¾ 19" wide and 418 mm deep. As a result, precious lab bench and equipment rack space is not wasted. Their low maximum weight of 6.9 kg also makes the generators ideal for mobile applications.
Outstanding dynamic rangeEven in its basic configuration, the R&S®SMB100A offers output power up to +14 dBm between 50 MHz and 20 GHz and up to +11 dBm between 50 MHz and 40 GHz (in both cases without attenuator). And even higher power levels up to +19 dBm are possible with the R&S®SMB-B31 high output power option. The R&S®SMB-B32 option delivers high output power between 50 MHz and 40 GHz, for a power increase of 5 dB to the specified +16 dBm. Typically, these values are sig-nificantly exceeded (FIG 3).
FIG 1 The R&S®SMB100A with the R&S®NRP-Z85 power sensor (con-
nected using the R&S®NRP-Z4 USB adapter cable) for direct level mea-
surement and output to the generator display.
* R&S®SMB100A generator: now with electronic step attenuator and expanded range up to 12.75 GHz. NEWS (2011) No. 203, pp. 42–43.
FIG 2 The frequency range expansion options for the R&S®SMB100A
family of generators at a glance.
GENERAL PURPOSE | Signal generators
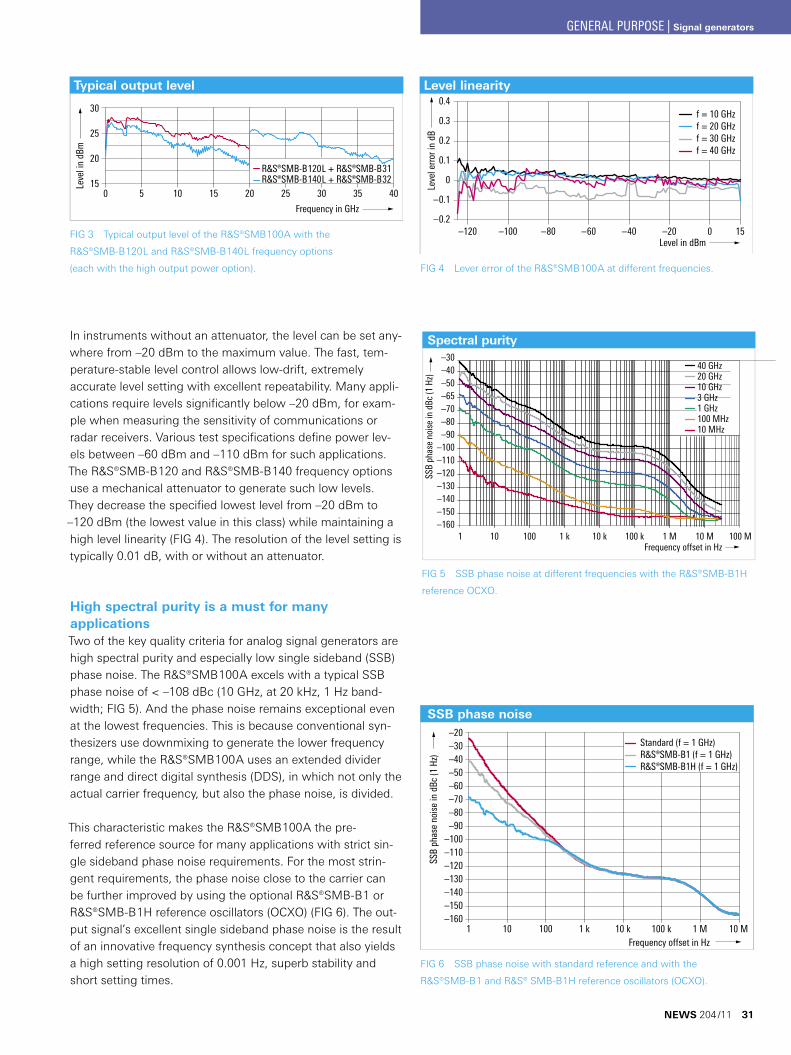
Typical output level
30
25
20
150 5 10 15 20 25 30 35 40
Frequency in GHz
Leve
l in
dBm
R&S®SMB-B120L + R&S®SMB-B31R&S®SMB-B140L + R&S®SMB-B32
Level linearity0.4
0.3
0.2
0.1
0
–0.1
–0.2–120 –100 –80 –60 –40 –20 0 15
Level in dBm
Leve
l erro
r in
dB
f = 10 GHzf = 20 GHzf = 30 GHzf = 40 GHz
Spectral purity
1 10 100 1 k 10 k 100 k 1 M 10 M 100 M
40 GHz20 GHz10 GHz3 GHz1 GHz100 MHz10 MHz
–30–40–50–65–70–80–90
–100–110–120–130–140–150–160
Frequency offset in Hz
SSB
phas
e no
ise
in d
Bc (1
Hz)
SSB phase noise
SSB
phas
e no
ise
in d
Bc (1
Hz)
Standard (f = 1 GHz)R&S®SMB-B1 (f = 1 GHz)R&S®SMB-B1H (f = 1 GHz)
1 10 100 1 k 10 k 100 k 1 M 10 MFrequency offset in Hz
–20–30–40–50–60–70–80–90
–100–110–120–130–140–150–160
FIG 3 Typical output level of the R&S®SMB100A with the
R&S®SMB-B120L and R&S®SMB-B140L frequency options
(each with the high output power option). FIG 4 Lever error of the R&S®SMB100A at different frequencies.
In instruments without an attenuator, the level can be set any-where from –20 dBm to the maximum value. The fast, tem-perature-stable level control allows low-drift, extremely accurate level setting with excellent repeatability. Many appli-cations require levels significantly below –20 dBm, for exam-ple when measuring the sensitivity of communications or radar receivers. Various test specifications define power lev-els between –60 dBm and –110 dBm for such applications. The R&S®SMB-B120 and R&S®SMB-B140 frequency options use a mechanical attenuator to generate such low levels. They decrease the specified lowest level from –20 dBm to –120 dBm (the lowest value in this class) while maintaining a high level linearity (FIG 4). The resolution of the level setting is typically 0.01 dB, with or without an attenuator.
High spectral purity is a must for many applicationsTwo of the key quality criteria for analog signal generators are high spectral purity and especially low single sideband (SSB) phase noise. The R&S®SMB100A excels with a typical SSB phase noise of < –108 dBc (10 GHz, at 20 kHz, 1 Hz band-width; FIG 5). And the phase noise remains exceptional even at the lowest frequencies. This is because conventional syn-thesizers use downmixing to generate the lower frequency range, while the R&S®SMB100A uses an extended divider range and direct digital synthesis (DDS), in which not only the actual carrier frequency, but also the phase noise, is divided.
This characteristic makes the R&S®SMB100A the pre-ferred reference source for many applications with strict sin-gle sideband phase noise requirements. For the most strin-gent requirements, the phase noise close to the carrier can be further improved by using the optional R&S®SMB-B1 or R&S®SMB-B1H reference oscillators (OCXO) (FIG 6). The out-put signal’s excellent single sideband phase noise is the result of an innovative frequency synthesis concept that also yields a high setting resolution of 0.001 Hz, superb stability and short setting times.
FIG 5 SSB phase noise at different frequencies with the R&S®SMB-B1H
reference OCXO.
FIG 6 SSB phase noise with standard reference and with the
R&S®SMB-B1 and R&S® SMB-B1H reference oscillators (OCXO).
NEWS 204 /11 31
GENERAL PURPOSE | Signal generators
32
Rapid level and frequency changesFast VCOs are built into all R&S®SMB100A generators. With frequency setting times of several microseconds, they are clearly superior to the YIG oscillators (which require several hundred microseconds) often used in the microwave range. The difference is especially apparent during a frequency sweep or in List mode, a programmable sequence of up to 2000 frequency and level settings. The rapid frequency and level changes provide a significant cost advantage in auto-mated test systems and on production lines.
In remote control operation, a level setting takes place in less than 3 ms after the IEC/IEEE bus delimiter (without mechan-ical attenuator switching). The frequency change is complete after only 2.5 ms. It is even faster in List mode where setting times of typically only a few 100 μs are achieved, making this mode ideal for fast frequency and level sweeps.
Versatile right down to the pulse signal generatorThe R&S®SMB100A standard configuration is more than ade-quate for many tasks. It not only has outstanding quality cri-teria, it also features excellent functionality. All of the new frequency options include amplitude, frequency and phase modulation. In addition, the signal generator can be com-bined with the R&S®SMB-K21 pulse modulator option, the R&S®SMB-K23 pulse generator option and particularly the R&S®SMB-K27 pulse train option to create a versatile, high-quality pulse signal generator. Pulse trains are configurable pulse scenarios used in radar applications. These pulse trains can be programmed with varying pulse widths, varying pulse pauses and with the necessary repetitions (FIG 7). This per-mits the simulation of jittered or staggered pulses, and the two effects can be used on both the pulse width and the pulse pause.
FIG 7 Pulse train
display on the
R&S®SMB100A.
It is also possible to connect an R&S®NRP-Zxx power sensor to the generator via USB (FIG 1). For demanding applications, the desired power can then be measured directly on the DUT, taking into account cable loss and other components. Correc-tions can be made on the generator to set the desired level on the DUT. The R&S®SMB100A can even replace legacy OEM generators in applications. Since it understands their remote control commands, it can emulate many OEM generators (for more details, please refer to R&S®LegacyPro on www.rohde-schwarz.com).
SummaryThe new frequency options expand the scope for R&S®SMB100A signal generators into the microwave range. Even in their basic configuration, they are both functionally and qualitatively ideal for many tasks. The versatile pulse gen-erator options allow them to be adapted to special require-ments. Production lines and ATE systems benefit from their short level and frequency setting times. Both the low power consumption of only 120 W for a fully equipped 40 GHz instrument and the recommended calibration interval of three years contribute to profitability. All the generators have clear block diagram displays, the same appearance and handling, and identical remote control commands, thereby making day-to-day work easier.
Frank-Werner Thümmler
GENERAL PURPOSE | Signal generators
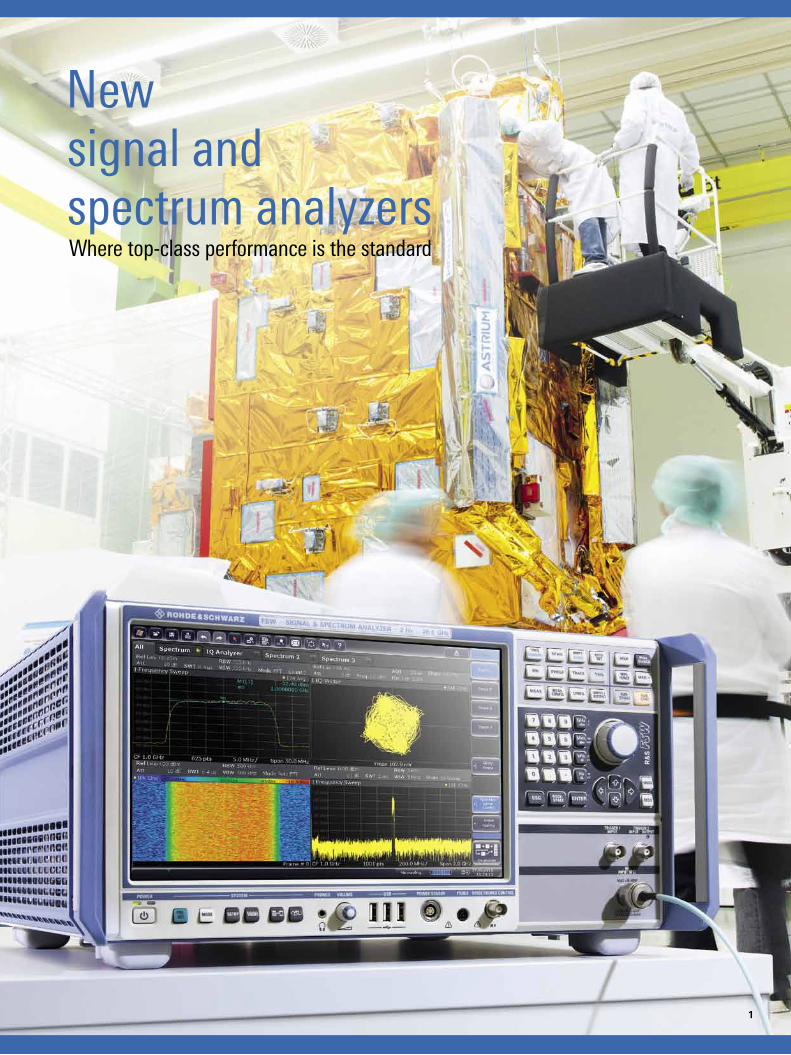
Newsignal andspectrum analyzersWhere top-class performance is the standard
1
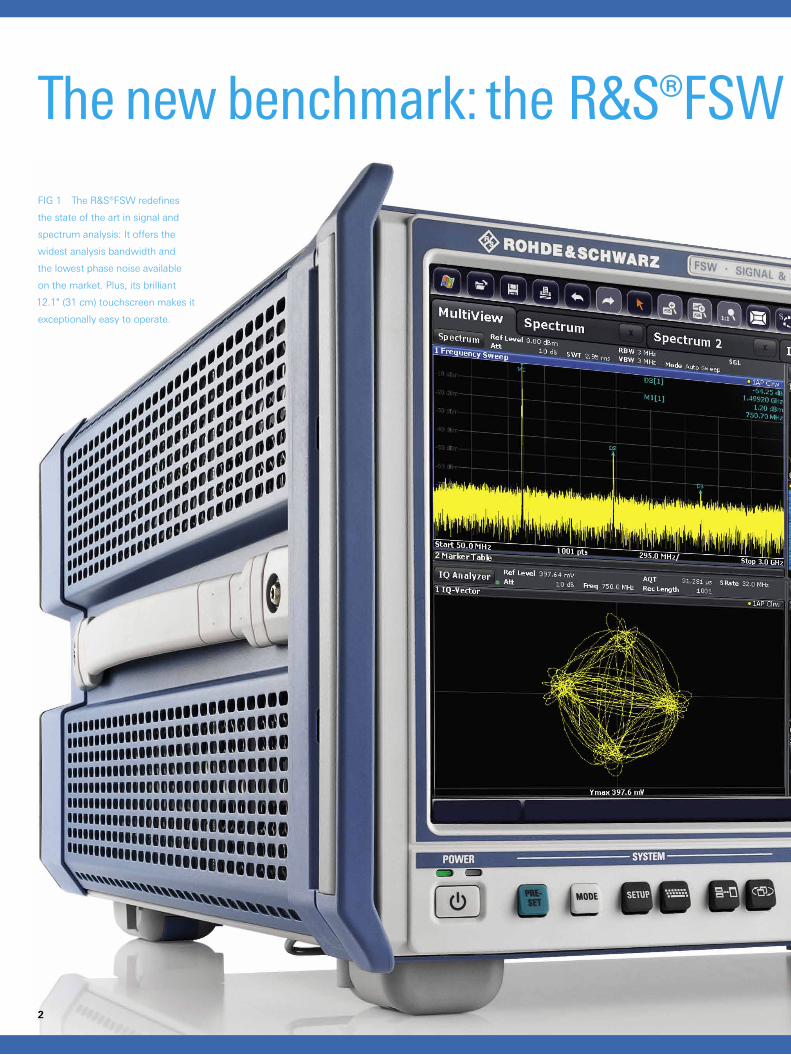
2
The new benchmark: the R&S®FSW signal and spectrum analyzerFIG 1 The R&S®FSW redefines
the state of the art in signal and
spectrum analysis: It offers the
widest analysis bandwidth and
the lowest phase noise available
on the market. Plus, its brilliant
12.1" (31 cm) touchscreen makes it
exceptionally easy to operate.
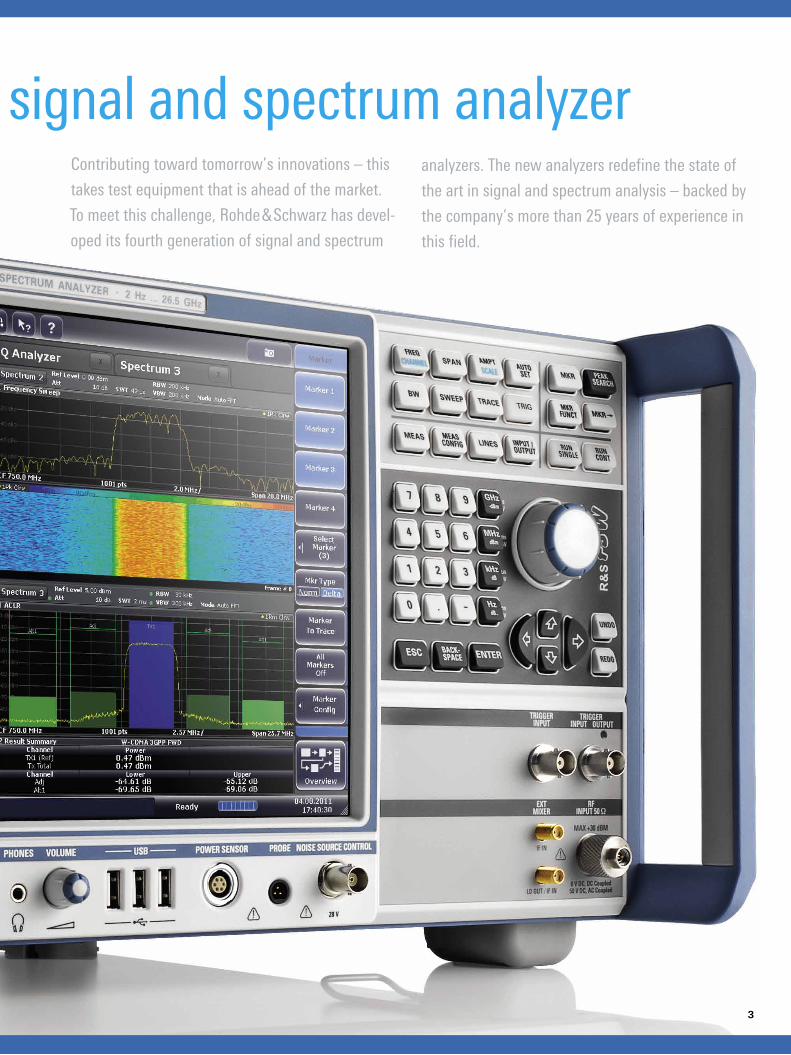
The new benchmark: the R&S®FSW signal and spectrum analyzerContributing toward tomorrow’s innovations – this
takes test equipment that is ahead of the market.
To meet this challenge, Rohde&Schwarz has devel-
oped its fourth generation of signal and spectrum
analyzers. The new analyzers redefine the state of
the art in signal and spectrum analysis – backed by
the company’s more than 25 years of experience in
this field.
3
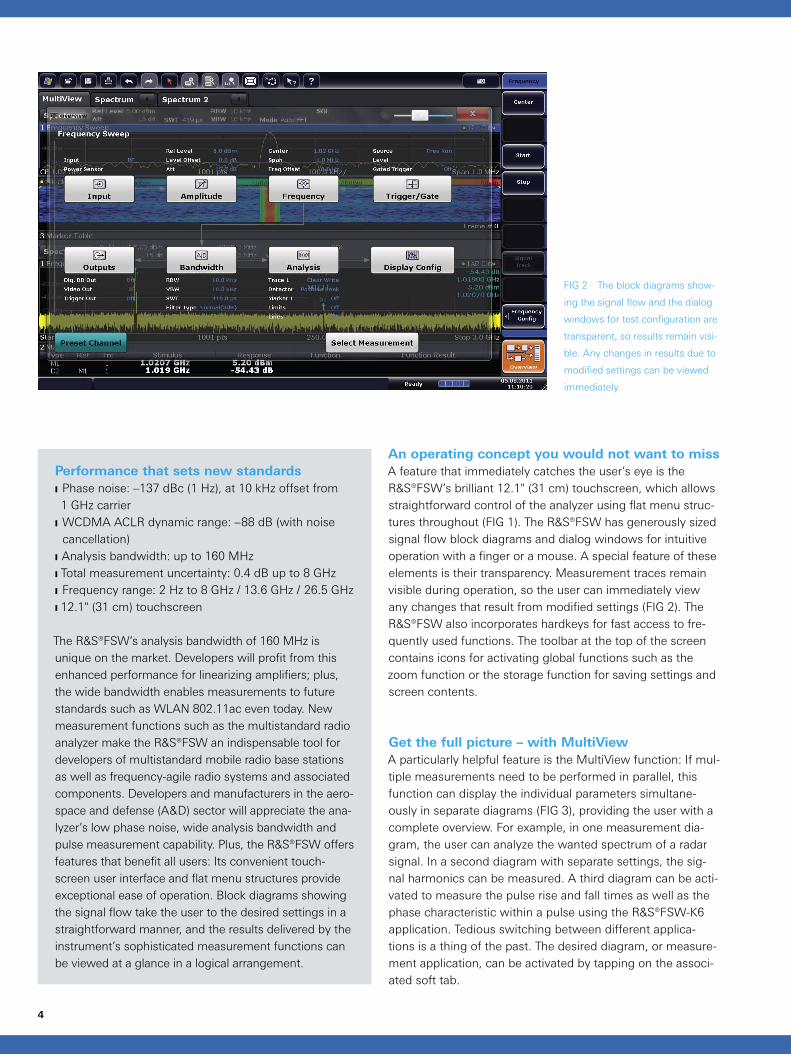
4
An operating concept you would not want to missA feature that immediately catches the user’s eye is the R&S®FSW’s brilliant 12.1" (31 cm) touchscreen, which allows straightforward control of the analyzer using flat menu struc-tures throughout (FIG 1). The R&S®FSW has generously sized signal flow block diagrams and dialog windows for intuitive operation with a finger or a mouse. A special feature of these elements is their transparency. Measurement traces remain visible during operation, so the user can immediately view any changes that result from modified settings (FIG 2). The R&S®FSW also incorporates hardkeys for fast access to fre-quently used functions. The toolbar at the top of the screen contains icons for activating global functions such as the zoom function or the storage function for saving settings and screen contents.
Get the full picture – with MultiViewA particularly helpful feature is the MultiView function: If mul-tiple measurements need to be performed in parallel, this function can display the individual parameters simultane-ously in separate diagrams (FIG 3), providing the user with a complete overview. For example, in one measurement dia-gram, the user can analyze the wanted spectrum of a radar signal. In a second diagram with separate settings, the sig-nal harmonics can be measured. A third diagram can be acti-vated to measure the pulse rise and fall times as well as the phase characteristic within a pulse using the R&S®FSW-K6 application. Tedious switching between different applica-tions is a thing of the past. The desired diagram, or measure-ment application, can be activated by tapping on the associ-ated soft tab.
FIG 2 The block diagrams show-
ing the signal flow and the dialog
windows for test configuration are
transparent, so results remain visi-
ble. Any changes in results due to
modified settings can be viewed
immediately.
Performance that sets new standards ❙ Phase noise: –137 dBc (1 Hz), at 10 kHz offset from 1 GHz carrier ❙ WCDMA ACLR dynamic range: –88 dB (with noise cancellation)
❙ Analysis bandwidth: up to 160 MHz ❙ Total measurement uncertainty: 0.4 dB up to 8 GHz ❙ Frequency range: 2 Hz to 8 GHz / 13.6 GHz / 26.5 GHz ❙ 12.1" (31 cm) touchscreen
The R&S®FSW’s analysis bandwidth of 160 MHz is unique on the market. Developers will profit from this enhanced performance for linearizing amplifiers; plus, the wide bandwidth enables measurements to future standards such as WLAN 802.11ac even today. New measurement functions such as the multistandard radio analyzer make the R&S®FSW an indispensable tool for developers of multistandard mobile radio base stations as well as frequency-agile radio systems and associated components. Developers and manufacturers in the aero-space and defense (A&D) sector will appreciate the ana-lyzer’s low phase noise, wide analysis bandwidth and pulse measurement capability. Plus, the R&S®FSW offers features that benefit all users: Its convenient touch-screen user interface and flat menu structures provide exceptional ease of operation. Block diagrams showing the signal flow take the user to the desired settings in a straightforward manner, and the results delivered by the instrument’s sophisticated measurement functions can be viewed at a glance in a logical arrangement.
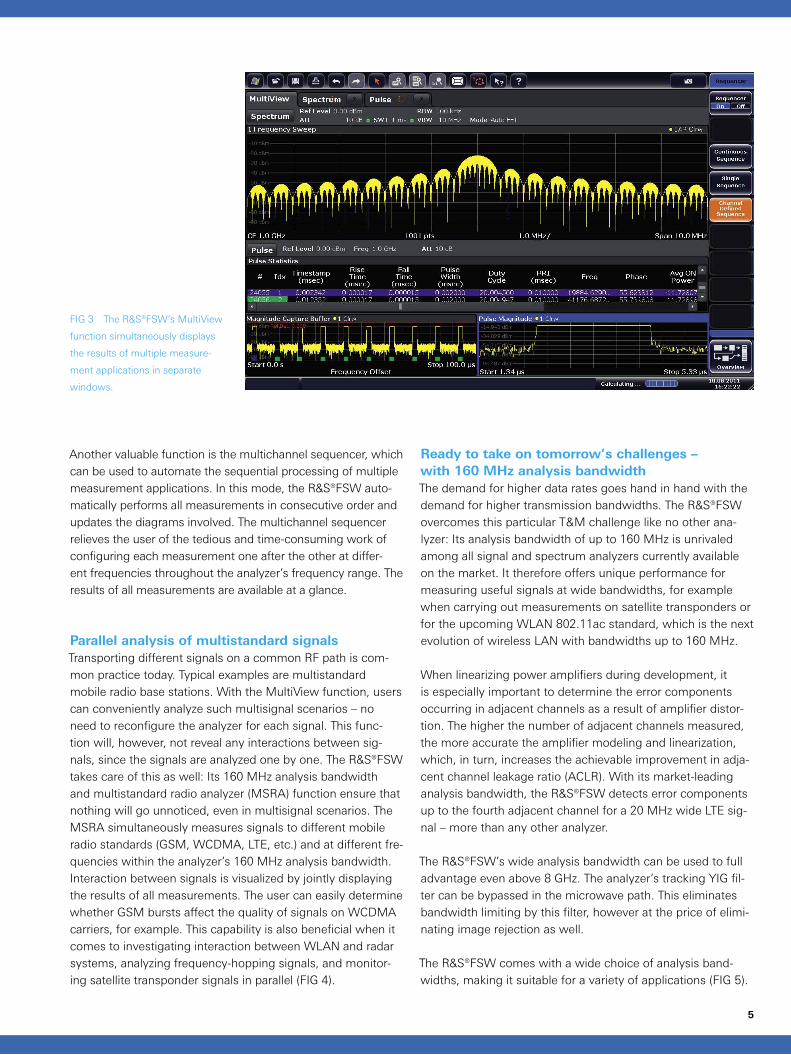
Another valuable function is the multichannel sequencer, which can be used to automate the sequential processing of multiple measurement applications. In this mode, the R&S®FSW auto-matically performs all measurements in consecutive order and updates the diagrams involved. The multi channel sequencer relieves the user of the tedious and time-consuming work of configuring each measurement one after the other at differ-ent frequencies throughout the analyzer’s frequency range. The results of all measurements are available at a glance.
Parallel analysis of multistandard signalsTransporting different signals on a common RF path is com-mon practice today. Typical examples are multi standard mobile radio base stations. With the MultiView function, users can conveniently analyze such multisignal scenarios – no need to reconfigure the analyzer for each signal. This func-tion will, however, not reveal any interactions between sig-nals, since the signals are analyzed one by one. The R&S®FSW takes care of this as well: Its 160 MHz analysis bandwidth and multistandard radio analyzer (MSRA) function ensure that nothing will go unnoticed, even in multisignal scenarios. The MSRA simultaneously measures signals to different mobile radio standards (GSM, WCDMA, LTE, etc.) and at different fre-quencies within the analyzer’s 160 MHz analysis bandwidth. Interaction between signals is visualized by jointly displaying the results of all measurements. The user can easily determine whether GSM bursts affect the quality of signals on WCDMA carriers, for example. This capability is also beneficial when it comes to investigating interaction between WLAN and radar systems, analyzing frequency-hopping signals, and monitor-ing satellite transponder signals in parallel (FIG 4).
FIG 3 The R&S®FSW’s MultiView
function simultaneously displays
the results of multiple measure-
ment applications in separate
windows.
Ready to take on tomorrow’s challenges – with 160 MHz analysis bandwidthThe demand for higher data rates goes hand in hand with the demand for higher transmission bandwidths. The R&S®FSW overcomes this particular T&M challenge like no other ana-lyzer: Its analysis bandwidth of up to 160 MHz is unrivaled among all signal and spectrum analyzers currently available on the market. It therefore offers unique performance for measuring useful signals at wide bandwidths, for example when carrying out measurements on satellite transponders or for the upcoming WLAN 802.11ac standard, which is the next evolution of wireless LAN with bandwidths up to 160 MHz.
When linearizing power amplifiers during development, it is especially important to determine the error components occurring in adjacent channels as a result of amplifier distor-tion. The higher the number of adjacent channels measured, the more accurate the amplifier modeling and linearization, which, in turn, increases the achievable improvement in adja-cent channel leakage ratio (ACLR). With its market-leading analysis bandwidth, the R&S®FSW detects error components up to the fourth adjacent channel for a 20 MHz wide LTE sig-nal – more than any other analyzer.
The R&S®FSW’s wide analysis bandwidth can be used to full advantage even above 8 GHz. The analyzer’s tracking YIG fil-ter can be bypassed in the microwave path. This eliminates bandwidth limiting by this filter, however at the price of elimi-nating image rejection as well.
The R&S®FSW comes with a wide choice of analysis band-widths, making it suitable for a variety of applications (FIG 5).
5
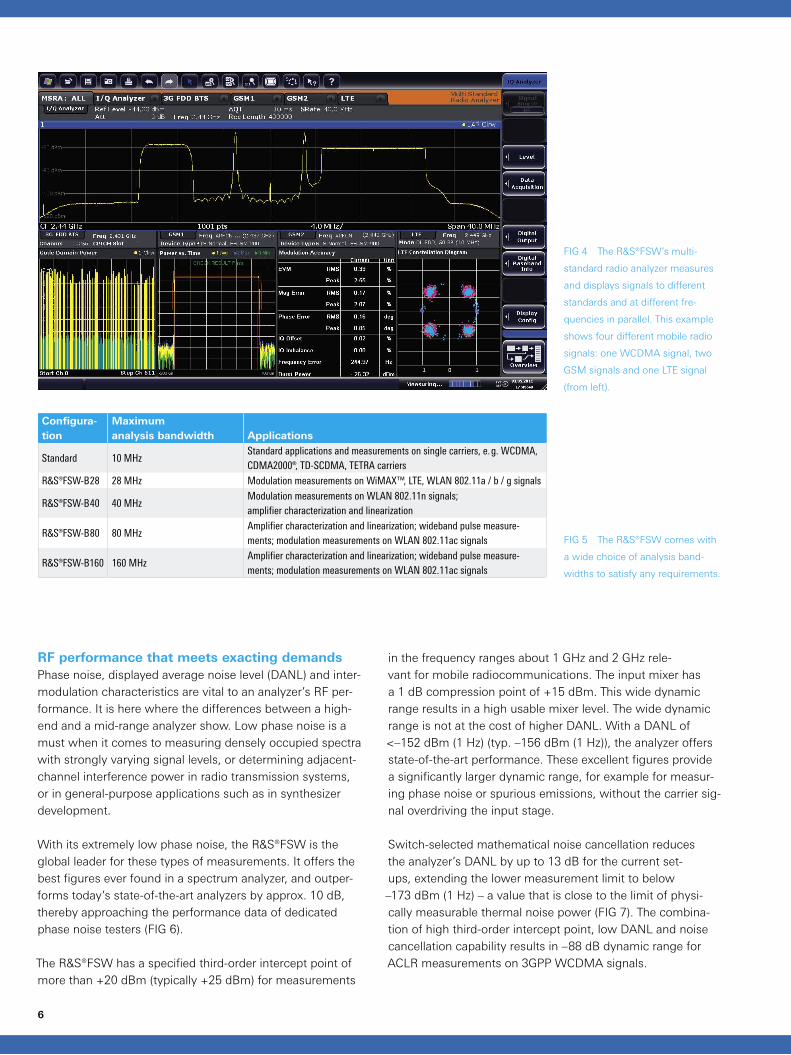
6
RF performance that meets exacting demandsPhase noise, displayed average noise level (DANL) and inter-modulation characteristics are vital to an analyzer’s RF per-formance. It is here where the differences between a high-end and a mid-range analyzer show. Low phase noise is a must when it comes to measuring densely occupied spectra with strongly varying signal levels, or determining adjacent-channel interference power in radio transmission systems, or in general-purpose applications such as in synthesizer development.
With its extremely low phase noise, the R&S®FSW is the global leader for these types of measurements. It offers the best figures ever found in a spectrum analyzer, and outper-forms today’s state-of-the-art analyzers by approx. 10 dB, thereby approaching the performance data of dedicated phase noise testers (FIG 6).
The R&S®FSW has a specified third-order intercept point of more than +20 dBm (typically +25 dBm) for measurements
Configura-tion
Maximum analysis bandwidth Applications
Standard 10 MHzStandard applications and measurements on single carriers, e.g. WCDMA, CDMA2000®, TD-SCDMA, TETRA carriers
R&S®FSW-B28 28 MHz Modulation measurements on WiMAX™, LTE, WLAN 802.11a / b / g signals
R&S®FSW-B40 40 MHzModulation measurements on WLAN 802.11n signals; amplifier characterization and linearization
R&S®FSW-B80 80 MHzAmplifier characterization and linearization; wideband pulse measure-ments; modulation measurements on WLAN 802.11ac signals
R&S®FSW-B160 160 MHzAmplifier characterization and linearization; wideband pulse measure-ments; modulation measurements on WLAN 802.11ac signals
FIG 5 The R&S®FSW comes with
a wide choice of analysis band-
widths to satisfy any requirements.
FIG 4 The R&S®FSW’s multi-
standard radio analyzer measures
and displays signals to different
standards and at different fre-
quencies in parallel. This example
shows four different mobile radio
signals: one WCDMA signal, two
GSM signals and one LTE signal
(from left).
in the frequency ranges about 1 GHz and 2 GHz rele-vant for mobile radiocommunications. The input mixer has a 1 dB compression point of +15 dBm. This wide dynamic range results in a high usable mixer level. The wide dynamic range is not at the cost of higher DANL. With a DANL of <–152 dBm (1 Hz) (typ. –156 dBm (1 Hz)), the analyzer offers state-of-the-art performance. These excellent figures provide a significantly larger dynamic range, for example for measur-ing phase noise or spurious emissions, without the carrier sig-nal overdriving the input stage.
Switch-selected mathematical noise cancellation reduces the analyzer’s DANL by up to 13 dB for the current set-ups, extending the lower measurement limit to below –173 dBm (1 Hz) – a value that is close to the limit of physi-cally measurable thermal noise power (FIG 7). The combina-tion of high third-order intercept point, low DANL and noise cancellation capability results in –88 dB dynamic range for ACLR measurements on 3GPP WCDMA signals.
Harmonic measurements made easy with integrated highpass filtersIn the microwave receive path above 8 GHz, a tracking YIG fil-ter is used to limit signal bandwidth at the input mixer, keep-ing the fundamental away from the mixer stage, which is important for harmonic measurements in particular. In the RF path, by contrast, wideband measurements are carried out without preselection. This means that the dynamic range for harmonic measurements depends on the analyzer’s inherent intermodulation products for carrier frequencies up to 4 GHz. The R&S®FSW excels here as well: With a second harmonic intercept point of +52 dBm at 1 GHz, the analyzer is the ideal
choice for measuring harmonics fast and with a high dynamic range. Plus, for signals between 500 MHz and 4 GHz, the analyzer features switchable highpass filters to suppress the fundamental and thereby increase the dynamic range for har-monic measurements. Use of a highpass filter will push the second harmonic intercept point to 70 dBm. This eliminates the need for external filters, reducing the number of filters and switching relays required in system applications, for exam-ple. Highpass filters for carrier frequencies from 1.5 GHz to 4 GHz are included as standard; highpass filters for 500 MHz to 1.5 GHz can be added with the R&S®FSW-B13 option.
FIG 6 The R&S®FSW outperforms
today’s state-of-the-art analyzers
by approx. 10 dB, featuring phase
noise of –137 dBc (1 Hz) at 10 kHz
offset from a 1 GHz carrier.
FIG 7 Displayed average noise
level (DANL) with preamplifier and
noise cancellation switched on.
7
8
High level measurement accuracy up to 8 GHzIn addition to dynamic range, level measurement accuracy plays an eminent role in all T&M applications. Here, too, the R&S®FSW offers impressive figures: With a total measure-ment uncertainty (including RF attenuation and frequency response) of 0.3 dB up to 3 GHz and only 0.4 dB up to 8 GHz, it delivers accurate, dependable results. For frequencies between 3 GHz and 8 GHz in particular, the R&S®FSW has level measurement accuracy closer to that of power meters than have conventional analyzers, many of which exhibit 1 dB to 2 dB frequency response above approx. 3 GHz. The R&S®FSW thereby simplifies test setups in development and production for measurements on WLAN 802.11a and 802.11ac signals in the 5 GHz range as well as WiMAX™ sig-nals in the range between 3.4 GHz and 3.8 GHz.
The R&S®FSW: a safe investmentThe R&S®FSW is of modular design, which makes it easy to accommodate new technologies and performance enhance-ments. The controller, power supply and digital signal pro-cessing (DSP) board are designed as plug-in modules and inserted into slots on the rear. Optional modules, such as for bandwidth extension, are likewise accommodated on the rear. This makes the R&S®FSW a safe investment.
Keeping user data confidentialThe R&S®FSW’s internal solid-state disk containing the operat-ing system, analyzer firmware and user data is also accessible from the rear. This makes it easy to remove or exchange the disk, for example among different analyzers, and keep confi-dential data within a secure area. Device-specific alignment data is stored on the R&S®FSW modules separately and inde-pendently of the user data.
Easy replacement of obsolete analyzersUsers are frequently faced with the complex task of having to modernize proven test systems that were validated at sub-stantial cost and effort, for example because a central sys-tem component such as a spectrum analyzer can no longer be repaired or procured. The R&S®FSW solves this prob-lem. It supports the remote control command sets of other Rohde&Schwarz analyzers, and even those of other manu-facturers’ instruments. Replacing an obsolete analyzer with an R&S®FSW therefore poses no problems, as is also demon-strated by numerous successful reference projects with the R&S®FSV and R&S®FSU analyzers. On top of this, the user will benefit from the higher measurement speed of the R&S®FSW.
Herbert Schmitt
Condensed data of the R&S®FSW
Frequency range R&S®FSW8 2 Hz to 8 GHz R&S®FSW13 2 Hz to 13.6 GHz R&S®FSW26 2 Hz to 26.5 GHzBandwidthsResolution bandwidth standard filter 1 Hz to 10 MHz channel filter 100 Hz to 5 MHz video filter 1 Hz to 10 MHzI/Q demodulation bandwidth 10 MHz with R&S®FSW-B28 option 28 MHz with R&S®FSW-B40 option 40 MHz with R&S®FSW-B80 option 80 MHz with R&S®FSW-B160 option 160 MHzDisplayed average noise level (DANL) without preamplifier 2 GHz typ. –156 dBm (1 Hz), with R&S®FSW-B13 option typ. –159 dBm (1 Hz) 8 GHz typ. –156 dBm (1 Hz) 25 GHz typ. –150 dBm (1 Hz) with R&S®FSV-B24 preamplifier option 8 GHz typ. –169 dBm (1 Hz) 25 GHz typ. –161 dBm (1 Hz) with noise cancellation, preamplifier off, 2 GHz typ. –169 dBm (1 Hz) Intermodulation, third-order intercept (TOI) f < 1 GHz typ. +30 dBm f < 3 GHz typ. +25 dBm 8 GHz to 26 GHz typ. +17 dBmWCDMA ACLR dynamic range with noise cancellation –88 dBPhase noise10 kHz offset from carrier 500 MHz carrier typ. –140 dBc (1 Hz) 1 GHz carrier typ. –137 dBc (1 Hz) 10 GHz carrier typ. –128 dBc (1 Hz)Total measurement uncertainty 8 GHz 0.4 dB
RF generator for all mobile radio stan-dards plus GPS, Galileo and GLONASSWhen equipped with the new R&S®SMBV-K94 software option, the R&S®SMBV100A vector signal gener-
ator can additionally generate GLONASS signals for the L1 and L2 bands. With the new extension, hybrid
scenarios are available for simulating GLONASS, GPS and Galileo signals for constellations with up to
12 satellites. And because the R&S®SMBV100A vector signal generator can also generate signals for all
major mobile radio and audio broadcasting standards, it is rightly considered an all-purpose tool unique in
its class.
The multitalented R&S®SMBV100AThe extensions for GLONASS turn the R&S®SMBV100A into a versatile GNSS simulator for all currently relevant standards, while its excellent RF characteristic allow it to function as a multidisciplinary vector signal generator – all in one box. It can simulate GPS, Galileo or GLONASS with up to 12 satel-lites, or it can be configured to simulate a hybrid constellation of GPS, Galileo and GLONASS on the upper L1 / E1 band and of GPS and GLONASS on the lower L2 band. For details on GLONASS, see the box on pages 34/35.
The R&S®SMBV100A can simulate all GLONASS frequency numbers between –7 and 12, i.e. the subcarriers used by GLONASS satellites before 2005 as well as those used by GLONASS-M and GLONASS-K satellites (legacy FDMA sig-nals) after 2005 (FIG 1).
A GLONASS receiver must be able to handle continually changing satellite scenarios. Satellites are in a good recep-tion position for a short period of time and will then drop below the horizon, and other, previously unavailable sat-ellites will rise into view. In Auto Localization mode, the R&S®SMBV100A uses sophisticated algorithms to simu-late such scenarios by continually varying the satellite con-stellation to ensure satellite visibility, thereby simulating a real-world scenario made up of visible satellites and usable constellations. The generator uses an extended ephemeris concept that allows the simulation to run longer than the standard short age of ephemeris data (30 minutes in the case of GLONASS and two hours for GPS). This is done by project-ing ephemeris data into the future, thereby prolonging the data´s validity in order to allow the receiver module to acquire and track signals and obtain a position fix for a very long time.
FIG 1 Hybrid satellite configu-
ration with GLONASS, GPS and
Galileo.
NEWS 204 /11 33
GENERAL PURPOSE | Signal generators
34
WLANs are gaining in importance as a way to implement indoor localization, and can replace or complement satellite-based localization in locations where signals are disturbed due to multipath reception. WLAN localization relies on mea-suring the signal levels received from access points at the user’s location. If signals from multiple access points are available, the user’s position can be determined with relatively high precision. When equipped with the R&S®SMBV-K48 or -K54 WiFi option, the R&S®SMBV100A can also simulate such signals.
ApplicationsTypical applications and test cases for navigation systems in development and production have been described in detail in the previous issue*. The following applications are in addition to those previously published:
FIG 2 Hybrid satellite constellation including GLONASS (R), GPS (G) and
Galileo (E) satellites.* Signals for GPS, Galileo and digital communications standards in a single instrument.
NEWS (2011) No. 203, pp 39–41.
The GLONASS global navigation satellite systemGLONASS is a global navigation satellite system (GNSS) offer-ing worldwide coverage. It is expected to be completely oper-ational by the end of 2011 with a total of 24 satellites. The sys-tem is deployed by the Russian government as an alternative to the United States’ global positioning system (GPS). And because GLONASS is set up as a worldwide system, it is of interest glob-ally for all navigation applications. Major chipset manufacturers are already working on modules that will support both GLONASS and GPS because manufacturers of smartphones and navigation devices will integrate the new system into their products. Car manufacturers targeting the Russian market will also need naviga-tion systems ready to handle GLONASS.
Enhanced location services with GLONASSLocation-based services (LBS) are growing exponentially, and they will soon be indispensable for many mobile users. GPS made it possible to integrate these services, and this system is still con-sidered the only fully operational GNSS worldwide. LBS requires 3D navigation, which calls for a line of sight (LOS) to at least four satellites at the user location in order to deliver a good position fix. This is not always possible in urban environments, where the LOS can be obstructed by shadowing. GLONASS and GPS together
will improve this situation, providing up to 54 satellites in total, thereby increasing the availability and performance of navigation sys-tems in these problem areas and improving LBS reliability.
GLONASS vs. GalileoGLONASS was designed as an alternative to GPS and was not until recently intended as a complementary system. The center frequency of the Russian navigation system in the commercial upper RNSS band lies approximately 27 MHz above the center frequency of the GPS L1 band (FIG 4). That makes it more difficult for chipset manu-facturers to develop hybrid receivers that support both systems.
Galileo, the independent European GNSS, was originally designed as the complementary system for GPS. Both systems use CDMA mod-ulation and employ a dedicated spreading code for each satellite. In addition, GPS and Galileo share the same frequencies in the upper RNSS band, also called the L1 / E1 band, and minimize inter-/intra-system interference by applying binary offset carrier (BOC) modula-tion and assigning dedicated orthogonal spreading codes (pseudo random noise; PRN) to each satellite. Because Galileo has been delayed and the first operational satellites will not be available until 2014, GLONASS is now filling in as a complementary system to GPS to improve LBS.
GLONASS and GNSS cross-correlation testsThe R&S®SMBV100A can now simulate hybrid satellite con-stellations with GLONASS / GPS / Galileo in the L1 band (FIG 2) and also simulate PRN cross correlation and intersys-tem interference among the various GNSS. The Static simu-lation mode on the R&S SMBV100A is the optimal mode for cross-correlation tests with a very high signal fidelity.
GENERAL PURPOSE | Signal generators
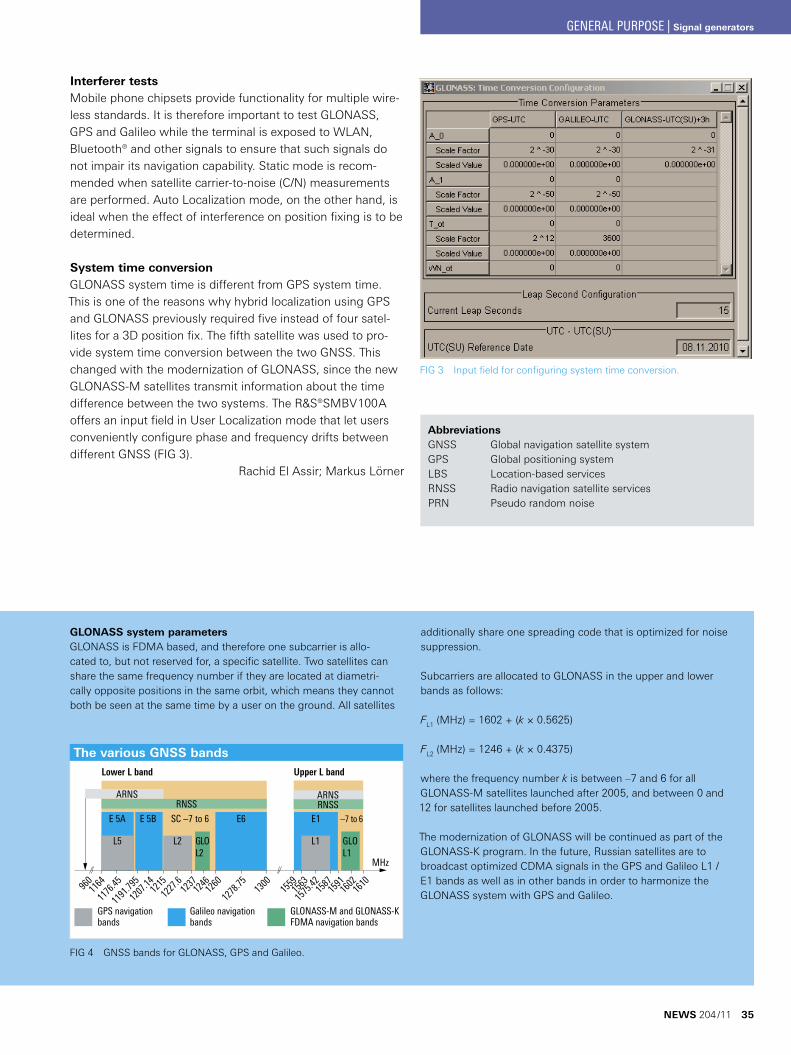
The various GNSS bands
L1
MHz
Upper L bandLower L band
GPS navigationbands
Galileo navigationbands
GLONASS-M and GLONASS-KFDMA navigation bands
1191
.795
1176
.45
1207
.141215
116496
012
27.6
1237
1260
1246
1278
.75 1300
1559
1563
1575
.421587
1591
1602
1610
RNSSARNSRNSS
ARNS
E1E6E 5A
L5 L2 L1 GLOL1
GLOL2
E 5B SC –7 to 6 –7 to 6
FIG 3 Input field for configuring system time conversion.
AbbreviationsGNSS Global navigation satellite systemGPS Global positioning systemLBS Location-based servicesRNSS Radio navigation satellite servicesPRN Pseudo random noise
FIG 4 GNSS bands for GLONASS, GPS and Galileo.
GLONASS system parametersGLONASS is FDMA based, and therefore one subcarrier is allo-cated to, but not reserved for, a specific satellite. Two satellites can share the same frequency number if they are located at diametri-cally opposite positions in the same orbit, which means they cannot both be seen at the same time by a user on the ground. All satellites
Interferer testsMobile phone chipsets provide functionality for multiple wire-less standards. It is therefore important to test GLONASS, GPS and Galileo while the terminal is exposed to WLAN, Bluetooth® and other signals to ensure that such signals do not impair its navigation capability. Static mode is recom-mended when satellite carrier-to-noise (C/N) measurements are performed. Auto Localization mode, on the other hand, is ideal when the effect of interference on position fixing is to be determined.
System time conversionGLONASS system time is different from GPS system time. This is one of the reasons why hybrid localization using GPS and GLONASS previously required five instead of four satel-lites for a 3D position fix. The fifth satellite was used to pro-vide system time conversion between the two GNSS. This changed with the modernization of GLONASS, since the new GLONASS-M satellites transmit information about the time difference between the two systems. The R&S®SMBV100A offers an input field in User Localization mode that let users conveniently configure phase and frequency drifts between different GNSS (FIG 3).
Rachid El Assir; Markus Lörner
additionally share one spreading code that is optimized for noise suppression.
Subcarriers are allocated to GLONASS in the upper and lower bands as follows:
FL1 (MHz) = 1602 + (k × 0.5625)
FL2 (MHz) = 1246 + (k × 0.4375)
where the frequency number k is between –7 and 6 for all GLONASS-M satellites launched after 2005, and between 0 and 12 for satellites launched before 2005.
The modernization of GLONASS will be continued as part of the GLONASS-K program. In the future, Russian satellites are to broadcast optimized CDMA signals in the GPS and Galileo L1 /E1 bands as well as in other bands in order to harmonize the GLONASS system with GPS and Galileo.
NEWS 204 /11 35
GENERAL PURPOSE | Signal generators
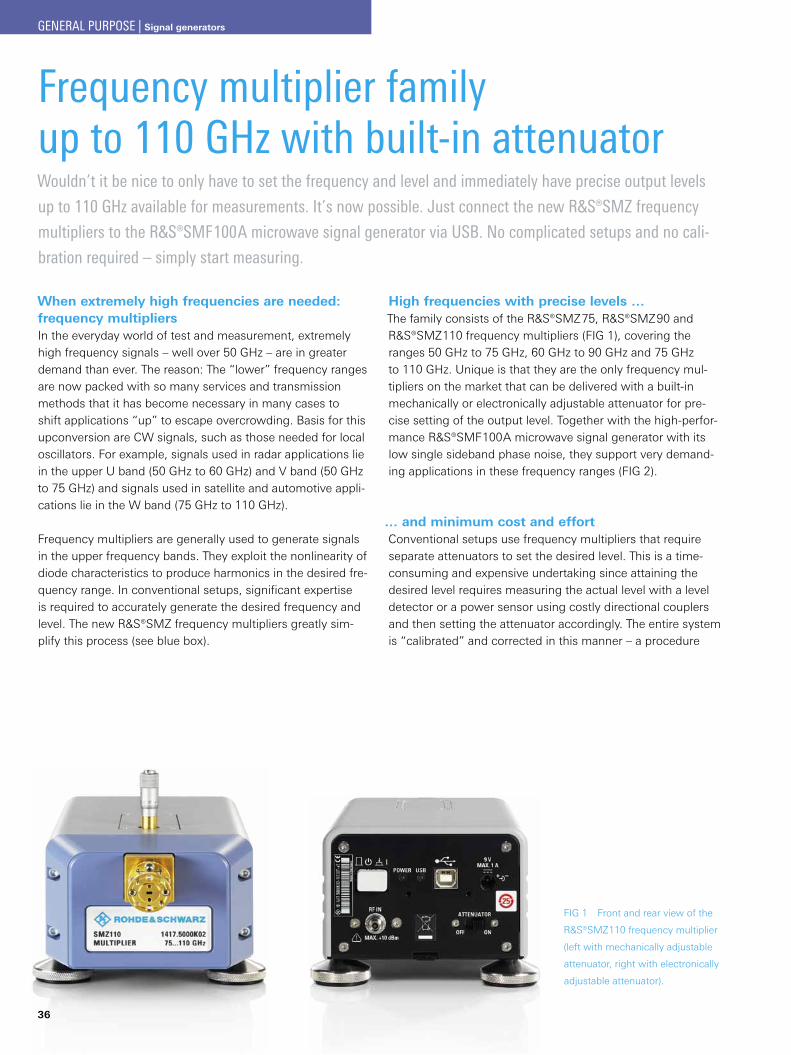
36
Frequency multiplier family up to 110 GHz with built-in attenuatorWouldn’t it be nice to only have to set the frequency and level and immediately have precise output levels
up to 110 GHz available for measurements. It’s now possible. Just connect the new R&S®SMZ frequency
multipliers to the R&S®SMF100A microwave signal generator via USB. No complicated setups and no cali-
bration required – simply start measuring.
When extremely high frequencies are needed: frequency multipliers In the everyday world of test and measurement, extremely high frequency signals – well over 50 GHz – are in greater demand than ever. The reason: The “lower” frequency ranges are now packed with so many services and transmission methods that it has become necessary in many cases to shift applications “up” to escape overcrowding. Basis for this upconversion are CW signals, such as those needed for local oscillators. For example, signals used in radar applications lie in the upper U band (50 GHz to 60 GHz) and V band (50 GHz to 75 GHz) and signals used in satellite and automotive appli-cations lie in the W band (75 GHz to 110 GHz).
Frequency multipliers are generally used to generate signals in the upper frequency bands. They exploit the nonlinearity of diode characteristics to produce harmonics in the desired fre-quency range. In conventional setups, significant expertise is required to accurately generate the desired frequency and level. The new R&S®SMZ frequency multipliers greatly sim-plify this process (see blue box).
High frequencies with precise levels …The family consists of the R&S®SMZ75, R&S®SMZ90 and R&S®SMZ110 frequency multipliers (FIG 1), covering the ranges 50 GHz to 75 GHz, 60 GHz to 90 GHz and 75 GHz to 110 GHz. Unique is that they are the only frequency mul-tipliers on the market that can be delivered with a built-in mechanically or electronically adjustable attenuator for pre-cise setting of the output level. Together with the high-perfor-mance R&S®SMF100A microwave signal generator with its low single sideband phase noise, they support very demand-ing applications in these frequency ranges (FIG 2).
… and minimum cost and effortConventional setups use frequency multipliers that require separate attenuators to set the desired level. This is a time-consuming and expensive undertaking since attaining the desired level requires measuring the actual level with a level detector or a power sensor using costly directional couplers and then setting the attenuator accordingly. The entire system is “calibrated” and corrected in this manner – a procedure
FIG 1 Front and rear view of the
R&S®SMZ110 frequency multiplier
(left with mechanically adjustable
attenuator, right with electronically
adjustable attenuator).
GENERAL PURPOSE | Signal generators
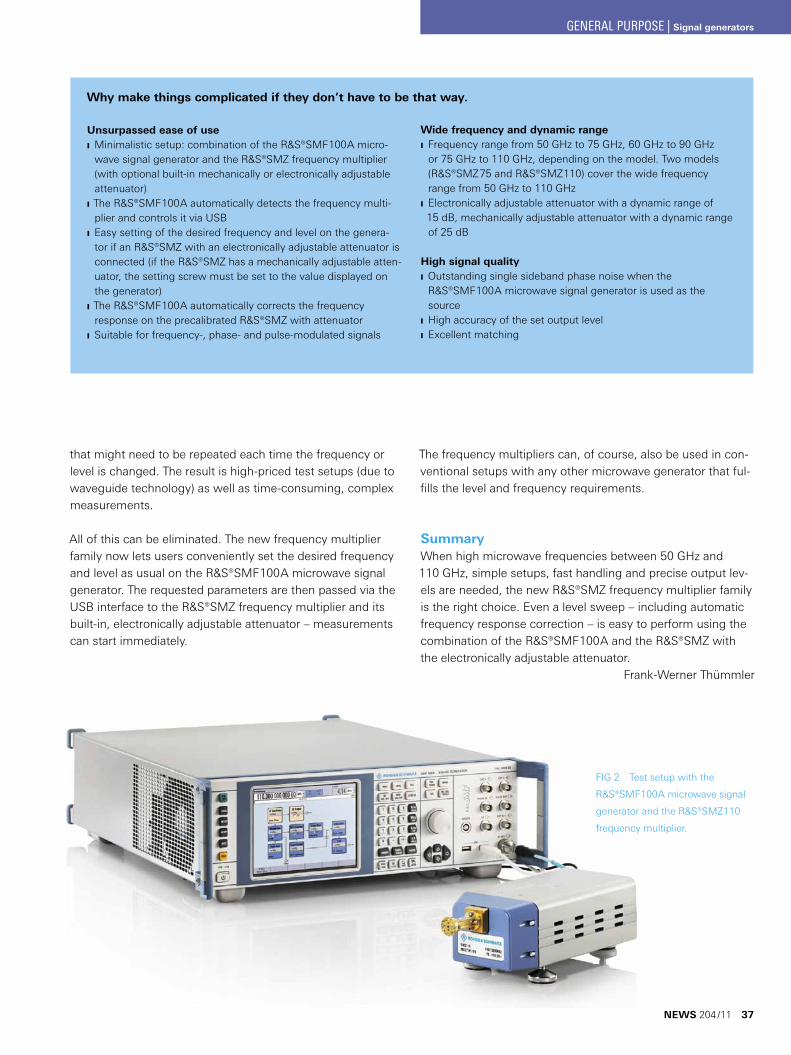
FIG 2 Test setup with the
R&S®SMF100A microwave signal
generator and the R&S®SMZ110
frequency multiplier.
that might need to be repeated each time the frequency or level is changed. The result is high-priced test setups (due to waveguide technology) as well as time-consuming, complex measurements.
All of this can be eliminated. The new frequency multiplier family now lets users conveniently set the desired frequency and level as usual on the R&S®SMF100A microwave signal generator. The requested parameters are then passed via the USB interface to the R&S®SMZ frequency multiplier and its built-in, electronically adjustable attenuator – measurements can start immediately.
Unsurpassed ease of use ❙ Minimalistic setup: combination of the R&S®SMF100A micro-wave signal generator and the R&S®SMZ frequency multiplier (with optional built-in mechanically or electronically adjustable attenuator)
❙ The R&S®SMF100A automatically detects the frequency multi-plier and controls it via USB
❙ Easy setting of the desired frequency and level on the genera-tor if an R&S®SMZ with an electronically adjustable attenuator is connected (if the R&S®SMZ has a mechanically adjustable atten-uator, the setting screw must be set to the value displayed on the generator)
❙ The R&S®SMF100A automatically corrects the frequency response on the precalibrated R&S®SMZ with attenuator
❙ Suitable for frequency-, phase- and pulse-modulated signals
The frequency multipliers can, of course, also be used in con-ventional setups with any other microwave generator that ful-fills the level and frequency requirements.
SummaryWhen high microwave frequencies between 50 GHz and 110 GHz, simple setups, fast handling and precise output lev-els are needed, the new R&S®SMZ frequency multiplier family is the right choice. Even a level sweep – including automatic frequency response correction – is easy to perform using the combination of the R&S®SMF100A and the R&S®SMZ with the electronically adjustable attenuator.
Frank-Werner Thümmler
Wide frequency and dynamic range ❙ Frequency range from 50 GHz to 75 GHz, 60 GHz to 90 GHz or 75 GHz to 110 GHz, depending on the model. Two models (R&S®SMZ75 and R&S®SMZ110) cover the wide frequency range from 50 GHz to 110 GHz
❙ Electronically adjustable attenuator with a dynamic range of 15 dB, mechanically adjustable attenuator with a dynamic range of 25 dB
High signal quality ❙ Outstanding single sideband phase noise when the R&S®SMF100A microwave signal generator is used as the source
❙ High accuracy of the set output level ❙ Excellent matching
Why make things complicated if they don’t have to be that way.
NEWS 204 /11 37
GENERAL PURPOSE | Signal generators

The new R&S®SGS100A RF source enables production lines to work faster and more cost-effectively. Although much more compact than previous RF sources, it delivers the same perform ance as high-end conventional instruments. It is avail-able as a CW source or as a vector signal generator with an integrated I/Q modulator. With its frequency range of up to 6 GHz, the vector signal generator version covers all essen-tial digital signals. The CW version, with a range of up to 12.75 GHz, can be used as a versatile local oscillator as well as for interference testing against the mobile radio standards.
The new R&S®SGS100A signal generator from Rohde&Schwarz covers the frequency range up to 12.75 GHz and has been opti-mized for use in automated test systems. The signal source is excep-tionally compact. It fits in just one-half the width of a 19" rack and requires only a single height unit. Its small size means that four RF sources can be installed in the space previously needed for one RF source. With typical frequency and level setting times of 280 µs, the R&S®SGS100A is three times faster than its conventional coun-terparts. This means higher production test throughput in addition to significantly reduced space requirements.
The compact R&S®SGS100A provides RF performance comparable with that of high-end signal generators. It comes with an electronic step attenuator and offers a very high output level of typ. +22 dBm over the entire frequency range. Its low nonharmonics of –76 dBc up to 1.5 GHz make the generator an excellent signal source for A/D converter tests.
The R&S®SGS100A is available in two models: The CW version gener-ates frequencies up to 12.75 GHz. It can be used as a local oscillator as well as for interference testing against mobile radio standards. The vector signal generator version with integrated I/Q modulator offers a maximum frequency of 6 GHz and covers the relevant frequency bands for digital communications standards. RF signals from multi-ple R&S®SGS100A can optionally be phase-locked to support appli-cations such as beamforming required by the aerospace and defense industry.
The generator also reduces operating and capital expenditures: Its ini-tial costs are significantly lower than those of comparable equipment. In addition, it consumes less power (just 70 W) and dissipates less heat. Besides greater cost-efficiency, this also translates into higher reliability. The calibration interval of three years helps to keep operat-ing cost low.
Since the RF source is typically remote-controlled, the front panel of the R&S®SGS100A was designed for use in systems. It offers sta-tus LEDs as well as all of the keys necessary for controlling generator operation. For laboratory use, it can also be operated manually via the external R&S®SGMA-GUI software.
Visit the Rohde&Schwarz website for detailed information about the R&S®SGS100A.
In briefR&S®SGS100A RF source: the smallest fully integrated signal generator for automated test systems
ALLGEMEINE MESSTECHNIK | Signalgeneratoren
38
High-end performance in the smallest possible space: Four R&S®SGS100A RF sources
require very little space in automated test systems, as shown in this example.
GENERAL PURPOSE | Signal generators
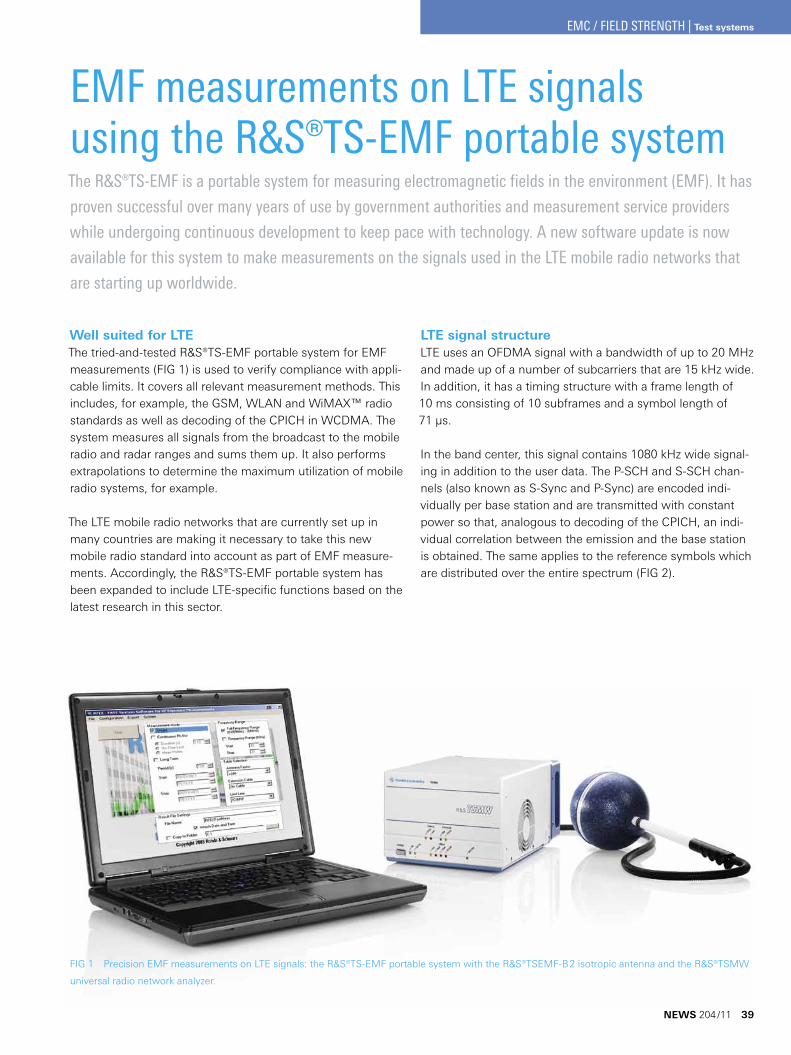
EMF measurements on LTE signals using the R&S®TS-EMF portable systemThe R&S®TS-EMF is a portable system for measuring electromagnetic fields in the environment (EMF). It has
proven successful over many years of use by government authorities and measurement service providers
while undergoing continuous development to keep pace with technology. A new software update is now
available for this system to make measurements on the signals used in the LTE mobile radio networks that
are starting up worldwide.
Well suited for LTEThe tried-and-tested R&S®TS-EMF portable system for EMF measurements (FIG 1) is used to verify compliance with appli-cable limits. It covers all relevant measurement methods. This includes, for example, the GSM, WLAN and WiMAX™ radio standards as well as decoding of the CPICH in WCDMA. The system measures all signals from the broadcast to the mobile radio and radar ranges and sums them up. It also performs extrapolations to determine the maximum utilization of mobile radio systems, for example.
The LTE mobile radio networks that are currently set up in many countries are making it necessary to take this new mobile radio standard into account as part of EMF measure-ments. Accordingly, the R&S®TS-EMF portable system has been expanded to include LTE-specific functions based on the latest research in this sector.
LTE signal structureLTE uses an OFDMA signal with a bandwidth of up to 20 MHz and made up of a number of subcarriers that are 15 kHz wide. In addition, it has a timing structure with a frame length of 10 ms consisting of 10 subframes and a symbol length of 71 µs.
In the band center, this signal contains 1080 kHz wide signal-ing in addition to the user data. The P-SCH and S-SCH chan-nels (also known as S-Sync and P-Sync) are encoded indi-vidually per base station and are transmitted with constant power so that, analogous to decoding of the CPICH, an indi-vidual correlation between the emission and the base station is obtained. The same applies to the reference symbols which are distributed over the entire spectrum (FIG 2).
FIG 1 Precision EMF measurements on LTE signals: the R&S®TS-EMF portable system with the R&S®TSEMF-B2 isotropic antenna and the R&S®TSMW
universal radio network analyzer.
NEWS 204 /11 39
EMC / FIELD STRENGTH | Test systems
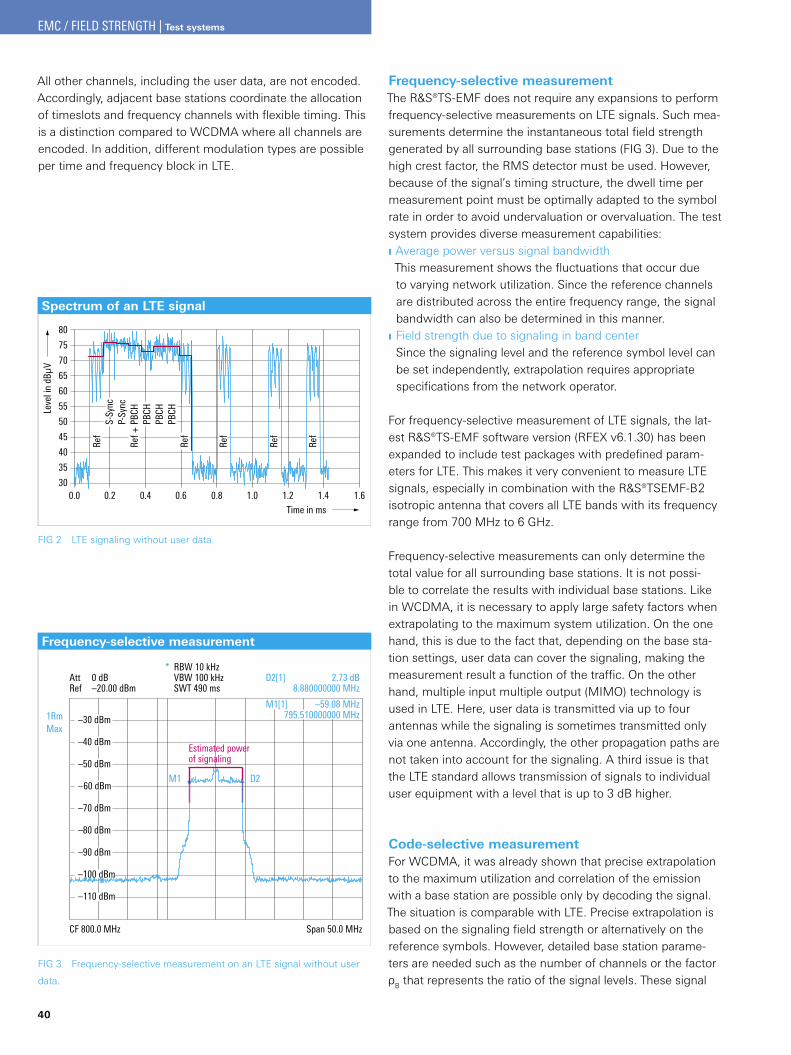
Spectrum of an LTE signal
Leve
l in
dBμ
V
80
75
70
65
60
55
50
45
40
35
300.0 0.2 0.4 0.6 0.8 1.0 1.2 1.4 1.6
Time in ms
Ref
Ref
Ref
Ref
Ref
Ref +
PBC
HPB
CH
PBCH
PBCH
S-Sy
ncP-
Sync
Frequency-selective measurement
1RmMax
Att 0 dBRef –20.00 dBm
* RBW 10 kHz VBW 100 kHz SWT 490 ms
CF 800.0 MHz
Estimated powerof signaling
Span 50.0 MHz
–30 dBm
–40 dBm
–50 dBm
–60 dBm
–70 dBm
–80 dBm
–90 dBm
–100 dBm
–110 dBm
2.73 dB 8.880000000 MHz
–59.08 MHz 795.510000000 MHz
D2[1]
M1[1]
D2M1
40
FIG 2 LTE signaling without user data.
FIG 3 Frequency-selective measurement on an LTE signal without user
data.
All other channels, including the user data, are not encoded. Accordingly, adjacent base stations coordinate the allocation of timeslots and frequency channels with flexible timing. This is a distinction compared to WCDMA where all channels are encoded. In addition, different modulation types are possible per time and frequency block in LTE.
Frequency-selective measurementThe R&S®TS-EMF does not require any expansions to perform frequency-selective measurements on LTE signals. Such mea-surements determine the instantaneous total field strength generated by all surrounding base stations (FIG 3). Due to the high crest factor, the RMS detector must be used. However, because of the signal’s timing structure, the dwell time per measurement point must be optimally adapted to the symbol rate in order to avoid undervaluation or overvaluation. The test system provides diverse measurement capabilities: ❙ Average power versus signal bandwidth This measurement shows the fluctuations that occur due to varying network utilization. Since the reference channels are distributed across the entire frequency range, the signal bandwidth can also be determined in this manner.
❙ Field strength due to signaling in band center Since the signaling level and the reference symbol level can be set independently, extrapolation requires appropriate specifications from the network operator.
For frequency-selective measurement of LTE signals, the lat-est R&S®TS-EMF software version (RFEX v6.1.30) has been expanded to include test packages with predefined param-eters for LTE. This makes it very convenient to measure LTE signals, especially in combination with the R&S®TSEMF-B2 isotropic antenna that covers all LTE bands with its frequency range from 700 MHz to 6 GHz.
Frequency-selective measurements can only determine the total value for all surrounding base stations. It is not possi-ble to correlate the results with individual base stations. Like in WCDMA, it is necessary to apply large safety factors when extrapolating to the maximum system utilization. On the one hand, this is due to the fact that, depending on the base sta-tion settings, user data can cover the signaling, making the measurement result a function of the traffic. On the other hand, multiple input multiple output (MIMO) technology is used in LTE. Here, user data is transmitted via up to four antennas while the signaling is sometimes transmitted only via one antenna. Accordingly, the other propagation paths are not taken into account for the signaling. A third issue is that the LTE standard allows transmission of signals to individual user equipment with a level that is up to 3 dB higher.
Code-selective measurementFor WCDMA, it was already shown that precise extrapolation to the maximum utilization and correlation of the emission with a base station are possible only by decoding the signal. The situation is comparable with LTE. Precise extrapolation is based on the signaling field strength or alternatively on the reference symbols. However, detailed base station parame-ters are needed such as the number of channels or the factor ρB that represents the ratio of the signal levels. These signal
EMC / FIELD STRENGTH | Test systems
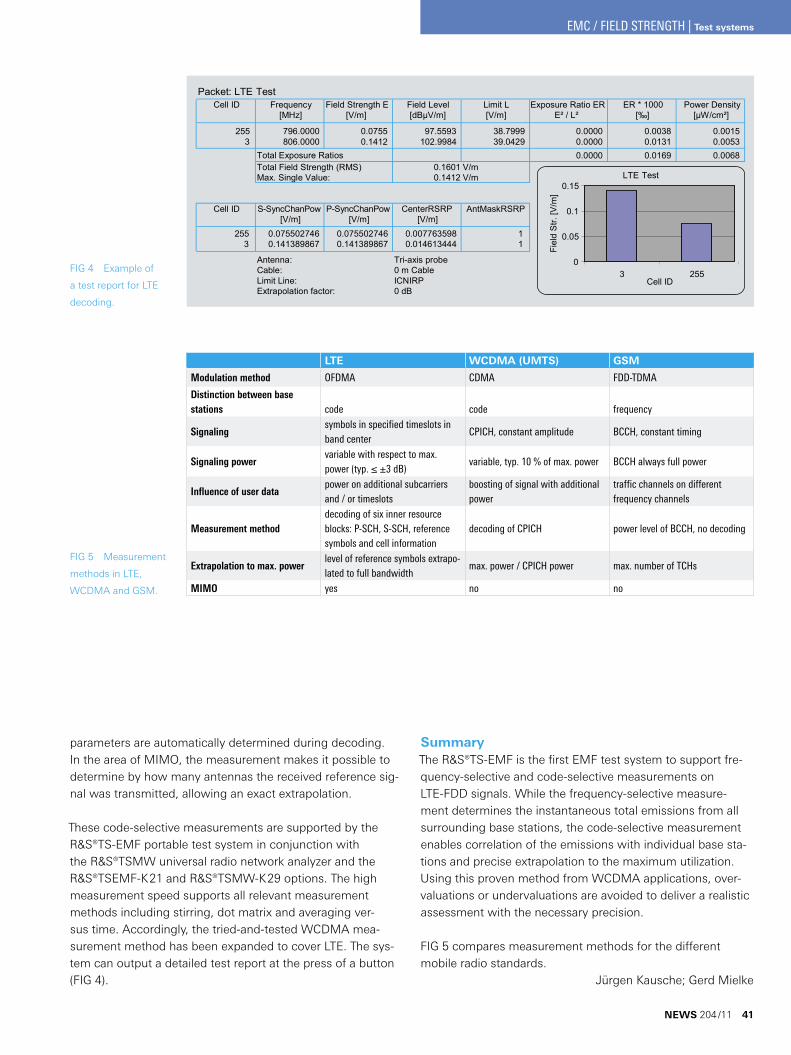
Packet: LTE Test Cell ID Frequency Field Strength E Field Level Limit L Exposure Ratio ER ER * 1000 Power Density
[MHz] [V/m] [dBµV/m] [V/m] E² / L² [‰] [µW/cm²] 255 796.0000 0.0755 97.5593 38.7999 0.0000 0.0038 0.0015
3 806.0000 0.1412 102.9984 39.0429 0.0000 0.0131 0.0053 Total Exposure Ratios 0.0000 0.0169 0.0068 Total Field Strength (RMS) 0.1601 V/m Max. Single Value: 0.1412 V/m
Cell ID S-SyncChanPow P-SyncChanPow CenterRSRP AntMaskRSRP [V/m] [V/m] [V/m]
255 0.075502746 0.075502746 0.007763598 1 3 0.141389867 0.141389867 0.014613444 1
Antenna: Tri-axis probe Cable: 0 m Cable Limit Line: ICNIRP Extrapolation factor: 0 dB
LTE Test
0
0.05
0.1
0.15
3 255 Cell ID
Fiel
d S
tr. [V
/m]
parameters are automatically determined during decoding. In the area of MIMO, the measurement makes it possible to determine by how many antennas the received reference sig-nal was transmitted, allowing an exact extrapolation.
These code-selective measurements are supported by the R&S®TS-EMF portable test system in conjunction with the R&S®TSMW universal radio network analyzer and the R&S®TSEMF-K21 and R&S®TSMW-K29 options. The high measurement speed supports all relevant measurement methods including stirring, dot matrix and averaging ver-sus time. Accordingly, the tried-and-tested WCDMA mea-surement method has been expanded to cover LTE. The sys-tem can output a detailed test report at the press of a button (FIG 4).
FIG 4 Example of
a test report for LTE
decoding.
SummaryThe R&S®TS-EMF is the first EMF test system to support fre-quency-selective and code-selective measurements on LTE-FDD signals. While the frequency-selective measure-ment determines the instantaneous total emissions from all surrounding base stations, the code-selective measurement enables correlation of the emissions with individual base sta-tions and precise extrapolation to the maximum utilization. Using this proven method from WCDMA applications, over-valuations or undervaluations are avoided to deliver a realistic assessment with the necessary precision.
FIG 5 compares measurement methods for the different mobile radio standards.
Jürgen Kausche; Gerd Mielke
LTE WCDMA (UMTS) GSM
Modulation method OFDMA CDMA FDD-TDMA
Distinction between base stations code code frequency
Signalingsymbols in specified timeslots in band center
CPICH, constant amplitude BCCH, constant timing
Signaling powervariable with respect to max. power (typ. ≤ ±3 dB)
variable, typ. 10 % of max. power BCCH always full power
Influence of user datapower on additional subcarriers and / or timeslots
boosting of signal with additional power
traffic channels on different frequency channels
Measurement methoddecoding of six inner resource blocks: P-SCH, S-SCH, reference symbols and cell information
decoding of CPICH power level of BCCH, no decoding
Extrapolation to max. powerlevel of reference symbols extrapo-lated to full bandwidth
max. power / CPICH power max. number of TCHs
MIMO yes no no
FIG 5 Measurement
methods in LTE,
WCDMA and GSM.
NEWS 204 /11 41
EMC / FIELD STRENGTH | Test systems
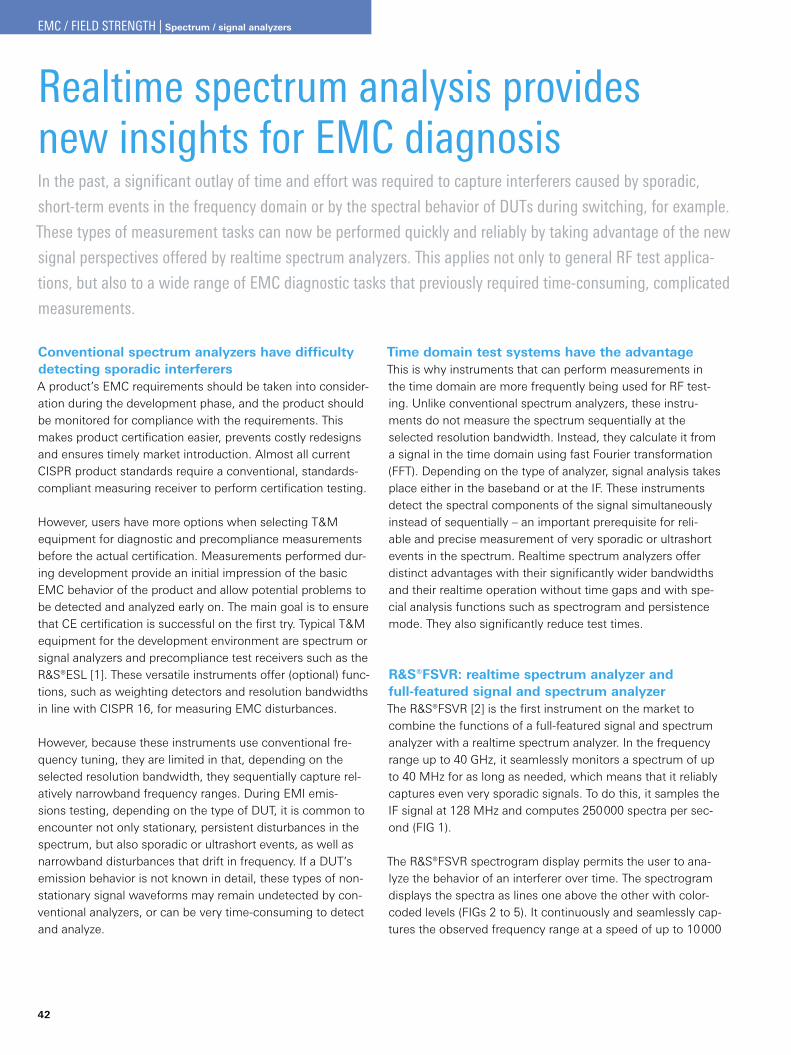
42
Realtime spectrum analysis provides new insights for EMC diagnosisIn the past, a significant outlay of time and effort was required to capture interferers caused by sporadic,
short-term events in the frequency domain or by the spectral behavior of DUTs during switching, for example.
These types of measurement tasks can now be performed quickly and reliably by taking advantage of the new
signal perspectives offered by realtime spectrum analyzers. This applies not only to general RF test applica-
tions, but also to a wide range of EMC diagnostic tasks that previously required time-consuming, complicated
measurements.
Conventional spectrum analyzers have difficulty detecting sporadic interferersA product’s EMC requirements should be taken into consider-ation during the development phase, and the product should be monitored for compliance with the requirements. This makes product certification easier, prevents costly redesigns and ensures timely market introduction. Almost all current CISPR product standards require a conventional, standards-compliant measuring receiver to perform certification testing.
However, users have more options when selecting T&M equipment for diagnostic and precompliance measurements before the actual certification. Measurements performed dur-ing development provide an initial impression of the basic EMC behavior of the product and allow potential problems to be detected and analyzed early on. The main goal is to ensure that CE certification is successful on the first try. Typical T&M equipment for the development environment are spectrum or signal analyzers and precompliance test receivers such as the R&S®ESL [1]. These versatile instruments offer (optional) func-tions, such as weighting detectors and resolution bandwidths in line with CISPR 16, for measuring EMC disturbances.
However, because these instruments use conventional fre-quency tuning, they are limited in that, depending on the selected resolution bandwidth, they sequentially capture rel-atively narrowband frequency ranges. During EMI emis-sions testing, depending on the type of DUT, it is common to encounter not only stationary, persistent disturbances in the spectrum, but also sporadic or ultrashort events, as well as narrowband disturbances that drift in frequency. If a DUT’s emission behavior is not known in detail, these types of non-stationary signal waveforms may remain undetected by con-ventional analyzers, or can be very time-consuming to detect and analyze.
Time domain test systems have the advantageThis is why instruments that can perform measurements in the time domain are more frequently being used for RF test-ing. Unlike conventional spectrum analyzers, these instru-ments do not measure the spectrum sequentially at the selected resolution bandwidth. Instead, they calculate it from a signal in the time domain using fast Fourier transformation (FFT). Depending on the type of analyzer, signal analysis takes place either in the baseband or at the IF. These instruments detect the spectral components of the signal simultaneously instead of sequentially – an important prerequisite for reli-able and precise measurement of very sporadic or ultrashort events in the spectrum. Realtime spectrum analyzers offer distinct advantages with their significantly wider bandwidths and their realtime operation without time gaps and with spe-cial analysis functions such as spectrogram and persistence mode. They also significantly reduce test times.
R&S®FSVR: realtime spectrum analyzer and full-featured signal and spectrum analyzerThe R&S®FSVR [2] is the first instrument on the market to combine the functions of a full-featured signal and spectrum analyzer with a realtime spectrum analyzer. In the frequency range up to 40 GHz, it seamlessly monitors a spectrum of up to 40 MHz for as long as needed, which means that it reliably captures even very sporadic signals. To do this, it samples the IF signal at 128 MHz and computes 250000 spectra per sec-ond (FIG 1).
The R&S®FSVR spectrogram display permits the user to ana-lyze the behavior of an interferer over time. The spectrogram displays the spectra as lines one above the other with color-coded levels (FIGs 2 to 5). It continuously and seamlessly cap-tures the observed frequency range at a speed of up to 10000
EMC / FIELD STRENGTH | Spectrum / signal analyzers
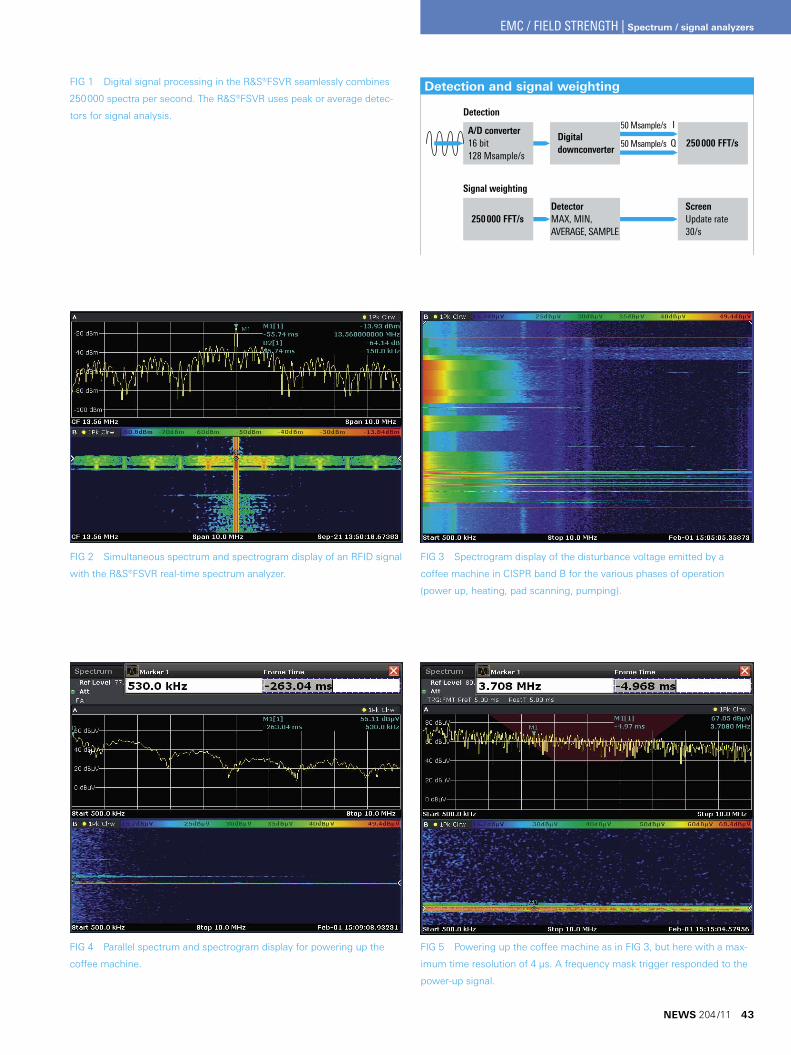
Detection and signal weighting
A/D converter16 bit128 Msample/s
Digital downconverter
50 Msample/s
50 Msample/s
I
Q 250000 FFT/s
Detection
Signal weighting
DetectorMAX, MIN, AVERAGE, SAMPLE
ScreenUpdate rate30/s
250000 FFT/s
FIG 1 Digital signal processing in the R&S®FSVR seamlessly combines
250000 spectra per second. The R&S®FSVR uses peak or average detec-
tors for signal analysis.
FIG 2 Simultaneous spectrum and spectrogram display of an RFID signal
with the R&S®FSVR real-time spectrum analyzer.
FIG 3 Spectrogram display of the disturbance voltage emitted by a
coffee machine in CISPR band B for the various phases of operation
(power up, heating, pad scanning, pumping).
FIG 4 Parallel spectrum and spectrogram display for powering up the
coffee machine.
FIG 5 Powering up the coffee machine as in FIG 3, but here with a max-
imum time resolution of 4 µs. A frequency mask trigger responded to the
power-up signal.
NEWS 204 /11 43
EMC / FIELD STRENGTH | Spectrum / signal analyzers
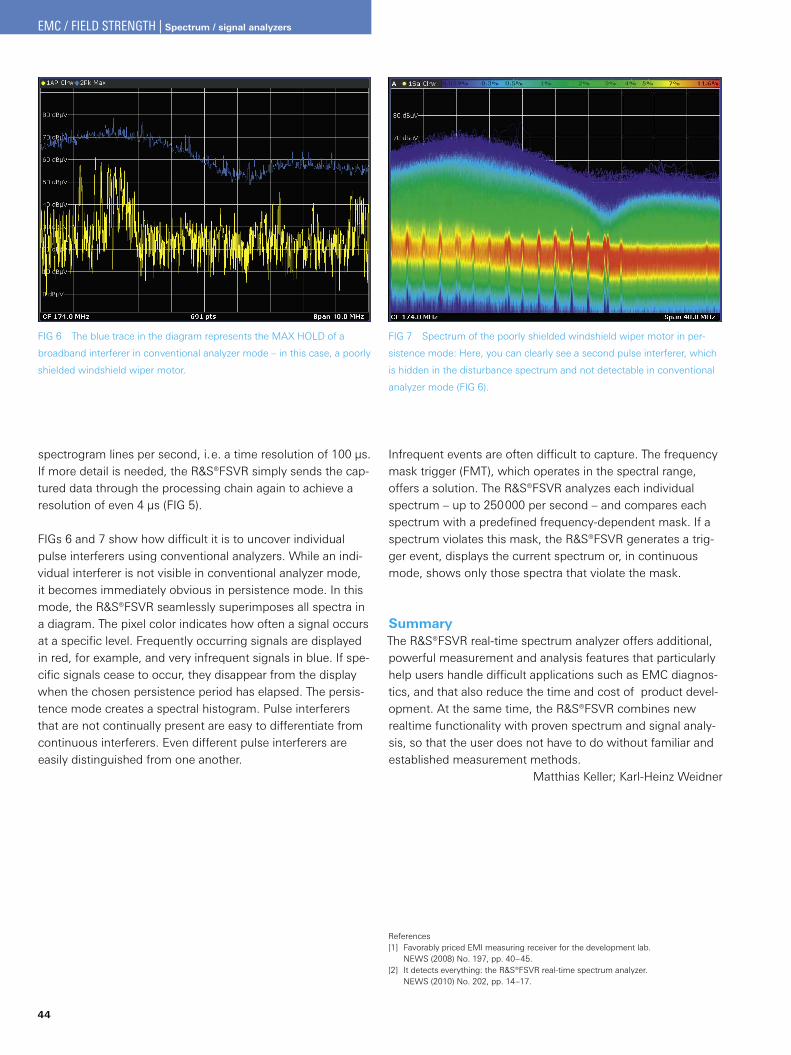
44
spectrogram lines per second, i.e. a time resolution of 100 µs. If more detail is needed, the R&S®FSVR simply sends the cap-tured data through the processing chain again to achieve a resolution of even 4 µs (FIG 5).
FIGs 6 and 7 show how difficult it is to uncover individual pulse interferers using conventional analyzers. While an indi-vidual interferer is not visible in conventional analyzer mode, it becomes immediately obvious in persistence mode. In this mode, the R&S®FSVR seamlessly superimposes all spectra in a diagram. The pixel color indicates how often a signal occurs at a specific level. Frequently occurring signals are displayed in red, for example, and very infrequent signals in blue. If spe-cific signals cease to occur, they disappear from the display when the chosen persistence period has elapsed. The persis-tence mode creates a spectral histogram. Pulse interferers that are not continually present are easy to differentiate from continuous interferers. Even different pulse interferers are easily distinguished from one another.
FIG 6 The blue trace in the diagram represents the MAX HOLD of a
broadband interferer in conventional analyzer mode – in this case, a poorly
shielded windshield wiper motor.
FIG 7 Spectrum of the poorly shielded windshield wiper motor in per-
sistence mode: Here, you can clearly see a second pulse interferer, which
is hidden in the disturbance spectrum and not detectable in conventional
analyzer mode (FIG 6).
Infrequent events are often difficult to capture. The frequency mask trigger (FMT), which operates in the spectral range, offers a solution. The R&S®FSVR analyzes each individual spectrum – up to 250000 per second – and compares each spectrum with a predefined frequency-dependent mask. If a spectrum violates this mask, the R&S®FSVR generates a trig-ger event, displays the current spectrum or, in continuous mode, shows only those spectra that violate the mask.
SummaryThe R&S®FSVR real-time spectrum analyzer offers additional, powerful measurement and analysis features that particularly help users handle difficult applications such as EMC diagnos-tics, and that also reduce the time and cost of product devel-opment. At the same time, the R&S®FSVR combines new realtime functionality with proven spectrum and signal analy-sis, so that the user does not have to do without familiar and established measurement methods.
Matthias Keller; Karl-Heinz Weidner
References[1] Favorably priced EMI measuring receiver for the development lab.
NEWS (2008) No. 197, pp. 40–45. [2] It detects everything: the R&S®FSVR real-time spectrum analyzer.
NEWS (2010) No. 202, pp. 14–17.
EMC / FIELD STRENGTH | Spectrum / signal analyzers
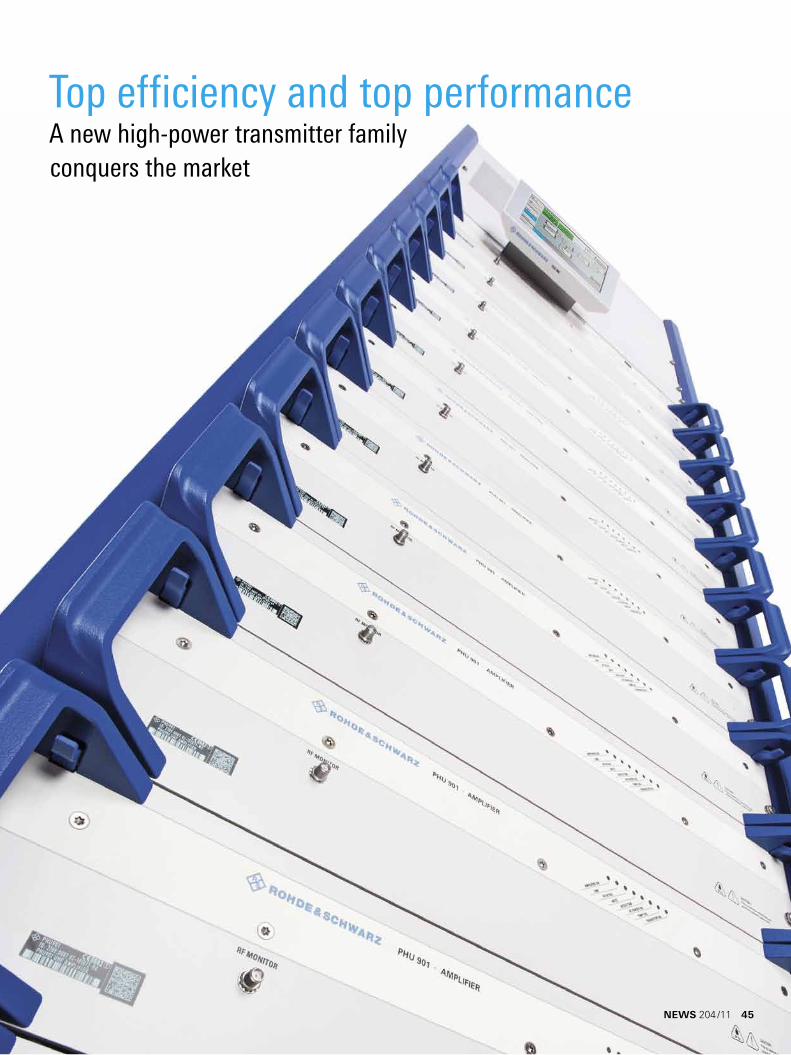
Top efficiency and top performanceA new high-power transmitter family conquers the market
NEWS 204 /11 45
46
Efficiency* was the top-priority goal when
developing the new R&S®THU9 high-
power transmitter family, the first member
of the new R&S®Tx9 transmitter genera-
tion. The transmitters’ unique level of effi-
ciency saves lots of money over the entire
life cycle. Their space-optimized design
delivers more power per square foot of
floor space. Operation via touchscreen
makes work easy even for infrequent
users. The future-ready system concept
safeguards investments and allows prac-
tical transmitter configurations for all
requirements.
FIG 1 In a single rack, the R&S®THU9 transmitter family
delivers up to 15 kW output power for COFDM standards at
an efficiency of up to 28 %.
Efficiency redefined: the R&S®THU9 UHF high-power transmitters
* The development of the ninth transmitter gen-eration from Rohde&Schwarz yields a variety of different technological capacities. Under the heading of “efficiency to the power of five” (E5), all transmitters of the new generation – includ-ing the R&S®THU9 – redefine transmitter efficiency: ❙ Maximum energy efficiency ❙ Space efficiency ❙ Time efficiency in terms of operation
❙ Service efficiency ❙ Investment efficiency
BROADCASTING | TV transmitters
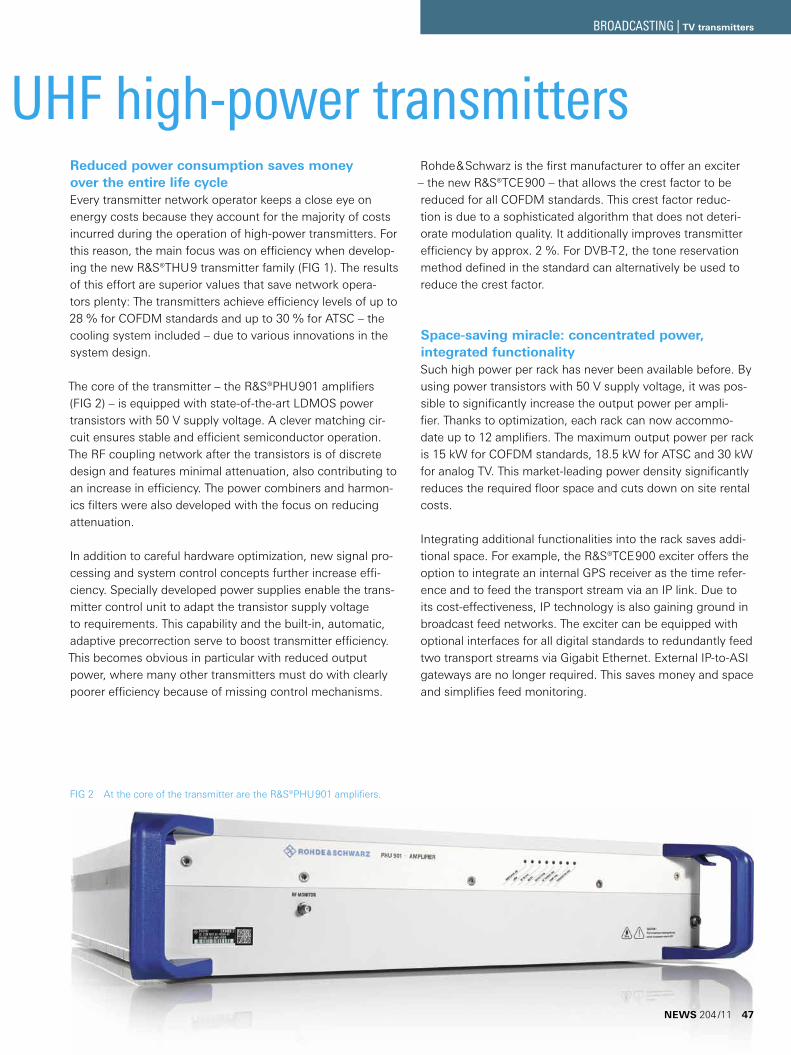
Reduced power consumption saves money over the entire life cycleEvery transmitter network operator keeps a close eye on energy costs because they account for the majority of costs incurred during the operation of high-power transmitters. For this reason, the main focus was on efficiency when develop-ing the new R&S®THU9 transmitter family (FIG 1). The results of this effort are superior values that save network opera-tors plenty: The transmitters achieve efficiency levels of up to 28 % for COFDM standards and up to 30 % for ATSC – the cooling system included – due to various innovations in the system design.
The core of the transmitter – the R&S®PHU901 amplifiers (FIG 2) – is equipped with state-of-the-art LDMOS power transistors with 50 V supply voltage. A clever matching cir-cuit ensures stable and efficient semiconductor operation. The RF coupling network after the transistors is of discrete design and features minimal attenuation, also contributing to an increase in efficiency. The power combiners and harmon-ics filters were also developed with the focus on reducing attenuation.
In addition to careful hardware optimization, new signal pro-cessing and system control concepts further increase effi-ciency. Specially developed power supplies enable the trans-mitter control unit to adapt the transistor supply voltage to requirements. This capability and the built-in, automatic, adaptive precorrection serve to boost transmitter efficiency. This becomes obvious in particular with reduced output power, where many other transmitters must do with clearly poorer efficiency because of missing control mechanisms.
Rohde&Schwarz is the first manufacturer to offer an exciter – the new R&S®TCE900 – that allows the crest factor to be reduced for all COFDM standards. This crest factor reduc-tion is due to a sophisticated algorithm that does not deteri-orate modulation quality. It additionally improves transmitter efficiency by approx. 2 %. For DVB-T2, the tone reservation method defined in the standard can alternatively be used to reduce the crest factor.
Space-saving miracle: concentrated power, integrated functionalitySuch high power per rack has never been available before. By using power transistors with 50 V supply voltage, it was pos-sible to significantly increase the output power per ampli-fier. Thanks to optimization, each rack can now accommo-date up to 12 amplifiers. The maximum output power per rack is 15 kW for COFDM standards, 18.5 kW for ATSC and 30 kW for analog TV. This market-leading power density significantly reduces the required floor space and cuts down on site rental costs.
Integrating additional functionalities into the rack saves addi-tional space. For example, the R&S®TCE900 exciter offers the option to integrate an internal GPS receiver as the time refer-ence and to feed the transport stream via an IP link. Due to its cost-effectiveness, IP technology is also gaining ground in broadcast feed networks. The exciter can be equipped with optional interfaces for all digital standards to redundantly feed two transport streams via Gigabit Ethernet. External IP-to-ASI gateways are no longer required. This saves money and space and simplifies feed monitoring.
Efficiency redefined: the R&S®THU9 UHF high-power transmitters
FIG 2 At the core of the transmitter are the R&S®PHU901 amplifiers.
NEWS 204 /11 47
BROADCASTING | TV transmitters
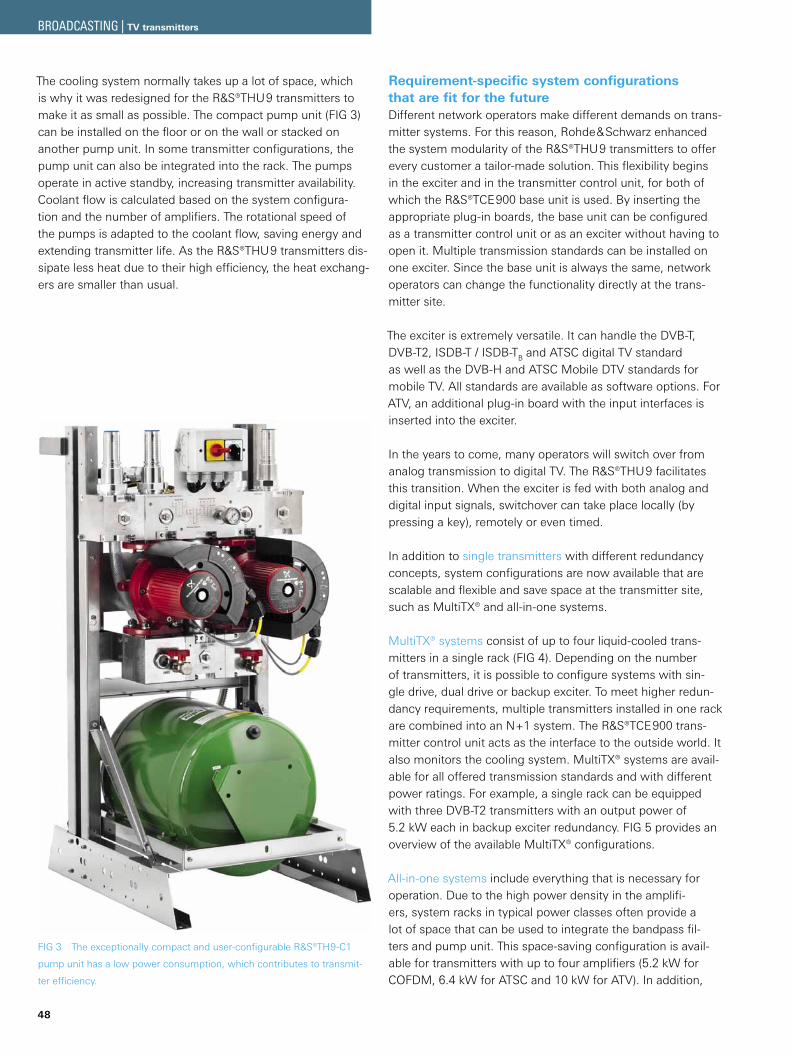
48
The cooling system normally takes up a lot of space, which is why it was redesigned for the R&S®THU9 transmitters to make it as small as possible. The compact pump unit (FIG 3) can be installed on the floor or on the wall or stacked on another pump unit. In some transmitter configurations, the pump unit can also be integrated into the rack. The pumps operate in active standby, increasing transmitter availability. Coolant flow is calculated based on the system configura-tion and the number of amplifiers. The rotational speed of the pumps is adapted to the coolant flow, saving energy and extending transmitter life. As the R&S®THU9 transmitters dis-sipate less heat due to their high efficiency, the heat exchang-ers are smaller than usual.
FIG 3 The exceptionally compact and user-configurable R&S®TH9-C1
pump unit has a low power consumption, which contributes to transmit-
ter efficiency.
Requirement-specific system configurations that are fit for the futureDifferent network operators make different demands on trans-mitter systems. For this reason, Rohde&Schwarz enhanced the system modularity of the R&S®THU9 transmitters to offer every customer a tailor-made solution. This flexibility begins in the exciter and in the transmitter control unit, for both of which the R&S®TCE900 base unit is used. By inserting the appropriate plug-in boards, the base unit can be configured as a transmitter control unit or as an exciter without having to open it. Multiple transmission standards can be installed on one exciter. Since the base unit is always the same, network operators can change the functionality directly at the trans-mitter site.
The exciter is extremely versatile. It can handle the DVB-T, DVB-T2, ISDB-T / ISDB-TB and ATSC digital TV standard as well as the DVB-H and ATSC Mobile DTV standards for mobile TV. All standards are available as software options. For ATV, an additional plug-in board with the input interfaces is inserted into the exciter.
In the years to come, many operators will switch over from analog transmission to digital TV. The R&S®THU9 facilitates this transition. When the exciter is fed with both analog and digital input signals, switchover can take place locally (by pressing a key), remotely or even timed.
In addition to single transmitters with different redundancy concepts, system configurations are now available that are scalable and flexible and save space at the transmitter site, such as MultiTX® and all-in-one systems.
MultiTX® systems consist of up to four liquid-cooled trans-mitters in a single rack (FIG 4). Depending on the number of transmitters, it is possible to configure systems with sin-gle drive, dual drive or backup exciter. To meet higher redun-dancy requirements, multiple transmitters installed in one rack are combined into an N+1 system. The R&S®TCE900 trans-mitter control unit acts as the interface to the outside world. It also monitors the cooling system. MultiTX® systems are avail-able for all offered transmission standards and with different power ratings. For example, a single rack can be equipped with three DVB-T2 transmitters with an output power of 5.2 kW each in backup exciter redundancy. FIG 5 provides an overview of the available MultiTX® configurations.
All-in-one systems include everything that is necessary for operation. Due to the high power density in the amplifi-ers, system racks in typical power classes often provide a lot of space that can be used to integrate the bandpass fil-ters and pump unit. This space-saving configuration is avail-able for transmitters with up to four amplifiers (5.2 kW for COFDM, 6.4 kW for ATSC and 10 kW for ATV). In addition,
BROADCASTING | TV transmitters

Example of a MultiTX® system
¸TCE900as transmitter control unit
¸TCE900as exciter
TS
¸TCE900as exciter
TS
¸TCE900as exciter
TS
¸TCE900as exciter
TS
¸TCE900as exciter
TS
¸TCE900as exciter
TS
RF
RF
5.2 kW RF
Heat exchanger
Pump unit
RF
RF
5.2 kW RF
RF
RF
5.2 kW RF
3 × 4 amplifiers¸PH901
FIG 5 The MultiTX® system allows various multitransmitter configurations.
FIG 4 Example of a MultiTX® system with three transmitters in one rack. Depending on the number of transmitters, it is possible to configure systems
with single drive, dual drive or backup exciter.
Number of amplifiers 1 2 3 4 5 6 8 10 12 16 20 24
Output power (RMS) for COFDM standards ¹)
1.3 kW 2.6 kW 3.9 kW 5.2 kW 6.4 kW 7.7 kW 10.0 kW 12.5 kW 15.0 kW 20.0 kW 24.0 kW 29.0 kW
Output power (RMS) for ATSC / ATSC Mobile DTV ¹)
1.6 kW 3.2 kW 4.8 kW 6.4 kW 8.0 kW 9.5 kW 12.5 kW 15.0 kW 18.5 kW 24.5 kW 30.0 kW 36.0 kW
Output power for ATV (sync peak) ²)
2.6 kW 5.0 kW 7.5 kW 10.0 kW 12.5 kW 15.0 kW 20.0 kW 24.5 kW 30.0 kW 39.0 kW 48.0 kW 58.0 kW
Number of transmitters per rack
up to 4 up to 3 up to 2
Dimensions (H × W × D) 2000 mm × 600 mm × 1100 mm 2000 mm × 1200 mm × 1100 mm
1) Before bandpass filter.2) After four-cavity bandpass filter.
NEWS 204 /11 49
BROADCASTING | TV transmitters
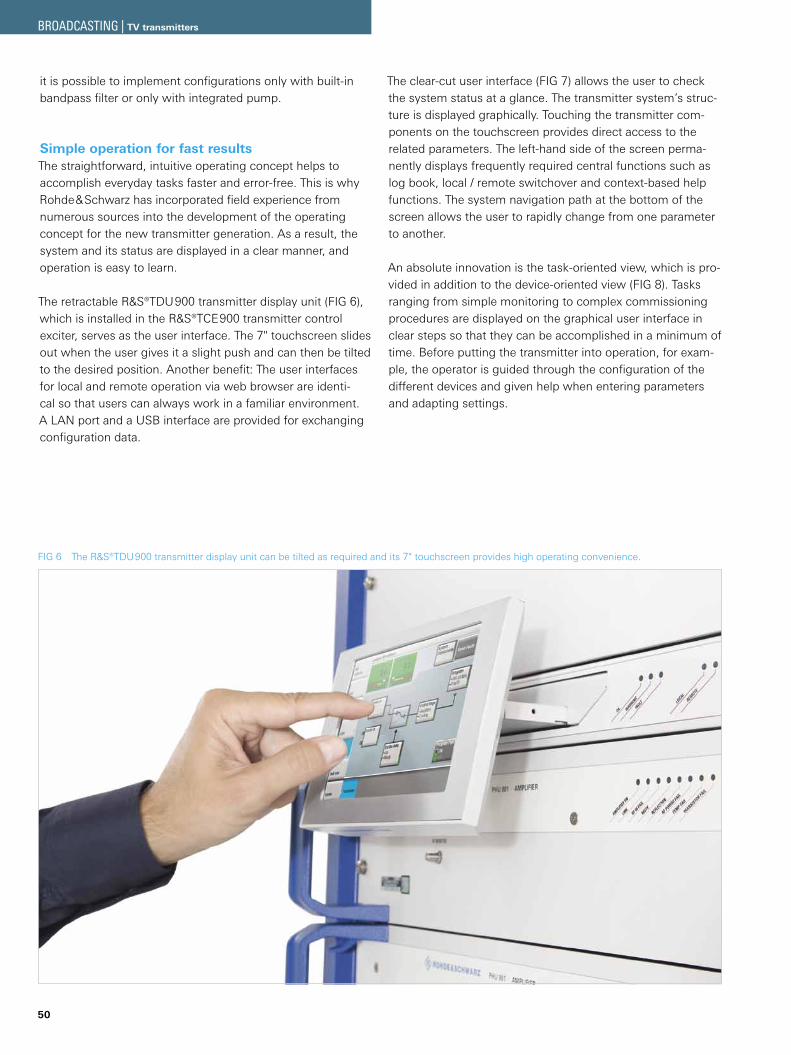
50
it is possible to implement configurations only with built-in bandpass filter or only with integrated pump.
Simple operation for fast resultsThe straightforward, intuitive operating concept helps to accomplish everyday tasks faster and error-free. This is why Rohde&Schwarz has incorporated field experience from numerous sources into the development of the operating concept for the new transmitter generation. As a result, the system and its status are displayed in a clear manner, and operation is easy to learn.
The retractable R&S®TDU900 transmitter display unit (FIG 6), which is installed in the R&S®TCE900 transmitter control exciter, serves as the user interface. The 7" touchscreen slides out when the user gives it a slight push and can then be tilted to the desired position. Another benefit: The user interfaces for local and remote operation via web browser are identi-cal so that users can always work in a familiar environment. A LAN port and a USB interface are provided for exchanging configuration data.
The clear-cut user interface (FIG 7) allows the user to check the system status at a glance. The transmitter system’s struc-ture is displayed graphically. Touching the transmitter com-ponents on the touchscreen provides direct access to the related parameters. The left-hand side of the screen perma-nently displays frequently required central functions such as log book, local / remote switchover and context-based help functions. The system navigation path at the bottom of the screen allows the user to rapidly change from one parameter to another.
An absolute innovation is the task-oriented view, which is pro-vided in addition to the device-oriented view (FIG 8). Tasks ranging from simple monitoring to complex commissioning procedures are displayed on the graphical user interface in clear steps so that they can be accomplished in a minimum of time. Before putting the transmitter into operation, for exam-ple, the operator is guided through the configuration of the different devices and given help when entering parameters and adapting settings.
FIG 6 The R&S®TDU900 transmitter display unit can be tilted as required and its 7" touchscreen provides high operating convenience.
BROADCASTING | TV transmitters

FIG 8 The task-
oriented view.
FIG 7 The device-
oriented view pres-
ents all important
system information
in a straightforward
manner.
NEWS 204 /11 51
BROADCASTING | TV transmitters
Key features at a glance
Brilliant efficiency ❙ Top efficiency thanks to innovative system design ❙ Innovative amplifier with high efficiency ❙ Voltage regulation and crest factor reduction ❙ Efficient liquid cooling system
Scalable and flexible system configuration ❙ MultiTX® system with multiple transmitters and configu-rations in a single rack
❙ R&S®TCE900 base unit – a multitalent that can be used as a transmitter control unit or as an exciter
❙ Simple switchover from analog to digital TV ❙ IP transport stream feed reduces infrastructure costs
Multifaceted, compact design ❙ Highest power density on the market ❙ MultiTX® system with up to four single transmitters per rack
❙ All-in-one transmitter with built-in pump unit and band-pass filter
❙ Space-saving, flexible liquid cooling system
Simple operation for fast results ❙ User-friendly, ergonomic operating unit ❙ Simplified navigation with device-oriented views ❙ Task-oriented menus for fast training of operating per-sonnel
52
A typical Rohde&Schwarz product: reliable and virtually maintenance-freeUsers can rely on the R&S®THU9 transmitter family. Its design has been optimized for high availability and all sys-tem components have outstanding Rohde&Schwarz prod-uct quality. To keep maintenance costs as low as possible, the transmitters were strictly designed for long life. For exam-ple, there are no fans in the amplifiers, which are exclusively liquid-cooled. The R&S®TCE900 is equipped with special fans that have a service life of significantly more than ten years.
SummaryWith the R&S®THU9 transmitter family, Rohde&Schwarz has launched a system that perfectly combines diverse efficiency aspects: Featuring unique efficiency, excellent flexibility and future-readiness, coupled with exceptional power density and a user-tailored operating concept, this transmitter family redefines efficiency. The new transmitters will help network operators to clearly reduce the total cost of ownership of their networks.
Axel Menke
BROADCASTING | TV transmitters

R&S®DVMS for perfect monitoring of DVB-T2 networks
The R&S®DVMS1 and R&S®DVMS4 digital TV monitor-ing systems keep track of the quality of digital TV sig-nals – they detect all relevant errors at the RF and transport stream levels. Besides monitoring up to four signals, they allow in-depth signal analysis in parallel. When equipped with the new plug-in, they are ready to handle DVB-T2. These systems were presented in NEWS (2010) No. 202, pp. 26–29.
Monitoring DVB-T2 networks requires test equipment with both new and adapted functions. The R&S®DVMS1
and R&S®DVMS4 digital TV monitoring systems already support this new standard: Equipped with a new
receiver plug-in and new firmware that supports T2-MI, they are immediately ready to perform tests based on
the latest DVB-T2 extensions of the measurement guidelines.
DVB-T2: a new standard moves forwardThe new DVB-T2 digital terrestrial television standard is a fur-ther development of the DVB-T standard. Many countries in Europe and Africa have already opted to introduce this stan-dard which has been in regular use for some time now in the UK, Finland, Italy and Sweden. DVB-T2 supports higher data rates, mobile reception and different modulation parameters within a channel. The standard also implements more effec-tive error protection and provides a larger range of modu-lation parameters along with a constellation that is slightly rotated for more robust modulation. In addition, a new inter-face for the modulator, the T2 modulator interface (T2-MI), has been specified. It supports the transport of programs via multiple physical layer pipes (PLPs), including the associated modulation parameters (L1 parameters). The individual PLPs have an MPEG-2 transport stream structure and are modu-lated by the transmitter on the basis of the associated modu-lation parameters. This makes it possible to individually opti-mize the transmission of different programs for a high data rate or better robustness.
Monitoring is not a luxuryNetwork monitoring has many clear benefits. In these com-plex networks, monitoring systems provide the ability to quickly detect any errors that occur during signal distribution, signal emission or in the signal structure. This makes it pos-sible to rapidly introduce countermeasures to minimize the downtime. The more comprehensive and detailed the net-work monitoring is, the more accurate the analysis results will be about the location and nature of the error when problems occur. Continuous monitoring is also useful for documenting the signal properties vs. time. This can be important vis-à-vis contracting parties and enables easier verification of compli-ance with agreed quality standards.
Clearly, there are many arguments in favor of monitor-ing – and consequently in favor of the R&S®DVMS1 and R&S®DVMS4 digital TV monitoring systems. These versa-tile monitoring systems can be quickly readied for DVB-T2 by simply installing a plug-in and new firmware. They can be installed at any desired monitoring points in the network and come with many sophisticated features.
Typical monitoring points and functionsEffective monitoring is based on checking a signal at various points in the signal transmission chain – depending on the monitoring functions and objectives. The more points that are monitored, the greater the precision when it comes to deter-mining the source of an error from the results. Some exam-ples are provided below:
Transmitter site ❙ Signal emitted by transmitter
■ Is the signal DVB-T2 compliant? ■ Are the signal quality and strength sufficient?
❙ Signal fed to transmitter ■ Are the content and included modulation parameters correct?
❙ In single-frequency networks ■ Are all of the transmitters in sync?
NEWS 204 /11 53
BROADCASTING | Broadcast monitoring systems
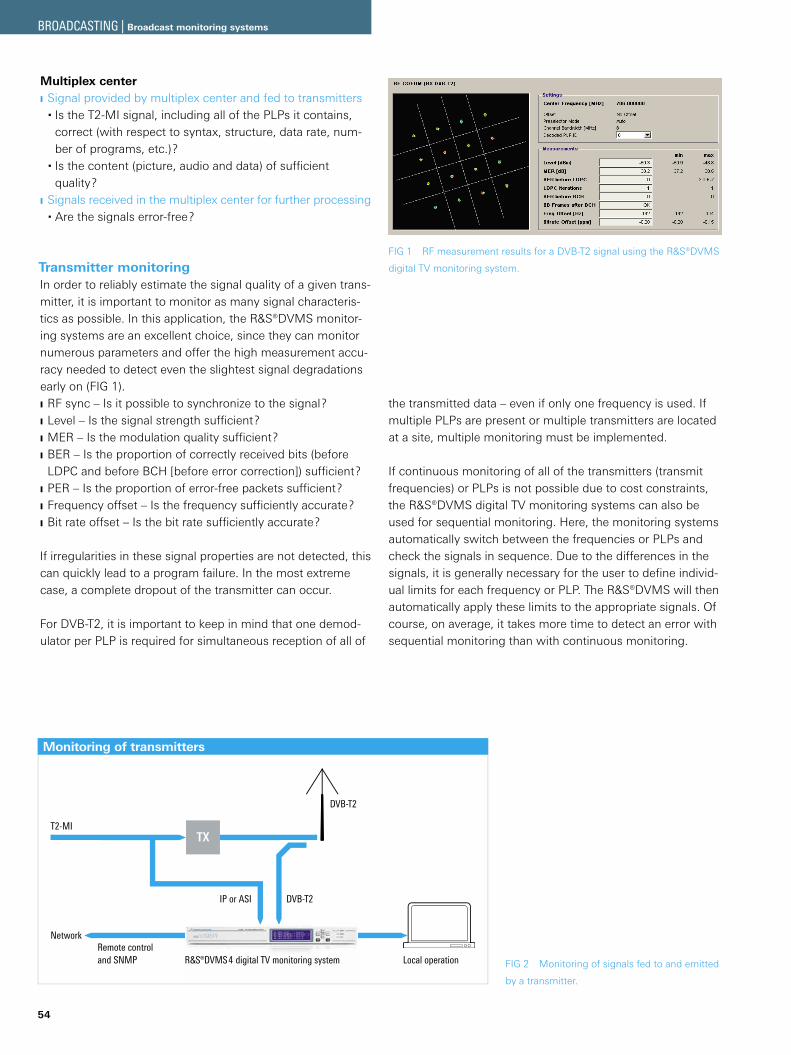
Monitoring of transmitters
TX
DVB-T2
T2-MI
Network
IP or ASI DVB-T2
Remote controland SNMP Local operation¸DVMS4 digital TV monitoring system
54
Multiplex center ❙ Signal provided by multiplex center and fed to transmitters
■ Is the T2-MI signal, including all of the PLPs it contains, correct (with respect to syntax, structure, data rate, num-ber of programs, etc.)?
■ Is the content (picture, audio and data) of sufficient quality?
❙ Signals received in the multiplex center for further processing ■ Are the signals error-free?
Transmitter monitoringIn order to reliably estimate the signal quality of a given trans-mitter, it is important to monitor as many signal characteris-tics as possible. In this application, the R&S®DVMS monitor-ing systems are an excellent choice, since they can monitor numerous parameters and offer the high measurement accu-racy needed to detect even the slightest signal degradations early on (FIG 1). ❙ RF sync – Is it possible to synchronize to the signal? ❙ Level – Is the signal strength sufficient? ❙ MER – Is the modulation quality sufficient? ❙ BER – Is the proportion of correctly received bits (before LDPC and before BCH [before error correction]) sufficient?
❙ PER – Is the proportion of error-free packets sufficient? ❙ Frequency offset – Is the frequency sufficiently accurate? ❙ Bit rate offset – Is the bit rate sufficiently accurate?
If irregularities in these signal properties are not detected, this can quickly lead to a program failure. In the most extreme case, a complete dropout of the transmitter can occur.
For DVB-T2, it is important to keep in mind that one demod-ulator per PLP is required for simultaneous reception of all of
the transmitted data – even if only one frequency is used. If multiple PLPs are present or multiple transmitters are located at a site, multiple monitoring must be implemented.
If continuous monitoring of all of the transmitters (transmit frequencies) or PLPs is not possible due to cost constraints, the R&S®DVMS digital TV monitoring systems can also be used for sequential monitoring. Here, the monitoring systems automatically switch between the frequencies or PLPs and check the signals in sequence. Due to the differences in the signals, it is generally necessary for the user to define individ-ual limits for each frequency or PLP. The R&S®DVMS will then automatically apply these limits to the appropriate signals. Of course, on average, it takes more time to detect an error with sequential monitoring than with continuous monitoring.
FIG 1 RF measurement results for a DVB-T2 signal using the R&S®DVMS
digital TV monitoring system.
FIG 2 Monitoring of signals fed to and emitted
by a transmitter.
BROADCASTING | Broadcast monitoring systems
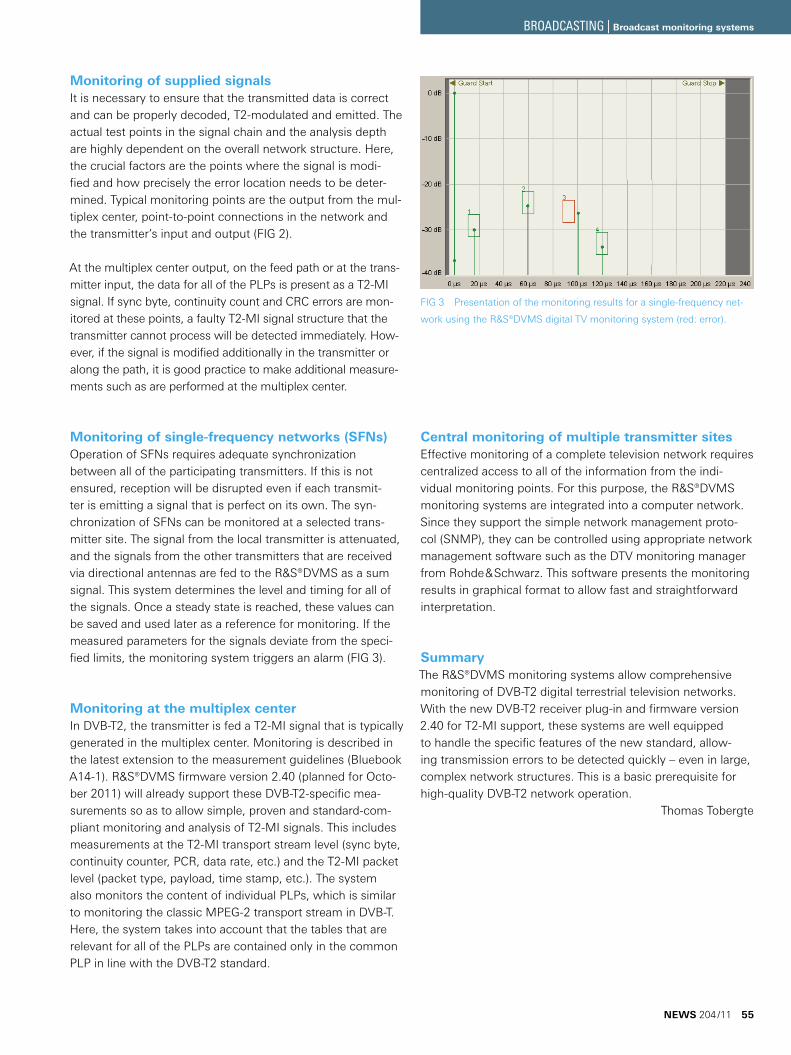
FIG 3 Presentation of the monitoring results for a single-frequency net-
work using the R&S®DVMS digital TV monitoring system (red: error).
Monitoring of supplied signalsIt is necessary to ensure that the transmitted data is correct and can be properly decoded, T2-modulated and emitted. The actual test points in the signal chain and the analysis depth are highly dependent on the overall network structure. Here, the crucial factors are the points where the signal is modi-fied and how precisely the error location needs to be deter-mined. Typical monitoring points are the output from the mul-tiplex center, point-to-point connections in the network and the transmitter’s input and output (FIG 2).
At the multiplex center output, on the feed path or at the trans-mitter input, the data for all of the PLPs is present as a T2-MI signal. If sync byte, continuity count and CRC errors are mon-itored at these points, a faulty T2-MI signal structure that the transmitter cannot process will be detected immediately. How-ever, if the signal is modified additionally in the transmitter or along the path, it is good practice to make additional measure-ments such as are performed at the multiplex center.
Monitoring of single-frequency networks (SFNs)Operation of SFNs requires adequate synchronization between all of the participating transmitters. If this is not ensured, reception will be disrupted even if each transmit-ter is emitting a signal that is perfect on its own. The syn-chronization of SFNs can be monitored at a selected trans-mitter site. The signal from the local transmitter is attenuated, and the signals from the other transmitters that are received via directional antennas are fed to the R&S®DVMS as a sum signal. This system determines the level and timing for all of the signals. Once a steady state is reached, these values can be saved and used later as a reference for monitoring. If the measured parameters for the signals deviate from the speci-fied limits, the monitoring system triggers an alarm (FIG 3).
Monitoring at the multiplex centerIn DVB-T2, the transmitter is fed a T2-MI signal that is typically generated in the multiplex center. Monitoring is described in the latest extension to the measurement guidelines (Bluebook A14-1). R&S®DVMS firmware version 2.40 (planned for Octo-ber 2011) will already support these DVB-T2-specific mea-surements so as to allow simple, proven and standard-com-pliant monitoring and analysis of T2-MI signals. This includes measurements at the T2-MI transport stream level (sync byte, continuity counter, PCR, data rate, etc.) and the T2-MI packet level (packet type, payload, time stamp, etc.). The system also monitors the content of individual PLPs, which is similar to monitoring the classic MPEG-2 transport stream in DVB-T. Here, the system takes into account that the tables that are relevant for all of the PLPs are contained only in the common PLP in line with the DVB-T2 standard.
Central monitoring of multiple transmitter sitesEffective monitoring of a complete television network requires centralized access to all of the information from the indi-vidual monitoring points. For this purpose, the R&S®DVMS monitoring systems are integrated into a computer network. Since they support the simple network management proto-col (SNMP), they can be controlled using appropriate network management software such as the DTV monitoring manager from Rohde&Schwarz. This software presents the monitoring results in graphical format to allow fast and straightforward interpretation.
SummaryThe R&S®DVMS monitoring systems allow comprehensive monitoring of DVB-T2 digital terrestrial television networks. With the new DVB-T2 receiver plug-in and firmware version 2.40 for T2-MI support, these systems are well equipped to handle the specific features of the new standard, allow-ing transmission errors to be detected quickly – even in large, complex network structures. This is a basic prerequisite for high-quality DVB-T2 network operation.
Thomas Tobergte
NEWS 204 /11 55
BROADCASTING | Broadcast monitoring systems
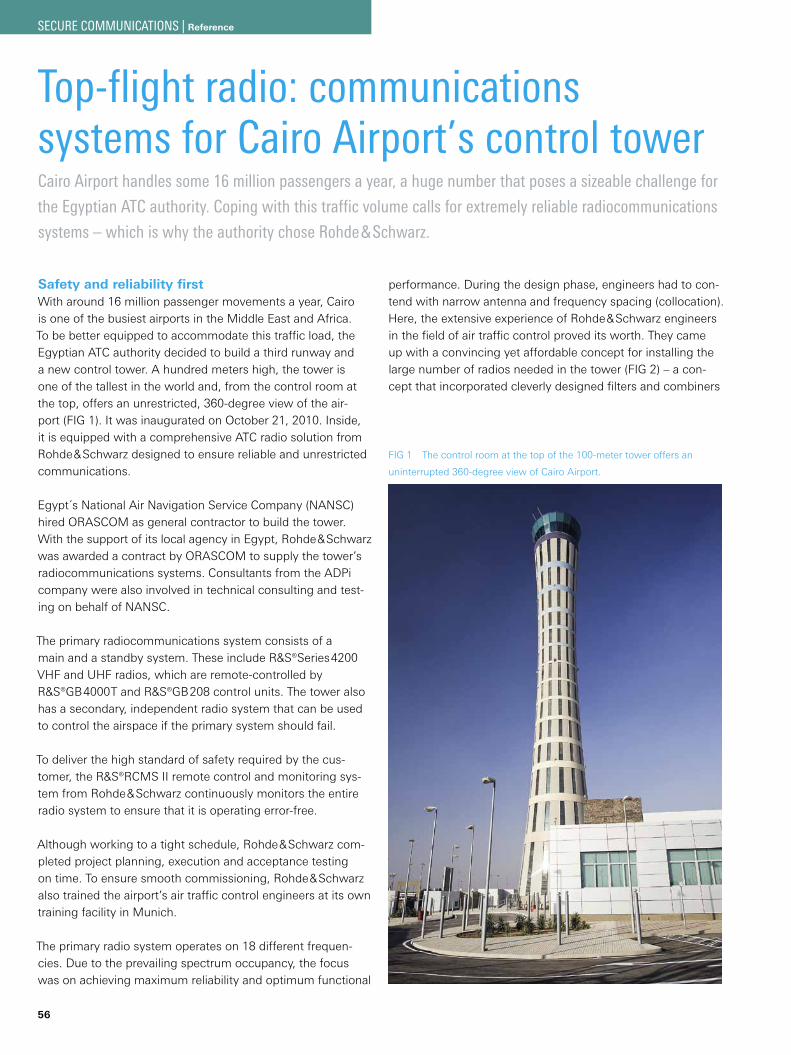
56
Top-flight radio: communications systems for Cairo Airport’s control towerCairo Airport handles some 16 million passengers a year, a huge number that poses a sizeable challenge for
the Egyptian ATC authority. Coping with this traffic volume calls for extremely reliable radiocommunications
systems – which is why the authority chose Rohde&Schwarz.
Safety and reliability firstWith around 16 million passenger movements a year, Cairo is one of the busiest airports in the Middle East and Africa. To be better equipped to accommodate this traffic load, the Egyptian ATC authority decided to build a third runway and a new control tower. A hundred meters high, the tower is one of the tallest in the world and, from the control room at the top, offers an unrestricted, 360-degree view of the air-port (FIG 1). It was inaugurated on October 21, 2010. Inside, it is equipped with a comprehensive ATC radio solution from Rohde&Schwarz designed to ensure reliable and unrestricted communications.
Egypt´s National Air Navigation Service Company (NANSC) hired ORASCOM as general contractor to build the tower. With the support of its local agency in Egypt, Rohde&Schwarz was awarded a contract by ORASCOM to supply the tower’s radiocommunications systems. Consultants from the ADPi company were also involved in technical consulting and test-ing on behalf of NANSC.
The primary radiocommunications system consists of a main and a standby system. These include R&S®Series4200 VHF and UHF radios, which are remote-controlled by R&S®GB4000T and R&S®GB208 control units. The tower also has a secondary, independent radio system that can be used to control the airspace if the primary system should fail.
To deliver the high standard of safety required by the cus-tomer, the R&S®RCMS II remote control and monitoring sys-tem from Rohde&Schwarz continuously monitors the entire radio system to ensure that it is operating error-free.
Although working to a tight schedule, Rohde&Schwarz com-pleted project planning, execution and acceptance testing on time. To ensure smooth commissioning, Rohde&Schwarz also trained the airport’s air traffic control engineers at its own training facility in Munich.
The primary radio system operates on 18 different frequen-cies. Due to the prevailing spectrum occupancy, the focus was on achieving maximum reliability and optimum functional
performance. During the design phase, engineers had to con-tend with narrow antenna and frequency spacing (collocation). Here, the extensive experience of Rohde&Schwarz engineers in the field of air traffic control proved its worth. They came up with a convincing yet affordable concept for installing the large number of radios needed in the tower (FIG 2) – a con-cept that incorporated cleverly designed filters and combiners
FIG 1 The control room at the top of the 100-meter tower offers an
uninterrupted 360-degree view of Cairo Airport.
SECURE COMMUNICATIONS | Reference
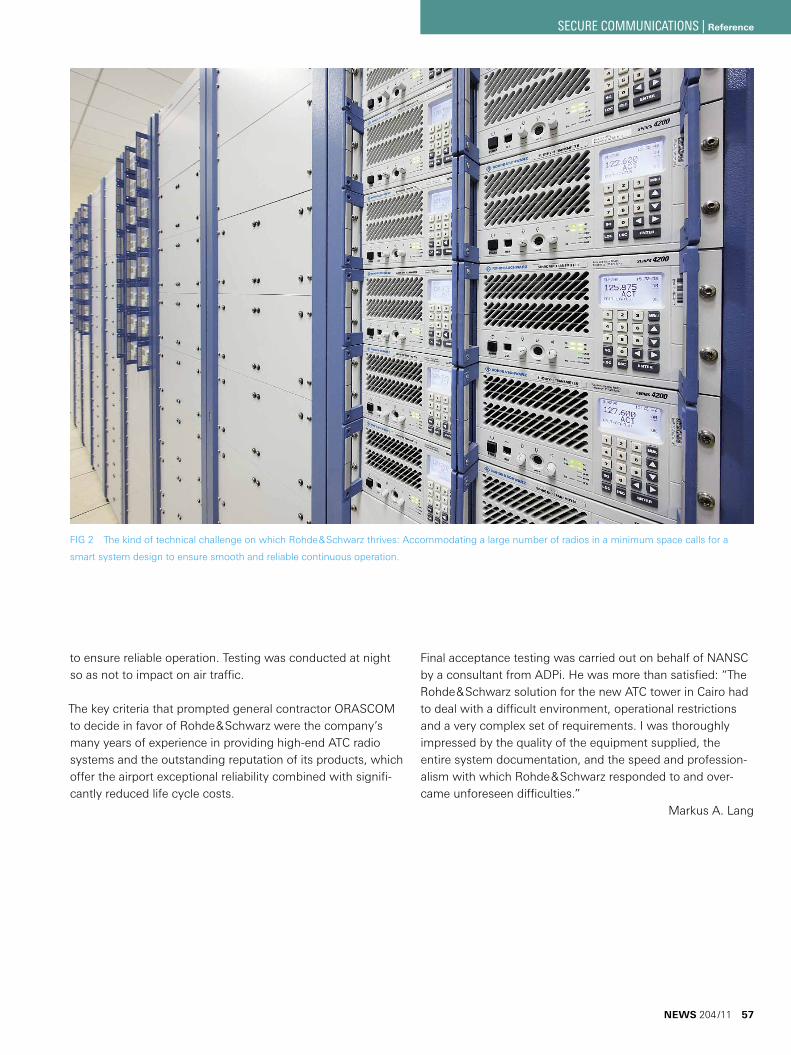
to ensure reliable operation. Testing was conducted at night so as not to impact on air traffic.
The key criteria that prompted general contractor ORASCOM to decide in favor of Rohde&Schwarz were the company’s many years of experience in providing high-end ATC radio systems and the outstanding reputation of its products, which offer the airport exceptional reliability combined with signifi-cantly reduced life cycle costs.
FIG 2 The kind of technical challenge on which Rohde&Schwarz thrives: Accommodating a large number of radios in a minimum space calls for a
smart system design to ensure smooth and reliable continuous operation.
Final acceptance testing was carried out on behalf of NANSC by a consultant from ADPi. He was more than satisfied: “The Rohde&Schwarz solution for the new ATC tower in Cairo had to deal with a difficult environment, operational restrictions and a very complex set of requirements. I was thoroughly impressed by the quality of the equipment supplied, the entire system documentation, and the speed and profession-alism with which Rohde&Schwarz responded to and over-came unforeseen difficulties.”
Markus A. Lang
NEWS 204 /11 57
SECURE COMMUNICATIONS | Reference
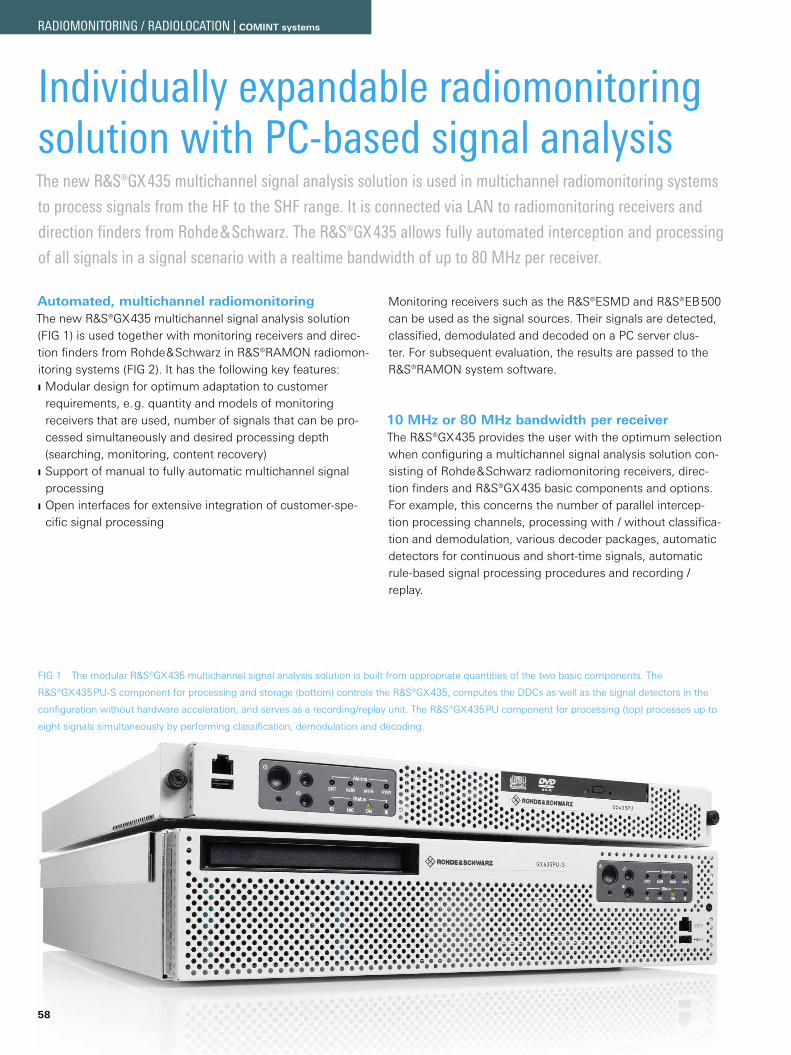
FIG 1 The modular R&S®GX435 multichannel signal analysis solution is built from appropriate quantities of the two basic components. The
R&S®GX435PU-S component for processing and storage (bottom) controls the R&S®GX435, computes the DDCs as well as the signal detectors in the
configuration without hardware acceleration, and serves as a recording/replay unit. The R&S®GX435PU component for processing (top) processes up to
eight signals simultaneously by performing classification, demodulation and decoding.
58
Individually expandable radiomonitoring solution with PC-based signal analysisThe new R&S®GX435 multichannel signal analysis solution is used in multichannel radiomonitoring systems
to process signals from the HF to the SHF range. It is connected via LAN to radiomonitoring receivers and
direction finders from Rohde&Schwarz. The R&S®GX435 allows fully automated interception and processing
of all signals in a signal scenario with a realtime bandwidth of up to 80 MHz per receiver.
Automated, multichannel radiomonitoringThe new R&S®GX435 multichannel signal analysis solution (FIG 1) is used together with monitoring receivers and direc-tion finders from Rohde&Schwarz in R&S®RAMON radiomon-itoring systems (FIG 2). It has the following key features: ❙ Modular design for optimum adaptation to customer requirements, e.g. quantity and models of monitoring receivers that are used, number of signals that can be pro-cessed simultaneously and desired processing depth (searching, monitoring, content recovery)
❙ Support of manual to fully automatic multichannel signal processing
❙ Open interfaces for extensive integration of customer-spe-cific signal processing
Monitoring receivers such as the R&S®ESMD and R&S®EB500 can be used as the signal sources. Their signals are detected, classified, demodulated and decoded on a PC server clus-ter. For subsequent evaluation, the results are passed to the R&S®RAMON system software.
10 MHz or 80 MHz bandwidth per receiverThe R&S®GX435 provides the user with the optimum selection when configuring a multichannel signal analysis solution con-sisting of Rohde&Schwarz radiomonitoring receivers, direc-tion finders and R&S®GX435 basic components and options. For example, this concerns the number of parallel intercep-tion processing channels, processing with / without classifica-tion and demodulation, various decoder packages, automatic detectors for continuous and short-time signals, automatic rule-based signal processing procedures and recording / replay.
RADIOMONITORING / RADIOLOCATION | COMINT systems
R&S®RAMON radiomonitoring system with three workstations
R&S®DDF550
DF antenna
R&S®GX435 with R&S®ESMD
R&S®GX435 with R&S®EB500
Ethernet
System server
R&S®GX425 IF recoder
Antenna
RF multiplexer
R&S®GX435 R&S®GX435 and receiver with board for hardware-accelerated signal analysis
Maximum processable realtime bandwidth per wideband receiver
10 MHz 80 MHz
Number of extractable signals per wideband receiver (using DDC computation) at 10 MHz bandwidth
HF: 32 (up to 30 kHz bandwidth) VHF/UHF/SHF: 8 (up to 300 kHz bandwidth)
HF: 126 (up to 30 kHz bandwidth) VHF/UHF/SHF: 16 (up to 300 kHz bandwidth)
at 20 MHz bandwidth – HF: 126 (up to 30 kHz bandwidth) VHF/UHF/SHF: 16 (up to 300 kHz bandwidth)
at 80 MHz bandwidth – VHF/UHF/SHF: 16 (up to 300 kHz bandwidth)Maximum realtime bandwidth for signal detection ( continuous and short-time signals)
HF: 10 MHz VHF/UHF/SHF: 10 MHz
HF: 20 MHz VHF/UHF/SHF: 80 MHz
Maximum demodulated baud rate for a signal HF: 4800 baud VHF/UHF/SHF: 25 kbaud
HF: 4800 baud VHF/UHF/SHF: 10 Mbaud
FIG 3 Key performance data of the R&S®GX 435 multichannel signal analysis solution.
The monitoring receivers are connected to the system via Ethernet LAN. In the basic version, each receiver provides a maximum transmission bandwidth of 10 MHz for the I/Q data. The R&S®GX435 processes these signals online and can save them simultaneously in the form of digital I/Q raw data. Recorded files with I/Q raw data or imported signal files in WAV format that were saved using other receiving equip-ment can be used as offline signal sources. These files can be played and processed using the replay function provided by the R&S®GX435.
Some monitoring receivers such as the R&S®ESMD and direction finders such as the R&S®DDF255 can be option-ally equipped with a board for hardware-accelerated signal processing. As a result, signal scenarios with bandwidths of up to 80 MHz per receiver can be made available in realtime to the R&S®GX435 multichannel signal analysis solution for online processing (FIG 3). The board contains four field-pro-grammable gate arrays (FPGA) and supports the following high-performance signal processing functions:
FIG 2 The R&S®RAMON system with the R&S®ESMD and R&S®EB500 wideband monitoring receivers, one R&S®DDF550 digital direction finder,
one R&S®GX425 recording / replay component and three workstations. The two R&S®GX435 multichannel signal analysis solution units support the
R&S®ESMD and the R&S®EB500 with simultaneous processing of up to 32 signals from the receiver´s wideband signal scenarios.
NEWS 204 /11 59
RADIOMONITORING / RADIOLOCATION | COMINT systems
Q
E
W
60
❙ Extraction of a large quantity of signals using a digital downconverter (DDC)
❙ Detection of all continuous and all short-time signals in the receiver’s realtime bandwidth
❙ Demodulation of a broadband signal with baud rates of up to 10 Mbaud
Automatic multichannel signal search, classification and processingThe R&S®GX435 supports manual processing of signals, but it is designed especially for fully automatic signal search mon-itoring and processing. For automatic searching, the user enters the number of classifiers to be used along with the desired classification depth and the rules for automatic pro-cessing of the detected signals. For the classification depth, the user can select energy detection as well as modulation type and transmission system classification. The R&S®GX435 detects spectral energy in the receiver’s realtime bandwidth
and inserts detected signals into the queue of signals to be classified. The classifiers automatically process the signals in this list that are extracted by the DDCs and determine the technical parameters in accordance with the desired classifi-cation depth.
The automatic classifier in the R&S®GX435 analyzes any selected signal. It can classify the following modulation types, for example: A3E, J3E, ASK2, FSK2, FSK4, multitone and multichannel systems, MSK, OQPSK, PSK2 / 4 / 8 (A and B variants in each case), QAM16, OFDM and burst methods. It outputs the following technical parameters as measure-ment results: center frequency, bandwidth, modulation type, plus additional parameters such as shift, symbol rate, num-ber of channels, channel spacing and burst length. It adds time information and a quality value to each result. The clas-sification of the bit stream or transmission system checks the demodulated signal for characteristics in order to determine a code or the method.
FIG 4 The fully automatic search and classification application detects all signals in a specified frequency range based on their spectral energy (Q),
automatically assigns classifiers in succession to these signals and collects the results in a list (W). For each signal that is detected, a user-definable rule
is applied. The automatic actions that are triggered are logged in the result list (E).
RADIOMONITORING / RADIOLOCATION | COMINT systems
If there are more signals in the queue of signals awaiting clas-sification than there are free classifiers, a selection strategy is used to determine which signals are to be classified first and which should remain in the queue. The standard strategy gives the highest priority to signals that are currently active and to those that are currently ending. For this purpose, the R&S®GX435 offers two I/Q data paths. The live path is used for detection. For classification and processing of the sig-nals, the second I/Q data path, which is delayed by several seconds, is used. This gives the system a few more seconds to also analyze and process signals that have already been terminated.
For each signal that is classified, the R&S®GX435 applies a user-configurable set of rules that specifies how to perform automatic signal processing (FIG 4). The condition for a rule can be a combination of all measured signal parameters (e.g. center frequency, bandwidth, signal start time, detected mod-ulation type and parameters, detected transmission system). For the action to be performed, commands are available, for example, to alert the user, perform I/Q recording of the signal and record the demodulated bit stream and the decoded sig-nal content. A fixed time interval or the criterion “until end of signal” can be specified for recording.
Production and analysisAfter successful classification or if the transmission system parameters are known in advance, the R&S®GX435 sets the appropriate digital/analog demodulator and the appropriate decoder in order to recover the contents of the signal. The system saves all technical details and data content in a data-base for subsequent access during postprocessing. The R&S®GX435’s transmission system library is growing contin-uously and currently covers more than 100 HF and VHF/UHF transmission systems.
Recorded I/Q files can be played back in the R&S®GX435 or extracted and passed on to a special workstation for offline signal analysis (e.g. using the R&S®GX410 [1] or the R&S®GX430 / GX430IS [2]). The data obtained through demodulation (symbol or bit streams) can be passed in file format to the powerful R&S®CA 250 bit stream analysis soft-ware [3]. This software is useful for investigating unknown bit streams (bit structures, block codes, convolutional codes, scramblers, alphabets, etc.).
References[1] The R&S®GX400 and R&S®GX410 are briefly described here:
R&S®AMMOS Laboratory R&S®AMLAB – Compact system for wideband interception and technical analysis. NEWS (2007) No. 194, pp. 60–65.
[2] R&S®GX430: Powerful, PC-based signal analysis and signal processing. NEWS (2008) No. 196, pp. 48–53.
[3] Convenient signal analysis at the symbol and bit stream level. NEWS (2009) No. 199, pp. 79–81.
User-specific expansionsThe open interface concept of the R&S®GX435 allows the user to integrate and operate user-programmed transmis-sion system modules (demodulator, decoder). Moreover, it is possible to integrate user-developed classifiers into the R&S®GX435 which function in parallel to the classifier pro-vided by Rohde&Schwarz. Receivers with a digital interface that are not from Rohde&Schwarz can be integrated via user-programmed drivers. Clearly, the multichannel signal analysis solution is ideally equipped to meet any of the user’s expan-sion requirements.
Summary and future developmentsThe R&S®GX435 is a modular, automatic system for radio-monitoring allowing multichannel analysis and processing of analog and digital signals. Owing to the user-configu-rable, rule-based automaton, the user can adapt the search and monitoring capabilities to meet individual requirements. The demodulator and transmission system libraries in the R&S®GX435 are undergoing continuous expansion, as are the capabilities in the areas of classification and automatic sig-nal detection. Moreover, the open interfaces allow the user to make customized expansions to the signal processing capa-bilities of the multichannel signal analysis solution.
Jürgen Modlich
NEWS 204 /11 61
RADIOMONITORING / RADIOLOCATION | COMINT systems
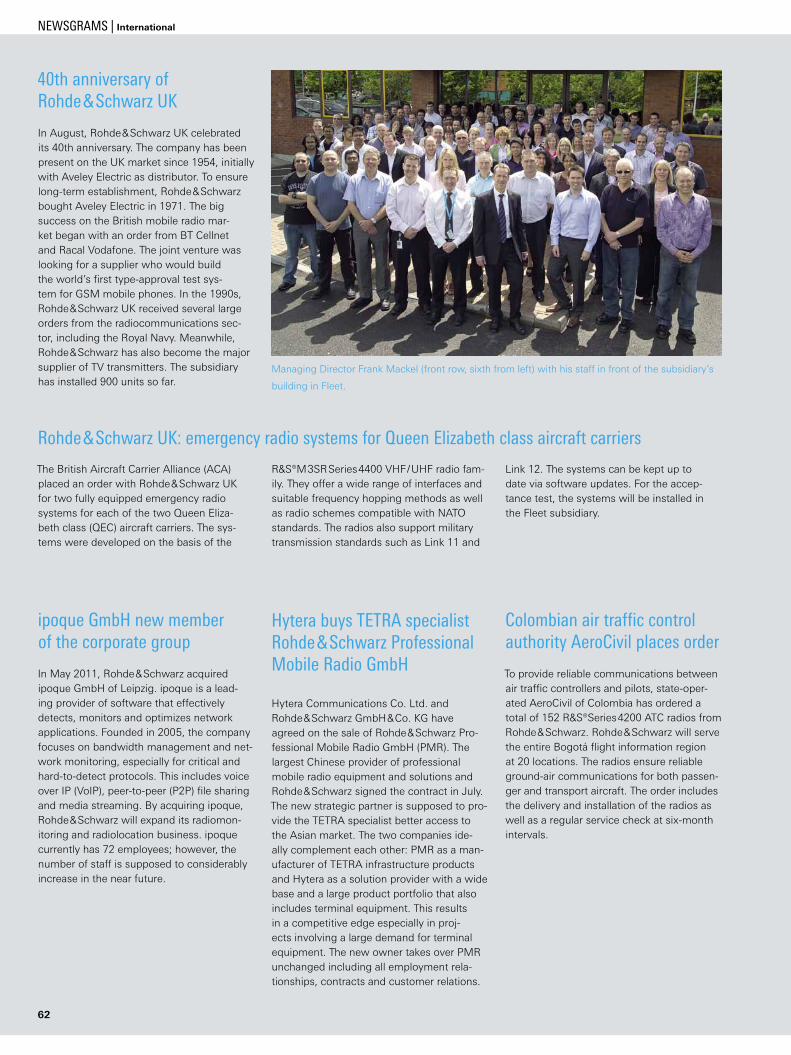
62
ipoque GmbH new member of the corporate group
In May 2011, Rohde&Schwarz acquired ipoque GmbH of Leipzig. ipoque is a lead-ing provider of software that effectively detects, monitors and optimizes network applications. Founded in 2005, the company focuses on bandwidth management and net-work monitoring, especially for critical and hard-to-detect protocols. This includes voice over IP (VoIP), peer-to-peer (P2P) file sharing and media streaming. By acquiring ipoque, Rohde&Schwarz will expand its radiomon-itoring and radiolocation business. ipoque currently has 72 employees; however, the number of staff is supposed to considerably increase in the near future.
Hytera buys TETRA specialist Rohde&Schwarz Professional Mobile Radio GmbH
Hytera Communications Co. Ltd. and Rohde&Schwarz GmbH&Co. KG have agreed on the sale of Rohde&Schwarz Pro-fessional Mobile Radio GmbH (PMR). The largest Chinese provider of professional mobile radio equipment and solutions and Rohde&Schwarz signed the contract in July. The new strategic partner is supposed to pro-vide the TETRA specialist better access to the Asian market. The two companies ide-ally complement each other: PMR as a man-ufacturer of TETRA infrastructure products and Hytera as a solution provider with a wide base and a large product portfolio that also includes terminal equipment. This results in a competitive edge especially in proj-ects involving a large demand for terminal equipment. The new owner takes over PMR unchanged including all employment rela-tionships, contracts and customer relations.
Colombian air traffic control authority AeroCivil places order
To provide reliable communications between air traffic controllers and pilots, state-oper-ated AeroCivil of Colombia has ordered a total of 152 R&S®Series4200 ATC radios from Rohde&Schwarz. Rohde&Schwarz will serve the entire Bogotá flight information region at 20 locations. The radios ensure reliable ground-air communications for both passen-ger and transport aircraft. The order includes the delivery and installation of the radios as well as a regular service check at six-month intervals.
The British Aircraft Carrier Alliance (ACA) placed an order with Rohde&Schwarz UK for two fully equipped emergency radio systems for each of the two Queen Eliza-beth class (QEC) aircraft carriers. The sys-tems were developed on the basis of the
40th anniversary of Rohde&Schwarz UK
In August, Rohde&Schwarz UK celebrated its 40th anniversary. The company has been present on the UK market since 1954, initially with Aveley Electric as distributor. To ensure long-term establishment, Rohde&Schwarz bought Aveley Electric in 1971. The big success on the British mobile radio mar-ket began with an order from BT Cellnet and Racal Vodafone. The joint venture was looking for a supplier who would build the world’s first type-approval test sys-tem for GSM mobile phones. In the 1990s, Rohde&Schwarz UK received several large orders from the radiocommunications sec-tor, including the Royal Navy. Meanwhile, Rohde&Schwarz has also become the major supplier of TV transmitters. The subsidiary has installed 900 units so far.
Managing Director Frank Mackel (front row, sixth from left) with his staff in front of the subsidiary’s
building in Fleet.
Rohde&Schwarz UK: emergency radio systems for Queen Elizabeth class aircraft carriers
R&S®M3SRSeries4400 VHF/UHF radio fam-ily. They offer a wide range of interfaces and suitable frequency hopping methods as well as radio schemes compatible with NATO standards. The radios also support military transmission standards such as Link 11 and
Link 12. The systems can be kept up to date via software updates. For the accep-tance test, the systems will be installed in the Fleet subsidiary.
NEWSGRAMS | International
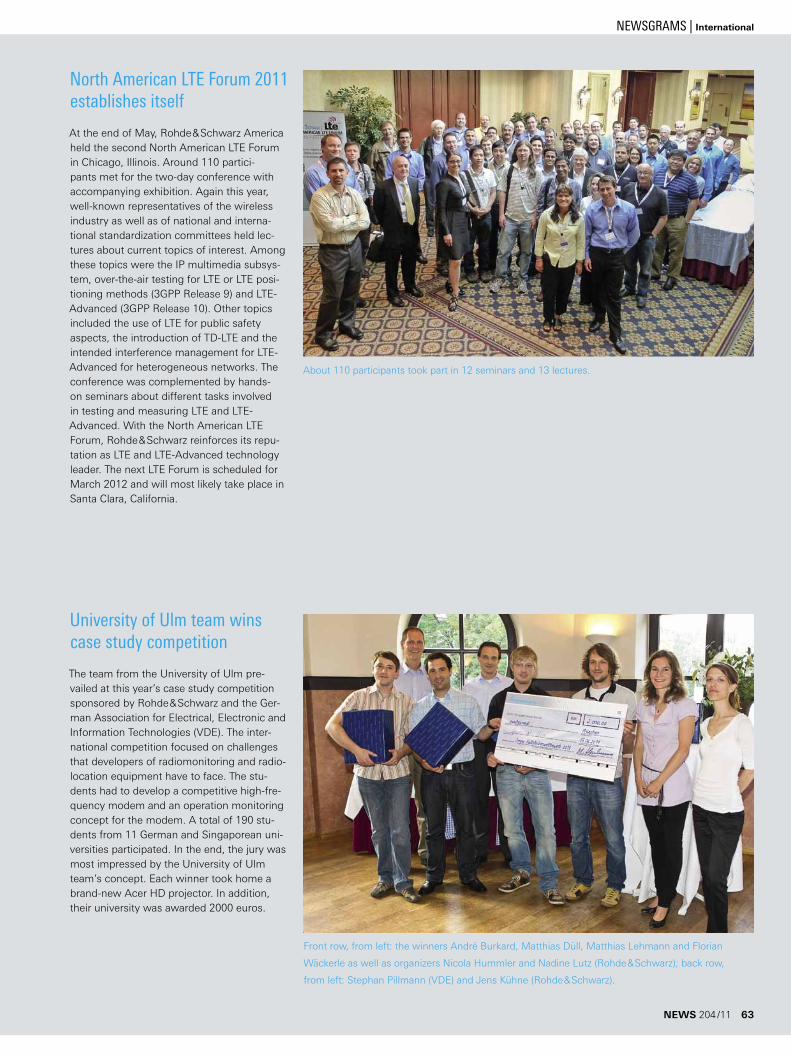
University of Ulm team wins case study competition
The team from the University of Ulm pre-vailed at this year’s case study competition sponsored by Rohde&Schwarz and the Ger-man Association for Electrical, Electronic and Information Technologies (VDE). The inter-national competition focused on challenges that developers of radiomonitoring and radio-location equipment have to face. The stu-dents had to develop a competitive high-fre-quency modem and an operation monitoring concept for the modem. A total of 190 stu-dents from 11 German and Singaporean uni-versities participated. In the end, the jury was most impressed by the University of Ulm team’s concept. Each winner took home a brand-new Acer HD projector. In addition, their university was awarded 2000 euros.
North American LTE Forum 2011 establishes itself
At the end of May, Rohde&Schwarz America held the second North American LTE Forum in Chicago, Illinois. Around 110 partici-pants met for the two-day conference with accompanying exhibition. Again this year, well-known representatives of the wireless industry as well as of national and interna-tional standardization committees held lec-tures about current topics of interest. Among these topics were the IP multimedia subsys-tem, over-the-air testing for LTE or LTE posi-tioning methods (3GPP Release 9) and LTE-Advanced (3GPP Release 10). Other topics included the use of LTE for public safety aspects, the introduction of TD-LTE and the intended interference management for LTE-Advanced for heterogeneous networks. The conference was complemented by hands-on seminars about different tasks involved in testing and measuring LTE and LTE-Advanced. With the North American LTE Forum, Rohde&Schwarz reinforces its repu-tation as LTE and LTE-Advanced technology leader. The next LTE Forum is scheduled for March 2012 and will most likely take place in Santa Clara, California.
Front row, from left: the winners André Burkard, Matthias Düll, Matthias Lehmann and Florian
Wäckerle as well as organizers Nicola Hummler and Nadine Lutz (Rohde&Schwarz); back row,
from left: Stephan Pillmann (VDE) and Jens Kühne (Rohde&Schwarz).
About 110 participants took part in 12 seminars and 13 lectures.
NEWS 204 /11 63
NEWSGRAMS | International
Fast. Accurate. USB-capable.Power sensorsfrom Rohde & Schwarz.Depending on the application, the focus of power measurements can be on measurement accuracy, measurement speed or both. The R&S®NRP family offers the best characteristics on the market in each case: ❙ Universal power sensors: ideal combination of accuracy and measurement speed plus the widest dynamic range
❙ Wideband power sensors: high video bandwidth and automatic pulse analysis ❙ Thermal power sensors: outstanding linearity and highest accuracy The frequency range of the sensors extends from DC to 67 GHz with a maximum dynamic range of 90 dB.
For more details, visit: www.rohde-schwarz.com/ad/nrp