2020 global retirement index - natixis
TRANSCRIPT

2020 Global Retirement IndexAn in-depth assessment of welfare in retirement around the world
2Global Retirement Index 2020
Table of contents
September 2020 – Letter from Natixis CEO Jean Raby 3
Executive Summary 4
What could possibly go wrong? How 2020 has compoundedthe threats to global retirement security 5
Key Findings 21
The Global Retirement Index 2020 22
Framework 23
The Best Performers 24
Regional Perspective 27
Year-on-Year Trends 29
Performance by Sub-Index 31
Health Index 32
Spotlight: Coronavirus and Retiree Health 34
Material Wellbeing Index 36
Spotlight: Disparate effects of the coronavirus 38
Finances in Retirement Index 40
Spotlight: Low interest rates – the new normal 43
Quality of Life Index 45
Country Reports 47
References 79
Framework 80
Appendix A: Methodology 81
Constructing the Global Retirement Index 85
Appendix B: Full Rankings 86

3Global Retirement Index 2020
September 2020
With the world facing immediate issues resulting from the coronavirus pandemic and the economic consequences from the response of governments around the world, wildfires and other natural catastrophes triggered by changing weather and climate patterns, and heightened concerns about social justice and income inequality, the long-term goal of retirement security may not appear to be a top global concern in 2020.
In reality, though, the crises we are experiencing today will have long-range implications for global retirement security and the impact will likely be felt for decades to come. As we see with current challenges, it will take a coordinated effort from policy makers, businesses and individuals to address the challenge of ensuring people can retire secure in the knowledge they have adequate financial resources after a lifetime of work.
Looking at results from the 2020 Natixis Global Retirement index, we see that even among those countries that today find a balance between material wellbeing, retirement finances, health, and quality of life, there is no guarantee of long-term success. As we have done in recent years, we complement our quantitative analysis of these factors with a qualitative examination of the issues that pose a risk to retirement security. In light of what we have seen so far this year, those risks are growing.
COVID-19 obviously poses significant risks to today’s retirees, as mortality rates from the disease disproportionately skew to older individuals. But policy actions taken to address the economic ramifications of the pandemic present long-term risk to retirement security, and interest rates are one of the greatest pressures.
Between January and July 2020 alone, central bankers around the world implemented 173 rate cuts.* A growing number of central banks have moved to negative rates to quell market fears. In examining this phenomenon, we find that only one country in the Index – the UK – presented a negative five-year average for real interest rates when we began tracking the data in 2016. Today there are 16. Rates matter in retirement, and with the US Federal Reserve’s recent forecast on rates to remain low through 2023, they will continue to impact pension liabilities and retiree income for the foreseeable future.
Along with rates, our examination of the risks looks at the current economic pressures on retirement savings, the uncertainty presented by record levels of public debt, the physical and financial risks of climate change, and the long-term impact of income inequality.
With so much that is uncertain in the world today, we believe that only collaborative efforts can make a positive difference in the results. Asset managers, among others, have to work alongside policy makers, employers and individuals to meet the challenge of ensuring a secure retirement for individuals around the globe. We like to believe that our Global Retirement Index can fuel the debate about the actions needed to realize this critical goal.
Jean Raby Chief Executive Officer Natixis Investment Managers
*Natixis Portfolio Research and Consulting Group

4Global Retirement Index 2020
Executive Summary
Top 10 Countries for Retirement Security
1. Iceland 6. New Zealand
2. Switzerland 7. Australia
3. Norway 8. Canada
4. Ireland 9. Denmark
5. Netherlands 10. Germany
1 Recession
Even short-term obstacles to retirement savings have the potential to compound into a long-term problem. High unemployment means both retirement plan contributions and payroll taxes earmarked for public pensions are dramatically reduced. Adding to long-term challenges are the hardship plan withdrawals many have been forced to make just to stay above water.
2 Interest rates
Rates have been at historic lows for 12+ years, but the global shutdown has forced even more cuts. Going forward, retirees will have to be resourceful in how they manage income needs, while pension managers will need to think creatively about how they will manage long-term liabilities.
3 Public debt
Public spending on stimulus and aid has been essential to keep the economy afloat, but it also compounds record public debt levels. In the future, debt will present policy makers with difficult decisions about how they address the needs of retirees.
4 Climate
As demonstrated by recent Australian wildfires, climate-related natural disasters are becoming more severe and more frequent, and they are leaving vulnerable retirees exposed to higher levels of physical and financial risk.
5 Economic inequality
The social justice movement has brought income inequality into focus. Whether the data is examined by race or gender, it demonstrates that a lifetime of lower earning potential adds up to a greater imbalance in retirement savings, funding, and income.
Five critical risks to retirement security
5Global Retirement Index 2020
Retirement security was on shaky ground at the start of 2020: Aging demographics were conspiring to undo the math behind pay-as-you-
go pension systems. Twelve years of low interest rates limits income options for retirees and increases liabilities for pension managers.
Record levels of public debt were forcing tough funding decisions for public policy makers. All while climate-related disasters and declining
environmental quality posed risks to the health, safety and finances of retirees.
If the world was risky in January, by June it had become a high-wire act as public health, social, economic, and financial risks all reached peak
levels of concern. It is clear that the issues present overwhelming risk and dire short-term consequences that demand an urgent response
from policy makers. But the actions that are wholly necessary to shore up the world economy now will have a profound long-term effect on a
wide range of economic and societal issues including global retirement security.
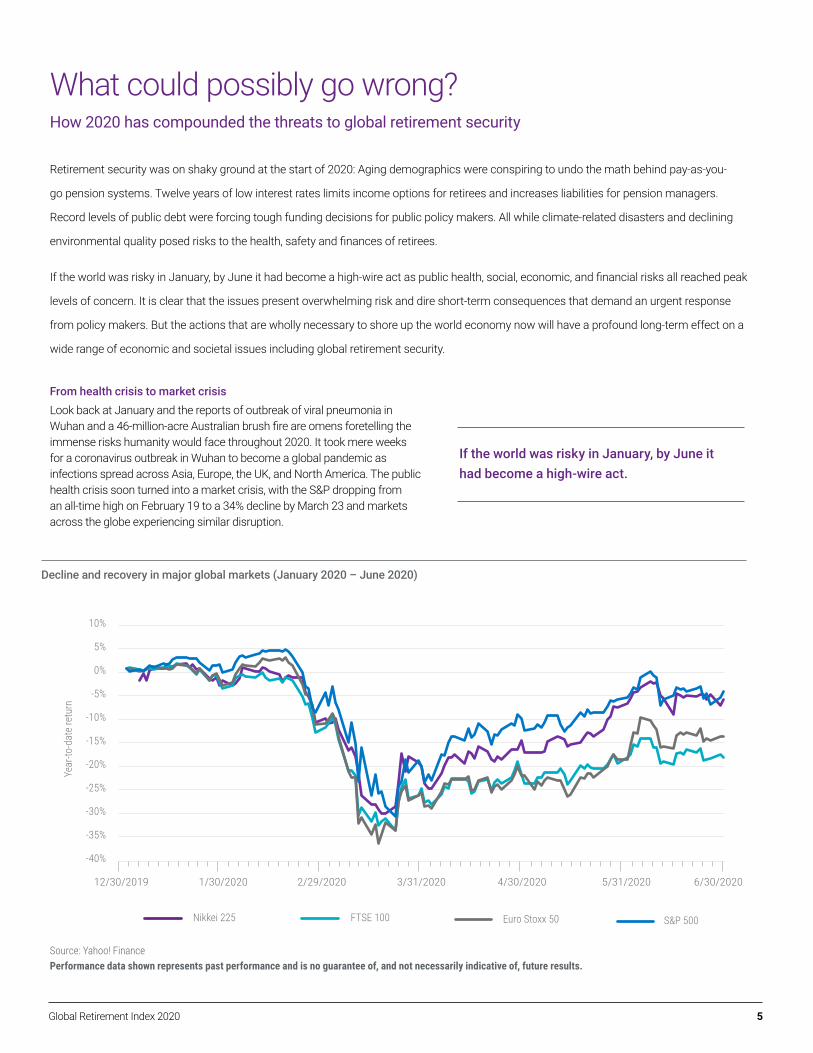
From health crisis to market crisisLook back at January and the reports of outbreak of viral pneumonia in Wuhan and a 46-million-acre Australian brush fire are omens foretelling the immense risks humanity would face throughout 2020. It took mere weeks for a coronavirus outbreak in Wuhan to become a global pandemic as infections spread across Asia, Europe, the UK, and North America. The public health crisis soon turned into a market crisis, with the S&P dropping from an all-time high on February 19 to a 34% decline by March 23 and markets across the globe experiencing similar disruption.
If the world was risky in January, by June it had become a high-wire act.
Decline and recovery in major global markets (January 2020 – June 2020)
Year
-to-d
ate
retu
rn
Nikkei 225 S&P 500Euro Stoxx 50FTSE 100
12/30/2019 1/30/2020 2/29/2020 3/31/2020 4/30/2020 5/31/2020 6/30/2020
-40%
-35%
-30%
-25%
-20%
-15%
-10%
-5%
0%
5%
10%
What could possibly go wrong?How 2020 has compounded the threats to global retirement security
Source: Yahoo! FinancePerformance data shown represents past performance and is no guarantee of, and not necessarily indicative of, future results.

6Global Retirement Index 2020
As losses mounted, trillions of fiscal and monetary intervention (as of mid-May) would be necessary to keep a market crisis from turning into a global financial crisis – with more on the way. Shutting down large swaths of the $90 trillion global economy in March, April, and May helped flatten the curve in COVID hot spots, but also resulted in the biggest drop in quarterly growth ever recorded and massive waves of unemployment.
Then, just as policy makers began to implement measures to safely re-open the economy, the spotlight turned to the death of George Floyd while restrained by Minneapolis police, igniting a global social justice movement that accelerated into mass protests around the world.
Retirement security on high alertNow, three-quarters of the way into 2020, retirement security is on high alert. The measures taken to respond to immediate and dire health, financial, and social risks have been essential to managing the crisis. But over the long term, these same measures are setting off warning bells for individuals, employers, institutions, policy makers, and asset managers who need to recognize the long-term implications for retirement security.
So far, the year 2020 has delivered some of the greatest threats to public health and the global economy in more than a century. Clearly, a drastic situation demands a swift, dramatic response. So far, efforts to moderate some of the economic impact of the pandemic have worked. But today’s actions will clearly present greater challenges to retirement security in the long term – challenges that start with recession.
Recession: Today’s triple threatSlow global growth has been a long-simmering concern. In fact, 67% of those included in the Natixis 2019 Global Survey of Institutional Investors1 thought slow growth would have a negative impact on performance in 2020. Despite the dark forecast, few have could imagined the global economy was about to be thrown into the worst recession since World War II. Nor could anyone have anticipated that global unemployment would reach its highest level since 1965.2
The short-term phenomenon of recession has already left an indelible mark on long-term retirement security in the 21st century. Both the Tech Bubble (2001) and the Global Financial Crisis (2008–2009) hit retirees hard as they saw account balances drop and income decline. But the speed and scale of the pandemic recession makes it particularly challenging for retirees.
The International Monetary Fund estimates the global economy will shrink by 3% in 2020, resulting in losses of $9 trillion – an amount greater than the economies of Germany and Japan combined.3 In the US, Pew Foundation research reports that unemployment rose faster in the first three months of the pandemic than the two years of the global financial crisis. In February, just 6.2 million Americans (3.8% of the workforce) were unemployed; by May that number had reached 20.5 million (13.0% of the US workforce), or a net loss of 14 million jobs in 3 months.4 Numbers have improved since May but have not rebounded to pre-pandemic levels.
Prior to the February shutdown, unemployment in the European Union had been at 6.4%5 – nearly the lowest for the past decade. Thanks to job retention programs, unemployment in the EU had climbed only to 7.8% in the wake of the COVID pandemic, but jobless numbers were not as strong in Spain (15.6%) and Greece (15.5%).6
Among the wide range of concerns, five key issues present the greatest long-term threats:
RecessionEven short-term obstacles to retirement savings have the potential to compound into a long-term problem. High unemployment means both retirement plan contributions and payroll taxes earmarked for public pensions are dramatically reduced. Adding to long-term challenges are the hardship plan withdrawals many have been forced to make just to stay above water.
Interest ratesRates have been at historic lows for 12+ years, but the global shutdown has forced even more cuts. Going forward, retirees will have to be resourceful in how they manage income needs, while pension managers will need to think creatively about how they will manage long-term liabilities.
Public debtPublic spending on stimulus and aid has been essential to keep the economy afloat, but it also compounds record public debt levels. In the future, debt will present policy makers with difficult decisions about how they address the needs of retirees.
Climate As demonstrated by recent Australian wildfires, climate-related natural disasters are becoming more severe and more frequent, and they are leaving vulnerable retirees exposed to higher levels of physical and financial risk.
Economic inequalityThe social justice movement has brought income inequality into focus. Whether the data is examined by race or gender, it demonstrates that a lifetime of lower earning potential adds up to a greater imbalance in retirement savings, funding, and income.
7Global Retirement Index 2020
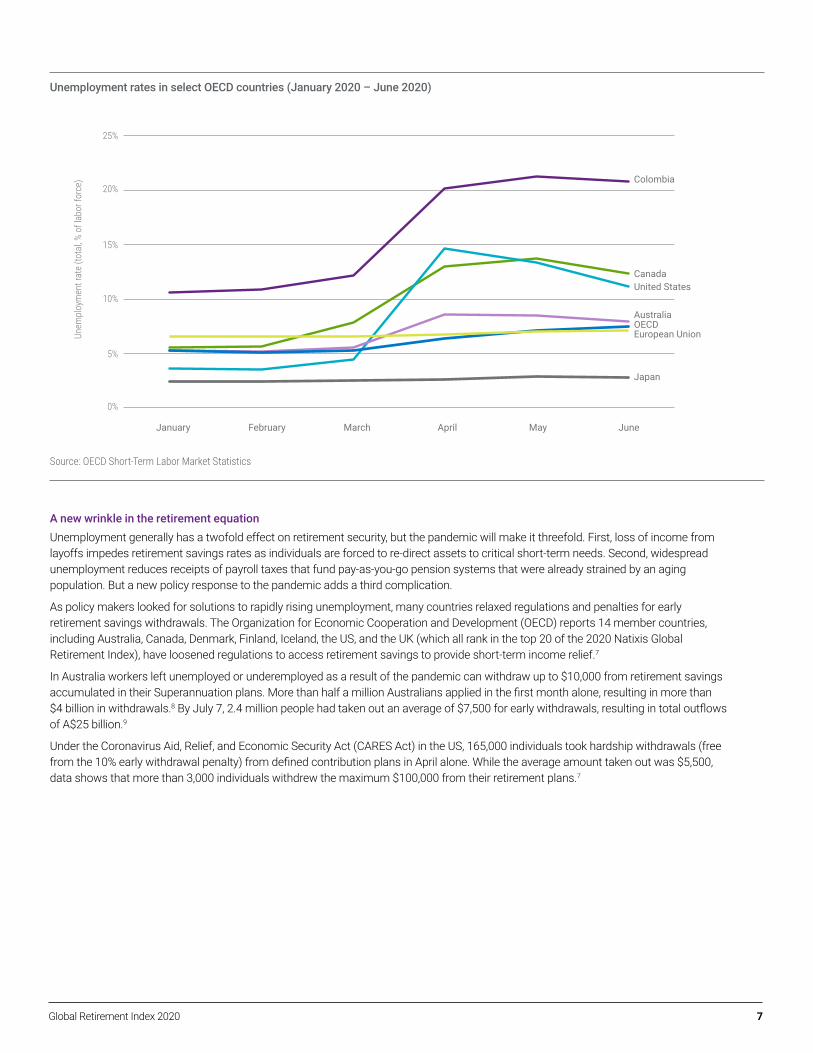
Source: OECD Short-Term Labor Market Statistics
Unemployment rates in select OECD countries (January 2020 – June 2020)
A new wrinkle in the retirement equationUnemployment generally has a twofold effect on retirement security, but the pandemic will make it threefold. First, loss of income from layoffs impedes retirement savings rates as individuals are forced to re-direct assets to critical short-term needs. Second, widespread unemployment reduces receipts of payroll taxes that fund pay-as-you-go pension systems that were already strained by an aging population. But a new policy response to the pandemic adds a third complication.
As policy makers looked for solutions to rapidly rising unemployment, many countries relaxed regulations and penalties for early retirement savings withdrawals. The Organization for Economic Cooperation and Development (OECD) reports 14 member countries, including Australia, Canada, Denmark, Finland, Iceland, the US, and the UK (which all rank in the top 20 of the 2020 Natixis Global Retirement Index), have loosened regulations to access retirement savings to provide short-term income relief.7
In Australia workers left unemployed or underemployed as a result of the pandemic can withdraw up to $10,000 from retirement savings accumulated in their Superannuation plans. More than half a million Australians applied in the first month alone, resulting in more than $4 billion in withdrawals.8 By July 7, 2.4 million people had taken out an average of $7,500 for early withdrawals, resulting in total outflows of A$25 billion.9
Under the Coronavirus Aid, Relief, and Economic Security Act (CARES Act) in the US, 165,000 individuals took hardship withdrawals (free from the 10% early withdrawal penalty) from defined contribution plans in April alone. While the average amount taken out was $5,500, data shows that more than 3,000 individuals withdrew the maximum $100,000 from their retirement plans.7
Colombia
OECDAustralia
European Union
Japan
CanadaUnited States
5%
0%
10%
15%
20%
25%
Unem
ploy
men
t rat
e (to
tal, %
of l
abor
forc
e)
January February March April May June
8Global Retirement Index 2020
Employers: Measure twice, cut onceRecession not only hurts personal contributions, but it can also impact employer participation in the savings equation. When companies look to cut costs in recessionary periods, many have cut matching contributions to defi ned contribution plans. While many times this is a temporary measure, some companies have turned the emergency response into standard operating procedure by not reinstating the benefi t once business improves.
Clearly companies have to manage expenses when faced with a dire economic picture. But it’s important to remember that over the long term a company match is a critical incentive for employee participation, shown in the results from the 2019 Natixis Survey of US Defi ned Contribution Plan Participants.10 If it is to be suspended, employers should also have a plan for reinstating the match, not just for the boost it gives employee accounts, but also for the impact it can have on participation rates, top heavy testing, and other key measures of plan compliance.
While the swiftness of hardship withdrawals offers solid commentary on personal savings and immediate fi nancial challenges presented by recession, it also foreshadows even more challenging long-term retirement issues. Money taken out of retirement plans today is not only taxed at a higher rate commensurate with previous working wages, but it also speaks to lost opportunity for those assets to grow over time.
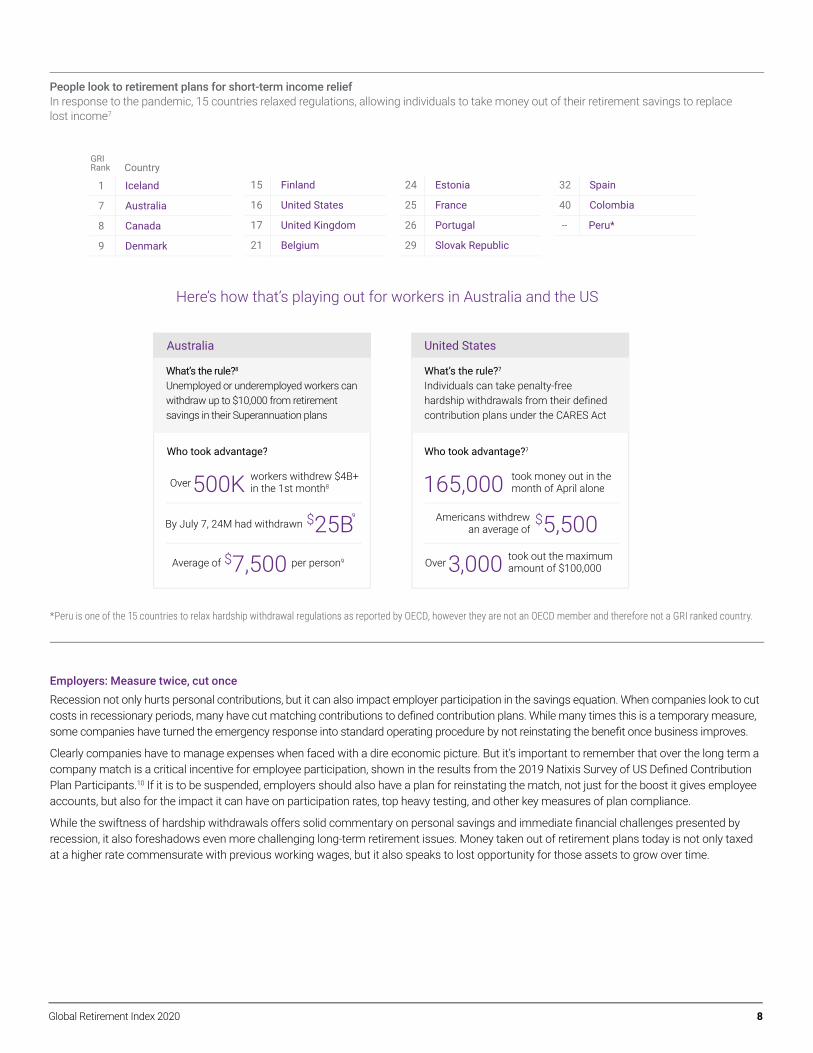
People look to retirement plans for short-term income reliefIn response to the pandemic, 15 countries relaxed regulations, allowing individuals to take money out of their retirement savings to replacelost income7
Here’s how that’s playing out for workers in Australia and the US
United StatesAustralia
What’s the rule?7
Individuals can take penalty-free hardship withdrawals from their defined contribution plans under the CARES Act
Who took advantage?7Who took advantage?
What’s the rule?8
Unemployed or underemployed workers can withdraw up to $10,000 from retirement savings in their Superannuation plans
165,000 took money out in the month of April alone
3,000 took out the maximum amount of $100,000Over
500K workers withdrew $4B+ in the 1st month8Over
$5,500Americans withdrew an average of
$25BBy July 7, 24M had withdrawn
$7,500Average of per person9
1 Iceland
7 Australia
8 Canada
9 Denmark
15 Finland
16 United States
17 United Kingdom
21 Belgium
24 Estonia
25 France
26 Portugal
29 Slovak Republic
32 Spain
40 Colombia
-- Peru*
GRIRank Country
9
*Peru is one of the 15 countries to relax hardship withdrawal regulations as reported by OECD, however they are not an OECD member and therefore not a GRI ranked country.

9Global Retirement Index 2020
When the world reemerges from the pandemic recession, it will be critical to examine the barriers and incentives to retirement savings. Policy makers and employers will need to redouble efforts to ensure workers have access to retirement savings plans and the incentives needed to boost both participation and contribution rates. Individuals will need to examine their retirement plans, their current savings balance and their savings rates to determine how they will overcome any shortfalls created by the recession and their plan for moving forward.
Interest rates: How low can they really go?When the economy is in crisis, interest rates are the go-to tool for central bankers looking to stimulate spending and get markets moving in the short term. But the cuts made in the throes of the 2008 Global Financial Crisis are largely still in place, leaving rates near historic lows for 12+ years. Faced with the pandemic recession, central bankers were forced to cut even more, implementing 173 cuts globally between January and July 2020.11 It all raises the stakes on retirement security for both individuals and pension managers.
Growth of $5,500 in the S&P 500 over the past 20 years On average, Americans took hardship withdrawals of $5,500 from their defi ned contribution plans under the CARES Act. That’s money that could have been working toward their retirement savings goal.7
$ Re
tirem
ent A
ccou
nt B
alan
ce
2000 2010 2015 20202005
$0
$50,000
$100,000
$150,000
$200,000
$250,000
$300,000
$5,500
$273,260
Performance data shown represents past performance and is no guarantee of, and not necessarily indicative of, future results.Source: Yahoo! Finance
The objective of retirement income planning is simple: Don’t outlive your assets.
From an individual perspective, low rates are generally good because it costs less to borrow money: Mortgages are more affordable, car loans have lower monthly payments, and small business loans are more attractive. But low rates make life diffi cult for retirees. After accumu-lating retirement assets over a lifetime, individuals fi nd the low-yield environment is a terrible time to annuitize their savings.
The objective of retirement income planning is simple: Do not outlive your assets. Low rates make a big challenge and the circumstances can be dire. If their portfolios cannot generate sustainable income, retirees are forced to take a larger share of principal in their distributions, depleting retirement savings faster. The problem is amplifi ed by ever-increasing 21St century lifespans. In the end, not only will retirees needto live on less income, but they will need to live longer on that lower income.

10Global Retirement Index 2020
Lower interest rates mean greater liabilities
Lower rates. Greater liabilities.The same combination of low rates and longer lifespans also puts pension managers at a disadvantage. Charged with providing an income to beneficiaries, pension managers are finding that low rates have increased liabilities substantially.
Essentially, in providing a pension, employers must put a value on the benefits they have promised to employees. Current interest rates are used to estimate the total amount they will need for future payouts. In simple terms, if rates are low today, the value of what they need to pay out in the future is greater.
People will have to dip into theirprincipal faster, so they’ll potentially
expend their pension assetsmore quickly — and may outlivetheir savings
What that means for individual retirees
But how much they can investin illiquid assets
regulations limitThey’ll need to close the funding gap with
private investments,infrastructure,and other illiquid assets
Pensions traditionally use fixed income securities to meet their obligations, but today’s
low-yielding bonds aren’t enough
Multiple pensioners are drawing payments,
with varying life expectancies
What that means for institutions
So, when rates are low, the valueof future payouts is greater
It’s counterintuitive, but when rates are low, pension liabilities increase substantially. That’s because current interest rates are used to estimate the amount of future payouts.
Traditionally, pensions shore up those obligations with bonds. But today’s low yielding bonds are not enough. Given that problem, institutions need to look past traditional fixed income securities to generate the yields they need. The Natixis Global Survey of Institutional Investors found that public and private pension managers are looking to private investments, infrastructure, and other illiquid assets12 to help close the funding gap. But it is not an easy proposition.
Liquidity requirements put in place after the 2008 Global Financial Crisis limit institutions’ ability to tap these higher yielding assets. While the regulations came with the good intention of ensuring that pensions would not collapse under the weight of black swan events, the unintended impact on retirement security may be that pensions could collapse under a long-term erosion of assets.
11Global Retirement Index 2020
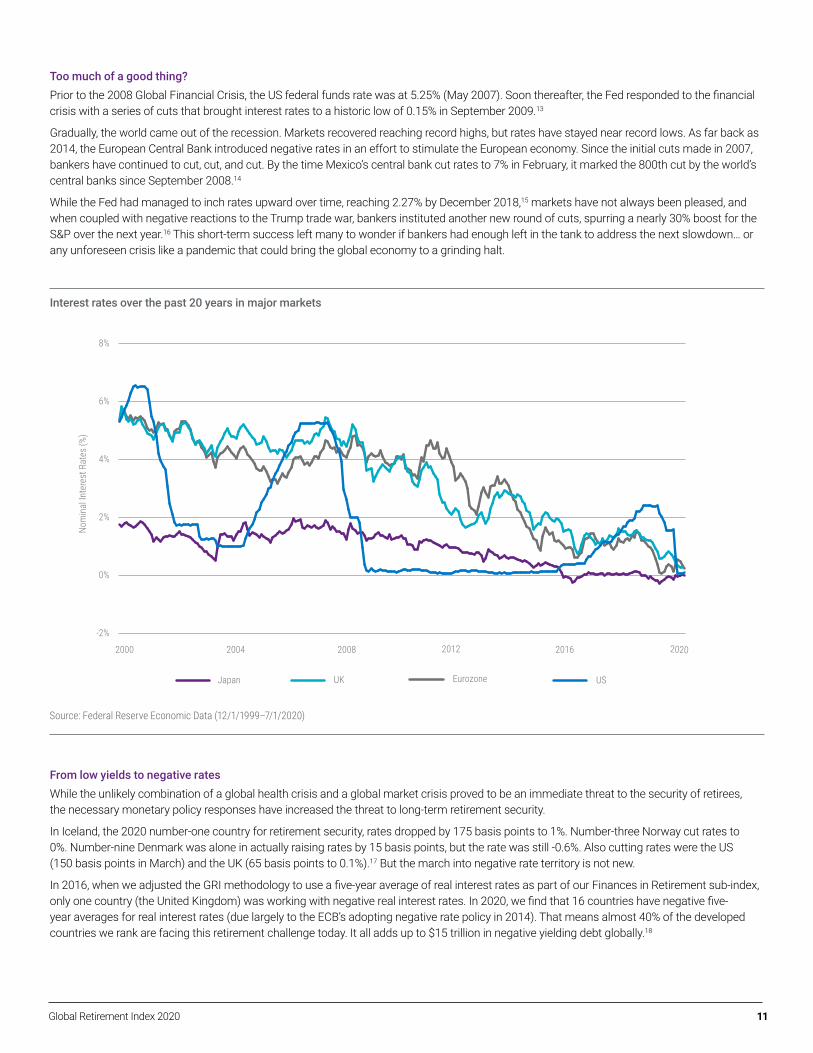
Too much of a good thing?Prior to the 2008 Global Financial Crisis, the US federal funds rate was at 5.25% (May 2007). Soon thereafter, the Fed responded to the financial crisis with a series of cuts that brought interest rates to a historic low of 0.15% in September 2009.13
Gradually, the world came out of the recession. Markets recovered reaching record highs, but rates have stayed near record lows. As far back as 2014, the European Central Bank introduced negative rates in an effort to stimulate the European economy. Since the initial cuts made in 2007, bankers have continued to cut, cut, and cut. By the time Mexico’s central bank cut rates to 7% in February, it marked the 800th cut by the world’s central banks since September 2008.14
While the Fed had managed to inch rates upward over time, reaching 2.27% by December 2018,15 markets have not always been pleased, and when coupled with negative reactions to the Trump trade war, bankers instituted another new round of cuts, spurring a nearly 30% boost for the S&P over the next year.16 This short-term success left many to wonder if bankers had enough left in the tank to address the next slowdown… or any unforeseen crisis like a pandemic that could bring the global economy to a grinding halt.
Interest rates over the past 20 years in major markets
Nom
inal
Inte
rest
Rat
es (%
)
Japan EurozoneUK US
-2%
0%
2%
4%
6%
8%
2000 2008 2012 2016 20202004
Source: Federal Reserve Economic Data (12/1/1999–7/1/2020)
From low yields to negative ratesWhile the unlikely combination of a global health crisis and a global market crisis proved to be an immediate threat to the security of retirees, the necessary monetary policy responses have increased the threat to long-term retirement security.
In Iceland, the 2020 number-one country for retirement security, rates dropped by 175 basis points to 1%. Number-three Norway cut rates to 0%. Number-nine Denmark was alone in actually raising rates by 15 basis points, but the rate was still -0.6%. Also cutting rates were the US (150 basis points in March) and the UK (65 basis points to 0.1%).17 But the march into negative rate territory is not new.
In 2016, when we adjusted the GRI methodology to use a five-year average of real interest rates as part of our Finances in Retirement sub-index, only one country (the United Kingdom) was working with negative real interest rates. In 2020, we find that 16 countries have negative five-year averages for real interest rates (due largely to the ECB’s adopting negative rate policy in 2014). That means almost 40% of the developed countries we rank are facing this retirement challenge today. It all adds up to $15 trillion in negative yielding debt globally.18

12Global Retirement Index 2020
In simple terms, retirement security was already under pressure from historically low rates. Not only has the pressure been increased, but it’s likely to be felt for many more years to come.
Public debt: The records keep piling upRate cuts aren’t the only pandemic policy call to pressure retirement security. While absolutely necessary in the short term, trillions in fi scaland monetary stimulus – and more still to come – will pose a long-term challenge.
It’s clear, the higher the debt level, the harder the choices for policy makers. In the future they will need to balance education, national security, and other expenditures with the costs of providing pensions, healthcare and long-term care benefi ts to retirees. The outcome of those debates cannot be projected today. Depending on the political winds, which party is in power, and other unforeseen crises, funding priorities will change. As a result, retirement security will be in fl ux for a long, long time.
Still in debt from the last crisisThe last crisis pushed public debt to record levels around the world. Japan, where policy makers have struggled to address economic stagnation for decades, faced a debt load equal to 237% of GDP in 2018 – the highest in the world. Debt was growing in Europe too: Greece (185% of GDP), Italy (135%), Portugal (120%), Belgium (102%), France (98%), and Spain (97%). In addition, the US stood at 107% while Canada (90%) and the UK (87%) also faced mounting public debt.19
Then came COVID-19. In March it was clear that the unprecedented global health crisis was likely to ignite a fi nancial crisis as the global economy came to a screeching halt. Governments around the world had to respond with unprecedented fi scal measures to support the shutdown needed to fl atten the curve on coronavirus infections.
The Center for Strategic and International Studies reports that as of March 26, government spending among G20 countries had reached$5 trillion for direct payments to individuals and limitless loans to struggling businesses, an amount equal to 7.4% of the G20 GDP.20
Timeline of countries going into negative real interest rate territoryGRI countries with a negative fi ve-year average for real interest rates
GRI countries with a 5 year average of negative interest rates
GRI 2020GRI 2018
Austria
Germany
Luxembourg
Netherlands
Norway
United Kingdom
GRI 2017
Austria
Luxembourg
United Kingdom
GRI 2016
United Kingdom
Austria
Belgium
Denmark
Finland
France
Germany
Hungary
Japan
Latvia
Lithuania
Luxembourg
Netherlands
Norway
Slovak Republic
Sweden
United Kingdom
1 3 6 7 16
GRI 2019
Austria
Belgium
Germany
Luxembourg
Netherlands
United Kingdom
Norway
Source: CoreData Research; interest rate scores in the respective GRI editions

13Global Retirement Index 2020
Pre-Pandemic Debt to GDP23
COVID Spending as of August 202017
COVID Spending as % of GDP17
Canada 90% $317 billion CAD 5%
France 98% €135 billion 6%
Germany 62% €286 Billion IMF 8.8%
Italy 132% €55 billion 3.5%
Japan 235% ¥117.1 trillion 21%
United States 104% $2.8 trillion 11%
United Kingdom 87% $86 billion 3.9%
COVID Spending pushes public debt to new highs
Six months later, the $12 trillion fiscal and monetary response appears to have worked in the short term. But COVID-19 will have dramatic long-term consequences. The United Nations expects the pandemic to result in an $8.5 trillion loss of economic output over the next two years, essentially wiping out the gains made over the past four years. All told, the UN projects a -5% loss in GDP in developed countries for 2020 and only modest 3.4% growth in 2021.21
Debt to GDP ratios are set to surpass those of World War II.
Debt to GDP ratios are set to surpass those of World War II. For example, by 2021, government debt in Italy is expected to reach 152% of GDP and the US is expected to reach 125%. Portugal, Spain and France are all likely to end up above 110%. Germany, one of the countries that has spent the most to support its economy as a percentage of GDP, is only projected to reach 72% debt to GDP.22
COVID stimulus pushes public debt to new highs
New record debt levels do not necessarily pose significant risk today. Interest rates are low and will stay that way for a long time. As a result, debt servicing costs are low, much lower than they were during the Euro debt crisis that began in 2009. Central banks are keeping servicing costs level to ensure that countries like Italy, which was among the hardest hit by the pandemic, have no problem paying for their debt. While the yield on Italian debt reached a high of 7.06% during the last crisis, it stands below 1.5% today.24
Over the long term, though, public debt could become a greater concern. The same interest rates that make debt servicing levels manageable now could tempt policy makers to further increase spending as they look to finance future initiatives, adding further to debt levels and tightening the squeeze on retirement benefits.
Climate: A risk to health and wealthThe financial and social risks to retirement security in 2020 are clear, but there is another substantial risk that may not be as obvious: climate change and the environment. First and foremost are the effects that these issues have on the health and wellbeing of the elderly. Second are the potential financial costs that climate-related disasters present to retirees.
On the health side of the equation, the experience with COVID-19 shows just how vulnerable elderly populations are. According to the Centers for Disease Control, age is a key determinant in the severity of illness brought on by the coronavirus. Data shows that people in their 60s and 70s are at higher risk for severe illness than those in their 50s. In fact, the CDC reports that the highest risk population are those over age 85.25
The risks presented by the pandemic have been clear, but the elderly are also among the most susceptible to other environmental health risks. For example, the World Health Organization lists air pollution as the world’s top environmental health risk.26 In 2014, WHO reported approximately 7 million premature deaths linked to indoor and outdoor air pollution,27 and by 2060, it estimates that air pollution alone will cause 6 to 9 million premature deaths annually worldwide at a cost of 1% of GDP worldwide.28
14Global Retirement Index 2020
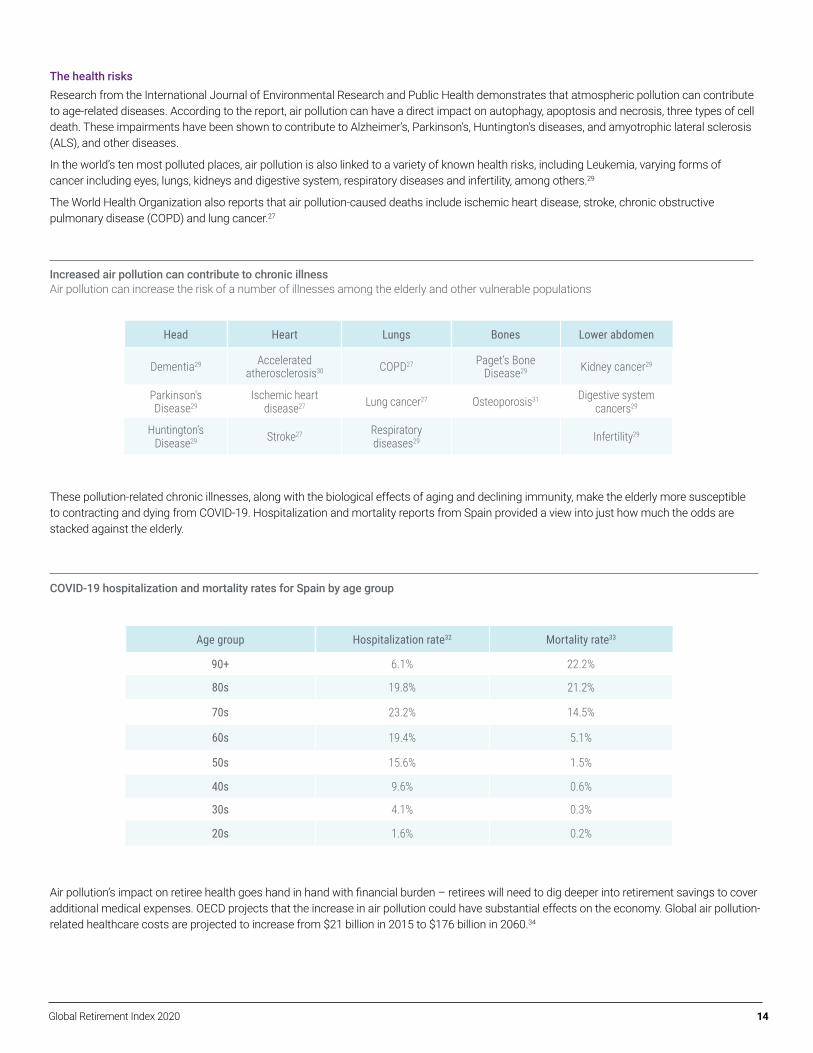
The health risksResearch from the International Journal of Environmental Research and Public Health demonstrates that atmospheric pollution can contribute to age-related diseases. According to the report, air pollution can have a direct impact on autophagy, apoptosis and necrosis, three types of cell death. These impairments have been shown to contribute to Alzheimer’s, Parkinson’s, Huntington's diseases, and amyotrophic lateral sclerosis (ALS), and other diseases.
In the world’s ten most polluted places, air pollution is also linked to a variety of known health risks, including Leukemia, varying forms of cancer including eyes, lungs, kidneys and digestive system, respiratory diseases and infertility, among others.29
The World Health Organization also reports that air pollution-caused deaths include ischemic heart disease, stroke, chronic obstructive pulmonary disease (COPD) and lung cancer.27
Increased air pollution can contribute to chronic illness Air pollution can increase the risk of a number of illnesses among the elderly and other vulnerable populations
These pollution-related chronic illnesses, along with the biological effects of aging and declining immunity, make the elderly more susceptible to contracting and dying from COVID-19. Hospitalization and mortality reports from Spain provided a view into just how much the odds are stacked against the elderly.
Age group Hospitalization rate32 Mortality rate33
90+ 6.1% 22.2%
80s 19.8% 21.2%
70s 23.2% 14.5%
60s 19.4% 5.1%
50s 15.6% 1.5%
40s 9.6% 0.6%
30s 4.1% 0.3%
20s 1.6% 0.2%
Air pollution’s impact on retiree health goes hand in hand with financial burden – retirees will need to dig deeper into retirement savings to cover additional medical expenses. OECD projects that the increase in air pollution could have substantial effects on the economy. Global air pollution-related healthcare costs are projected to increase from $21 billion in 2015 to $176 billion in 2060.34
Head Heart Lungs Bones Lower abdomen
Dementia29 Accelerated atherosclerosis30 COPD27 Paget’s Bone
Disease29 Kidney cancer29
Parkinson's Disease29
Ischemic heart disease27 Lung cancer27 Osteoporosis31 Digestive system
cancers29
Huntington’s Disease29 Stroke27 Respiratory
diseases29 Infertility29
COVID-19 hospitalization and mortality rates for Spain by age group

15Global Retirement Index 2020
The financial risk pictureThe health concerns for retirees are clear, but climate also adds up to real financial risk for retirees. Hurricanes, blizzards, wildfires, and other events leave a wide trail of destruction. Whether it’s the direct costs for rebuilding or higher insurance premiums, retirees living on a fixed income have limited options for addressing the added financial pressure.
A cursory look at the news during hurricane season may demonstrate that weather events are getting more frequent and severe, but the National Oceanic and Atmospheric Administration confirms that we are seeing more weather- and climate-related disaster than ever before. NOAA reports that since 1980 there have been 273 weather events that caused $1 billion or more in damages, ringing up a total bill of $1.8 trillion.35
While the 40-year average is six events per year, 2018 brought 14 events resulting in $1 billion in damages or more. The tab for two tropical cyclones, eight severe storms, two winter storms, drought, and wildfires added up to $91 billion, making it the fourth most expensive year on record.35
The climate pressure is not limited to the US. German insurer Munich Re reports that climate-related disasters were responsible for $150 billion in damages worldwide in 2019, of which only one-third ($52 billion) were insured.36 Adding to the tab are the nearly $100 billion in direct damages caused by the Australian Mega Fire.37
Event Country Damage Insured
Typhoon Hagibis38 Japan $17 B $10 B
Cyclone Idai38 Mozambique $2.3 B ~ $0
Typhoon Faxai38 Japan $9 B $7 B
Typhoon Lekima39 China, Japan, Taiwan, Malaysia $8.1 B $0.84 B
Asia felt the brunt of the effects of climate-related storm damage Three of the four largest events landed in the region
Beyond insurance issues, there are other climate-related risks that can impact the bottom line for retirees. For example, climate events can stress the global food supply, leading to higher costs when retirees will have a fixed income that for most is substantially lower than their working income.
Housing costs can also be stressed by climate change. A house is often the single largest asset in a family's holdings. Those with homes located in flood zones or areas exposed to wildfires and other hazards often experience decreased property values. Not only may the values drop, but homeowners are likely to find they have higher maintenance costs and higher insurance premiums.
Climate and environment may not be top of mind for many considering retirement security, but they can present significant risks to the health and financial wellbeing of retirees. The global pandemic presents a grim reminder of just how vulnerable the elderly are.
Income inequality: Made even less equal by retirementOne of the key issues to be raised in 2020 came not out of the coronavirus, but out of the global social justice movement sparked by the death of George Floyd. This wave of protest for racial justice, coupled with the movement for global action on gender equality, highlights just how far-reaching the challenge of global retirement security really is.
The economic divide associated with gender and racial inequality is amplified in retirement, particularly in a world where policy makers and employers have shifted the responsibility for retirement funding onto the shoulders of individuals. As a result, not only is there a pay gap that impedes retirement savings, there is also a critical gap in access to workplace-based retirement savings plans.
Facing the gender gapIt stands to reason that if an individual is denied equal access to income opportunities in their working years, then the gap will continue, and will likely widen in retirement. The World Economic Forum 2017 Gender Gap Report estimates that the gender pay gap is so wide today that it will take 257 years to completely remove gender disparity globally.40
OECD estimates that the average gender pay gap in the developed world is 14%.41 But that gap widens dramatically in retirement. For example, they report that women’s retirement account balances are on average 25% lower than men's42 and in the European Union, women over age 65 received a pension that was on average 30% lower than that of men.43

16Global Retirement Index 2020
Gender wage and pension gap across OECD countries W
age
and
pens
ion
gap
in O
ECD
coun
tries
(%)
Estonia
Slovak Republic
Denmark
Czech Republic
HungaryLatvia
Lithuania
Iceland Slovenia
PolandFinland
NorwayOECD
BelgiumIreland
SwedenGreece
Portugal
Switzerland
SpainItaly
France
United KingdomAustria
Netherlands
Luxembourg
Germany
Gender Wage Gap Gender Pension Gap
46
16
433
42
1415
16
10
6
1215 15
57 6
4
14 18
7 9
5
12 13
21
1515
28
5
9
3935
33 32 32 32 3128 28 28 26 25 23 22 20
18 1816 15 14
128
2
8
Sources: OECD (2019), "The gender pension gap is large", in Pensions at a Glance 2019: OECD and G20 Indicators, OECD Publishing, Paris, https://doi.org/10.1787/e1302ec1-en. | OECD (2020), Gender wage gap (indicator). doi: 10.1787/7cee77aa-en (Accessed on 15 September 2020).
The problem is compounded by one key demographic truth: Women generally live longer than men. It is estimated that after age 65, women will live an average of 3.6 years longer than men.44 And because women live longer, that means they are living longer alone. In fact, Eurostats reports that in 2017 the share of elderly women living alone in the EU was 40%, compared to 22% of men.45
In 2017 the share of elderly women living alone in the EU was 40%, compared to 22% of men.
In the end the gender gap presents a stark reality as exemplified by today’s OECD population, where OECD finds that poverty rates for elderly women (15.7%) are 52% higher than that of elderly men (10.3%).46 And women age 75 plus are more likely than men to face severe difficulties in paying for basic services.45
The picture isn’t any brighter in the United States. US Census data shows that on average, women in the US make only 82% of what men do ($45,000 vs. $55,000).47 And race widens the gap, putting women of color at a greater disadvantage. On average:
• Black women make only 62% of what White men do48
• Hispanic women make 54%48
• Native Hawaiian and Pacific Islander Women make 61%49 • American Indian and Native Alaskan women make 57%48
• Asian women make 90%48
Analysis from the American Association of University Women shows that the pay gap continues long after working years and retired women face a large income gap. Overall, total retirement income for women is 70% of the income that men have – Social Security benefits are 80.2% of men’s, and pension income for women is 76% of what men receive. AAUW also reports that historically, women have not saved as much for retirement. They spend a shorter time in the workforce (75%) and are twice as likely to work part time.50
Recognizing the race gapBeyond gender, there is a wide retirement security gap for people of color. The Washington-based National Institute on Retirement Security report on Race and Retirement Security (2013) finds that workers of color are significantly less likely to be covered by an employer retirement plan.
In fact, only 54% of Black and Asian employees (age 24–65) and 38% of Latino employees are covered by an employer-sponsored retirement plan. This compares to 62% of White employees. And while 24% of White households are covered by a pension, only 16% of households of color are covered.51

17Global Retirement Index 2020
Income disparity naturally adds up to a retirement security gap. Research from the National Institute on Retirement Security shows that households of color are far less likely to have dedicated retirement savings than White households of the same age. It’s found that 62% of Black households and 69% of Latino households have no retirement savings vs. 37% of White households. Three out of four Black households and four out of five Latino households have less than $10,000 in retirement savings.51
In the UK, the Office for National Statistics has found similar examples of inequality. For example, data shows that White households in the UK have incomes 63% higher than Black households and reports that the gap has actually widened in the past two years. ONS data shows that after accounting for benefits and taxes, White households had an average income that was 9% higher than Asian households and 18% higher than Black households.52
A report from the People’s Pension revealed just how wide that gap can become in retirement. Its data shows that minority ethnic women will receive a total pension that is 51% less than an average White male will receive. Overall it is estimated that on average minority ethnic pensioners were 24% worse off than their peers.53
Further, the pension organization, which has more than 5 million members in the UK, reports a gap of 26.9% for Black, African, Caribbean, and Black British individuals and 30.35% for Asian (Chinese, Indian, Bangladeshi, Pakistani, other Asian) individuals.53
Whether it’s the US, UK, or elsewhere, the central problem to inequality in retirement is lifelong income inequality. Not only can a lower income add up to less opportunity to save for retirement and lower balances, but it also means that individuals are going to receive lower benefit payments from state pay-as-you-go pensions.
Case Study: In the United States, there’s a wide retirement security gap for people of color Lifelong income inequality adds up to inequality in retirement
Latino households4 out of 5
Black households3 out of 4
The majority of those who do have retirement savings have set aside less than $10,000
of White households
37%of Black households
62%of Latino households
69%
Many people of color have no retirement savings at all
of White employees of Black and Asianemployees
of White households of households of color
of Latino employees
16%24%
Covered by a pension
38%54%62%
Covered by an employer-sponsored retirement plan
In the US, they’re significantly less likely to be covered by an employer-sponsored retirement plan
Source: Nari Rhee, PhD, Race and Retirement Insecurity in the United States, National Institute on Retirement Security, December 2013, https://www.nirsonline.org/reports/race-and-retirement-insecurity-in-the-united-states/
18Global Retirement Index 2020
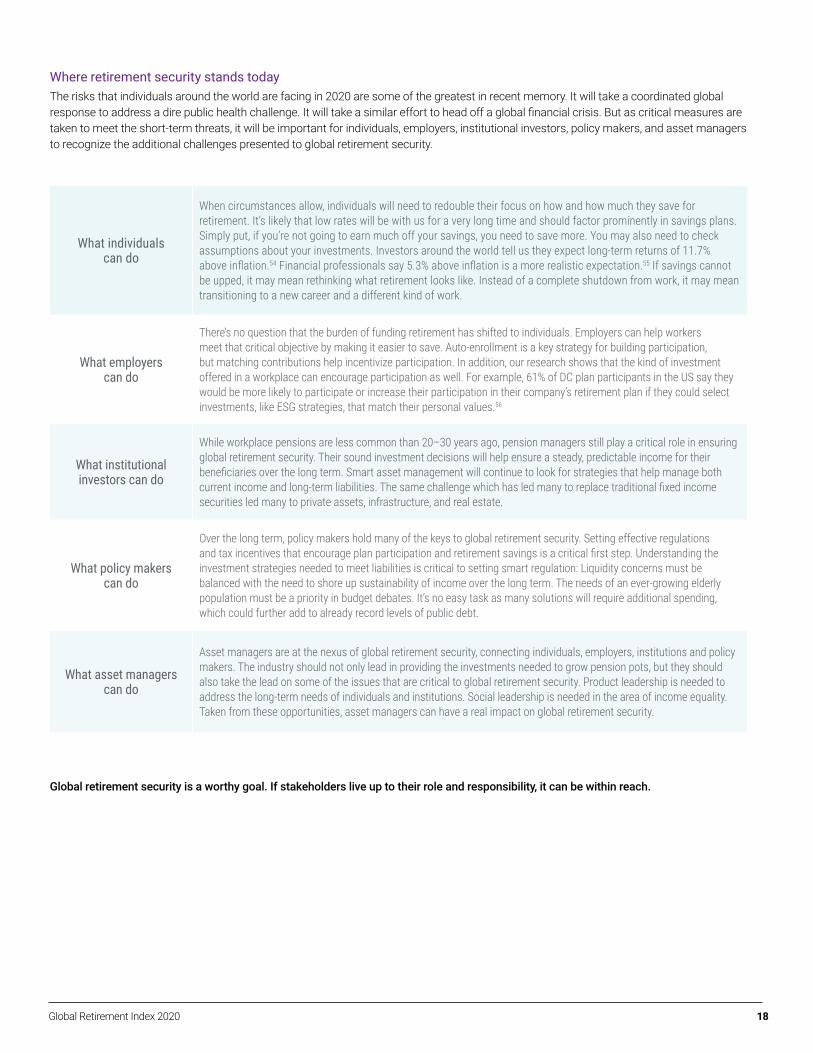
Where retirement security stands todayThe risks that individuals around the world are facing in 2020 are some of the greatest in recent memory. It will take a coordinated global response to address a dire public health challenge. It will take a similar effort to head off a global financial crisis. But as critical measures are taken to meet the short-term threats, it will be important for individuals, employers, institutional investors, policy makers, and asset managers to recognize the additional challenges presented to global retirement security.
What individuals can do
When circumstances allow, individuals will need to redouble their focus on how and how much they save for retirement. It’s likely that low rates will be with us for a very long time and should factor prominently in savings plans. Simply put, if you’re not going to earn much off your savings, you need to save more. You may also need to check assumptions about your investments. Investors around the world tell us they expect long-term returns of 11.7% above inflation.54 Financial professionals say 5.3% above inflation is a more realistic expectation.55 If savings cannot be upped, it may mean rethinking what retirement looks like. Instead of a complete shutdown from work, it may mean transitioning to a new career and a different kind of work.
What employers can do
There’s no question that the burden of funding retirement has shifted to individuals. Employers can help workers meet that critical objective by making it easier to save. Auto-enrollment is a key strategy for building participation, but matching contributions help incentivize participation. In addition, our research shows that the kind of investment offered in a workplace can encourage participation as well. For example, 61% of DC plan participants in the US say they would be more likely to participate or increase their participation in their company’s retirement plan if they could select investments, like ESG strategies, that match their personal values.56
What institutional investors can do
While workplace pensions are less common than 20–30 years ago, pension managers still play a critical role in ensuring global retirement security. Their sound investment decisions will help ensure a steady, predictable income for their beneficiaries over the long term. Smart asset management will continue to look for strategies that help manage both current income and long-term liabilities. The same challenge which has led many to replace traditional fixed income securities led many to private assets, infrastructure, and real estate.
What policy makers can do
Over the long term, policy makers hold many of the keys to global retirement security. Setting effective regulations and tax incentives that encourage plan participation and retirement savings is a critical first step. Understanding the investment strategies needed to meet liabilities is critical to setting smart regulation: Liquidity concerns must be balanced with the need to shore up sustainability of income over the long term. The needs of an ever-growing elderly population must be a priority in budget debates. It’s no easy task as many solutions will require additional spending, which could further add to already record levels of public debt.
What asset managers can do
Asset managers are at the nexus of global retirement security, connecting individuals, employers, institutions and policy makers. The industry should not only lead in providing the investments needed to grow pension pots, but they should also take the lead on some of the issues that are critical to global retirement security. Product leadership is needed to address the long-term needs of individuals and institutions. Social leadership is needed in the area of income equality. Taken from these opportunities, asset managers can have a real impact on global retirement security.
Global retirement security is a worthy goal. If stakeholders live up to their role and responsibility, it can be within reach.

19Global Retirement Index 2020
References
1 Global Survey of Institutional Investors conducted by CoreData Research in October and November 2019. Survey included 500 institutional investors in 29 countries.
2 Ayhan Kose and Noataka Sugawara, World Economic Forum, World Bank: COVID-19 recession is expected to be twice as bad as the 2009 financial crisis, June 18, 2020. https://www.weforum.org/agenda/2020/06/coronavirus-covid19-economic-recession-global-compared
3 Gita Gopinath, International Monetary Fund Blog, The Great Lockdown: Worst Economic Downturn Since the Great Depression, April 14, 2020. https://blogs.imf.org/2020/04/14/the-great-lockdown-worst-economic-downturn-since-the-great-depression/
4 Rakesh Kochhar, Pew Research, Unemployment rose higher in three months of COVID-19 than it did in two years of the Great Recession, June 11, 2020. https://www.pewresearch.org/fact-tank/2020/06/11/unemployment-rose-higher-in-three-months-of-covid-19-than-it-did-in-two-years-of-the-great-recession/
5 H. Pelcher, Statista, Unemployment rate in the European Union and the Euro area from June 2019 to June 2020 (Eurostat) https://www.statista.com/statistics/264887/monthly-unemployment-rate-in-the-eu-and-euro-area/
6 H. Pelcher, Statista, Unemployment rate in EU countries July 2020 (Eurostat) https://www.statista.com/statistics/268830/unemployment-rate-in-eu-countries/
7 Dhara Singh, Coronavirus cash crunch leading to more Americans withdrawing from 401k accounts, Copyright 2020 by Yahoo! Money Used with permission; Retirement Savings in the Time of COVID, Copyright 2020 by OECD.
8 Kemp, Daniel. To be able to copy & paste content to share with others please contact us at [email protected] to upgrade your subscription to the appropriate license, Agri Investor, April 24, 2020. https://www.agriinvestor.com/first-wave-of-superannuation-withdrawals-in-australia-amounts-to-a4-4bn/
9 Michael Janda, (Michael Janda) and Australian Broadcasting Corporation, https://www.abc.net.au/news/2020-07-07/coronavirus-superannuation-early-withdrawal-scheme-hits-$25b/12429318
10 Natixis Investment Managers, Survey of US Defined Contribution Plan Participants conducted by CoreData Research, January and February 2019. Survey included 1,000 US workers, 700 being plan participants and 300 being non-participants.
11 Source: Natixis PRCG
12 Natixis Investment Managers, Global Survey of Institutional Investors conducted by CoreData Research in October and November 2019. Survey included 500 institutional investors in 29 countries.
13 Federal Funds Rate – 62 Year Historical Chart. https://www.macrotrends.net/2015/fed-funds-rate-historical-chart
14 Dion Rabouin, Axios, Central banks have cut interest rates 800 times since the Great Recession. https://www.axios.com/central-banks-interest-rate-cuts-great-recession-35ddfceb-41ad-4819-9e0b-fb89fb449d4d.html
15 Board of Governors of the Federal Reserve System (US), Effective Federal Funds Rate [FEDFUNDS], retrieved from FRED, Federal Reserve Bank of St. Louis; https://fred.stlouisfed.org/series/FEDFUNDS, August 31, 2020.
16 Morningstar. https://www.morningstar.com/indexes/spi/spx/performance
17 International Monetary Fund, POLICY RESPONSES TO COVID-19. Updated August 28, 2020. https://www.imf.org/en/Topics/imf-and-covid19/Policy-Responses-to-COVID-19
18 John Ainger and Tasos Vossos, Bloomberg, World’s Rising Stock of Sub-Zero Debt Has Investors Adding Risk, July 27, 2020. https://www.bloomberg.com/news/articles/2020-07-27/world-s-stock-of-negative-yield-debt-climbs-toward-2019-s-record
19 International Monetary Fund, General Government Debt 20 Percent of GDP as of 2018. https://www.imf.org/external/datamapper/GG_DEBT_GDP@GDD/SWE
20 Center for Strategic Insight & International Studies, Breaking down the G20 Covid-19 Fiscal Response, April 30, 2020. https://www.csis.org/analysis/breaking-down-g20-covid- 19-fiscal-response
21 United Nations News, Coronavirus ‘grim reality’: World economy to shrink by 3.2 per cent, new UN report projects, May 13, 2020. https://news.un.org/en/story/2020/05/1064032
22 TradingEconomics.com referencing National Statistics, EUROSTAT, and World Bank data
23 Gramlich, John, Coronavirus downturn likely to add to high government debt in some countries, Pew Research, April 29, 2020. https://www.pewresearch.org/fact-tank/2020/04/29/coronavirus-downturn-likely-to-add-to-high-government-debt-in-some-countries/
24 Organization for Economic Co-operation and Development, Long-Term Government Bond Yields: 10-year: Main (Including Benchmark) for Italy [IRLTLT01ITM156N], retrieved from FRED, Federal Reserve Bank of St. Louis; https://fred.stlouisfed.org/series/IRLTLT01ITM156N, August 31, 2020.
25 Center for Disease Control and Prevention, Coronavirus Disease 2019: Older Adults, August 16, 2020. https://www.cdc.gov/coronavirus/2019-ncov/need-extra-precautions/older-adults.html
26 McCarthy, N. (November 21, 2018). Air Pollution Is The Greatest Human Health Risk. Retrieved September 25, 2020, from https://www.statista.com/chart/16154/average-life-expectancy-lost-per-person-worldwide/
27 World Health Organization, 7 million premature deaths annually linked to air pollution, News release https://www.who.int/mediacentre/news/releases/2014/air-pollution/en/
28 OECD (2016), (Environment Directorate), https://www.oecd.org/env/air-pollution-to-cause-6-9-million-premature-deaths-and-cost-1-gdp-by-2060.htm.
29 Numan, M. S., Brown, J. P., & Michou, L. (2015). Impact of air pollutants on oxidative stress in common autophagy-mediated aging diseases. International journal of environmental research and public health, 12(2), 2289–2305. https://doi.org/10.3390/ijerph120202289
30 Kaufman J. D. (2010). Does air pollution accelerate progression of atherosclerosis?, Journal of the American College of Cardiology, 56(22), 1809–1811. https://doi.org/10.1016/j.jacc.2010.05.054
31 Barcelona Institute for Global Health, Air Pollution Can Worsen Bone Health, 3/1/2020.
32 Fernando Forte, Statista, Percentage distribution of people hospitalized due to complications from coronavirus (COVID-19) in Spain as of April 29, 2020, by age group (Ministry of Health, Social Services and Equality). https://www.statista.com/statistics/1106425/covid-19-mortality-rate-by-age-group-in-spain-march/
33 Fernando Forte, Statista, COVID-19 mortality rate by age group in Spain May 2020 (Ministry of Health, Social Services and Equality). https://www.statista.com/statistics/1105596/covid-19-mortality-rate-by-age-group-in-spain-march/
34 OECD, The economic consequences of outdoor air pollution, June 2016. http://www.oecd.org/environment/indicators-modelling-outlooks/Policy-Highlights-Economic-consequences-of-outdoor-air-pollution-web.pdf

20Global Retirement Index 2020
35 NOAA National Centers for Environmental Information (NCEI) U.S. Billion-Dollar Weather and Climate Disasters (2020). https://www.ncdc.noaa.gov/billions/, DOI: 10.25921/ stkw-7w73
36 Petra Löw, Munich RE NatCatSERVICE, Tropical cyclones cause highest losses Natural disasters of 2019 in figures. https://www.munichre.com/topics-online/en/climate-change-and-natural-disasters/natural-disasters/natural-disasters-of-2019-in-figures-tropical-cyclones-cause-highest-losses.html
37 Paul Read and Richard Denniss, news.com.au, With costs approaching $100 billion, the bushfires are Australia’s costliest natural disaster. https://www.news.com.au/finance/economy/australian-economy/with-costs-approaching-100-billion-the-bushfires-are-australias-costliest-natural-disaster/news-story/3c5fd4f7dabacc896cecd0167095d4b8
38 Munich RE NatCatSERVICE, Tropical cyclones causing billions in losses dominate nat cat picture of 2019, August 1, 2020. https://www.munichre.com/en/company/media-relations/media-information-and-corporate-news/media-information/2020/causing-billions-in-losses-dominate-nat-cat-picture-2019.html?WT.tsrc=[Facebook]&WT.mc_id=2019NaturalDisasterPressRelease#-1295112364
39 Munich RE NatCatSERVICE, 2019. https://www.munichre.com/content/dam/munichre/global/content-pieces/documents/media-relations/2019-nat-cat-world-map.pdf/_jcr_content/renditions/original./2019-nat-cat-world-map.pdf
40 Armstrong, M. (December 17, 2019). The Long Road to Gender Equality [Digital image]. Retrieved September 21, 2020, from https://www.statista.com/chart/11667/the-long-road-to-gender-equality/
41 OECD (2020), Gender wage gap (indicator). doi: 10.1787/7cee77aa-en (Accessed on 15 September 2020).
42 OECD (2019), "The gender pension gap is large", in Pensions at a Glance 2019: OECD and G20 Indicators, OECD Publishing, Paris, https://doi.org/10.1787/e1302ec1-en.
43 Eurostat, © European Union, https://ec.europa.eu/eurostat/web/products-eurostat-news/-/DDN-20200207-1. Responsibility for the adaptation lies entirely with Natixis Investment Managers
44 OECD (2020), Life expectancy at 65 (indicator). doi: 10.1787/0e9a3f00-en (Accessed on 31 August 2020)
45 Eurostat, Ageing Europe - statistics on housing and living conditions, May-June 2019. https://ec.europa.eu/eurostat/statistics-explained/index.php?title=Ageing_Europe_- statistics_on_ housing_and_li living_conditions
46 OECD (2019), Pensions at a Glance 2019: OECD and G20 Indicators, OECD Publishing, Paris, https://doi.org/10.1787/b6d3dcfc-en.
47 Jessica Semega, Melissa Kollar, John Creamer, and Abinash Mohanty, US Census, Income and Poverty in the United States: 2018, September 10, 2019, https://www.census.gov/library/publications/2019/demo/p60-266.html
48 Robin Bleiweis, Center for American Progress, Quick Facts About the Gender Wage Gap, March 24, 2020. https://www.americanprogress.org/issues/women/reports/2020/03/24/482141/quick-facts-gender-wage-gap/
49 Jasmine Tucker, National Women’s Law Center, Equal Pay for Asian American and Pacific Islander Women, January 2020. https://nwlc-ciw49tixgw5lbab.stackpathdns.com/wp-content/uploads/2019/03/AAPI-EPD-1.30.2020.pdf
50 AAUW, Women & Retirement. https://www.aauw.org/issues/equity/retirement/
51 Nari Rhee, PhD, Race and Retirement Insecurity in the United States, National Institute on Retirement Security, December 2013, https://www.nirsonline.org/reports/race-and-retirement-insecurity-in-the-united-states/
52 UK Office for National Statistics, Press Release, Effects of taxes and benefits on UK household income: financial year ending 2019, Released June 23, 2020. https://www.ons.gov.uk/peoplepopulationandcommunity/personalandhouseholdfinances/incomeandwealth/bulletins/theeffectsoftaxesandbenefitsonhouseholdincome/financialyearending2019
53 The People’s Pension (UK), Measuring the ethnicity pensions gap, https://thepeoplespension.co.uk/info/wp-content/uploads/sites/3/2020/01/Measuring-the-ethnicity-pensions-gap.pdf p.3, 5
54 Natixis Investment Managers, Global Survey of Individual Investors conducted by CoreData Research, February-March 2019. Survey included 9,100 investors from 25 countries.
55 Natixis Investment Managers, Global Survey of Financial Professionals conducted by CoreData Research in March and April 2020. Survey included 2,700 financial professionals throughout 16 countries.
56 Natixis Investment Managers, Survey of US Defined Contribution Plan Participants conducted by CoreData Research, January and February 2019. Survey included 1,000 US workers, 700 being plan participants and 300 being non-participants.

Global Retirement Index 2020 21
North America has the highest overall regional score. Western Europe, ranking second overall, finishes first or second in all sub-indices except Finances, where it ranks fifth. While Asia Pacific finishes no higher than fourth across most sub-indices, these countries as a region have the second highest score for the Finances sub-index.
151413121110
98765
1st
2nd3rd
2019
2020
2019
2020
24th 29th
74%
11th10th9th8th7th6th5th4th3rd2nd1st
91%
73%85%64%72%71%
88% 89% 80%
North America Asia PacificWestern Europe
69%85%62%78%56%
31%31%32%22%65%
Norway has the highest scores for both the Health and Material Wellbeing sub-indices, while Singapore ranks first in the Finances sub-index and Finland finishes first in Quality of Life.
Netherlands and Germany had the largest climb in the overall rankings, moving from tenth to fifth and 13th to tenth respectively.
The Nordic countries in general perform relatively well across all sub-indices except Finances. For example, all finish in the top ten for Quality of Life but only Iceland finishes in the top ten for Finances.
The BRIC countries score particularly well in the Finances sub-index, having a higher score than Western Europe, Latin America and Eastern Europe, but finish near the bottom in the other sub-indices.
Sweden drops seven spots to 11th overall this year. It ranks fourth for Quality of Life and seventh for Health but moves from 15th to 17th in Material Wellbeing and from 22nd to 30thin Finances.
Iceland, Switzerland and Norway remain in the top three with the same rankings as last year.
Estonia, ranked 24th, replaces Slovak Republic (29th) in the top 25 overall this year. All other countries from the top 25 last year remain in the top 25 this year.
Key Findings
Global Retirement Index 2020 22
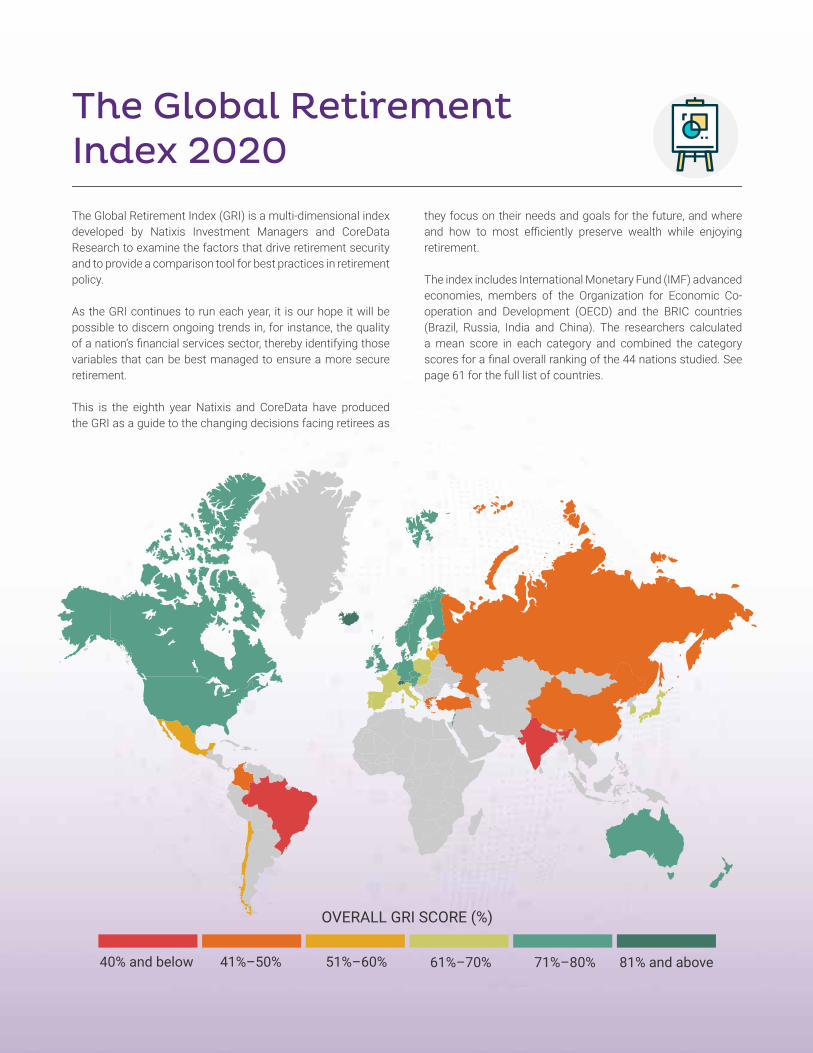
The Global Retirement Index (GRI) is a multi-dimensional index developed by Natixis Investment Managers and CoreData Research to examine the factors that drive retirement security and to provide a comparison tool for best practices in retirement policy.
As the GRI continues to run each year, it is our hope it will be possible to discern ongoing trends in, for instance, the quality of a nation’s fi nancial services sector, thereby identifying those variables that can be best managed to ensure a more secure retirement.
This is the eighth year Natixis and CoreData have produced the GRI as a guide to the changing decisions facing retirees as
The Global RetirementIndex 2020
they focus on their needs and goals for the future, and where and how to most effi ciently preserve wealth while enjoying retirement.
The index includes International Monetary Fund (IMF) advanced economies, members of the Organization for Economic Co-operation and Development (OECD) and the BRIC countries (Brazil, Russia, India and China). The researchers calculated a mean score in each category and combined the category scores for a fi nal overall ranking of the 44 nations studied. See page 61 for the full list of countries.
81% and above41%–50%40% and below 51%–60% 61%–70% 71%–80%
OVERALL GRI SCORE (%)

Global Retirement Index 2020 23
Framework
The index incorporates 18 performance indicators, grouped into four thematic sub-indices, which have been calculated on the basis of reliable data from a range of international organizations and academic sources. It takes into account the particular characteristics of the older demographic retiree group in order to assess and compare the level of retirement security in different countries around the world.
The four thematic indices cover key aspects for welfare in retirement: the material means to live comfortably in retirement;
access to quality fi nancial services to help preserve savings value and maximize income; access to quality health services; and a clean and safe environment.
The sub-indices provide insight into which particular characteristics are driving an improvement or worsening each country’s position. Data has been tracked consistently to provide a basis for year-over-year comparison.
The construction of the Quality of Life sub-index in the 2020 GRI has been slightly updated to refl ect changes in the data sources. In particular, three indicators – Air Quality, Biodiversity and Habitat, and Water and Sanitation – and the way they are measured are different compared to last year.
For Air Quality, the average annual concentration of PM2.5 has been replaced with the number of years lost due to exposure to PM2.5, exposure to indoor air pollution has been replaced with number of years lost due to exposure to household air pollution, and the percentage of a country’s population exposed to annual concentrations of PM2.5 with number of years lost due to exposure to ground-level ozone pollution. The Water and Sanitation indicator has been updated with a new data source and new defi nitions – unsafe drinking water compared to access to improved water source and unsafe sanitation compared to improved sanitation facilities in previous years. The data for Biodiversity is relatively similar to last year except for the addition of a new indicator called the Biodiversity Habitat Index.
Since the 2020 GRI scores with these updates would no longer be comparable to 2019 GRI scores, we calculated 2019 scores with the updated data and methodology. As such, the 2018 and 2019 scores and rankings in this year’s GRI report show what the scores would have been with these new calculations and may not necessarily be the same as published in last year’s report.
Methodology Update
Health
Life ExpectancyHealth Expenditure per Capita
Non-Insured Health Expenditure
Old-Age DependencyBank Non-Performing Loans
Infl ationInterest RatesTax PressureGovernance
Government Indebtedness
Finances in Retirement
Income EqualityIncome per Capita
Unemployment
Material Wellbeing Quality of LifeHappinessAir Quality
Water and SanitationBiodiversity and HabitatEnvironmental Factors

Global Retirement Index 2020 24
The Best Performers
TOP 10Countriesin 2020GRI
84%
74%
83%
76%
80%
75%
76%
76%
76%
77%
83%
74%
82%
76%
80%
76%
77%
76%
76%
76%
82%
74%
82%
74%
80%
75%
79%
76%
77%
77%
1. Iceland
10. Germany
2. Switzerland
9. Denmark
3. Norway
8. Canada
4. Ireland
7. Australia
6. New Zealand
5. Netherlands
2
2
1
0
0
0
0
0
0
0
1
1
5
0
0
0
0
0
2
3
Iceland remains in fi rst place with a slightly lower score than it had in 2019, down from 83% to 82%, placing it marginally ahead of Switzerland.
Below them, Norway is in third place with the same score, 80%, as it achieved in 2019, while Ireland has 79% this year, compared to 77%
in 2019, moving up one spot to fourth place.
Most of the countries in the top ten have the same rankings as they did last year. New Zealand, Australia, Canada
and Denmark remain the same at sixth through ninth. However, there is some movement into and out of the
top ten for a few of the other countries.
Sweden, fourth in 2019, falls to 11th this year after its score fell from 77% to 74%, while the Netherlands climbs from tenth to fi fth, with a score of 77% this year and 76% in 2019. Meanwhile, Germany moves up three spots to tenth overall.
Iceland features in the top ten for all four sub- indices: second for material wellbeing, sixth for quality of life, ninth for health and tenth for fi nances. Switzerland also places in the top ten in each sub-index, with fourth place in fi nances, fi fth in quality of life, sixth in health and ninth in material wellbeing. In the Material Wellbeing Sub-Index, Iceland scores 87%, a big margin over Switzerland in ninth place with 75%.
Norway does very well in three of the sub-indices, for health, material wellbeing and quality of life,
being fi rst, fi rst and second respectively. However, its hopes of a higher spot in the GRI are dashed by
its 24th place in the Finances in Retirement Sub-Index, where it performs badly on the indicators for interest
rates, infl ation and tax pressure.
Ireland is more consistent throughout, as it ranks fourth in health, eighth in fi nances and 11th for both quality of life
and material wellbeing. Given its upward trend in the GRI from 2017 to 2019, Ireland could rise even higher in the future if it can
maintain its consistency and improve here and there.
2 3
1
Ranking change201820192020
Global Retirement Index 2020 25
The two Antipodean countries in the GRI top ten, New Zealand and Australia, are second and third in the Finances in Retirement Sub-Index, while New Zealand is also eighth for quality of life. Both also represent the value of consistency, as they are both in the top ten for the fourth year in succession.
Being consistent across all four sub-indices is difficult when a high score in one sub-index could make it hard to do well in another sub-index. For example, life expectancy is an indicator for the Health Sub-Index, but countries which do well here, such as Japan and Switzerland, first and second for life expectancy, will tend to have a higher proportion of older people in the population. This means that they are likely to lag on the old- age dependency indicator, which is part of the Finances in Retirement Sub-Index. In this case, Japan is 44th for the old-age dependency indicator and Switzerland is 23rd. As it happens, the top ten for the Finances in Retirement Sub-Index includes several countries, Singapore, Chile, the Republic of Korea and Estonia, which do not score highly in the other sub-indices.
Germany, Austria and Czech Republic are geographically close, and in the GRI they are placed relatively close together in tenth, 12th and 14th places. One reason for this is that all three are in the top ten for the Material Wellbeing Sub-Index. Income equality is one of the indicators for material wellbeing, and Czech Republic and Austria do well on this. Austria and Germany do reasonably well on the income per capita indicator here, while the Czech Republic and Germany are first and fourth on the employment indicator within the Material Wellbeing Sub-Index.
Sweden and Finland are 11th and 15th in the GRI but fail to join their Nordic neighbors in the top ten due to poorer performances in the Material Wellbeing and Finances in Retirement Sub-Indices. In particular, low scores on unemployment count against them in the Material Wellbeing Sub-Index. And in the Finances in Retirement Sub-Index, Sweden is 30th and Finland is 31st, due to very low scores on tax pressure and old-age dependency.
A number of countries appear in the top ten in only one of the four sub-indices and are in the top 25 countries on the GRI. Luxembourg, which is 13th in the GRI, is third in the Health Sub-Index. France is fifth in the Health Sub-Index but is only 25th overall, largely due to 42nd place in the Finances in Retirement Sub-Index, where it does badly on the indicators for old-age dependency, tax pressures and government indebtedness. Slovenia is sixth for material wellbeing and 19th overall, while the UK is seventh in the Quality of Life Sub-Index and 17th overall.
The United States and several other countries do relatively well on the GRI without being among the leaders in any sub-index. In the case of the U.S., this is because it scores badly on at least one indicator on three of the sub-indices. For example, on life expectancy, the U.S. is 32nd with 78.54 years, which brings down its score in the Health Sub-Index, despite scoring very highly on healthcare expenditure. And on material wellbeing, the U.S. suffers from poor performance on income equality, and on finances in retirement, it scores poorly on government indebtedness.
Global Retirement Index 2020 26
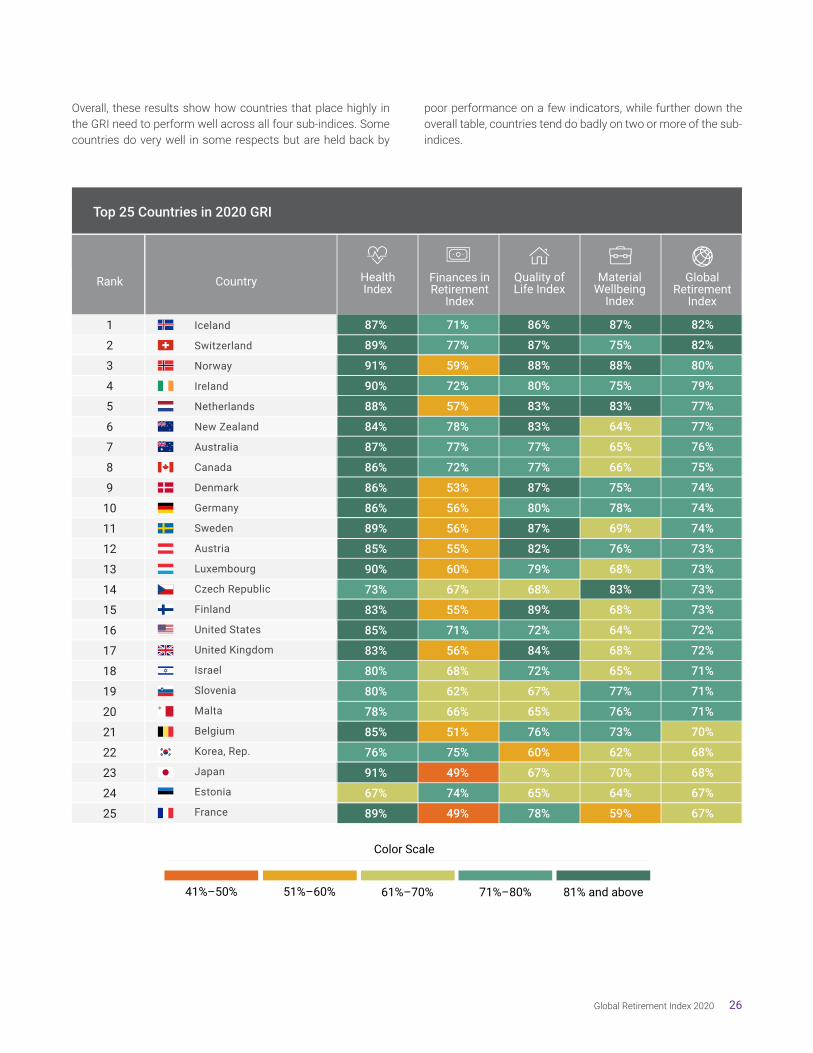
Overall, these results show how countries that place highly in the GRI need to perform well across all four sub-indices. Some countries do very well in some respects but are held back by
poor performance on a few indicators, while further down the overall table, countries tend do badly on two or more of the sub-indices.
Iceland
Switzerland
Norway
Ireland
Netherlands
New Zealand
Australia
Canada
Denmark
Germany
Sweden
Austria
Luxembourg
Czech Republic
Finland
United States
United Kingdom
Israel
Slovenia
Malta
Belgium
Korea, Rep.
Japan
Estonia
France
1
2
3
4
5
6
7
8
9
10
11
12
13
14
15
16
17
18
19
20
21
22
23
24
25
87%
89%
91%
90%
88%
84%
87%
86%
86%
86%
89%
85%
90%
73%
83%
85%
83%
80%
80%
78%
85%
76%
91%
67%
89%
71%
77%
59%
72%
57%
78%
77%
72%
53%
56%
56%
55%
60%
67%
55%
71%
56%
68%
62%
66%
51%
75%
49%
74%
49%
86%
87%
88%
80%
83%
83%
77%
77%
87%
80%
87%
82%
79%
68%
89%
72%
84%
72%
67%
65%
76%
60%
67%
65%
78%
87%
75%
88%
75%
83%
64%
65%
66%
75%
78%
69%
76%
68%
83%
68%
64%
68%
65%
77%
76%
73%
62%
70%
64%
59%
82%
82%
80%
79%
77%
77%
76%
75%
74%
74%
74%
73%
73%
73%
73%
72%
72%
71%
71%
71%
70%
68%
68%
67%
67%
Top 25 Countries in 2020 GRI
CountryRank HealthIndex
Finances inRetirement
Index
MaterialWellbeing
Index
GlobalRetirement
Index
Quality ofLife Index
81% and above41%–50% 51%–60% 61%–70% 71%–80%
Color Scale
Global Retirement Index 2020 27
Regional Perspective
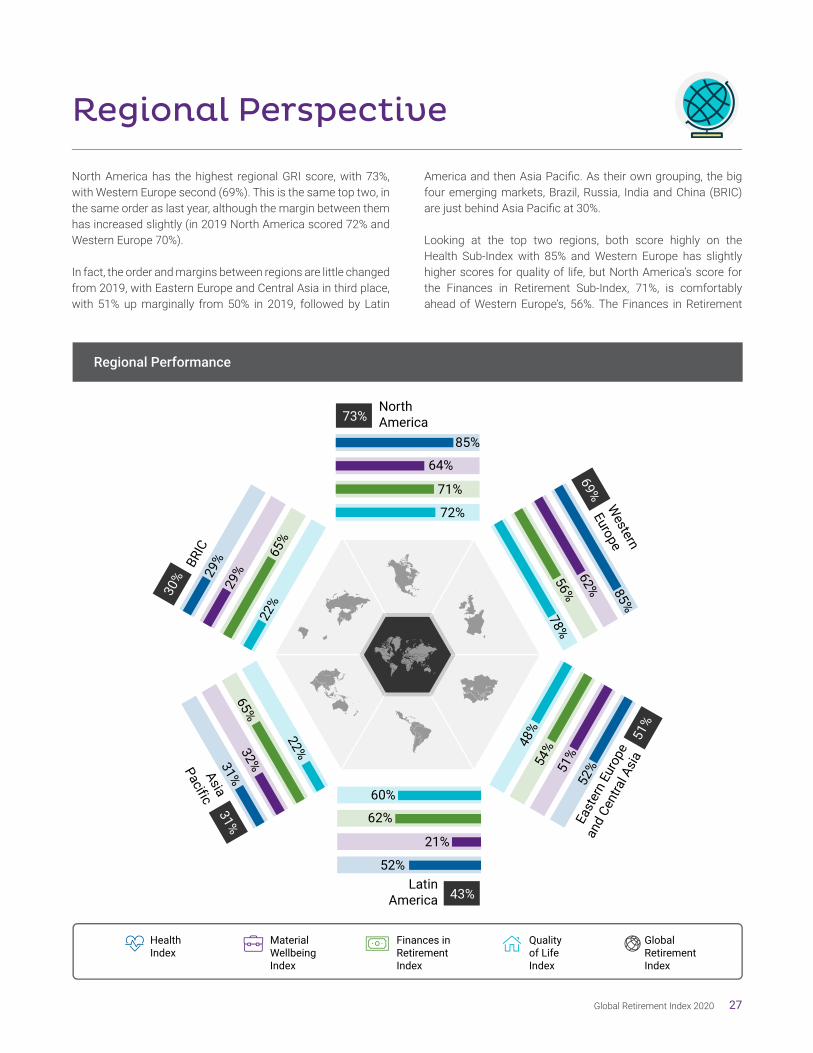
North America has the highest regional GRI score, with 73%, with Western Europe second (69%). This is the same top two, in the same order as last year, although the margin between them has increased slightly (in 2019 North America scored 72% and Western Europe 70%).
In fact, the order and margins between regions are little changed from 2019, with Eastern Europe and Central Asia in third place, with 51% up marginally from 50% in 2019, followed by Latin
America and then Asia Pacifi c. As their own grouping, the big four emerging markets, Brazil, Russia, India and China (BRIC) are just behind Asia Pacifi c at 30%.
Looking at the top two regions, both score highly on the Health Sub-Index with 85% and Western Europe has slightly higher scores for quality of life, but North America’s score for the Finances in Retirement Sub-Index, 71%, is comfortably ahead of Western Europe’s, 56%. The Finances in Retirement
MaterialWellbeingIndex
Qualityof LifeIndex
GlobalRetirementIndex
HealthIndex
Finances inRetirementIndex
NorthAmerica73%
85%
64%
72%
71%
LatinAmerica 43%
60%
62%
52%
21%
Western
Europe
69%
85%
62%
78%56%
East
ern
Euro
pe
and
Cent
ral A
sia51
%
52%51
%
48%
54%
Asia
Pacific31%
22%
65%
31%32%
BRIC
30% 29
%29
%
22%
65%
Regional Performance

Global Retirement Index 2020 28
Sub-Index is one area where countries in Western Europe do not perform strongly, compared to the other sub-indices, as their demographic profiles, with an aging population in many cases, often mean they score badly on the old-age dependency indicator. Some European countries also do poorly on the tax pressure and government indebtedness indicators, among other measures. In contrast, Canada is ninth on the finances in retirement indicators, while the U.S. is a respectable 11th.
On the Finances in Retirement Sub-Index, Eastern Europe and Central Asia (54%) is only just behind Western Europe (56%), but lags further behind on the other sub-indices. While some countries here, such as the Czech Republic (14th overall and third for material wellbeing), Israel (18th overall) and Slovenia (19th overall and sixth for material wellbeing), fare well in the overall GRI, others, such as Russia (38th) and Turkey (42nd), are closer to the bottom. There is also a Baltic split between Estonia, which has risen to 24th in the overall GRI, and Lithuania and Latvia, which are 35th and 36th respectively in the GRI.
Latin America (62%) outscores both Western Europe and Eastern Europe and Central Asia on the Finances in Retirement Sub-Index, and it also comfortably beats the latter region on the Quality of Life Sub-Index (60% versus 48%). However, it also records the lowest score of any region, 21%, for material wellbeing. This is due to Brazil, which is bottom of the class on the income equality indicator and close to the bottom for the income per capita and unemployment indicators. As the regional scores are population-weighted, this brings down the overall material wellbeing score for Latin America, which in turn negatively impacts its regional GRI score.
Asia Pacific also scores very highly on finances in retirement with 65%, second only to North America. This is not surprising, as Singapore, New Zealand and Australia make up the top three here and South Korea is sixth. However, the region has relatively low scores in the other three sub-indices. The issue here is that the world’s two largest countries by population, China and India, do not perform particularly well in health, quality of life and material wellbeing, and this brings the overall results for the region in these categories down.
The BRIC region (Brazil, Russia, India and China) has a very good score, 65%, for the Finances in Retirement Sub-Index but, for the reasons explained above, does badly on the other sub-indices. All of the BRIC countries are in the bottom part of the GRI overall, with Brazil 43rd and India 44th. All have low life expectancy and low health expenditure in the Health Sub-Index, and mixed results elsewhere, leading to a low overall score.

Global Retirement Index 2020 29
Year-on-Year TrendsThe Top 25:
The top three overall countries have maintained their placement for three years running. Iceland tops the overall rankings this year, followed by Switzerland and Norway.
Ireland has consolidated its recent rise in the overall GRI, from seventh in 2018 to fi fth in 2019 to fourth this year. Netherlands also consolidates its place in the top fi ve, from tenth in 2019 to fi fth in 2020.
Below the top fi ve, there is some movement. Netherlands climbs up fi ve places into the top ten at fi fth. The Czech
Republic is another country moving upwards, from 15th to 14th, but Sweden is heading in the opposite direction, dropping sharply from fourth in 2019 to 11th this year. While Sweden, which was also fourth overall in 2018, is fourth for quality of life and seventh for health, it fell from from 15th to 17th on material wellbeing and from 22nd to 30th on fi nances in retirement, where it fares poorly on indicators such as old-age dependency and tax pressure.
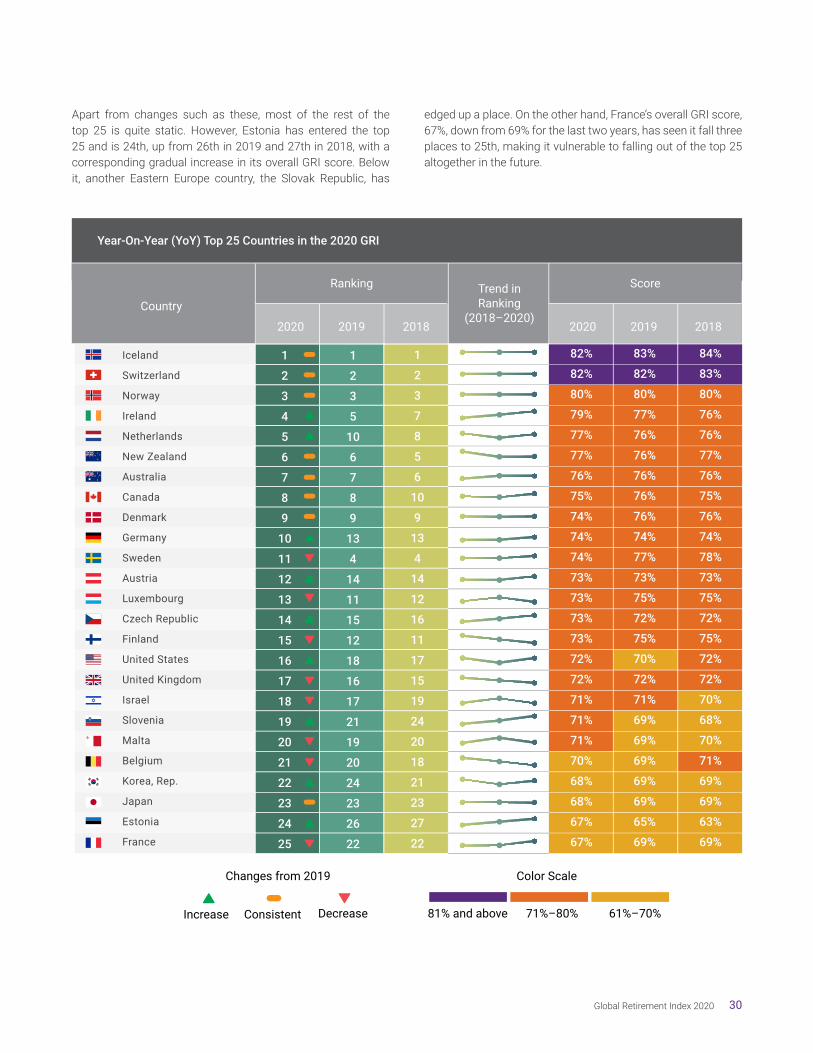
Global Retirement Index 2020 30
Apart from changes such as these, most of the rest of the top 25 is quite static. However, Estonia has entered the top 25 and is 24th, up from 26th in 2019 and 27th in 2018, with a corresponding gradual increase in its overall GRI score. Below it, another Eastern Europe country, the Slovak Republic, has
edged up a place. On the other hand, France’s overall GRI score, 67%, down from 69% for the last two years, has seen it fall three places to 25th, making it vulnerable to falling out of the top 25 altogether in the future.
Year-On-Year (YoY) Top 25 Countries in the 2020 GRI
81% and above 61%–70%71%–80%
Ranking
CountryTrend inRanking
(2018–2020)
Score
20192020 2018 20192020 2018
82%
82%
80%
79%
77%
77%
76%
75%
74%
74%
74%
73%
73%
73%
73%
72%
72%
71%
71%
71%
70%
68%
68%
67%
67%
83%
82%
80%
77%
76%
76%
76%
76%
76%
74%
77%
73%
75%
72%
75%
70%
72%
71%
69%
69%
69%
69%
69%
65%
69%
84%
83%
80%
76%
76%
77%
76%
75%
76%
74%
78%
73%
75%
72%
75%
72%
72%
70%
68%
70%
71%
69%
69%
63%
69%
1
2
3
5
10
6
7
8
9
13
4
14
11
15
12
18
16
17
21
19
20
24
23
26
22
1
2
3
7
8
5
6
10
9
13
4
14
12
16
11
17
15
19
24
20
18
21
23
27
22
1
2
3
4
5
6
7
8
9
10
11
12
13
14
15
16
17
18
19
20
21
22
23
24
25
Color Scale
Increase Consistent Decrease
Changes from 2019
Iceland
Switzerland
Norway
Ireland
Netherlands
New Zealand
Australia
Canada
Denmark
Germany
Sweden
Austria
Luxembourg
Czech Republic
Finland
United States
United Kingdom
Israel
Slovenia
Malta
Belgium
Korea, Rep.
Japan
Estonia
France

Performanceby Sub-IndexThe Performance by Sub-Index section analyzes GRI performance on an indicator-by-indicator basis. Focusing on sub-index performance highlights the strengths of some countries’ indicators and illuminates good practices for certain countries while highlighting needed areas of improvement for others.
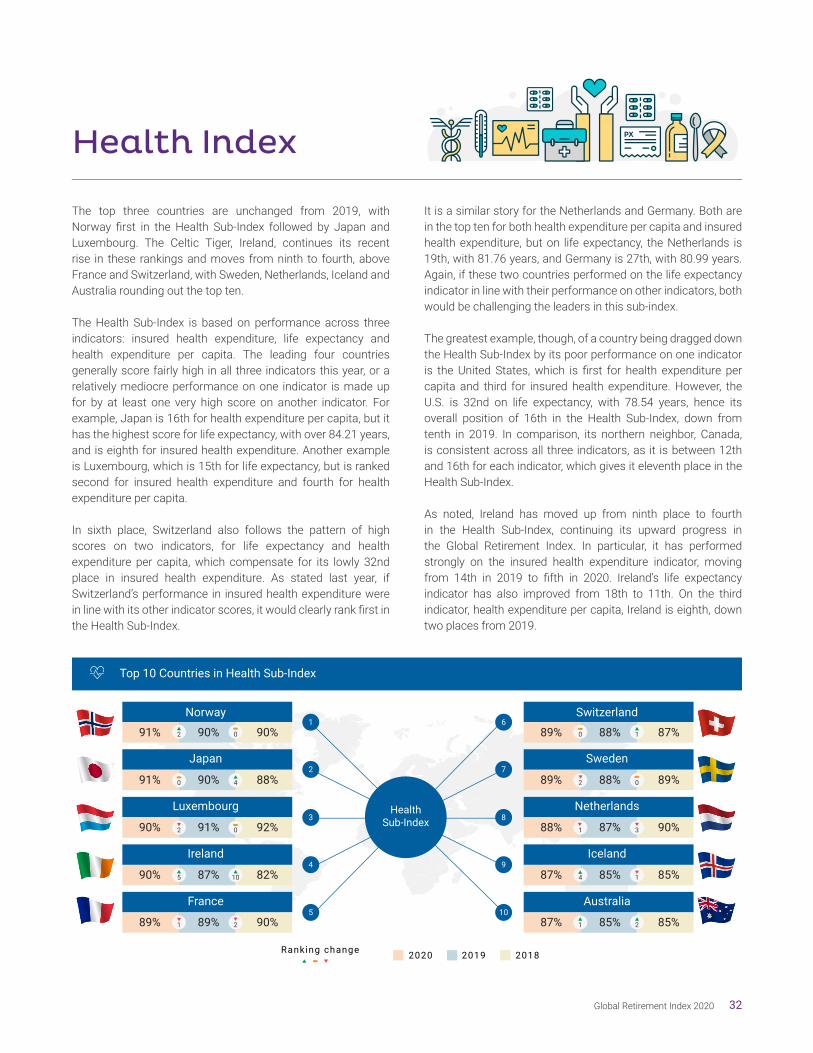
Global Retirement Index 2020 32
HealthSub-Index
Norway
Japan
Luxembourg
Ireland
France
1
2
3
4
5
6
7
8
9
10
91%
91%
90%
90%
89%
90%
90%
91%
87%
89%
90%
88%
92%
82%
90%
Switzerland
Sweden
Netherlands
Iceland
Australia
89%
89%
88%
87%
87%
88%
88%
87%
85%
85%
87%
89%
90%
85%
85%
Ranking change 2020 2019 2018
2 0
0 4
2 0
5 10
1 2
0 1
2
1 3
4 1
1 2
Top 10 Countries in Health Sub-Index
0
Health Index
The top three countries are unchanged from 2019, with Norway fi rst in the Health Sub-Index followed by Japan and Luxembourg. The Celtic Tiger, Ireland, continues its recent rise in these rankings and moves from ninth to fourth, above France and Switzerland, with Sweden, Netherlands, Iceland and Australia rounding out the top ten.
The Health Sub-Index is based on performance across three indicators: insured health expenditure, life expectancy and health expenditure per capita. The leading four countries generally score fairly high in all three indicators this year, or a relatively mediocre performance on one indicator is made up for by at least one very high score on another indicator. For example, Japan is 16th for health expenditure per capita, but it has the highest score for life expectancy, with over 84.21 years, and is eighth for insured health expenditure. Another example is Luxembourg, which is 15th for life expectancy, but is ranked second for insured health expenditure and fourth for health expenditure per capita.
In sixth place, Switzerland also follows the pattern of high scores on two indicators, for life expectancy and health expenditure per capita, which compensate for its lowly 32nd place in insured health expenditure. As stated last year, if Switzerland’s performance in insured health expenditure were in line with its other indicator scores, it would clearly rank fi rst in the Health Sub-Index.
It is a similar story for the Netherlands and Germany. Both are in the top ten for both health expenditure per capita and insured health expenditure, but on life expectancy, the Netherlands is 19th, with 81.76 years, and Germany is 27th, with 80.99 years. Again, if these two countries performed on the life expectancy indicator in line with their performance on other indicators, both would be challenging the leaders in this sub-index.
The greatest example, though, of a country being dragged down the Health Sub-Index by its poor performance on one indicator is the United States, which is fi rst for health expenditure per capita and third for insured health expenditure. However, the U.S. is 32nd on life expectancy, with 78.54 years, hence its overall position of 16th in the Health Sub-Index, down from tenth in 2019. In comparison, its northern neighbor, Canada, is consistent across all three indicators, as it is between 12th and 16th for each indicator, which gives it eleventh place in the Health Sub-Index.
As noted, Ireland has moved up from ninth place to fourth in the Health Sub-Index, continuing its upward progress in the Global Retirement Index. In particular, it has performed strongly on the insured health expenditure indicator, moving from 14th in 2019 to fi fth in 2020. Ireland’s life expectancy indicator has also improved from 18th to 11th. On the third indicator, health expenditure per capita, Ireland is eighth, down two places from 2019.
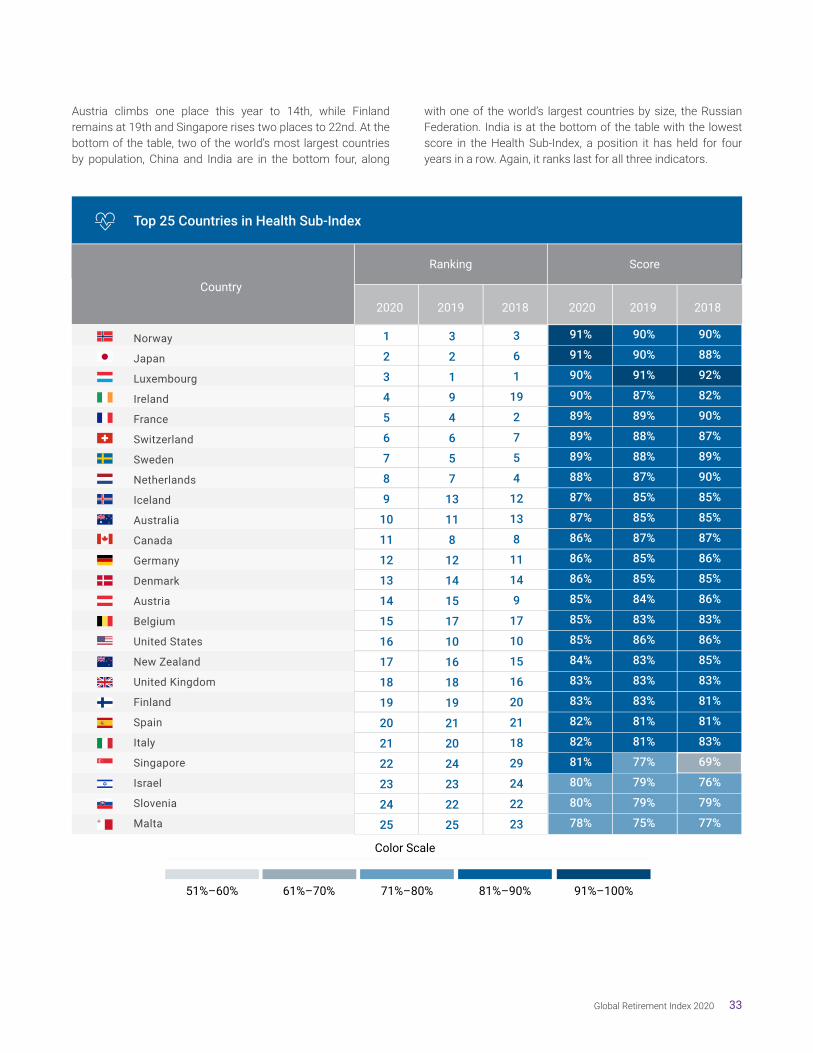
Global Retirement Index 2020 33
Austria climbs one place this year to 14th, while Finland remains at 19th and Singapore rises two places to 22nd. At the bottom of the table, two of the world’s most largest countries by population, China and India are in the bottom four, along
with one of the world’s largest countries by size, the Russian Federation. India is at the bottom of the table with the lowest score in the Health Sub-Index, a position it has held for four years in a row. Again, it ranks last for all three indicators.
Top 25 Countries in Health Sub-Index
Norway
Japan
Luxembourg
Ireland
France
Switzerland
Sweden
Netherlands
Iceland
Australia
Canada
Germany
Denmark
Austria
Belgium
United States
New Zealand
United Kingdom
Finland
Spain
Italy
Singapore
Israel
Slovenia
Malta
Ranking
Country
Score
20192020 2018 20192020 2018
91%
91%
90%
90%
89%
89%
89%
88%
87%
87%
86%
86%
86%
85%
85%
85%
84%
83%
83%
82%
82%
81%
80%
80%
78%
90%
90%
91%
87%
89%
88%
88%
87%
85%
85%
87%
85%
85%
84%
83%
86%
83%
83%
83%
81%
81%
77%
79%
79%
75%
90%
88%
92%
82%
90%
87%
89%
90%
85%
85%
87%
86%
85%
86%
83%
86%
85%
83%
81%
81%
83%
69%
76%
79%
77%
3
2
1
9
4
6
5
7
13
11
8
12
14
15
17
10
16
18
19
21
20
24
23
22
25
3
6
1
19
2
7
5
4
12
13
8
11
14
9
17
10
15
16
20
21
18
29
24
22
23
1
2
3
4
5
6
7
8
9
10
11
12
13
14
15
16
17
18
19
20
21
22
23
24
25
61%–70% 71%–80% 91%–100%81%–90%
Color Scale
51%–60%

Global Retirement Index 2020 34
Coronavirus and Retiree Health
The global coronavirus pandemic spread rapidly around the world in the fi rst few months of 2020, disrupting everyday life and leading to tens of thousands of deaths among those affected. Millions of retirees, who should be enjoying time with grandchildren, or on travel and hobbies, or giving back to society with voluntary work, now face a new health risk.
It is very clear that the older age groups are much more affected by the pandemic. In the United States, hospitalizations related to coronavirus have been driven by older individuals. According to the CDC, the US overall cumulative COVID-19-associated hospitalization rate is 151.7 per 100,000 but the highest rates are in people 65 years and older (412.9 per 100,000) and 50–64 years (228.1 per 100,000).¹
Spotlight:
The same trend has been seen in other countries, such as Italy and Spain. For example, 63% of COVID deaths in Italy have been among adults 80 years and older as of June 22, and for Spain, 59% of COVID deaths have occurred among the same age group as of May 29.
But the risk that COVID-19 poses to retirees varies considerably depending on which country they live in. This is true even of the top ten countries in this year’s Health Index, which are very good for the health of retirees. Using the measure of deaths per 100,000 of the population as a result of COVID-19, this varies from as low as 0.96 in Japan (second in the Health Index) to
57.09 in Sweden (seventh).² These differences are due to a range of factors and each country’s own circumstances.
Proportion of U.S. COVID-19 Deaths by Age
COVID-19 Deaths Higher in Italy and Spain for Older Individuals
15–29 years
30–39 years
40–49 years
50–59 years
60–69 years
70–79 years
≥ 80 years
Italy Spain
Sources: Italian Ministry of Health and Spanish Ministry of Health.Italy figures recent as of June 22, 2020 and Spain figures
recent as of May 29, 2020.
0.0%
0.2%
0.9%
3.5%
10.1%
26.5%
58.8%
0.1%
0.3%
1.1%
3.2%
8.9%
23.8%
62.6%
70% 60% 50% 40% 30% 20% 10% 0% 0% 10% 20% 30% 40% 50% 60% 70%
% of COVID deaths% of COVID deaths
Note: Ages 0–14 omitted since the share was less than 0.1% for both countries.
25–34 years
35–44 years
45–54 years
55–64 years
65–74 years
75–84 years
85 years and over
% of COVID-19 deaths
Note: Ages 0–24 years omitted since the share was 0.1% or less
United States
0% 10% 20% 30% 40%
Source: U.S. Centers for Disease Control and Prevention.U.S. figures recent as of August 22, 2020.
0.8%
2.0%
5.3%
12.6%
21.3%
26.4%
31.5%
¹ U.S. Centers for Disease Control and Prevention. “CDC COVIDView: A Weekly Surveillance Summary of U.S. COVID-19 Activity,” https://www.cdc.gov/coronavirus/2019-ncov/covid-data/covidview/index.html. Data current as of August 15, 2020.² Johns Hopkins University of Medicine Coronavirus Resource Center. “Mortality Analyses,” https://coronavirus.jhu.edu/data/mortality.Data current as of August 25, 2020.
Japan’s aging population could have made it extremely vulnerable, but so far, it is has reported a very low mortality rate. It has a very good healthcare system which is used to dealing with pneumonia-related illnesses among retirees. And its relative geographical isolation may also have helped, even in an age of globalization.
Within Europe, retirees in Germany and Norway have benefi ted from low death rates per 100,000 of the population, of 11.19 and 4.97 respectively. Both countries took early action to lock down and, in Germany’s case, it rapidly implemented a large-scale test and trace regime to track COVID-19 cases. But retirees in France (fi fth on the Index) have seen a much higher fi gure for deaths per 100,000 of population, 45.60 compared to its neighbor, Germany, below it in 12th place. France, like theUK, Italy and Spain, experienced a high number of COVID-19 cases in care homes. Care homes, with large numbers of retirees in close proximity, are very exposed to COVID-19, unless there are strict controls to prevent the transmission of the virus and testing of staff and residents to detect and track any cases that emerge.
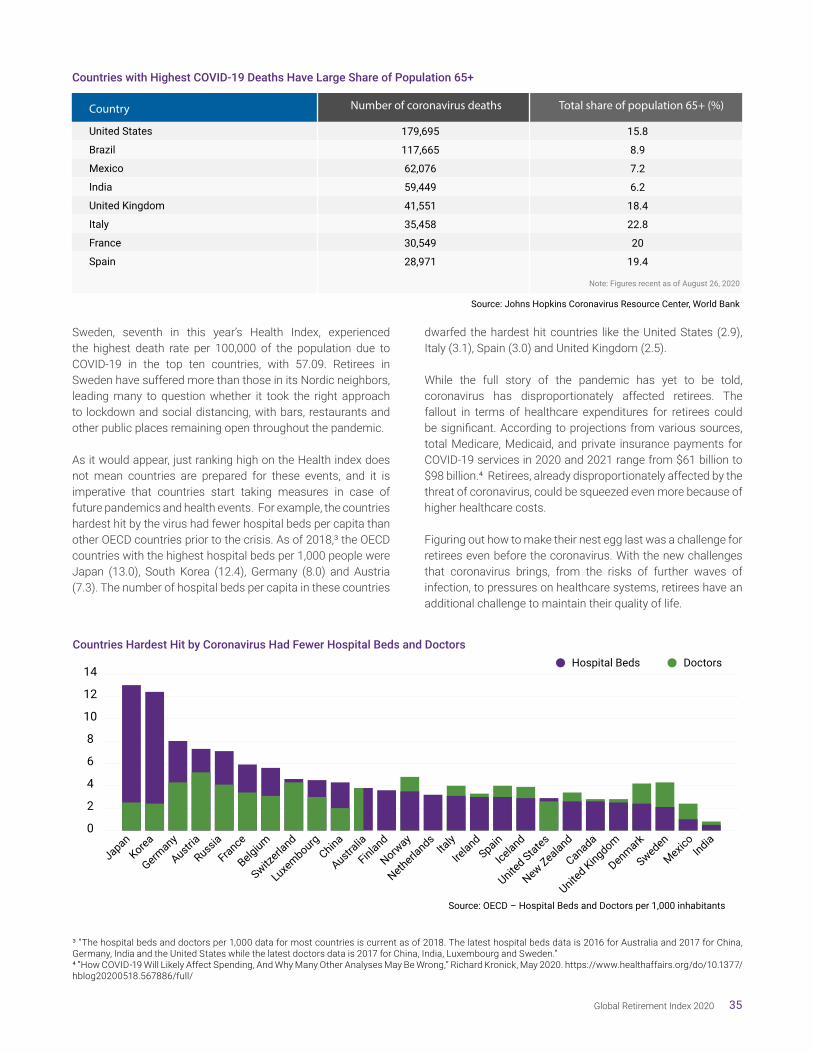
Global Retirement Index 2020 35
Sweden, seventh in this year’s Health Index, experienced the highest death rate per 100,000 of the population due to COVID-19 in the top ten countries, with 57.09. Retirees in Sweden have suffered more than those in its Nordic neighbors, leading many to question whether it took the right approach to lockdown and social distancing, with bars, restaurants and other public places remaining open throughout the pandemic.
As it would appear, just ranking high on the Health index does not mean countries are prepared for these events, and it is imperative that countries start taking measures in case of future pandemics and health events. For example, the countries hardest hit by the virus had fewer hospital beds per capita than other OECD countries prior to the crisis. As of 2018,3 the OECD countries with the highest hospital beds per 1,000 people were Japan (13.0), South Korea (12.4), Germany (8.0) and Austria (7.3). The number of hospital beds per capita in these countries
dwarfed the hardest hit countries like the United States (2.9), Italy (3.1), Spain (3.0) and United Kingdom (2.5).
While the full story of the pandemic has yet to be told, coronavirus has disproportionately affected retirees. The fallout in terms of healthcare expenditures for retirees could be significant. According to projections from various sources, total Medicare, Medicaid, and private insurance payments for COVID-19 services in 2020 and 2021 range from $61 billion to $98 billion.4 Retirees, already disproportionately affected by the threat of coronavirus, could be squeezed even more because of higher healthcare costs.
Figuring out how to make their nest egg last was a challenge for retirees even before the coronavirus. With the new challenges that coronavirus brings, from the risks of further waves of infection, to pressures on healthcare systems, retirees have an additional challenge to maintain their quality of life.
Countries with Highest COVID-19 Deaths Have Large Share of Population 65+
United States
Brazil
Mexico
India
United Kingdom
Italy
France
Spain
179,695
117,665
62,076
59,449
41,551
35,458
30,549
28,971
15.8
8.9
7.2
6.2
18.4
22.8
20
19.4
Country Number of coronavirus deaths Total share of population 65+ (%)
Note: Figures recent as of August 26, 2020
Source: Johns Hopkins Coronavirus Resource Center, World Bank
Countries Hardest Hit by Coronavirus Had Fewer Hospital Beds and Doctors
14
12
10
8
6
4
2
0
JapanKorea
Germany
Austria
Russia
France
Belgium
Switzerla
nd
Luxembourg
China
Australia
Finland
Norway
Netherlands
Italy
Ireland
Spain
Iceland
United States
New Zealand
Canada
United Kingdom
Denmark
Sweden
Mexico
India
Hospital Beds Doctors
Source: OECD – Hospital Beds and Doctors per 1,000 inhabitants
3 “The hospital beds and doctors per 1,000 data for most countries is current as of 2018. The latest hospital beds data is 2016 for Australia and 2017 for China, Germany, India and the United States while the latest doctors data is 2017 for China, India, Luxembourg and Sweden.”4 “How COVID-19 Will Likely Affect Spending, And Why Many Other Analyses May Be Wrong,” Richard Kronick, May 2020. https://www.healthaffairs.org/do/10.1377/hblog20200518.567886/full/

Global Retirement Index 2020 36
MaterialWellbeing Index
Norway, Iceland, the Czech Republic and the Netherlands remain unchanged in the top four places in the Material Wellbeing Sub-Index. Iceland stays in fi rst place for the employment indicator, but its ranking for the income equality indicator fell from third to fi fth, and on the income per capita indicator, it dropped four places from seventh to eleventh. These changes account for its Material Wellbeing Sub-Index falling from 91% in 2019 to 87% in 2020, resulting in it dropping one spot to second place.
The top three countries all score highly on the income equality index and are in the top fi ve for this indicator. Norway also scores very highly for both income per capita, in third place, and has the sixth highest score for the employment indicator. Iceland and the Czech Republic are jointly in fi rst place on the employment index, but the issue of poor performance for one particular indicator also applies to the Czech Republic, as it is only in 27th place for income per capita. However, the Netherlands is a ‘steady Eddie’ performer, in the top ten for income equality and income per capita and fi fth for employment.
Within the top ten countries on this sub-index, Austria jumps one place this year from ninth to eighth, although it has only risen from 75% to 76%. Austria’s rise is partly due to its better performance on the employment index, up from 23rd to 21st place. Austria also remained in the top ten place for both of
the other indicators. Another country rising up the Material Wellbeing Sub-Index is Slovenia, up from 14th to sixth. Slovenia improves its score signifi cantly on the employment indicator. It ranks second for income equality but ranks fi rmly in the middle of the pack for the other two indicators.
Just outside the top ten spots, two other countries rising up the Material Wellbeing Sub-Index are Ireland and Poland. Ireland, which leaps from 16th to 11th, has improved its ranking for the income equality and employment indicators, while it remains in fi fth place for the income per capita indicator. Poland rockets up to 15th from 22nd in the Material Wellbeing Sub-index, although it has only increased its score from 68% to 71%, as many other countries have seen their scores fall slightly. Poland’s improvement is largely due to going from 16th to tenth on the employment indicator, while it also did better on income equality, where it rose from 15th to 14th.
Against this, both Luxembourg and South Korea dropped signifi cantly down the table for material wellbeing this year. Luxembourg fell on two indicators, income equality and employment, which meant it dropped from 11th last year to 20th. South Korea, though, plummeted from tenth to 27th, mainly due to falling from 18th to 33rd for the income equality index.
MaterialWellbeingSub-Index
Norway
Iceland
Czech Republic
Netherlands
Germany
1
2
3
4
5
6
7
8
9
10
88%
87%
83%
83%
78%
86%
91%
83%
82%
79%
87%
93%
82%
80%
79%
Slovenia
Malta
Austria
Switzerland
Denmark
77%
76%
76%
75%
75%
72%
76%
75%
78%
75%
69%
73%
76%
80%
74%
Ranking change 2020 2019 2018
1 0
1 0
0 0
0 1
0 1
8 4
0 6
1 2
3 2
2 2
Top 10 Countries in Material Wellbeing Sub-Index

Global Retirement Index 2020 37
The U.S. is in 26th place for material wellbeing with 64%, ahead of the Russian Federation, which is 31st with 54%. Both score poorly for income inequality, with the U.S. in 38th place and Russia in 35th place, but do relatively better on the employment indicator, with the U.S. 11th and Russia 20th. But the U.S. does much better on income per capita, sixth, compared to Russia, 37th.
The bottom three this year are Greece, 15%, then India, 14%, with Brazil, 8%, propping up the table of 44 countries as ranked by their scores in the Material Wellbeing Sub-Index. Brazil remains near the bottom for each material wellbeing indicator, while India remains bottom on the income per capita indicator and Greece remains last in the employment indicator.
Top 25 Countries in Material Wellbeing Sub-Index
Norway
Iceland
Czech Republic
Netherlands
Germany
Slovenia
Malta
Austria
Switzerland
Denmark
Ireland
Belgium
Slovak Republic
Hungary
Poland
Japan
Sweden
Finland
United Kingdom
Luxembourg
Canada
Australia
Israel
Estonia
New Zealand
Ranking
Country
Score
20192020 2018 20192020 2018
88%
87%
83%
83%
78%
77%
76%
76%
75%
75%
75%
73%
73%
72%
71%
70%
69%
68%
68%
68%
66%
65%
65%
64%
64%
86%
91%
83%
82%
79%
72%
76%
75%
78%
75%
71%
73%
68%
70%
68%
72%
72%
68%
69%
74%
68%
66%
66%
62%
62%
87%
93%
82%
80%
79%
69%
73%
76%
80%
74%
73%
71%
64%
70%
66%
75%
71%
69%
71%
73%
65%
66%
63%
57%
63%
2
1
3
4
5
14
7
9
6
8
16
12
19
17
22
13
15
20
18
11
21
24
23
25
26
2
1
3
5
6
18
13
7
4
10
12
14
23
17
20
9
15
19
16
11
22
21
24
28
25
1
2
3
4
5
6
7
8
9
10
11
12
13
14
15
16
17
18
19
20
21
22
23
24
25
61%–70%51%–60% 71%–80% 91%–100%81%–90%
Color Scale

Global Retirement Index 2020 38
Disparate effects of the coronavirus
The coronavirus pandemic has upended the global economy, triggering the worst recession in almost a century and huge damage to people’s health, employment and wellbeing. The pandemic can expose weaknesses and hidden divisions in many countries in the form of increased unemployment, reduced incomes and worsening income equality, all components of the Material Wellbeing index.
Just as the fi nancial crisis of 2007–08 resulted in a massive increase in unemployment, the COVID-19 pandemic seems to be on a similar, if not worse, path of economic consequences. After 2008, unemployment spiked in OECD countries and stayed around 8% until 2014, where it dropped to 7.4%. It declined every year after that until 2019, where it was 5.2%.
The OECD Economic Outlook report, published in June 2020, looked at a double-hit scenario, with a second global outbreak of COVID-19 in 2020. Unemployment will increase even more with a second outbreak, the OECD warned. It said that in Spain, for example, unemployment will reach 21.8% by the end of 2020 in a single-hit scenario, and 25.5% in a double-hit scenario. The U.S. and the UK could also see large increases in the unemployment with second waves of COVID-19, with unemployment rising to almost 17% in the U.S. and almost 15% in the UK.
As some countries like the U.S. struggle to control spikes in COVID cases, it goes without saying that a second wave of infection will add massively to the adverse impact on the material wellbeing of millions of citizens, as economic activity contracts for a second time if countries have to impose another lockdown in order to control the spread of COVID-19.
Spotlight:
Second outbreak would cause higher unemployment spike in 2020-Q4
Spain
United States
United Kingdom
France
Canada
Germany
Japan
25.5%
16.9%
14.8%
13.7%
10.6%
5.5%
4%
0 5 10 15 20 25 30
Single-hit scenario Additional impact from double-hit scenario
Source: OECD (2020), Unemployment rate forecast (indicator).

Global Retirement Index 2020 39
In many cases, a rise in unemployment is likely to disproportionately affect those on lower incomes, exacerbating income inequality. For example, Spain, which is 25th in the income equality Sub-Index, is expected to be heavily hit by a fall in tourism in 2020, with job losses across many hotels, bars, restaurants and a wide range of businesses that cater to tourists. Many staff in these businesses are low-paid, so the less well-off in Spain are likely to be worse affected than professional and managerial workers, deepening existing inequalities.
The USA is 38th on the income equality Sub-Index and its unemployment rate reached almost 15% in April, before Statistics recovering in May. Based on data from the U.S. Bureau of Labor (BLS), 52% of Americans with college degrees could work from home compared to only 13% of workers with a high school degree. By income level, the difference is even starker – 61.5% of those earning above the 75th percentile can work from home compared to just 20.1% of people whose earnings fall between the 25th and 50th percentile and 9.2% of those who earn below 25th percentile.5 Lower paid workers are also less well-placed to cope with unemployment, as they are less likely to have savings to tide them over until they find another job.
The scale of the global recession resulting from COVID-19 means most, if not all, countries will face recession in 2020 and possibly 2021. However, we can expect countries that rank highly in the Material Wellbeing Index to cope better than most. For example, Germany is fifth in the Material Wellbeing Index and it is facing a big drop in GDP (6.6%) in 2020, even if a second outbreak is avoided. However, the German government is acting on a large scale to support the economy with two large budget packages, worth a combined €284.4 billion (8.3% of GDP), announced in March and early June. These packages will support businesses, individual workers and the self-employed, and will also promote investment in areas such as digital infrastructure and research and development. This shows how actions to tackle the crisis can also redirect economic activity for long-term growth.
But as discussed, the danger of the COVID-19 pandemic is that it will exacerbate inequalities, as it has a disproportionate impact on the worse off. This may happen within countries and also at a global level. The danger to the global economy is clear, and it must be hoped that both collectively and individually, countries have the foresight and wisdom to do what they can to prevent this.
5 “Economic News Release, Table 1. Workers who could work at home, did work at home, and were paid for work at home, by selected characteristics, averages for the period 2017-2018,” U.S. Bureau of Labor Statistics, September 2019. https://www.bls.gov/news.release/flex2.t01.htm
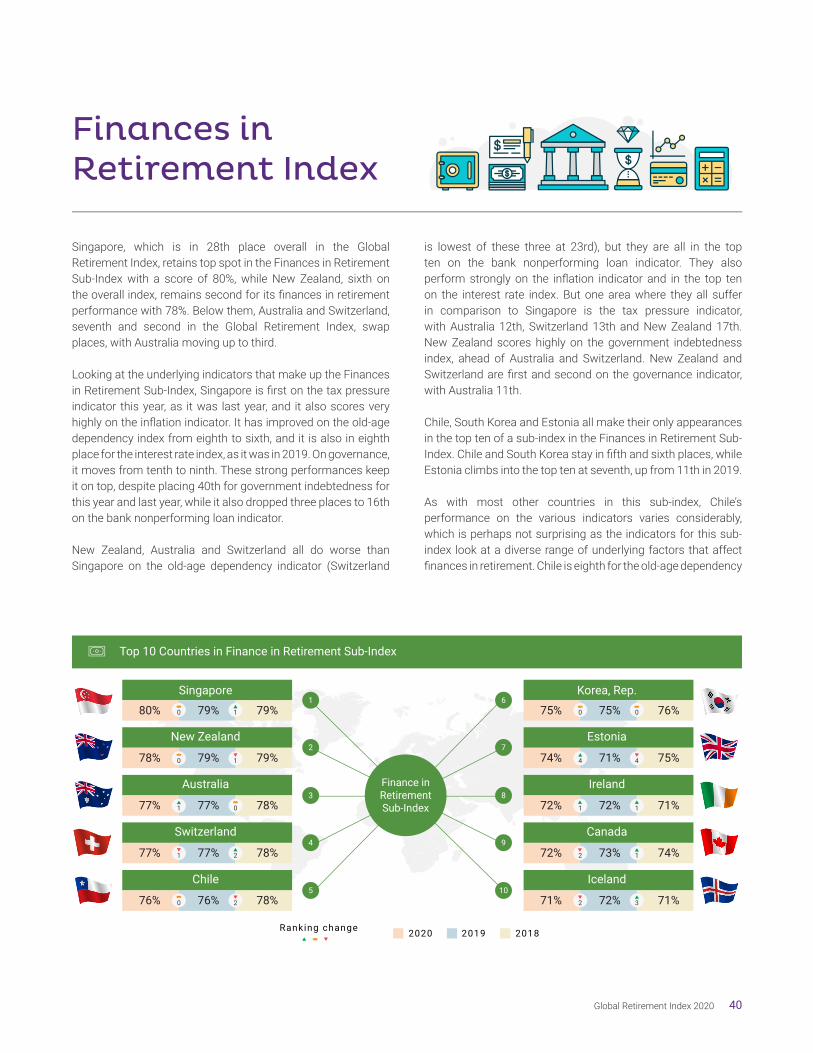
Global Retirement Index 2020 40
Finances inRetirement Index
Singapore, which is in 28th place overall in the Global Retirement Index, retains top spot in the Finances in Retirement Sub-Index with a score of 80%, while New Zealand, sixth on the overall index, remains second for its fi nances in retirement performance with 78%. Below them, Australia and Switzerland, seventh and second in the Global Retirement Index, swap places, with Australia moving up to third.
Looking at the underlying indicators that make up the Finances in Retirement Sub-Index, Singapore is fi rst on the tax pressure indicator this year, as it was last year, and it also scores very highly on the infl ation indicator. It has improved on the old-age dependency index from eighth to sixth, and it is also in eighth place for the interest rate index, as it was in 2019. On governance, it moves from tenth to ninth. These strong performances keep it on top, despite placing 40th for government indebtedness for this year and last year, while it also dropped three places to 16th on the bank nonperforming loan indicator.
New Zealand, Australia and Switzerland all do worse than Singapore on the old-age dependency indicator (Switzerland
is lowest of these three at 23rd), but they are all in the top ten on the bank nonperforming loan indicator. They also perform strongly on the infl ation indicator and in the top ten on the interest rate index. But one area where they all suffer in comparison to Singapore is the tax pressure indicator, with Australia 12th, Switzerland 13th and New Zealand 17th. New Zealand scores highly on the government indebtedness index, ahead of Australia and Switzerland. New Zealand and Switzerland are fi rst and second on the governance indicator, with Australia 11th.
Chile, South Korea and Estonia all make their only appearances in the top ten of a sub-index in the Finances in Retirement Sub-Index. Chile and South Korea stay in fi fth and sixth places, while Estonia climbs into the top ten at seventh, up from 11th in 2019.
As with most other countries in this sub-index, Chile’s performance on the various indicators varies considerably, which is perhaps not surprising as the indicators for this sub-index look at a diverse range of underlying factors that affect fi nances in retirement. Chile is eighth for the old-age dependency
Finance inRetirementSub-Index
Singapore
New Zealand
Australia
Switzerland
Chile
1
2
3
4
5
6
7
8
9
10
80%
78%
77%
77%
76%
79%
79%
77%
77%
76%
79%
79%
78%
78%
78%
Korea, Rep.
Estonia
Ireland
Canada
Iceland
75%
74%
72%
72%
71%
75%
71%
72%
73%
72%
76%
75%
71%
74%
71%
Ranking change 2020 2019 2018
0 1
0 1
1 0
1 2
0 2
0 0
4 4
1 1
2 1
2 3
Top 10 Countries in Finance in Retirement Sub-Index

Global Retirement Index 2020 41
indicator, down one place from 2019, and it is sixth again for the tax pressure indicator. It also scores highly on the government indebtedness index where it is fourth. These results make up for its performance on the indicators for governance (24th), interest rates (20th), inflation (38th) and bank nonperforming loans (23rd). In contrast, South Korea is tenth for the old-age dependency indicator, 15th for the interest rate indicator, tenth for tax pressure and 16th for government indebtedness. Its lowest position is 27th for governance, a slight improvement on 2019, when it was 29th.
Estonia is the biggest mover in the top ten for the Finances in Retirement Sub-Index, up four places to seventh. The biggest contributor here is that it has gone from 15th to second on the bank nonperforming loan index. It is relatively low for the old-age dependency indicator at 33rd, but improved on tax pressure, rising from 29th to 23rd place, and it remained in first place on the government indebtedness indicator. On governance, Estonia remains in 19th place.
Iceland is the leading country in 2020 in the Global Retirement Index and is tenth in the Finances in Retirement sub-index, below Canada, which is eighth overall and ninth in this Sub-Index, and
Ireland, fourth overall and eighth here. Both have potential to improve in this sub-index, as Iceland has mediocre scores for tax pressure and bank nonperforming loans, while Canada ranks near the bottom for the government indebtedness indicator.
The United States is in 16th place in the Global Retirement Index, but eleventh place here. With its well-known budget deficit, the U.S. scores badly on the government indebtedness indicator, where it is 39th. However, it does reasonably well on the other financial indicators here and is 18th on the old-age dependency indicator. India has moved up from 27th to 19th this year, although its positioning on the various indicators has stayed fairly level. On some indicators, such as bank nonperforming loans and inflation, India does badly, with 41st place for both these indicators. But the flip side to India’s poor performance on measures for health and longevity mean it is top for the old-age dependency index and it also does very well on the tax pressure indicator. The results for India and the U.S. show how rankings for Finances in Retirement can be based on wildly varying results on the various indicators making up this sub-index.
As the Global Retirement Index is intended as a comparison tool across countries over the years, we strive to keep the indicators constant to ensure comparability. However, we do seek to improve on the framework as we discern ongoing trends. As a result, in 2016 we moved to a shorter country list to focus our efforts on countries where retirement was a more immediate issue and also switched to the five-year average of real interest rates and inflation to ensure we have a longer-term perspective of these variables to match the rest of the variables in the report.
Four years later, we find ourselves with another trend that requires further analysis – negative interest rates. Low interest rates have become the norm after the financial crisis as we have highlighted in our spotlight, but in a post-COVID world, there is a possibility of more central banks embracing negative interest rates. The 2016 GRI had only one country that had a negative value for the five-year average of real interest rates. That number has increased steadily over the years and landed at 16 in this year’s report.
Negative real interest rates are heavily penalized in the GRI – they incur a 1% score, the lowest possible in the GRI, while a positive real interest rate, even if small, can result in much larger scores. Given the detrimental impact of negative rates on retirees and their savings, we feel it is justified to keep the methodology intact for this year while keeping an eye out for interest rate trends over the next year.
Interest Rates

Global Retirement Index 2020 42
France, Greece and Turkey are in the bottom three for the Finances in Retirement Sub-Index. While the other two are unchanged from 2019, France drops from 37th to 42nd. On infl ation, France and Greece score highly, while Turkey is last on the infl ation indicator. However, Turkey is ninth on the tax
pressure indicator, whereas France and Greece are 43rd and 37th respectively. Turkey also does well on the government indebtedness indicator, in fi fth place, while France is 36th and Greece is 43rd. And while France is 21st on the governance indicator, Greece is 37th and Turkey is 43rd.
Top 25 Countries in Finances in Retirement Sub-Index
Singapore
New Zealand
Australia
Switzerland
Chile
Korea, Rep.
Estonia
Ireland
Canada
Iceland
United States
Israel
China
Czech Republic
Malta
Colombia
Poland
Mexico
India
Spain
Slovenia
Portugal
Luxembourg
Norway
Cyprus
Ranking
Country
Score
20192020 2018 20192020 2018
80%
78%
77%
77%
76%
75%
74%
72%
72%
71%
71%
68%
68%
67%
66%
65%
65%
64%
64%
62%
62%
61%
60%
59%
59%
79%
79%
77%
77%
76%
75%
71%
72%
73%
72%
71%
70%
69%
69%
66%
65%
66%
64%
60%
63%
65%
61%
60%
59%
59%
79%
79%
78%
78%
78%
76%
75%
71%
74%
71%
72%
71%
69%
69%
67%
67%
68%
66%
56%
64%
65%
61%
62%
60%
53%
1
2
4
3
5
6
11
9
7
8
10
12
14
13
18
20
17
23
27
24
21
26
28
31
32
2
1
4
5
3
6
7
10
8
11
9
12
14
15
20
19
17
22
36
24
23
27
26
29
40
1
2
3
4
5
6
7
8
9
10
11
12
13
14
15
16
17
18
19
20
21
22
23
24
25
61%–70%51%–60% 71%–80% 91%–100%81%–90%
Color Scale
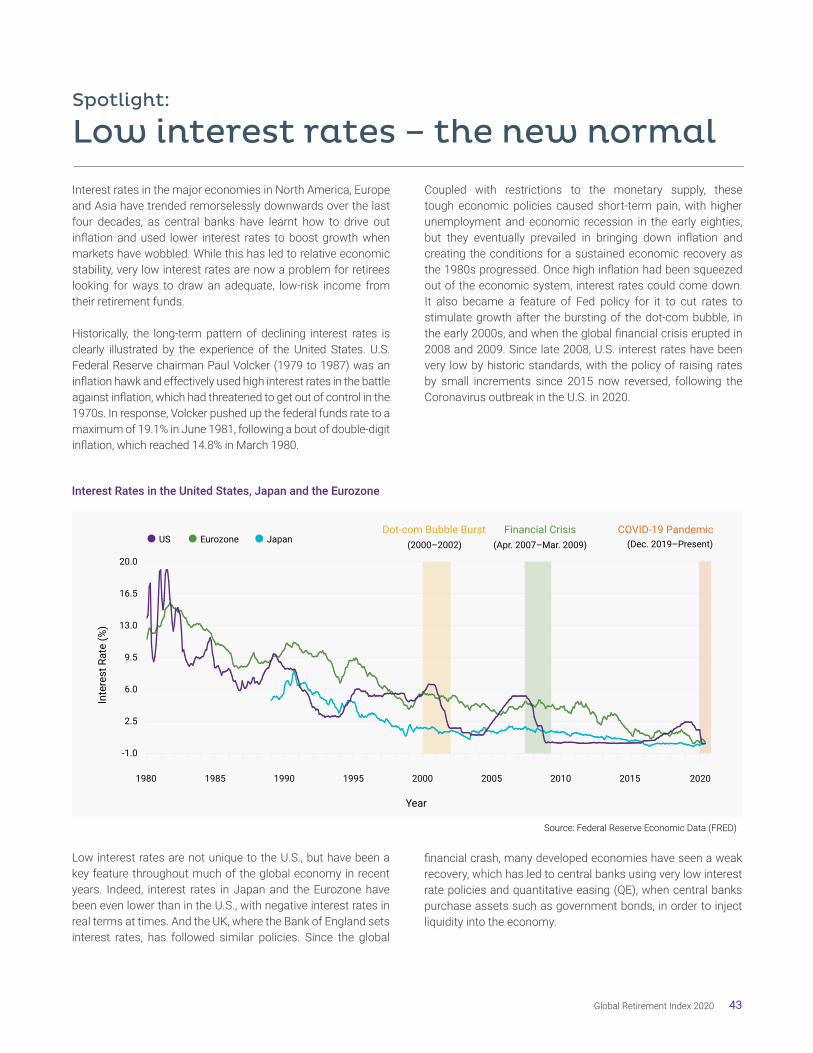
Global Retirement Index 2020 43
Low interest rates – the new normal
Interest rates in the major economies in North America, Europe and Asia have trended remorselessly downwards over the last four decades, as central banks have learnt how to drive out infl ation and used lower interest rates to boost growth when markets have wobbled. While this has led to relative economic stability, very low interest rates are now a problem for retirees looking for ways to draw an adequate, low-risk income from their retirement funds.
Historically, the long-term pattern of declining interest rates is clearly illustrated by the experience of the United States. U.S. Federal Reserve chairman Paul Volcker (1979 to 1987) was an infl ation hawk and effectively used high interest rates in the battle against infl ation, which had threatened to get out of control in the 1970s. In response, Volcker pushed up the federal funds rate to a maximum of 19.1% in June 1981, following a bout of double-digit infl ation, which reached 14.8% in March 1980.
Coupled with restrictions to the monetary supply, these tough economic policies caused short-term pain, with higher unemployment and economic recession in the early eighties, but they eventually prevailed in bringing down infl ation and creating the conditions for a sustained economic recovery as the 1980s progressed. Once high infl ation had been squeezed out of the economic system, interest rates could come down. It also became a feature of Fed policy for it to cut rates to stimulate growth after the bursting of the dot-com bubble, in the early 2000s, and when the global fi nancial crisis erupted in 2008 and 2009. Since late 2008, U.S. interest rates have been very low by historic standards, with the policy of raising rates by small increments since 2015 now reversed, following the Coronavirus outbreak in the U.S. in 2020.
Spotlight:
Interest Rates in the United States, Japan and the Eurozone
19901980 1985 1995 2000 2005 2010 2015 2020
COVID-19 PandemicDot-com Bubble Burst Financial Crisis
Year
Inte
rest
Rat
e (%
)
(2000–2002) (Apr. 2007–Mar. 2009) (Dec. 2019–Present)Eurozone JapanUS
Source: Federal Reserve Economic Data (FRED)
20.0
16.5
13.0
9.5
6.0
2.5
-1.0
Low interest rates are not unique to the U.S., but have been a key feature throughout much of the global economy in recent years. Indeed, interest rates in Japan and the Eurozone have been even lower than in the U.S., with negative interest rates in real terms at times. And the UK, where the Bank of England sets interest rates, has followed similar policies. Since the global
fi nancial crash, many developed economies have seen a weak recovery, which has led to central banks using very low interest rate policies and quantitative easing (QE), when central banks purchase assets such as government bonds, in order to inject liquidity into the economy.

Global Retirement Index 2020 44
Average Equity and Fixed Income Holdings of Families Headed by U.S. Retirees
100200300400500600700
1990 1995 2000 2005 2010 2015
Fixed Income Equities
$ (t
hous
ands
)
Source: Survey of Consumer Finances
These policies have kept down interest rates to the extent that many observers now call very low interest rates “the new normal.” For retirees, very low interest rates have negative consequences, although it is arguable they have prevented deflation from taking hold.
On one hand, low interest rates have boosted the prices of assets, such as equities, and kept the cost of borrowing low. This has supported the asset value of pension funds and investment portfolios and helped those with large mortgages or other debts. But the negative consequences of very low interest rates for retirees are very low interest rates on savings accounts and safer assets such as certificates of deposit (CDs). From earning around five or six percent annual income from CDs and savings accounts before the global financial crash, savers now struggle to beat even low levels of inflation, with rates on many bank accounts around one percent a year or less.
Annuity rates have also plummeted as a result of longevity increases and very low interest rates. In 2000, a 65-year-old woman could obtain a monthly income of $744 with a $100,000 annuity purchase.6 By April 2020, the equivalent monthly income was $469, a fall of 37% in income for retirees. And very low rates have greatly increased the liabilities of defined benefit (DB) pension funds, if they are discounted by the interest rate of a secure fixed income asset, such as government bonds
or investment grade corporate bonds. As this has made DB pensions more expensive where DB pension funds are valued and funded on this basis, many employers have switched to lower cost but riskier defined contribution (DC) pensions, which is likely to mean lower incomes in retirement for many.
Another effect of the “new normal” of very low interest rates has been for retirees to increase their holdings of equities relative to their fixed income holdings. Low rates have held down the income received on fixed income assets, unless investors are prepared to take on more risk, so this makes sense from an investment perspective.
Stock holdings for the average U.S. retiree have soared from $171.5K in the 1990 average account to $464.3K, while bonds have likewise increased astronomically from $230.5K to $531.7K.7 In percentage terms, stocks have increased 171% since 1990 while bonds have increased 131%. While this works when markets are doing well, as in the bull market of the past ten years, it can also be extremely risky as we’ve seen during the bout of volatility in March when equity markets saw their fastest ever decline from a market peak. The risk for retirees in this situation is that they might panic and sell at the wrong time, crystallizing a big loss on their equity assets. Retirees also have less time to recoup equity losses than younger individuals, who are better placed to ride out equity market volatility.
Of the top ten countries in this year’s Finances in Retirement Sub-Index, interest rates as at late July 2020 were uniformly low, from 1% in Iceland to a negative interest rate of -0.75% in Switzerland. Because the Swiss franc is a safe haven currency, Switzerland has had to use negative rates to reduce upward pressure on the Swiss franc, as this makes Swiss exports less competitive. Negative rates can mean bank deposits above a certain size incur a fee, rather than interest being paid on them, although this normally only applies to corporate customers, rather than individuals.
For retirees, negative rates magnify the problem they face in generating an income from investments. Rather than purchasing an annuity or using safe fixed income assets, when
interest rates are very low, or even negative, retirees may invest in property in order to receive a rental income, or may seek to cash in a small slice of a diversified portfolio on a regular basis. As a rough rule of thumb, retirees can prudently redeem up to 3% or 4% of their portfolio and hope the capital gains on the remainder will at least maintain their portfolio’s value over the medium to long term. If a retiree has an investment portfolio of $500,000, withdrawing 3% for an annual income only equates to $15,000 a year, but with extremely low interest rates at 0.5% or lower in all but one of the top ten countries in the Finances in Retirement Sub-Index, this may be preferable to the very low returns from annuities, savings accounts, government bonds and other secure income-producing assets.
6 “Plunging annuity rates: A strategy for new retirees.” MarketWatch. https://www.marketwatch.com/story/plunging-annuity-rates-a-strategy-for-new-retirees-2020-04-087 Board of Governors of the Federal Reserve System. “Survey of Consumer Finances,” www.federalreserve.gov/econres/scfindex.htm
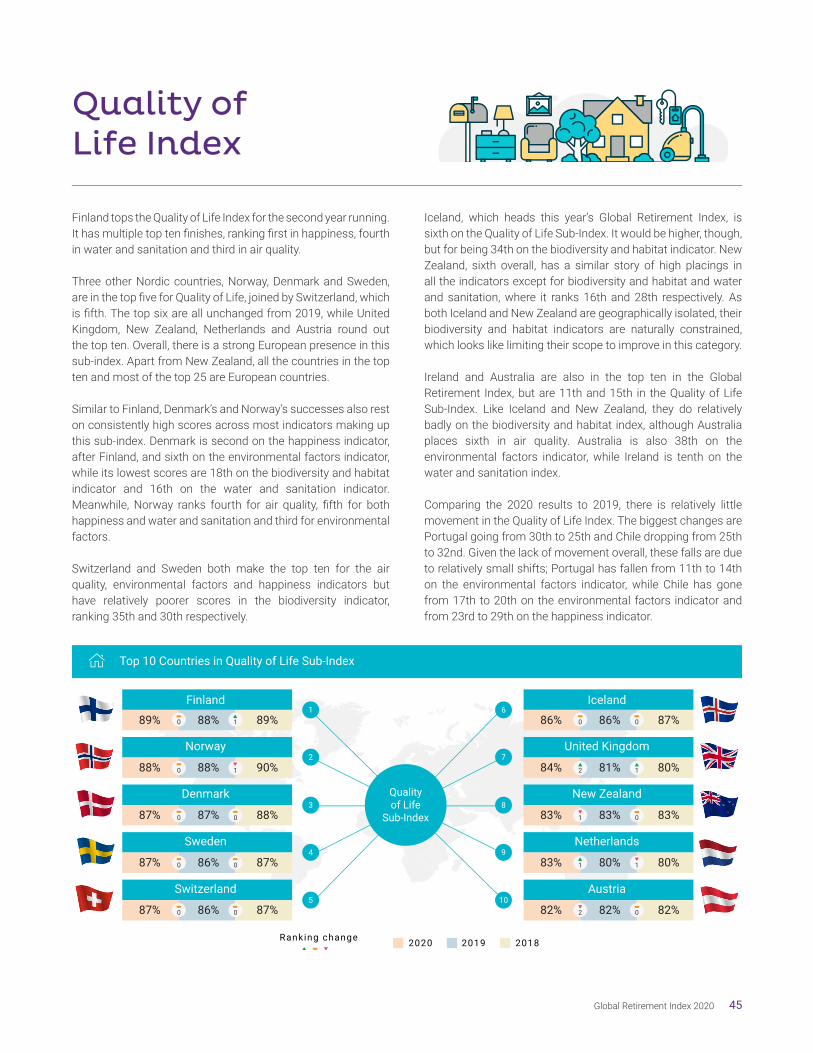
Global Retirement Index 2020 45
Quality ofLife Index
Finland tops the Quality of Life Index for the second year running. It has multiple top ten fi nishes, ranking fi rst in happiness, fourth in water and sanitation and third in air quality.
Three other Nordic countries, Norway, Denmark and Sweden, are in the top fi ve for Quality of Life, joined by Switzerland, which is fi fth. The top six are all unchanged from 2019, while United Kingdom, New Zealand, Netherlands and Austria round outthe top ten. Overall, there is a strong European presence in this sub-index. Apart from New Zealand, all the countries in the top ten and most of the top 25 are European countries.
Similar to Finland, Denmark’s and Norway’s successes also rest on consistently high scores across most indicators making up this sub-index. Denmark is second on the happiness indicator, after Finland, and sixth on the environmental factors indicator, while its lowest scores are 18th on the biodiversity and habitat indicator and 16th on the water and sanitation indicator. Meanwhile, Norway ranks fourth for air quality, fi fth for both happiness and water and sanitation and third for environmental factors.
Switzerland and Sweden both make the top ten for the air quality, environmental factors and happiness indicators but have relatively poorer scores in the biodiversity indicator, ranking 35th and 30th respectively.
Iceland, which heads this year’s Global Retirement Index, is sixth on the Quality of Life Sub-Index. It would be higher, though, but for being 34th on the biodiversity and habitat indicator. New Zealand, sixth overall, has a similar story of high placings in all the indicators except for biodiversity and habitat and water and sanitation, where it ranks 16th and 28th respectively. As both Iceland and New Zealand are geographically isolated, their biodiversity and habitat indicators are naturally constrained, which looks like limiting their scope to improve in this category.
Ireland and Australia are also in the top ten in the Global Retirement Index, but are 11th and 15th in the Quality of Life Sub-Index. Like Iceland and New Zealand, they do relatively badly on the biodiversity and habitat index, although Australia places sixth in air quality. Australia is also 38th on the environmental factors indicator, while Ireland is tenth on the water and sanitation index.
Comparing the 2020 results to 2019, there is relatively little movement in the Quality of Life Index. The biggest changes are Portugal going from 30th to 25th and Chile dropping from 25th to 32nd. Given the lack of movement overall, these falls are due to relatively small shifts; Portugal has fallen from 11th to 14th on the environmental factors indicator, while Chile has gone from 17th to 20th on the environmental factors indicator and from 23rd to 29th on the happiness indicator.
Qualityof Life
Sub-Index
Finland
Norway
Denmark
Sweden
Switzerland
1
2
3
4
5
6
7
8
9
10
89%
88%
87%
87%
87%
88%
88%
87%
86%
86%
89%
90%
88%
87%
87%
Iceland
United Kingdom
New Zealand
Netherlands
Austria
86%
84%
83%
83%
82%
86%
81%
83%
80%
82%
87%
80%
83%
80%
82%
Ranking change 2020 2019 2018
0 1
0 1
0 0
0 0
0 0
0 0
2 1
1 0
1 1
2 0
Top 10 Countries in Quality of Life Sub-Index
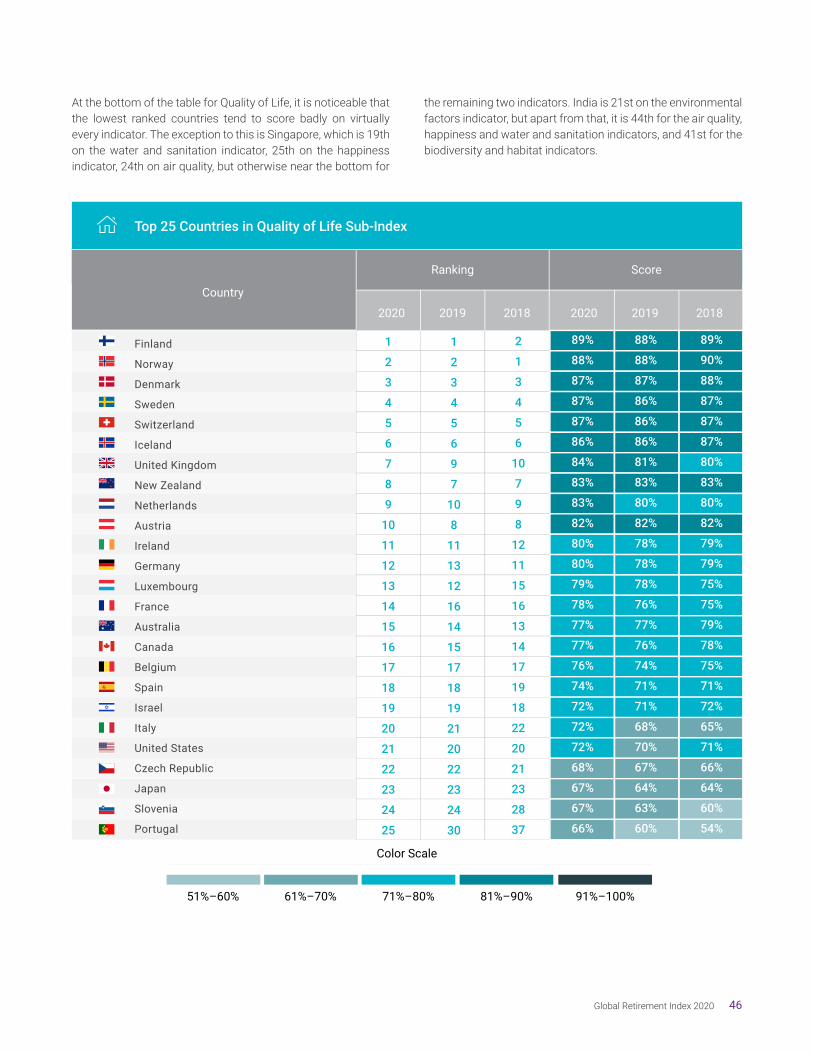
Global Retirement Index 2020 46
At the bottom of the table for Quality of Life, it is noticeable that the lowest ranked countries tend to score badly on virtually every indicator. The exception to this is Singapore, which is 19th on the water and sanitation indicator, 25th on the happiness indicator, 24th on air quality, but otherwise near the bottom for
the remaining two indicators. India is 21st on the environmental factors indicator, but apart from that, it is 44th for the air quality, happiness and water and sanitation indicators, and 41st for the biodiversity and habitat indicators.
Top 25 Countries in Quality of Life Sub-Index
Finland
Norway
Denmark
Sweden
Switzerland
Iceland
United Kingdom
New Zealand
Netherlands
Austria
Ireland
Germany
Luxembourg
France
Australia
Canada
Belgium
Spain
Israel
Italy
United States
Czech Republic
Japan
Slovenia
Portugal
Ranking
Country
Score
20192020 2018 20192020 2018
89%
88%
87%
87%
87%
86%
84%
83%
83%
82%
80%
80%
79%
78%
77%
77%
76%
74%
72%
72%
72%
68%
67%
67%
66%
88%
88%
87%
86%
86%
86%
81%
83%
80%
82%
78%
78%
78%
76%
77%
76%
74%
71%
71%
68%
70%
67%
64%
63%
60%
89%
90%
88%
87%
87%
87%
80%
83%
80%
82%
79%
79%
75%
75%
79%
78%
75%
71%
72%
65%
71%
66%
64%
60%
54%
1
2
3
4
5
6
9
7
10
8
11
13
12
16
14
15
17
18
19
21
20
22
23
24
30
2
1
3
4
5
6
10
7
9
8
12
11
15
16
13
14
17
19
18
22
20
21
23
28
37
1
2
3
4
5
6
7
8
9
10
11
12
13
14
15
16
17
18
19
20
21
22
23
24
25
61%–70%51%–60% 71%–80% 91%–100%81%–90%
Color Scale

CountryReportsThis section offers a summary of GRI performance for each country finishing in the top 25 overall. Each country report references last year’s figures and shows how different indicator movements have affected the country’s overall and sub-index scores this year.
The goal of the country analysis is to obtain an adequate proxy for changes in retirement conditions in a particular country by comparing year-on-year performance and movements in ranking.

Global Retirement Index 2020 48
Iceland
For the third year in a row, Iceland ranks fi rst overall in the GRI this year with a score of 82%. It has a slightly overall lower score this year because of lower scores in the Material Wellbeing (2nd) and Finances (10th) sub-indices.
Iceland ranks second among all GRI countries in the Material Wellbeing sub-index. It not only has top ten fi nishes in the employment indicator, where it ranks fi rst overall, but also in income equality (5th). Iceland has a lower sub-index score because of lower income equality.
Iceland also drops in its Finances sub-index score. It has lower scores in the bank nonperforming loans, tax pressure, old-age dependency, and interest rate indicators. It manages two top ten fi nishes in interest rates (6th) and government indebtedness (9th).
Iceland’s Quality of Life (6th) sub-index has a modest gain. It improves in the happiness indicator, where it ranks fourth, while also managing to improve in environmental factors (7th) and water and sanitation (6th). It also ranks in the top ten for air quality (2nd) but has the eleventh-lowest score among GRI countries in the biodiversity indicator.
Iceland’s largest gain this year is in the Health sub-index to 9th. It improves in the insured health expenditure and health expenditure per capita indicators. It manages a top ten fi nish in life expectancy (9th).
1
82%12020 2020
2018
20191
1*2018
201983%
84%
RANKING SCORE
GLOBAL RETIREMENT INDEX
HEALTH
QUALITY OF LIFE
MATERIAL WELLBEING
FINANCES IN RETIREMENT
Old-Age Dependency
Bank Non-Performing Loans
Inflation
Interest Rates
Tax Pressure
Government Indebtedness
Governance
87%
86%
87%
71%
49%
54%
96%
81%
17%
56%
90%
85%
86%
91%
72%
51%
61%
93%
81%
19%
53%
90%
85%
87%
93%
71%
53%
59%
74%
80%
23%
47%
90%
20182020 2019 2020 2019
SCORE CHANGESCORESSUB-INDEX ANDINDICATOR SCORES
* Prior to the methodology update this year, Iceland had previously ranked second overall in GRI 2018.

Global Retirement Index 2020 49
Switzerland
Switzerland ranks second overall in this year’s GRI. While its rank stays the same, its score is lower than last year because of lower scores in the Material Wellbeing (9th) and Finances (4th) sub-indices. It is one of only two countries, along with Iceland, to fi nish in the top ten for all four sub-indices.
Switzerland drops in the Material Wellbeing sub-index because of lower scores in income equality and employment indicators. Income per capita (4th) is Switzerland’s only indicator making the top ten.
Switzerland has a more muted drop in the Finances sub- index. Its largest slide is the bank nonperforming loans indicator, followed by tax pressure, old-age dependency and interest rates. It has the second-highest score among all countries for the governance indicator and also fi nishes in the top ten for bank nonperforming loans (6th) and interest rates (10th).
Switzerland’s largest sub-index score improvement is Health (6th). Its scores improve in all three indicators and it has the second-highest score among all GRI countries for both the life expectancy and health expenditure per capita indicators.
Switzerland’s other sub-index improvement is Quality of Life (5th). It improves in air quality (8th) and happiness (3rd) indicators. It also has top ten fi nishes in the environmental factors (4th) and water and sanitation (2nd) indicators.
2
82%22020 2020
2018
20192
2*2018
201982%
83%
RANKING SCORE
GLOBAL RETIREMENT INDEX
HEALTH
QUALITY OF LIFE
MATERIAL WELLBEING
FINANCES IN RETIREMENT
Old-Age Dependency
Bank Non-Performing Loans
Inflation
Interest Rates
Tax Pressure
Government Indebtedness
Governance
89%
87%
75%
77%
36%
86%
100%
76%
41%
52%
93%
88%
86%
78%
77%
37%
90%
100%
76%
41%
52%
93%
87%
87%
80%
78%
38%
77%
100%
75%
52%
51%
93%
20182020 2019 2020 2019
SCORE CHANGESCORESSUB-INDEX ANDINDICATOR SCORES
* Prior to the methodology update this year, Switzerland had previously ranked fi rst overall in GRI 2018.
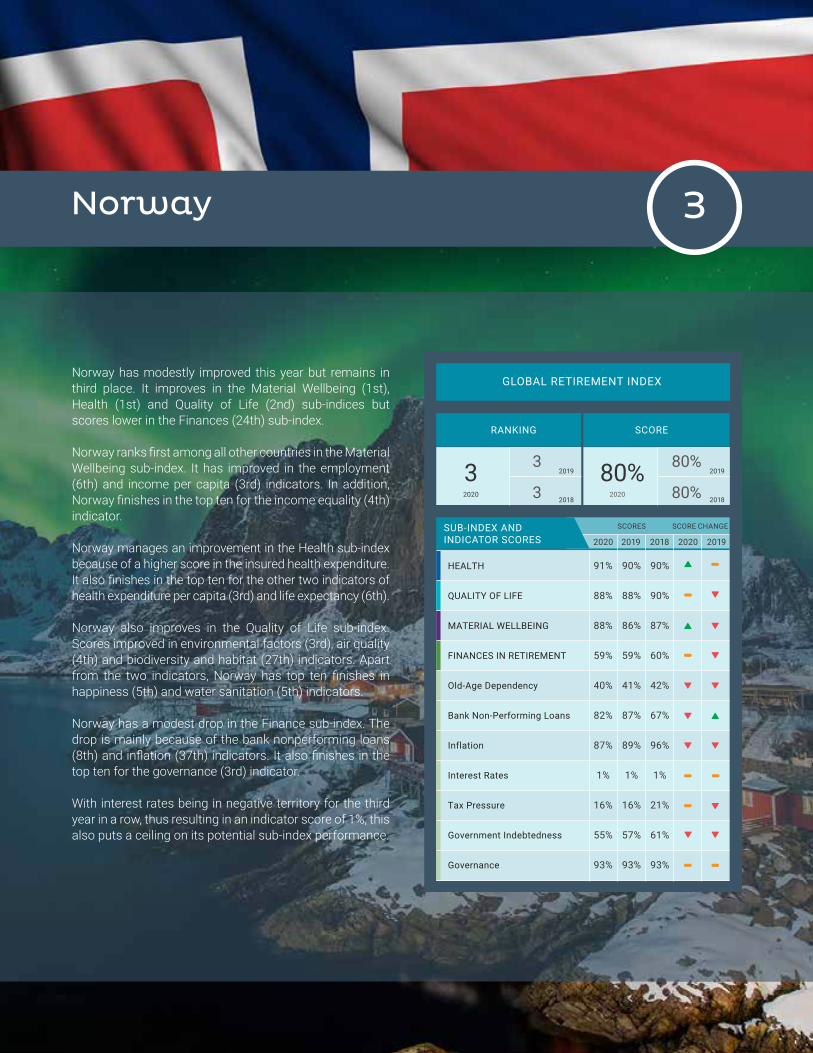
Global Retirement Index 2020 50
Norway
Norway has modestly improved this year but remains in third place. It improves in the Material Wellbeing (1st), Health (1st) and Quality of Life (2nd) sub-indices but scores lower in the Finances (24th) sub-index.
Norway ranks fi rst among all other countries in the Material Wellbeing sub-index. It has improved in the employment (6th) and income per capita (3rd) indicators. In addition, Norway fi nishes in the top ten for the income equality (4th) indicator.
Norway manages an improvement in the Health sub-index because of a higher score in the insured health expenditure. It also fi nishes in the top ten for the other two indicators of health expenditure per capita (3rd) and life expectancy (6th).
Norway also improves in the Quality of Life sub-index. Scores improved in environmental factors (3rd), air quality (4th) and biodiversity and habitat (27th) indicators. Apart from the two indicators, Norway has top ten fi nishes in happiness (5th) and water sanitation (5th) indicators.
Norway has a modest drop in the Finance sub-index. The drop is mainly because of the bank nonperforming loans (8th) and infl ation (37th) indicators. It also fi nishes in the top ten for the governance (3rd) indicator.
With interest rates being in negative territory for the third year in a row, thus resulting in an indicator score of 1%, this also puts a ceiling on its potential sub-index performance.
3
80%32020 2020
2018
20193
3 2018
201980%
80%
RANKING SCORE
GLOBAL RETIREMENT INDEX
HEALTH
QUALITY OF LIFE
MATERIAL WELLBEING
FINANCES IN RETIREMENT
Old-Age Dependency
Bank Non-Performing Loans
Inflation
Interest Rates
Tax Pressure
Government Indebtedness
Governance
91%
88%
88%
59%
40%
82%
87%
1%
16%
55%
93%
90%
88%
86%
59%
41%
87%
89%
1%
16%
57%
93%
90%
90%
87%
60%
42%
67%
96%
1%
21%
61%
93%
20182020 2019 2020 2019
SCORE CHANGESCORESSUB-INDEX ANDINDICATOR SCORES
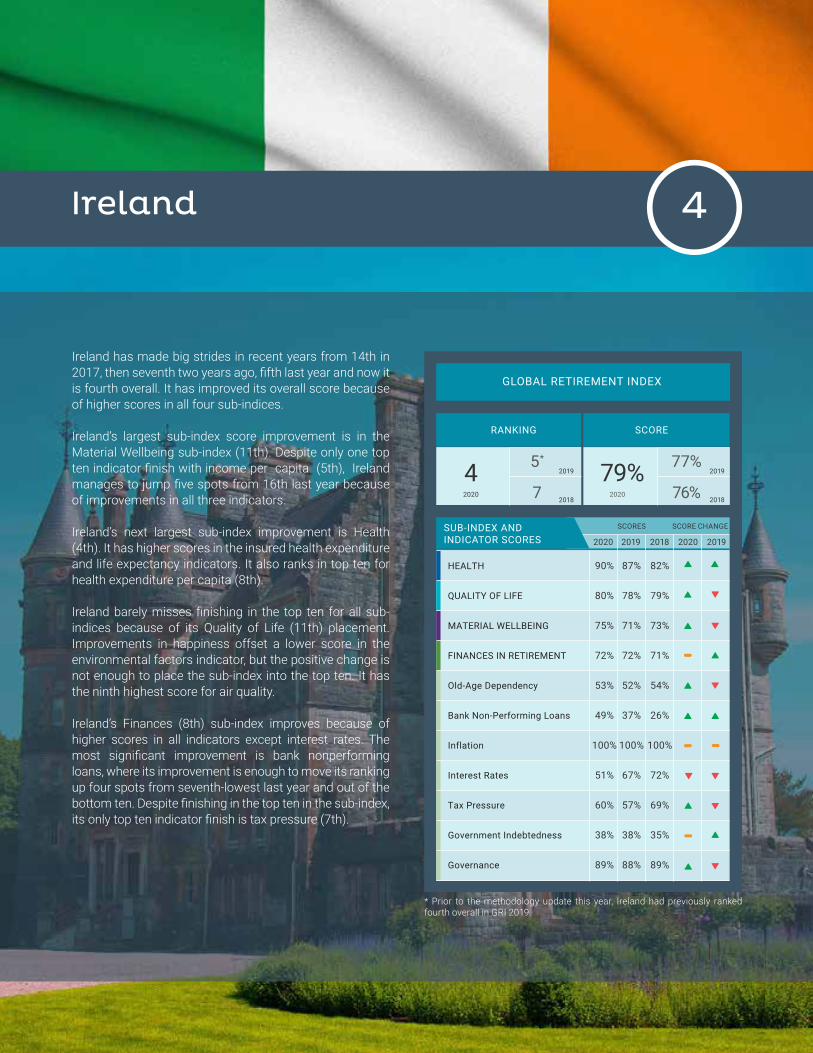
Global Retirement Index 2020 51
Ireland
Ireland has made big strides in recent years from 14th in 2017, then seventh two years ago, fi fth last year and now it is fourth overall. It has improved its overall score because of higher scores in all four sub-indices.
Ireland’s largest sub-index score improvement is in the Material Wellbeing sub-index (11th). Despite only one top ten indicator fi nish with income per capita (5th), Ireland manages to jump fi ve spots from 16th last year because of improvements in all three indicators.
Ireland’s next largest sub-index improvement is Health (4th). It has higher scores in the insured health expenditure and life expectancy indicators. It also ranks in top ten for health expenditure per capita (8th).
Ireland barely misses fi nishing in the top ten for all sub- indices because of its Quality of Life (11th) placement. Improvements in happiness offset a lower score in the environmental factors indicator, but the positive change is not enough to place the sub-index into the top ten. It has the ninth highest score for air quality.
Ireland’s Finances (8th) sub-index improves because of higher scores in all indicators except interest rates. The most signifi cant improvement is bank nonperforming loans, where its improvement is enough to move its ranking up four spots from seventh-lowest last year and out of the bottom ten. Despite fi nishing in the top ten in the sub-index, its only top ten indicator fi nish is tax pressure (7th).
4
79%42020 2020
2018
20195*
7 2018
201977%
76%
RANKING SCORE
GLOBAL RETIREMENT INDEX
HEALTH
QUALITY OF LIFE
MATERIAL WELLBEING
FINANCES IN RETIREMENT
Old-Age Dependency
Bank Non-Performing Loans
Inflation
Interest Rates
Tax Pressure
Government Indebtedness
Governance
90%
80%
75%
72%
53%
49%
100%
51%
60%
38%
89%
87%
78%
71%
72%
52%
37%
100%
67%
57%
38%
88%
82%
79%
73%
71%
54%
26%
100%
72%
69%
35%
89%
20182020 2019 2020 2019
SCORE CHANGESCORESSUB-INDEX ANDINDICATOR SCORES
* Prior to the methodology update this year, Ireland had previously ranked fourth overall in GRI 2019.

Global Retirement Index 2020 52
Netherlands
The Netherlands moves up fi ve spots this year to fi fth overall. Its overall score improves slightly from last year mainly because of improvements in the Quality of Life (9th), Health (8th) and Material Wellbeing (4th) sub-indices.
Within the Quality of Life sub-index, a signifi cant improvement in the environmental factors indicator led to the higher sub-index score. It has a top ten fi nish in happiness (6th), although its score for this indicator is lower compared to last year, and is third for water and sanitation.
Netherlands’ Health sub-index score improves because of a higher score in the insured health expenditure indicator (4th). Other top ten performances include health expenditure per capita (9th).
Netherlands’ ranking in Finance (27th) improves six places from last year even though there’s not much improvement in all indicators. It has modest improvements in tax pressure, government indebtedness and governance indicators but scores low in old-age dependency and bank nonperforming loan indicators.
However, its fi ve-year average for real interest rates being below zero results in an indicator score of 1% for the third year in a row.
5
77%52020 2020
2018
201910*
8 2018
201976%
76%
RANKING SCORE
GLOBAL RETIREMENT INDEX
HEALTH
QUALITY OF LIFE
MATERIAL WELLBEING
FINANCES IN RETIREMENT
Old-Age Dependency
Bank Non-Performing Loans
Inflation
Interest Rates
Tax Pressure
Government Indebtedness
Governance
88%
83%
83%
57%
32%
64%
100%
1%
15%
43%
92%
87%
80%
82%
57%
34%
67%
100%
1%
14%
43%
92%
90%
80%
80%
58%
35%
55%
100%
1%
21%
42%
92%
20182020 2019 2020 2019
SCORE CHANGESCORESSUB-INDEX ANDINDICATOR SCORES
* Prior to the methodology update this year, Netherlands had previously ranked 11th overall in 2019 and tenth overall in 2018.

Global Retirement Index 2020 53
New Zealand
New Zealand ranks sixth again this year. It improves in the Material Wellbeing (25th), Health (17th), and Quality of Life (8th) sub-indices and has a lower score in Finances (2nd).
New Zealand has a higher score in the Material Wellbeing sub-index mainly because of the employment indicator (14th). None of its indicators make the top ten.
New Zealand also improves in both the Quality of Life (8th) and Health (17th) sub-indices. It improves in the happiness and environmental factors indicators, where it ranks eighth for both among all GRI countries, and also lands in the top ten for air quality (5th). The improvement in the Health sub-index is mainly due to insured health expenditure, where it ranks ninth.
New Zealand has a modest drop in its score for the Finances sub-index. This is New Zealand’s highest-ranked sub-index, and it has multiple top ten fi nishes with governance (1st), bank nonperforming loans (4th), government indebtedness (6th) and interest rates (9th) all ranking at or near the top of the pack. However, the fi rst four indicators mentioned, along with old-age dependency, are also the reason for its decline in the sub-index since these indicators have lower scores compared to last year.
6
77%62020 2020
2018
20196*
5 2018
201976%
77%
RANKING SCORE
GLOBAL RETIREMENT INDEX
HEALTH
QUALITY OF LIFE
MATERIAL WELLBEING
FINANCES IN RETIREMENT
Old-Age Dependency
Bank Non-Performing Loans
Inflation
Interest Rates
Tax Pressure
Government Indebtedness
Governance
84%
83%
64%
78%
45%
92%
100%
76%
31%
62%
93%
83%
83%
62%
79%
47%
96%
100%
76%
30%
67%
94%
85%
83%
63%
79%
48%
84%
100%
79%
36%
65%
94%
20182020 2019 2020 2019
SCORE CHANGESCORESSUB-INDEX ANDINDICATOR SCORES
* Prior to the methodology update this year, New Zealand had previously ranked fi fth overall in GRI 2019.

Global Retirement Index 2020 54
Australia
Australia remains at seventh overall in this year’s GRI. It has a higher overall score because of higher scores in the Health (10th) and Quality of Life (15th) sub-indices.
Australia’s largest improvement is in the Health sub-index. The positive change is due to a higher score in the insured health expenditure. It has a top ten fi nish in the life expectancy (8th) indicator.
Australia also improves in the Quality of Life sub-index. It has higher scores in both the happiness and environmental factors indicators. It has the sixth-highest score among all GRI countries for air quality but also has the seventh-lowest score for environmental factors.
Australia drops in the Material Wellbeing (22nd) sub-index because of lower scores in the income equality and employment indicators. Australia is squarely in the middle of the pack for this sub-index; none of its indicators fi nish in the top or bottom ten.
Australia’s highest-ranked sub-index is Finances (3rd). Scores for the bank nonperforming loans, interest rates, old-age dependency and government indebtedness indicators all drop compared to last year. Top ten fi nishes include interest rates (7th) and bank nonperforming loans (10th) despite lower scores in both indicators.
7
76%72020 2020
2018
20197*
6 2018
201976%
76%
RANKING SCORE
GLOBAL RETIREMENT INDEX
HEALTH
QUALITY OF LIFE
MATERIAL WELLBEING
FINANCES IN RETIREMENT
Old-Age Dependency
Bank Non-Performing Loans
Inflation
Interest Rates
Tax Pressure
Government Indebtedness
Governance
87%
77%
65%
77%
46%
78%
100%
80%
43%
52%
91%
85%
77%
66%
77%
46%
82%
100%
82%
40%
53%
90%
85%
79%
66%
78%
48%
72%
100%
83%
52%
55%
90%
20182020 2019 2020 2019
SCORE CHANGESCORESSUB-INDEX ANDINDICATOR SCORES
* Prior to the methodology update this year, Australia had previously ranked ninth overall in GRI 2019.

Global Retirement Index 2020 55
Canada
Canada has a lower overall score compared to last year but the same ranking at eighth. It has lower scores in the Material Wellbeing (21st), Finances (9th) and Health (11th) sub-indices.
Canada has a lower score in the Material Wellbeing sub-index because of lower scores in the income equality and employment indicators. None of its indicators make the top or bottom ten.
Canada drops in the Finances in Retirment sub-index because of lower scores in almost all indicators, with the only exception being the infl ation indicator. Despite the lower sub-index score, Finances is still Canada’s highest-ranked sub-index. It has top ten fi nishes in bank nonperforming loans (3rd) and governance (10th).
Canada has a lower score in the Health (11th) sub-index because of a lower score in the life expectancy indicator. None of its indicators make the top or bottom ten.
Canada’s largest sub-index improvement is for Quality of Life (16th). It has higher scores in the environmental factors, biodiversity and happiness indicators. It has the seventh-highest ranking for the air quality indicator but also the eighth-lowest score for the biodiversity indicator.
8
75%82020 2020
2018
20198
10*2018
201976%
75%
RANKING SCORE
GLOBAL RETIREMENT INDEX
HEALTH
QUALITY OF LIFE
MATERIAL WELLBEING
FINANCES IN RETIREMENT
Old-Age Dependency
Bank Non-Performing Loans
Inflation
Interest Rates
Tax Pressure
Government Indebtedness
Governance
86%
77%
66%
72%
41%
97%
100%
65%
30%
28%
91%
87%
76%
68%
73%
42%
100%
100%
67%
31%
29%
92%
87%
78%
65%
74%
44%
85%
100%
70%
38%
29%
92%
20182020 2019 2020 2019
SCORE CHANGESCORESSUB-INDEX ANDINDICATOR SCORES
* Prior to the methodology update this year, Canada had previously ranked ninth overall in GRI 2018.
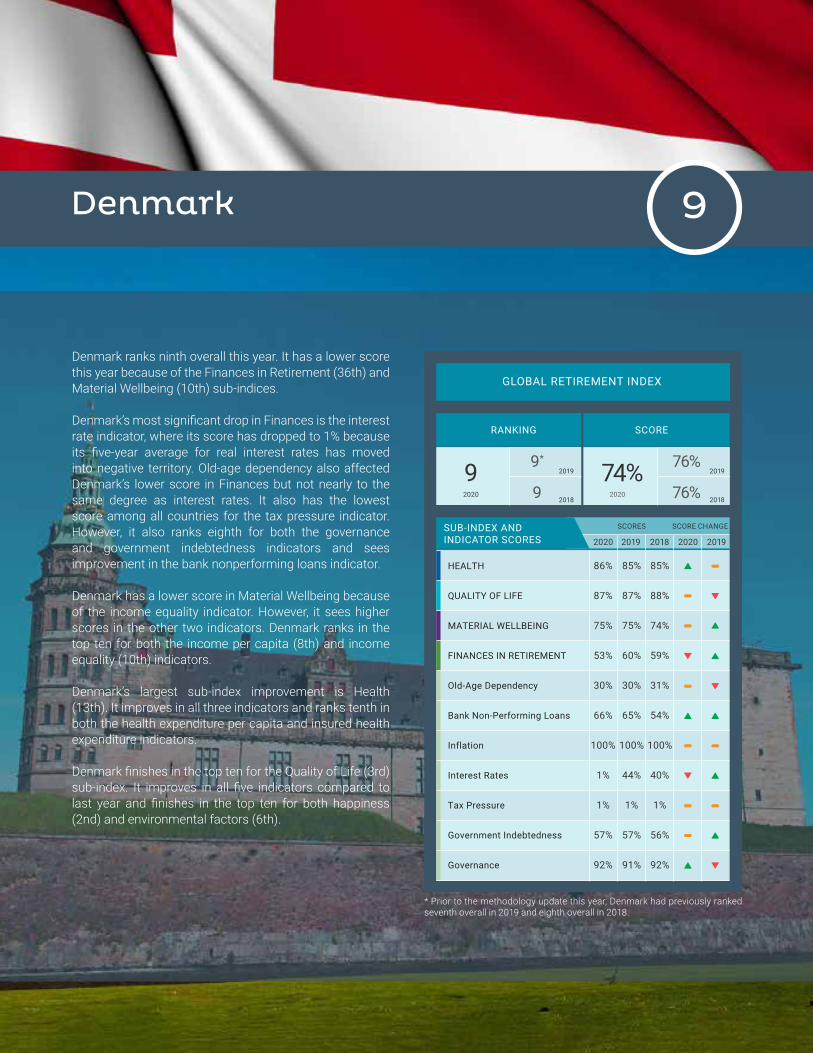
Global Retirement Index 2020 56
Denmark
Denmark ranks ninth overall this year. It has a lower score this year because of the Finances in Retirement (36th) and Material Wellbeing (10th) sub-indices.
Denmark’s most signifi cant drop in Finances is the interest rate indicator, where its score has dropped to 1% because its fi ve-year average for real interest rates has moved into negative territory. Old-age dependency also affected Denmark’s lower score in Finances but not nearly to the same degree as interest rates. It also has the lowest score among all countries for the tax pressure indicator. However, it also ranks eighth for both the governance and government indebtedness indicators and sees improvement in the bank nonperforming loans indicator.
Denmark has a lower score in Material Wellbeing because of the income equality indicator. However, it sees higher scores in the other two indicators. Denmark ranks in the top ten for both the income per capita (8th) and income equality (10th) indicators.
Denmark’s largest sub-index improvement is Health (13th). It improves in all three indicators and ranks tenth in both the health expenditure per capita and insured health expenditure indicators. Denmark fi nishes in the top ten for the Quality of Life (3rd) sub-index. It improves in all fi ve indicators compared to last year and fi nishes in the top ten for both happiness (2nd) and environmental factors (6th).
9
74%92020 2020
2018
20199*
9 2018
201976%
76%
RANKING SCORE
GLOBAL RETIREMENT INDEX
HEALTH
QUALITY OF LIFE
MATERIAL WELLBEING
FINANCES IN RETIREMENT
Old-Age Dependency
Bank Non-Performing Loans
Inflation
Interest Rates
Tax Pressure
Government Indebtedness
Governance
86%
87%
75%
53%
30%
66%
100%
1%
1%
57%
92%
85%
87%
75%
60%
30%
65%
100%
44%
1%
57%
91%
85%
88%
74%
59%
31%
54%
100%
40%
1%
56%
92%
20182020 2019 2020 2019
SCORE CHANGESCORESSUB-INDEX ANDINDICATOR SCORES
* Prior to the methodology update this year, Denmark had previously ranked seventh overall in 2019 and eighth overall in 2018.

Global Retirement Index 2020 57
Germany
Germany ranks tenth in this year’s GRI. Its higher overall score compared to last year is due to higher scores in the Quality of Life (12th), Health (12th) and Finances (28th) sub-indices.
Germany improves in the Quality of Life (12th) sub-index because of higher scores in almost all indicators. It makes the top ten for both the biodiversity (3rd) and water and sanitation (9th) indicators.
Health (12th) also sees a score improvement compared to last year. It makes the top ten and has higher scores in both the insured health expenditure (7th) and health expenditure per capita (5th) indicators.
Germany’s last sub-index score to improve is Finances (28th). It has higher scores in the government indebtedness, bank nonperforming loans, tax pressure and governance indicators. It places in the bottom ten for the old-age dependency indicator, where its score ranks sixth lowest among all GRI countries.
Its fi ve-year average for real interest rates continuing to be below zero also holds back its sub-index score.
Germany has a lower score compared to last year because of the income equality indicator. All the same, Material Wellbeing is still Germany’s highest ranked sub-index because of solid indicator rankings across the board. None of its indicators rank in the bottom ten and it places in the top ten for both the employment (4th) and income per capita (10th) indicators.
10
74%102020 2020
2018
201913
13 2018
201974%
74%
RANKING SCORE
GLOBAL RETIREMENT INDEX
HEALTH
QUALITY OF LIFE
MATERIAL WELLBEING
FINANCES IN RETIREMENT
Old-Age Dependency
Bank Non-Performing Loans
Inflation
Interest Rates
Tax Pressure
Government Indebtedness
Governance
86%
80%
78%
56%
26%
73%
100%
1%
18%
41%
90%
85%
78%
79%
56%
26%
72%
100%
1%
17%
40%
90%
86%
79%
79%
57%
27%
62%
100%
1%
24%
39%
90%
20182020 2019 2020 2019
SCORE CHANGESCORESSUB-INDEX ANDINDICATOR SCORES

Global Retirement Index 2020 58
Sweden
Sweden moves down seven spots from last year to 11th this year and out of the top ten. A signifi cant drop in its Finances in Retirement (30th) sub-index score along with a comparatively smaller drop in Material Wellbeing (17th) resulted in the steep drop in overall score.
Within Finances, the most signifi cant contributor to Sweden’s lower sub-index score is the interest rate indicator. With its fi ve-year average for real interest rates moving into negative territory, its indicator score dropped from 55% to 1% and brought down the average performance of the rest of the sub-index. Comparatively smaller score declines in bank nonperforming loans, old-age dependency and governance also brought down Sweden’s placement. While Sweden has some very good indicator fi nishes, such as ranking in the top ten for both bank nonperforming loans (5th) and governance (6th), it also has the fourth-lowest score for tax pressure and the eighth-lowest score for old-age dependency among all GRI countries.
Sweden’s other sub-index to see a lower score compared to last year is Material Wellbeing. It has lower scores in both the employment and income equality indicators. It has a top ten placement in the income equality indicator with a ranking of 8th.
Sweden has a higher score in the Quality of Life (4th) sub-index because of improvements in all indicators. It has multiple top ten fi nishes by ranking fi rst in air quality, second in environmental factors and seventh in happiness.
Sweden’s other sub-index improvement is Health (7th). It has higher scores in all three indicators and has the sixth highest score for health expenditure per capita.
11
74%112020 2020
2018
20194*
4 2018
201977%
78%
RANKING SCORE
GLOBAL RETIREMENT INDEX
HEALTH
QUALITY OF LIFE
MATERIAL WELLBEING
FINANCES IN RETIREMENT
Old-Age Dependency
Bank Non-Performing Loans
Inflation
Interest Rates
Tax Pressure
Government Indebtedness
Governance
89%
87%
69%
56%
27%
89%
100%
1%
4%
53%
92%
88%
86%
72%
65%
28%
96%
100%
55%
3%
53%
92%
89%
87%
71%
67%
29%
71%
100%
61%
7%
54%
92%
20182020 2019 2020 2019
SCORE CHANGESCORESSUB-INDEX ANDINDICATOR SCORES
* Prior to the methodology update this year, Sweden had previously ranked sixth overall in GRI 2019.

Global Retirement Index 2020 59
Austria
Austria moves up to 12th in this year’s GRI after ranking 14th last year. It improves its overall score because of improvements in all four sub-indices.
Austria has a higher Health (14th) sub-index score because of improvements in all three indicators. It makes the top ten for health expenditure per capita, where it ranks seventh among all GRI countries.
Austria also improves in the Finances in Retirement (34th) sub-index. Its sub-index ranking moves out of the bottom ten because of higher scores in all indicators except infl ation and interest rates, whose scores remain at 100% and 1% respectively. Improvements in the tax pressure indicator, which ranks seventh lowest, would help boost their sub-index score.
Austria has a better placement in the Material Wellbeing (8th) sub-index because of higher scores in the employment and income per capita indicators. Austria’s highest ranked sub-index, Material Wellbeing has two top ten fi nishesin the form of income equality (10th) and income per capita (9th).
Austria’s last sub-index improvement is Quality of Life (10th). It has lower scores in both the environmental factors and water and sanitation indicators. It ranks ninth in both the happiness and environmental factors indicators.
12
73%122020 2020
2018
201914*
14 2018
201973%
73%
RANKING SCORE
GLOBAL RETIREMENT INDEX
HEALTH
QUALITY OF LIFE
MATERIAL WELLBEING
FINANCES IN RETIREMENT
Old-Age Dependency
Bank Non-Performing Loans
Inflation
Interest Rates
Tax Pressure
Government Indebtedness
Governance
85%
82%
76%
55%
35%
67%
100%
1%
8%
34%
89%
84%
82%
75%
54%
34%
65%
100%
1%
6%
33%
89%
86%
82%
76%
54%
35%
55%
100%
1%
7%
32%
89%
20182020 2019 2020 2019
SCORE CHANGESCORESSUB-INDEX ANDINDICATOR SCORES
* Prior to the methodology update this year, Austria had previously ranked 15th overall in GRI 2019.

Global Retirement Index 2020 60
Luxembourg
Luxembourg ranks 13th in this year’s GRI. It has a lower score than last year because of the Material Wellbeing (20th) and Health (3rd) sub-indices.
Luxembourg has a lower score in the Material Wellbeing sub-index because of lower scores in the income equality and employment indicators. It has the second-highest score among all GRI countries for the income per capita indicator.
Luxembourg has one of the highest scores for the Health (3rd) sub-index among all GRI countries despite a lower score compared to last year. Two indicators place in the top ten, with insured health expenditure ranking second and health expenditure per capita ranking fourth. It has lower scores in both the health expenditure per capita and life expectancy indicators.
Luxembourg improves in the Quality of Life (13th) sub-index. It has a higher score in the happiness indicator, where it ranks tenth, and also places in the top ten for biodiversity (8th). It also improves in both the air quality and water and sanitation indicators. An area for improvement is environmental factors, where it has the tenth-lowest score among all GRI countries.
Luxembourg’s other improvement is the Finances in Retirement (23rd) sub-index. It has higher scores in the old-age dependency, bank nonperforming loans and governance indicators. It has multiple top ten fi nishes including government indebtedness (3rd), governance (5th) and bank nonperforming loans (7th).
However, its fi ve-year average for real interest rates continuing to remain below zero results in an indicator score of only 1% for the third year in a row.
13
73%132020 2020
2018
201911*
12 2018
201975%
75%
RANKING SCORE
GLOBAL RETIREMENT INDEX
HEALTH
QUALITY OF LIFE
MATERIAL WELLBEING
FINANCES IN RETIREMENT
Old-Age Dependency
Bank Non-Performing Loans
Inflation
Interest Rates
Tax Pressure
Government Indebtedness
Governance
90%
79%
68%
60%
56%
84%
100%
1%
15%
71%
92%
91%
78%
74%
60%
55%
83%
100%
1%
18%
71%
92%
92%
75%
73%
62%
56%
100%
100%
1%
24%
73%
92%
20182020 2019 2020 2019
SCORE CHANGESCORESSUB-INDEX ANDINDICATOR SCORES
* Prior to the methodology update this year, Luxembourg had previously ranked tenth overall in 2019 and 11th overall in 2018.
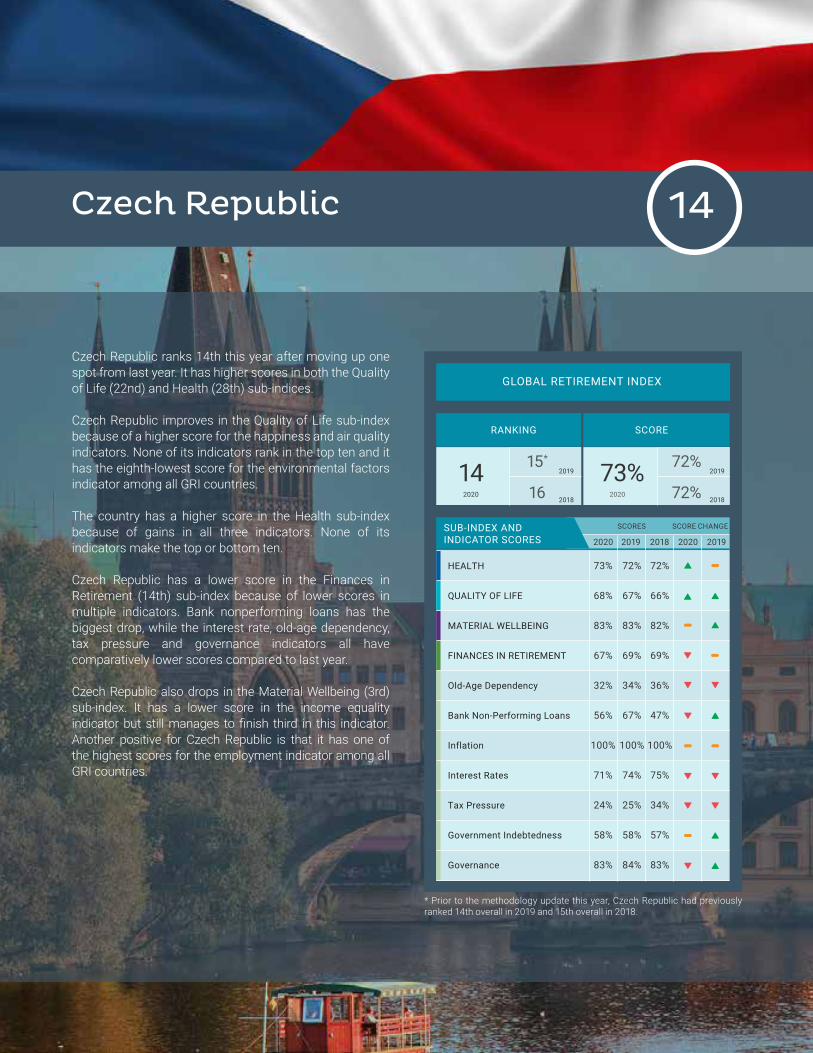
Global Retirement Index 2020 61
v
Czech Republic
Czech Republic ranks 14th this year after moving up one spot from last year. It has higher scores in both the Quality of Life (22nd) and Health (28th) sub-indices.
Czech Republic improves in the Quality of Life sub-index because of a higher score for the happiness and air quality indicators. None of its indicators rank in the top ten and it has the eighth-lowest score for the environmental factors indicator among all GRI countries.
The country has a higher score in the Health sub-index because of gains in all three indicators. None of its indicators make the top or bottom ten.
Czech Republic has a lower score in the Finances in Retirement (14th) sub-index because of lower scores in multiple indicators. Bank nonperforming loans has the biggest drop, while the interest rate, old-age dependency, tax pressure and governance indicators all have comparatively lower scores compared to last year.
Czech Republic also drops in the Material Wellbeing (3rd) sub-index. It has a lower score in the income equality indicator but still manages to fi nish third in this indicator. Another positive for Czech Republic is that it has one ofthe highest scores for the employment indicator among all GRI countries.
14
73%142020 2020
2018
201915*
16 2018
201972%
72%
RANKING SCORE
GLOBAL RETIREMENT INDEX
HEALTH
QUALITY OF LIFE
MATERIAL WELLBEING
FINANCES IN RETIREMENT
Old-Age Dependency
Bank Non-Performing Loans
Inflation
Interest Rates
Tax Pressure
Government Indebtedness
Governance
73%
68%
83%
67%
32%
56%
100%
71%
24%
58%
83%
72%
67%
83%
69%
34%
67%
100%
74%
25%
58%
84%
72%
66%
82%
69%
36%
47%
100%
75%
34%
57%
83%
20182020 2019 2020 2019
SCORE CHANGESCORESSUB-INDEX ANDINDICATOR SCORES
* Prior to the methodology update this year, Czech Republic had previously ranked 14th overall in 2019 and 15th overall in 2018.

Global Retirement Index 2020 62
Finland
Finland ranks 15th this year after falling three spots from last year. It has a lower overall score because of a lower score in the Finances in Retirement (31st) sub-index.
Finland’s lower Finances score is mainly due to a signifi cant drop in its score for the real interest rates indicator. Since its fi ve-year average for real interest rates moved from positive to negative territory, its indicator score decreased from 45% to 1%. It also has slightly lower scores in the bank nonperforming loans, old-age dependency, government indebtedness, and governance indicators. Its score for governance (4th) is among the best in the GRI but it has some improvements to make in other indicators. The old- age dependency (42nd) and tax pressure (40th) indicators both rank in the bottom ten among all GRI countries.
Finland has a higher score in the Material Wellbeing (18th) sub-index because of higher scores in the employment and income per capita indicators. It has a top ten fi nish in the income equality indicator by ranking seventh.
Finland improves its score in the Quality of Life (1st) sub-index. It has a higher score compared to last year for both the environmental factors and water and sanitation indicators. Finland has some of the best indicator rankings among all GRI countries with the happiness (1st), air quality (3rd) and water and sanitation (4th) all fi nishing in the top fi ve.
Finland ranks 19th in the Health sub-index for the second year in a row. It has a higher score in the insured health expenditure indicator and lower scores in the life expectancy and health expenditure per capita indicators. None of its indicators make the top or bottom ten.
15
73%152020 2020
2018
201912
11*2018
201975%
75%
RANKING SCORE
GLOBAL RETIREMENT INDEX
HEALTH
QUALITY OF LIFE
MATERIAL WELLBEING
FINANCES IN RETIREMENT
Old-Age Dependency
Bank Non-Performing Loans
Inflation
Interest Rates
Tax Pressure
Government Indebtedness
Governance
83%
89%
68%
55%
22%
70%
100%
1%
5%
40%
93%
83%
88%
68%
62%
24%
74%
100%
45%
3%
41%
93%
81%
89%
69%
63%
26%
61%
100%
36%
6%
41%
92%
20182020 2019 2020 2019
SCORE CHANGESCORESSUB-INDEX ANDINDICATOR SCORES
* Prior to the methodology update this year, Finland had previously ranked 12th overall in GRI 2018.
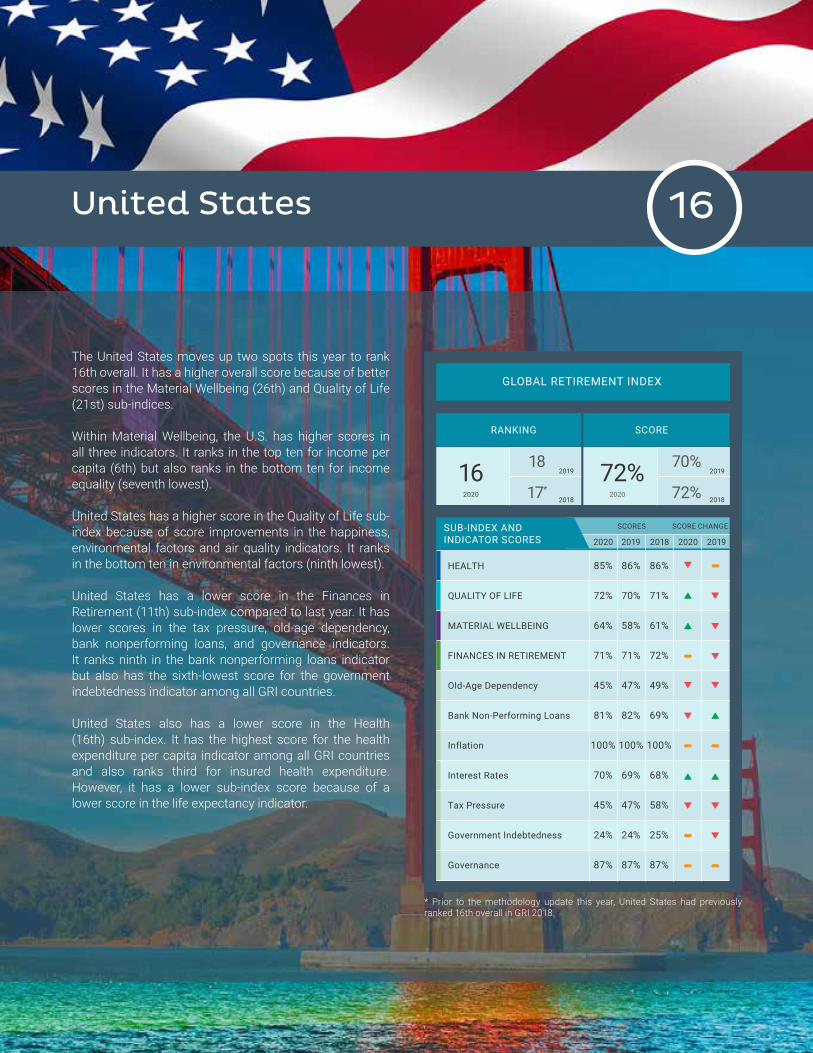
Global Retirement Index 2020 63
United States
The United States moves up two spots this year to rank 16th overall. It has a higher overall score because of better scores in the Material Wellbeing (26th) and Quality of Life (21st) sub-indices.
Within Material Wellbeing, the U.S. has higher scores in all three indicators. It ranks in the top ten for income per capita (6th) but also ranks in the bottom ten for income equality (seventh lowest).
United States has a higher score in the Quality of Life sub-index because of score improvements in the happiness, environmental factors and air quality indicators. It ranks in the bottom ten in environmental factors (ninth lowest).
United States has a lower score in the Finances in Retirement (11th) sub-index compared to last year. It has lower scores in the tax pressure, old-age dependency, bank nonperforming loans, and governance indicators. It ranks ninth in the bank nonperforming loans indicator but also has the sixth-lowest score for the government indebtedness indicator among all GRI countries.
United States also has a lower score in the Health (16th) sub-index. It has the highest score for the health expenditure per capita indicator among all GRI countries and also ranks third for insured health expenditure. However, it has a lower sub-index score because of a lower score in the life expectancy indicator.
16
72%162020 2020
2018
201918
17*2018
201970%
72%
RANKING SCORE
GLOBAL RETIREMENT INDEX
HEALTH
QUALITY OF LIFE
MATERIAL WELLBEING
FINANCES IN RETIREMENT
Old-Age Dependency
Bank Non-Performing Loans
Inflation
Interest Rates
Tax Pressure
Government Indebtedness
Governance
85%
72%
64%
71%
45%
81%
100%
70%
45%
24%
87%
86%
70%
58%
71%
47%
82%
100%
69%
47%
24%
87%
86%
71%
61%
72%
49%
69%
100%
68%
58%
25%
87%
20182020 2019 2020 2019
SCORE CHANGESCORESSUB-INDEX ANDINDICATOR SCORES
* Prior to the methodology update this year, United States had previously ranked 16th overall in GRI 2018.

Global Retirement Index 2020 64
United Kingdom
The U.K. falls one spot to 17th. It has a slightly lower overall score because of lower scores in the Material Wellbeing (19th) and Finances in Retirement (29th) sub-indices.
The U.K. falls in Material Wellbeing because of a lower score in the income equality indicator. It registers improvements in the other two indicators. None of its indicators rank in the top or bottom ten.
Within Finances, the U.K. has a lower sub-index score because of lower scores in the bank nonperforming loans, government indebtedness and governance indicators. None of its Finances indicators make the top or bottom ten.
Its fi ve-year average for real interest rates is also in negative territory, resulting in an indicator score of 1% for the third year in a row.
The U.K. has a higher score in the Quality of Life (7th) sub-index. In this, its highest ranked sub-index, the U.K. sees improvements in the environmental factors, happiness and water and sanitation indicators. It has multiple top ten indicator fi nishes by ranking fi rst in water and sanitation, fourth in biodiversity and tenth for both environmental factors and air quality.
The U.K. also improves in the Health (18th) sub-index because of higher scores in both the insured health expenditure and life expectancy indicators. None of its indicators make the top or bottom ten.
17
72%172020 2020
2018
201916*
15 2018
201972%
72%
RANKING SCORE
GLOBAL RETIREMENT INDEX
HEALTH
QUALITY OF LIFE
MATERIAL WELLBEING
FINANCES IN RETIREMENT
Old-Age Dependency
Bank Non-Performing Loans
Inflation
Interest Rates
Tax Pressure
Government Indebtedness
Governance
83%
84%
68%
56%
34%
76%
100%
1%
28%
30%
88%
83%
81%
69%
56%
34%
77%
100%
1%
27%
30%
88%
83%
80%
71%
57%
35%
72%
100%
1%
37%
31%
89%
20182020 2019 2020 2019
SCORE CHANGESCORESSUB-INDEX ANDINDICATOR SCORES
* Prior to the methodology update this year, the U.K. had previously ranked 17th overall in both 2019 and 2018.
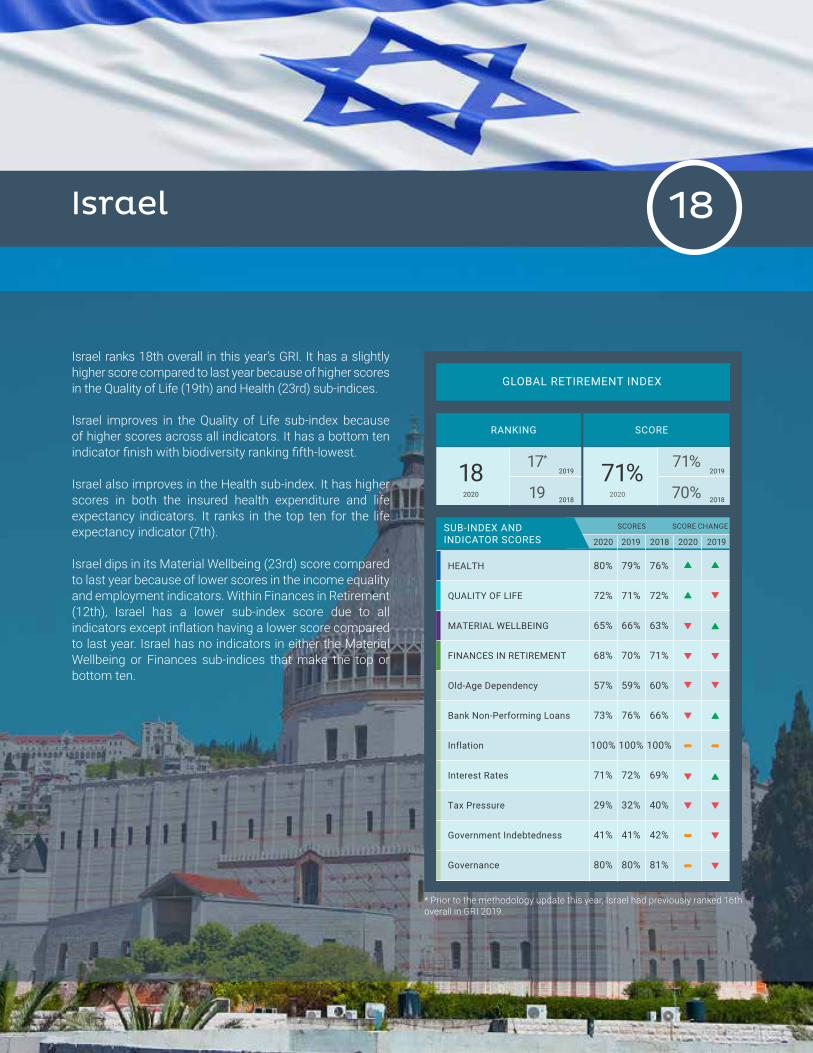
Global Retirement Index 2020 65
Israel
Israel ranks 18th overall in this year’s GRI. It has a slightly higher score compared to last year because of higher scores in the Quality of Life (19th) and Health (23rd) sub-indices.
Israel improves in the Quality of Life sub-index because of higher scores across all indicators. It has a bottom ten indicator fi nish with biodiversity ranking fi fth-lowest.
Israel also improves in the Health sub-index. It has higher scores in both the insured health expenditure and life expectancy indicators. It ranks in the top ten for the life expectancy indicator (7th).
Israel dips in its Material Wellbeing (23rd) score compared to last year because of lower scores in the income equality and employment indicators. Within Finances in Retirement (12th), Israel has a lower sub-index score due to all indicators except infl ation having a lower score compared to last year. Israel has no indicators in either the Material Wellbeing or Finances sub-indices that make the top or bottom ten.
18
71%182020 2020
2018
201917*
19 2018
201971%
70%
RANKING SCORE
GLOBAL RETIREMENT INDEX
HEALTH
QUALITY OF LIFE
MATERIAL WELLBEING
FINANCES IN RETIREMENT
Old-Age Dependency
Bank Non-Performing Loans
Inflation
Interest Rates
Tax Pressure
Government Indebtedness
Governance
80%
72%
65%
68%
57%
73%
100%
71%
29%
41%
80%
79%
71%
66%
70%
59%
76%
100%
72%
32%
41%
80%
76%
72%
63%
71%
60%
66%
100%
69%
40%
42%
81%
20182020 2019 2020 2019
SCORE CHANGESCORESSUB-INDEX ANDINDICATOR SCORES
* Prior to the methodology update this year, Israel had previously ranked 16th overall in GRI 2019.

Global Retirement Index 2020 66
Slovenia
Slovenia moves up two spots to 19th overall in this year’s GRI. It improves its overall score compared to last year because of higher scores in the Material Wellbeing (6th), Quality of Life (24th) and Health (24th) sub-indices.
Slovenia has a higher score in the Material Wellbeing (6th) sub-index this year because of higher scores in the employment and income per capita indicators. Slovenia has the second-highest score for the income equality indicator among all GRI countries.
Slovenia improves in the Quality of Life sub-index because of a higher score in the happiness indicator. It has the second-highest biodiversity score among all GRI countries.
Slovenia improves in the Health sub-index because of higher scores in the insured health expenditure and health expenditure per capita. It has the sixth-highest score among all countries for the insured health expenditure indicator.
Finances in Retirement (21st) sees Slovenia’s largest drop in sub-index score. The interest rate and bank nonperforming loans are the largest falls in indicator scores, followed by a more muted score dip in the old-age dependency indicator. None of its indicators make the top or bottom ten.
19
71%192020 2020
2018
201921*
24 2018
201969%
68%
RANKING SCORE
GLOBAL RETIREMENT INDEX
HEALTH
QUALITY OF LIFE
MATERIAL WELLBEING
FINANCES IN RETIREMENT
Old-Age Dependency
Bank Non-Performing Loans
Inflation
Interest Rates
Tax Pressure
Government Indebtedness
Governance
80%
67%
77%
62%
32%
51%
100%
37%
21%
37%
83%
79%
63%
72%
65%
34%
68%
100%
70%
18%
35%
83%
79%
60%
69%
65%
37%
44%
100%
74%
25%
34%
83%
20182020 2019 2020 2019
SCORE CHANGESCORESSUB-INDEX ANDINDICATOR SCORES
* Prior to the methodology update this year, Slovenia had previously ranked 19th overall in 2019 and 23rd overall in 2018.
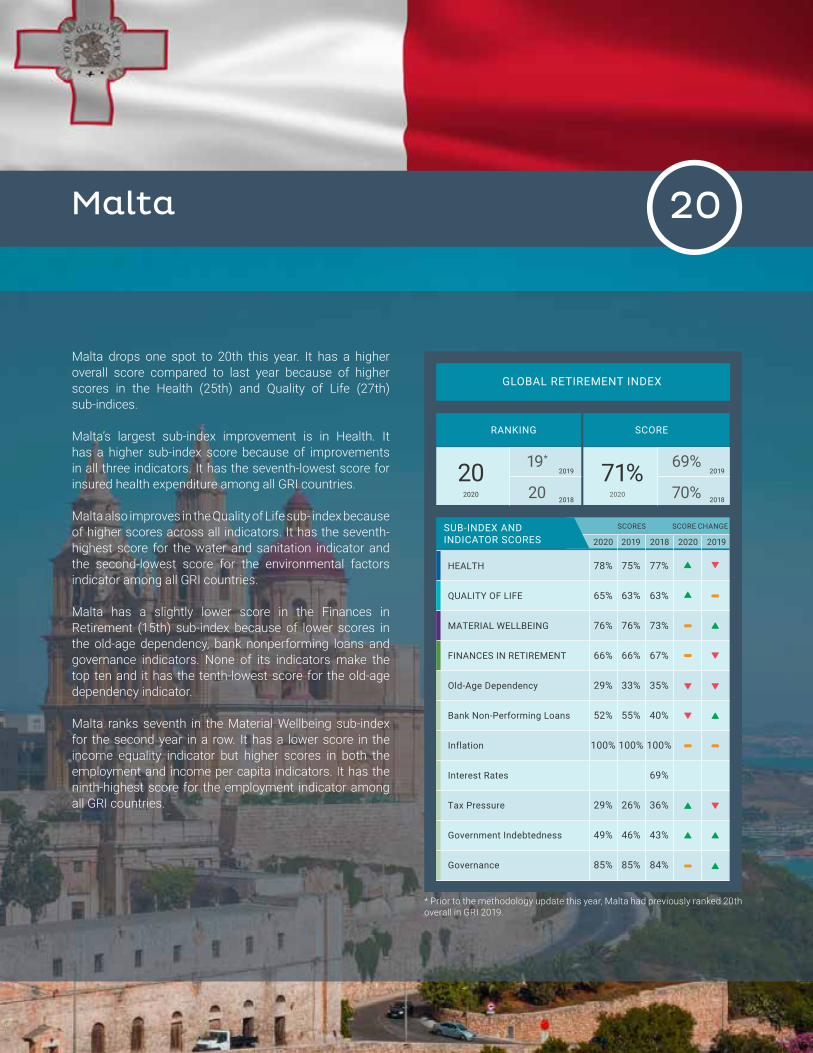
Global Retirement Index 2020 67
Malta
Malta drops one spot to 20th this year. It has a higher overall score compared to last year because of higher scores in the Health (25th) and Quality of Life (27th) sub-indices.
Malta’s largest sub-index improvement is in Health. It has a higher sub-index score because of improvements in all three indicators. It has the seventh-lowest score for insured health expenditure among all GRI countries.
Malta also improves in the Quality of Life sub- index because of higher scores across all indicators. It has the seventh-highest score for the water and sanitation indicator and the second-lowest score for the environmental factors indicator among all GRI countries.
Malta has a slightly lower score in the Finances in Retirement (15th) sub-index because of lower scores in the old-age dependency, bank nonperforming loans and governance indicators. None of its indicators make the top ten and it has the tenth-lowest score for the old-age dependency indicator.
Malta ranks seventh in the Material Wellbeing sub-index for the second year in a row. It has a lower score in the income equality indicator but higher scores in both the employment and income per capita indicators. It has the ninth-highest score for the employment indicator among all GRI countries.
20
71%202020 2020
2018
201919*
20 2018
201969%
70%
RANKING SCORE
GLOBAL RETIREMENT INDEX
HEALTH
QUALITY OF LIFE
MATERIAL WELLBEING
FINANCES IN RETIREMENT
Old-Age Dependency
Bank Non-Performing Loans
Inflation
Interest Rates
Tax Pressure
Government Indebtedness
Governance
78%
65%
76%
66%
29%
52%
100%
29%
49%
85%
75%
63%
76%
66%
33%
55%
100%
26%
46%
85%
77%
63%
73%
67%
35%
40%
100%
69%
36%
43%
84%
20182020 2019 2020 2019
SCORE CHANGESCORESSUB-INDEX ANDINDICATOR SCORES
* Prior to the methodology update this year, Malta had previously ranked 20th overall in GRI 2019.

Global Retirement Index 2020 68
Belgium
Belgium moves down one spot to 21st this year. It has a higher overall score compared to last year because of higher scores in the Quality of Life (17th), Health (15th) and Material Wellbeing (12th) sub-indices.
Belgium has a higher score in the Material Wellbeing sub- index because of better performances in the employment and income per capita indicators. It fi nishes in the top ten for the income equality indicator with a ranking of sixth.
Belgium’s lower score in Finances in Retirement (39th) is due to multiple drops in indicators within the sub-index. The bank nonperforming loans, old-age dependency, tax pressure and government indebtedness indicators all have lower scores compared to last year. Both the tax pressure (third lowest) and government indebtedness (eighth lowest) indicators rank in the bottom ten.
Its fi ve-year average for real interest rates remaining below zero also means it only scores 1% in this indicator, thus holding back its sub-index performance.
Belgium has a higher score in the Quality of Life (17th) sub-index because of improvements in the environmental factors, happiness, water and sanitation, and air quality indicators. It has the ninth-highest score among all GRI countries for the biodiversity indicator.
Belgium also has a higher score in the Health (15th) sub- index. It improves in both the insured health expenditure and life expectancy indicators. None of its indicators make the top or bottom ten.
21
70%212020 2020
2018
201920*
18 2018
201969%
71%
RANKING SCORE
GLOBAL RETIREMENT INDEX
HEALTH
QUALITY OF LIFE
MATERIAL WELLBEING
FINANCES IN RETIREMENT
Old-Age Dependency
Bank Non-Performing Loans
Inflation
Interest Rates
Tax Pressure
Government Indebtedness
Governance
85%
76%
73%
51%
33%
62%
100%
1%
3%
25%
86%
83%
74%
73%
51%
34%
64%
100%
1%
3%
25%
86%
83%
75%
71%
59%
35%
50%
100%
46%
4%
25%
87%
20182020 2019 2020 2019
SCORE CHANGESCORESSUB-INDEX ANDINDICATOR SCORES
* Prior to the methodology update this year, Belgium had previously ranked 21st overall in GRI 2019.

Global Retirement Index 2020 69
Korea, Rep.
South Korea rises two spots to 22nd overall in this year’s GRI. It has a lower overall score compared to lastyear because of a lower score in the Material Wellbeing (27th) sub-index, despite higher scores in the rest of thesub-indices.
South Korea has a lower score in Material Wellbeing because of the income equality and employment indicators. None of its indicators rank in the top or bottom ten.
South Korea’s largest sub-index score improvement is Quality of Life (35th). It improves its scores in the environmental factors, happiness, water and sanitation and biodiversity indicators. However, the sub-index still ranks relatively low compared to other countries because of bottom ten fi nishes for environmental factors (sixth-lowest), happiness (seventh-lowest) and biodiversity (ninth-lowest).
South Korea’s next largest sub-index improvement is Health (27th) because of higher scores in all three indicators. It ranks tenth in the life expectancy indicator but has the ninth-lowest score for the insured health expenditure indicator.
South Korea’s last sub-index score improvement is Finances (6th). It improves in both the bank nonperforming loans and governance indicators. It has multiple top ten fi nishes by ranking fi rst in bank nonperforming loans and tenth in both the old-age dependency and tax pressure indicators.
22
68%222020 2020
2018
201924
21*2018
201969%
69%
RANKING SCORE
GLOBAL RETIREMENT INDEX
HEALTH
QUALITY OF LIFE
MATERIAL WELLBEING
FINANCES IN RETIREMENT
Old-Age Dependency
Bank Non-Performing Loans
Inflation
Interest Rates
Tax Pressure
Government Indebtedness
Governance
76%
60%
62%
75%
57%
100%
100%
71%
46%
52%
83%
72%
56%
74%
75%
60%
97%
100%
71%
46%
54%
82%
72%
56%
75%
76%
62%
85%
100%
74%
62%
57%
81%
20182020 2019 2020 2019
SCORE CHANGESCORESSUB-INDEX ANDINDICATOR SCORES
* Prior to the methodology update this year, South Korea had previously ranked 24th overall in GRI 2018.

Global Retirement Index 2020 70
Japan
Japan remains at 23rd overall in this year’s GRI. It has a lower overall score compared to last year because of lower scores in the Finances in Retirement (41st) and Material Wellbeing (16th) sub-indices.
Japan’s most signifi cant drop in Finances is the interest rate indicator, where its score has dropped to 1% because its fi ve-year average for real interest rates has moved into negative territory. It also has lower scores compared to last year in the bank nonperforming loans, old-age dependency and governance indicators. It has the lowest score among all GRI countries for both the government indebtedness and old-age dependency indicators.
Japan also has a lower score in the Material Wellbeing sub-index. Scores for both the income equality and income per capita indicators have gone down compared to last year. It has the highest score for the employment indicator among all GRI countries.
Japan improves in the Quality of Life sub-index because of higher scores in the happiness, environmental factors and water and sanitation indicators. It has the sixth-lowest score for the happiness indicator and none of its other indicators make the top or bottom ten.
Japan also has a higher score in the Health sub-index. It improves in the insured health expenditure indicator compared to last year. Japan makes the top ten in both the life expectancy (1st) and insured health expenditure (8th) indicators.
23
68%232020 2020
2018
201923
23*2018
201969%
69%
RANKING SCORE
GLOBAL RETIREMENT INDEX
HEALTH
QUALITY OF LIFE
MATERIAL WELLBEING
FINANCES IN RETIREMENT
Old-Age Dependency
Bank Non-Performing Loans
Inflation
Interest Rates
Tax Pressure
Government Indebtedness
Governance
91%
67%
70%
49%
5%
75%
100%
1%
35%
1%
88%
90%
64%
72%
55%
7%
79%
100%
49%
33%
1%
88%
88%
64%
75%
55%
8%
66%
100%
55%
38%
1%
88%
20182020 2019 2020 2019
SCORE CHANGESCORESSUB-INDEX ANDINDICATOR SCORES
* Prior to the methodology update this year, Japan had previously ranked 22nd overall in GRI 2018.

Global Retirement Index 2020 71
Estonia
Estonia moves up two spots to 24th this year. It has a higher overall score because of better scores in all four sub-indices.
Estonia has a higher score in the Quality of Life sub-index because of a higher score in the happiness and air quality indicators. Estonia’s higher score in the happiness indicator is enough to move it out of the bottom ten in this indicator, where it ranked ninth-lowest last year. It has the tenth-highest score for the biodiversity indicator but the tenth-lowest score for the water and sanitation indicator.
Estonia also improves in the Finances in Retirement sub-index. It has higher scores in the bank nonperforming loans, tax pressure and governance indicators. Both the government indebtedness (1st) and bank nonperforming loans (2nd) indicators fi nish in the top fi ve this year.
Estonia has a higher score in the Material Wellbeing (24th) sub-index because of higher scores in the income per capita and employment indicators. None of its indicators make the top or bottom ten. Estonia’s last sub-index improvement is Health. It has a higher sub-index score because of improvements in all three indicators. None of its indicators make the top or bottom ten.
24
67%242020 2020
2018
201926
27 2018
201965%
63%
RANKING SCORE
GLOBAL RETIREMENT INDEX
HEALTH
QUALITY OF LIFE
MATERIAL WELLBEING
FINANCES IN RETIREMENT
Old-Age Dependency
Bank Non-Performing Loans
Inflation
Interest Rates
Tax Pressure
Government Indebtedness
Governance
67%
65%
64%
74%
30%
99%
100%
28%
100%
87%
65%
61%
62%
71%
31%
74%
100%
23%
100%
86%
62%
58%
57%
75%
33%
77%
100%
73%
33%
100%
86%
20182020 2019 2020 2019
SCORE CHANGESCORESSUB-INDEX ANDINDICATOR SCORES

Global Retirement Index 2020 72
France
France moves down three spots to 25th in this year’s GRI. It has lower scores in the Finances (42nd) and Material Wellbeing (29th) sub-indices.
France’s largest drop is in the Finances in Retirement sub-index. France’s lower Finances score is mainly due to a signifi cant drop in its score for the real interest rates indicator. It also has lower scores in the old-age dependency, government indebtedness, bank nonperforming loans and tax pressure indicators. The tax pressure (lowest), old-age dependency (seventh lowest) and government indebtedness (ninth lowest) indicators all fi nish in the bottom ten. The governance indicator manages a slight improvement compared to last year.
France also has a lower score in the Material Wellbeing (29th) sub-index. It has lower scores in both the employment and income equality indicators. It has the seventh-lowest score for the employment indicator.
France’s largest sub-index improvement is the Quality of Life (14th) sub-index. It has a higher score in the sub-index because of better scores in the happiness, air quality and water and sanitation indicators. It makes the top ten in the biodiversity (5th) indicator.
France’s other sub-index improvement is Health (5th). It has a higher sub-index score because of a better score in the health expenditure per capita indicator. It has the highest score for the insured health expenditure indicator among all GRI countries.
25
67%252020 2020
2018
201922
22*2018
201969%
69%
RANKING SCORE
GLOBAL RETIREMENT INDEX
HEALTH
QUALITY OF LIFE
MATERIAL WELLBEING
FINANCES IN RETIREMENT
Old-Age Dependency
Bank Non-Performing Loans
Inflation
Interest Rates
Tax Pressure
Government Indebtedness
Governance
89%
78%
59%
49%
27%
57%
100%
1%
1%
26%
85%
89%
76%
61%
55%
28%
58%
100%
55%
1%
27%
85%
90%
75%
60%
57%
30%
49%
100%
58%
2%
28%
84%
20182020 2019 2020 2019
SCORE CHANGESCORESSUB-INDEX ANDINDICATOR SCORES
* Prior to the methodology update this year, France had previously ranked 21st overall in GRI 2018.
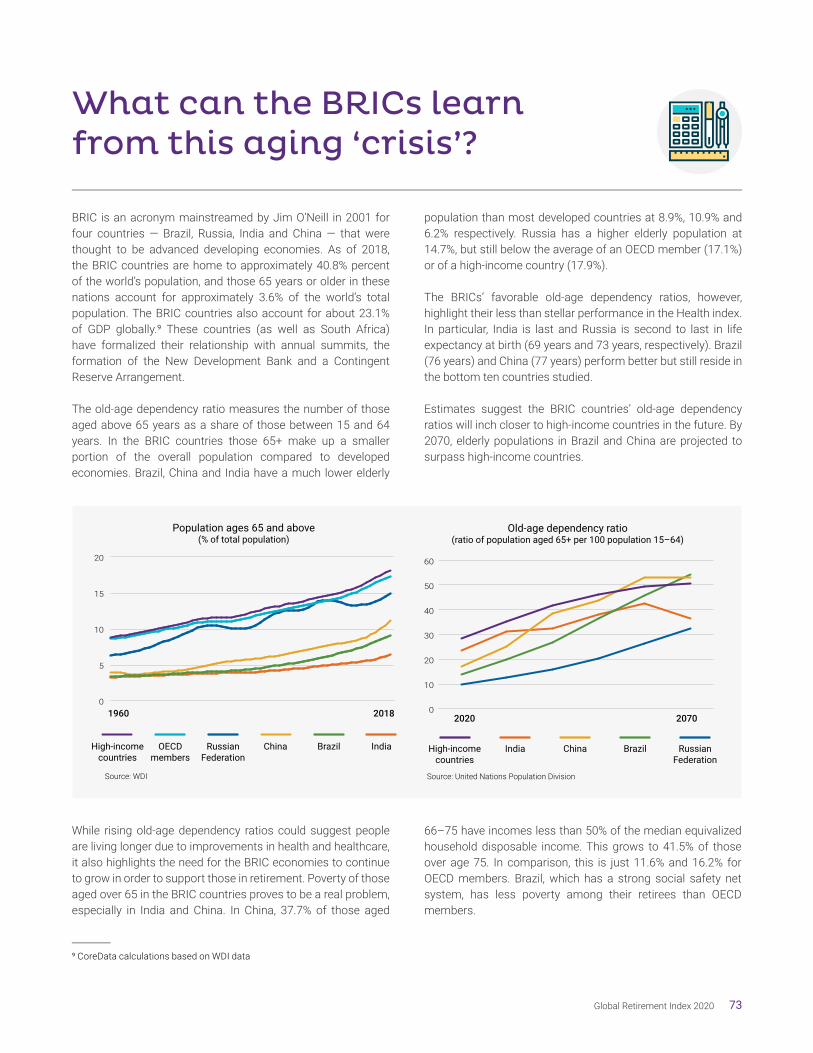
Global Retirement Index 2020 73
What can the BRICs learn from this aging ‘crisis’?
BRIC is an acronym mainstreamed by Jim O’Neill in 2001 for four countries — Brazil, Russia, India and China — that were thought to be advanced developing economies. As of 2018, the BRIC countries are home to approximately 40.8% percent of the world’s population, and those 65 years or older in these nations account for approximately 3.6% of the world’s total population. The BRIC countries also account for about 23.1% of GDP globally.9 These countries (as well as South Africa) have formalized their relationship with annual summits, the formation of the New Development Bank and a Contingent Reserve Arrangement.
The old-age dependency ratio measures the number of those aged above 65 years as a share of those between 15 and 64 years. In the BRIC countries those 65+ make up a smaller portion of the overall population compared to developed economies. Brazil, China and India have a much lower elderly
population than most developed countries at 8.9%, 10.9% and 6.2% respectively. Russia has a higher elderly population at 14.7%, but still below the average of an OECD member (17.1%) or of a high-income country (17.9%).
The BRICs’ favorable old-age dependency ratios, however, highlight their less than stellar performance in the Health index. In particular, India is last and Russia is second to last in life expectancy at birth (69 years and 73 years, respectively). Brazil (76 years) and China (77 years) perform better but still reside in the bottom ten countries studied.
Estimates suggest the BRIC countries’ old-age dependency ratios will inch closer to high-income countries in the future. By 2070, elderly populations in Brazil and China are projected to surpass high-income countries.
While rising old-age dependency ratios could suggest people are living longer due to improvements in health and healthcare, it also highlights the need for the BRIC economies to continue to grow in order to support those in retirement. Poverty of those aged over 65 in the BRIC countries proves to be a real problem, especially in India and China. In China, 37.7% of those aged
9 CoreData calculations based on WDI data
66–75 have incomes less than 50% of the median equivalized household disposable income. This grows to 41.5% of those over age 75. In comparison, this is just 11.6% and 16.2% for OECD members. Brazil, which has a strong social safety net system, has less poverty among their retirees than OECD members.
High-incomecountries
IndiaChina BrazilRussianFederation
OECDmembers
Population ages 65 and above(% of total population)
1960 20180
5
10
15
20
Source: WDI
0
10
20
30
40
50
60
2020 2070
High-incomecountries
India China Brazil RussianFederation
Old-age dependency ratio(ratio of population aged 65+ per 100 population 15–64)
Source: United Nations Population Division

Global Retirement Index 2020 74
Having a robust pension system in place will also help ease the demographic transition to an older population. From a pure pension asset perspective, Brazil has the most robust system in place, with pension assets accounting for 25.5% of GDP in 2018. Russia’s pension assets account for 5.5% of GDP while China’s pension assets account for about 1.7% and India about 1.0% (in 2016).¹0
This is not the only bright spot for the BRIC countries. As a group, the BRICs continue to outperform in the Finances in Retirement index. Their population weighted regional average Finances in Retirement Index score is higher than Latin America, Western Europe, and Eastern Europe and Central Asia.
While this suggests there is some room to grow for China and India, evaluating net replacement rates leaves a more promising impression. The net replacement rate is the individual net pension entitlement divided by net pre-retirement earnings. While the OECD average is 58.6% for an average earner, in India and China it is 94.8% and 79.4% respectively, indicating they replace a higher percentage of income.
Each country also individually improves its rank in Finances in Retirement. India rises eight spots to 19th, Brazil rises to 26th from 36th and Russia is 33rd from 42nd. China has the highest rank out of the four in Finances in Retirement at 13th from 14th last year. Notably China performs well in tax pressure (4th) and old age dependency (7th) but is 41st in governance.
¹0 “Pension Markets in Focus 2019,” OECD, October 2019. https://www.oecd.org/pensions/private-pensions/pensionmarketsinfocus.htm
Income poverty rates
Brazil
China
India
Russian Federation
OECD members
7.9%
37.7%
23.3%
15.0%
11.6%
7.3%
41.5%
22.2%
12.7%
16.2%
Source: OECD Income Distribution Database
Age 66–75Country Aged over 75
OECD members
China
94.8%
79.4%
64.8%
58.6%
57.0%
Country
Russia
Brazil
India
Source: OECD pension models
Net pension replacementrates of average earners
Finances in Retirement Index
North America Asia PacificBRICs
China India Brazil RussianFederation
Eastern Europeand Central Asia
Western Europe
Latin America
71.0% 65.4%64.8%
68.0% 63.5% 58.1% 54.8%61.7%
55.7%
53.9%
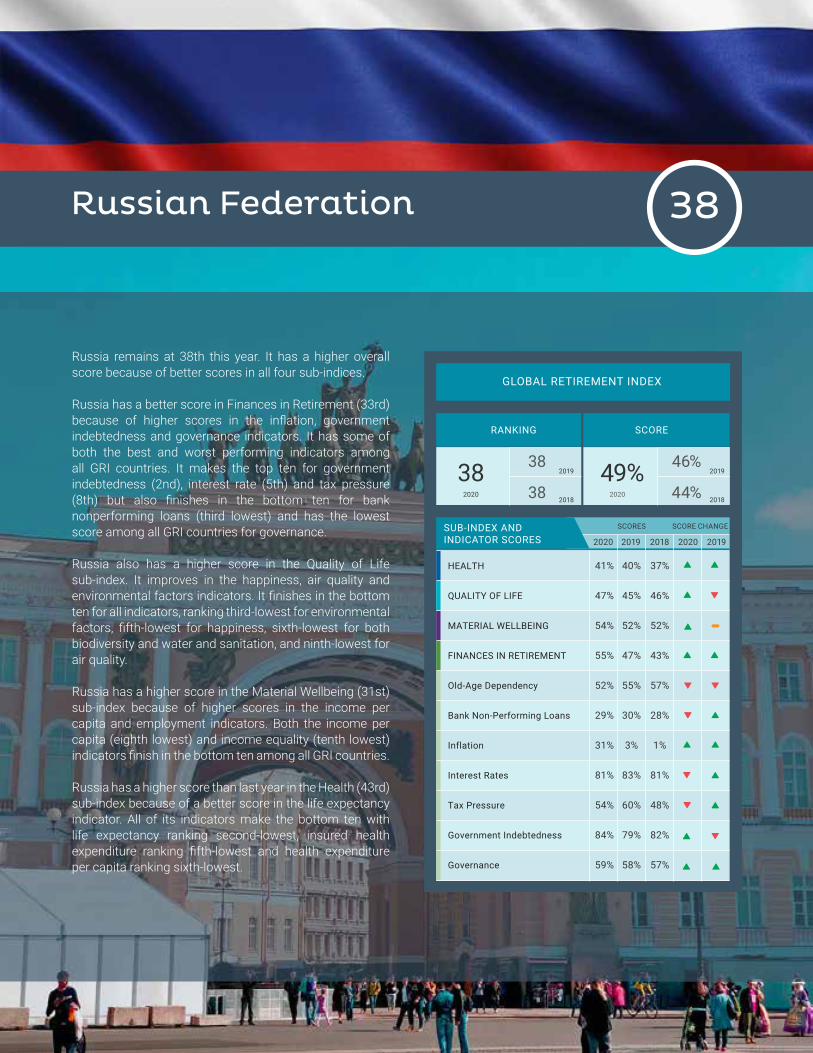
Global Retirement Index 2020 75
Russian Federation
Russia remains at 38th this year. It has a higher overall score because of better scores in all four sub-indices.
Russia has a better score in Finances in Retirement (33rd) because of higher scores in the infl ation, government indebtedness and governance indicators. It has some of both the best and worst performing indicators among all GRI countries. It makes the top ten for government indebtedness (2nd), interest rate (5th) and tax pressure (8th) but also fi nishes in the bottom ten for bank nonperforming loans (third lowest) and has the lowest score among all GRI countries for governance.
Russia also has a higher score in the Quality of Life sub-index. It improves in the happiness, air quality and environmental factors indicators. It fi nishes in the bottom ten for all indicators, ranking third-lowest for environmental factors, fi fth-lowest for happiness, sixth-lowest for both biodiversity and water and sanitation, and ninth-lowest for air quality.
Russia has a higher score in the Material Wellbeing (31st) sub-index because of higher scores in the income per capita and employment indicators. Both the income per capita (eighth lowest) and income equality (tenth lowest) indicators fi nish in the bottom ten among all GRI countries. Russia has a higher score than last year in the Health (43rd) sub-index because of a better score in the life expectancy indicator. All of its indicators make the bottom ten with life expectancy ranking second-lowest, insured health expenditure ranking fi fth-lowest and health expenditure per capita ranking sixth-lowest.
38
49%382020 2020
2018
201938
38 2018
201946%
44%
RANKING SCORE
GLOBAL RETIREMENT INDEX
HEALTH
QUALITY OF LIFE
MATERIAL WELLBEING
FINANCES IN RETIREMENT
Old-Age Dependency
Bank Non-Performing Loans
Inflation
Interest Rates
Tax Pressure
Government Indebtedness
Governance
41%
47%
54%
55%
52%
29%
31%
81%
54%
84%
59%
40%
45%
52%
47%
55%
30%
3%
83%
60%
79%
58%
37%
46%
52%
43%
57%
28%
1%
81%
48%
82%
57%
20182020 2019 2020 2019
SCORE CHANGESCORESSUB-INDEX ANDINDICATOR SCORES

Global Retirement Index 2020 76
China
China remains at 39th overall this year. It has a higher overall score than last year because of higher scores in both the Material Wellbeing (36th) and Quality of Life (43rd) sub-indices.
China improves in the Material Wellbeing sub-index because of higher scores in the income equality and employment indicators. It fi nishes in the bottom ten for both income per capita (fourth-lowest) and income equality (eighth-lowest).
Within the Quality of Life sub-index, China improves in all indicators except water and sanitation. All of its indicators fi nish in the bottom ten, with environmental factors ranking fi fth-lowest, water and sanitation ranking ninth-lowest, and happiness, air quality and biodiversity all ranking second-lowest.
China has a lower score in the Finances in Retirement (13th) sub-index. It has lower scores in the bank nonperforming loans, government indebtedness, old-age dependency and interest rate indicators compared to last year. It makes the top ten for both the tax pressure (4th) and old-age dependency (7th) indicators, but it has the fourth-lowest score for the governance indicator among all GRI countries.
China also has a lower score in the Health (41st) sub-index. Both the insured health expenditure and life expectancy indicators have lower scores compared to last year. All three indicators make the bottom ten with health expenditure per capita ranking second-lowest, insured health expenditure ranking sixth-lowest and life expectancy ranking eighth-lowest.
39
47%392020 2020
2018
201939
40 2018
201942%
42%
RANKING SCORE
GLOBAL RETIREMENT INDEX
HEALTH
QUALITY OF LIFE
MATERIAL WELLBEING
FINANCES IN RETIREMENT
Old-Age Dependency
Bank Non-Performing Loans
Inflation
Interest Rates
Tax Pressure
Government Indebtedness
Governance
48%
34%
45%
68%
73%
64%
100%
74%
82%
46%
65%
49%
30%
32%
69%
75%
67%
100%
76%
80%
49%
64%
47%
30%
32%
69%
79%
61%
95%
78%
100%
51%
63%
20182020 2019 2020 2019
SCORE CHANGESCORESSUB-INDEX ANDINDICATOR SCORES
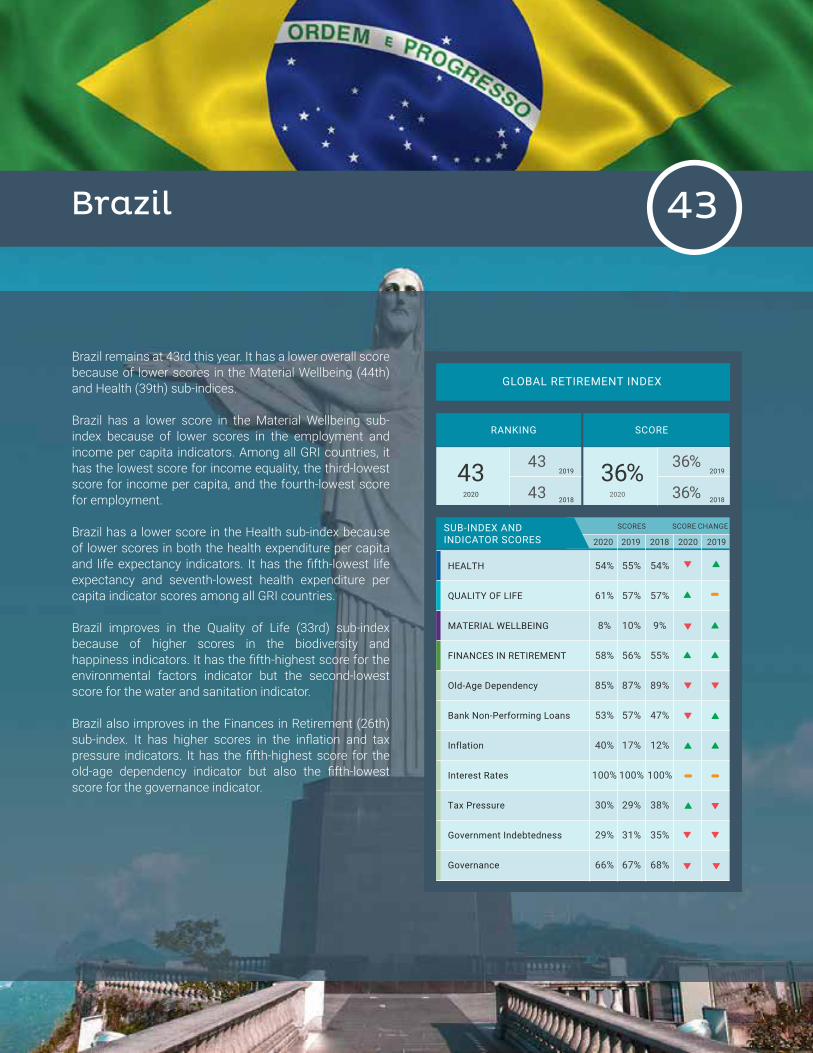
Global Retirement Index 2020 77
Brazil
Brazil remains at 43rd this year. It has a lower overall score because of lower scores in the Material Wellbeing (44th) and Health (39th) sub-indices.
Brazil has a lower score in the Material Wellbeing sub- index because of lower scores in the employment and income per capita indicators. Among all GRI countries, it has the lowest score for income equality, the third-lowest score for income per capita, and the fourth-lowest score for employment.
Brazil has a lower score in the Health sub-index because of lower scores in both the health expenditure per capita and life expectancy indicators. It has the fi fth-lowest life expectancy and seventh-lowest health expenditure per capita indicator scores among all GRI countries.
Brazil improves in the Quality of Life (33rd) sub-index because of higher scores in the biodiversity and happiness indicators. It has the fi fth-highest score for the environmental factors indicator but the second-lowest score for the water and sanitation indicator.
Brazil also improves in the Finances in Retirement (26th) sub-index. It has higher scores in the infl ation and tax pressure indicators. It has the fi fth-highest score for the old-age dependency indicator but also the fi fth-lowest score for the governance indicator.
43
36%432020 2020
2018
201943
43 2018
201936%
36%
RANKING SCORE
GLOBAL RETIREMENT INDEX
HEALTH
QUALITY OF LIFE
MATERIAL WELLBEING
FINANCES IN RETIREMENT
Old-Age Dependency
Bank Non-Performing Loans
Inflation
Interest Rates
Tax Pressure
Government Indebtedness
Governance
54%
61%
8%
58%
85%
53%
40%
100%
30%
29%
66%
55%
57%
10%
56%
87%
57%
17%
100%
29%
31%
67%
54%
57%
9%
55%
89%
47%
12%
100%
38%
35%
68%
20182020 2019 2020 2019
SCORE CHANGESCORESSUB-INDEX ANDINDICATOR SCORES

Global Retirement Index 2020 78
India
India ranks last in this year’s GRI. It has a lower overall score compared to last year because of a lower score in the Material Wellbeing (43rd) sub-index.
India has a lower score for the Material Wellbeing (43rd) sub-index because of lower scores in the employment and income equality indicators. It has the lowest score among all GRI countries for the income per capita indicator and the ninth-lowest score for the income equality indicator.
India has a higher score in the Finances (19th) sub-index because of higher scores in the infl ation, governance, and interest rate indicators. It has the highest score for both the old-age dependency and tax pressure indicators and the fourth-highest score in the interest rate indicator. But it also makes the bottom ten for both the bank nonperforming loans (fourth-lowest) and governance (seventh-lowest) indicators.
India improves in the Health (44th) sub-index because of a higher score in the insured health expenditure. All of its indicators have the lowest scores among all GRI countries. India ranks last in the Quality of Life (44th) sub-index. It has a lower score in the environmental factors indicator. It fi nishes last in the happiness, air quality, and water and sanitation indicators and fourth-to-last in the biodiversity indicator.
44
9%442020 2020
2018
201944
44 2018
201910%
9%
RANKING SCORE
GLOBAL RETIREMENT INDEX
HEALTH
QUALITY OF LIFE
MATERIAL WELLBEING
FINANCES IN RETIREMENT
Old-Age Dependency
Bank Non-Performing Loans
Inflation
Interest Rates
Tax Pressure
Government Indebtedness
Governance
3%
3%
14%
64%
100%
30%
46%
85%
100%
36%
68%
3%
3%
16%
60%
100%
31%
23%
84%
100%
37%
68%
3%
3%
16%
56%
100%
29%
10%
83%
100%
38%
67%
20182020 2019 2020 2019
SCORE CHANGESCORESSUB-INDEX ANDINDICATOR SCORES

Global Retirement Index 2020 79
ReferencesCentral Intelligence Agency, The World Factbook. Accessible online at: https://www.cia.gov/library/publications/the-world-factbook/index.html
Country statistical agencies, central banks, and ministries of finance, economy, and trade; available at http://www.bis.org/cbanks.htm; and https://unstats.un.org/home
Dasgupta, P. and Weale, M. (1992), “On Measuring the Quality of Life”, World Development, Vol. 20:1, pp. 119-131.
Emerson, J. W., Hsu, A., Levy, M. A., de Sherbinin, A., Mara, V., Esty, D. C., & Jaiteh, M. (2012), “2012 Environmental Performance Index and Pilot Trend Environmental Performance Index.” New Haven, CT: Yale Center for Environmental Law & Policy.
Helliwell, J., Layard, R., & Sachs, J. (2020). “World Happiness Report 2020”, New York: Sustainable Development Solutions Network.
International Monetary Fund (2019), Financial Soundness Indicators. Washington, DC. https://www.imf.org/external/np/sta/fsi/eng/fsi.htm
Klugman, Rodriguez and Choi (2011), “The HDI 2010: New Controversies, Old Critiques”, Human Development Research Paper 2011/1, UNDP, New York.
National Institute of Population and Social Security Research. Tokyo, Japan. http://www.ipss.go.jp/index-e.asp
Organization for Economic Co-operation and Development (2019), OECD.Stat. http://stats.oecd.org/
Social Security Administration. “Social Security Programs Throughout the World”, Washington, DC. https://www.ssa.gov/policy/docs/progdesc/ssptw/
Statistical Office of the European Communities (2019), Eurostat. Luxembourg. http://ec.europa.eu/eurostat/data/database
United Nations. “World Population Prospects”, New York. https://population.un.org/wpp/
U.S. Energy Information Administration (2019). http://www.eia.gov/environment/data.cfm
Wendling, Z. A., Emerson, J. W., de Sherbinin, A., Esty, D. C., et al. (2020). “2020 Environmental Performance Index.” New Haven, CT: Yale Center for Environmental Law & Policy. epi.yale.edu
World Bank (2020), World Development Indicators 2020.Washington, DC. http://data.worldbank.org/data-catalog/worlddevelopment-indicators
World Bank (2019), Worldwide Governance Indicators, 2019 Update. Washington, DC. http://info.worldbank.org/governance/wgi/index.aspx#home

Global Retirement Index 2020 80
Health Index
Material WellbeingIndex
Finances inRetirement
Index
Quality of LifeIndex
Index Sub-indexPolicy Category
Weight(% of Index)
IndicatorsIndicatorWeight(% of
Sub-Index)
Data Source Latest DataAvailable Target Low Performance
BenchmarkStatistical
Transformation
Life Expectancy Index GEOMEAN 1
1
1
1
1
1
1
GEOMEAN
GEOMEAN
GEOMEAN
GEOMEAN
GEOMEAN
GEOMEAN
0.55
0.40
0.05
0.6
0.4
0.2
0.2
0.2
0.1
0.1
0.1
0.1
0.33
0.33
0.165
0.165
1
2020
2020
2020
2019
2016
2015
2014
2017
2017
2017
2018
2019
Current health expenditure per capita,PPP (current international $)
Life expectancy at birth World Bank WDI 2020
World Bank WDI 2020
World Bank WDI 2020
Sample Minimum(69.42 years, India) None
None
Natural Logarithm
None
None
None
None
None
None
None
Natural Logarithm
Natural Logarithm
Natural Logarithm
Natural Logarithm
Natural Logarithm
Natural Logarithm
Natural Logarithm
Natural Logarithm
Natural Logarithm
Natural Logarithm
Natural Logarithm
Natural Logarithm
Natural Logarithm
Natural Algorithm
Natural Algorithm
None
Natural Logarithm
Natural Logarithm
Natural Logarithm
Natural Logarithm
Sample Minimum ($253.32, India)
Sample Maximum (53.90, Brazil)
Sample Maximum (17.20%, Greece)
Sample Maximum(36.45%, Greece)
Sample Maximum (237.12%, Japan)
Sample Maximum (46.20%, France)
Sample Maximum (2,706.53, India)
Sample Maximum (1,837.97, India)
Sample Maximum (293.93, India)
Sample Maximum (1,425.45, India)
Sample Maximum (815.66, India)
0%
0%
0%
0%
Sample Minimum (0.04, Singapore)
Sample Minimum (96.4, Brazil)
0.0
19,588.33
1.532823116
8.453269722
0%
Sample Maximum(11.62%, Turkey)
0%
Sample Minimum ($6,630, India)
100%
Minimum on Scale (-2.5)
50%
Sample Maximum(84.21 years, Japan)2018
2017
2018
2019
2018
2018
2019, 2018, 2017
2015 to 2019
2014 to 2018
2019
2019
2019
2019
2019
2019
2019
2017
Sample Maximum ($10,246.14, USA)
Sample Minimum(20.90, Slovak Republic)
3% Unemployment
Sample Minimum(0.35%, South Korea)
Sample Minimum (8.05%, Estonia)
Outlier-adjusted Sample Minimum(14.10%, Singapore)
2%
20%
Sample Maximum($92,150, Singapore)
Sample Minimum (9.38%, France)
Maximum on Scale (2.5)
10%
Sample Minimum (71.68, Iceland)
Sample Minimum (0.22, Switzerland)
Sample Minimum (2.66, Ireland)
Sample Minimum (1.68, Greece)
Sample Minimum(0.41, United Kingdom)
10% of country's exclusive economic zone (EEZ)designated as a marine protected area
17% protection for allbiomes within its borders
17% global protection goal
100%
1.0
0.31
100.0
1262 kg CO2 eq. (Estimated value associatedwith 50% reduction in global GHG
emissions by 2050, against 1990 levels)
0.07642 kg CO2 eq. (Estimated valueassociated with 50% reduction in global
GHG emissions by 2050, against 1990 levels)
0 grams CO2 per KWh
100% electricity from renewable sources
Sample Maximum (7.81, Finland) Sample Minimum (3.57, India)
World Bank WDI 2020
World Bank WDI 2020
IMF Financial Soundness Indicators
World Bank WDI 2020, OECD
CIA World Factbook
Environmental PerformanceIndex 2020
Environmental PerformanceIndex 2020
Environmental PerformanceIndex 2020
Environmental PerformanceIndex 2020
Environmental PerformanceIndex 2020
Environmental PerformanceIndex 2020
Environmental PerformanceIndex 2020
Environmental PerformanceIndex 2020
Environmental PerformanceIndex 2020
Environmental PerformanceIndex 2020
US Energy Information Administration (EIA),World Bank WDI 2020
US Energy Information Administration (EIA),World Bank WDI 2020
US Energy Information Administration (EIA),World Bank WDI 2020
US Energy Information Administration(EIA), World Bank WDI 2020
World Happiness Report 2020
Environmental PerformanceIndex 2020
Environmental PerformanceIndex 2020
Country statistical agencies, central banks,and ministries of finance economy
World Bank WDI 2020
World Bank Worldwide GovernanceIndicators 2019
World Bank WDI 2020
Eurostat, OECD, World Bank WDI 2020,CIA World Factbook
Out-of-pocket expenditure(% of current health expenditure)
GINI Index
GNI per capita, PPP(current international $)
Between 2011 and 2018depending on Country
Unemployment (% of total labor force)(modeled ILO estimate)
Average of World BankGovernance Indicators
Age dependency ratio, old(% of working age population)
Bank nonperforming loansto total gross loans (%)
Inflation, consumerprices (% annual)
Real interest rate (%)
Public Debt (% of GDP)
Tax Burden (% of GDP)
PM2.5 Exposure
Household Solid Fuels
Ozone Exposure
Unsafe Drinking Water
Unsafe Sanitation
Marine Protected Areas
Terrestrial Protected Areas(National Biome Weights)
Terrestial Protected Areas(Global Biome Weights)
Species Protection Index
Protected AreasRepresentativeness Index
Biodiversity Habitat Index
Species Habitat Index
CO2 emissions per capita
CO2 emissions per GDP
CO2 emissions perelectricity generation
Renewable electricity
Happiness (0-10)
GEOMEAN
GEOMEAN
GEOMEAN
GEOMEAN
GEOMEAN
0.5
0.5
0.125 GEOMEAN
0.125 GEOMEAN
0.125 GEOMEAN
0.125 GEOMEAN
0.5 GEOMEAN
Health Expenditureper Capita Index
Non-Insured HealthExpenditure Index
Income Equality Index
Income per Capita Index
Unemployment Index
Institutional Strength Index
InvestmentEnvironment
Index
Air Quality Index
Water and SanitationIndex
Biodiversityand Habitat Index
(EPI 2018)
EnvironmentalFactors Index
Happiness Index
Framework

Global Retirement Index 2020 81
Appendix A
Methodology
Constructing the Indicators
The Natixis CoreData Global Retirement Index is a composite welfare index which combines 18 target-oriented indicators, grouped into four thematic sub-indices.
The four sub-indices cover four relevant considerations for welfare in old age and are:
Health IndexMaterial Wellbeing IndexFinances in Retirement IndexQuality of Life Index
The first step in expanding the index is to construct the 18 indicators. These are constructed by selecting and preparing the raw data obtained from reliable secondary sources, and then transforming it into normalized indices.
In order to create normalized indices, minima and maxima need to be established. As a target-oriented performance index, the maxima are determined as ideal outcomes. The selection of target varies from variable to variable, and will be explored in greater depth later on.
The minima are in fact the opposite, and are defined as lower performance benchmarks, which mark the worst possible scenario. In some cases, they will refer to subsistence minimum levels and in others, simply as the worst observed value in the sample for that variable.
These indicators are created, following Emerson et al. (2012)¹¹ and based on a “proximity-to-target” methodology by which “each country’s performance on any given indicator is measured
However, this formula is, in certain cases, adapted to the characteristics of the data for each variable.
Again, following Emerson et al. (2012), most indicators are transformed into logarithms¹² due to the high level of skewness of the data. This not only has the advantage of identifying differences between the worst and the best performers, but it more clearly differentiates between top performing countries, allowing to better distinguish variations among them.
Moreover, using logarithms allows for better identification of differences across the whole scale, distinguishing between differences in performance which are equal in the absolute but very different proportionally.
Also, logarithmic functions are a better representation of variables which have decreasing marginal welfare benefits, such as income.
Once the indicators have been created, they are aggregated by obtaining their geometric mean¹3 to obtain the thematic indices. The geometric mean offers a number of advantages over the arithmetic mean;¹4 this will be discussed later in this chapter.¹5
¹¹ Emerson, J. W., Hsu, A., Levy, M. A., de Sherbinin, A., Mara, V., Esty, D. C., & Jaiteh, M. (2012), “2012 Environmental Performance Index and Pilot Trend Environmental Performance Index.” New Haven, CT: Yale Center for Environmental Law & Policy.¹² Logarithmic form: variables with skewed distributions are transformed into logarithmic form by taking natural logarithms of the values to make the distribution less skewed. When calculating an indicator we transform into logarithmic form by doing the following: Where: t = target or sample maximum m = lower performance benchmark or sample minimum x = value of the variable non-logarithmic indicator = (x-m) / (t-m) -> take logs -> indicator in logarithmic form = [ln(x)-ln(m)] / [ln(t)-ln(m)]¹3 Geometric mean is a representation of the typical value or central tendency of a series of numbers calculated as the nth root of the product of n numbers. Geometric mean = ¹4 Arithmetic mean (or average) is a representation of the typical value or central tendency of a series of numbers calculated as the sum of all the values in the series and divided by the number in the series. Arithmetic mean =
¹5 See Constructing the Global Retirement Index on page 67.
based on its position within a range” established by the lower performance benchmark and the target, on a scale from 0.01 (instead of 0 to facilitate further calculation) to 1, where 0.01 is equal to or lower than the lower performance benchmark and 1 equal to or higher than the target.
The general formula to normalize the indicators is then given by:
Indicator = Observed value – lower performance benchmark
Target – lower performance benchmark
n X1 X2 Xn...
X1 X2 Xn+ + +...n

Global Retirement Index 2020 82
The four thematic sub-indices are constructed using the indicators in the following way:
1. The Health in Retirement Index: this sub-index is obtained by taking the geometric mean of the following indicators:
a. Life expectancy Index: obtained using data from the World Bank (WB)’s World Development Indicators (WDI) 2020. The target for this indicator is the sample maximum which is equal to 84.21 years, and the low performance benchmark is equal to 69.42 years, a figure observed as the sample minimum.
b. Health expenditure per capita Index: obtained using data on current health expenditure per capita, PPP (current international $) from WB’s WDI 2020. The target set for this indicator is the sample maximum, equal to $10,246.14 USD, and the low performance benchmark is equal to the sample minimum of $253.32. The indicator is transformed into logarithms, as the marginal returns to extra expenditure are decreasing.
c. Non-insured health expenditure Index: this indicator is included to take into account the level of expenditure in health that is not insured. The smaller the proportion of expenditure in healthcare that is uninsured, the higher the probability of having access to healthcare. This indicator is calculated using data on out-of-pocket expenditure (percentage of current health expenditure), included in the WB’s WDI 2020. The target for this indicator is equal to the sample minimum of 9.38% and the low performance benchmark is equal to 100%, which means that none of the population is covered by health insurance.
2. The Material Wellbeing in Retirement Index: this sub-index measures the ability of a country’s population to provide for their material needs. The following indicators are aggregated by obtaining their geometric mean to obtain a single measure:
a. Income per capita Index: this indicator is calculated using data for the gross national income per capita, PPP (current International $) from the WB’s WDI 2020. The purchasing power parity (PPP) version is used as it provides a better approximation to the real purchasing power of incomes across countries. The target used for this indicator is the sample maximum of $92,150 USD, and the low performance benchmark is equal to the sample minimum of $6,630 USD. Logarithmic transformation is applied to calculate the indicator.
b. Income equality Index: this indicator is included as it has been generally accepted that average levels of income in a society cannot on their own
measure material welfare, and including a measure of equality ensures that countries with higher and more equally distributed income get a better score. This index is constructed using the GINI index with data obtained from Eurostat, the Organization for Economic Co-operation and Development (OECD), the WB’s WDI 2020 and the CIA World Factbook. The target is set at 20.90, which is the sample minimum. The low performance benchmark is set at 53.90, which is the sample maximum. The index is presented in a logarithmic form.
c. Unemployment Index: a measure of unemployment is included in this index, despite the fact that its focus is on people who have already retired from the labor market. This is because societies with high levels of unemployment will see their social security systems under pressure, putting in danger the financing and provision of services for the elderly. Moreover, retirees in countries with low unemployment levels will have a better possibility of complementing their pension incomes with employment income, which is becoming increasingly necessary and common. High levels of unemployment are also indicative of a country undergoing economic problems and it is likely that this will affect the living standards of those in retirement. The target for this index is 3% unemployment, at which level structural and cyclical unemployment can be assumed to be 0 and only frictional unemployment persists, which indicates practical full employment. The low performance benchmark is set at 17.20%, which is the sample maximum. The index undergoes a logarithmic transformation and the raw data used for this index was sourced from the WB’s WDI 2020.
3. Finances in Retirement Index: this sub-index captures the soundness of a country’s financial system as well as the level of returns to savings and investment and the preservation of the purchasing power of savings. It is calculated as the arithmetic mean of the institutional strength index and the investment environment index, which is in itself the geometric mean of six indicators of the soundness of government finances and the strength of the financial system. The rationale behind this construction is that while a favorable investment environment is extremely important for the finances of retirees, this will only be long lasting and stable in the presence of sound institutions, low levels of corruption, strong property rights and a strong regulatory framework. Hence, good governance is a necessary condition for long-term financial strength and stability and as much receives an equal weight.
a. Institutional Strength Index: is calculated under logarithms after obtaining the arithmetic mean of the estimates of governance from six different
Global Retirement Index 2020 83
dimensions (Voice and Accountability, Political Stability and Absence of Violence/Terrorism, Government Effectiveness, Regulatory Quality, Rule of Law, and Control of Corruption) of the WB’s Worldwide Governance Indicators (2018 Update). The target level is set equal to the maximum on the scale used by the indicators, which is +2.5, while the lower performance benchmark is equal to the lowest value of the scale, -2.5.
b. Investment Environment Index: this is calculated as the geometric mean of the following indicators:
I. Old-age dependency Index: this indicator is included because a high dependency ratio poses a severe threat to the capacity of society to pay for the care of the elderly, as well as risks reducing the value of savings in the long run, through several channels such as a fall in asset prices and a fall in output, among others. This index is transformed into logarithms and is calculated using data on old-age dependency ratio (percentage of working-age population) from the WB’s WDI 2020. The target value is equal to 10%, which reflects healthy demographics, where for every old-age dependent there are 10 people in the working force. The low performance benchmark is equal to 50%, as it is potentially unsustainable to have less than two workers for every old-age dependent.
II. Inflation Index: this is important due to the fact that high inflation will reduce the purchasing power of savings and pensions, which can affect retirees disproportionately. The data used is on annual consumer price inflation and is sourced from the WB’s WDI 2020. The value for each country is the five-year average from 2015 to 2019. The target is 2%, which is a level of inflation pursued by major central banks, and considered to be sufficiently close to price stability and sufficiently far from deflation to provide some buffer from either. The low performance benchmark is set at the sample maximum of 11.62%. This indicator undergoes a logarithmic transformation when calculated.
III. Real interest rate Index: this is included as higher interest rates will increase the returns to
investment and saving, and in turn increase the level of wealth of retirees, who tend to benefit more than other age groups. Real interest rate is used instead of nominal interest rate to eliminate the effect of inflation. The data for this indicator is sourced from the WB’s WDI 2020 and is completed from the OECD.16,17 The value for each country is the five-year average from 2014 to 2018. The target is 20% and the low performance benchmark is 0%. The data is multiplied by 100 before logarithmic transformation applied.
IV. Tax pressure Index: the importance of this indicator lies in the fact that higher levels of taxation will decrease the level of disposable income of retirees and affect their financial situation. Data used is the tax burden from country statistical agencies, central banks, and ministries of finance, economy, and trade, which measures the total taxes collected as percentage of GDP. The target is set at the outlier-adjusted sample minimum of 14.10% of GDP while the low performance benchmark is the sample maximum of 46.20% of GDP. This indicator is calculated in logarithmic form.
V. Bank non-performing loan Index: this indicator captures the strength of the banking system by looking at the proportion of loans that are defaulted on. This index is transformed into logarithms and is constructed using the data observed from the IMF Financial Soundness Indicators database. The target for this index is set equal to the sample minimum of 0.35% and the low performance benchmark is the sample maximum of 36.45%.
VI. Government indebtedness Index: captures the soundness and sustainability of government finances and serves as a predictor of future levels of taxation. The data used for this index is sourced from the CIA World Factbook and undergoes a logarithmic transformation to construct the index. The target level is set equal to the sample minimum of 8.05% and the low performance benchmark is the sample maximum of 237.12%.
¹6 Latest data on annual consumer price inflation and 10-year government bond yields are used to calculate the real interest rate (real interest rate = nominal interest rate – inflation) for those countries missing data from the WDI. ¹7 Long-term interest rates are obtained from OECD for the following countries: Austria, Belgium, Denmark, Finland, France, Germany, Greece, Ireland, Latvia, Lithuania, Luxembourg, Netherlands, Norway, Poland, Portugal, Slovak Republic, Slovenia, Spain, and Sweden. Real interest rates are calculated by subtracting inflation from the long-term interest rate.

Global Retirement Index 2020 84
4. Quality of Life Index: this sub-index captures the level of happiness and fulfillment in a society as well as the effect of natural environment factors on the Quality of Life of individuals. It is constructed as the geometric mean of the happiness index and the natural environment index.
a. Happiness Index: this data is taken from the World Happiness Report, which calculates scores for happiness based on responses by people asked to evaluate the quality of their current lives on a scale of 0 to 10, averaged over the years 2017–2019. The indicator is presented in the logarithmic form. The target is set at the sample maximum, which is an average score of 7.81, and the low performance benchmark is set at the sample minimum of 3.57.
b. Natural Environment Index: this is calculated as the geometric mean of the following indicators, which measure the natural environment quality of a country and the effects of pollution on humans.
I. Air quality Index: this index is calculated as the weighted average of PM2.5 exposure (55% weight), household solid fuels (40% weight), and ozone exposure (5% weight). The data is obtained from EPI 2020.
II. Water and sanitation Index: captures the level of infrastructure providing people with safe drinking water and safe sanitation. This index is calculated as the weighted average of the two indicators with water weighing 60% and sanitation weighting 40% (after logarithms transformation). Targets are the sample minimums of 1.68 for unsafe drinking water and 0.41 for unsafe sanitation, and the low performance benchmarks are the
sample maximums of 1,425.45 for unsafe drinking water and 815.66 for unsafe sanitation. The data used is obtained from EPI 2020.
III. Biodiversity and habitat Index: provides an insight into a country’s protection of its ecosystem. The higher the score is, the more a country is capable to ensure a wide range of “ecosystem service” like flood control and soil renewal, the production of commodities, and spiritual and aesthetic fulfillment will remain available for current and future generations. This index is calculated as the weighted average of marine protected areas (20% weight), national terrestrial protected areas (20% weight), global terrestrial protected areas (20% weight), the species protection index (10% weight), the protected areas representativeness index (10% weight), the biodiversity habitat index (10% weight) and the species habitat index (10% weight). The data is obtained from EPI 2020.
IV. Environmental factors Index: this index is included due to the fact that the impacts of environmental factors will dramatically affect human health, water resources, agriculture, and ecosystems. The index is calculated as the weighted average of CO2 emissions per capita (1/3 weight), CO2 emissions per GDP (1/3 weight), CO2 emissions per electricity generation (1/6 weight) and renewable electricity (1/6 weight). Logarithmic transformation is applied for all indicators except for renewable energy. The data is sourced from the U.S. Energy Information Administration (EIA) and the WB’s WDI 2020.
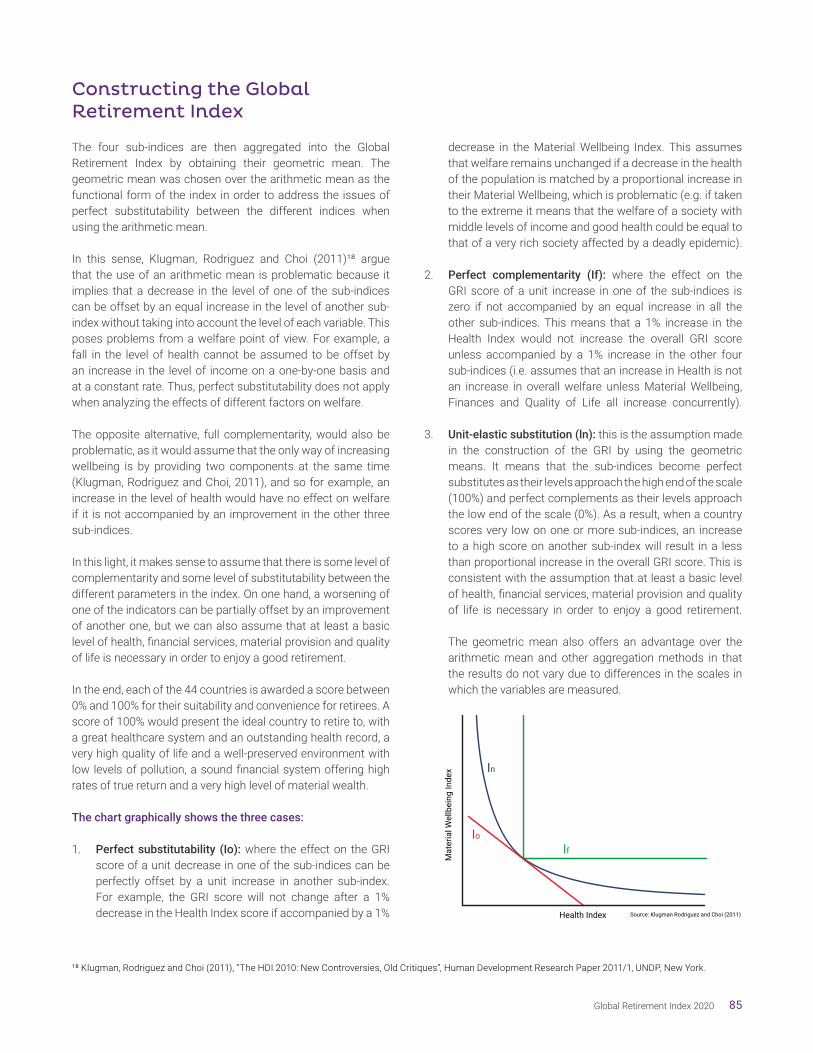
Global Retirement Index 2020 85
Constructing the Global Retirement Index
The four sub-indices are then aggregated into the Global Retirement Index by obtaining their geometric mean. The geometric mean was chosen over the arithmetic mean as the functional form of the index in order to address the issues of perfect substitutability between the different indices when using the arithmetic mean.
In this sense, Klugman, Rodriguez and Choi (2011)¹8 argue that the use of an arithmetic mean is problematic because it implies that a decrease in the level of one of the sub-indices can be offset by an equal increase in the level of another sub-index without taking into account the level of each variable. This poses problems from a welfare point of view. For example, a fall in the level of health cannot be assumed to be offset by an increase in the level of income on a one-by-one basis and at a constant rate. Thus, perfect substitutability does not apply when analyzing the effects of different factors on welfare.
The opposite alternative, full complementarity, would also be problematic, as it would assume that the only way of increasing wellbeing is by providing two components at the same time (Klugman, Rodriguez and Choi, 2011), and so for example, an increase in the level of health would have no effect on welfare if it is not accompanied by an improvement in the other three sub-indices.
In this light, it makes sense to assume that there is some level of complementarity and some level of substitutability between the different parameters in the index. On one hand, a worsening of one of the indicators can be partially offset by an improvement of another one, but we can also assume that at least a basic level of health, financial services, material provision and quality of life is necessary in order to enjoy a good retirement.
In the end, each of the 44 countries is awarded a score between 0% and 100% for their suitability and convenience for retirees. A score of 100% would present the ideal country to retire to, with a great healthcare system and an outstanding health record, a very high quality of life and a well-preserved environment with low levels of pollution, a sound financial system offering high rates of true return and a very high level of material wealth.
The chart graphically shows the three cases:
1. Perfect substitutability (Io): where the effect on the GRI score of a unit decrease in one of the sub-indices can be perfectly offset by a unit increase in another sub-index. For example, the GRI score will not change after a 1% decrease in the Health Index score if accompanied by a 1%
¹8 Klugman, Rodriguez and Choi (2011), “The HDI 2010: New Controversies, Old Critiques”, Human Development Research Paper 2011/1, UNDP, New York.
decrease in the Material Wellbeing Index. This assumes that welfare remains unchanged if a decrease in the health of the population is matched by a proportional increase in their Material Wellbeing, which is problematic (e.g. if taken to the extreme it means that the welfare of a society with middle levels of income and good health could be equal to that of a very rich society affected by a deadly epidemic).
2. Perfect complementarity (If): where the effect on the GRI score of a unit increase in one of the sub-indices is zero if not accompanied by an equal increase in all the other sub-indices. This means that a 1% increase in the Health Index would not increase the overall GRI score unless accompanied by a 1% increase in the other four sub-indices (i.e. assumes that an increase in Health is not an increase in overall welfare unless Material Wellbeing, Finances and Quality of Life all increase concurrently).
3. Unit-elastic substitution (ln): this is the assumption made in the construction of the GRI by using the geometric means. It means that the sub-indices become perfect substitutes as their levels approach the high end of the scale (100%) and perfect complements as their levels approach the low end of the scale (0%). As a result, when a country scores very low on one or more sub-indices, an increase to a high score on another sub-index will result in a less than proportional increase in the overall GRI score. This is consistent with the assumption that at least a basic level of health, financial services, material provision and quality of life is necessary in order to enjoy a good retirement. The geometric mean also offers an advantage over the arithmetic mean and other aggregation methods in that the results do not vary due to differences in the scales in which the variables are measured.
Io
In
If
Mat
eria
l Wel
lbei
ng In
dex
Health Index Source: Klugman Rodriguez and Choi (2011)

Global Retirement Index 2020 86
Appendix B: Full Rankings
Color Scale
40% andbelow
41%-50%
51%-60%
61%-70%
71%-80%
81% andabove
Rank Country
123456789
1011121314151617181920212223242526272829303132333435363738394041424344
87%
89%
91%
90%
88%
84%
87%
86%
86%
86%
89%
85%
90%
73%
83%
85%
83%
80%
80%
78%
85%
76%
91%
67%
89%
76%
64%
81%
65%
82%
66%
82%
58%
68%
58%
49%
45%
41%
48%
57%
70%
59%
54%
3%
71%
77%
59%
72%
57%
78%
77%
72%
53%
56%
56%
55%
60%
67%
55%
71%
56%
68%
62%
66%
51%
75%
49%
74%
49%
61%
65%
80%
53%
54%
59%
62%
50%
76%
55%
53%
64%
55%
68%
65%
45%
44%
58%
64%
86%
87%
88%
80%
83%
83%
77%
77%
87%
80%
87%
82%
79%
68%
89%
72%
84%
72%
67%
65%
76%
60%
67%
65%
78%
66%
58%
50%
64%
72%
65%
74%
57%
62%
62%
60%
58%
47%
34%
62%
60%
38%
61%
3%
87%
75%
88%
75%
83%
64%
65%
66%
75%
78%
69%
76%
68%
83%
68%
64%
68%
65%
77%
76%
73%
62%
70%
64%
59%
58%
71%
52%
73%
49%
60%
35%
72%
37%
52%
52%
41%
54%
45%
19%
15%
27%
8%
14%
82%
82%
80%
79%
77%
77%
76%
75%
74%
74%
74%
73%
73%
73%
73%
72%
72%
71%
71%
71%
70%
68%
68%
67%
67%
65%
64%
64%
63%
63%
62%
60%
59%
58%
57%
53%
51%
49%
47%
46%
41%
40%
36%
9%
Iceland
Switzerland
Norway
Ireland
Netherlands
New Zealand
Australia
Canada
Denmark
Germany
Sweden
Austria
Luxembourg
Czech Republic
Finland
United States
United Kingdom
Israel
Slovenia
Malta
Belgium
Korea, Rep.
Japan
Estonia
France
Portugal
Poland
Singapore
Slovak Republic
Italy
Cyprus
Spain
Hungary
Chile
Lithuania
Latvia
Mexico
Russian Federation
China
Colombia
Greece
Turkey
Brazil
India
HealthIndex
Finances inRetirement
Index
MaterialWellbeing
Index
GlobalRetirement
Index
Quality ofLife Index
Full Rankings: Global Retirement Index 2020

RC78-0820 3207968.1.1
Exp 09/30/2022
NOT FDIC INSURED • MAY LOSE VALUE • NO BANK GUARANTEE
The views and opinions expressed may change based on market and other conditions. This material is provided for informational purposes only and should not be construed as investment advice. There can be no assurance that developments will transpire as forecasted. Actual results may vary.All investing involves risk, including the risk of loss. No investment strategy or risk management technique can guarantee return or eliminate risk in all market environments.Outside the United States, this communication is for information only and is intended for investment service providers or other Professional Clients. This material must not be used with Retail Investors. This material may not be redistributed, published, or reproduced, in whole or in part. Although Natixis Investment Managers believes the information provided in this material to be reliable, including that from third party sources, it does not guarantee the accuracy, adequacy or completeness of such information.In the EU (ex UK): Provided by Natixis Investment Managers S.A. or one of its branch offices listed below. Natixis Investment Managers S.A. is a Luxembourg management company that is authorized by the Commission de Surveillance du Secteur Financier and is incorporated under Luxembourg laws and registered under n. B 115843. Registered office of Natixis Investment Managers S.A.: 2, rue Jean Monnet, L-2180 Luxembourg, Grand Duchy of Luxembourg. France: Natixis Investment Managers Distribution (n.509 471 173 RCS Paris). Registered office: 43 avenue Pierre Mendès France, 75013 Paris. Italy: Natixis Investment Managers S.A., Succursale Italiana (Bank of Italy Register of Italian Asset Management Companies no 23458.3). Registered office: Via Larga, 2 - 20122, Milan, Italy. Germany: Natixis Investment Managers S.A., Zweigniederlassung Deutschland (Registration number: HRB 88541). Registered office: Im Trutz Frankfurt 55, Westend Carrée, 7. Floor, Frankfurt am Main 60322, Germany. Netherlands: Natixis Investment Managers, Nederlands (Registration number 50774670). Registered office: Stadsplateau 7, 3521AZ Utrecht, the Netherlands. Sweden: Natixis Investment Managers, Nordics Filial (Registration number 516405-9601 - Swedish Companies Registration Office). Registered office: Kungsgatan 48 5tr, Stockholm 111 35, Sweden. Spain: Natixis Investment Managers, Sucursal en España. Serrano n°90, 6th Floor, 28006 Madrid, Spain.In Switzerland: Provided by Natixis Investment Managers, Switzerland Sàrl, Rue du Vieux Collège 10, 1204 Geneva, Switzerland or its representative office in Zurich, Schweizergasse 6, 8001 Zürich.In the UK: Provided by Natixis Investment Managers UK Limited, authorized and regulated by the Financial Conduct Authority (register no. 190258). Registered Office: Natixis Investment Managers UK Limited, One Carter Lane, London, EC4V 5ER.In the DIFC: Distributed in and from the DIFC financial district to Professional Clients only by Natixis Investment Managers Middle East (DIFC Branch) which is regulated by the DFSA. Related financial products or services are only avail-able to persons who have sufficient financial experience and understanding to participate in financial markets within the DIFC, and qualify as Professional Clients as defined by the DFSA. Registered office: Office 603 - Level 6, Currency House Tower 2, PO Box 118257, DIFC, Dubai, United Arab Emirates.In Singapore: Provided by Natixis Investment Managers Singapore (name registration no. 53102724D), a division of Ostrum Asset Management Asia Limited (company registration no. 199801044D). Registered address of Natixis Investment Managers Singapore: 5 Shenton Way, #22-05 UIC Building, Singapore 068808.In Taiwan: Provided by Natixis Investment Managers Securities Investment Consulting (Taipei) Co., Ltd., a Securities Investment Consulting Enterprise regulated by the Financial Supervisory Commission of the R.O.C. Registered address: 16F-1, No. 76, Section 2, Tun Hwa South Road, Taipei, Taiwan, Da-An District, 106 (Ruentex Financial Building I), R.O.C., license number 2017 FSC SICE No. 018, Tel. +886 2 2784 5777.
In Japan: Provided by Natixis Investment Managers Japan Co., Ltd., Registration No.: Director-General of the Kanto Local Financial Bureau (kinsho) No. 425. Content of Business: The Company conducts discretionary asset management business and investment advisory and agency business as a Financial Instruments Business Operator. Registered address: 1-4-5, Roppongi, Minato-ku, Tokyo.In Hong Kong: Provided by Natixis Investment Managers Hong Kong Limited to institutional/corporate professional investors only. Please note that the con-tent of the above website has not been reviewed or approved by the HK SFC. It may contain information about funds that are not authorized by the SFC.In Australia: Provided by Natixis Investment Managers Australia Pty Limited (ABN 60 088 786 289) (AFSL No. 246830) and is intended for the general information of financial advisers and wholesale clients only.In New Zealand: This document is intended for the general information of New Zealand wholesale investors only and does not constitute financial advice. This is not a regulated offer for the purposes of the Financial Markets Conduct Act 2013 (FMCA) and is only available to New Zealand investors who have certified that they meet the requirements in the FMCA for wholesale investors. Natixis Investment Managers Australia Pty Limited is not a registered financial service provider in New Zealand.In Latin America: Provided by Natixis Investment Managers S.A.In Colombia: Provided by Natixis Investment Managers S.A. Oficina de Representación (Colombia) to professional clients for informational purposes only as permitted under Decree 2555 of 2010. Any products, services or investments referred to herein are rendered exclusively outside of Colombia.In Mexico: Provided by Natixis IM Mexico, S. de R.L. de C.V., which is not a regulated financial entity or an investment manager in terms of the Mexican Securities Market Law (Ley del Mercado de Valores) and is not registered with the Comisión Nacional Bancaria y de Valores (CNBV) or any other Mexican authority. Any products, services or investments referred to herein that require authorization or license are rendered exclusively outside of Mexico. Natixis Investment Managers is an entity organized under the laws of France and is not authorized by or registered with the CNBV or any other Mexican authority to operate within Mexico as an investment manager in terms of the Mexican Securities Market Law (Ley del Mercado de Valores). Any use of the expression or reference contained herein to “Investment Managers” is made to Natixis Investment Managers and/or any of the investment management subsidiaries of Natixis Investment Managers, which are also not authorized by or registered with the CNBV or any other Mexican authority to operate within Mexico as investment managers.In Uruguay: Provided by Natixis Investment Managers Uruguay S.A., a duly registered investment advisor, authorized and supervised by the Central Bank of Uruguay. Office: San Lucar 1491, oficina 102B, Montevideo, Uruguay, CP 11500.The above referenced entities are business development units of Natixis Investment Managers, the holding company of a diverse line-up of specialized investment management and distribution entities worldwide. The investment management subsidiaries of Natixis Investment Managers conduct any regu-lated activities only in and from the jurisdictions in which they are licensed or authorized. Their services and the products they manage are not available to all investors in all jurisdictions.In Canada: This material is provided by Natixis Investment Managers Canada LP, 145 King Street West, Suite 1500, Toronto, ON M5H 1J8.In the United States: Provided by Natixis Distribution, L.P., 888 Boylston St., Boston, MA 02199. Natixis Investment Managers includes all of the invest-ment management and distribution entities affiliated with Natixis Distribution, L.P. and Natixis Investment Managers S.A.This material should not be considered a solicitation to buy or an offer to sell any product or service to any person in any jurisdiction where such activity would be unlawful.