2019 preqin global infrastructure report. 2019 preqin global infrastructure report private...
TRANSCRIPT

2019 Preqin Global Infrastructure
Report
Sample Pages
ISBN: 978-1-912116-17-1$175 / £125 / €150www.preqin.com

2 0 1 9 P R E Q I N G L O B A L I N F R A S T R U C T U R E R E P O R T
2 © P r e q i n L t d . / w w w . p r e q i n . c o m
CONTENTS
CEO's Foreword – Mark O'Hare 3
1. 2019 PREQIN GLOBAL INFRASTRUCTURE REPORT
Private Capital's Part to Play in Infrastructure Investment – Andy Matthews, Infracapital
7
Seeing Success in a Competitive Market – Dennis Kwan, MVision
10
Key Trends of 2018 14
2. FUNDRAISING IN 2018
Fundraising Trends in 2018 – Giacomo Biondi Morra di Belforte, Capstone Partners
17
Infrastructure Secures a Record $90bn in 2018 18
Fundraising in 2018 20
Regional Fundraising 24
Funds in Market 26
3. FUND MANAGERS & AUM
Infrastructure Assets Continue Strong Growth 28
Assets under Management 30
Fund Managers 32
4. INVESTORS
Appetite for Infrastructure Strengthens 36
Investors 38
Future Investments 40
Alternative Structures 41
5. PERFORMANCE
Infrastructure Returns: Delivering on Promises 44
Performance Overview 46
Private vs. Public 48
A View on Performance 49
6. DEALS & EXITS
Too Much Capital Chasing Too Few Deals? 52
Deals 54
Exits 56
7. OUTLOOK
The Social Care Evolution: Investment to Deliver Better Healthcare Outcomes – Julie-Anne Mizzi, AMP Capital
58
The Opportunity for 2019 60
Outlook for Infrastructure 62
DATA PACK FOR 2019 PREQIN GLOBAL INFRASTRUCTURE REPORTThe data behind all of the charts and infographics featured in this report, plus additional datasets for each of the chapters in the book, is available to purchase in Excel format. Ready-made charts and graphs are also available, and can be used in marketing materials, presentations or company reports.
To purchase the data pack, please contact your Preqin representative or download an order form here:
www.preqin.com/gir

2 0 1 9 P R E Q I N G L O B A L I N F R A S T R U C T U R E R E P O R T
14 © P r e q i n L t d . / w w w . p r e q i n . c o m
KEY TRENDS OF 2018
Infrastructure has certainly delivered on its promise to investors: record capital ($77bn) was distributed back to investors in 2017, bolstering the positive sentiment among industry participants. Such activity has prompted most investors to maintain or even increase allocations to the asset class going forwards. Despite the concerns over the challenging pricing environment and significant competition for assets, our end-of-year surveys indicate that fund managers and investors feel positive about infrastructure in the year ahead.
INVESTORS SATISFIED WITH INFRASTRUCTURE COMPETITION FOR ASSETS INTENSIFIES
ASSET VALUATIONS HIGHER THAN EVER CAPITAL CONCENTRATION ON THE RISE
SLOWDOWN IN DEALS HEALTHY EXIT ENVIRONMENT
Record distributions in 2017 of$77bnInvestors invest in infrastructure fordiversification and a reliable income stream
84% of surveyed investors felt that infrastructure met or exceeded their expectations in 2018
66%of surveyed fund managers feel competition for assets will be a key challenge for return generation in 2019
$542mnAverage deal size in 2018vs. $492mn in 2017
54%of surveyed fund managers feel valuations will be a challenge for return generation in 2019 (second most cited challengeafter competition for assets)$179bnRecord levels of dry powder available (as at June 2018)
50largest funds closed in 2018 secured 98% of total capital raised (compared to 92% in 2017)
76%of surveyed fund managers agreethat competition for investor capital is more intense than 12 months ago
22%Decrease in the number of deals completed in 2018 from 2017
$666mnAverage size of exits in 2018,up from $635mn in 2017
46%of surveyed fund managers anticipate increased exit activity in the next 12 months
61%of surveyed investors feel we are at the peak of the current equity market cycle

1 . 2 0 1 9 P R E Q I N G L O B A L I N F R A S T R U C T U R E R E P O R T
7
In your opinion, what key trends emerged or persisted in the infrastructure space over 2018?A persistent theme is the continued capital seeking to find a home in the sector, which appears to be having a two-fold impact. Firstly, we are seeing ever larger funds raised, and secondly, managers continue to stretch the definition of infrastructure in search of value in a more crowded marketplace. However, pleasingly, this year we have also witnessed increased recognition of the critical role that private capital must play in order to meet the infrastructure investment requirements in Europe and further afield, which is generating significant investment opportunity. We have also seen an emerging focus on the need for the private sector to mobilize behind the investment needed in Europe’s infrastructure, offering attractive infrastructure investment opportunities.
In the same year that governments and consumers alike were increasingly focused on climate change and more inclusive societies and economies, the European Commission (EC) launched its Action Plan1 on financing sustainable growth. The plan seeks to mobilize the private sector, calling for the private sector to “support the €180bn of additional investment a year needed to transition to a low-carbon economy.” This initiative has been a catalyst for sustainable investment across a wide range of different sectors including clean energy, fibre, transport and social infrastructure.
How did Infracapital respond to these trends?We have looked to capitalize on this sizeable opportunity in Europe, where deal flow remains strong, through both our brownfield and greenfield strategies. On the brownfield side we recently closed our third fund at its £1.85bn hard cap and are pleased to have already completed several investments. We have benefitted from remaining relatively small and focused on the mid-market.
1 The European Commission Action on Financing Sustainable Growth, March 2018.2 Sustainable Infrastructure and Finance, June 2016. Published by United Nations Environment and Global Infrastructure Basel.
With a dedicated greenfield strategy team with specialist greenfield expertise, we have formed a number of attractive platforms with our developer and industrial partners, offering attractive investments supporting the need for new, essential infrastructure. The speed, quality and diversity of our deployment highlights the strong pipeline of opportunities in this space. I think the main attraction of the strategy for LPs has been how it complements their existing brownfield infrastructure exposure by providing a different return profile, albeit the portfolio once fully operational will be yielding for the majority of the fund life.
What opportunities are you seeing in the greenfield space today?There is a vast requirement in Europe for new infrastructure across all sectors, with the EC estimating that 75% of infrastructure required by 2050 has not yet been built.2 This is driven by low levels of infrastructure investment since the Global Financial Crisis, a growing need for energy-efficient infrastructure and the impact of new technologies.
The impact of technology creates opportunities in several sectors, spanning transport, fibre broadband and energy infrastructure. For instance, governments and car manufacturers are increasingly committed
PRIVATE CAPITAL'S PART TO PLAY IN INFRASTRUCTURE INVESTMENT
ANDY MATTHEWSHead of Greenfield, Infracapital

2 0 1 9 P R E Q I N G L O B A L I N F R A S T R U C T U R E R E P O R T
8 © P r e q i n L t d . / w w w . p r e q i n . c o m
to ‘going electric’. This is resulting in a substantial need for mass charging infrastructure (an estimated €40-50bn of investment is needed by 2030), but also generating broader investment opportunities. For example, substantial reinforcement of the national grid, which will be materially impacted by the vehicle-charging behavioural model which is still developing, with potentially more ‘refuelling’ at home and overnight than at stations. We have also focused on fibre broadband where there is a sizeable backlog of demand, especially in the case of Germany and the UK. We have recently made investments in both countries, where fibre connections amount to less than 10% of homes.
The investment in renewable energy assets is well documented, but the rise of decentralized energy systems, and the impact of energy intermittency on the grid, has also created new opportunities. It is estimated that the grid will require €20bn of investment by 20203, including energy storage, to cope with decentralized energy sources and unpredictable energy generation. We see investments such as our asset Bioenergy Infrastructure Group (BIG), a waste-to-energy platform launched in 2015, as a great example of how private capital can solve both a societal problem (waste) and generate energy more sustainably.
As a manager we tend to only speak of the growing opportunities in the sector, but equally there are
3 SUSI Analytics (2017).
challenges and headwinds we must respond to. Take the development of autonomous cars: this may well disrupt aspects of our current transport infrastructure as autonomous and connected vehicles change the demands on our roads. However, such change can also deliver attractive investment prospects through digital and power infrastructure required to support such change.
Preqin’s survey found that 70% of investors in infrastructure expect to increase their allocations over the next five years. What part do you feel greenfield will play in this?Long-term investors are increasingly attracted to infrastructure and we think greenfield investment should be considered a part of any LP’s infrastructure portfolio. By investing earlier in the asset lifecycle, an investor can enjoy a significant return premium without being forced into more ‘private equity-style’ investments. Institutional investors that can accept the lower yield in the early years of a greenfield fund’s life are well compensated through access to long-term yields in this untapped market, well in excess of equivalent brownfield infrastructure.
Of course, investors must be cognisant of construction risk, and should be wary of managers that lack the specialist skillset and track record required to effectively manage a portfolio through construction. However, a seasoned manager can mitigate this through effective and measurable risk management techniques.
We think greenfield investment is a great solution for both investors and consumers alike. Greenfield projects can help solve the allocation challenges facing pension schemes and other institutional investors, while simultaneously solving the funding gap faced by governments, who alone cannot meet the changing needs of modern society.
ABOUT INFRACAPITALInfracapital is a leading European infrastructure investor with significant experience in mid-market investing, having raised and managed over £5bn of funds. Infracapital’s platform offers investors multiple ways to access essential European infrastructure with strategies in both greenfield and brownfield infrastructure. Infracapital’s focus is to build and actively manage a diverse portfolio of businesses that delivers stable returns to investors, while meeting the changing needs of society and supporting sustainable economic growth.
www.infracapital.co.uk
By investing earlier in the asset lifecycle, an investor can enjoy a significant return premium without being forced into more 'private equity-style' investments.

2 0 1 9 P R E Q I N G L O B A L N A T U R A L R E S O U R C E S R E P O R T
8 © P r e q i n L t d . / w w w . p r e q i n . c o m
ANOTHER SUCCESSFUL YEAR FOR FUNDRAISING
The natural resources fundraising market was in a healthy state in 2018; the $93bn raised by unlisted natural resources funds represents the highest amount raised in any year (Fig. 2.1). The number of funds
that have successfully closed, however, has declined by 37% compared to 2017’s total of 145 funds. This concentration of capital suggests that investors are much more selective in the fund managers they back – this trend was most recently observed in 2017 (with the number of funds closed down from 157 in 2016) but was more pronounced in 2018, as the average size of funds closed in the year reached a record $1.1bn.
FUNDS SPEND MORE TIME ON ROAD Despite the record sums raised, fundraising conditions have been tough on some managers; the average time spent on the road by natural resources funds closed in 2018 was 17.3 months, up from just 15.0 months for funds closed in 2016 (Fig. 2.6). Our survey revealed that investors are looking to re-up with the most experienced and trusted fund managers over 2019 to ride out expected choppy waters ahead (page 30). Follow-on funds are more likely to achieve a first close faster than first-time funds: 37% of follow-on funds closed in 2018 were able to achieve a first close in 12 months or less, compared with just 25% of first-time funds.
ENERGY DOMINATES THE ASSET CLASS Energy is historically the most prominent strategy within natural resources, and there are no signs of this changing (Fig. 2.2). The tale for the non-energy strategies in 2018 is mixed. Metals & mining fundraising was up for the year with $2.5bn raised compared to $782mn in 2017. Fundraising for agriculture/farmland funds on the other hand was significantly lower than in 2017, with just $740mn raised by seven funds, compared to $1.9bn raised in 2017 by 17 funds. This represents the third consecutive annual decline in the amount raised by agriculture/farmland funds. The sector has faced challenges, not least the looming threat of interest rate rises in recent years playing out in 2018, which is negatively impacting farmland pricing.
EUROPE’S MARKET SHARE GROWSWithin Europe, there has been a push towards renewable energy, driven in part by EU legislation, which is opening up new avenues for investing that managers and investors are keen to exploit. Of the total natural resources capital secured in 2018, 30% will be deployed in Europe, up from 26% in 2017 and 18% in 2016.
North America is still the destination of the majority of natural resources capital: the region’s share of total capital was up from 58% in 2017 to 62% in 2018. The gains in North America and Europe were counterbalanced by a steep decline in fundraising elsewhere, from $14bn in 2017 to only $7.6bn in 2018 (Fig. 2.3).
CAPITAL CONCENTRATION CONTINUESAcross the private capital industry, the largest fund managers are securing significant capital – and natural resources is no exception. The proportion of aggregate capital raised by the 10 largest natural resources funds has increased to 53% in 2018 from 44% in 2014, indicating that capital is flowing to the largest fund managers (Fig. 2.4). Indeed, the majority (81%) of fund managers surveyed in November 2018 felt that competition for investor capital had intensified over the past year – perhaps another indication of the difficulty of securing capital without pre-existing relationships with investors. With a greater proportion of surveyed investors more inclined to re-up with GPs (38%) than form new GP relationships (19%) for investments in 2019, there is an evident trend of investors sticking with more established fund managers.
The high number of funds in market is to be expected given the overhang of managers that failed to complete fundraising in 2017 and 2018 in the face of a more selective investor base.
2 0 1 9 P R E Q I N G L O B A L I N F R A S T R U C T U R E R E P O R T
38 © P r e q i n L t d . / w w w . p r e q i n . c o m
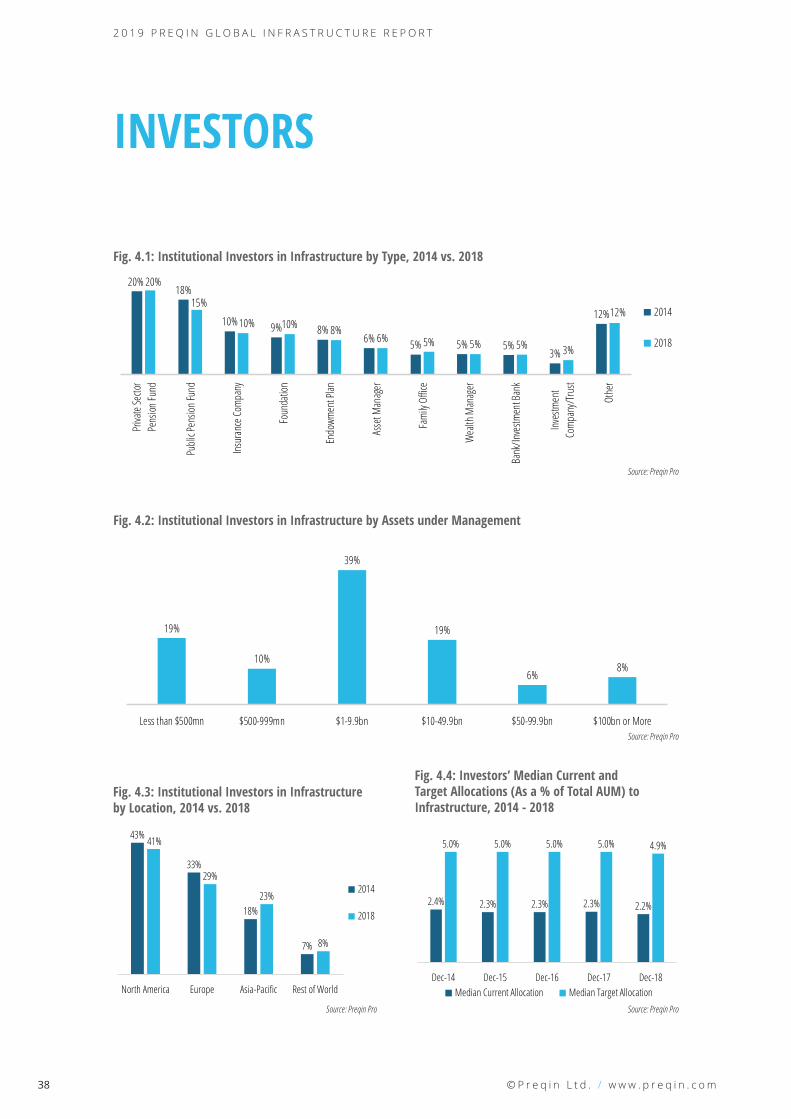
INVESTORS
Fig. 4.1: Institutional Investors in Infrastructure by Type, 2014 vs. 2018
20%18%
10% 9% 8%6% 5% 5% 5%
3%
12%
20%
15%
10% 10% 8%6% 5% 5% 5% 3%
12%
Priva
te Se
ctor
Pens
ion Fu
nd
Publi
c Pen
sion F
und
Insur
ance
Comp
any
Foun
datio
n
Endo
wmen
t Plan
Asse
t Man
ager
Fami
ly Of
fice
Wea
lth M
anag
er
Bank
/Inve
stmen
t Ban
k
Inves
tmen
tCo
mpan
y/Tru
st
Othe
r
2014
2018
Source: Preqin Pro
Fig. 4.2: Institutional Investors in Infrastructure by Assets under Management
19%
10%
39%
19%
6%8%
Less than $500mn $500-999mn $1-9.9bn $10-49.9bn $50-99.9bn $100bn or MoreSource: Preqin Pro
Fig. 4.4: Investors’ Median Current and Target Allocations (As a % of Total AUM) to Infrastructure, 2014 - 2018
Source: Preqin Pro
2.4% 2.3% 2.3% 2.3% 2.2%
5.0% 5.0% 5.0% 5.0% 4.9%
Dec-14 Dec-15 Dec-16 Dec-17 Dec-18Median Current Allocation Median Target Allocation
Source: Preqin Pro
43%
33%
18%
7%
41%
29%
23%
8%
North America Europe Asia-Pacific Rest of World
2014
2018
Fig. 4.3: Institutional Investors in Infrastructure by Location, 2014 vs. 2018

7 . O U T L O O K
63
Fig. 7.6: Investors’ Expected Capital Commitments to Infrastructure in the Next 12 Months Compared with the Previous 12 Months
35%
52%
12%
More Capital
Same Amountof Capital
Less Capital
Source: Preqin Investor Interviews, November 2018
Fig. 7.5: Infrastructure Investors’ Plans to Alter Their Level of Private Investment in Response to the Cycle
30%
61%
9%
Will Invest Morein Private Capital
No Change
Will Invest Lessin Private Capital
Source: Preqin Investor Interviews, November 2018
Fig. 7.3: Strategies that Investors View as Presenting the Best Opportunities
15%
30%27%
35%
24%
4% 5%9%
0%
Debt Core Core-Plus Value Added Opportunistic Distressed Fund of Funds Secondaries OtherSource: Preqin Investor Interviews, November 2018
Fig. 7.4: Developed and Emerging Markets that Investors View as Presenting the Best Opportunities
58% 53%
35% 34%27% 24% 24%
US
Wes
tern E
urop
e(E
xcl. U
K)
UK
India
China
Cent
ral &
Easte
rn Eu
rope
Othe
rEm
erging
Asia
Developed Markets Emerging MarketsSource: Preqin Investor Interviews, November 2018
Regulatory risk will become a greater concern for investors. Regulated assets traditionally have been considered one of the ‘safer’ subsectors of infrastructure. With the regulatory risk coming into sharper focus, industry participants will need to diversify their portfolios and consider valuations in this sector.
Julio Garcia, IMF Investors

The 2019 Preqin Global Alternatives Reports are the most detailed and comprehensive reviews of the alternative assets industry available, offering exclusive insight into the latest developments in the private equity, hedge fund, real estate, infrastructure, private debt and natural resources asset classes.
Access in-depth analysis and comprehensive statistics to understand the latest trends in fundraising, performance, investors, deals and fund managers.■ View historical data alongside the most important industry developments. Read contributions from
some of the industry’s leading igures.■ Improve your presentations, marketing materials and company reports.
■ Answer key questions: Who is investing? How much has been raised? Where are the centres of activity? Where is the capital going? What are the biggest deals? What is the outlook for the industry?
2019 PREQIN GLOBAL ALTERNATIVES REPORTS
For more information visit: www.preqin.com/reports
PAYMENT DETAILS: SHIPPING DETAILS:
Cheque enclosed (cheque payable to ‘Preqin’) Name:_______________________________________
Telephone:_______________________________________
Charge my: Visa Firm:_______________________________________
Email:_______________________________________
Mastercard Job Title:_______________________________________
Amex Address:_______________________________________
Please invoice me _______________________________________
Currency: USD GBP EUR _______________________________________
Card Number:_______________________________________
City:_______________________________________
Name on Card:_______________________________________
State:_______________________________________
Expiration Date:_______________________________________
Post/Zip:_______________________________________
Security Code:_______________________________________
Country:_______________________________________
COMPLETED ORDER FORMSPost (to Preqin):
NEW YORKOne Grand Central Place60 E 42nd StreetSuite 630New YorkNY 10165Tel: +1 212 350 0100Fax: +1 440 445 9595
LONDON3rd FloorVintners’ Place68 Upper Thames StreetLondonEC4V 3BJTel: +44 (0)20 3207 0200Fax: +44 (0)870 330 5892
SINGAPOREOne Finlayson Green#11-02Singapore049246
Tel: +65 6305 2200Fax: +65 6491 2240
SAN FRANCISCOOne Embarcadero CenterSuite 2850San FranciscoCA 94111
Tel: +1 415 316 0580 Fax: +1 440 445 9595
HONG KONGLevel 9, Central Building1-3 Pedder StreetCentral, Hong Kong
Tel: +852 3892 0200
American Express, four-digit code printed on the front of the card.
Visa and Mastercard, last three digits printed on the signature strip.
I would like to purchase:
PRINTName First Copy Each Additional Copy Quantity Data Pack* Private Equity & Venture Capital $175/£125/€150 $90/£65/€75 $300/£215/€260Hedge Funds $175/£125/€150 $90/£65/€75 $300/£215/€260Real Estate $175/£125/€150 $90/£65/€75 $300/£215/€260Infrastructure $175/£125/€150 $90/£65/€75 $300/£215/€260Private Debt $175/£125/€150 $90/£65/€75 $300/£215/€260Natural Resources $175/£125/€150 $90/£65/€75 $300/£215/€260All Six Titles (25% Saving!) $785/£560/€675 $395/£280/€340 $1,350/£965/€1,160Shipping Costs: $40/£10/€25 for single publication
$20/£5/€12 for additional copies(Shipping costs will not exceed a maximum of $60/£15/€37 per order when all shipped to same address. If shipped to multiple addresses then full postage rates apply for additional copies.)
If you would like to order more than 10 copies of one title, please contact us for a special rate
DIGITALName Single-User Licence Each Additional
Copy Quantity Enterprise Licence** Data Pack*
Private Equity & Venture Capital $175/£125/€150 $90/£65/€75 $1,000/£715/€860 $300/£215/€260Hedge Funds $175/£125/€150 $90/£65/€75 $1,000/£715/€860 $300/£215/€260Real Estate $175/£125/€150 $90/£65/€75 $1,000/£715/€860 $300/£215/€260Infrastructure $175/£125/€150 $90/£65/€75 $1,000/£715/€860 $300/£215/€260Private Debt $175/£125/€150 $90/£65/€75 $1,000/£715/€860 $300/£215/€260Natural Resources $175/£125/€150 $90/£65/€75 $1,000/£715/€860 $300/£215/€260All Six Titles (25% Saving!) $785/£560/€675 $395/£280/€340 $4,500/£3,215/€3,860 $1,350/£965/€1,160*Data packs feature all the chart and league table data in an Excel file. Must be purchased alongside the associated report.**Enterprise Licence allows for team-wide digital access.Please note all prices quoted throughout are exclusive of sales taxes.