2018 preqin global hedge fund report …docs.preqin.com/samples/2018-preqin-global-hedge-fund...many...
TRANSCRIPT

ISBN: 978-1-912116-06-5$175 / £125 / €150www.preqin.com
2018PREQIN GLOBALHEDGE FUNDREPORT SAMPLE PAGES

© Preqin Ltd. 2018 / www.preqin.com2
2018 PREQIN GLOBAL HEDGE FUND REPORT - SAMPLE PAGES
CONTENTSCEO’s Foreword - Mark O’Hare 4
1: 2018 PREQIN GLOBAL HEDGE FUND REPORT
Keynote Address: Regulatory Impacts on the Securities Finance Industry - Glenn Horner, State Street
6
2: OVERVIEW OF THE HEDGE FUND INDUSTRY
Timeline of Key Events in 2017 8
Hedge Funds: 2017 in Numbers 10
Hedge Funds Hit Perfect 12 in 2017 as Industry Rebounds from Difficult Period - Amy Bensted, Preqin
11
Shifting Landscape Leads Hedge Funds to Move Prime Brokerages - Steven Sanders, Interactive Brokers
12
We Share Industry Leaders’ Optimism About the Future- Jack Inglis, AIMA
14
Why Alternative Investments? - Richard H. Baker, Managed Funds Association
15
3: HEDGE FUND MANAGEMENT
Asset Flows in 2017 18
Overview of Fund Managers and Funds 20
4: PERFORMANCE
Performance Benchmarks 26
Performance in 2017 28
Performance over the Longer Term 32
5: INDUSTRY OUTLOOK FOR 2018
View from the Inside 36
Fund Manager Outlook 37
Investor Outlook 41
Investment Consultant Outlook 46
Predictions for 2017: How Accurate Were They? 50
6: FUND TERMS AND CONDITIONS
Hedge Fund Fee Structures 52
Terms and Conditions: An Overview 57
7: INVESTORS
Know Your Investor 60
Fund Searches and Mandates 65
Private Wealth Firms 68
In Focus: Public Pension Funds 70
Sample Investors to Watch in 2018 71
How Investors Source and Select Funds 72
8: OVERVIEW OF THE INDUSTRY BY STRATEGY
In Focus: Alternative Risk Premia 74
In Focus: Artificial Intelligence/Machine Learning (AIML) 75
In Focus: Cryptocurrency 76
Equity Strategies 77
Macro Strategies 78
Event Driven Strategies 79
Credit Strategies 80
Relative Value Strategies 81
Multi-Strategy 82
Niche Strategies 84
Volatility Trading Funds 85
Activist Funds 86
Discretionary vs. Systematic Traders 87
Emerging Markets Strategies 88
9: FUNDS OF HEDGE FUNDS
Overview of Funds of Hedge Funds 90
Funds of Hedge Funds – Plans for 2018 94
Funds of Hedge Funds – Survey Results 95
10: CTAs
Overview of CTAs 98
11: LIQUID ALTERNATIVES
Overview of Liquid Alternatives 104
12: MANAGED ACCOUNTS
Overview of Managed Accounts 110
13: SERVICE PROVIDERS
Fund Administrators 114
Fund Custodians 115
Prime Brokers 116
Fund Auditors 117
Law Firms 118
14: LEAGUE TABLES
Leading Hedge Funds 122
Largest Investors by Region 124
Largest Investors by Type 125
Leading Fund Managers 126

2018 PREQIN GLOBAL HEDGE FUND REPORT - SAMPLE PAGES
They say that a week is a long time in politics; well, a year is certainly a long time in hedge funds. My foreword to Preqin’s 2017 Global Report reflected on the extended period of disappointing returns that had started in 2015, leading to investor dissatisfaction and net
redemptions for the industry in 2016.
Fast-forward to early 2018, and the outlook for the industry has improved significantly: ■ Hedge funds achieved a ‘perfect 12’ in 2017: 12 months of positive performance – the first time this has been achieved since 2003 –
and the 2017 return was 11.41%, also the best on record since 2013. ■ Supported by this positive performance, investor sentiment has turned around: the proportions of investors satisfied versus
disappointed with returns have taken a turn for the better (see page 41), as has the pattern of investors intending to increase versus decrease their allocations.
■ As a consequence of this, and following five consecutive quarters of net outflows starting in Q4 2015, the tide turned, and the industry saw net inflows of just under $50bn in 2017. Early days, and investors will need to see continued solid performance in order to fully regain their confidence in and enthusiasm for the industry, but certainly a welcome start.
■ Supported by these net inflows and (especially) the positive performance, industry assets under management reached a new record high of $3.55tn in November 2017.
Moving beyond the statistics, there are also many signs of new dynamism in the industry. New strategies are emerging, and this year’s Global Report covers alternative risk premia, cryptocurrency/blockchain and AI for the first time. These emerging strategies still account for relatively modest dollar allocations at this stage, but it is interesting to see the encouragingly large proportion of investors that are expressing interest in or investing in these strategies to some extent. Managers are also offering a wider-than-ever range of structures/vehicles to meet the varying requirements of different investors. New managers continue to enter the industry, although for the first time on record fund closures have exceeded fund launches, so that the total number of active managers has declined. Net inflows have gone to the better-performing funds, while losses have been concentrated among the weaker performers (see page 19), signs of an inevitable – and perhaps welcome – consolidation in the industry.
Many investors believe that the market could be hitting the top of the equity cycle, and are positioning themselves more defensively as a result, to the benefit of hedge funds. The range and diversity of investors allocating to hedge funds is huge (see pages 60-64), and understanding the various pools of capital, together with their requirements and expectations, is vital for success in asset gathering.
Notwithstanding the more positive performance and outlook in 2018, many challenges remain for hedge funds. Fees are a perennial issue, with a large proportion of investors feeling that fees and terms are not adequately aligned between investors and fund managers (see page 52), and the all-important investment consultants continue to exert pressure on the industry (see pages 46-49). Regulatory change continues apace, with MIFID II, reforms from the Trump administration and the potential effects of Brexit all playing a role.
One constant factor in the industry’s development is the need for the best possible information to help investors and fund managers alike decide and execute their strategies. Preqin is committed to continuing to invest in and develop our services in the industry, and we thank all our customers and wider participants across the industry for their support.
Thank you,
Mark O’Hare
CEO’s FOREWORD- Mark O’Hare

© Preqin Ltd. 2018 / www.preqin.com6
1. 2018 PREQIN GLOBAL HEDGE FUND REPORT2018 PREQIN GLOBAL HEDGE FUND REPORT - SAMPLE PAGES
In response to the Global Financial Crisis of 2007-2008, Basel III and
Financial Stability Board regulations were implemented, prescribing more stringent capital requirements and new liquidity rules. Additionally, global regulators designated the most systemically important banks as Globally Systemically Important Banks (G-SIBs). The G-SIB designation requires these entities to meet heightened standards in terms of capital, liquidity and interconnectedness. Though the new standards have not been fully implemented, the securities financing industry throughout the globe has already been impacted, and new entrants are emerging in the market to help clients navigate the evolving regulatory landscape.
For securities finance transactions, the standardized approach of Basel III results in risk-weighted assets (RWA) that are many multiples higher than under the advanced approach, due to little or no recognition of netting, correlation of loans and collateral or diversification. The current proposal aims to address the shortcomings of the standardized approach for securities finance transactions and will incorporate the aforementioned considerations. Banks have been impacted by Basel III’s higher capital requirements, impacting capital allocated to banks’ prime brokerage businesses as well as the availability of supply from bank-based agent lenders. Additionally, Basel III prescribes a 3% leverage ratio, or even higher standards, as in the case of G-SIBs. In the US, a 5% ratio at the parent-company level and a
6% ratio at the depository level is required for G-SIBs. For many banks, the leverage ratio has superseded the risk-based capital ratios as a binding constraint, and as a result, many banks have engaged in a re-sizing of their balance sheets – eliminating or reducing the amount of low spread transactions undertaken, often including prime brokerage balances.
The Liquidity Coverage Ratio (LCR) requires that internationally active banks maintain sufficient unencumbered High Quality Liquid Assets (HQLA) to meet funding requirements for a significant stress event lasting up to 30 days. Unencumbered HQLA must be 100% of total net cash outflows over a 30-day period based on significant funding market stresses similar to those experienced during the financial crisis. As a result of the LCR, banks’ abilities to provide term financing over 30 days to prime broker clients have been reduced.
Another impact the financial crisis has had on the regulatory environment is the implementation of the Net Stable Funding Ratio (NSFR). NSFR, which has yet to be finalized in some jurisdictions, aims to reduce the reliance on short-term wholesale funding by banks. Banks have traditionally utilized their balance sheets to provide maturity transformation to the market, but such maturity transformation can create systemic instability. Banks will be required to maintain 100% available stable funding (ASF) compared to required stable funding (RSF). This measure assigns ASF weights to a bank’s capital and liabilities that mature in less than six months and between six months and one
year. As a direct result, the cost of funding for certain prime brokerage transactions has increased, making certain transactions uneconomical.
The final piece of Basel III that has directly impacted securities financing is the proposed Large Exposure Limits. Large internationally active banks will be limited to exposures of 25% of their tier one common equity to any single counterparty. Further limitations of 15% will apply to G-SIB to G-SIB exposures. Exposures will be measured based on the standardized approach in securities finance transactions. This may change in the event that the newly proposed standardized method for RWA calculations is adopted. Agent lenders and prime brokers that lend securities to clients may be limited in the size and scope of transactions. This could lead to a decline in supply available to the alternative asset management sector, and has already created a marketplace that welcomes new entrants.
As existing providers consider their response, there has been a proliferation of new entrants performing new roles. At State Street, businesses like Enhanced Custody and Alternative Financing Solutions have been created to address the evolving liquidity landscape. In the traditional Agency Lending businesses, innovative trade structures have become a necessity. As the LCR is phased in and Large Exposure Limits are adopted we will likely see further innovations within securities finance.
REGULATORY IMPACTS ON THE SECURITIES FINANCE INDUSTRY - Glenn Horner, State Street
STATE STREETState Street Bank and Trust Company is among the most financially strong and trusted counterparties in the industry. Our strong credit position, stable funding capabilities and global network give us the resources, expertise and infrastructure to help clients manage regulatory change, mitigate risks and meet competitive challenges.
www.statestreet.com

© Preqin Ltd. 2018 / www.preqin.com18
2018 PREQIN GLOBAL HEDGE FUND REPORT - SAMPLE PAGES 3. HEDGE FUND MANAGEMENT
ASSET FLOWS IN 2017
INDUSTRY GROWTH AS INFLOWS RETURNHaving suffered a year of net outflows (-$109.8bn) in 2016, hedge funds reversed this trend in 2017 with net investor inflows amounting to $49.5bn (as at November 2017), with positive net flows recorded in all four quarters of the year (Fig. 3.1). However, almost as many hedge funds saw outflows (43%) as inflows (44%) over the course of 2017, highlighting the continued difficulties faced by many managers.
Driven by this influx of investor capital, as well as strong hedge fund returns in 2017 (+11.41%), the industry’s assets continued to grow throughout 2017, reaching $3.55tn as at November 2017, representing an increase of 9% since the end of 2016. The US remains the largest market, holding just under three-quarters (74%) of industry assets.
INFLOWS BY STRATEGYMulti-strategy funds recorded the greatest net inflows (+$24.2bn) of any top-level strategy (Fig. 3.2), and with strong annual returns of 10.09% in 2017, the strategy’s aggregate industry assets grew 14% in the 11 months to November 2017 to stand at
$485bn. In comparison, equity strategies recorded net outflows (-$32.6bn) over the course of 2017. However, despite this, the annual performance of equity strategies in 2017 (+15.01%) drove aggregate strategy assets up by 8.6% since the end of 2016 to November 2017.
Only 32% of CTAs saw net inflows in 2017 (Fig. 3.3); however, with net inflows
totalling $22.6bn in 2017 (as at November) it seems the significant amounts of capital flowing into these strategies are going into the hands of only a small number of managed futures managers.
TOP PERFORMERS ATTRACTING INFLOWSPast performance remains a key factor in determining a fund manager’s ability to attract new capital. As shown in Fig. 3.6,
Fig. 3.2: Hedge Fund Asset Flows by Core Strategy
Strategy 2015 ($bn)
2016 ($bn)
Q1 2017 ($bn)
Q2 2017 ($bn)
Q3 2017 ($bn)
Q4 2017 ($bn)*
2017 ($bn)
Industry Assets ($bn)
% Change from Dec-16
Multi-Strategy 27.5 -22.5 -2.3 7.0 13.3 6.2 24.2 485 14.0%
CTA 24.6 25.5 7.2 10.4 -4.0 9.0 22.6 279 11.3%
Macro Strategies -25.8 -5.9 11.1 2.4 -8.5 12.1 17.2 1,054 7.6%
Event Driven Strategies -1.8 -2.9 8.9 0.2 2.7 2.8 14.6 206 16.6%
Niche Strategies 1.3 -0.8 1.1 2.7 2.6 1.8 8.1 24 63.8%
Relative Value Strategies -18.8 -24.7 0.6 7.2 -2.1 -7.1 -1.4 354 4.0%
Credit Strategies 4.2 -28.2 3.1 -12.6 13.9 -7.7 -3.3 251 5.9%
Equity Strategies 60.3 -50.3 -10.0 -12.4 1.3 -11.4 -32.6 894 8.6%
Total Industry 71.4 -109.8 19.7 5.0 19.2 5.6 49.5 3,547 9.2%
Source: Preqin Hedge Fund Online
28.8
47.5
3.9
-8.9-14.3
-19.9
-32.5
-43.1
19.7
5.0
19.2
5.6
-50
-40
-30
-20
-10
0
10
20
30
40
50
60
Q1 Q2 Q3 Q4 Q1 Q2 Q3 Q4 Q1 Q2 Q3 Q4*
2015 2016 2017
Source: Preqin Hedge Fund Online
Qua
rter
ly A
sset
Flo
ws
($bn
)
Fig. 3.1: Quarterly Hedge Fund Asset Flows, Q1 2015 - Q4 2017*
*Q4 2017 asset flows estimated to 30 November 2017.
MACRO STRATEGIES
EQUITY STRATEGIES MULTI-STRATEGY RELATIVE VALUE
STRATEGIES
$1,054bn▲8%
$894bn▲9%
$485bn▲14%
$354bn▲4%
Industry Assets by Strategy
Change over 2017

4. FUNDRAISING
19
2018 PREQIN GLOBAL HEDGE FUND REPORT - SAMPLE PAGES 3. HEDGE FUND MANAGEMENT
32%
34%
40%
42%
43%
46%
55%
23%
13%
16%
14%
14%
13%
12%
46%
53%
44%
44%
43%
41%
33%
0% 20% 40% 60% 80% 100%
CTA
Macro Strategies
Relative Value Strategies
Credit Strategies
Equity Strategies
Event Driven Strategies
Multi-Strategy
Inflow No Change Outflow
Source: Preqin Hedge Fund Online
Proportion of Funds
Fig. 3.3: Hedge Fund Asset Flows over 2017 by Core Strategy
43%
52%
46%
42%
2%
21%
57%
48%
52%
37%
0% 20% 40% 60% 80% 100%
$1bn or More
$500-999mn
$100-499mn
Less than $100mn
Inflow No Change Outflow
Source: Preqin Hedge Fund Online
Proportion of Funds
Fig. 3.4: Hedge Fund Asset Flows over 2017 by Fund Size
the majority (51%) of funds that generated returns of 5% or more in 2016 experienced net inflows; by contrast, two-thirds of funds that generated a loss of greater than 5% in 2016 saw outflows in 2017. Therefore, although past performance may not be indicative of future performance, it is a clear signifier of future asset flows.
OUTLOOK2017 will help bring renewed optimism to many industry participants, as investors looked to allocate fresh capital to the asset class. However, the success in fundraising varies significantly from manager to manager based on strategy, region, size and performance. This emphasizes the
need for fund managers and allocators alike to have access to comprehensive fund-level data to have the greatest insight into the direction of capital flows in 2018 and beyond.
47%
47%
38%
44%
7%
6%
20%
15%
46%
48%
43%
40%
0% 20% 40% 60% 80% 100%
Rest of World
Asia-Pacific
Europe
North America
Inflow No Change Outflow
Source: Preqin Hedge Fund Online
Proportion of Funds
Fig. 3.5: Hedge Fund Asset Flows over 2017 by Fund Manager Headquarters
51%
38%
35%
19%
13%
15%
13%
14%
36%
47%
52%
67%
0% 20% 40% 60% 80% 100%
5% or Greater
0% to 4.99%
-5% to -0.01%
Less than -5%
Inflow No Change Outflow
Source: Preqin Hedge Fund Online
Proportion of Funds
Fig. 3.6: Hedge Fund Asset Flows over 2017 by 2016 Performance
CTAs CREDITSTRATEGIES
EVENT DRIVENSTRATEGIES
NICHE STRATEGIES
$279bn▲11%
$251bn▲6%
$206bn▲17%
$24bn▲64%
Industry Assets by Strategy
Change over 2017

© Preqin Ltd. 2018 / www.preqin.com26
2018 PREQIN GLOBAL HEDGE FUND REPORT - SAMPLE PAGES 4. PERFORMANCE
PERFORMANCE BENCHMARKS2017 2016 2015 3-Year
Annualized5-Year
Annualized3-Year
Volatility5-Year
Volatility
Hedge Funds 11.41 7.67 2.17 7.02 7.76 3.97 3.71CTAs 3.24 0.87 0.80 1.63 3.63 4.67 4.37Alternative Mutual Funds 7.03 3.34 -1.68 2.83 4.20 3.38 3.60UCITS 6.68 1.27 1.46 3.10 3.71 3.59 3.31Funds of Hedge Funds 6.59 -0.01 1.35 2.60 4.12 3.00 2.92
Equity Strategies
Equity Strategies 15.01 7.40 1.22 7.73 8.92 5.80 5.34 Long/Short Equity 12.31 5.66 2.67 6.81 8.24 4.98 4.68 Long Bias 22.44 11.87 -3.37 9.80 10.11 8.95 8.07 Value-Oriented 20.16 11.84 -2.84 9.30 12.95 8.28 7.48 Sector-Focused 24.19 8.29 2.30 11.22 12.92 8.21 7.22Alternative Mutual Funds 10.26 2.93 0.42 4.46 6.73 4.78 4.89UCITS 11.62 0.22 2.53 4.68 5.94 5.27 5.01Funds of Hedge Funds 11.12 -0.39 2.11 4.16 5.85 4.79 4.46
Macro Strategies
Macro Strategies 5.57 7.59 4.35 5.83 5.43 2.35 2.37 Macro 6.19 7.89 6.57 6.88 6.95 2.34 2.49 Commodities 6.58 15.71 -8.81 3.99 -0.51 6.60 6.40 Foreign Exchange 1.22 6.21 1.77 3.04 1.21 2.99 3.25Alternative Mutual Funds 4.68 2.21 -8.37 -0.66 -0.08 3.37 3.52UCITS 2.97 3.21 -0.98 1.71 1.63 3.17 3.03Funds of Hedge Funds 0.37 1.63 0.04 0.68 1.28 2.29 2.44
Event Driven
Strategies
Event Driven Strategies 11.71 12.82 -0.67 7.77 8.52 4.75 4.45 Event Driven 13.37 12.14 -0.22 8.25 9.44 5.11 4.82 Distressed 6.89 15.16 -4.97 5.37 6.14 5.24 4.89 Special Situations 11.10 21.13 -2.76 9.38 8.22 7.14 6.64 Risk/Merger Arbitrage 6.81 8.78 6.15 7.24 6.17 2.63 2.36 Opportunistic 18.63 11.64 1.72 10.44 11.23 5.14 4.76Alternative Mutual Funds 2.65 5.67 -2.07 2.03 n/a 2.74 n/aUCITS 4.64 -0.48 1.05 1.71 2.21 2.96 2.76Funds of Hedge Funds 5.65 4.09 -1.96 2.54 3.27 3.31 3.62
Credit Strategies
Credit Strategies 7.61 8.92 2.36 6.26 6.81 2.23 2.13 Long/Short Credit 7.17 8.96 -0.44 5.15 5.49 2.62 2.53 Fixed Income 8.18 9.36 2.50 6.64 6.17 2.26 2.14 Mortgage-Backed Strategies 8.54 7.33 4.16 6.66 8.78 2.17 2.36 Asset-Backed Lending 6.90 7.75 7.58 7.41 8.87 0.85 1.16 Specialist Credit 9.46 10.72 3.52 7.85 9.01 3.92 3.21Alternative Mutual Funds 4.32 4.62 -1.96 2.28 2.26 2.20 2.30UCITS 3.08 3.27 0.21 2.18 2.33 2.88 2.54Funds of Hedge Funds 3.41 2.27 0.94 2.20 5.57 1.71 2.46
Relative Value
Strategies
Relative Value Strategies 4.31 3.45 5.53 4.43 5.39 1.72 1.59 Equity Market Neutral 2.92 1.48 6.69 3.67 4.91 2.05 1.91 Fixed Income Arbitrage 5.81 5.31 3.17 4.76 4.88 1.90 1.89 Relative Value Arbitrage 5.11 7.12 6.08 6.10 7.62 2.43 2.23 Statistical Arbitrage 3.43 1.79 7.17 4.10 5.27 1.89 2.32 Convertible Arbitrage 7.33 5.49 2.58 5.12 5.79 2.49 2.32Alternative Mutual Funds 0.18 -1.15 0.84 -0.05 0.10 2.71 2.52UCITS 1.81 0.14 2.05 1.33 1.69 1.79 1.51Funds of Hedge Funds 3.96 0.25 2.22 2.13 2.84 1.80 1.80
Multi-Strategy
Multi-Strategy 10.09 6.16 3.52 6.56 6.82 2.58 2.52Alternative Mutual Funds 6.15 4.87 -2.58 2.74 3.90 3.85 4.55UCITS 3.29 1.71 1.04 2.01 2.86 2.67 2.71Funds of Hedge Funds 5.54 -0.41 1.26 2.10 3.73 2.74 2.70
Niche Strategies
Niche Strategies Insurance-Linked Strategies 4.45 3.54 4.97 4.32 5.69 2.65 2.18 Niche 11.51 12.23 13.06 12.27 7.90 4.21 4.63
Fig. 4.1: Summary of Performance Benchmarks, As at December 2017 (Net Returns, %)*

4. FUNDRAISING
27
4. PERFORMANCE2018 PREQIN GLOBAL HEDGE FUND REPORT - SAMPLE PAGES
2017 2016 2015 3-Year Annualized
5-Year Annualized
3-Year Volatility
5-Year Volatility
Trading Styles
Activist 13.87 12.07 0.92 8.80 10.03 5.97 5.50Volatility 9.67 8.77 5.33 7.91 7.55 2.80 2.69Discretionary 12.41 8.31 1.83 7.43 8.95 4.50 4.25Systematic 7.58 4.89 4.60 5.68 6.49 2.55 2.55
North America
North America 9.27 10.85 -0.22 6.52 8.68 4.86 4.55Alternative Mutual Funds 8.38 4.80 -4.09 2.90 5.27 4.94 4.88Funds of Hedge Funds 6.50 1.21 -0.15 2.48 4.84 3.74 3.52
EuropeEurope 8.75 3.63 6.72 6.34 7.01 3.89 3.72UCITS 5.05 -0.67 5.65 3.30 4.70 3.82 3.57Funds of Hedge Funds 3.33 -1.67 4.11 1.89 3.65 2.79 2.79
Asia-PacificAsia-Pacific 18.66 2.37 6.67 9.02 10.11 6.42 5.65UCITS 18.23 -0.88 3.40 6.61 6.27 7.95 6.87Funds of Hedge Funds 15.69 -2.21 5.87 6.20 7.14 5.68 4.99
Emerging Markets
Emerging Markets 15.86 10.08 2.87 9.47 8.25 5.15 4.87 Asia 28.67 3.37 3.93 11.40 12.71 9.73 8.95 Latin America 15.58 21.42 1.95 12.68 8.45 5.94 5.51 Africa 7.54 0.13 8.08 5.18 8.46 3.93 4.02 Russia & Eastern Europe 12.44 16.63 -0.42 9.30 0.43 8.30 10.13 Middle East & Israel 9.83 5.94 2.81 6.15 13.08 6.81 7.88UCITS Hedge Funds 20.52 4.65 -4.49 6.40 4.84 8.63 7.77Funds of Hedge Funds 12.43 2.19 5.81 6.73 7.17 4.34 4.14
Developed Markets
Developed Markets 8.27 7.21 3.68 6.37 7.81 2.83 2.76CTAs -8.58 -1.17 -2.25 -4.05 -1.10 6.34 6.02UCITS 3.11 1.37 0.95 1.80 2.43 2.90 2.55
CTAs
CTAs 3.24 0.87 0.80 1.63 3.63 4.67 4.37 Trend Following 3.46 -0.35 -0.71 0.78 3.64 6.58 6.16 Macro 0.25 -2.01 0.57 -0.40 2.16 4.67 4.33 Counter Trend 4.41 0.09 0.44 1.63 2.68 5.07 4.61 Pattern Recognition 0.23 2.15 2.07 1.48 3.56 4.77 4.45 Arbitrage 2.88 -0.51 1.36 1.23 3.21 3.31 3.13 Option Writing 9.64 5.38 7.55 7.51 4.79 4.21 5.43Discretionary -0.06 5.37 2.08 2.44 2.89 2.77 3.16Systematic 3.37 -0.39 -0.92 0.67 3.23 6.08 5.63Funds of CTAs 0.59 -3.31 -5.59 -2.80 0.77 10.14 9.57
SizeEmerging (Less than $100mn) 10.90 8.23 1.87 6.93 7.19 4.05 3.82Small ($100-499mn) 11.38 6.82 2.79 6.94 7.70 3.97 3.70Medium ($500-999mn) 10.13 6.49 2.26 6.24 6.94 3.63 3.45Large ($1bn or More) 9.47 4.55 2.22 5.37 6.99 3.22 3.21
Currency
USD 12.11 7.34 0.67 6.60 7.48 4.29 4.04EUR 5.19 2.28 3.23 3.56 4.16 3.24 3.03GBP 6.05 3.24 1.80 3.68 2.79 2.26 2.38CHF 3.33 -0.82 2.55 1.67 3.40 3.28 3.39JPY 10.43 2.74 6.82 6.62 11.07 4.36 5.35BRL 14.92 21.28 7.79 14.53 10.87 4.52 4.24AUD 14.52 4.07 8.85 9.06 10.13 5.05 4.50USD - CTAs 3.50 1.05 0.52 1.68 3.69 4.75 4.49EUR - CTAs 5.52 -3.85 2.83 1.42 2.96 7.60 6.77USD - UCITS 11.22 0.89 -0.35 3.79 3.93 4.25 4.04EUR - UCITS 4.84 0.66 2.12 2.53 3.35 3.46 3.14GBP - UCITS 6.13 2.45 1.40 3.31 4.10 2.98 3.13CHF - UCITS 3.56 -1.67 0.72 0.85 1.54 2.96 2.87USD - Funds of Hedge Funds 7.30 0.28 0.49 2.64 4.05 3.15 3.11EUR - Funds of Hedge Funds 3.86 -2.31 0.96 0.81 2.36 3.05 3.05
Source: Preqin Hedge Fund Online
*Please note, all performance information includes preliminary data for December 2017 based on net returns reported to Preqin in early January 2018. Although stated trends and comparisons are not expected to alter significantly, final benchmark values are subject to change.
© Preqin Ltd. 2018 / www.preqin.com36
2018 PREQIN GLOBAL HEDGE FUND REPORT - SAMPLE PAGES 5. INDUSTRY OUTLOOK FOR 2018
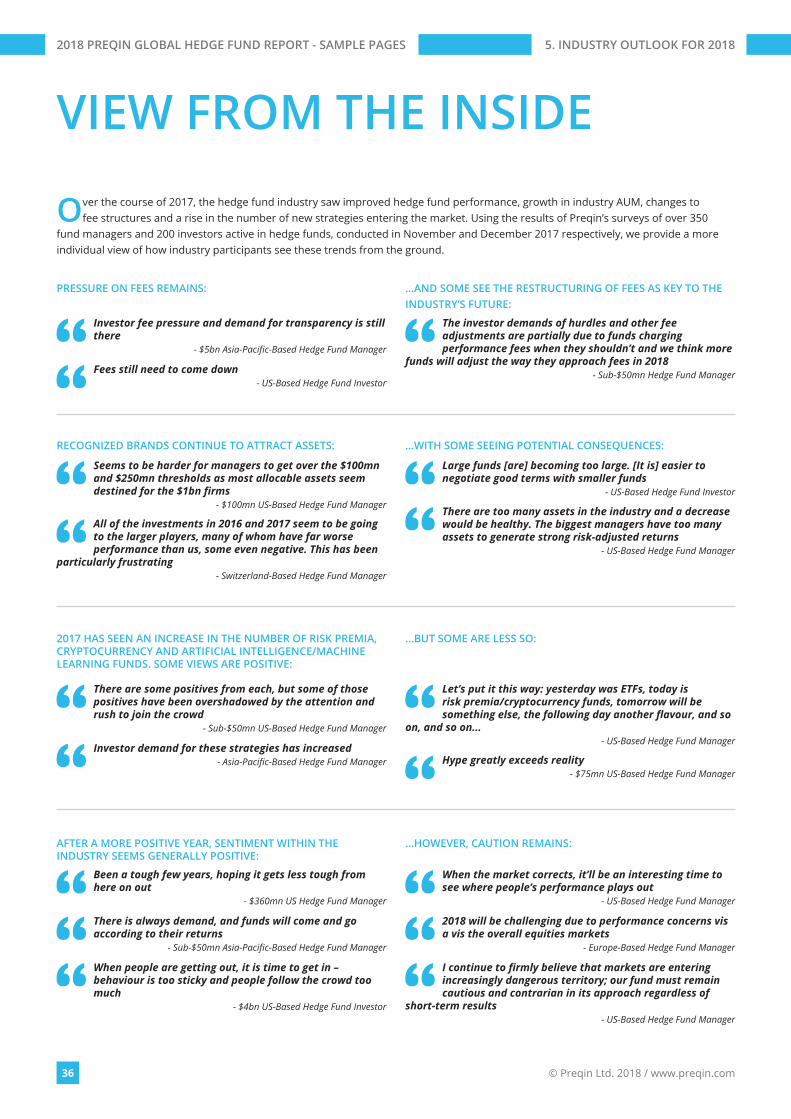
VIEW FROM THE INSIDE
Over the course of 2017, the hedge fund industry saw improved hedge fund performance, growth in industry AUM, changes to fee structures and a rise in the number of new strategies entering the market. Using the results of Preqin’s surveys of over 350
fund managers and 200 investors active in hedge funds, conducted in November and December 2017 respectively, we provide a more individual view of how industry participants see these trends from the ground.
PRESSURE ON FEES REMAINS: …AND SOME SEE THE RESTRUCTURING OF FEES AS KEY TO THE INDUSTRY’S FUTURE:
Investor fee pressure and demand for transparency is still there
- $5bn Asia-Pacific-Based Hedge Fund Manager
RECOGNIZED BRANDS CONTINUE TO ATTRACT ASSETS: …WITH SOME SEEING POTENTIAL CONSEQUENCES:
2017 HAS SEEN AN INCREASE IN THE NUMBER OF RISK PREMIA, CRYPTOCURRENCY AND ARTIFICIAL INTELLIGENCE/MACHINE LEARNING FUNDS. SOME VIEWS ARE POSITIVE:
…BUT SOME ARE LESS SO:
The investor demands of hurdles and other fee adjustments are partially due to funds charging performance fees when they shouldn’t and we think more
funds will adjust the way they approach fees in 2018- Sub-$50mn Hedge Fund ManagerFees still need to come down
- US-Based Hedge Fund Investor
Seems to be harder for managers to get over the $100mn and $250mn thresholds as most allocable assets seem destined for the $1bn firms
- $100mn US-Based Hedge Fund Manager
All of the investments in 2016 and 2017 seem to be going to the larger players, many of whom have far worse performance than us, some even negative. This has been
particularly frustrating- Switzerland-Based Hedge Fund Manager
Large funds [are] becoming too large. [It is] easier to negotiate good terms with smaller funds
- US-Based Hedge Fund Investor
There are too many assets in the industry and a decrease would be healthy. The biggest managers have too many assets to generate strong risk-adjusted returns
- US-Based Hedge Fund Manager
There are some positives from each, but some of those positives have been overshadowed by the attention and rush to join the crowd
- Sub-$50mn US-Based Hedge Fund Manager
Investor demand for these strategies has increased- Asia-Pacific-Based Hedge Fund Manager
Let’s put it this way: yesterday was ETFs, today is risk premia/cryptocurrency funds, tomorrow will be something else, the following day another flavour, and so
on, and so on...- US-Based Hedge Fund Manager
Hype greatly exceeds reality- $75mn US-Based Hedge Fund Manager
AFTER A MORE POSITIVE YEAR, SENTIMENT WITHIN THE INDUSTRY SEEMS GENERALLY POSITIVE:
…HOWEVER, CAUTION REMAINS:
Been a tough few years, hoping it gets less tough from here on out
- $360mn US Hedge Fund Manager
There is always demand, and funds will come and go according to their returns
- Sub-$50mn Asia-Pacific-Based Hedge Fund Manager
When people are getting out, it is time to get in – behaviour is too sticky and people follow the crowd too much
- $4bn US-Based Hedge Fund Investor
When the market corrects, it’ll be an interesting time to see where people’s performance plays out
- US-Based Hedge Fund Manager
2018 will be challenging due to performance concerns vis a vis the overall equities markets
- Europe-Based Hedge Fund Manager
I continue to firmly believe that markets are entering increasingly dangerous territory; our fund must remain cautious and contrarian in its approach regardless of
short-term results- US-Based Hedge Fund Manager

© Preqin Ltd. 2018 / www.preqin.com60
2018 PREQIN GLOBAL HEDGE FUND REPORT - SAMPLE PAGES 7. INVESTORS
Preqin estimates that institutional investors allocate $2.06tn to hedge
funds, approximately 58% of all capital invested in the industry today. In capital terms this is the highest level Preqin has recorded; however, the level has fallen proportionally from highs in 2013 as institutional inflows have slowed in a period of growing appetite from private sources of wealth and retail clients. Nevertheless, gaining interest from institutional investors, with their long-term investment horizons and “sticky” capital, can be vital to the long-term development of a hedge fund business. However, under
the umbrella of “institutional investor” fall many different types of institutions with different sets of challenges and portfolio needs that hedge funds help to solve. Therefore, gaining insight into the differences between types of investors – both on a macro level and an individual basis – is an important step towards securing capital from these investors.
In this section we examine these allocators in more detail, based on data taken from Preqin’s online platform, to help you understand the needs of institutions in 2018 and really “Know Your Investor”.
KNOW YOUR INVESTOR
5,287Number of investors tracked by Preqin.
$2.06tnAmount of capital invested in hedge
funds by institutional investors.
45%of institutional investors allocate to
hedge funds.
PROPORTION OF HEDGE FUND INDUSTRY CAPITAL COMING FROM INSTITUTIONAL
INVESTORS
474public pension funds invest in hedge
funds globally.
51%of public pension funds actively invest
in hedge funds.
$21.0bnLargest allocation to hedge funds of any public pension fund investor –
ABP (managed by APG – All Pensions Group).
Public pension funds have become prominent investors in hedge funds over the past decade and their actions and activity in the asset class have helped shaped the industry we see today. There has been much focus on these investors in recent years following the cuts made to hedge fund investments by CalPERS and a handful of other high-profile pension funds. However, the “will they – won’t they?” debate around the wider mass exit of public retirement funds from investment in
hedge funds is landing firmly on the side of public pension funds remaining committed to hedge fund investment long term. Today we see more public pension funds investing in hedge funds than ever before, collectively investing their largest sum of capital on record. Much of the increase in capital coming from public pension funds continues to be driven by new schemes making their first investments in the asset class, particularly as new regions open up to the possibility of hedge fund investment.
Recent relaxation of regulations in South Korea, for instance, has led to investors such as National Pension Service making their first investments; others including Yellow Umbrella Mutual Aid Fund have begun to consider investment for the first time. Although the average allocation to hedge funds by public pension funds has remained stable since 2016 (at 7.9% of AUM, Fig. 7.5), we have noted broader changes to their investment portfolios. Public pension funds continue to move away from a complete fund of hedge funds
PUBLIC PENSION FUNDS
2011
2012
2013
2014
2015
2016
2017
61% 63% 65%62% 60% 58% 58%
© Preqin Ltd. 2018 / www.preqin.com74
2018 PREQIN GLOBAL HEDGE FUND REPORT - SAMPLE PAGES 8. OVERVIEW OF THE INDUSTRY BY STRATEGY
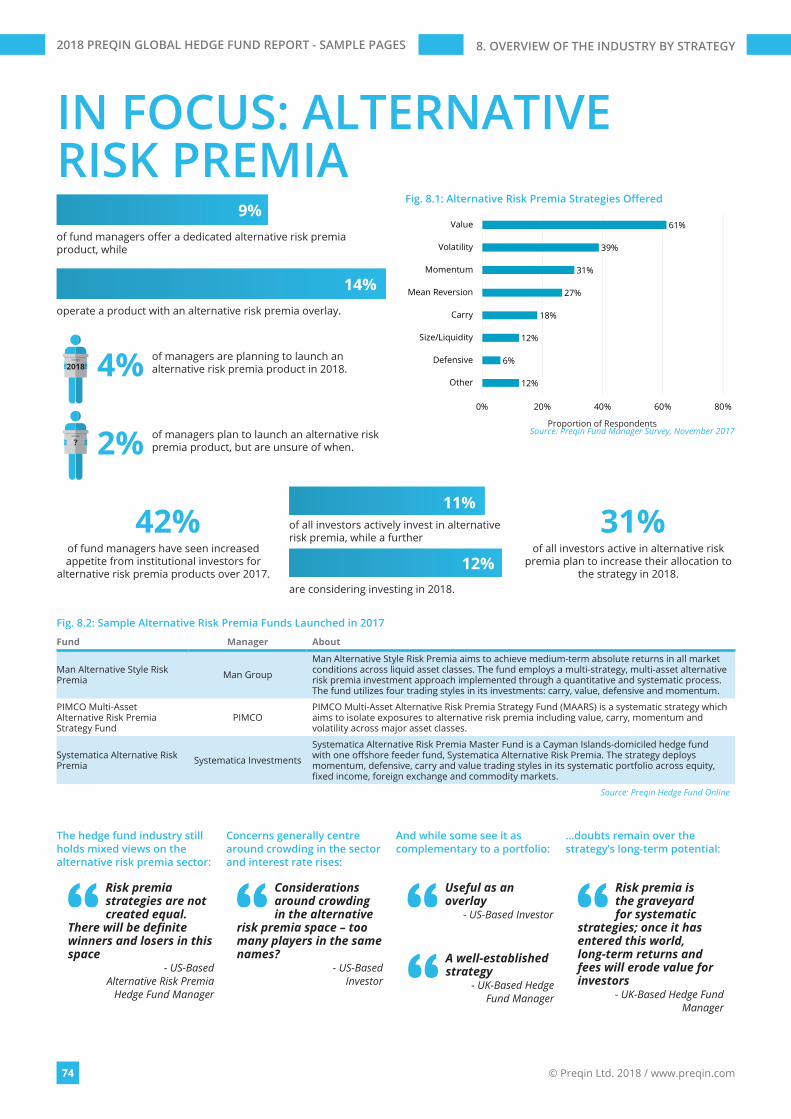
IN FOCUS: ALTERNATIVE RISK PREMIA
2018
?
12%
6%
12%
18%
27%
31%
39%
61%
0% 20% 40% 60% 80%
Other
Defensive
Size/Liquidity
Carry
Mean Reversion
Momentum
Volatility
Value
Source: Preqin Fund Manager Survey, November 2017Proportion of Respondents
Fig. 8.1: Alternative Risk Premia Strategies Offered
of fund managers offer a dedicated alternative risk premia product, while
9%
14%operate a product with an alternative risk premia overlay.
of managers are planning to launch an alternative risk premia product in 2018.4%
of managers plan to launch an alternative risk premia product, but are unsure of when.2%
42%of fund managers have seen increased appetite from institutional investors for
alternative risk premia products over 2017.
31%of all investors active in alternative risk
premia plan to increase their allocation to the strategy in 2018.
of all investors actively invest in alternative risk premia, while a further
are considering investing in 2018.
11%
12%
The hedge fund industry still holds mixed views on the alternative risk premia sector:
Concerns generally centre around crowding in the sector and interest rate rises:
And while some see it as complementary to a portfolio:
…doubts remain over the strategy’s long-term potential:
Risk premia strategies are not created equal.
There will be definite winners and losers in this space
- US-BasedAlternative Risk Premia
Hedge Fund Manager
Considerations around crowding in the alternative
risk premia space – too many players in the same names?
- US-BasedInvestor
Useful as an overlay
- US-Based Investor
A well-established strategy
- UK-Based Hedge Fund Manager
Risk premia is the graveyard for systematic
strategies; once it has entered this world, long-term returns and fees will erode value for investors
- UK-Based Hedge Fund Manager
Fig. 8.2: Sample Alternative Risk Premia Funds Launched in 2017
Fund Manager About
Man Alternative Style Risk Premia Man Group
Man Alternative Style Risk Premia aims to achieve medium-term absolute returns in all market conditions across liquid asset classes. The fund employs a multi-strategy, multi-asset alternative risk premia investment approach implemented through a quantitative and systematic process. The fund utilizes four trading styles in its investments: carry, value, defensive and momentum.
PIMCO Multi-Asset Alternative Risk Premia Strategy Fund
PIMCOPIMCO Multi-Asset Alternative Risk Premia Strategy Fund (MAARS) is a systematic strategy which aims to isolate exposures to alternative risk premia including value, carry, momentum and volatility across major asset classes.
Systematica Alternative Risk Premia Systematica Investments
Systematica Alternative Risk Premia Master Fund is a Cayman Islands-domiciled hedge fund with one offshore feeder fund, Systematica Alternative Risk Premia. The strategy deploys momentum, defensive, carry and value trading styles in its systematic portfolio across equity, fixed income, foreign exchange and commodity markets.
Source: Preqin Hedge Fund Online

© Preqin Ltd. 2018 / www.preqin.com80
2018 PREQIN GLOBAL HEDGE FUND REPORT - SAMPLE PAGES 8. OVERVIEW OF THE INDUSTRY BY STRATEGY
CREDIT STRATEGIES
2.75%
1.53% 1.73% 1.40%
7.61%
6.26% 6.81%
3.53% 4.57%
2.98% 2.89%
11.41%
7.02%7.76%
0%
2%
4%
6%
8%
10%
12%
Q1
2017
Q2
2017
Q3
2017
Q4
2017
2017
3-Ye
arAn
nual
ized
5-Ye
arAn
nual
ized
Credit Strategies Funds All Hedge FundsSource: Preqin Hedge Fund Online
Net
Ret
urn
Fig. 8.18: Performance of Credit Strategies Funds (As at December 2017)*
0.9% 0.5% 4%
31% 30%
19%
8% 7%
0.8% 2%
13%
24%
34%
17%
6%2%
0%
5%
10%
15%
20%
25%
30%
35%
40%
Less
than
-10%
-10%
to -5
.01%
-5%
to -0
.01%
0% to
4.9
9%
5% to
9.9
9%
10%
to 1
4.99
%
15%
to 1
9.99
%
20%
or G
reat
er
2016
2017
Source: Preqin Hedge Fund Online
Prop
ortio
n of
Fun
ds
Annual Net Return
Fig. 8.19: Distribution of Credit Strategies Fund Returns, 2016 vs. 2017*
Fig. 8.20: Performance of Credit Strategies Funds by Sub-Strategy (As at December 2017)*
Q1 2017 Q2 2017 Q3 2017 Q4 2017 2017 3-Year Annualized 3-Year Volatility
Specialist Credit4.07%
Mortgage-Backed Strategies
2.64%
Fixed Income2.13%
Specialist Credit1.84%
Specialist Credit9.46%
Specialist Credit7.85%
Asset-Backed Lending Strategies
0.85%
Fixed Income2.77%
Asset-Backed Lending Strategies
1.92%
Long/Short Credit1.66%
Fixed Income1.59%
Mortgage-Backed Strategies
8.54%
Asset-Backed Lending Strategies
7.41%
Mortgage-Backed Strategies
2.17%
Mortgage-Backed Strategies
2.69%
Specialist Credit1.75%
Asset-Backed Lending Strategies
1.55%
Long/Short Credit1.58%
Fixed Income8.18%
Mortgage-Backed Strategies
6.66%
Fixed Income2.26%
Long/Short Credit2.63%
Fixed Income1.45%
Specialist Credit1.50%
Mortgage-Backed Strategies
1.51%
Long/Short Credit7.17%
Fixed Income6.64%
Long/Short Credit2.62%
Asset-Backed Lending Strategies
2.26%
Long/Short Credit1.12%
Mortgage-Backed Strategies
1.45%
Asset-Backed Lending Strategies
1.00%
Asset-Backed Lending Strategies
6.90%
Long/Short Credit5.15%
Specialist Credit3.92%
Source: Preqin Hedge Fund Online
26% 22%34% 30% 26%
19%
40%38%
35%32%
35% 43%
19%15%
10% 19%14% 16%
10%16% 12% 13%
19% 14%
5% 8% 8% 6% 6% 9%
0%
10%
20%
30%
40%
50%
60%
70%
80%
90%
100%
2012 2013 2014 2015 2016 2017
Specialist Credit
Asset-BackedLending Strategies
Mortgage-BackedStrategies
Long/Short Credit
Fixed Income
Source: Preqin Hedge Fund Online
Prop
ortio
n of
Fun
d La
unch
es
Year of Inception
Fig. 8.17: Credit Strategies Fund Launches by Core Strategy and Year of Inception, 2012 - 2017
*Please note, all performance information includes preliminary data for December 2017 based on net returns reported to Preqin in early January 2018. Although stated trends and comparisons are not expected to alter significantly, final benchmark values are subject to change.
FundManagers
Investors
Active Funds
AUM (As at November
2017)
651
2,168
1,805
$251bn

© Preqin Ltd. 2018 / www.preqin.com98
2018 PREQIN GLOBAL HEDGE FUND REPORT - SAMPLE PAGES 10. CTAs
OVERVIEW OF CTAs
Volatility and fluctuations in commodity and currency markets continued to
drive trends in the managed futures/CTA industry in 2017. A number of high-profile elections in Europe saw the euro fluctuate as markets responded to the election victories of Mark Rutte, Emmanuel Macron and Angela Merkel; the Brazilian real weakened in May amid corruption allegations against President Temer, and strong growth in US GDP over the course
of Q3 2017 saw the dollar strengthen. In July, the price of copper hit a two-year high following reports China could move to ban imports of scrap metal, and while the price of gold fluctuated over the course of the year, the safe-haven asset has gained since the lows seen in January 2017.
Oil saw a sharp trend reversal in the middle of 2017 as Saudi Arabia and Nigeria announced plans to cut production, while
US output showed signs of a slowdown; these events drove the price of crude oil to its biggest daily and weekly gains of 2017, kickstarting a trend by which the price of crude oil continued to rise over 2017, hitting over $60/barrel at the end of the year.
The trend reversals and volatile conditions in currency and commodity
markets are reflected in the 2017 return of the Preqin All-Strategies CTA benchmark: below water for five months and above for seven months of the year, the benchmark returned 3.24% in 2017, in contrast to the 12 positive months and 11.41% return of the Preqin All-Strategies Hedge Fund benchmark over the same period (Fig. 10.1). With CTAs providing potential diversification from equity markets, they have struggled in a year which has seen major stock markets around the world continuously reach record highs.
Q1: -0.64%. The first quarter of 2017 saw price swings across various commodity markets create challenging conditions for
-0.93%
0.49% 0.53%
-0.14% -0.06%
2.44%2.89%
-0.98%
-0.53%
0.06%
4.90%
3.37%
0.67%
3.23%
-0.64%
0.00%0.30%
3.59%3.24%
1.63%
3.63%
-2%
-1%
0%
1%
2%
3%
4%
5%
6%
Q1
2017
Q2
2017
Q3
2017
Q4
2017
2017
3-Ye
arAn
nual
ized
5-Ye
arAn
nual
ized
DiscretionaryCTAs
SystematicCTAs
All CTAs
Source: Preqin Hedge Fund Online
Net
Ret
urn
Fig. 10.1: Performance of CTAs (As at December 2017)*
Fig. 10.2: CTA Performance by Strategy (As at December 2017)*
Q1 2017 Q2 2017 Q3 2017 Q4 2017 2017 3-Year Annualized 3-Year Volatility
Option Writing3.48%
Option Writing3.04%
Option Writing2.32%
Trend Following4.88%
Option Writing9.64%
Option Writing7.51%
Arbitrage3.31%
Arbitrage0.63%
Counter Trend-0.38%
Arbitrage0.75%
Counter Trend4.59%
Counter Trend4.41%
Counter Trend1.63%
Option Writing4.21%
Counter Trend-0.21%
Arbitrage-0.45%
Counter Trend0.42%
Macro2.48%
Trend Following3.46%
Pattern Recognition1.48%
Macro4.67%
Pattern Recognition-0.63%
Trend Following-0.51%
Macro0.35%
Pattern Recognition2.47%
Arbitrage2.88%
Arbitrage1.23%
Pattern Recognition4.77%
Trend Following-1.17%
Macro-1.25%
Trend Following0.33%
Arbitrage1.93%
Macro0.25%
Trend Following0.78%
Counter Trend5.07%
Macro-1.28%
Pattern Recognition-1.48%
Pattern Recognition-0.09%
Option Writing0.49%
Pattern Recognition0.23%
Macro-0.40%
Trend Following6.58%
Source: Preqin Hedge Fund Online
*Please note, all performance information includes preliminary data for December 2017 based on net returns reported to Preqin in early January 2018. Although stated trends and comparisons are not expected to alter significantly, final benchmark values are subject to change.
PERFORMANCE OF CTAs IN 2017

© Preqin Ltd. 2018 / www.preqin.com126
2018 PREQIN GLOBAL HEDGE FUND REPORT - SAMPLE PAGES 14. LEAGUE TABLES
LEADING FUND MANAGERS
Fig. 14.14: Largest Hedge Fund Managers in Europe
Rank Change from 2017 Manager Location Year
Established Assets under Management
1 - Man Group UK 1983 $64.6bn as at 30 September 2017
2 - Standard Life Investments (Part of Aberdeen Standard Investments) UK 1998 $32.3bn as at 30 September 2017
3 ▲1 Marshall Wace UK 1997 $30.0bn as at 1 October 20174 ▼1 Winton Capital Management UK 1997 $28.4bn as at 30 September 20175 - GAM UK 1983 $20.7bn as at 30 June 20176 ▲4 The Children's Investment Fund Management UK 2003 $16.7bn as at 30 September 20177 ▲1 Capula Investment Management UK 2005 $16.3bn as at 30 September 2017= ▲2 Cevian Capital Sweden 2002 $16.3bn as at 30 September 20179 ▼2 Brummer & Partners Sweden 1995 $14.6bn as at 30 September 2017
10 ▲1 AlphaGen Capital** UK 1999 $13.6bn as at 30 September 2017
Source: Preqin Hedge Fund Online
Fig. 14.15: Largest Hedge Fund Managers in Asia-Pacific
Rank Change from 2017 Manager Location Year
Established Assets under Management
1 - Platinum Asset Management Australia 1994 $19.4bn as at 30 September 20172 ▼1 Hillhouse Capital Management China 2005 $17.6bn as at 30 November 20173 - Value Partners Hong Kong 1993 $16.5bn as at 30 September20174 * Springs Capital China 2007 $8.0bn as at 30 September 20175 ▼1 PAG Absolute Returns Hong Kong 2002 $7.2bn as at 30 September 20176 ▼1 Dymon Asia Capital Singapore 2008 $5.4bn as at 30 September 20177 ▼1 Graticule Asset Management Asia Singapore 2014 $5.3bn as at 30 September 20178 ▼1 Tybourne Capital Management Hong Kong 2010 $5.0bn as at 31 October 20179 * Lakefront Asset Management (BJ) China 2011 $4.1bn as at 30 September 2017= ▼2 Myriad Asset Management Hong Kong 2011 $4.1bn as at 1 June 2017
Source: Preqin Hedge Fund OnlineFig. 14.16: Largest Hedge Fund Managers in Rest of World
Rank Change from 2017 Manager Location Year
Established Assets under Management
1 - Verde Asset Management Brazil 2015 $10.0bn as at 30 September 20172 - SPX Capital Brazil 2010 $7.2bn as at 30 September 20173 ▲2 Gávea Investimentos Brazil 2003 $2.3bn as at 30 September 20174 ▼1 JGP Global Gestão de Recursos Brazil 1998 $2.2bn as at 30 September 20175 ▼1 Tarpon Investment Group Brazil 2002 $1.9bn as at 30 September 20176 - Claritas Investments Brazil 1999 $1.7bn as at 17 September 20177 * Apex Capital Brazil 2011 $1.4bn as at 29 September 20178 ▲4 Sphera Funds Management Israel 2004 $1.3bn as at 1 October 20179 - Canvas Capital Brazil 2012 $1.2bn as at 30 September 2017
10 * Ibiuna Investimentos Brazil 2010 $1.1bn as at 30 September 2017
Source: Preqin Hedge Fund Online
Fig. 14.13: Largest Hedge Fund Managers in North America
Rank Change from 2017 Manager Location Year
Established Assets under Management
1 - Bridgewater Associates US 1975 $160.4bn as at 30 September 20172 - AQR Capital Management US 1998 $106.2bn as at 30 June 20173 ▲1 Renaissance Technologies US 1982 $50.9bn as at 30 September 20174 * JP Morgan Asset Management US 1974 $43.1bn as at 30 September 20175 ▲5 Two Sigma Investments US 2002 $35.4bn as at 30 June 20176 ▼1 Millennium Management US 1989 $35.3bn as at 1 November 20177 - Elliott Management US 1977 $32.8bn as at 30 June 20178 ▼5 Och-Ziff Capital Management US 1994 $31.8bn as at 1 October 20179 ▼1 Baupost Group US 1982 $31.1bn as at 30 June 2017
10 ▲4 Davidson Kempner Capital Management US 1990 $29.7bn as at 30 September 2017
Source: Preqin Hedge Fund Online
▲X: Higher ranking in league table, up X places from 2017 Preqin Global Hedge Fund Report.▼X: Lower ranking in league table, down X places from 2017 Preqin Global Hedge Fund Report.- : No change in ranking from 2017 Preqin Global Hedge Fund Report.*Change in position unavailable as 2016 year-end data was not accessible at time of publishing the 2017 Preqin Global Hedge Fund Report.**In May 2017, Janus Capital Group Inc. and Henderson Group plc merged to form Janus Henderson Group plc. AlphaGen Capital manages the Group’s hedge fund investments.
The 2018 Preqin Global Alternatives Reports are the most detailed and comprehensive reviews of the alternative assets industry available, offering exclusive insight into the latest developments in the private equity, hedge fund, real estate, infrastructure, private debt and natural resources asset classes.
■ Access in-depth analysis and comprehensive statistics, helping you to understand the latest trends in fundraising, performance, investors, deals, fund managers, secondaries, fund terms, placement agents, consultants, law firms and much more.
■ View historical data alongside the most important industry developments. Read contributions from some of the industry’s leading figures.
■ Improve your presentations, marketing materials and company reports. ■ Discover the most important players in every area of the industry. ■ Answer key questions: Who is investing? How much has been raised? Where are the centres of
activity? Where is the capital going? What are the biggest deals? What is the outlook for the industry?
2018 PREQIN GLOBAL ALTERNATIVES REPORTS
For more information visit: www.preqin.com/reports
PAYMENT DETAILS: SHIPPING DETAILS:
Cheque enclosed (cheque payable to ‘Preqin’) Name:________________________________
Telephone:________________________________
Charge my: Visa Firm:________________________________
Email:________________________________
Mastercard Job Title:________________________________
Amex Address:________________________________
Please invoice me ________________________________
Currency: USD GBP EUR ________________________________
Card Number:________________________________
City:________________________________
Name on Card:________________________________
State:________________________________
Expiration Date:________________________________
Post/Zip:________________________________
Security Code:________________________________
Country:________________________________
COMPLETED ORDER FORMSPost (to Preqin):
NEW YORKOne Grand Central Place60 E 42nd StreetSuite 630New YorkNY 10165Tel: +1 212 350 0100Fax: +1 440 445 9595
LONDON3rd FloorVintners’ Place68 Upper Thames StreetLondonEC4V 3BJTel: +44 (0)20 3207 0200Fax: +44 (0)870 330 5892
SINGAPOREOne Finlayson Green#11-02Singapore049246
Tel: +65 6305 2200Fax: +65 6491 2240
SAN FRANCISCOOne Embarcadero CenterSuite 2850San FranciscoCA 94111
Tel: +1 415 316 0580 Fax: +1 440 445 9595
HONG KONGLevel 9, Central Building1-3 Pedder StreetCentral, Hong Kong
Tel: +852 3892 0200
American Express, four-digit code printed on the front of the card.
Visa and Mastercard, last three digits printed on the signature strip.
2018PREQIN GLOBALREAL ESTATEREPORT
ISBN: 978-1-907012-97-6$175 / £125 / €150www.preqin.com
2018PREQIN GLOBALINFRASTRUCTUREREPORT
ISBN: 978-1-907012-97-6$175 / £125 / €150www.preqin.com
2018PREQIN GLOBALPRIVATE DEBTREPORT
ISBN: 978-1-907012-97-6$175 / £125 / €150www.preqin.com
2018PREQIN GLOBALNATURAL RESOURCESREPORT
ISBN: 978-1-907012-97-6$175 / £125 / €150www.preqin.com
2018PREQIN GLOBALHEDGE FUNDREPORT
ISBN: 978-1-907012-97-6$175 / £125 / €150www.preqin.com
2018PREQIN GLOBALPRIVATE EQUITY &VENTURE CAPITALREPORT
ISBN: 978-1-907012-97-6$175 / £125 / €150www.preqin.com
I would like to purchase:
PRINTName First Copy Each Additional Copy Quantity Data Pack* Private Equity & Venture Capital $175/£125/€150 $90/£65/€75 $300/£215/€260
Hedge Funds $175/£125/€150 $90/£65/€75 $300/£215/€260
Real Estate $175/£125/€150 $90/£65/€75 $300/£215/€260
Infrastructure $175/£125/€150 $90/£65/€75 $300/£215/€260
Private Debt $175/£125/€150 $90/£65/€75 $300/£215/€260
Natural Resources $175/£125/€150 $90/£65/€75 $300/£215/€260
All Six Titles (25% Saving!) $785/£560/€675 $395/£280/€340 $1,350/£965/€1,160
Shipping Costs: $40/£10/€25 for single publication $20/£5/€12 for additional copies
(Shipping costs will not exceed a maximum of $60/£15/€37 per order when all shipped to same address. If shipped to multiple addresses then full postage rates apply for additional copies.)
If you would like to order more than 10 copies of one title, please contact us for a special rate
DIGITALName Single-User Licence Each Additional Copy Quantity Enterprise Licence** Data Pack* Private Equity & Venture Capital $175/£125/€150 $90/£65/€75 $1,000/£715/€860 $300/£215/€260
Hedge Funds $175/£125/€150 $90/£65/€75 $1,000/£715/€860 $300/£215/€260
Real Estate $175/£125/€150 $90/£65/€75 $1,000/£715/€860 $300/£215/€260
Infrastructure $175/£125/€150 $90/£65/€75 $1,000/£715/€860 $300/£215/€260
Private Debt $175/£125/€150 $90/£65/€75 $1,000/£715/€860 $300/£215/€260
Natural Resources $175/£125/€150 $90/£65/€75 $1,000/£715/€860 $300/£215/€260
All Six Titles (25% Saving!) $785/£560/€675 $395/£280/€340 $4,500/£3,215/€3,860 $1,350/£965/€1,160
*Data packs feature all the chart and league table data in an Excel file. Must be purchased alongside the associated report.**Enterprise Licence allows for team-wide digital access.Please note all prices quoted throughout are exclusive of sales taxes.