2017 preqin global hedge fund report sample...
TRANSCRIPT
2017PREQIN GLOBALHEDGE FUNDREPORT
SAMPLE PAGES
alternative assets. intelligent data.
ISBN: 978-1-907012-98-3$175 / £125 / €150www.preqin.com
© Preqin Ltd. 2017 / www.preqin.com2
2017 PREQIN GLOBAL HEDGE FUND REPORT - SAMPLE PAGES
CEO’s Foreword - Mark O’Hare 4
1: 2017 PREQIN GLOBAL HEDGE FUND REPORT
Hedge Fund Identity Crisis Reshapes Asset Management- Basil Williams, PAAMCO
6
2: OVERVIEW OF THE HEDGE FUND INDUSTRY
Hedge Funds: 2016 in Numbers 10
Despite Improved Performance in 2016, Investors Remain Cautious in 2017 - Amy Bensted, Preqin
12
The Future Is Bright, but Fees and Regulation Remain Challenges - Jim Cass, SEI Investment Manager Services
13
The Shifting Landscape of Prime Brokerage - Steven Sanders, Interactive Brokers
15
Partnerships Are Deepening between Alternative Investment Fund Managers and Investors - Jack Inglis, AIMA
17
Why Investors Invest - Richard H. Baker, Managed Funds Association
18
3: KEY EVENTS IN 2016
Timeline of Key Events in 2016 20
In Focus: Brexit 22
In Focus: Commodity Market Volatility 23
In Focus: Central Bank Intervention 24
In Focus: US Election 25
4: INDUSTRY PERFORMANCE IN 2016
Introduction 28
Performance Benchmarks 29
In Focus: Emerging Markets 31
Performance in 2016 32
Performance over the Longer Term 34
Top Performing Funds 37
Most Consistent Top Performing Funds 42
5: ASSET FLOWS IN 2016
Asset Flows in 2016 48
Leading Fund Managers 50
6: OVERVIEW OF THE HEDGE FUND MANAGEMENT INDUSTRY
Introduction 54
Fund Managers and Funds Overview 55
Leading Hedge Funds 60
Fund Manager Outlook for 2017 62
7: FEES AND OTHER TERMS AND CONDITIONS
Investor Attitudes towards Fund Terms and Conditions 68
Management and Performance Fees 72
Hedge Fund Employment 76
8: OVERVIEW OF THE INDUSTRY BY STRATEGY
Introduction 78
In Focus: Alternative Risk Premia 79
Equity Strategies 80
Macro Strategies 82
Event Driven Strategies 84
Credit Strategies 86
Relative Value Strategies 88
Multi-Strategy 90
Niche Strategies 92
Volatility Trading Funds 93
Activist Funds 94
Discretionary vs. Systematic Traders 96
Predictions for 2016: How Accurate Were They? 98
CONTENTS
Preqin’s Hedge Fund Online is the leading source of intelligence on the hedge fund industry. Hedge Fund Online is
Preqin’s fl agship hedge fund information resource, incorporating all of our hedge fund data, intelligence and functionality,
providing you with the most comprehensive coverage of the asset class available.
Constantly updated by our teams of dedicated researchers around the globe, Hedge Fund Online is a vital source of data
and information for professionals seeking to keep up-to-date with the latest developments in the industry.
www.preqin.com/hedge
HEDGE FUND ONLINE
3
2017 PREQIN GLOBAL HEDGE FUND REPORT - SAMPLE PAGES
9: INVESTORS & GATEKEEPERS
Introduction 100
Largest Investors by Region 101
Largest Investors by Type 102
Investor Outlook for 2017 103
Know Your Investor 107
Fund Searches and Mandates 112
Private Wealth Firms Investing in Hedge Funds 115
Investment Consultant Outlook for 2017 117
In Focus: Public Pension Funds 121
Sample Investors to Watch in 2017 122
How Investors Source and Select Funds 123
10: FUNDS OF HEDGE FUNDS
Introduction 126
Overview of Funds of Hedge Funds 127
Challenges and Opportunities for Funds of Hedge Funds 132
11: CTAs
In Uncertain Times, Managed Futures Can Add Value - Mick Swift, Abbey Capital
136
Introduction 138
Overview of CTAs 139
12: LIQUID ALTERNATIVES
Introduction 144
Overview of Liquid Alternatives 145
13: MANAGED ACCOUNTS
Introduction 150
Overview of Managed Accounts 151
14: SERVICE PROVIDERS
Introduction 156
Fund Administrators 157
Fund Custodians 158
Prime Brokers 159
Fund Auditors 160
Law Firms 161
Fund Marketers 162
The data behind all of the charts featured in the Report is available to purchase in Excel format.
Ready-made charts are also included that can be used for presentations, marketing materials and
company reports.
To purchase the data pack, please visit:
www.preqin.com/ghfr
DATA PACK FOR 2017 PREQIN GLOBAL HEDGE FUND REPORT
© Preqin Ltd. 2017 / www.preqin.com6
1. 2017 PREQIN GLOBAL HEDGE FUND REPORT2017 PREQIN GLOBAL HEDGE FUND REPORT - SAMPLE PAGES
OVERVIEW
A paradigm shift within the asset management industry is at hand. Disappointing performance across both traditional and alternative investment approaches has opened the door for change. The barriers between traditional asset management and alternative asset management are rapidly blurring. New products that marry the investment goals of traditional active investment mandates with the trading strategies utilized by the best alternative managers are emerging, and institutional investors are taking notice. This innovative hybrid approach seeks to solve the return conundrum created by the low return environment brought on by years of easy monetary policy globally.
Active long-only asset management has performed poorly in recent years, rattling investors’ confi dence in their traditional investment approach. The growth of the hedge fund industry has ‘stolen’ some of the alpha once captured by active long-only managers. As a result, passive investments have taken signifi cant market share from what was once an active-only world. Nonetheless, for most of 2016, hedge funds and funds of hedge funds have come into the spotlight as their value proposition of either better performance or diversifi ed returns is being challenged. Many managers have failed to deliver the diversifying or ‘alternative’ performance that they had asserted was possible. In addition, clarity surrounding investment mandates, which is key to successfully measuring a manager’s performance, is currently lacking within the industry, creating an identity crisis.
Along with these structural shifts, most institutional investors are failing to achieve their targeted investment returns, creating the opportunity for change. One promising innovation will be investment approaches that integrate hedge fund techniques into more traditional equity
or fi xed income mandates, thereby redefi ning the world of active investing. By utilizing investment strategies heretofore used only in the alternative arena, investment managers with the vision, skills and infrastructure to implement this multidisciplinary investment process will be in a position to attract market share from both the active and passive segments of traditional managers.
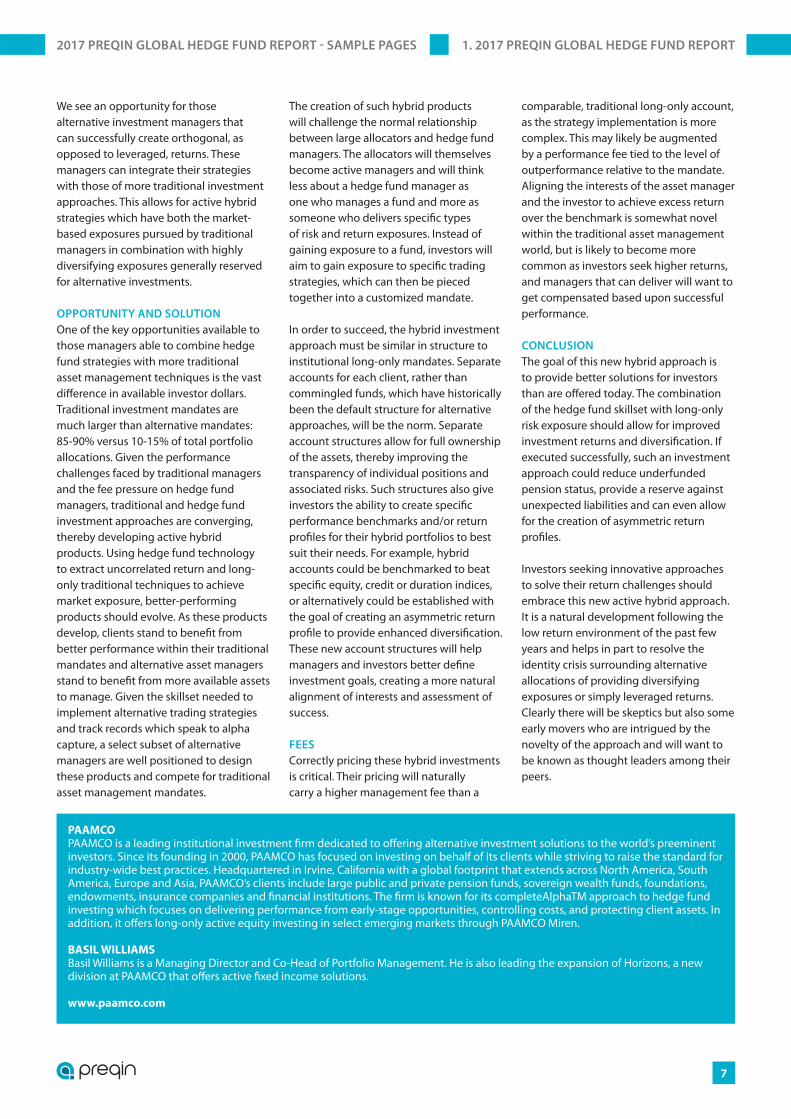
BACKGROUND
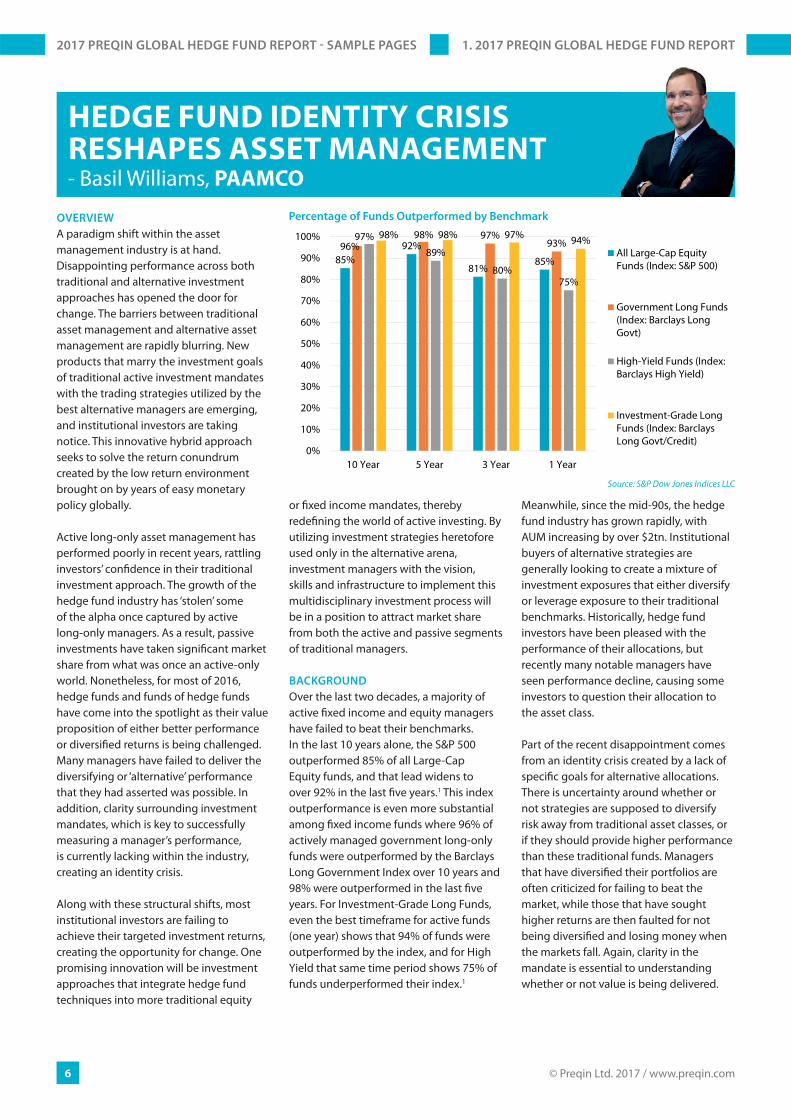
Over the last two decades, a majority of active fi xed income and equity managers have failed to beat their benchmarks. In the last 10 years alone, the S&P 500 outperformed 85% of all Large-Cap Equity funds, and that lead widens to over 92% in the last fi ve years.1 This index outperformance is even more substantial among fi xed income funds where 96% of actively managed government long-only funds were outperformed by the Barclays Long Government Index over 10 years and 98% were outperformed in the last fi ve years. For Investment-Grade Long Funds, even the best timeframe for active funds (one year) shows that 94% of funds were outperformed by the index, and for High Yield that same time period shows 75% of funds underperformed their index.1
Meanwhile, since the mid-90s, the hedge fund industry has grown rapidly, with AUM increasing by over $2tn. Institutional buyers of alternative strategies are generally looking to create a mixture of investment exposures that either diversify or leverage exposure to their traditional benchmarks. Historically, hedge fund investors have been pleased with the performance of their allocations, but recently many notable managers have seen performance decline, causing some investors to question their allocation to the asset class.
Part of the recent disappointment comes from an identity crisis created by a lack of specifi c goals for alternative allocations. There is uncertainty around whether or not strategies are supposed to diversify risk away from traditional asset classes, or if they should provide higher performance than these traditional funds. Managers that have diversifi ed their portfolios are often criticized for failing to beat the market, while those that have sought higher returns are then faulted for not being diversifi ed and losing money when the markets fall. Again, clarity in the mandate is essential to understanding whether or not value is being delivered.
HEDGE FUND IDENTITY CRISISRESHAPES ASSET MANAGEMENT- Basil Williams, PAAMCO
85%92%
81%85%
96%98% 97%
93%97%
89%
80%75%
98% 98% 97% 94%
0%
10%
20%
30%
40%
50%
60%
70%
80%
90%
100%
10 Year 5 Year 3 Year 1 Year
All Large-Cap EquityFunds (Index: S&P 500)
Government Long Funds(Index: Barclays LongGovt)
High-Yield Funds (Index:Barclays High Yield)
Investment-Grade LongFunds (Index: BarclaysLong Govt/Credit)
Source: S&P Dow Jones Indices LLC
Percentage of Funds Outperformed by Benchmark
7
We see an opportunity for those alternative investment managers that can successfully create orthogonal, as opposed to leveraged, returns. These managers can integrate their strategies with those of more traditional investment approaches. This allows for active hybrid strategies which have both the market-based exposures pursued by traditional managers in combination with highly diversifying exposures generally reserved for alternative investments.
OPPORTUNITY AND SOLUTION
One of the key opportunities available to those managers able to combine hedge fund strategies with more traditional asset management techniques is the vast diff erence in available investor dollars. Traditional investment mandates are much larger than alternative mandates: 85-90% versus 10-15% of total portfolio allocations. Given the performance challenges faced by traditional managers and the fee pressure on hedge fund managers, traditional and hedge fund investment approaches are converging, thereby developing active hybrid products. Using hedge fund technology to extract uncorrelated return and long-only traditional techniques to achieve market exposure, better-performing products should evolve. As these products develop, clients stand to benefi t from better performance within their traditional mandates and alternative asset managers stand to benefi t from more available assets to manage. Given the skillset needed to implement alternative trading strategies and track records which speak to alpha capture, a select subset of alternative managers are well positioned to design these products and compete for traditional asset management mandates.
The creation of such hybrid products will challenge the normal relationship between large allocators and hedge fund managers. The allocators will themselves become active managers and will think less about a hedge fund manager as one who manages a fund and more as someone who delivers specifi c types of risk and return exposures. Instead of gaining exposure to a fund, investors will aim to gain exposure to specifi c trading strategies, which can then be pieced together into a customized mandate.
In order to succeed, the hybrid investment approach must be similar in structure to institutional long-only mandates. Separate accounts for each client, rather than commingled funds, which have historically been the default structure for alternative approaches, will be the norm. Separate account structures allow for full ownership of the assets, thereby improving the transparency of individual positions and associated risks. Such structures also give investors the ability to create specifi c performance benchmarks and/or return profi les for their hybrid portfolios to best suit their needs. For example, hybrid accounts could be benchmarked to beat specifi c equity, credit or duration indices, or alternatively could be established with the goal of creating an asymmetric return profi le to provide enhanced diversifi cation. These new account structures will help managers and investors better defi ne investment goals, creating a more natural alignment of interests and assessment of success.
FEES
Correctly pricing these hybrid investments is critical. Their pricing will naturally carry a higher management fee than a
comparable, traditional long-only account, as the strategy implementation is more complex. This may likely be augmented by a performance fee tied to the level of outperformance relative to the mandate. Aligning the interests of the asset manager and the investor to achieve excess return over the benchmark is somewhat novel within the traditional asset management world, but is likely to become more common as investors seek higher returns, and managers that can deliver will want to get compensated based upon successful performance.
CONCLUSION
The goal of this new hybrid approach is to provide better solutions for investors than are off ered today. The combination of the hedge fund skillset with long-only risk exposure should allow for improved investment returns and diversifi cation. If executed successfully, such an investment approach could reduce underfunded pension status, provide a reserve against unexpected liabilities and can even allow for the creation of asymmetric return profi les.
Investors seeking innovative approaches to solve their return challenges should embrace this new active hybrid approach. It is a natural development following the low return environment of the past few years and helps in part to resolve the identity crisis surrounding alternative allocations of providing diversifying exposures or simply leveraged returns. Clearly there will be skeptics but also some early movers who are intrigued by the novelty of the approach and will want to be known as thought leaders among their peers.
PAAMCOPAAMCO is a leading institutional investment fi rm dedicated to off ering alternative investment solutions to the world’s preeminent investors. Since its founding in 2000, PAAMCO has focused on investing on behalf of its clients while striving to raise the standard for industry-wide best practices. Headquartered in Irvine, California with a global footprint that extends across North America, South America, Europe and Asia, PAAMCO’s clients include large public and private pension funds, sovereign wealth funds, foundations, endowments, insurance companies and fi nancial institutions. The fi rm is known for its completeAlphaTM approach to hedge fund investing which focuses on delivering performance from early-stage opportunities, controlling costs, and protecting client assets. In addition, it off ers long-only active equity investing in select emerging markets through PAAMCO Miren.
BASIL WILLIAMSBasil Williams is a Managing Director and Co-Head of Portfolio Management. He is also leading the expansion of Horizons, a new division at PAAMCO that off ers active fi xed income solutions.
www.paamco.com
1. 2017 PREQIN GLOBAL HEDGE FUND REPORT2017 PREQIN GLOBAL HEDGE FUND REPORT - SAMPLE PAGES
© Preqin Ltd. 2017 / www.preqin.com10
2. OVERVIEW OF THE HEDGE FUND INDUSTRY2017 PREQIN GLOBAL HEDGE FUND REPORT - SAMPLE PAGES
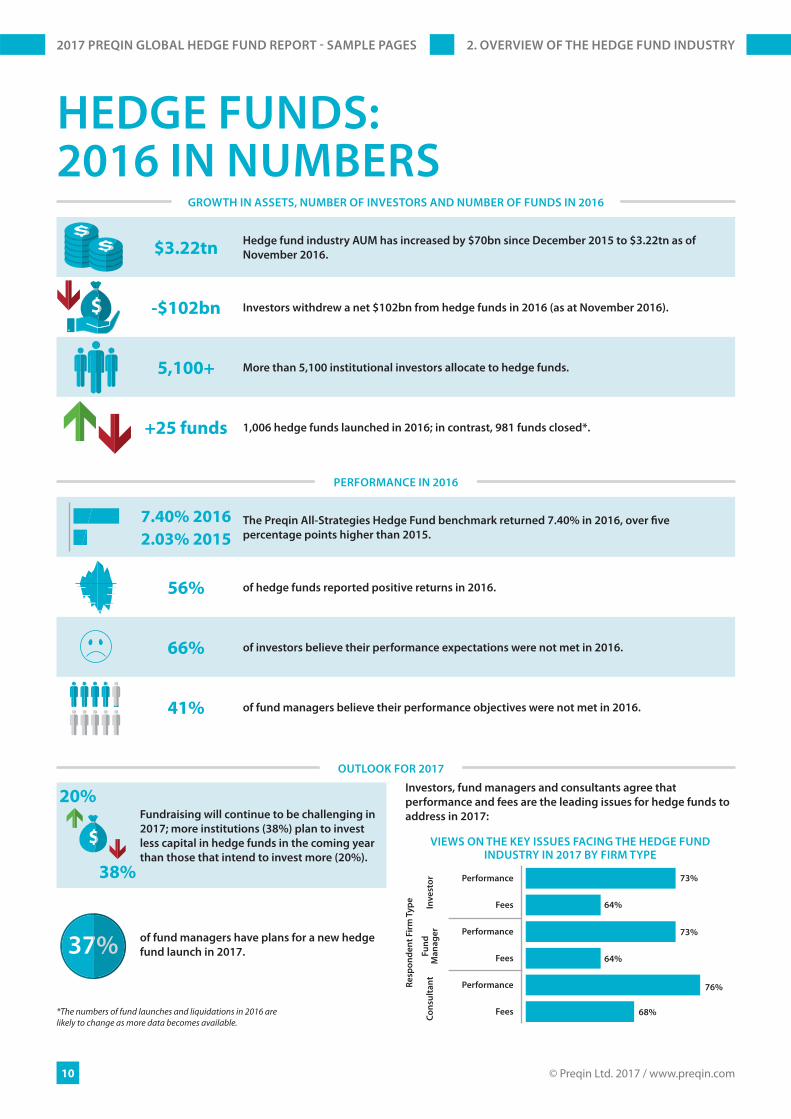
Fundraising will continue to be challenging in
2017; more institutions (38%) plan to invest
less capital in hedge funds in the coming year
than those that intend to invest more (20%).
of fund managers have plans for a new hedge
fund launch in 2017.
GROWTH IN ASSETS, NUMBER OF INVESTORS AND NUMBER OF FUNDS IN 2016
HEDGE FUNDS:2016 IN NUMBERS
$3.22tnHedge fund industry AUM has increased by $70bn since December 2015 to $3.22tn as of
November 2016.
-$102bn Investors withdrew a net $102bn from hedge funds in 2016 (as at November 2016).
5,100+ More than 5,100 institutional investors allocate to hedge funds.
+25 funds 1,006 hedge funds launched in 2016; in contrast, 981 funds closed*.
7.40% 2016
2.03% 2015
The Preqin All-Strategies Hedge Fund benchmark returned 7.40% in 2016, over fi ve
percentage points higher than 2015.
56% of hedge funds reported positive returns in 2016.
66% of investors believe their performance expectations were not met in 2016.
41% of fund managers believe their performance objectives were not met in 2016.
PERFORMANCE IN 2016
OUTLOOK FOR 2017
20%
38%
Investors, fund managers and consultants agree that
performance and fees are the leading issues for hedge funds to
address in 2017:
VIEWS ON THE KEY ISSUES FACING THE HEDGE FUND INDUSTRY IN 2017 BY FIRM TYPE
Performance
Inv
est
or
Re
spo
nd
en
t F
irm
Ty
pe
Fees
Performance
Fees
Performance
Fees
Fu
nd
Ma
na
ge
rC
on
sult
an
t
73%
64%
73%
64%
76%
68%*The numbers of fund launches and liquidations in 2016 are likely to change as more data becomes available.

© Preqin Ltd. 2017 / www.preqin.com12
2016 could be characterized as a year in which the unexpected happened, with perhaps the Brexit result and Donald Trump’s triumph in the US presidential election at the pinnacle of this series of largely unpredicted events. As markets struggled to respond to these surprising outcomes, volatility increased, and hedge funds, following two years of returns below 5%, were able to capture some upside, adding 7.40% over the course of 2016. However, despite hedge fund performance as a whole being well within the targeted range of most investors (see page 110), 2016 may well be remembered by hedge fund managers as a diffi cult year, with a net $102bn of investor capital being redeemed in the 11 months to November. Even the largest hedge funds were unable to survive the wave of redemption requests which swept through the industry in 2016. For instance, Perry Capital, which had assets of $15bn at its height, was forced to close up shop in September following signifi cant investor withdrawals and poor performance.
It was, perhaps, the announcement of withdrawals from several of the largest investors in hedge funds – New Jersey State Investment Council, NYCERS and Metlife Insurance Company, to name a few – that characterized the reasons behind the wider redemptions in the industry. Many of these large institutions cited performance concerns and the high fees as the leading reasons driving their decisions to reduce their exposure to hedge funds. Our interviews with institutional investors in December 2016 revealed that the return expectations of two out of every three investors had not been met over 2016, and 73% and 64% of investors stated performance and fees respectively as the leading issue in the industry today, the largest proportions by some margin. So, to counter these concerns, 2017 may be a year for managers to continue to build on the solid returns of 2016 in order to demonstrate their worth in terms of performance, as well as to focus
on the value they provide investors by re-evaluating the terms and conditions on their funds.
IT WASN’T ALL BAD NEWS IN 2016
However, looking beyond the headline fi gures, there are some bright spots. Firstly, the industry as a whole grew as a result of performance gains made in 2016. Today, collectively, hedge funds manage assets in excess of $3.2tn – the highest on record. Managed futures had a successful 2016 in regards to fundraising. CTAs built on the $25bn they raised in 2015, and added a further $17bn in fresh capital in 2016, taking the size of the CTA sector to $240bn. In addition, many investors continued to make new investments, or began investing in hedge funds for the fi rst time. Among these was National Pension Service of South Korea, which made its fi rst investment in hedge funds in July 2016, investing over $900mn in the asset class.
OUTFLOWS LOOK LIKELY TO CONTINUE
The fundraising challenges of 2016, however, show little sign of abating in 2017. Outfl ows accelerated throughout 2016, with the largest levels of investor redemptions made in the fi nal quarter of the year (to 30 November, page 48). In our December 2015 interviews with investors, Preqin noted for the fi rst time that more investors planned to reduce their exposure to hedge funds in the next 12 months than increase (32% versus 25%). Our December 2016 interviews (page 112) indicate that we may see continued outfl ows over 2017. Nearly twice the proportion of investors (38%) plan to reduce their exposure in 2017 than intend to increase (20%), a concern for managers as both retaining capital and fundraising is likely to continue to be a challenge over 2017. However, despite being squeezed on fees, fund managers are seeking to invest more in their marketing, business development and investor relations capabilities in order to combat these diffi culties, which they face in retaining capital and gaining fresh infl ows (page 63).
ALTERNATIVE ASSET INTELLIGENCE MAY
BE MORE IMPORTANT THAN EVER
As markets respond to the unexpected events of 2016, the ramifi cations of which are far from clear, 2017 could be a time for hedge funds to show their worth to investors if they can continue to build on the solid returns of 2016. Undeniably, many investors have grown cautious when it comes to investing in hedge funds, with a growing proportion looking to cut back on their investments in the near future. However, despite short-term concerns around performance, hedge funds have proved their worth in institutional investors’ portfolios on a risk-adjusted basis over the long term (page 34). However, with 14,500 funds open to investment, it is more challenging than ever to fi nd the right fund in terms of strategy, performance and fees. Therefore, intelligence that can help investors cut through the noise and fi nd the funds that meet their needs may be the fi rst step for institutions in creating portfolios of funds that can help them meet their long-term objectives.
The industry is in a period of change. Investor pressure on performance and fees has grown and there have been large-scale redemptions from hedge funds. In addition, the gap between new fund launches and fund liquidations has narrowed to just 25. If outfl ows continue in 2017, we may continue to see a shake-out of those funds that have failed to meet investors’ return expectations in recent years and a contraction in the size of the industry. Data and intelligence can help fund managers navigate these challenging times, not only in fi nding those investors looking to allocate fresh capital to hedge funds, but also in understanding the plans and needs of the institutions that currently invest in their funds. In a competitive marketplace, having intelligence on your peers – how are they performing, what fees they charge and who is invested in those funds – may also help managers set themselves apart in 2017.
DESPITE IMPROVED PERFORMANCE IN 2016, INVESTORS REMAIN CAUTIOUS IN 2017- Amy Bensted, Preqin
2. OVERVIEW OF THE HEDGE FUND INDUSTRY2017 PREQIN GLOBAL HEDGE FUND REPORT - SAMPLE PAGES
© Preqin Ltd. 2017 / www.preqin.com22
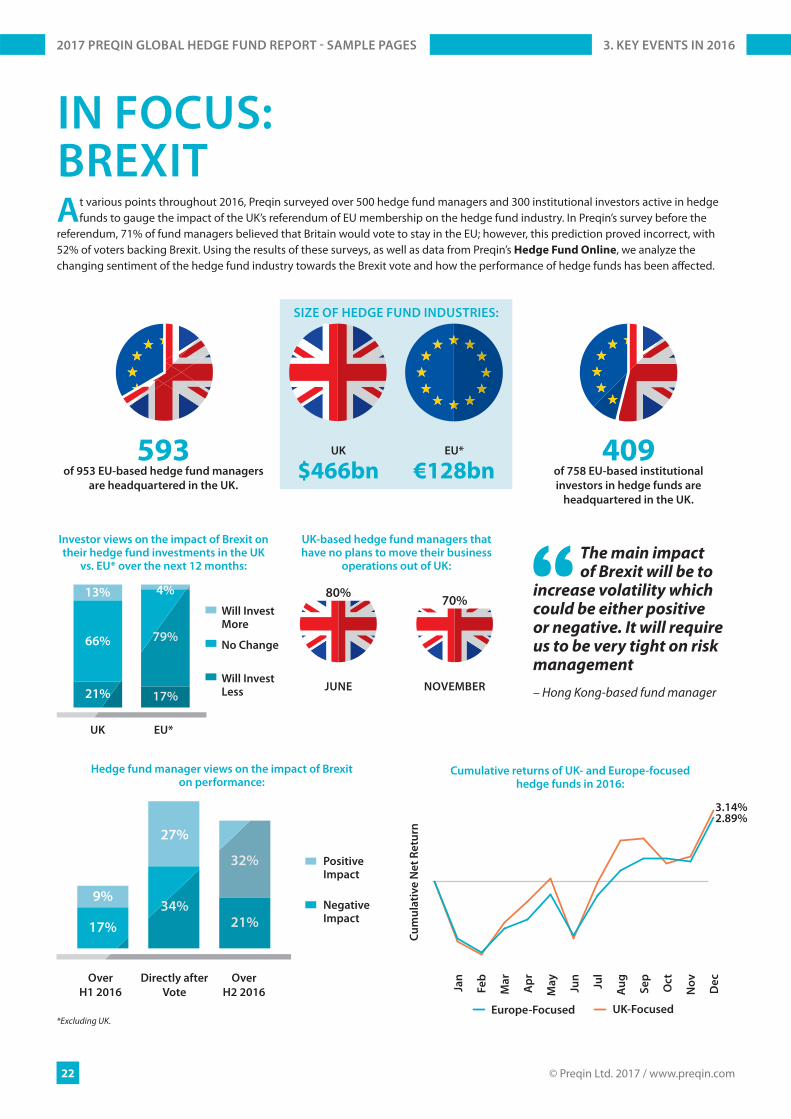
IN FOCUS:BREXIT
593of 953 EU-based hedge fund managers
are headquartered in the UK.
409of 758 EU-based institutional
investors in hedge funds are
headquartered in the UK.
SIZE OF HEDGE FUND INDUSTRIES:
UK
$466bnEU*
€128bn
UK-based hedge fund managers that have no plans to move their business
operations out of UK:
JUNE NOVEMBER
80%70%
Cumulative returns of UK- and Europe-focused hedge funds in 2016:
*Excluding UK.
At various points throughout 2016, Preqin surveyed over 500 hedge fund managers and 300 institutional investors active in hedge funds to gauge the impact of the UK’s referendum of EU membership on the hedge fund industry. In Preqin’s survey before the
referendum, 71% of fund managers believed that Britain would vote to stay in the EU; however, this prediction proved incorrect, with 52% of voters backing Brexit. Using the results of these surveys, as well as data from Preqin’s Hedge Fund Online, we analyze the changing sentiment of the hedge fund industry towards the Brexit vote and how the performance of hedge funds has been aff ected.
Investor views on the impact of Brexit on their hedge fund investments in the UK
vs. EU* over the next 12 months:
Hedge fund manager views on the impact of Brexit on performance:
The main impact of Brexit will be to
increase volatility which could be either positive or negative. It will require us to be very tight on risk management
– Hong Kong-based fund manager
UK EU*
Over
H1 2016
Directly after
Vote
Over
H2 2016
PositiveImpact
NegativeImpact
Jan
Fe
b
Ma
r
Ap
r
Ma
y
Jun
Jul
Au
g
Se
p
Oc
t
3.14%2.89%
Europe-Focused UK-Focused
Will InvestMore
No Change
Will InvestLess
Cu
mu
lati
ve
Ne
t R
etu
rn
No
v
De
c
3. KEY EVENTS IN 20162017 PREQIN GLOBAL HEDGE FUND REPORT - SAMPLE PAGES
29
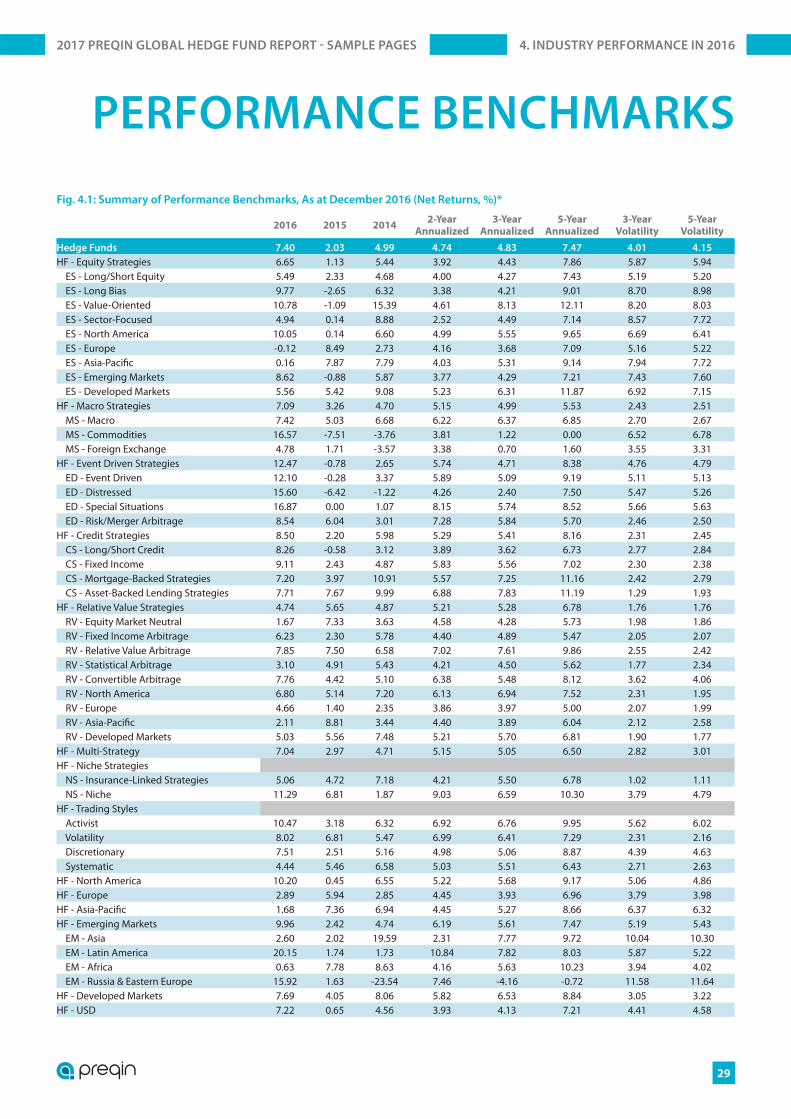
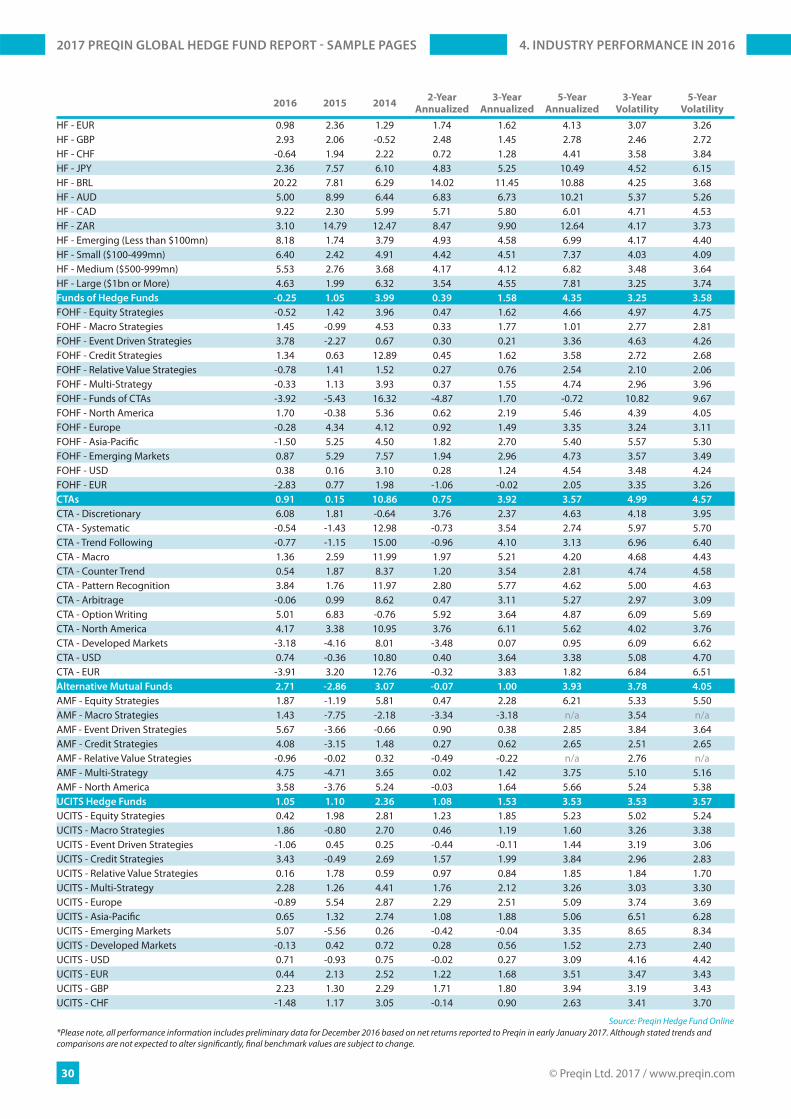
PERFORMANCE BENCHMARKS
Fig. 4.1: Summary of Performance Benchmarks, As at December 2016 (Net Returns, %)*
2016 2015 20142-Year
Annualized
3-Year
Annualized
5-Year
Annualized
3-Year
Volatility
5-Year
Volatility
Hedge Funds 7.40 2.03 4.99 4.74 4.83 7.47 4.01 4.15
HF - Equity Strategies 6.65 1.13 5.44 3.92 4.43 7.86 5.87 5.94 ES - Long/Short Equity 5.49 2.33 4.68 4.00 4.27 7.43 5.19 5.20 ES - Long Bias 9.77 -2.65 6.32 3.38 4.21 9.01 8.70 8.98 ES - Value-Oriented 10.78 -1.09 15.39 4.61 8.13 12.11 8.20 8.03 ES - Sector-Focused 4.94 0.14 8.88 2.52 4.49 7.14 8.57 7.72 ES - North America 10.05 0.14 6.60 4.99 5.55 9.65 6.69 6.41 ES - Europe -0.12 8.49 2.73 4.16 3.68 7.09 5.16 5.22 ES - Asia-Pacifi c 0.16 7.87 7.79 4.03 5.31 9.14 7.94 7.72 ES - Emerging Markets 8.62 -0.88 5.87 3.77 4.29 7.21 7.43 7.60 ES - Developed Markets 5.56 5.42 9.08 5.23 6.31 11.87 6.92 7.15HF - Macro Strategies 7.09 3.26 4.70 5.15 4.99 5.53 2.43 2.51 MS - Macro 7.42 5.03 6.68 6.22 6.37 6.85 2.70 2.67 MS - Commodities 16.57 -7.51 -3.76 3.81 1.22 0.00 6.52 6.78 MS - Foreign Exchange 4.78 1.71 -3.57 3.38 0.70 1.60 3.55 3.31HF - Event Driven Strategies 12.47 -0.78 2.65 5.74 4.71 8.38 4.76 4.79 ED - Event Driven 12.10 -0.28 3.37 5.89 5.09 9.19 5.11 5.13 ED - Distressed 15.60 -6.42 -1.22 4.26 2.40 7.50 5.47 5.26 ED - Special Situations 16.87 0.00 1.07 8.15 5.74 8.52 5.66 5.63 ED - Risk/Merger Arbitrage 8.54 6.04 3.01 7.28 5.84 5.70 2.46 2.50HF - Credit Strategies 8.50 2.20 5.98 5.29 5.41 8.16 2.31 2.45 CS - Long/Short Credit 8.26 -0.58 3.12 3.89 3.62 6.73 2.77 2.84 CS - Fixed Income 9.11 2.43 4.87 5.83 5.56 7.02 2.30 2.38 CS - Mortgage-Backed Strategies 7.20 3.97 10.91 5.57 7.25 11.16 2.42 2.79 CS - Asset-Backed Lending Strategies 7.71 7.67 9.99 6.88 7.83 11.19 1.29 1.93HF - Relative Value Strategies 4.74 5.65 4.87 5.21 5.28 6.78 1.76 1.76 RV - Equity Market Neutral 1.67 7.33 3.63 4.58 4.28 5.73 1.98 1.86 RV - Fixed Income Arbitrage 6.23 2.30 5.78 4.40 4.89 5.47 2.05 2.07 RV - Relative Value Arbitrage 7.85 7.50 6.58 7.02 7.61 9.86 2.55 2.42 RV - Statistical Arbitrage 3.10 4.91 5.43 4.21 4.50 5.62 1.77 2.34 RV - Convertible Arbitrage 7.76 4.42 5.10 6.38 5.48 8.12 3.62 4.06 RV - North America 6.80 5.14 7.20 6.13 6.94 7.52 2.31 1.95 RV - Europe 4.66 1.40 2.35 3.86 3.97 5.00 2.07 1.99 RV - Asia-Pacifi c 2.11 8.81 3.44 4.40 3.89 6.04 2.12 2.58 RV - Developed Markets 5.03 5.56 7.48 5.21 5.70 6.81 1.90 1.77HF - Multi-Strategy 7.04 2.97 4.71 5.15 5.05 6.50 2.82 3.01HF - Niche Strategies NS - Insurance-Linked Strategies 5.06 4.72 7.18 4.21 5.50 6.78 1.02 1.11 NS - Niche 11.29 6.81 1.87 9.03 6.59 10.30 3.79 4.79HF - Trading Styles Activist 10.47 3.18 6.32 6.92 6.76 9.95 5.62 6.02 Volatility 8.02 6.81 5.47 6.99 6.41 7.29 2.31 2.16 Discretionary 7.51 2.51 5.16 4.98 5.06 8.87 4.39 4.63 Systematic 4.44 5.46 6.58 5.03 5.51 6.43 2.71 2.63HF - North America 10.20 0.45 6.55 5.22 5.68 9.17 5.06 4.86HF - Europe 2.89 5.94 2.85 4.45 3.93 6.96 3.79 3.98HF - Asia-Pacifi c 1.68 7.36 6.94 4.45 5.27 8.66 6.37 6.32HF - Emerging Markets 9.96 2.42 4.74 6.19 5.61 7.47 5.19 5.43 EM - Asia 2.60 2.02 19.59 2.31 7.77 9.72 10.04 10.30 EM - Latin America 20.15 1.74 1.73 10.84 7.82 8.03 5.87 5.22 EM - Africa 0.63 7.78 8.63 4.16 5.63 10.23 3.94 4.02 EM - Russia & Eastern Europe 15.92 1.63 -23.54 7.46 -4.16 -0.72 11.58 11.64HF - Developed Markets 7.69 4.05 8.06 5.82 6.53 8.84 3.05 3.22HF - USD 7.22 0.65 4.56 3.93 4.13 7.21 4.41 4.58
4. INDUSTRY PERFORMANCE IN 20162017 PREQIN GLOBAL HEDGE FUND REPORT - SAMPLE PAGES
© Preqin Ltd. 2017 / www.preqin.com30
HF - EUR 0.98 2.36 1.29 1.74 1.62 4.13 3.07 3.26HF - GBP 2.93 2.06 -0.52 2.48 1.45 2.78 2.46 2.72HF - CHF -0.64 1.94 2.22 0.72 1.28 4.41 3.58 3.84HF - JPY 2.36 7.57 6.10 4.83 5.25 10.49 4.52 6.15HF - BRL 20.22 7.81 6.29 14.02 11.45 10.88 4.25 3.68HF - AUD 5.00 8.99 6.44 6.83 6.73 10.21 5.37 5.26HF - CAD 9.22 2.30 5.99 5.71 5.80 6.01 4.71 4.53HF - ZAR 3.10 14.79 12.47 8.47 9.90 12.64 4.17 3.73HF - Emerging (Less than $100mn) 8.18 1.74 3.79 4.93 4.58 6.99 4.17 4.40HF - Small ($100-499mn) 6.40 2.42 4.91 4.42 4.51 7.37 4.03 4.09HF - Medium ($500-999mn) 5.53 2.76 3.68 4.17 4.12 6.82 3.48 3.64HF - Large ($1bn or More) 4.63 1.99 6.32 3.54 4.55 7.81 3.25 3.74Funds of Hedge Funds -0.25 1.05 3.99 0.39 1.58 4.35 3.25 3.58
FOHF - Equity Strategies -0.52 1.42 3.96 0.47 1.62 4.66 4.97 4.75FOHF - Macro Strategies 1.45 -0.99 4.53 0.33 1.77 1.01 2.77 2.81FOHF - Event Driven Strategies 3.78 -2.27 0.67 0.30 0.21 3.36 4.63 4.26FOHF - Credit Strategies 1.34 0.63 12.89 0.45 1.62 3.58 2.72 2.68FOHF - Relative Value Strategies -0.78 1.41 1.52 0.27 0.76 2.54 2.10 2.06FOHF - Multi-Strategy -0.33 1.13 3.93 0.37 1.55 4.74 2.96 3.96FOHF - Funds of CTAs -3.92 -5.43 16.32 -4.87 1.70 -0.72 10.82 9.67FOHF - North America 1.70 -0.38 5.36 0.62 2.19 5.46 4.39 4.05FOHF - Europe -0.28 4.34 4.12 0.92 1.49 3.35 3.24 3.11FOHF - Asia-Pacifi c -1.50 5.25 4.50 1.82 2.70 5.40 5.57 5.30FOHF - Emerging Markets 0.87 5.29 7.57 1.94 2.96 4.73 3.57 3.49FOHF - USD 0.38 0.16 3.10 0.28 1.24 4.54 3.48 4.24FOHF - EUR -2.83 0.77 1.98 -1.06 -0.02 2.05 3.35 3.26CTAs 0.91 0.15 10.86 0.75 3.92 3.57 4.99 4.57
CTA - Discretionary 6.08 1.81 -0.64 3.76 2.37 4.63 4.18 3.95CTA - Systematic -0.54 -1.43 12.98 -0.73 3.54 2.74 5.97 5.70CTA - Trend Following -0.77 -1.15 15.00 -0.96 4.10 3.13 6.96 6.40CTA - Macro 1.36 2.59 11.99 1.97 5.21 4.20 4.68 4.43CTA - Counter Trend 0.54 1.87 8.37 1.20 3.54 2.81 4.74 4.58CTA - Pattern Recognition 3.84 1.76 11.97 2.80 5.77 4.62 5.00 4.63CTA - Arbitrage -0.06 0.99 8.62 0.47 3.11 5.27 2.97 3.09CTA - Option Writing 5.01 6.83 -0.76 5.92 3.64 4.87 6.09 5.69CTA - North America 4.17 3.38 10.95 3.76 6.11 5.62 4.02 3.76CTA - Developed Markets -3.18 -4.16 8.01 -3.48 0.07 0.95 6.09 6.62CTA - USD 0.74 -0.36 10.80 0.40 3.64 3.38 5.08 4.70CTA - EUR -3.91 3.20 12.76 -0.32 3.83 1.82 6.84 6.51Alternative Mutual Funds 2.71 -2.86 3.07 -0.07 1.00 3.93 3.78 4.05
AMF - Equity Strategies 1.87 -1.19 5.81 0.47 2.28 6.21 5.33 5.50AMF - Macro Strategies 1.43 -7.75 -2.18 -3.34 -3.18 n/a 3.54 n/aAMF - Event Driven Strategies 5.67 -3.66 -0.66 0.90 0.38 2.85 3.84 3.64AMF - Credit Strategies 4.08 -3.15 1.48 0.27 0.62 2.65 2.51 2.65AMF - Relative Value Strategies -0.96 -0.02 0.32 -0.49 -0.22 n/a 2.76 n/aAMF - Multi-Strategy 4.75 -4.71 3.65 0.02 1.42 3.75 5.10 5.16AMF - North America 3.58 -3.76 5.24 -0.03 1.64 5.66 5.24 5.38UCITS Hedge Funds 1.05 1.10 2.36 1.08 1.53 3.53 3.53 3.57
UCITS - Equity Strategies 0.42 1.98 2.81 1.23 1.85 5.23 5.02 5.24UCITS - Macro Strategies 1.86 -0.80 2.70 0.46 1.19 1.60 3.26 3.38UCITS - Event Driven Strategies -1.06 0.45 0.25 -0.44 -0.11 1.44 3.19 3.06UCITS - Credit Strategies 3.43 -0.49 2.69 1.57 1.99 3.84 2.96 2.83UCITS - Relative Value Strategies 0.16 1.78 0.59 0.97 0.84 1.85 1.84 1.70UCITS - Multi-Strategy 2.28 1.26 4.41 1.76 2.12 3.26 3.03 3.30UCITS - Europe -0.89 5.54 2.87 2.29 2.51 5.09 3.74 3.69UCITS - Asia-Pacifi c 0.65 1.32 2.74 1.08 1.88 5.06 6.51 6.28UCITS - Emerging Markets 5.07 -5.56 0.26 -0.42 -0.04 3.35 8.65 8.34UCITS - Developed Markets -0.13 0.42 0.72 0.28 0.56 1.52 2.73 2.40UCITS - USD 0.71 -0.93 0.75 -0.02 0.27 3.09 4.16 4.42UCITS - EUR 0.44 2.13 2.52 1.22 1.68 3.51 3.47 3.43UCITS - GBP 2.23 1.30 2.29 1.71 1.80 3.94 3.19 3.43UCITS - CHF -1.48 1.17 3.05 -0.14 0.90 2.63 3.41 3.70
Source: Preqin Hedge Fund Online*Please note, all performance information includes preliminary data for December 2016 based on net returns reported to Preqin in early January 2017. Although stated trends and comparisons are not expected to alter signifi cantly, fi nal benchmark values are subject to change.
2016 2015 20142-Year
Annualized
3-Year
Annualized
5-Year
Annualized
3-Year
Volatility
5-Year
Volatility
4. INDUSTRY PERFORMANCE IN 20162017 PREQIN GLOBAL HEDGE FUND REPORT - SAMPLE PAGES
© Preqin Ltd. 2017 / www.preqin.com48
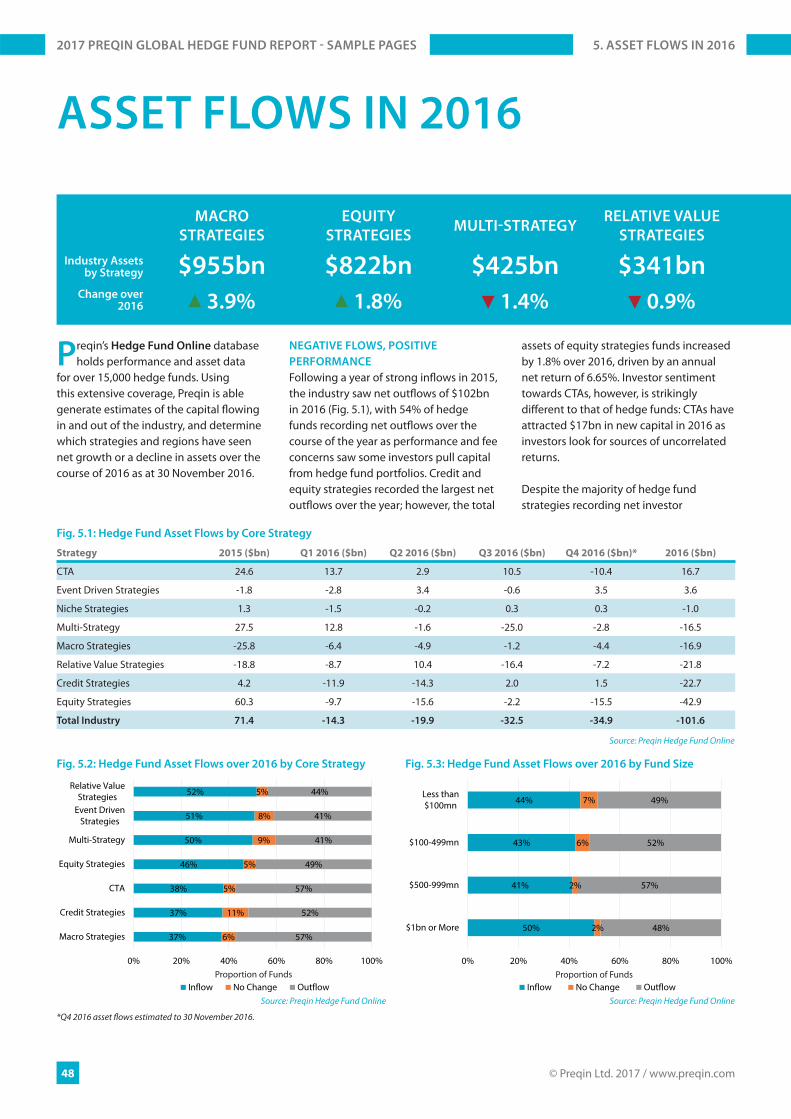
Preqin’s Hedge Fund Online database holds performance and asset data
for over 15,000 hedge funds. Using this extensive coverage, Preqin is able generate estimates of the capital fl owing in and out of the industry, and determine which strategies and regions have seen net growth or a decline in assets over the course of 2016 as at 30 November 2016.
NEGATIVE FLOWS, POSITIVE
PERFORMANCE
Following a year of strong infl ows in 2015, the industry saw net outfl ows of $102bn in 2016 (Fig. 5.1), with 54% of hedge funds recording net outfl ows over the course of the year as performance and fee concerns saw some investors pull capital from hedge fund portfolios. Credit and equity strategies recorded the largest net outfl ows over the year; however, the total
assets of equity strategies funds increased by 1.8% over 2016, driven by an annual net return of 6.65%. Investor sentiment towards CTAs, however, is strikingly diff erent to that of hedge funds: CTAs have attracted $17bn in new capital in 2016 as investors look for sources of uncorrelated returns.
Despite the majority of hedge fund strategies recording net investor
ASSET FLOWS IN 2016
Fig. 5.1: Hedge Fund Asset Flows by Core Strategy
Strategy 2015 ($bn) Q1 2016 ($bn) Q2 2016 ($bn) Q3 2016 ($bn) Q4 2016 ($bn)* 2016 ($bn)
CTA 24.6 13.7 2.9 10.5 -10.4 16.7
Event Driven Strategies -1.8 -2.8 3.4 -0.6 3.5 3.6
Niche Strategies 1.3 -1.5 -0.2 0.3 0.3 -1.0
Multi-Strategy 27.5 12.8 -1.6 -25.0 -2.8 -16.5
Macro Strategies -25.8 -6.4 -4.9 -1.2 -4.4 -16.9
Relative Value Strategies -18.8 -8.7 10.4 -16.4 -7.2 -21.8
Credit Strategies 4.2 -11.9 -14.3 2.0 1.5 -22.7
Equity Strategies 60.3 -9.7 -15.6 -2.2 -15.5 -42.9
Total Industry 71.4 -14.3 -19.9 -32.5 -34.9 -101.6
Source: Preqin Hedge Fund Online
37%
37%
38%
46%
50%
51%
52%
6%
11%
5%
5%
9%
8%
5%
57%
52%
57%
49%
41%
41%
44%
0% 20% 40% 60% 80% 100%
Macro Strategies
Credit Strategies
CTA
Equity Strategies
Multi-Strategy
Event DrivenStrategies
Relative ValueStrategies
Inflow No Change OutflowSource: Preqin Hedge Fund Online
Proportion of Funds
Fig. 5.2: Hedge Fund Asset Flows over 2016 by Core Strategy
50%
41%
43%
44%
2%
2%
6%
7%
48%
57%
52%
49%
0% 20% 40% 60% 80% 100%
$1bn or More
$500-999mn
$100-499mn
Less than$100mn
Inflow No Change OutflowSource: Preqin Hedge Fund Online
Proportion of Funds
Fig. 5.3: Hedge Fund Asset Flows over 2016 by Fund Size
MACRO
STRATEGIES
EQUITY
STRATEGIESMULTI-STRATEGY
RELATIVE VALUE
STRATEGIES
$955bn
▲3.9%
$822bn
▲1.8%
$425bn
▼1.4%
$341bn
▼0.9%
Industry Assets by Strategy
Change over 2016
*Q4 2016 asset fl ows estimated to 30 November 2016.
5. ASSET FLOWS IN 20162017 PREQIN GLOBAL HEDGE FUND REPORT - SAMPLE PAGES
© Preqin Ltd. 2017 / www.preqin.com58
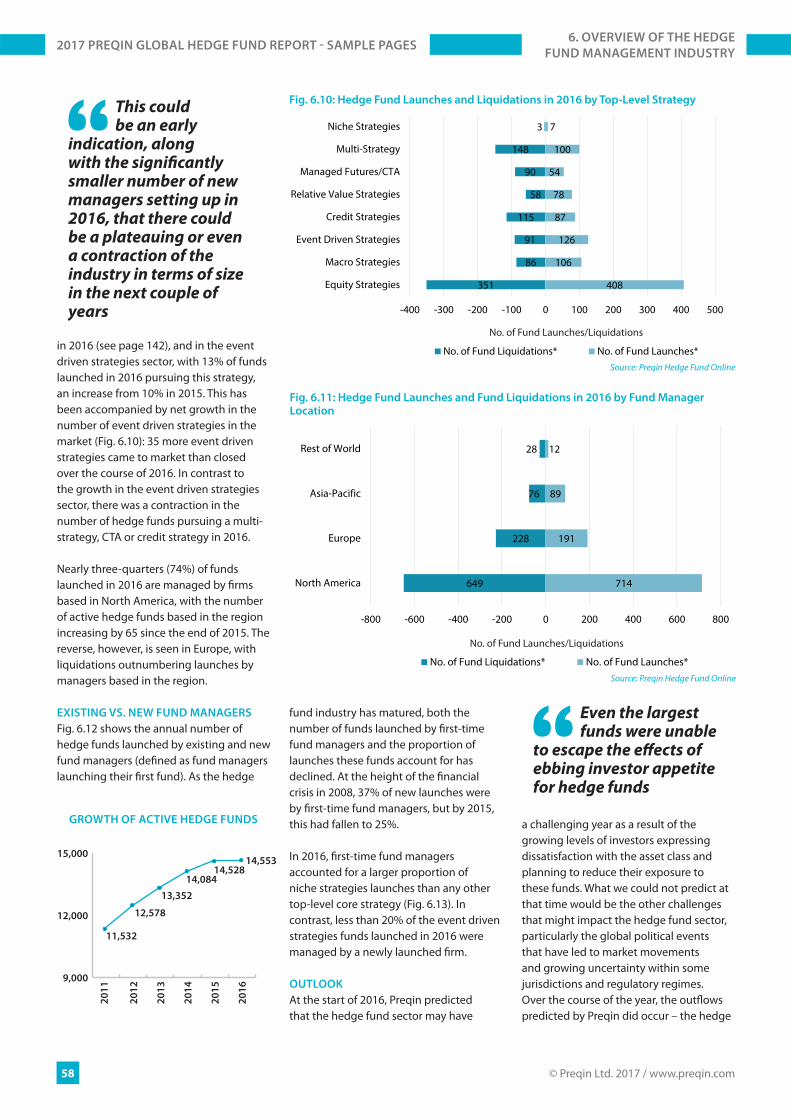
in 2016 (see page 142), and in the event driven strategies sector, with 13% of funds launched in 2016 pursuing this strategy, an increase from 10% in 2015. This has been accompanied by net growth in the number of event driven strategies in the market (Fig. 6.10): 35 more event driven strategies came to market than closed over the course of 2016. In contrast to the growth in the event driven strategies sector, there was a contraction in the number of hedge funds pursuing a multi-strategy, CTA or credit strategy in 2016.
Nearly three-quarters (74%) of funds launched in 2016 are managed by fi rms based in North America, with the number of active hedge funds based in the region increasing by 65 since the end of 2015. The reverse, however, is seen in Europe, with liquidations outnumbering launches by managers based in the region.
EXISTING VS. NEW FUND MANAGERS
Fig. 6.12 shows the annual number of hedge funds launched by existing and new fund managers (defi ned as fund managers launching their fi rst fund). As the hedge
fund industry has matured, both the number of funds launched by fi rst-time fund managers and the proportion of launches these funds account for has declined. At the height of the fi nancial crisis in 2008, 37% of new launches were by fi rst-time fund managers, but by 2015, this had fallen to 25%.
In 2016, fi rst-time fund managers accounted for a larger proportion of niche strategies launches than any other top-level core strategy (Fig. 6.13). In contrast, less than 20% of the event driven strategies funds launched in 2016 were managed by a newly launched fi rm.
OUTLOOK
At the start of 2016, Preqin predicted that the hedge fund sector may have
a challenging year as a result of the growing levels of investors expressing dissatisfaction with the asset class and planning to reduce their exposure to these funds. What we could not predict at that time would be the other challenges that might impact the hedge fund sector, particularly the global political events that have led to market movements and growing uncertainty within some jurisdictions and regulatory regimes. Over the course of the year, the outfl ows predicted by Preqin did occur – the hedge
GROWTH OF ACTIVE HEDGE FUNDS
15,000
12,000
9,000
20
11
20
12
20
13
20
14
20
15
20
16
11,532
12,578
13,352
14,08414,528
14,553
This could be an early
indication, along with the signifi cantly smaller number of new managers setting up in 2016, that there could be a plateauing or even a contraction of the industry in terms of size in the next couple of years
351
86
91
115
58
90
148
3
408
106
126
87
78
54
100
7
-400 -300 -200 -100 0 100 200 300 400 500
Equity Strategies
Macro Strategies
Event Driven Strategies
Credit Strategies
Relative Value Strategies
Managed Futures/CTA
Multi-Strategy
Niche Strategies
No. of Fund Liquidations* No. of Fund Launches*Source: Preqin Hedge Fund Online
No. of Fund Launches/Liquidations
Fig. 6.10: Hedge Fund Launches and Liquidations in 2016 by Top-Level Strategy
649
228
76
28
714
191
89
12
-800 -600 -400 -200 0 200 400 600 800
North America
Europe
Asia-Pacific
Rest of World
No. of Fund Liquidations* No. of Fund Launches*Source: Preqin Hedge Fund Online
No. of Fund Launches/Liquidations
Fig. 6.11: Hedge Fund Launches and Fund Liquidations in 2016 by Fund Manager Location
Even the largest funds were unable
to escape the eff ects of ebbing investor appetite for hedge funds
6. OVERVIEW OF THE HEDGE
FUND MANAGEMENT INDUSTRY2017 PREQIN GLOBAL HEDGE FUND REPORT - SAMPLE PAGES
© Preqin Ltd. 2017 / www.preqin.com86
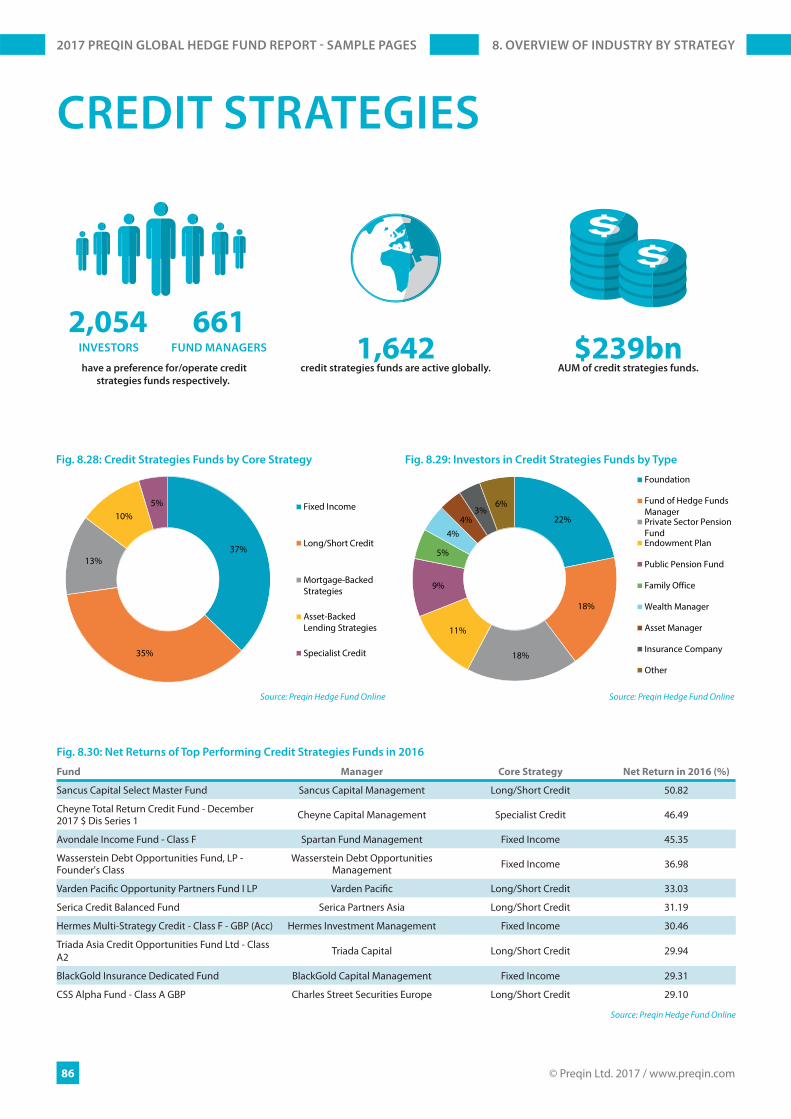
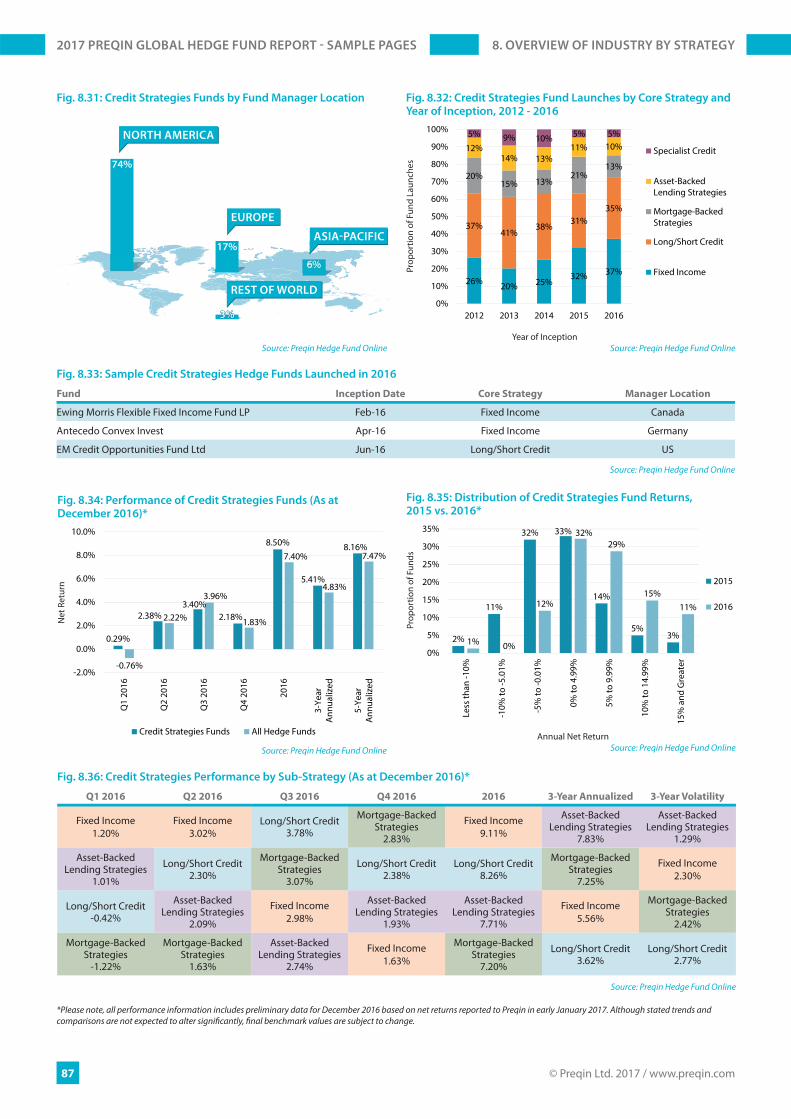
CREDIT STRATEGIES
37%
35%
13%
10%5% Fixed Income
Long/Short Credit
Mortgage-BackedStrategies
Asset-BackedLending Strategies
Specialist Credit
Source: Preqin Hedge Fund Online
Fig. 8.28: Credit Strategies Funds by Core Strategy
22%
18%
18%
11%
9%
5%
4%4%
3%6%
Foundation
Fund of Hedge FundsManagerPrivate Sector PensionFundEndowment Plan
Public Pension Fund
Family Office
Wealth Manager
Asset Manager
Insurance Company
Other
Source: Preqin Hedge Fund Online
Fig. 8.29: Investors in Credit Strategies Funds by Type
Fig. 8.30: Net Returns of Top Performing Credit Strategies Funds in 2016
Fund Manager Core Strategy Net Return in 2016 (%)
Sancus Capital Select Master Fund Sancus Capital Management Long/Short Credit 50.82
Cheyne Total Return Credit Fund - December 2017 $ Dis Series 1 Cheyne Capital Management Specialist Credit 46.49
Avondale Income Fund - Class F Spartan Fund Management Fixed Income 45.35
Wasserstein Debt Opportunities Fund, LP - Founder's Class
Wasserstein Debt Opportunities Management Fixed Income 36.98
Varden Pacifi c Opportunity Partners Fund I LP Varden Pacifi c Long/Short Credit 33.03
Serica Credit Balanced Fund Serica Partners Asia Long/Short Credit 31.19
Hermes Multi-Strategy Credit - Class F - GBP (Acc) Hermes Investment Management Fixed Income 30.46
Triada Asia Credit Opportunities Fund Ltd - Class A2 Triada Capital Long/Short Credit 29.94
BlackGold Insurance Dedicated Fund BlackGold Capital Management Fixed Income 29.31
CSS Alpha Fund - Class A GBP Charles Street Securities Europe Long/Short Credit 29.10
Source: Preqin Hedge Fund Online
have a preference for/operate credit
strategies funds respectively.
1,642credit strategies funds are active globally.
$239bnAUM of credit strategies funds.
2,054 661INVESTORS FUND MANAGERS
8. OVERVIEW OF INDUSTRY BY STRATEGY2017 PREQIN GLOBAL HEDGE FUND REPORT - SAMPLE PAGES
© Preqin Ltd. 2017 / www.preqin.com87
8. OVERVIEW OF INDUSTRY BY STRATEGY2017 PREQIN GLOBAL HEDGE FUND REPORT - SAMPLE PAGES
0.29%
2.38%3.40%
2.18%
8.50%
5.41%
8.16%
-0.76%
2.22%
3.96%
1.83%
7.40%
4.83%
7.47%
-2.0%
0.0%
2.0%
4.0%
6.0%
8.0%
10.0%
Q1
2016
Q2
2016
Q3
2016
Q4
2016
2016
3-Ye
arA
nnua
lized
5-Ye
arA
nnua
lized
Credit Strategies Funds All Hedge Funds
Source: Preqin Hedge Fund Online
Net
Ret
urn
Fig. 8.34: Performance of Credit Strategies Funds (As at December 2016)*
2%
11%
32% 33%
14%
5%3%
1% 0%
12%
32%29%
15%11%
0%
5%
10%
15%
20%
25%
30%
35%
Less
than
-10%
-10%
to -5
.01%
-5%
to -0
.01%
0% to
4.9
9%
5% to
9.9
9%
10%
to 1
4.99
%
15%
and
Gre
ater
2015
2016
Source: Preqin Hedge Fund Online
Prop
ortio
n of
Fun
ds
Annual Net Return
Fig. 8.35: Distribution of Credit Strategies Fund Returns, 2015 vs. 2016*
Fig. 8.36: Credit Strategies Performance by Sub-Strategy (As at December 2016)*
Q1 2016 Q2 2016 Q3 2016 Q4 2016 2016 3-Year Annualized 3-Year Volatility
Fixed Income1.20%
Fixed Income3.02%
Long/Short Credit3.78%
Mortgage-Backed Strategies
2.83%
Fixed Income9.11%
Asset-Backed Lending Strategies
7.83%
Asset-Backed Lending Strategies
1.29%
Asset-Backed Lending Strategies
1.01%
Long/Short Credit2.30%
Mortgage-Backed Strategies
3.07%
Long/Short Credit2.38%
Long/Short Credit8.26%
Mortgage-Backed Strategies
7.25%
Fixed Income2.30%
Long/Short Credit-0.42%
Asset-Backed Lending Strategies
2.09%
Fixed Income2.98%
Asset-Backed Lending Strategies
1.93%
Asset-Backed Lending Strategies
7.71%
Fixed Income5.56%
Mortgage-Backed Strategies
2.42%
Mortgage-Backed Strategies
-1.22%
Mortgage-Backed Strategies
1.63%
Asset-Backed Lending Strategies
2.74%
Fixed Income1.63%
Mortgage-Backed Strategies
7.20%
Long/Short Credit3.62%
Long/Short Credit2.77%
Source: Preqin Hedge Fund Online
Fig. 8.31: Credit Strategies Funds by Fund Manager Location
26% 20% 25%32% 37%
37%41%
38%31%
35%
20%15% 13%
21%13%
12%14% 13%
11% 10%5% 9% 10% 5% 5%
0%
10%
20%
30%
40%
50%
60%
70%
80%
90%
100%
2012 2013 2014 2015 2016
Specialist Credit
Asset-BackedLending Strategies
Mortgage-BackedStrategies
Long/Short Credit
Fixed Income
Source: Preqin Hedge Fund Online
Prop
ortio
n of
Fun
d La
unch
es
Year of Inception
Fig. 8.32: Credit Strategies Fund Launches by Core Strategy and Year of Inception, 2012 - 2016
Fig. 8.33: Sample Credit Strategies Hedge Funds Launched in 2016
Fund Inception Date Core Strategy Manager Location
Ewing Morris Flexible Fixed Income Fund LP Feb-16 Fixed Income Canada
Antecedo Convex Invest Apr-16 Fixed Income Germany
EM Credit Opportunities Fund Ltd Jun-16 Long/Short Credit US
Source: Preqin Hedge Fund Online
*Please note, all performance information includes preliminary data for December 2016 based on net returns reported to Preqin in early January 2017. Although stated trends and comparisons are not expected to alter signifi cantly, fi nal benchmark values are subject to change.
NORTH AMERICA
EUROPE
74%
17%
6%
REST OF WORLD
3%3%
Source: Preqin Hedge Fund Online
ASIA-PACIFIC
© Preqin Ltd. 2017 / www.preqin.com88
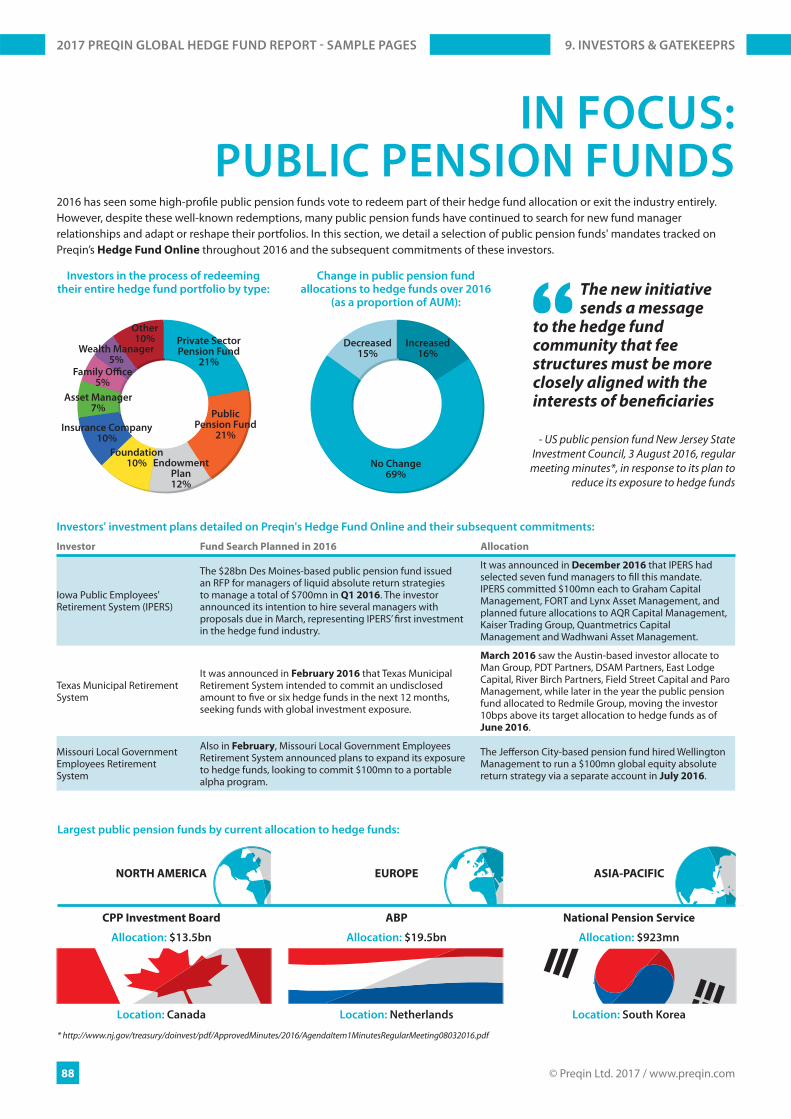
NORTH AMERICA EUROPE ASIA-PACIFIC
CPP Investment Board ABP National Pension Service
Allocation: $13.5bn Allocation: $19.5bn Allocation: $923mn
Location: Canada Location: Netherlands Location: South Korea
2016 has seen some high-profi le public pension funds vote to redeem part of their hedge fund allocation or exit the industry entirely. However, despite these well-known redemptions, many public pension funds have continued to search for new fund manager relationships and adapt or reshape their portfolios. In this section, we detail a selection of public pension funds' mandates tracked on Preqin’s Hedge Fund Online throughout 2016 and the subsequent commitments of these investors.
IN FOCUS: PUBLIC PENSION FUNDS
Investors in the process of redeeming their entire hedge fund portfolio by type:
Change in public pension fund allocations to hedge funds over 2016
(as a proportion of AUM):The new initiative sends a message
to the hedge fund community that fee structures must be more closely aligned with the interests of benefi ciaries
- US public pension fund New Jersey State Investment Council, 3 August 2016, regular
meeting minutes*, in response to its plan to reduce its exposure to hedge funds
Investors' investment plans detailed on Preqin's Hedge Fund Online and their subsequent commitments:
Investor Fund Search Planned in 2016 Allocation
Iowa Public Employees' Retirement System (IPERS)
The $28bn Des Moines-based public pension fund issued an RFP for managers of liquid absolute return strategies to manage a total of $700mn in Q1 2016. The investor announced its intention to hire several managers with proposals due in March, representing IPERS’ fi rst investment in the hedge fund industry.
It was announced in December 2016 that IPERS had selected seven fund managers to fi ll this mandate. IPERS committed $100mn each to Graham Capital Management, FORT and Lynx Asset Management, and planned future allocations to AQR Capital Management, Kaiser Trading Group, Quantmetrics Capital Management and Wadhwani Asset Management.
Texas Municipal Retirement System
It was announced in February 2016 that Texas Municipal Retirement System intended to commit an undisclosed amount to fi ve or six hedge funds in the next 12 months, seeking funds with global investment exposure.
March 2016 saw the Austin-based investor allocate to Man Group, PDT Partners, DSAM Partners, East Lodge Capital, River Birch Partners, Field Street Capital and Paro Management, while later in the year the public pension fund allocated to Redmile Group, moving the investor 10bps above its target allocation to hedge funds as of June 2016.
Missouri Local Government Employees Retirement System
Also in February, Missouri Local Government Employees Retirement System announced plans to expand its exposure to hedge funds, looking to commit $100mn to a portable alpha program.
The Jeff erson City-based pension fund hired Wellington Management to run a $100mn global equity absolute return strategy via a separate account in July 2016.
Largest public pension funds by current allocation to hedge funds:
* http://www.nj.gov/treasury/doinvest/pdf/ApprovedMinutes/2016/AgendaItem1MinutesRegularMeeting08032016.pdf
Private SectorPension Fund
21%
PublicPension Fund
21%
EndowmentPlan12%
Foundation10%
Insurance Company10%
Asset Manager7%
Family Offi ce5%
Wealth Manager5%
Other10% Increased
16%
No Change69%
Decreased15%
9. INVESTORS & GATEKEEPRS2017 PREQIN GLOBAL HEDGE FUND REPORT - SAMPLE PAGES
© Preqin Ltd. 2017 / www.preqin.com130
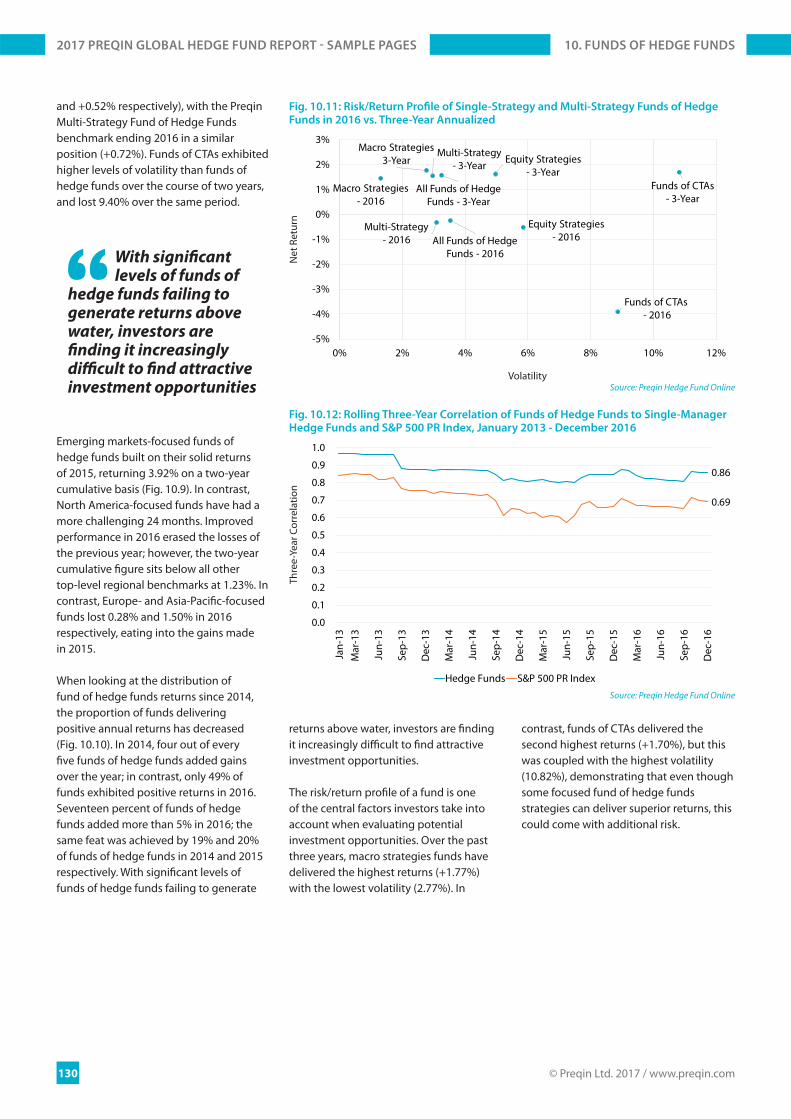
and +0.52% respectively), with the Preqin Multi-Strategy Fund of Hedge Funds benchmark ending 2016 in a similar position (+0.72%). Funds of CTAs exhibited higher levels of volatility than funds of hedge funds over the course of two years, and lost 9.40% over the same period.
Emerging markets-focused funds of hedge funds built on their solid returns of 2015, returning 3.92% on a two-year cumulative basis (Fig. 10.9). In contrast, North America-focused funds have had a more challenging 24 months. Improved performance in 2016 erased the losses of the previous year; however, the two-year cumulative fi gure sits below all other top-level regional benchmarks at 1.23%. In contrast, Europe- and Asia-Pacifi c-focused funds lost 0.28% and 1.50% in 2016 respectively, eating into the gains made in 2015.
When looking at the distribution of fund of hedge funds returns since 2014, the proportion of funds delivering positive annual returns has decreased (Fig. 10.10). In 2014, four out of every fi ve funds of hedge funds added gains over the year; in contrast, only 49% of funds exhibited positive returns in 2016. Seventeen percent of funds of hedge funds added more than 5% in 2016; the same feat was achieved by 19% and 20% of funds of hedge funds in 2014 and 2015 respectively. With signifi cant levels of funds of hedge funds failing to generate
returns above water, investors are fi nding it increasingly diffi cult to fi nd attractive investment opportunities.
The risk/return profi le of a fund is one of the central factors investors take into account when evaluating potential investment opportunities. Over the past three years, macro strategies funds have delivered the highest returns (+1.77%) with the lowest volatility (2.77%). In
contrast, funds of CTAs delivered the second highest returns (+1.70%), but this was coupled with the highest volatility (10.82%), demonstrating that even though some focused fund of hedge funds strategies can deliver superior returns, this could come with additional risk.
With signifi cant levels of funds of
hedge funds failing to generate returns above water, investors are fi nding it increasingly diffi cult to fi nd attractive investment opportunities
Equity Strategies - 2016
Macro Strategies - 2016
Multi-Strategy - 2016
Funds of CTAs- 2016
All Funds of Hedge Funds - 2016
Equity Strategies - 3-Year
Macro Strategies 3-Year
Funds of CTAs - 3-Year
All Funds of Hedge Funds - 3-Year
Multi-Strategy - 3-Year
-5%
-4%
-3%
-2%
-1%
0%
1%
2%
3%
0% 2% 4% 6% 8% 10% 12%
Source: Preqin Hedge Fund Online
Net
Ret
urn
Volatility
Fig. 10.11: Risk/Return Profi le of Single-Strategy and Multi-Strategy Funds of Hedge Funds in 2016 vs. Three-Year Annualized
0.86
0.69
0.0
0.1
0.2
0.3
0.4
0.5
0.6
0.7
0.8
0.9
1.0
Jan-
13M
ar-1
3
Jun-
13
Sep-
13
Dec
-13
Mar
-14
Jun-
14
Sep-
14
Dec
-14
Mar
-15
Jun-
15
Sep-
15
Dec
-15
Mar
-16
Jun-
16
Sep-
16
Dec
-16
Hedge Funds S&P 500 PR Index
Source: Preqin Hedge Fund Online
Thre
e-Ye
ar C
orre
latio
n
Fig. 10.12: Rolling Three-Year Correlation of Funds of Hedge Funds to Single-Manager Hedge Funds and S&P 500 PR Index, January 2013 - December 2016
10. FUNDS OF HEDGE FUNDS2017 PREQIN GLOBAL HEDGE FUND REPORT - SAMPLE PAGES
The 2017 Preqin Global Alternatives Reports are the most detailed and comprehensive reviews of the alternative assets industry available, off ering exclusive insight into the latest developments in the private equity, hedge fund, real estate, infrastructure, private debt and natural resources asset classes.
■ Access in-depth analysis and comprehensive statistics, helping you to understand the latest trends in fundraising, performance, investors, deals, fund managers, secondaries, fund terms, placement agents, consultants, law fi rms and much more.
■ View historical data alongside the most important industry developments. Read contributions from some of the industry’s leading fi gures.
■ Improve your presentations, marketing materials and company reports. ■ Discover the most important players in every area of the industry. ■ Answer key questions: Who is investing? How much has been raised? Where are the centres of
activity? Where is the capital going? What are the biggest deals? What is the outlook for the industry?
2017 PREQIN GLOBAL ALTERNATIVES REPORTS
alternative assets. intelligent data.
For more information visit: www.preqin.com/reports
PAYMENT DETAILS: SHIPPING DETAILS:
Cheque enclosed (cheque payable to ‘Preqin’) Name:________________________________
Telephone:________________________________
Charge my: Visa Firm:________________________________
Email:________________________________
Mastercard Job Title:________________________________
Amex Address:________________________________
Please invoice me________________________________
________________________________
Card Number:________________________________
City:________________________________
Name on Card:________________________________
State:________________________________
Expiration Date:________________________________
Post/Zip:________________________________
Security Code:________________________________
Country:________________________________
COMPLETED ORDER FORMS
Post (to Preqin):
NEW YORKOne Grand Central Place60 E 42nd StreetSuite 630New YorkNY 10165Tel: +1 212 350 0100Fax: +1 440 445 9595
LONDON3rd FloorVintners’ Place68 Upper Thames StreetLondonEC4V 3BJTel: +44 (0)20 3207 0200Fax: +44 (0)870 330 589
SINGAPOREOne Finlayson Green#11-02Singapore049246
Tel: +65 6305 2200Fax: +65 6491 5365
SAN FRANCISCOOne Embarcadero CenterSuite 2850San FranciscoCA 94111
Tel: +1 415 316 0580 Fax: +1 440 445 9595
HONG KONGLevel 9, Central Building1-3 Pedder StreetCentral, Hong Kong
Tel: +852 3958 2819 Fax: +852 3975 2800
MANILAPascor DriveSto. NiñoParanaque CityMetro Manila 1700Philippines
American Express, four-digit code printed on the front of the card.
Visa and Mastercard, last three digits printed on the signature strip.
2017PREQIN GLOBALREAL ESTATEREPORT
alternative assets. intelligent data.
ISBN: 978-1-907012-99-0$175 / £125 / €150www.preqin.com
2017PREQIN GLOBALINFRASTRUCTUREREPORT
alternative assets. intelligent data.
ISBN: 978-1-912116-00-3$175 / £125 / €150www.preqin.com
2017PREQIN GLOBALPRIVATE DEBTREPORT
alternative assets. intelligent data.
ISBN: 978-1-912116-72-0$175 / £125 / €150www.preqin.com
2017PREQIN GLOBALNATURAL RESOURCESREPORT
alternative assets. intelligent data.
ISBN: 978-1-912116-71-3$175 / £125 / €150www.preqin.com
2017PREQIN GLOBALHEDGE FUNDREPORT
alternative assets. intelligent data.
ISBN: 978-1-907012-98-3$175 / £125 / €150www.preqin.com
2017PREQIN GLOBALPRIVATE EQUITY & VENTURE CAPITALREPORT
alternative assets. intelligent data.
ISBN: 978-1-907012-97-6$175 / £125 / €150www.preqin.com
I would like to purchase:
PRINTName First Copy Each Additional Copy Quantity Data Pack* Private Equity & Venture Capital $175/£125/€150 $90/£65/€75 $300/£215/€260
Hedge Funds $175/£125/€150 $90/£65/€75 $300/£215/€260
Real Estate $175/£125/€150 $90/£65/€75 $300/£215/€260
Infrastructure $175/£125/€150 $90/£65/€75 $300/£215/€260
Private Debt $175/£125/€150 $90/£65/€75 $300/£215/€260
Natural Resources $175/£125/€150 $90/£65/€75 $300/£215/€260
All Six Titles (25% Saving!) $785/£560/€675 $395/£280/€340 $1,350/£965/€1,160
Shipping Costs: $40/£10/€25 for single publication $20/£5/€12 for additional copies
(Shipping costs will not exceed a maximum of $60/£15/€37 per order when all shipped to same address. If shipped to multiple addresses then full postage rates apply for additional copies.)
If you would like to order more than 10 copies of one title, please contact us for a special rate
DIGITALName Single-User Licence Each Additional Copy Quantity Enterprise Licence** Data Pack* Private Equity & Venture Capital $175/£125/€150 $90/£65/€75 $1,000/£715/€860 $300/£215/€260
Hedge Funds $175/£125/€150 $90/£65/€75 $1,000/£715/€860 $300/£215/€260
Real Estate $175/£125/€150 $90/£65/€75 $1,000/£715/€860 $300/£215/€260
Infrastructure $175/£125/€150 $90/£65/€75 $1,000/£715/€860 $300/£215/€260
Private Debt $175/£125/€150 $90/£65/€75 $1,000/£715/€860 $300/£215/€260
Natural Resources $175/£125/€150 $90/£65/€75 $1,000/£715/€860 $300/£215/€260
All Six Titles (25% Saving!) $785/£560/€675 $395/£280/€340 $4,500/£3,215/€3,860 $1,350/£965/€1,160
*Data packs feature all the chart and league table data in an Excel fi le. Must be purchased alongside the associated report.**Enterprise Licence allows for team-wide digital access.Please note all prices quoted throughout are exclusive of sales taxes.