2017 hollywood diversity report - social sciences2017 hollywood diversity report 1 executive summary...
TRANSCRIPT
2017 Hollywood Diversity Report:
Setting the Record Straight
i 2017 Hollywood Diversity Report
About the Center
For more than 45 years, the Ralph J. Bunche Center for African American Studies at
UCLA has supported multidisciplinary research that expands our knowledge about the
history, lifestyles, and sociocultural systems of people of African descent, and investigates
problems that have bearing on their psychological, social, and economic well-being.
As a unit of UCLA’s Institute for American Cultures, the Bunche Center has strong affilia-
tions and ongoing collaborations with UCLA’s Chicano Studies Research Center, Asian
American Studies Center, American Indian Studies Center, and the Center for the Study
of Women.
The Bunche Center’s location in Los Angeles, the entertainment capital of the world, pro-
vides unrivaled access to Hollywood’s leaders and creative talent. Its position as an inter-
disciplinary “think tank” allows center researchers to leverage the strengths of UCLA
the campus’s renowned faculty, outstanding humanities and social science divisions, and
state-of-the-art research libraries with the center’s own unique assets as the West
Coast’s premier research institute on African American Studies.
Acknowledgements
This report was authored by Dr. Darnell Hunt, Dr. Ana-Christina Ramón, Michael Tran,
Amberia Sargent, and Vanessa Díaz. Michelle Berman, Brittany Botts, Funmilola
Fagbamila, Briana McKoy, Carmella Stoddard, and Michael Tran contributed to data col-
lection for analyses.
Financial support in 2016 was provided by the Ralph J. Bunche Center for African Ameri-
can Studies at UCLA (The Hollywood Advancement Project) and the following: CBS En-
tertainment Diversity, El Rey Network, ICM Partners, Lionsgate Entertainment, OWN,
LLC, Sony Pictures Entertainment, Starz Entertainment, The Will & Jada Smith Family
Foundation, The Walt Disney Company, and Time Warner Inc..
Photo Credits: Darnell Hunt (cover, p. 61, 73); Pavel Ignatov/Shutterstock.com (p. 3); Alex
LMX/Shutterstock.com (p. 10); Vanessa Díaz (p. 15, 57); Shutterstock.com (p. 16, 47); Angela Waye/
Shutterstock.com (p. 29); bannosuke/Shutterstock.com (p. 39); Joe Seer/Shutterstock.com (p. 40); StacieS-
tauffSmith Photos/Shutterstock.com (p. 43); juan carlos tinjaca/Shutterstock.com (p. 67); and Rawpix-
el.com/Shutterstock.com (p. 69); Volt Collection/Shutterstock.com (p. 72).
February 2017
ii Ralph J. Bunche Center for African American Studies at UCLA
2017 Hollywood Diversity Report:
Setting the Record Straight
Table of Contents
Executive Summary .......................................................................................................... 1
The Data ............................................................................................................................ 4
The Hollywood Landscape ............................................................................................... 5
Hollywood Diversity: Take Four ...................................................................................... 10
Accolades .......................................................................................................................... 40
Gatekeeping ...................................................................................................................... 48
Diversity Initiatives .......................................................................................................... 59
Diversity and the Bottom Line: Casting, Box Office, and Ratings................................... 61
Conclusion: Setting the Record Straight ......................................................................... 73
Endnotes ........................................................................................................................... 75
About the Authors ............................................................................................................ 77
Appendix ........................................................................................................................... 79
1 2017 Hollywood Diversity Report
Executive Summary
This is the fourth in a series of reports to
examine relationships between diversity and
the bottom line in the Hollywood entertain-
ment industry. It considers the top 200
theatrical film releases in 2015 and 1,206
broadcast, cable and digital platform
television shows from the 2014-15 season in
order to document the degree to which
women and minorities are present in front of
and behind the camera. It discusses any
patterns between these findings and box
office receipts and audience ratings.
The following highlights emerge from this
year’s analysis:
1. Minorities. Constituting nearly 40
percent of the U. S. population in 2015,
minorities will become the majority within a
few decades. Since the previous report,
people of color have posted gains relative to
their white counterparts in five of the
industry employment arenas examined (i.e.,
film leads, broadcast scripted leads,
broadcast reality and other leads, digital
scripted leads, and broadcast scripted show
creators). Minorities lost ground in four of
the 11 arenas (i.e., film directors, film
writers, cable scripted leads, and digital
scripted show creators) and merely held
their ground in the other two (i.e., cable
scripted show creators and cable reality and
other leads). They remained underrepre-
sented on every front in 2014-15:
Nearly 3 to 1 among film leads
Nearly 4 to 1 among film directors
Greater than 7 to 1 among film writers
Greater than 3 to 1 among broadcast
scripted leads
Greater than 2 to 1 among cable scripted
leads
Nearly 2 to 1 among broadcast reality and
other leads
Greater than 2 to 1 among leads for cable
reality and other shows
Greater than 3 to 1 among digital scripted
leads
Nearly 5 to 1 among the creators of
broadcast scripted shows
Nearly 5 to 1 among the creators of cable
scripted shows
Nearly 7 to 1 among the creators of
digital scripted shows
Nearly 3 to 1 among the credited writers
for broadcast scripted shows
Greater than 3 to 1 among the credited
writers for cable scripted shows and
digital scripted shows
2. Women. Relative to their male counter-
parts, women posted gains in all Hollywood
employment arenas since the previous
report, with the exception of two — broad-
cast reality and other leads and cable reality
and other leads — where they fell further
behind. Still, like minorities, they remained
underrepresented on every front in 2014-15:
Nearly 2 to 1 among film leads
More than 6 to 1 among film directors
Nearly 4 to 1 among film writers
Less than proportionate representation
among broadcast scripted leads
2 Ralph J. Bunche Center for African American Studies at UCLA
Nearly 2 to 1 among cable scripted leads
Greater than 3 to 1 among broadcast
reality and other leads
Greater than 2 to 1 among cable reality
and other leads
Less than proportionate representation
among digital scripted leads
Greater than 2 to 1 among the creators of
broadcast scripted shows
Greater than 2 to 1 among the creators of
cable scripted shows
Greater than 2 to 1 among the creators of
digital scripted shows
3. Accolades. In 2015, minority- directed
films and those with minority leads lost
ground at the Oscars relative to those led by
white directors or that featured white leads.
While films featuring women leads gained
some ground at the Oscars in 2015, those
directed by women failed to win a single
Oscar. At the Emmys, broadcast scripted
shows created by minorities gained ground
relative to those initiated by white show
creators, while shows created by women
continued to lose ground relative to those
created by men. Meanwhile, not one of the
cable scripted shows created by minorities
won an Emmy that year (matching the
previous three years), and cable shows
created by women continued to lose ground
relative to those created by men.
4. Gatekeeping. Since the last report, the
three dominant talent agencies have
maintained (and in some cases increased)
their combined, dominant shares of the film
directors, film writers, film leads, broadcast
scripted show creators, broadcast scripted
leads, and cable scripted leads credited for
the theatrical films and television shows
examined in 2014-15. Minorities remain
woefully underrepresented on the rosters of
these powerful gatekeepers.
5. Diversity Initiatives. The most promi-
nent industry diversity initiatives are writers’
programs (film and television) and grant
programs (film). These programs are highly
competitive, offering opportunities for
networking and financing to a relatively
small number of the thousands of potential,
diverse candidates. Initiatives focused on
developing diverse creative executives — an
area highlighted in earlier reports as in dire
need of improvement — are even less readily
available.
6. The Bottom Line. Consistent with the
findings of earlier reports in this series, new
evidence from 2014-15 suggests that
America’s increasingly diverse audiences
prefer diverse film and television content.
Films with relatively diverse casts
enjoyed the highest median global box
office receipts and the highest median
return on investment
Minorities accounted for the majority of
ticket sales for five of the top-10 films in
2015 (ranked by global box office)
Relatively diverse films excelled at the
box office between 2011 and 2015,
regardless of genre
Median 18-49 viewer ratings (as well as
median household ratings among whites,
blacks, Latinos, and Asian Americans)
peaked during the 2014-15 season for
broadcast scripted shows featuring casts
that were greater than 40 percent
3 2017 Hollywood Diversity Report
minority
Social media engagement peaked for
broadcast scripted shows with casts that
reflected the diversity of America
Median black household ratings peaked
for cable scripted shows with casts that
were majority minority in 2014-15
For Asian American and Latino house-
holds, median ratings peaked in the cable
scripted arena for shows with casts that
were from 31 to 40 percent minority
For white households and viewers 18-49,
the peak interval in the cable scripted
arena contained shows with casts that
were from 11 to 20 percent minority
Social media engagement peaked for
cable scripted shows with casts that were
from 21 to 30 percent minority
4 Ralph J. Bunche Center for African American Studies at UCLA
2017 Hollywood Diversity
Report
This report is the fourth in a series of studies
by the Ralph J. Bunche Center for African
American Studies at UCLA to explore the
relationships between diversity and the
bottom line in the Hollywood entertainment
industry. The Bunche Center’s larger
Hollywood Advancement Project, from
which this report stems, has three primary
goals: 1) to generate comprehensive research
analyses of the inclusion of diverse groups in
film and television, including lead roles,
writing, directing, producing, and talent
representation; 2) to identify and dissemi-
nate best practices for increasing the pipeline
of underrepresented groups into the
Hollywood entertainment industry; and 3) to
consider the broader implications of diverse
industry access and media images for society
as a whole.
The Data
The 2017 Hollywood Diversity Report
examines 168 theatrical films released in in
2015,1 as well as 1,206 television shows
airing or streaming during the 2014-15
season.2 The television shows were
distributed across six broadcast networks, 64
cable networks, 13 digital platforms, and
through syndication (see Table 1, Appendix).
They were sorted into the following
categories for analysis: 125 broadcast
scripted shows; 87 broadcast reality and
other shows; 204 cable scripted shows; 688
cable reality and other shows; 56 digital
platform scripted shows; 39 digital platform
reality and other shows; and 7 syndicated
shows.3 Variables considered in the analyses
for this report include the following:
Racial status of lead talent
Gender of lead talent
Overall cast diversity
Show creator racial status
Show creator gender
Show locations
Writer diversity
Director diversity
Genres
Talent agency representation
Oscar and Emmy awards
Types of diversity initiatives
Nielsen viewer and social media ratings4
Global and domestic box office
Rentrak ticket buyer demographics
Data for this report were compiled from a
variety of sources that industry stakeholders
rely upon for day-to-day updates on industry
developments. These sources include The
Studio System, Variety Insight, the Internet
Movie Database (IMDb), Nielsen, Rentrak,
and Box Office Mojo.
5 2017 Hollywood Diversity Report
The Hollywood Landscape
“People in positions of hiring, you better get
smart…We need to have a serious conversa-
tion about diversity.”
— Spike Lee
The previous three reports in this series have
documented a curious disconnect in the
Hollywood entertainment industry with
respect to the question of diversity. On the
one hand, comprehensive analyses of talent
in front of and behind the camera consistent-
ly revealed the woeful underrepresentation
of people of color and women — particularly
in lead roles and in the powerful positions
responsible for deciding which stories get
told. On the other hand, each of the reports
have also documented the fact that diversity
sells: theatrical films and television shows
that more closely reflect the racial and ethnic
diversity of America tend to excel at the box
office and in viewer ratings. If the only color
that Hollywood cares about is green, as
industry insiders often claim, how do we
make sense of this disconnect?
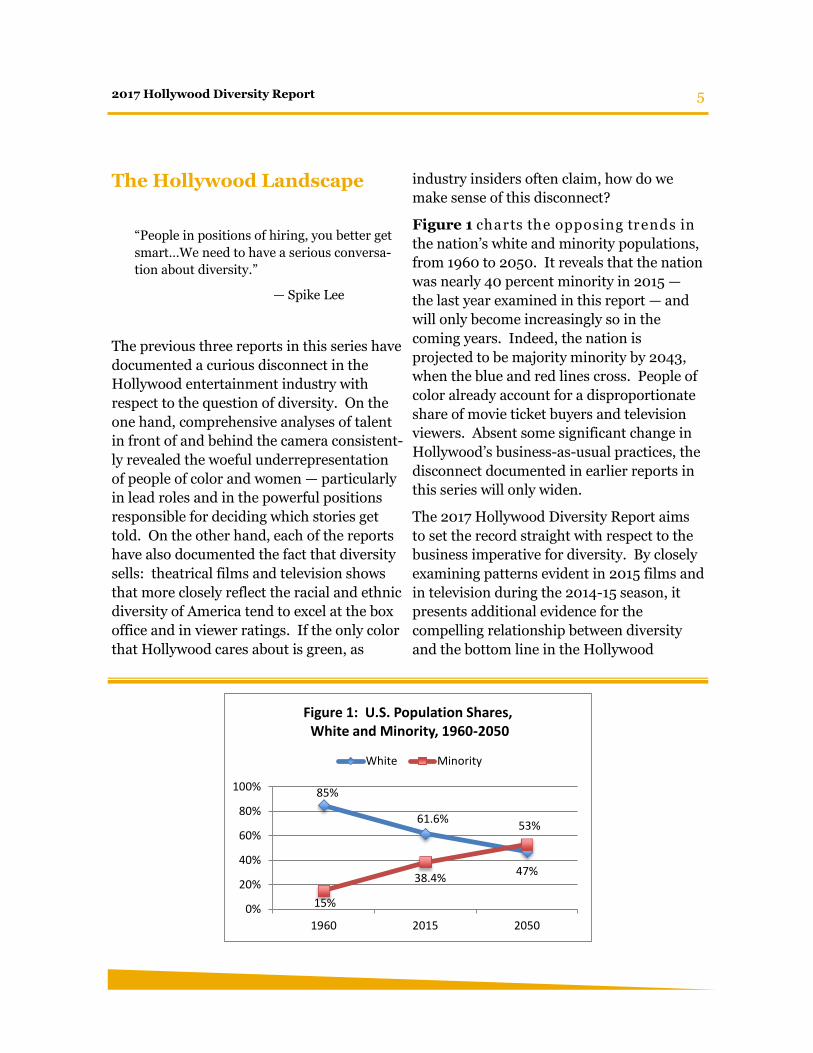
Figure 1 charts the opposing trends in
the nation’s white and minority populations,
from 1960 to 2050. It reveals that the nation
was nearly 40 percent minority in 2015 —
the last year examined in this report — and
will only become increasingly so in the
coming years. Indeed, the nation is
projected to be majority minority by 2043,
when the blue and red lines cross. People of
color already account for a disproportionate
share of movie ticket buyers and television
viewers. Absent some significant change in
Hollywood’s business-as-usual practices, the
disconnect documented in earlier reports in
this series will only widen.
The 2017 Hollywood Diversity Report aims
to set the record straight with respect to the
business imperative for diversity. By closely
examining patterns evident in 2015 films and
in television during the 2014-15 season, it
presents additional evidence for the
compelling relationship between diversity
and the bottom line in the Hollywood
85%
61.6%
47%
15%
38.4%
53%
0%
20%
40%
60%
80%
100%
1960 2015 2050
Figure 1: U.S. Population Shares,White and Minority, 1960-2050
White Minority

6 Ralph J. Bunche Center for African American Studies at UCLA
entertainment industry.
Film
1. U.S. and Canada Box Office Increases 8
Percent between 2014 and 2015
Global box office reached $38.3 billion in
2015, which was a 5 percent increase over
the 2014 figure. Meanwhile, total box office
for the United States and Canada increased
by 8 percent, from $10.4 billion in 2014 to
$11.1 billion in 2015.5 In 2015, 708 films
were released, a figure virtually unchanged
from the 709 films released in 2014.6
2. Minorities Purchase Nearly Half of All
Movie Tickets in 2015
In 2015, people of color purchased 45
percent of all movie tickets sold in the United
States. Latinos were particularly well
represented among minority ticket buyers,
accounting for 23 percent of ticket purchases
alone. Though the group constituted just
about 18 percent of the U.S. population in
2015, they also accounted for 23 percent of
all frequent moviegoers.7
3. Drama, Comedy, and Action Films
Dominate the Top Ranks
The 168 films examined for 2015 were
categorized into 16 genres. Three of the
genres8 — Drama (27.9 percent), Comedy
(21.4 percent), and Action (14.9 percent) —
collectively accounted for 64.2 percent of the
top grossing films in 2015, compared to 62.6
percent of the top 163 films considered in the
previous report for 2014 (see Figure 2).
Television
1. No Single Genre Dominates Broadcast
Programming
As in previous reports, Figure 3 reveals that
no single genre represented a majority of
broadcast television programming during the
2014-15 season. That is, dramas (40.6
percent) and reality programming (23.6
percent) together accounted for 64.2 percent
of the 212 broadcast shows examined. The
remaining 35.9 percent share was divided
between comedy (18.4 percent) and other9
programming (17.5 percent).
0.0%
5.0%
10.0%
15.0%
20.0%
25.0%
30.0%
Figure 2: Percentage Distribution of Films by Genre, 2014 and 2015 (n=163, 168)
2014 2015
7 Ralph J. Bunche Center for African American Studies at UCLA
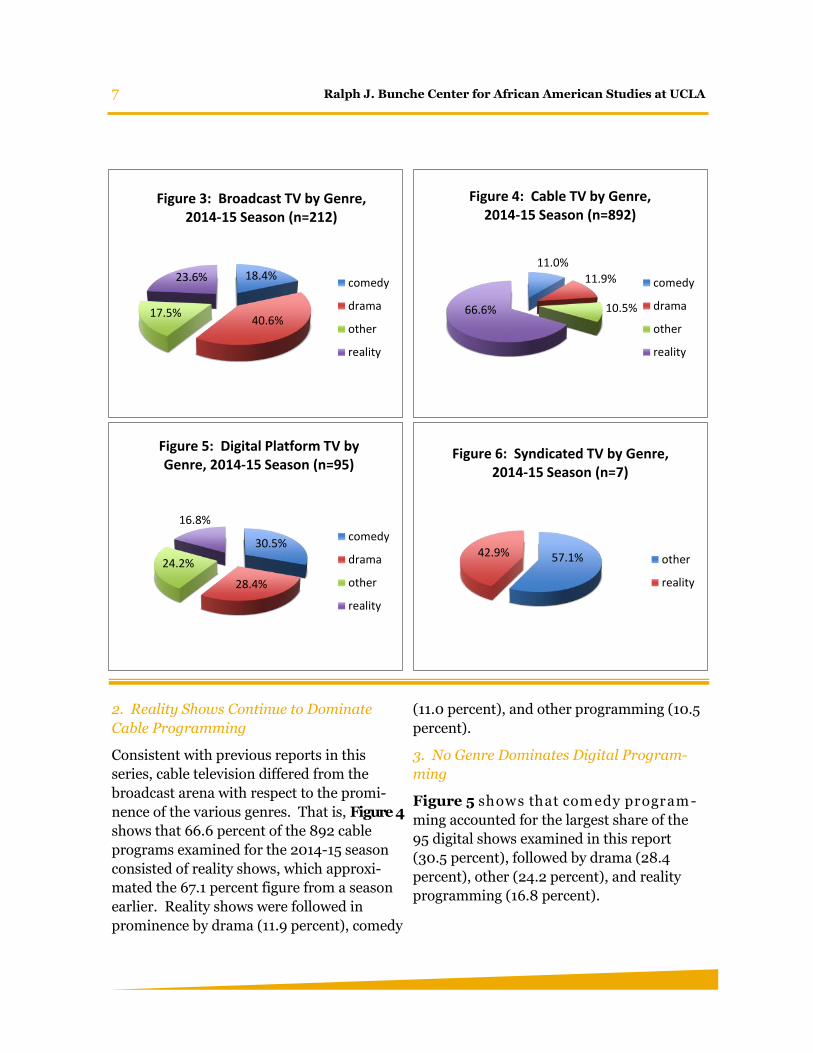
2. Reality Shows Continue to Dominate
Cable Programming
Consistent with previous reports in this
series, cable television differed from the
broadcast arena with respect to the promi-
nence of the various genres. That is, Figure 4
shows that 66.6 percent of the 892 cable
programs examined for the 2014-15 season
consisted of reality shows, which approxi-
mated the 67.1 percent figure from a season
earlier. Reality shows were followed in
prominence by drama (11.9 percent), comedy
(11.0 percent), and other programming (10.5
percent).
3. No Genre Dominates Digital Program-
ming
Figure 5 show s that com edy program -
ming accounted for the largest share of the
95 digital shows examined in this report
(30.5 percent), followed by drama (28.4
percent), other (24.2 percent), and reality
programming (16.8 percent).
18.4%
40.6%17.5%
23.6%
Figure 3: Broadcast TV by Genre, 2014-15 Season (n=212)
comedy
drama
other
reality
11.0%
11.9%
10.5%66.6%
Figure 4: Cable TV by Genre, 2014-15 Season (n=892)
comedy
drama
other
reality
30.5%
28.4%
24.2%
16.8%
Figure 5: Digital Platform TV by Genre, 2014-15 Season (n=95)
comedy
drama
other
reality
57.1%42.9%
Figure 6: Syndicated TV by Genre, 2014-15 Season (n=7)
other
reality
8 2017 Hollywood Diversity Report
4. Other Programming Continues to
Dominate Syndicated
Figure 6 show s that 57.1 percent of the
seven syndicated shows examined in this
report consisted of other programming.
Reality programming accounted for the
remaining 42.9 percent of the shows.
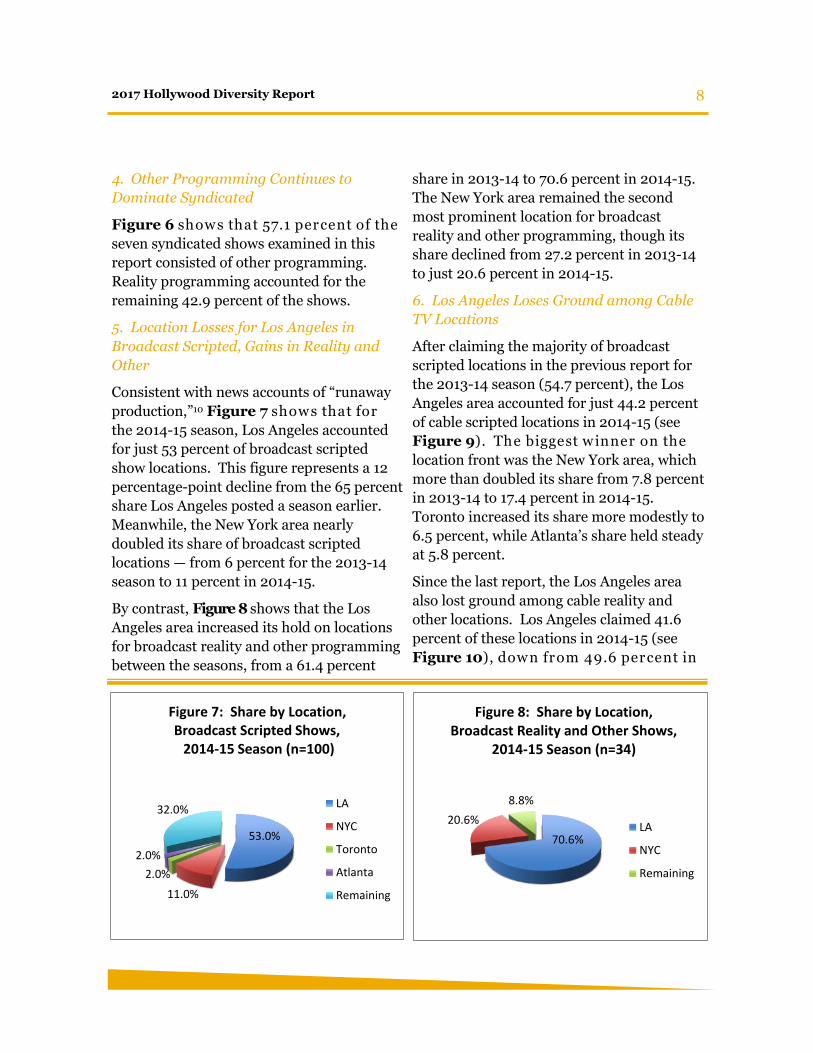
5. Location Losses for Los Angeles in
Broadcast Scripted, Gains in Reality and
Other
Consistent with news accounts of “runaway
production,”10 Figure 7 show s that for
the 2014-15 season, Los Angeles accounted
for just 53 percent of broadcast scripted
show locations. This figure represents a 12
percentage-point decline from the 65 percent
share Los Angeles posted a season earlier.
Meanwhile, the New York area nearly
doubled its share of broadcast scripted
locations — from 6 percent for the 2013-14
season to 11 percent in 2014-15.
By contrast, Figure 8 shows that the Los
Angeles area increased its hold on locations
for broadcast reality and other programming
between the seasons, from a 61.4 percent
share in 2013-14 to 70.6 percent in 2014-15.
The New York area remained the second
most prominent location for broadcast
reality and other programming, though its
share declined from 27.2 percent in 2013-14
to just 20.6 percent in 2014-15.
6. Los Angeles Loses Ground among Cable
TV Locations
After claiming the majority of broadcast
scripted locations in the previous report for
the 2013-14 season (54.7 percent), the Los
Angeles area accounted for just 44.2 percent
of cable scripted locations in 2014-15 (see
Figure 9). The biggest w inner on the
location front was the New York area, which
more than doubled its share from 7.8 percent
in 2013-14 to 17.4 percent in 2014-15.
Toronto increased its share more modestly to
6.5 percent, while Atlanta’s share held steady
at 5.8 percent.
Since the last report, the Los Angeles area
also lost ground among cable reality and
other locations. Los Angeles claimed 41.6
percent of these locations in 2014-15 (see
Figure 10), dow n from 49.6 percent in
53.0%
11.0%
2.0%
2.0%
32.0%
Figure 7: Share by Location, Broadcast Scripted Shows,
2014-15 Season (n=100)
LA
NYC
Toronto
Atlanta
Remaining
70.6%
20.6%
8.8%
Figure 8: Share by Location, Broadcast Reality and Other Shows,
2014-15 Season (n=34)
LA
NYC
Remaining
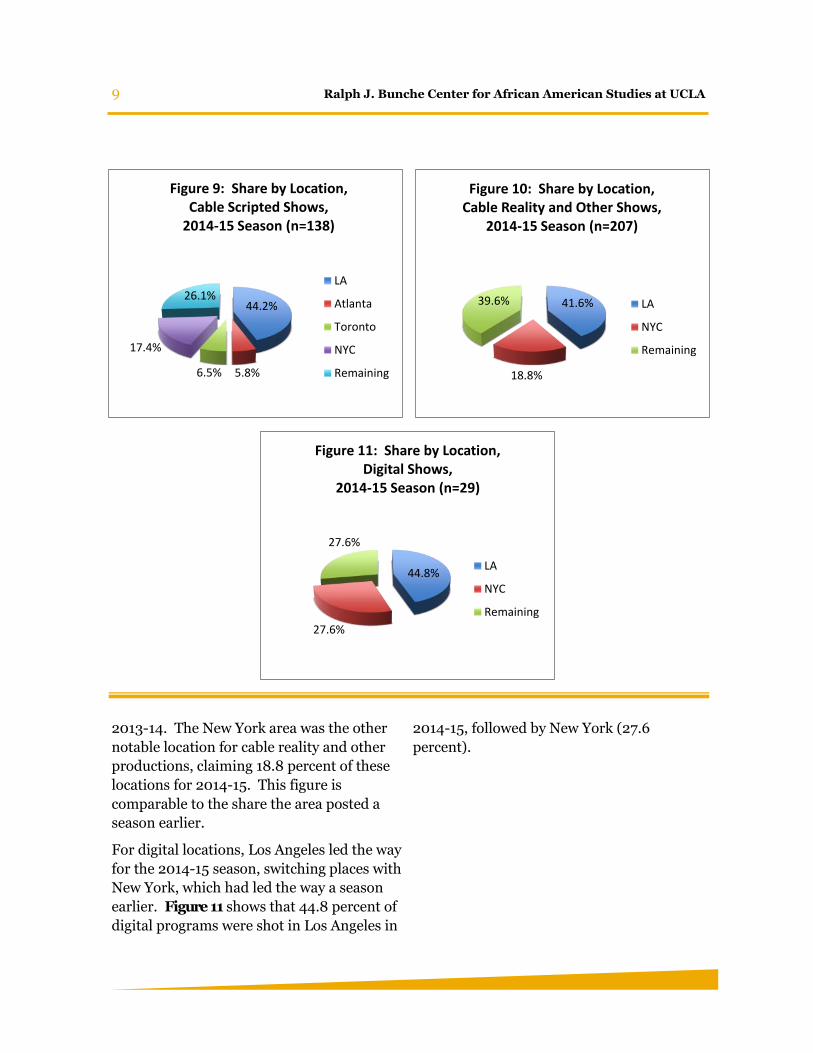
9 Ralph J. Bunche Center for African American Studies at UCLA
2013-14. The New York area was the other
notable location for cable reality and other
productions, claiming 18.8 percent of these
locations for 2014-15. This figure is
comparable to the share the area posted a
season earlier.
For digital locations, Los Angeles led the way
for the 2014-15 season, switching places with
New York, which had led the way a season
earlier. Figure 11 shows that 44.8 percent of
digital programs were shot in Los Angeles in
2014-15, followed by New York (27.6
percent).
44.2%
5.8%6.5%
17.4%
26.1%
Figure 9: Share by Location, Cable Scripted Shows,
2014-15 Season (n=138)
LA
Atlanta
Toronto
NYC
Remaining
41.6%
18.8%
39.6%
Figure 10: Share by Location, Cable Reality and Other Shows,
2014-15 Season (n=207)
LA
NYC
Remaining
44.8%
27.6%
27.6%
Figure 11: Share by Location, Digital Shows,
2014-15 Season (n=29)
LA
NYC
Remaining
10 2017 Hollywood Diversity Report
Hollywood Diversity: Take
Four
“What do you do when someone says, ‘Your
color skin is not what we’re looking for?’”
– America Ferrera
“Having your story told as a woman, as a
person of color, as a lesbian, or as a trans
person or as any member of any disenfran-
chised community is sadly often still a
radical idea.”
– Kerry Washington
The previous report in this series examined
theatrical films released in 2014 and
broadcast, cable, and digital shows airing or
streaming during the 2013-14 season. The
goal was to assess the degree of racial and
gender diversity in front of and behind the
camera. For the various film and television
arenas examined (e.g., lead roles, film
director, film writer, television writer, and
show creators), last year’s report (as its two
predecessors) found that underrepresenta-
tion was the norm for people of color and
women. All too often, as America Ferrera
exclaims in the quote above, industry
decision makers (typically white men) have
green-lighted projects for which people of
color are both marginal to the story and
excluded from the creative work behind the
scenes.
The current report extends the analyses
presented in prior reports in the Hollywood
Diversity Report series. This section
examines theatrical films released in 2015
and broadcast, cable, digital platform and
syndicated shows airing or streaming during
the 2014-15 season in order to identify any
meaningful trends in minority and female
access to industry employment. The
following headlines summarize the most
significant findings.
Film
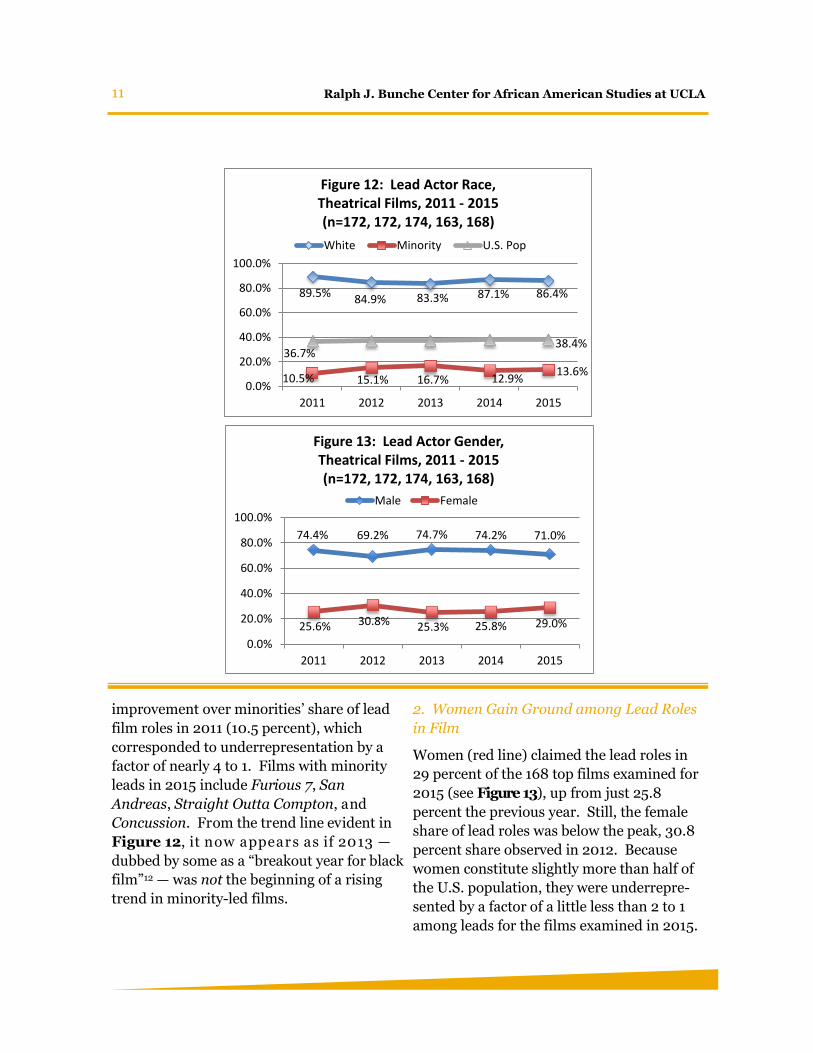
1. Minority Share of Lead Roles11 Stagnant
in Film
Figure 12 show s that the m inority
share of lead roles in the top films examined
(red line) peaked at 16.7 percent in 2013.
Since the last report, the minority share has
stayed more or less flat, 12.9 percent in 2014
versus 13.6 percent in 2015. Because
minorities collectively accounted for 38.4
percent of the U.S. population in 2015 (gray
line), they were underrepresented by a factor
of nearly 3 to 1 among lead roles in the films
examined for that year. Still, this was an
11 Ralph J. Bunche Center for African American Studies at UCLA
improvement over minorities’ share of lead
film roles in 2011 (10.5 percent), which
corresponded to underrepresentation by a
factor of nearly 4 to 1. Films with minority
leads in 2015 include Furious 7, San
Andreas, Straight Outta Compton, and
Concussion. From the trend line evident in
Figure 12, it now appears as if 2013 —
dubbed by some as a “breakout year for black
film”12 — was not the beginning of a rising
trend in minority-led films.
2. Women Gain Ground among Lead Roles
in Film
Women (red line) claimed the lead roles in
29 percent of the 168 top films examined for
2015 (see Figure 13), up from just 25.8
percent the previous year. Still, the female
share of lead roles was below the peak, 30.8
percent share observed in 2012. Because
women constitute slightly more than half of
the U.S. population, they were underrepre-
sented by a factor of a little less than 2 to 1
among leads for the films examined in 2015.
89.5% 84.9% 83.3% 87.1% 86.4%
10.5% 15.1% 16.7% 12.9%13.6%
36.7%38.4%
0.0%
20.0%
40.0%
60.0%
80.0%
100.0%
2011 2012 2013 2014 2015
Figure 12: Lead Actor Race, Theatrical Films, 2011 - 2015(n=172, 172, 174, 163, 168)
White Minority U.S. Pop
74.4% 69.2% 74.7% 74.2% 71.0%
25.6% 30.8% 25.3% 25.8% 29.0%
0.0%
20.0%
40.0%
60.0%
80.0%
100.0%
2011 2012 2013 2014 2015
Figure 13: Lead Actor Gender, Theatrical Films, 2011 - 2015(n=172, 172, 174, 163, 168)
Male Female
12 2017 Hollywood Diversity Report
Films that featured female leads that year
include: Cinderella, American Ultra, and
Fifty Shades of Grey.
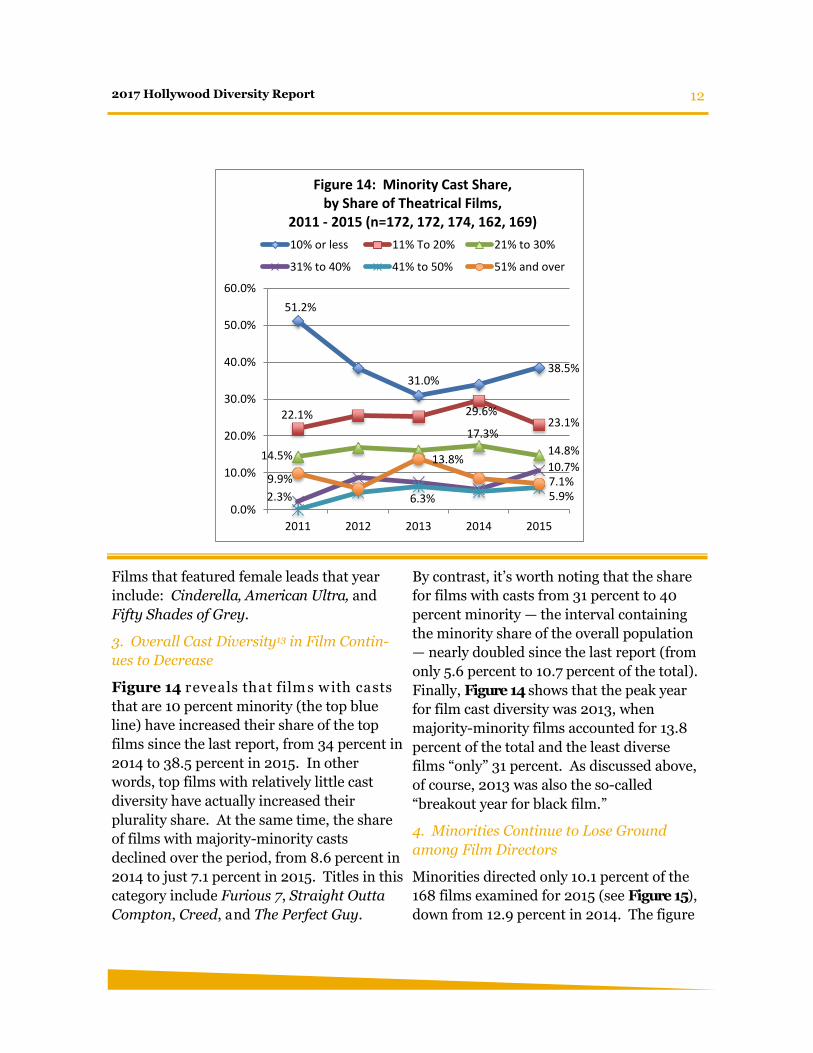
3. Overall Cast Diversity13 in Film Contin-
ues to Decrease
Figure 14 reveals that film s w ith casts
that are 10 percent minority (the top blue
line) have increased their share of the top
films since the last report, from 34 percent in
2014 to 38.5 percent in 2015. In other
words, top films with relatively little cast
diversity have actually increased their
plurality share. At the same time, the share
of films with majority-minority casts
declined over the period, from 8.6 percent in
2014 to just 7.1 percent in 2015. Titles in this
category include Furious 7, Straight Outta
Compton, Creed, and The Perfect Guy.
By contrast, it’s worth noting that the share
for films with casts from 31 percent to 40
percent minority — the interval containing
the minority share of the overall population
— nearly doubled since the last report (from
only 5.6 percent to 10.7 percent of the total).
Finally, Figure 14 shows that the peak year
for film cast diversity was 2013, when
majority-minority films accounted for 13.8
percent of the total and the least diverse
films “only” 31 percent. As discussed above,
of course, 2013 was also the so-called
“breakout year for black film.”
4. Minorities Continue to Lose Ground
among Film Directors
Minorities directed only 10.1 percent of the
168 films examined for 2015 (see Figure 15),
down from 12.9 percent in 2014. The figure
51.2%
31.0%38.5%
22.1% 29.6%23.1%
14.5%
17.3%
14.8%
2.3%
10.7%
6.3% 5.9%
9.9%
13.8%
7.1%
0.0%
10.0%
20.0%
30.0%
40.0%
50.0%
60.0%
2011 2012 2013 2014 2015
Figure 14: Minority Cast Share,by Share of Theatrical Films,
2011 - 2015 (n=172, 172, 174, 162, 169)
10% or less 11% To 20% 21% to 30%
31% to 40% 41% to 50% 51% and over
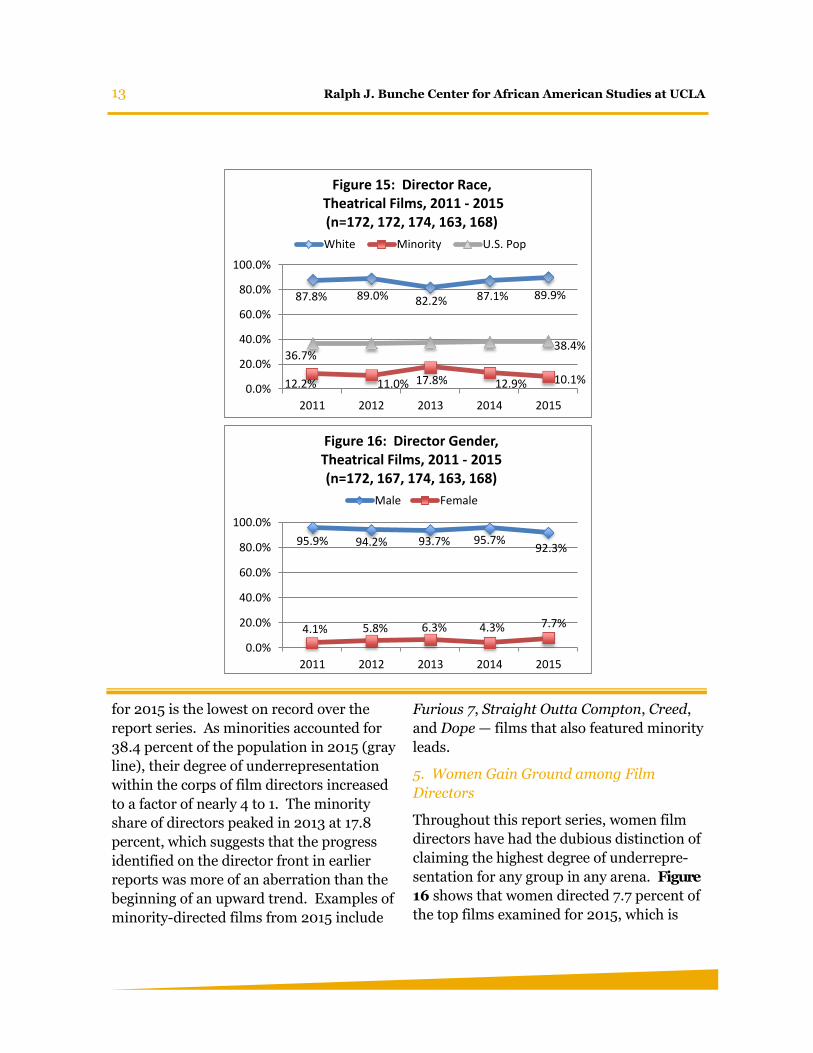
13 Ralph J. Bunche Center for African American Studies at UCLA
for 2015 is the lowest on record over the
report series. As minorities accounted for
38.4 percent of the population in 2015 (gray
line), their degree of underrepresentation
within the corps of film directors increased
to a factor of nearly 4 to 1. The minority
share of directors peaked in 2013 at 17.8
percent, which suggests that the progress
identified on the director front in earlier
reports was more of an aberration than the
beginning of an upward trend. Examples of
minority-directed films from 2015 include
Furious 7, Straight Outta Compton, Creed,
and Dope — films that also featured minority
leads.
5. Women Gain Ground among Film
Directors
Throughout this report series, women film
directors have had the dubious distinction of
claiming the highest degree of underrepre-
sentation for any group in any arena. Figure
16 shows that women directed 7.7 percent of
the top films examined for 2015, which is
87.8% 89.0% 82.2% 87.1% 89.9%
12.2% 11.0% 17.8% 12.9% 10.1%
36.7%38.4%
0.0%
20.0%
40.0%
60.0%
80.0%
100.0%
2011 2012 2013 2014 2015
Figure 15: Director Race,Theatrical Films, 2011 - 2015 (n=172, 172, 174, 163, 168)
White Minority U.S. Pop
95.9% 94.2% 93.7% 95.7%92.3%
4.1% 5.8% 6.3% 4.3% 7.7%
0.0%
20.0%
40.0%
60.0%
80.0%
100.0%
2011 2012 2013 2014 2015
Figure 16: Director Gender, Theatrical Films, 2011 - 2015 (n=172, 167, 174, 163, 168)
Male Female

14 2017 Hollywood Diversity Report
more than a 3 percentage-point increase over
2014 and the highest share on record for the
group. Still, as a little more than 50 percent
of the population, women remained woefully
underrepresented among film directors in
2015, by a factor of nearly 7 to 1. Films
directed by women in 2015 include Fifty
Shades of Grey, Pitch Perfect 2, The Intern,
and Jupiter Ascending.
6. Minorities Continue to Lose Ground
among Film Writers14
Consistent with findings above about the
losses minorities have endured since the
previous report in their share of film
directors, minorities have also lost ground
within the corps of film writers. Figure 17
shows minorities wrote just 5.3 percent of
the 168 films examined for 2015, down from
8 percent in 2014. The minority share of
writers — like the group’s share of leads and
directors — had peaked at more than double
92.4% 92.2% 88.2% 92.0%94.7%
7.6%7.8% 11.8% 8.0%
5.3%
36.7%38.4%
0.0%
20.0%
40.0%
60.0%
80.0%
100.0%
2011 2012 2013 2014 2015
Figure 17: Writer Race, Theatrical Films, 2011 - 2015 (n=172, 167, 170, 163, 168)
White Minority U.S. Pop
85.9% 87.0% 87.1% 90.8% 87.0%
14.1% 13.0% 12.9% 9.2% 13.0%
0.0%
20.0%
40.0%
60.0%
80.0%
100.0%
2011 2012 2013 2014 2015
Figure 18: Writer Gender, Theatrical Films, 2011 - 2015 (n=170, 169, 170, 163, 168)
Male Female
15 Ralph J. Bunche Center for African American Studies at UCLA
this figure, 11.8 percent, in 2013. Relative to
the minority share of the population (gray
line), minorities were underrepresented by a
factor of more than 7 to 1 among film writers
in 2015. Films from 2015 that featured
minority writers include Creed, The Perfect
Guy, Dope, and The Visit.
7. Women Gain Ground among Film
Writers
Figure 18 show s that wom en received
writing credits in 13 percent of the 168 films
examined for 2015, up from the 9.2 percent
figure the group posted in 2014. The 2015
share matches the share the group claimed in
2012 and 2013, but is still about a percentage
point below its 14.1 percent share for 2011.
Despite the gains noted above for women
film directors, the group still fared better as
writers in film in 2015 than as directors, an
arena in which they were “only” underrepre-
sented by a factor of about 4 to 1. Examples
of films written by women in 2015 include
Fifty Shades of Grey, Terminator: Genisys,
Pitch Perfect 2, and Kingsman: The Secret
Service.
16 2017 Hollywood Diversity Report
Television
Leads
Lead actors are significant figures in the
television arena because, more often than
not, the storytelling from week to week
revolves around their characters. As
discussed throughout this report series,
people of color and women have been
underrepresented among television leads
traditionally, raising questions about
audience engagement with the images of
American society in circulation.
1. Minorities Continue to Gain Ground
among Lead Roles in Broadcast Scripted
Shows
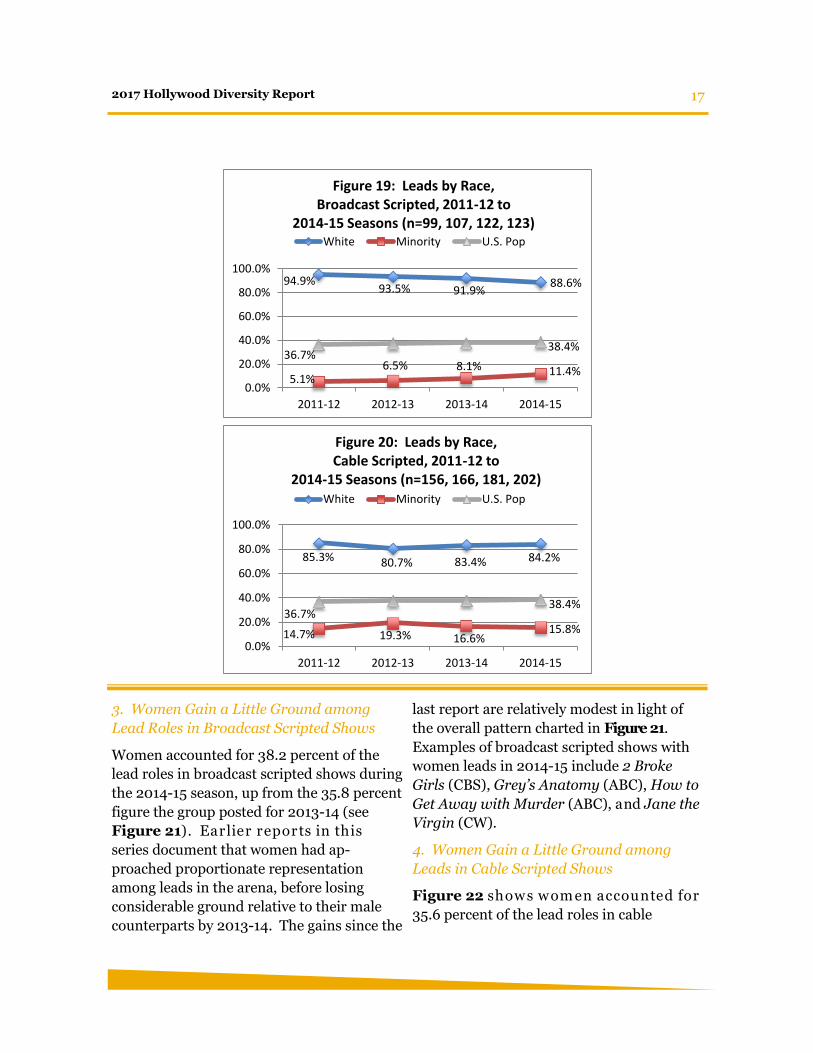
Minority actors claimed 11.4 percent of the
lead roles in broadcast scripted program-
ming during the 2014-15 season, up from the
8.1 percent figure posted for the 2014-15
season (see Figure 19). Though the trend
line for minority leads (red line) has a clear
upward trajectory, minorities remain
seriously underrepresented in this broadcast
scripted arena. That
is, given that
minorities accounted
for 38.4 percent of the
population in 2015
(gray line), their 2014
-15 share of broadcast
scripted lead roles
corresponds to
underrepresentation
by a factor of more
than 3 to 1. Examples
of broadcast scripted
shows from the 2014-
15 season that
featured minority
leads include Black-ish (ABC), Jane the
Virgin (CW), Empire (Fox), and Fresh Off
the Boat (ABC).
2. Minorities Continue to Lose Ground
among Leads in Cable Scripted Shows
Figure 20 show s m inority actors
accounted for 15.8 percent of the lead roles
in cable scripted shows during the 2014-15,
down about a percentage point from the
2013-14 figure (16.6 percent). Consistent
with earlier reports in this series, this share
remains considerably larger than the
corresponding broadcast share for minori-
ties, due to the fact that several cable
networks market primarily to minority (or
“urban”) audiences. Still, minorities were
underrepresented by a factor of more than 2
to 1 among cable scripted leads during the
2014-15 season (see gray line). The following
titles are among cable scripted shows that
featured minority leads in 2014-15: Being
Mary Jane (BET), Devious Maids (Lifetime),
From Dusk Till Dawn: The Series (El Rey),
Ballers (HBO), and Power (Starz).
17 2017 Hollywood Diversity Report
3. Women Gain a Little Ground among
Lead Roles in Broadcast Scripted Shows
Women accounted for 38.2 percent of the
lead roles in broadcast scripted shows during
the 2014-15 season, up from the 35.8 percent
figure the group posted for 2013-14 (see
Figure 21). Earlier reports in this
series document that women had ap-
proached proportionate representation
among leads in the arena, before losing
considerable ground relative to their male
counterparts by 2013-14. The gains since the
last report are relatively modest in light of
the overall pattern charted in Figure 21.
Examples of broadcast scripted shows with
women leads in 2014-15 include 2 Broke
Girls (CBS), Grey’s Anatomy (ABC), How to
Get Away with Murder (ABC), and Jane the
Virgin (CW).
4. Women Gain a Little Ground among
Leads in Cable Scripted Shows
Figure 22 show s w om en accounted for
35.6 percent of the lead roles in cable
94.9%93.5% 91.9%
88.6%
5.1%6.5% 8.1% 11.4%
36.7%38.4%
0.0%
20.0%
40.0%
60.0%
80.0%
100.0%
2011-12 2012-13 2013-14 2014-15
Figure 19: Leads by Race, Broadcast Scripted, 2011-12 to
2014-15 Seasons (n=99, 107, 122, 123)White Minority U.S. Pop
85.3% 80.7% 83.4% 84.2%
14.7% 19.3% 16.6%15.8%
36.7%38.4%
0.0%
20.0%
40.0%
60.0%
80.0%
100.0%
2011-12 2012-13 2013-14 2014-15
Figure 20: Leads by Race, Cable Scripted, 2011-12 to
2014-15 Seasons (n=156, 166, 181, 202)White Minority U.S. Pop
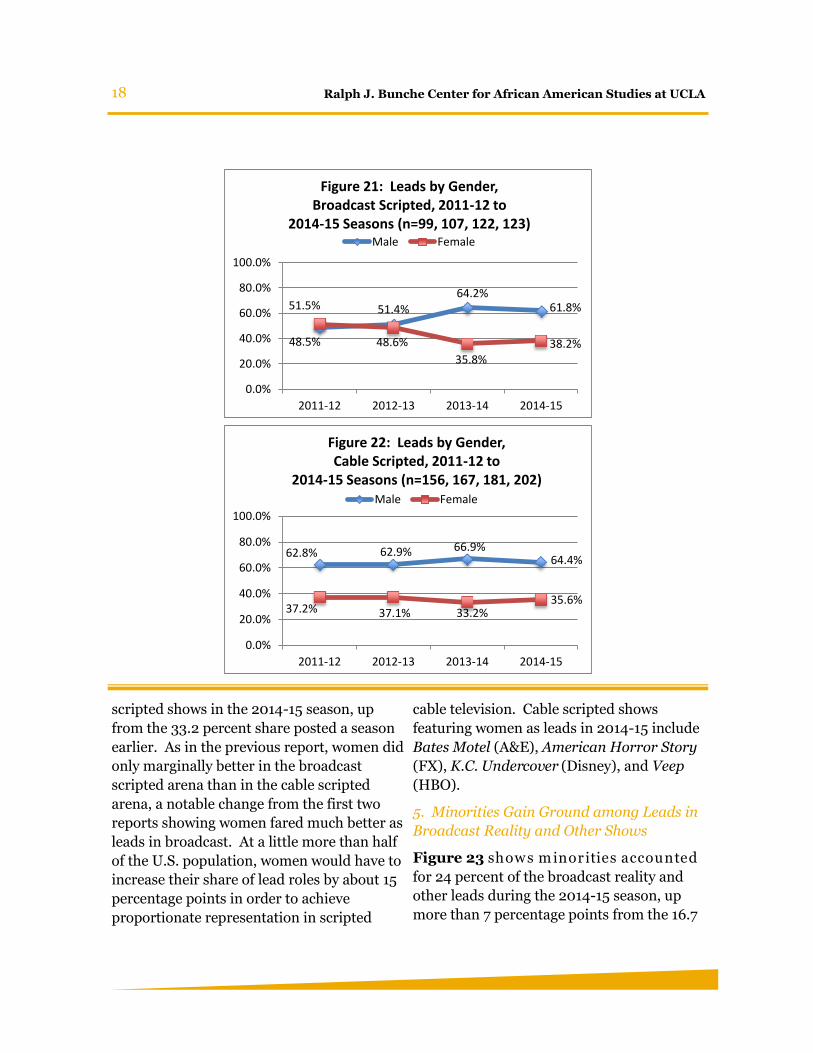
18 Ralph J. Bunche Center for African American Studies at UCLA
scripted shows in the 2014-15 season, up
from the 33.2 percent share posted a season
earlier. As in the previous report, women did
only marginally better in the broadcast
scripted arena than in the cable scripted
arena, a notable change from the first two
reports showing women fared much better as
leads in broadcast. At a little more than half
of the U.S. population, women would have to
increase their share of lead roles by about 15
percentage points in order to achieve
proportionate representation in scripted
cable television. Cable scripted shows
featuring women as leads in 2014-15 include
Bates Motel (A&E), American Horror Story
(FX), K.C. Undercover (Disney), and Veep
(HBO).
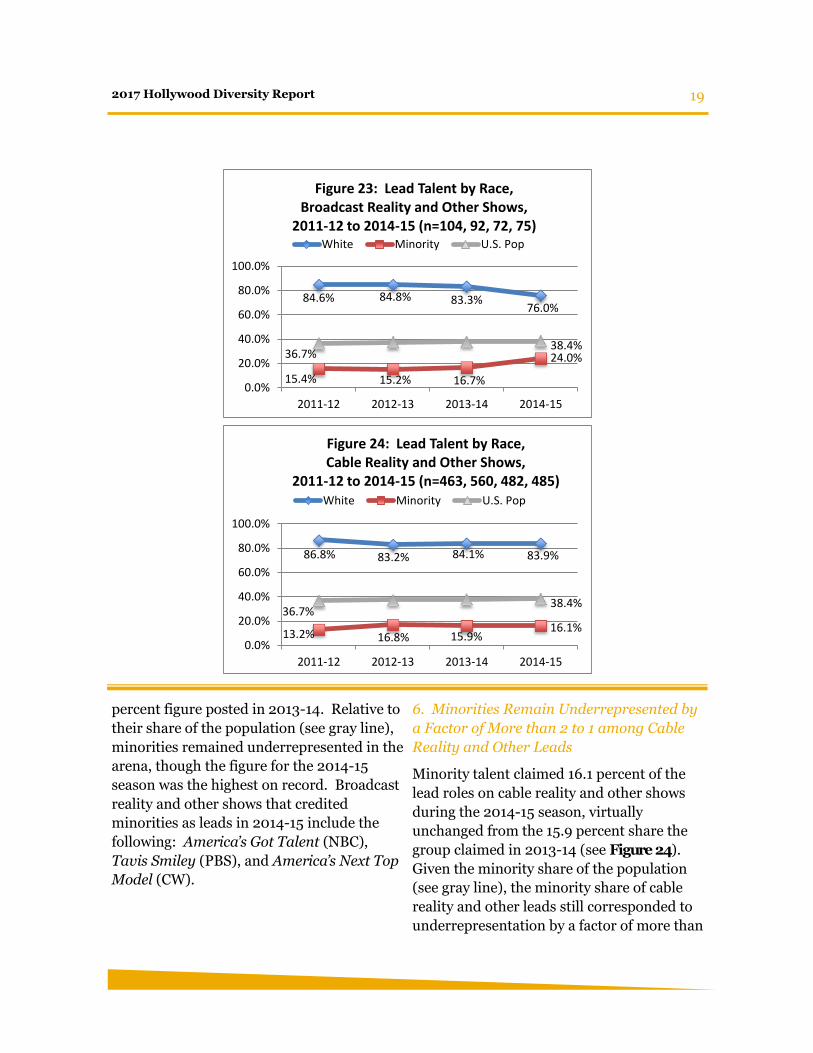
5. Minorities Gain Ground among Leads in
Broadcast Reality and Other Shows
Figure 23 show s m inorities accounted
for 24 percent of the broadcast reality and
other leads during the 2014-15 season, up
more than 7 percentage points from the 16.7
48.5%
51.4%
64.2%61.8%51.5%
48.6%
35.8%38.2%
0.0%
20.0%
40.0%
60.0%
80.0%
100.0%
2011-12 2012-13 2013-14 2014-15
Figure 21: Leads by Gender, Broadcast Scripted, 2011-12 to
2014-15 Seasons (n=99, 107, 122, 123)Male Female
62.8% 62.9% 66.9%64.4%
37.2% 37.1% 33.2%35.6%
0.0%
20.0%
40.0%
60.0%
80.0%
100.0%
2011-12 2012-13 2013-14 2014-15
Figure 22: Leads by Gender, Cable Scripted, 2011-12 to
2014-15 Seasons (n=156, 167, 181, 202)Male Female
19 2017 Hollywood Diversity Report
percent figure posted in 2013-14. Relative to
their share of the population (see gray line),
minorities remained underrepresented in the
arena, though the figure for the 2014-15
season was the highest on record. Broadcast
reality and other shows that credited
minorities as leads in 2014-15 include the
following: America’s Got Talent (NBC),
Tavis Smiley (PBS), and America’s Next Top
Model (CW).
6. Minorities Remain Underrepresented by
a Factor of More than 2 to 1 among Cable
Reality and Other Leads
Minority talent claimed 16.1 percent of the
lead roles on cable reality and other shows
during the 2014-15 season, virtually
unchanged from the 15.9 percent share the
group claimed in 2013-14 (see Figure 24).
Given the minority share of the population
(see gray line), the minority share of cable
reality and other leads still corresponded to
underrepresentation by a factor of more than
84.6% 84.8% 83.3%76.0%
15.4% 15.2% 16.7%
24.0%36.7%38.4%
0.0%
20.0%
40.0%
60.0%
80.0%
100.0%
2011-12 2012-13 2013-14 2014-15
Figure 23: Lead Talent by Race, Broadcast Reality and Other Shows,
2011-12 to 2014-15 (n=104, 92, 72, 75)White Minority U.S. Pop
86.8% 83.2% 84.1% 83.9%
13.2% 16.8% 15.9%16.1%
36.7%38.4%
0.0%
20.0%
40.0%
60.0%
80.0%
100.0%
2011-12 2012-13 2013-14 2014-15
Figure 24: Lead Talent by Race, Cable Reality and Other Shows,
2011-12 to 2014-15 (n=463, 560, 482, 485)White Minority U.S. Pop
20 Ralph J. Bunche Center for African American Studies at UCLA
2 to 1 in 2014-15. Examples of cable reality
and other shows that featured minority lead
talent that season include Gabriel Iglesias
Presents Stand-Up Revolution (Comedy
Central), Iyanla Fix My Life (OWN), and
Love & Hip Hop: Hollywood (VH1).
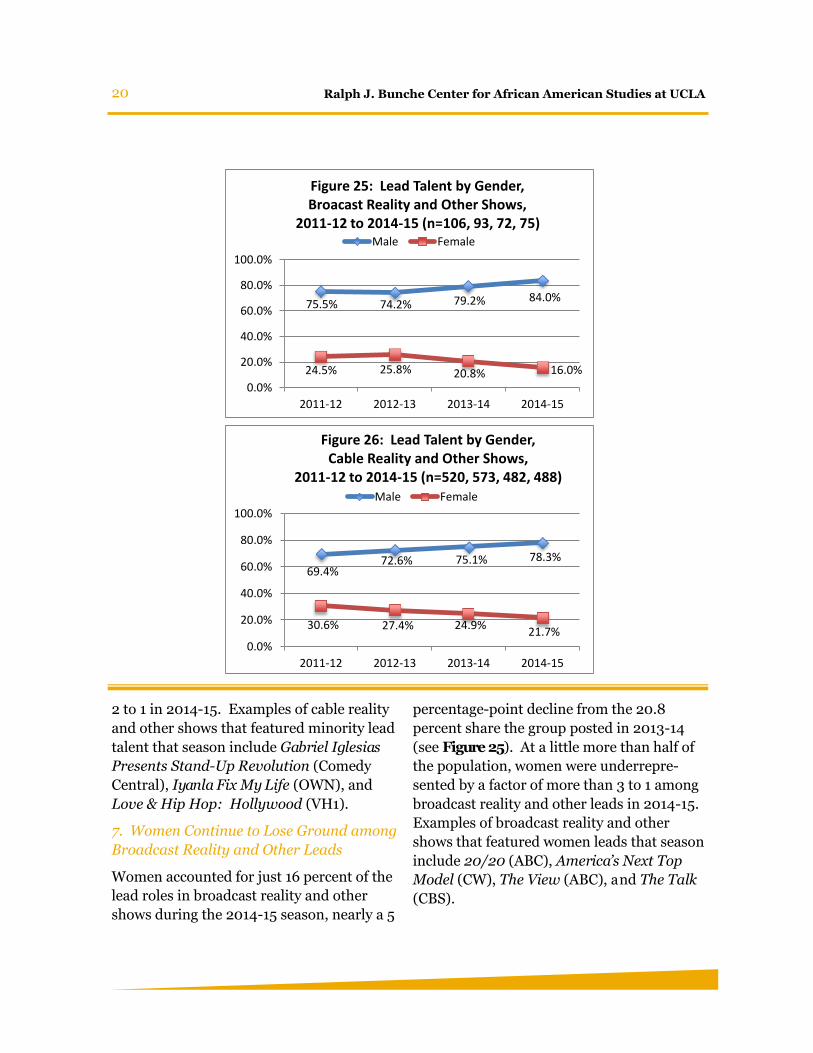
7. Women Continue to Lose Ground among
Broadcast Reality and Other Leads
Women accounted for just 16 percent of the
lead roles in broadcast reality and other
shows during the 2014-15 season, nearly a 5
percentage-point decline from the 20.8
percent share the group posted in 2013-14
(see Figure 25). At a little more than half of
the population, women were underrepre-
sented by a factor of more than 3 to 1 among
broadcast reality and other leads in 2014-15.
Examples of broadcast reality and other
shows that featured women leads that season
include 20/20 (ABC), America’s Next Top
Model (CW), The View (ABC), and The Talk
(CBS).
75.5% 74.2% 79.2% 84.0%
24.5% 25.8% 20.8% 16.0%
0.0%
20.0%
40.0%
60.0%
80.0%
100.0%
2011-12 2012-13 2013-14 2014-15
Figure 25: Lead Talent by Gender, Broacast Reality and Other Shows,
2011-12 to 2014-15 (n=106, 93, 72, 75)Male Female
69.4%72.6% 75.1% 78.3%
30.6% 27.4% 24.9%21.7%
0.0%
20.0%
40.0%
60.0%
80.0%
100.0%
2011-12 2012-13 2013-14 2014-15
Figure 26: Lead Talent by Gender, Cable Reality and Other Shows,
2011-12 to 2014-15 (n=520, 573, 482, 488)Male Female
21 2017 Hollywood Diversity Report
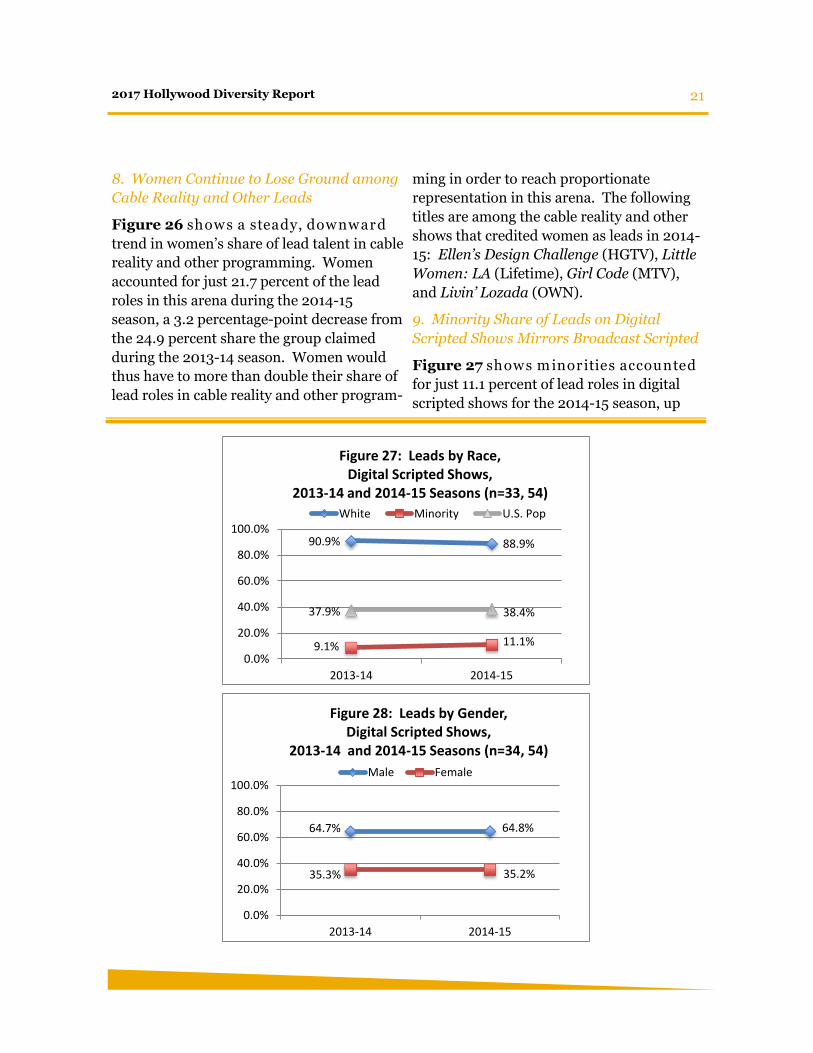
8. Women Continue to Lose Ground among
Cable Reality and Other Leads
Figure 26 show s a steady, dow nw ard
trend in women’s share of lead talent in cable
reality and other programming. Women
accounted for just 21.7 percent of the lead
roles in this arena during the 2014-15
season, a 3.2 percentage-point decrease from
the 24.9 percent share the group claimed
during the 2013-14 season. Women would
thus have to more than double their share of
lead roles in cable reality and other program-
ming in order to reach proportionate
representation in this arena. The following
titles are among the cable reality and other
shows that credited women as leads in 2014-
15: Ellen’s Design Challenge (HGTV), Little
Women: LA (Lifetime), Girl Code (MTV),
and Livin’ Lozada (OWN).
9. Minority Share of Leads on Digital
Scripted Shows Mirrors Broadcast Scripted
Figure 27 show s m inorities accounted
for just 11.1 percent of lead roles in digital
scripted shows for the 2014-15 season, up
90.9% 88.9%
9.1% 11.1%
37.9% 38.4%
0.0%
20.0%
40.0%
60.0%
80.0%
100.0%
2013-14 2014-15
Figure 27: Leads by Race, Digital Scripted Shows,
2013-14 and 2014-15 Seasons (n=33, 54)
White Minority U.S. Pop
64.7% 64.8%
35.3% 35.2%
0.0%
20.0%
40.0%
60.0%
80.0%
100.0%
2013-14 2014-15
Figure 28: Leads by Gender, Digital Scripted Shows,
2013-14 and 2014-15 Seasons (n=34, 54)
Male Female
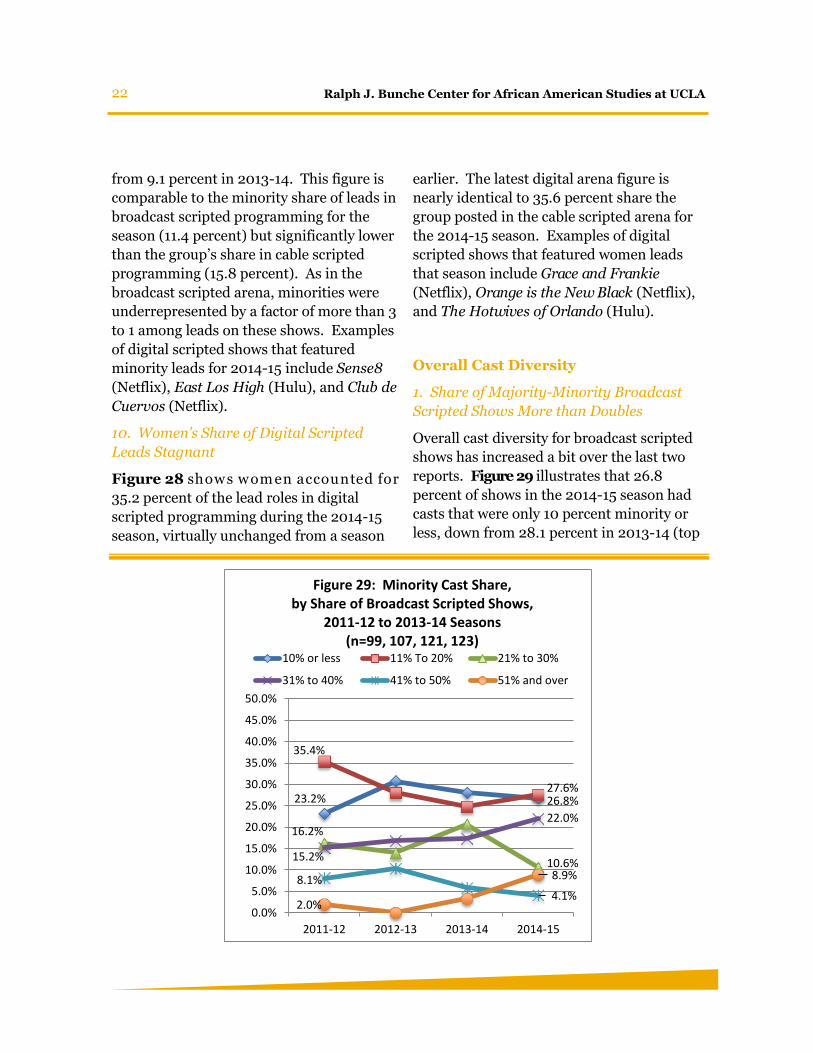
22 Ralph J. Bunche Center for African American Studies at UCLA
from 9.1 percent in 2013-14. This figure is
comparable to the minority share of leads in
broadcast scripted programming for the
season (11.4 percent) but significantly lower
than the group’s share in cable scripted
programming (15.8 percent). As in the
broadcast scripted arena, minorities were
underrepresented by a factor of more than 3
to 1 among leads on these shows. Examples
of digital scripted shows that featured
minority leads for 2014-15 include Sense8
(Netflix), East Los High (Hulu), and Club de
Cuervos (Netflix).
10. Women’s Share of Digital Scripted
Leads Stagnant
Figure 28 show s w om en accounted for
35.2 percent of the lead roles in digital
scripted programming during the 2014-15
season, virtually unchanged from a season
earlier. The latest digital arena figure is
nearly identical to 35.6 percent share the
group posted in the cable scripted arena for
the 2014-15 season. Examples of digital
scripted shows that featured women leads
that season include Grace and Frankie
(Netflix), Orange is the New Black (Netflix),
and The Hotwives of Orlando (Hulu).
Overall Cast Diversity
1. Share of Majority-Minority Broadcast
Scripted Shows More than Doubles
Overall cast diversity for broadcast scripted
shows has increased a bit over the last two
reports. Figure 29 illustrates that 26.8
percent of shows in the 2014-15 season had
casts that were only 10 percent minority or
less, down from 28.1 percent in 2013-14 (top
23.2% 26.8%
35.4%
27.6%
16.2%
10.6%15.2%
22.0%
8.1%4.1%
2.0%
8.9%
0.0%
5.0%
10.0%
15.0%
20.0%
25.0%
30.0%
35.0%
40.0%
45.0%
50.0%
2011-12 2012-13 2013-14 2014-15
Figure 29: Minority Cast Share, by Share of Broadcast Scripted Shows,
2011-12 to 2013-14 Seasons (n=99, 107, 121, 123)
10% or less 11% To 20% 21% to 30%
31% to 40% 41% to 50% 51% and over
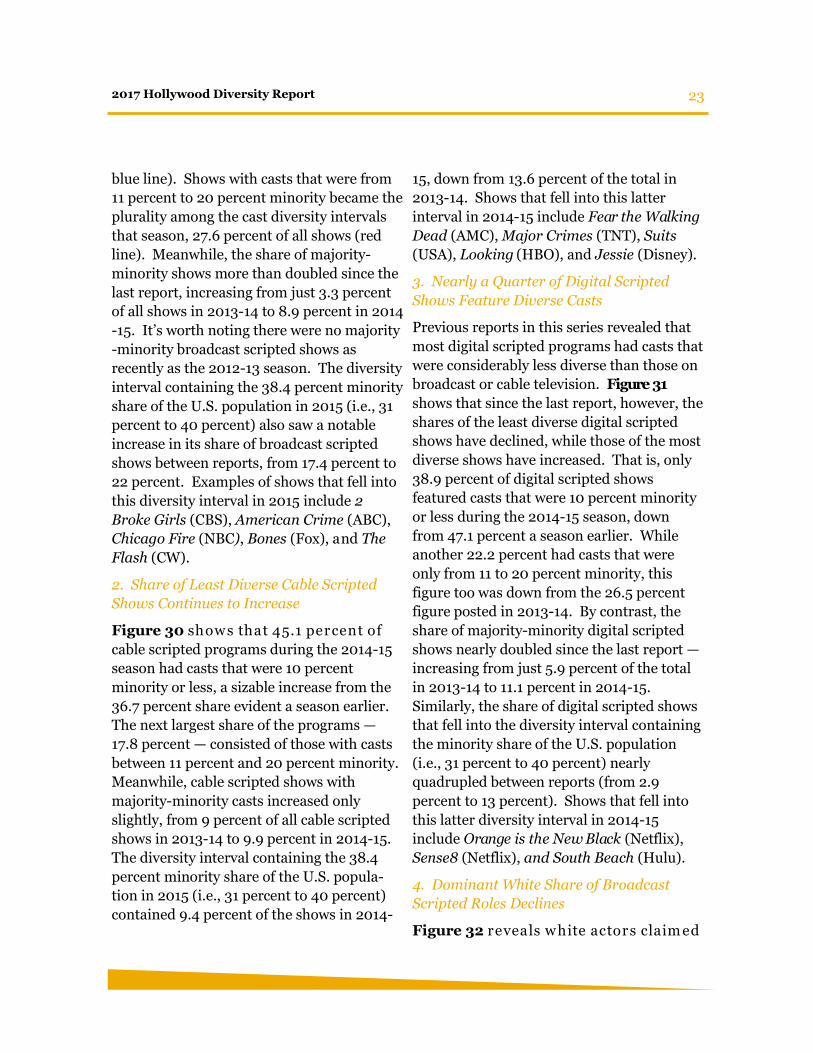
23 2017 Hollywood Diversity Report
blue line). Shows with casts that were from
11 percent to 20 percent minority became the
plurality among the cast diversity intervals
that season, 27.6 percent of all shows (red
line). Meanwhile, the share of majority-
minority shows more than doubled since the
last report, increasing from just 3.3 percent
of all shows in 2013-14 to 8.9 percent in 2014
-15. It’s worth noting there were no majority
-minority broadcast scripted shows as
recently as the 2012-13 season. The diversity
interval containing the 38.4 percent minority
share of the U.S. population in 2015 (i.e., 31
percent to 40 percent) also saw a notable
increase in its share of broadcast scripted
shows between reports, from 17.4 percent to
22 percent. Examples of shows that fell into
this diversity interval in 2015 include 2
Broke Girls (CBS), American Crime (ABC),
Chicago Fire (NBC), Bones (Fox), and The
Flash (CW).
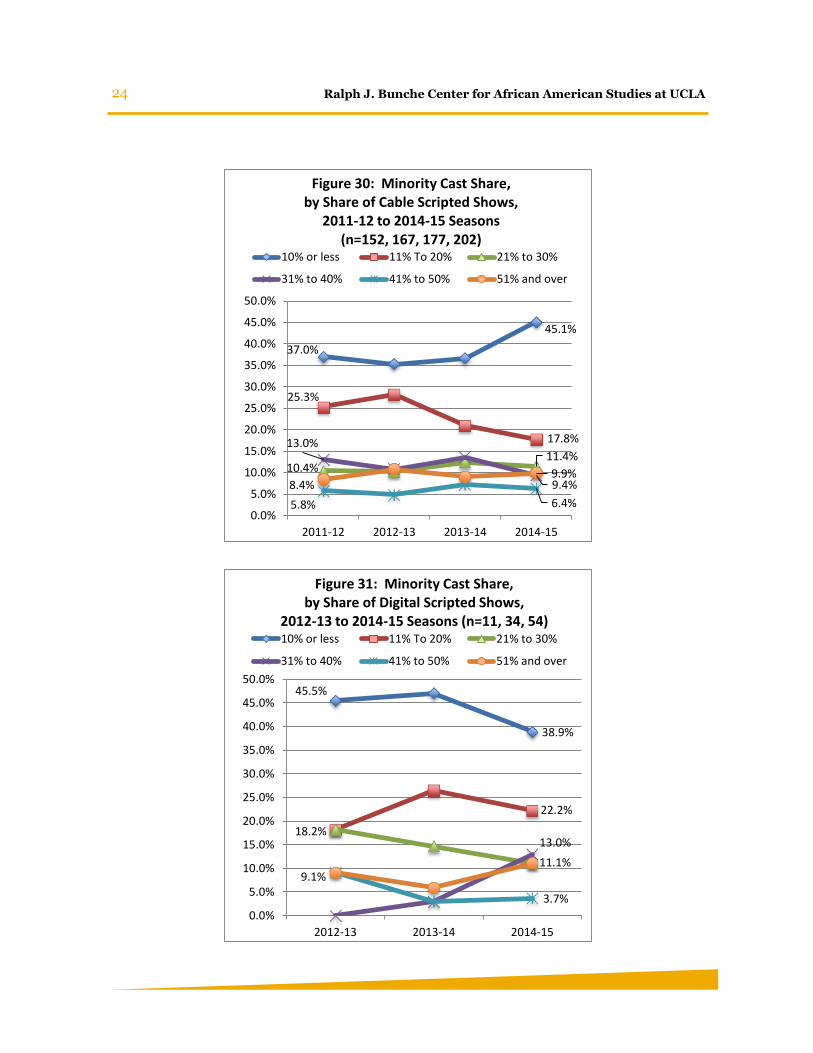
2. Share of Least Diverse Cable Scripted
Shows Continues to Increase
Figure 30 show s that 45.1 percent of
cable scripted programs during the 2014-15
season had casts that were 10 percent
minority or less, a sizable increase from the
36.7 percent share evident a season earlier.
The next largest share of the programs —
17.8 percent — consisted of those with casts
between 11 percent and 20 percent minority.
Meanwhile, cable scripted shows with
majority-minority casts increased only
slightly, from 9 percent of all cable scripted
shows in 2013-14 to 9.9 percent in 2014-15.
The diversity interval containing the 38.4
percent minority share of the U.S. popula-
tion in 2015 (i.e., 31 percent to 40 percent)
contained 9.4 percent of the shows in 2014-
15, down from 13.6 percent of the total in
2013-14. Shows that fell into this latter
interval in 2014-15 include Fear the Walking
Dead (AMC), Major Crimes (TNT), Suits
(USA), Looking (HBO), and Jessie (Disney).
3. Nearly a Quarter of Digital Scripted
Shows Feature Diverse Casts
Previous reports in this series revealed that
most digital scripted programs had casts that
were considerably less diverse than those on
broadcast or cable television. Figure 31
shows that since the last report, however, the
shares of the least diverse digital scripted
shows have declined, while those of the most
diverse shows have increased. That is, only
38.9 percent of digital scripted shows
featured casts that were 10 percent minority
or less during the 2014-15 season, down
from 47.1 percent a season earlier. While
another 22.2 percent had casts that were
only from 11 to 20 percent minority, this
figure too was down from the 26.5 percent
figure posted in 2013-14. By contrast, the
share of majority-minority digital scripted
shows nearly doubled since the last report —
increasing from just 5.9 percent of the total
in 2013-14 to 11.1 percent in 2014-15.
Similarly, the share of digital scripted shows
that fell into the diversity interval containing
the minority share of the U.S. population
(i.e., 31 percent to 40 percent) nearly
quadrupled between reports (from 2.9
percent to 13 percent). Shows that fell into
this latter diversity interval in 2014-15
include Orange is the New Black (Netflix),
Sense8 (Netflix), and South Beach (Hulu).
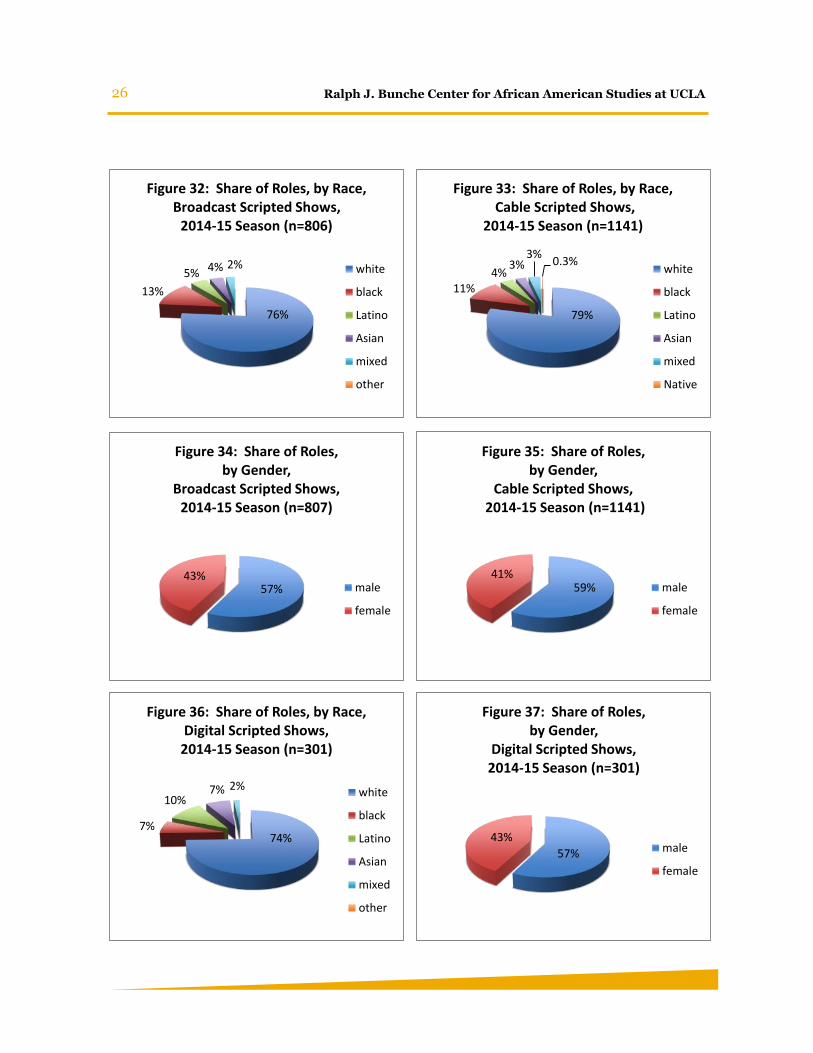
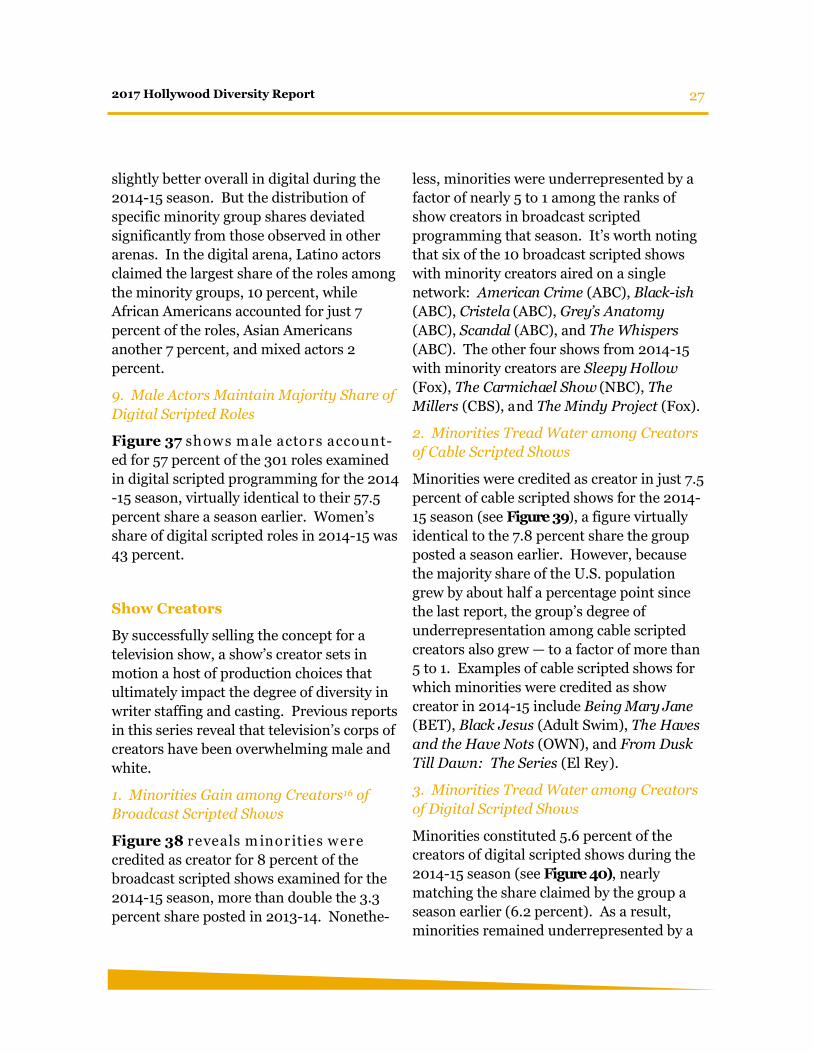
4. Dominant White Share of Broadcast
Scripted Roles Declines
Figure 32 reveals w hite actors claim ed
24 Ralph J. Bunche Center for African American Studies at UCLA
37.0%
45.1%
25.3%
17.8%
10.4%11.4%
13.0%
9.4%
5.8% 6.4%
8.4%9.9%
0.0%
5.0%
10.0%
15.0%
20.0%
25.0%
30.0%
35.0%
40.0%
45.0%
50.0%
2011-12 2012-13 2013-14 2014-15
Figure 30: Minority Cast Share, by Share of Cable Scripted Shows,
2011-12 to 2014-15 Seasons (n=152, 167, 177, 202)
10% or less 11% To 20% 21% to 30%
31% to 40% 41% to 50% 51% and over
45.5%
38.9%
22.2%
18.2%13.0%
3.7%
9.1%11.1%
0.0%
5.0%
10.0%
15.0%
20.0%
25.0%
30.0%
35.0%
40.0%
45.0%
50.0%
2012-13 2013-14 2014-15
Figure 31: Minority Cast Share, by Share of Digital Scripted Shows,
2012-13 to 2014-15 Seasons (n=11, 34, 54)10% or less 11% To 20% 21% to 30%
31% to 40% 41% to 50% 51% and over
25 2017 Hollywood Diversity Report
76 percent of the 806 roles examined in
broadcast scripted programming during the
2014-15 season, down a bit from the the 80
percent share the group posted a season
earlier. Meanwhile, minorities combined for
24 percent of all roles, up from the 20
percent share evident in 2013-14. Minorities
would have to increase their 2014-15 share of
these roles by more than 50 percent to reach
proportionate representation. Breakdowns
for specific minority group shares that
season include: black, 13 percent; Latino, 5
percent; Asian American, 4 percent; Native
Americans, 0 percent; and mixed, 2 percent.
Constituting nearly 18 percent of the U.S.
population in 2015, Latinos remained the
most underrepresented among the minority
groups, by a factor of more than 3 to 1.
5. White Actors Continue to Account for
More than Three Quarters of Cable Scripted
Roles
Figure 33 presents the percentage
distribution of cabled scripted roles by race
during the 2014-15 season. It shows white
actors claimed 79 percent of the 1141 cable
scripted roles, while minorities combined for
21 percent. These white and minority shares
were nearly identical to those documented in
the previous report for the 2013-14 season.
African American actors accounted for more
than half of all minority roles in scripted
cable shows in 2014-15. Claiming 11 percent
of the roles in this arena, the group nearly
matched its share of the U.S. population.
The shares of cable scripted roles claimed by
other minority groups were similar to the
small shares observed in broadcast scripted
programming (4 percent for Latinos, 3
percent for Asian Americans, 3 percent for
mixed actors, and 0 percent for Native
Americans15).
6. Male Actors Maintain Majority Share of
Broadcast Scripted Roles
Figure 34 show s m ale actors account-
ed for 57 percent of the 807 roles examined
in broadcast scripted programming for the
2014-15 season, virtually matching the 56
percent share posted a season earlier.
Women claimed 43 percent of the roles in
2014-15.
7. Male Actors Maintain Majority Share of
Cable Scripted Roles
As in previous reports, the advantage
enjoyed by male actors continued to be more
pronounced in the cable arena than it was in
broadcast. Figure 35 shows male actors
accounted for 59 percent of the 1141 roles
examined in cable scripted programming for
the 2014-15 season, exactly matching the
figure from a season earlier. Women
claimed just 41 percent of the roles.
8. Minority Actors Increase Share of Digital
Scripted Roles
Figure 36 presents the percentage
distribution of digital scripted roles by race
during the 2014-15 season. It shows white
actors claimed 74 percent of the 301 scripted
roles examined in digital platform program-
ming during the 2014-15 season, down from
the 80 percent figure posted a season earlier.
Accordingly, minorities combined for 26
percent of the roles in 2014-15, up from the
20 percent share they claimed in 2013-14.
The white/minority breakdown in digital
scripted programming is similar to that for
both broadcast scripted and cable scripted
programming, though minority actors fared
26 Ralph J. Bunche Center for African American Studies at UCLA
76%
13%
5% 4% 2%
Figure 32: Share of Roles, by Race, Broadcast Scripted Shows,
2014-15 Season (n=806)
white
black
Latino
Asian
mixed
other
79%
11%4%
3%3%
0.3%
Figure 33: Share of Roles, by Race,Cable Scripted Shows,
2014-15 Season (n=1141)
white
black
Latino
Asian
mixed
Native
57%43%
Figure 34: Share of Roles, by Gender,
Broadcast Scripted Shows, 2014-15 Season (n=807)
male
female
59%41%
Figure 35: Share of Roles, by Gender,
Cable Scripted Shows,2014-15 Season (n=1141)
male
female
74%7%
10%7% 2%
Figure 36: Share of Roles, by Race, Digital Scripted Shows,
2014-15 Season (n=301)
white
black
Latino
Asian
mixed
other
57%
43%
Figure 37: Share of Roles, by Gender,
Digital Scripted Shows, 2014-15 Season (n=301)
male
female
27 2017 Hollywood Diversity Report
slightly better overall in digital during the
2014-15 season. But the distribution of
specific minority group shares deviated
significantly from those observed in other
arenas. In the digital arena, Latino actors
claimed the largest share of the roles among
the minority groups, 10 percent, while
African Americans accounted for just 7
percent of the roles, Asian Americans
another 7 percent, and mixed actors 2
percent.
9. Male Actors Maintain Majority Share of
Digital Scripted Roles
Figure 37 show s m ale actors account-
ed for 57 percent of the 301 roles examined
in digital scripted programming for the 2014
-15 season, virtually identical to their 57.5
percent share a season earlier. Women’s
share of digital scripted roles in 2014-15 was
43 percent.
Show Creators
By successfully selling the concept for a
television show, a show’s creator sets in
motion a host of production choices that
ultimately impact the degree of diversity in
writer staffing and casting. Previous reports
in this series reveal that television’s corps of
creators have been overwhelming male and
white.
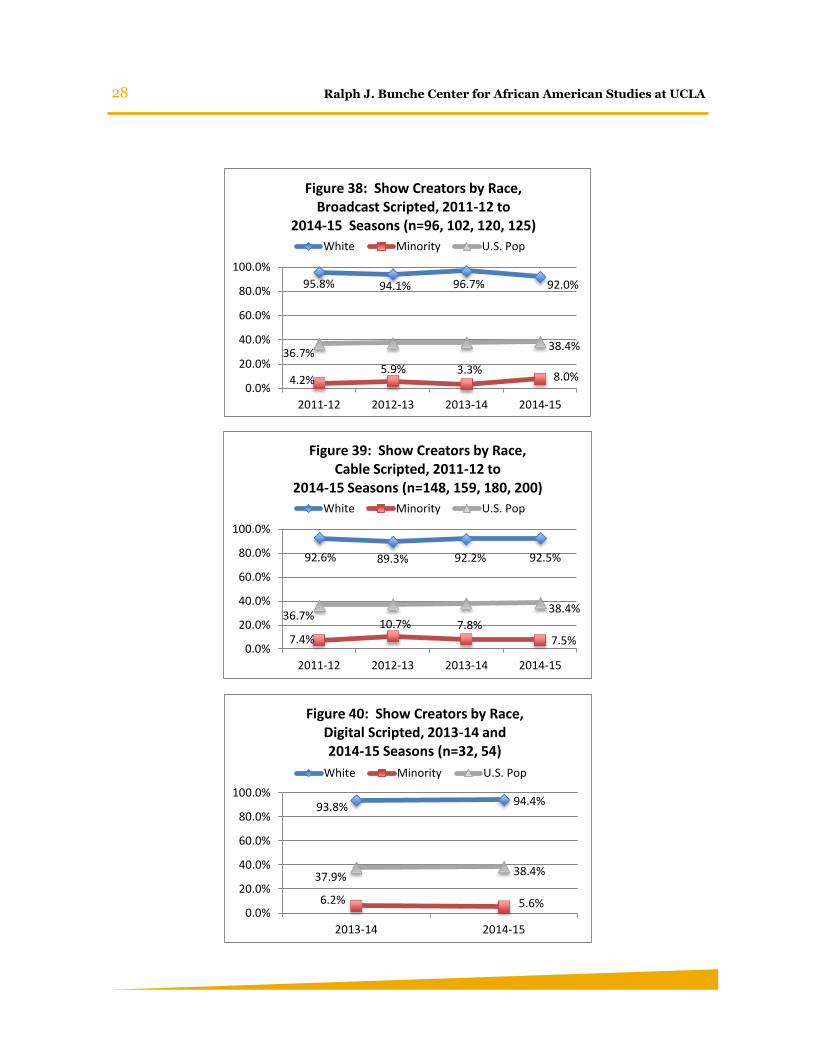
1. Minorities Gain among Creators16 of
Broadcast Scripted Shows
Figure 38 reveals m inorities w ere
credited as creator for 8 percent of the
broadcast scripted shows examined for the
2014-15 season, more than double the 3.3
percent share posted in 2013-14. Nonethe-
less, minorities were underrepresented by a
factor of nearly 5 to 1 among the ranks of
show creators in broadcast scripted
programming that season. It’s worth noting
that six of the 10 broadcast scripted shows
with minority creators aired on a single
network: American Crime (ABC), Black-ish
(ABC), Cristela (ABC), Grey’s Anatomy
(ABC), Scandal (ABC), and The Whispers
(ABC). The other four shows from 2014-15
with minority creators are Sleepy Hollow
(Fox), The Carmichael Show (NBC), The
Millers (CBS), and The Mindy Project (Fox).
2. Minorities Tread Water among Creators
of Cable Scripted Shows
Minorities were credited as creator in just 7.5
percent of cable scripted shows for the 2014-
15 season (see Figure 39), a figure virtually
identical to the 7.8 percent share the group
posted a season earlier. However, because
the majority share of the U.S. population
grew by about half a percentage point since
the last report, the group’s degree of
underrepresentation among cable scripted
creators also grew — to a factor of more than
5 to 1. Examples of cable scripted shows for
which minorities were credited as show
creator in 2014-15 include Being Mary Jane
(BET), Black Jesus (Adult Swim), The Haves
and the Have Nots (OWN), and From Dusk
Till Dawn: The Series (El Rey).
3. Minorities Tread Water among Creators
of Digital Scripted Shows
Minorities constituted 5.6 percent of the
creators of digital scripted shows during the
2014-15 season (see Figure 40), nearly
matching the share claimed by the group a
season earlier (6.2 percent). As a result,
minorities remained underrepresented by a
28 Ralph J. Bunche Center for African American Studies at UCLA
95.8% 94.1% 96.7% 92.0%
4.2%5.9% 3.3%
8.0%
36.7%38.4%
0.0%
20.0%
40.0%
60.0%
80.0%
100.0%
2011-12 2012-13 2013-14 2014-15
Figure 38: Show Creators by Race, Broadcast Scripted, 2011-12 to
2014-15 Seasons (n=96, 102, 120, 125)
White Minority U.S. Pop
92.6% 89.3% 92.2% 92.5%
7.4%10.7% 7.8%
7.5%
36.7%38.4%
0.0%
20.0%
40.0%
60.0%
80.0%
100.0%
2011-12 2012-13 2013-14 2014-15
Figure 39: Show Creators by Race, Cable Scripted, 2011-12 to
2014-15 Seasons (n=148, 159, 180, 200)
White Minority U.S. Pop
93.8% 94.4%
6.2% 5.6%
37.9% 38.4%
0.0%
20.0%
40.0%
60.0%
80.0%
100.0%
2013-14 2014-15
Figure 40: Show Creators by Race, Digital Scripted, 2013-14 and 2014-15 Seasons (n=32, 54)
White Minority U.S. Pop

29 2017 Hollywood Diversity Report
factor of nearly 7 to 1 in this arena. Digital
scripted shows with minority creators in
2014-15 include East Los High (Hulu) and
Club de Cuervos (Netflix).
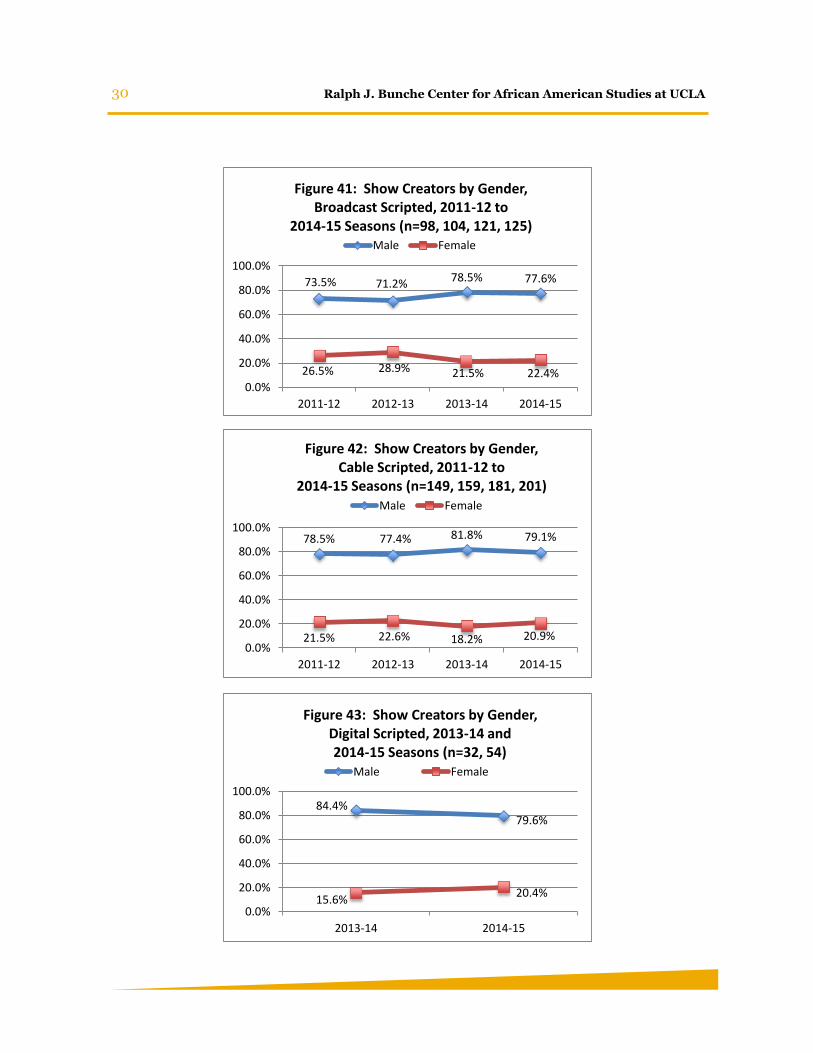
4. Women Tread Water among Creators of
Broadcast Scripted Shows
Figure 41 show s that 22.4 percent of
the creators of broadcast scripted shows
were women during the 2014-15 season,
which approximates the 21.5 percent figure
posted a season earlier. As a result, women
remained underrepresented among these
important industry players by a factor of
more than 2 to 1 for the 2014-15 season.
Among broadcast scripted shows that
credited women as show creator in 2014-15
are the following: Beauty and the Beast
(CW), Grey’s Anatomy (ABC), Scandal
(ABC), New Girl (Fox), and The Mindy
Project (Fox).
5. Women Make Little Headway among
Creators of Scripted
Shows in Cable
Women were
credited as creator in
20.9 percent of cable
scripted shows for
the 2014-15 season,
up slightly from the
18.2 percent share
posted a season
earlier but virtually
unchanged from the
share observed for
the 2011-12 (see
Figure 42).
Underrepresented
by a factor of more
than 2 to 1, women
were nearly as likely to create scripted shows
in cable as they were in broadcast during the
2014-15 season. Among cable scripted shows
that credited women as show creator in 2014
-15 are the following titles: The Missing
(Starz), Finding Carter (MTV), Masters of
Sex (Showtime), Girls (HBO), and Lost Girl
(Syfy).
6. Women Post Gains among Creators of
Digital Scripted Shows
Figure 43 show s that 20.4 percent of
the 54 digital scripted shows examined for
the 2014-15 season were created by women,
up from just 15.6 percent a season earlier.
As a result, women were underrepresented
by a factor of less than 3 to 1 in 2014-15.
Examples of digital scripted shows created
by women in that season include Orange is
the New Black (Netflix), Grace and Frankie
(Netflix), Transparent (Amazon), and
Difficult People (Hulu).
30 Ralph J. Bunche Center for African American Studies at UCLA
73.5% 71.2% 78.5% 77.6%
26.5% 28.9% 21.5% 22.4%0.0%
20.0%
40.0%
60.0%
80.0%
100.0%
2011-12 2012-13 2013-14 2014-15
Figure 41: Show Creators by Gender, Broadcast Scripted, 2011-12 to
2014-15 Seasons (n=98, 104, 121, 125)Male Female
78.5% 77.4% 81.8% 79.1%
21.5% 22.6% 18.2% 20.9%0.0%
20.0%
40.0%
60.0%
80.0%
100.0%
2011-12 2012-13 2013-14 2014-15
Figure 42: Show Creators by Gender, Cable Scripted, 2011-12 to
2014-15 Seasons (n=149, 159, 181, 201)Male Female
84.4%79.6%
15.6%20.4%
0.0%
20.0%
40.0%
60.0%
80.0%
100.0%
2013-14 2014-15
Figure 43: Show Creators by Gender, Digital Scripted, 2013-14 and 2014-15 Seasons (n=32, 54)
Male Female
31 2017 Hollywood Diversity Report
TV Writers
Television is all about the storytelling, and
this important process, of course, starts with
the writing. One of the key takeaways from
earlier reports in this series is that — more
often than not — diverse writers’ rooms are
the ones that have diverse showrunners at
the helm. But studies also have consistently
found over the years that Hollywood’s
writing rooms are far from diverse.17 Though
there appears to be some movement on this
front recently, data from the 2014-15
television season still echo these findings.
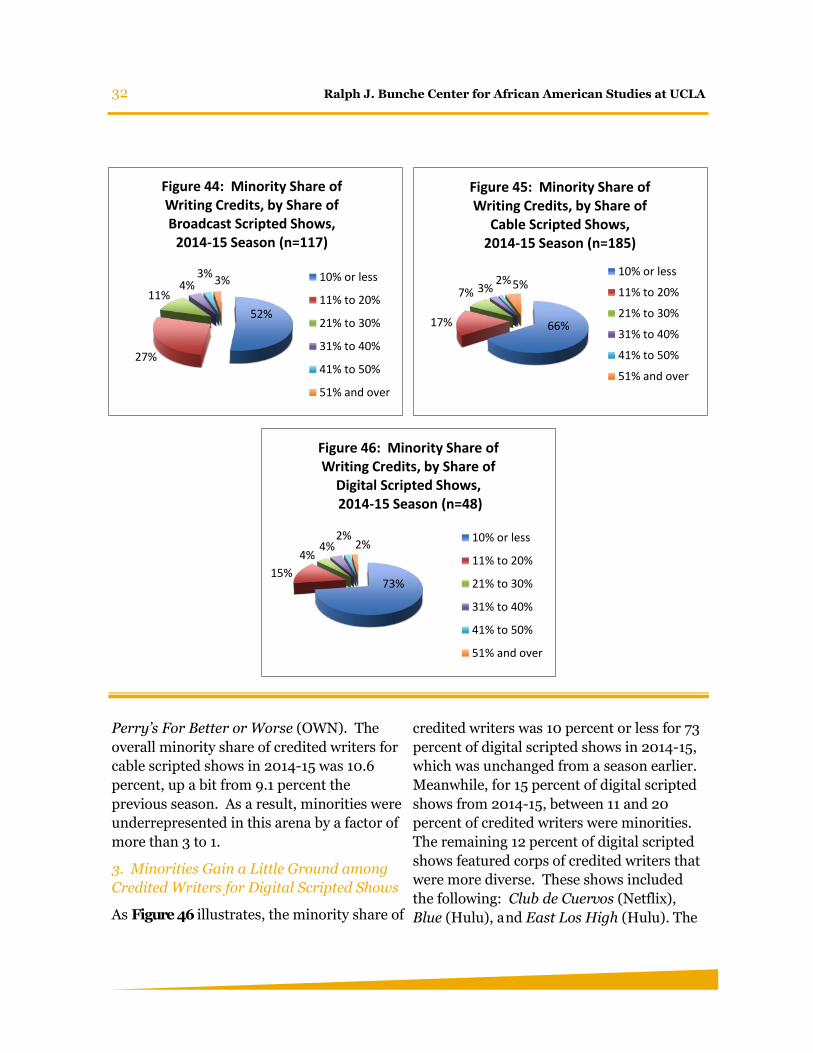
1. Minorities Gain Ground among Credited
Writers for Broadcast Scripted Shows
As Figure 44 shows, for about half of
broadcast scripted programs from the 2014-
15 season (52 percent), fewer than 10 percent
of credited writers were minorities. That is,
the share of shows with the fewest credited
minority writers declined 9 percentage
points since the last report, from 61 percent
in the 2013-14 season. For the next largest
share of shows, 27 percent, minorities
constituted between 11 and 20 percent of the
credited writers for the season. It is worth
noting that for only 4 percent of the shows
were minorities between 31 percent and 40
percent of the credited writers — the
diversity interval containing the minority
share of the population in 2015 (i.e., 38.4
percent). Three of the five shows in this
latter interval aired on ABC, including
Revenge (ABC), Scandal (ABC), and Secrets
& Lies (ABC); the other two shows in the
interval were Criminal Minds (CBS) and
Gracepoint (Fox). Meanwhile, for 3 percent
of the broadcast scripted shows from 2014-
15, minorities constituted the majority of
credited writers. There were no such shows
in 2013-14. Shows in which a majority of
credited writers were minority in 2014-15
include American Crime (ABC), Empire
(Fox), and Fresh Off the Boat (ABC). The
overall minority share of credited writers for
broadcast scripted shows for 2014-15 was
13.4 percent, up nearly 4 percentage points
from the 9.7 percent share minorities
claimed the previous season. Minorities
were underrepresented by a factor of nearly
3 to 1 among these writers, an improvement
over previous seasons.
2. Minority Share of Credited Writers
Remains 10 Percent or Less for Two Thirds
of Cable Scripted Shows
Figure 45 show s that for 66 percent of
cable scripted shows from the 2014-15
season, the minority share of credited writers
was 10 percent or less. This figure is
virtually unchanged from the previous
season. By contrast, the minority share of
credited writers was more than 50 percent
for only 5 percent of the cable shows that
season, a figure that also approximates the
one from a season earlier (4 percent). The 5
percent share of cable scripted shows for
which minorities constituted the majority of
credited writers, of course, largely mirrored
those with minority show creators and
majority-minority casts in 2014-15. Indeed,
all but two of the shows for which the
majority of credited writers were minorities
were black-oriented sitcoms and dramas
airing on networks that cater to significant
African American audiences. These latter
shows include Being Mary Jane (BET), Real
Husbands of Hollywood (BET), The Haves
and the Have Nots (OWN), and Tyler
32 Ralph J. Bunche Center for African American Studies at UCLA
Perry’s For Better or Worse (OWN). The
overall minority share of credited writers for
cable scripted shows in 2014-15 was 10.6
percent, up a bit from 9.1 percent the
previous season. As a result, minorities were
underrepresented in this arena by a factor of
more than 3 to 1.
3. Minorities Gain a Little Ground among
Credited Writers for Digital Scripted Shows
As Figure 46 illustrates, the minority share of
credited writers was 10 percent or less for 73
percent of digital scripted shows in 2014-15,
which was unchanged from a season earlier.
Meanwhile, for 15 percent of digital scripted
shows from 2014-15, between 11 and 20
percent of credited writers were minorities.
The remaining 12 percent of digital scripted
shows featured corps of credited writers that
were more diverse. These shows included
the following: Club de Cuervos (Netflix),
Blue (Hulu), and East Los High (Hulu). The
52%
27%
11%4%
3%3%
Figure 44: Minority Share of Writing Credits, by Share of Broadcast Scripted Shows,
2014-15 Season (n=117)
10% or less
11% to 20%
21% to 30%
31% to 40%
41% to 50%
51% and over
66%17%
7% 3%2%5%
Figure 45: Minority Share of Writing Credits, by Share of
Cable Scripted Shows, 2014-15 Season (n=185)
10% or less
11% to 20%
21% to 30%
31% to 40%
41% to 50%
51% and over
73%15%
4%4%
2%2%
Figure 46: Minority Share of Writing Credits, by Share of
Digital Scripted Shows,2014-15 Season (n=48)
10% or less
11% to 20%
21% to 30%
31% to 40%
41% to 50%
51% and over
33 2017 Hollywood Diversity Report
overall minority share of credited writers for
digital scripted shows in 2014-15 was 10.8
percent, up 2 percentage points from the 8.8
percent figure a season earlier. As a result,
minorities were underrepresented by a factor
of more than 3 to 1 in this arena.
4. Women Gain a Little Ground among
Credited Writers for Broadcast Scripted
Shows
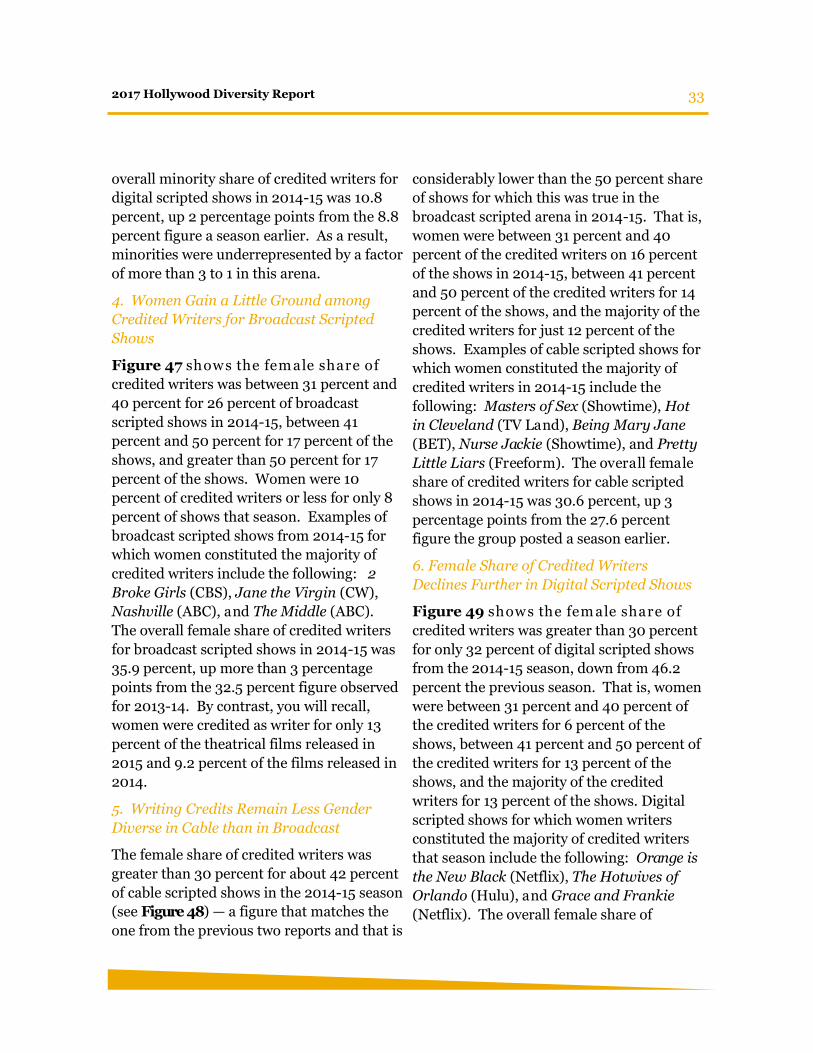
Figure 47 show s the fem ale share of
credited writers was between 31 percent and
40 percent for 26 percent of broadcast
scripted shows in 2014-15, between 41
percent and 50 percent for 17 percent of the
shows, and greater than 50 percent for 17
percent of the shows. Women were 10
percent of credited writers or less for only 8
percent of shows that season. Examples of
broadcast scripted shows from 2014-15 for
which women constituted the majority of
credited writers include the following: 2
Broke Girls (CBS), Jane the Virgin (CW),
Nashville (ABC), and The Middle (ABC).
The overall female share of credited writers
for broadcast scripted shows in 2014-15 was
35.9 percent, up more than 3 percentage
points from the 32.5 percent figure observed
for 2013-14. By contrast, you will recall,
women were credited as writer for only 13
percent of the theatrical films released in
2015 and 9.2 percent of the films released in
2014.
5. Writing Credits Remain Less Gender
Diverse in Cable than in Broadcast
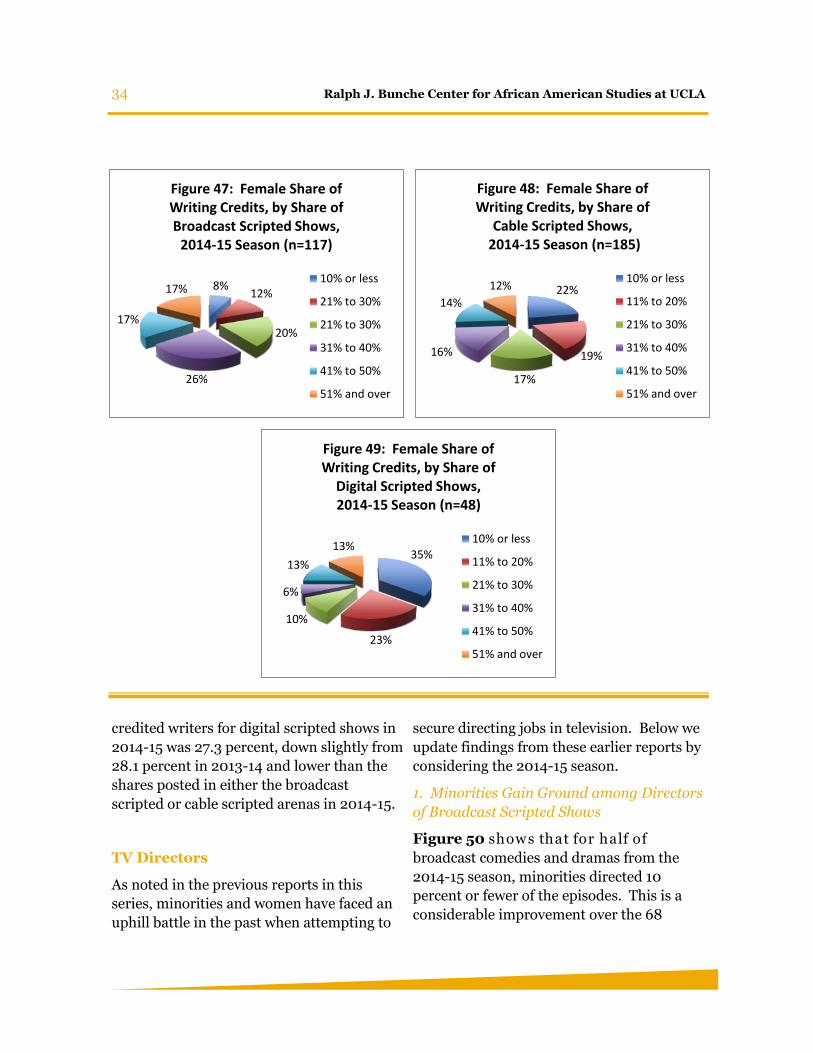
The female share of credited writers was
greater than 30 percent for about 42 percent
of cable scripted shows in the 2014-15 season
(see Figure 48) — a figure that matches the
one from the previous two reports and that is
considerably lower than the 50 percent share
of shows for which this was true in the
broadcast scripted arena in 2014-15. That is,
women were between 31 percent and 40
percent of the credited writers on 16 percent
of the shows in 2014-15, between 41 percent
and 50 percent of the credited writers for 14
percent of the shows, and the majority of the
credited writers for just 12 percent of the
shows. Examples of cable scripted shows for
which women constituted the majority of
credited writers in 2014-15 include the
following: Masters of Sex (Showtime), Hot
in Cleveland (TV Land), Being Mary Jane
(BET), Nurse Jackie (Showtime), and Pretty
Little Liars (Freeform). The overall female
share of credited writers for cable scripted
shows in 2014-15 was 30.6 percent, up 3
percentage points from the 27.6 percent
figure the group posted a season earlier.
6. Female Share of Credited Writers
Declines Further in Digital Scripted Shows
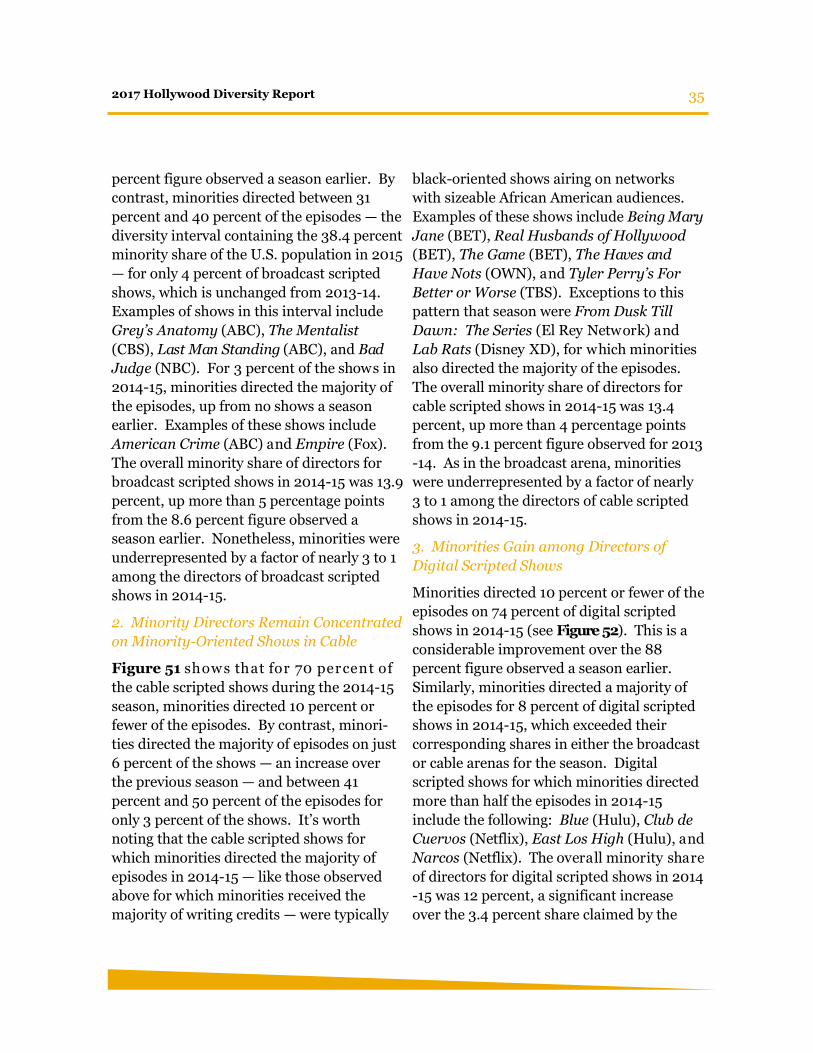
Figure 49 show s the fem ale share of
credited writers was greater than 30 percent
for only 32 percent of digital scripted shows
from the 2014-15 season, down from 46.2
percent the previous season. That is, women
were between 31 percent and 40 percent of
the credited writers for 6 percent of the
shows, between 41 percent and 50 percent of
the credited writers for 13 percent of the
shows, and the majority of the credited
writers for 13 percent of the shows. Digital
scripted shows for which women writers
constituted the majority of credited writers
that season include the following: Orange is
the New Black (Netflix), The Hotwives of
Orlando (Hulu), and Grace and Frankie
(Netflix). The overall female share of
34 Ralph J. Bunche Center for African American Studies at UCLA
credited writers for digital scripted shows in
2014-15 was 27.3 percent, down slightly from
28.1 percent in 2013-14 and lower than the
shares posted in either the broadcast
scripted or cable scripted arenas in 2014-15.
TV Directors
As noted in the previous reports in this
series, minorities and women have faced an
uphill battle in the past when attempting to
secure directing jobs in television. Below we
update findings from these earlier reports by
considering the 2014-15 season.
1. Minorities Gain Ground among Directors
of Broadcast Scripted Shows
Figure 50 show s that for half of
broadcast comedies and dramas from the
2014-15 season, minorities directed 10
percent or fewer of the episodes. This is a
considerable improvement over the 68
8%12%
20%
26%
17%
17%
Figure 47: Female Share of Writing Credits, by Share of Broadcast Scripted Shows,
2014-15 Season (n=117)
10% or less
21% to 30%
21% to 30%
31% to 40%
41% to 50%
51% and over
22%
19%
17%
16%
14%
12%
Figure 48: Female Share of Writing Credits, by Share of
Cable Scripted Shows,2014-15 Season (n=185)
10% or less
11% to 20%
21% to 30%
31% to 40%
41% to 50%
51% and over
35%
23%
10%
6%
13%
13%
Figure 49: Female Share of Writing Credits, by Share of
Digital Scripted Shows, 2014-15 Season (n=48)
10% or less
11% to 20%
21% to 30%
31% to 40%
41% to 50%
51% and over
35 2017 Hollywood Diversity Report
percent figure observed a season earlier. By
contrast, minorities directed between 31
percent and 40 percent of the episodes — the
diversity interval containing the 38.4 percent
minority share of the U.S. population in 2015
— for only 4 percent of broadcast scripted
shows, which is unchanged from 2013-14.
Examples of shows in this interval include
Grey’s Anatomy (ABC), The Mentalist
(CBS), Last Man Standing (ABC), and Bad
Judge (NBC). For 3 percent of the shows in
2014-15, minorities directed the majority of
the episodes, up from no shows a season
earlier. Examples of these shows include
American Crime (ABC) and Empire (Fox).
The overall minority share of directors for
broadcast scripted shows in 2014-15 was 13.9
percent, up more than 5 percentage points
from the 8.6 percent figure observed a
season earlier. Nonetheless, minorities were
underrepresented by a factor of nearly 3 to 1
among the directors of broadcast scripted
shows in 2014-15.
2. Minority Directors Remain Concentrated
on Minority-Oriented Shows in Cable
Figure 51 show s that for 70 percent of
the cable scripted shows during the 2014-15
season, minorities directed 10 percent or
fewer of the episodes. By contrast, minori-
ties directed the majority of episodes on just
6 percent of the shows — an increase over
the previous season — and between 41
percent and 50 percent of the episodes for
only 3 percent of the shows. It’s worth
noting that the cable scripted shows for
which minorities directed the majority of
episodes in 2014-15 — like those observed
above for which minorities received the
majority of writing credits — were typically
black-oriented shows airing on networks
with sizeable African American audiences.
Examples of these shows include Being Mary
Jane (BET), Real Husbands of Hollywood
(BET), The Game (BET), The Haves and
Have Nots (OWN), and Tyler Perry’s For
Better or Worse (TBS). Exceptions to this
pattern that season were From Dusk Till
Dawn: The Series (El Rey Network) and
Lab Rats (Disney XD), for which minorities
also directed the majority of the episodes.
The overall minority share of directors for
cable scripted shows in 2014-15 was 13.4
percent, up more than 4 percentage points
from the 9.1 percent figure observed for 2013
-14. As in the broadcast arena, minorities
were underrepresented by a factor of nearly
3 to 1 among the directors of cable scripted
shows in 2014-15.
3. Minorities Gain among Directors of
Digital Scripted Shows
Minorities directed 10 percent or fewer of the
episodes on 74 percent of digital scripted
shows in 2014-15 (see Figure 52). This is a
considerable improvement over the 88
percent figure observed a season earlier.
Similarly, minorities directed a majority of
the episodes for 8 percent of digital scripted
shows in 2014-15, which exceeded their
corresponding shares in either the broadcast
or cable arenas for the season. Digital
scripted shows for which minorities directed
more than half the episodes in 2014-15
include the following: Blue (Hulu), Club de
Cuervos (Netflix), East Los High (Hulu), and
Narcos (Netflix). The overall minority share
of directors for digital scripted shows in 2014
-15 was 12 percent, a significant increase
over the 3.4 percent share claimed by the
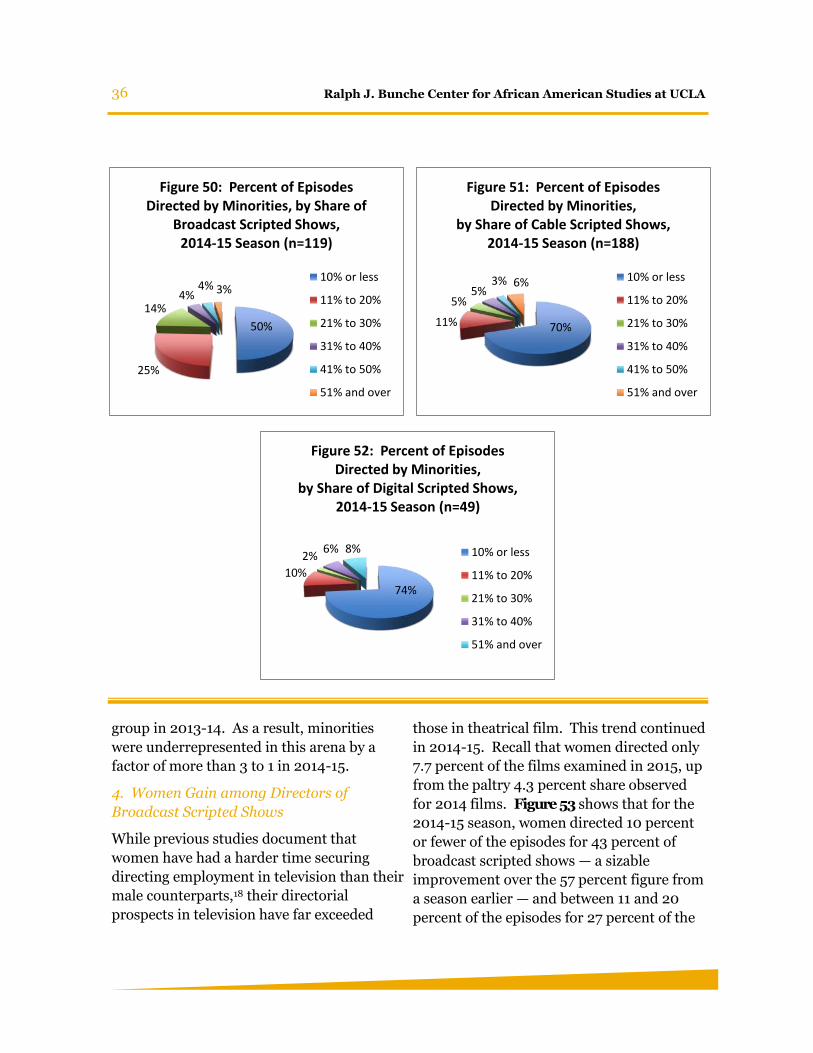
36 Ralph J. Bunche Center for African American Studies at UCLA
group in 2013-14. As a result, minorities
were underrepresented in this arena by a
factor of more than 3 to 1 in 2014-15.
4. Women Gain among Directors of
Broadcast Scripted Shows
While previous studies document that
women have had a harder time securing
directing employment in television than their
male counterparts,18 their directorial
prospects in television have far exceeded
those in theatrical film. This trend continued
in 2014-15. Recall that women directed only
7.7 percent of the films examined in 2015, up
from the paltry 4.3 percent share observed
for 2014 films. Figure 53 shows that for the
2014-15 season, women directed 10 percent
or fewer of the episodes for 43 percent of
broadcast scripted shows — a sizable
improvement over the 57 percent figure from
a season earlier — and between 11 and 20
percent of the episodes for 27 percent of the
50%
25%
14%4%
4% 3%
Figure 50: Percent of Episodes Directed by Minorities, by Share of
Broadcast Scripted Shows, 2014-15 Season (n=119)
10% or less
11% to 20%
21% to 30%
31% to 40%
41% to 50%
51% and over
70%11%
5%5%
3% 6%
Figure 51: Percent of Episodes Directed by Minorities,
by Share of Cable Scripted Shows, 2014-15 Season (n=188)
10% or less
11% to 20%
21% to 30%
31% to 40%
41% to 50%
51% and over
74%
10%
2%6% 8%
Figure 52: Percent of Episodes Directed by Minorities,
by Share of Digital Scripted Shows, 2014-15 Season (n=49)
10% or less
11% to 20%
21% to 30%
31% to 40%
51% and over
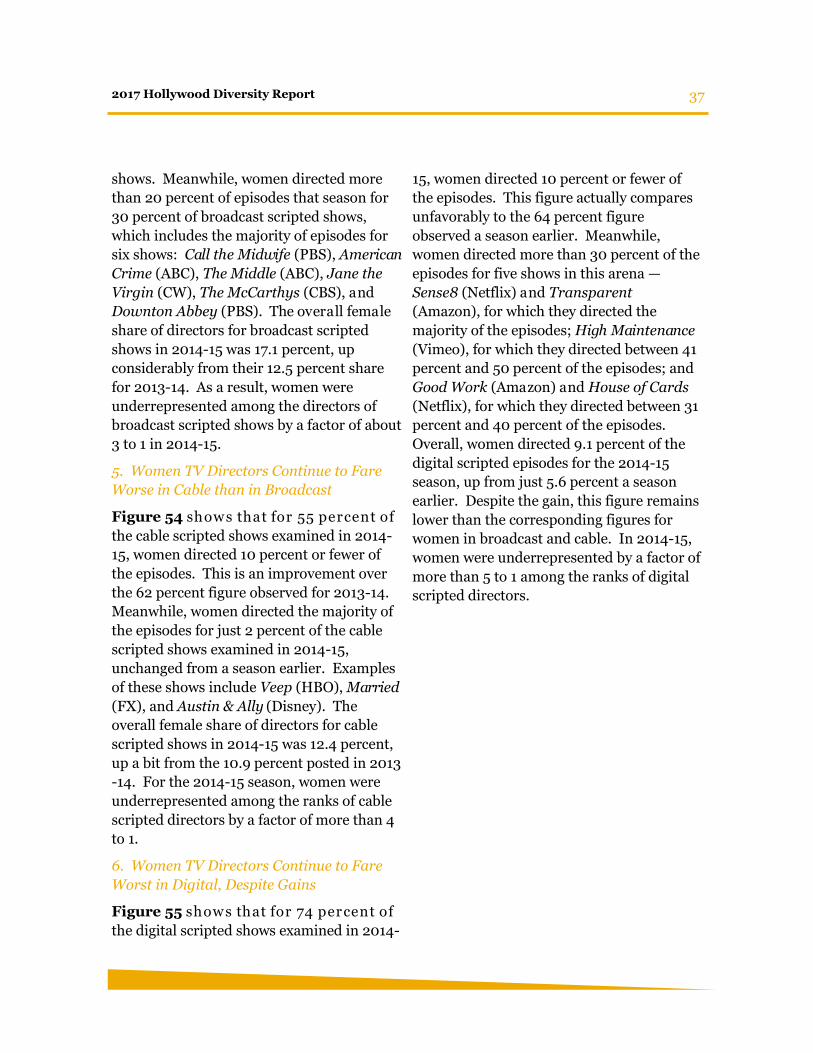
37 2017 Hollywood Diversity Report
shows. Meanwhile, women directed more
than 20 percent of episodes that season for
30 percent of broadcast scripted shows,
which includes the majority of episodes for
six shows: Call the Midwife (PBS), American
Crime (ABC), The Middle (ABC), Jane the
Virgin (CW), The McCarthys (CBS), and
Downton Abbey (PBS). The overall female
share of directors for broadcast scripted
shows in 2014-15 was 17.1 percent, up
considerably from their 12.5 percent share
for 2013-14. As a result, women were
underrepresented among the directors of
broadcast scripted shows by a factor of about
3 to 1 in 2014-15.
5. Women TV Directors Continue to Fare
Worse in Cable than in Broadcast
Figure 54 show s that for 55 percent of
the cable scripted shows examined in 2014-
15, women directed 10 percent or fewer of
the episodes. This is an improvement over
the 62 percent figure observed for 2013-14.
Meanwhile, women directed the majority of
the episodes for just 2 percent of the cable
scripted shows examined in 2014-15,
unchanged from a season earlier. Examples
of these shows include Veep (HBO), Married
(FX), and Austin & Ally (Disney). The
overall female share of directors for cable
scripted shows in 2014-15 was 12.4 percent,
up a bit from the 10.9 percent posted in 2013
-14. For the 2014-15 season, women were
underrepresented among the ranks of cable
scripted directors by a factor of more than 4
to 1.
6. Women TV Directors Continue to Fare
Worst in Digital, Despite Gains
Figure 55 show s that for 74 percent of
the digital scripted shows examined in 2014-
15, women directed 10 percent or fewer of
the episodes. This figure actually compares
unfavorably to the 64 percent figure
observed a season earlier. Meanwhile,
women directed more than 30 percent of the
episodes for five shows in this arena —
Sense8 (Netflix) and Transparent
(Amazon), for which they directed the
majority of the episodes; High Maintenance
(Vimeo), for which they directed between 41
percent and 50 percent of the episodes; and
Good Work (Amazon) and House of Cards
(Netflix), for which they directed between 31
percent and 40 percent of the episodes.
Overall, women directed 9.1 percent of the
digital scripted episodes for the 2014-15
season, up from just 5.6 percent a season
earlier. Despite the gain, this figure remains
lower than the corresponding figures for
women in broadcast and cable. In 2014-15,
women were underrepresented by a factor of
more than 5 to 1 among the ranks of digital
scripted directors.
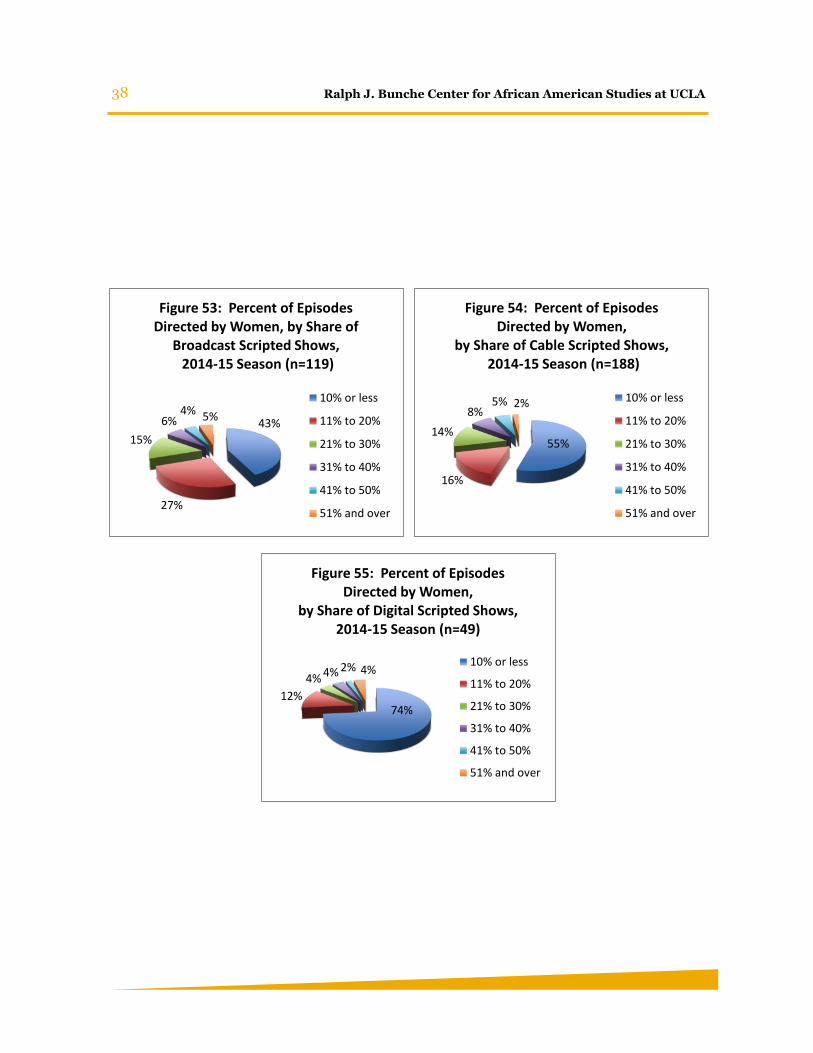
38 Ralph J. Bunche Center for African American Studies at UCLA
43%
27%
15%
6%4% 5%
Figure 53: Percent of Episodes Directed by Women, by Share of
Broadcast Scripted Shows,2014-15 Season (n=119)
10% or less
11% to 20%
21% to 30%
31% to 40%
41% to 50%
51% and over
55%
16%
14%
8%5% 2%
Figure 54: Percent of Episodes Directed by Women,
by Share of Cable Scripted Shows,2014-15 Season (n=188)
10% or less
11% to 20%
21% to 30%
31% to 40%
41% to 50%
51% and over
74%12%
4% 4% 2% 4%
Figure 55: Percent of Episodes Directed by Women,
by Share of Digital Scripted Shows, 2014-15 Season (n=49)
10% or less
11% to 20%
21% to 30%
31% to 40%
41% to 50%
51% and over
39 2017 Hollywood Diversity Report
Summary
Table 2 sum m arizes the var ious film
and television arenas examined for 2014-15
(e.g., lead roles, director, writer, and show
creators) by degree of underrepresentation
for minorities and women (see Appendix). It
shows that across all arenas, for both
minorities and women, pronounced
underrepresentation is still the norm.
Minorities gained a little ground among film
leads, broadcast scripted leads, broadcast
reality and other leads, digital scripted leads,
and broadcast scripted show creators. They
lost ground among film directors, film
writers, cable scripted leads, and digital
scripted show creators. They held their
ground among cable scripted show creators
and cable reality and other leads.
Meanwhile, women posted gains in all areas
except two — broadcast reality and other
leads and cable reality and other leads. Still,
they too remained underrepresented on
every front in 2014-15.
40 Ralph J. Bunche Center for African American Studies at UCLA
Accolades
“The only thing that separates women of
color from anyone else is opportunity. You
cannot win an Emmy for roles that are simply
not there.”
— Viola Davis
During the 2015 Emmy Awards, actress Viola
Davis cogently identified the core challenge
diverse talent face when Hollywood
celebrates its “best and brightest” — their
exclusion from prominent industry projects.
Davis had just become the first black women
in history to receive an Emmy for best
actress in a television drama.
Of course, another challenge diverse talent
face during awards season in Hollywood is
the demographics of the academies them-
selves. Indeed, five months after Davis’s win,
Cheryl Boone Isaacs — the first African
American president of the National Academy
of Motion Picture Arts and Sciences —
pledged during the 2016 Oscars telecast to
diversify the Academy. The Academy
subsequently moved to limit voting on the
Oscars to “active” members in a controver-
sial effort to increase the influence that new,
more diverse cohorts of members might have
in an organization traditionally dominated
by older white men.
As discussed in earlier reports in this series,
these issues matter because the academies’
celebration of excellence each year sets the
standards that define the types of prestige
projects likely to be green-lighted by industry
decision makers. The following headlines
survey the diversity of talent recognized in
film for 2015 and television during the 2014-
15 season. Particular attention is paid to any
changes in the racial and gender distribution
of Oscar and Emmy winners19 since the
previous report.
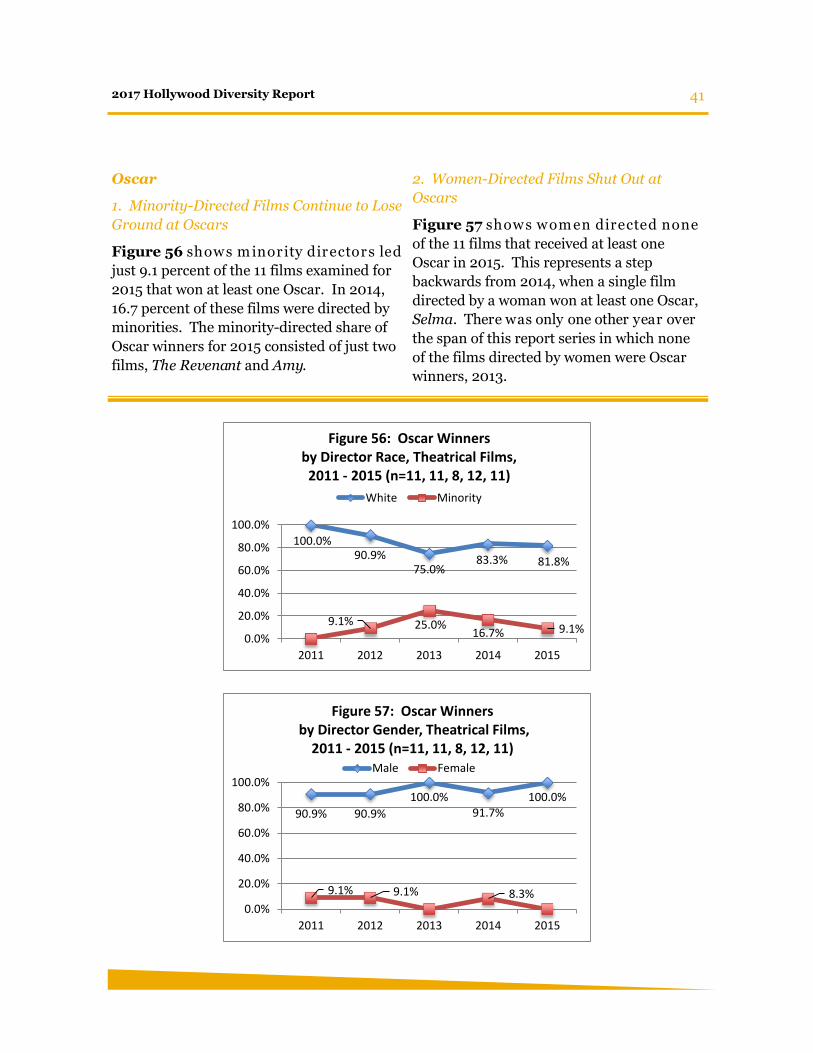
41 2017 Hollywood Diversity Report
Oscar
1. Minority-Directed Films Continue to Lose
Ground at Oscars
Figure 56 show s m inority directors led
just 9.1 percent of the 11 films examined for
2015 that won at least one Oscar. In 2014,
16.7 percent of these films were directed by
minorities. The minority-directed share of
Oscar winners for 2015 consisted of just two
films, The Revenant and Amy.
2. Women-Directed Films Shut Out at
Oscars
Figure 57 show s w om en directed none
of the 11 films that received at least one
Oscar in 2015. This represents a step
backwards from 2014, when a single film
directed by a woman won at least one Oscar,
Selma. There was only one other year over
the span of this report series in which none
of the films directed by women were Oscar
winners, 2013.
100.0%90.9%
75.0%83.3% 81.8%
9.1% 25.0%16.7% 9.1%
0.0%
20.0%
40.0%
60.0%
80.0%
100.0%
2011 2012 2013 2014 2015
Figure 56: Oscar Winners by Director Race, Theatrical Films, 2011 - 2015 (n=11, 11, 8, 12, 11)
White Minority
90.9% 90.9%
100.0%91.7%
100.0%
9.1% 9.1% 8.3%0.0%
20.0%
40.0%
60.0%
80.0%
100.0%
2011 2012 2013 2014 2015
Figure 57: Oscar Winnersby Director Gender, Theatrical Films,
2011 - 2015 (n=11, 11, 8, 12, 11)Male Female
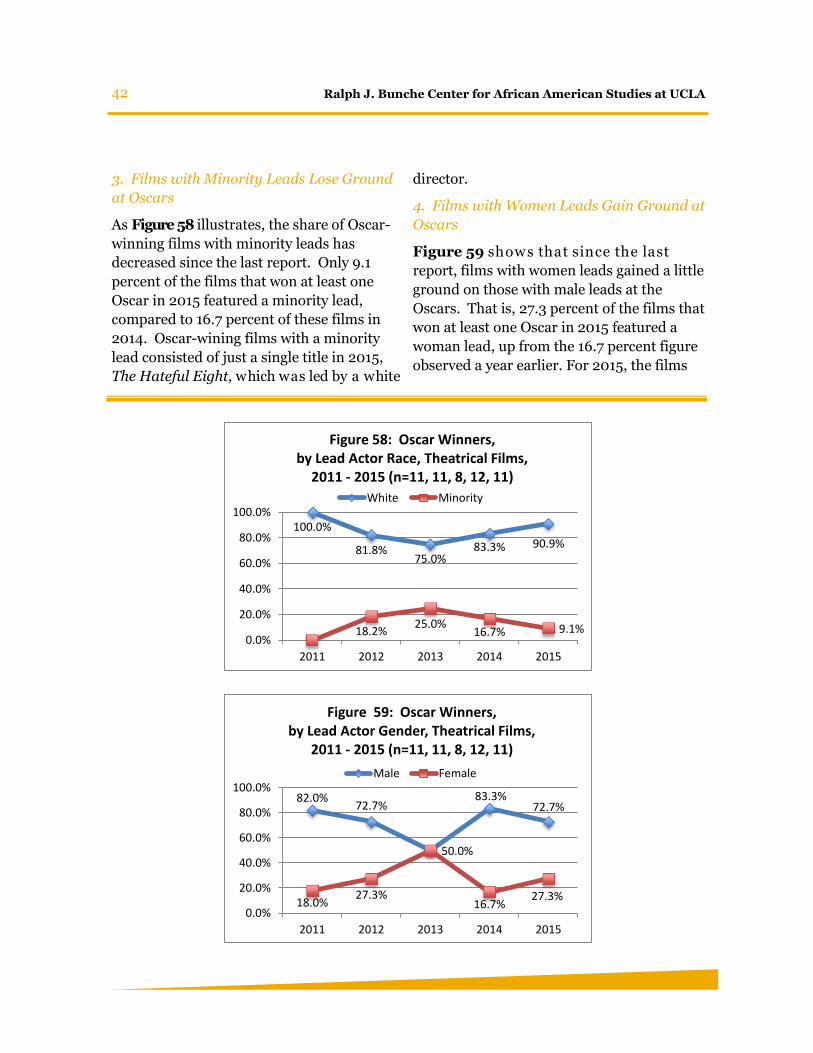
42 Ralph J. Bunche Center for African American Studies at UCLA
3. Films with Minority Leads Lose Ground
at Oscars
As Figure 58 illustrates, the share of Oscar-
winning films with minority leads has
decreased since the last report. Only 9.1
percent of the films that won at least one
Oscar in 2015 featured a minority lead,
compared to 16.7 percent of these films in
2014. Oscar-wining films with a minority
lead consisted of just a single title in 2015,
The Hateful Eight, which was led by a white
director.
4. Films with Women Leads Gain Ground at
Oscars
Figure 59 show s that since the last
report, films with women leads gained a little
ground on those with male leads at the
Oscars. That is, 27.3 percent of the films that
won at least one Oscar in 2015 featured a
woman lead, up from the 16.7 percent figure
observed a year earlier. For 2015, the films
100.0%
81.8%75.0%
83.3% 90.9%
18.2%25.0%
16.7% 9.1%0.0%
20.0%
40.0%
60.0%
80.0%
100.0%
2011 2012 2013 2014 2015
Figure 58: Oscar Winners,by Lead Actor Race, Theatrical Films,
2011 - 2015 (n=11, 11, 8, 12, 11)
White Minority
82.0%72.7%
83.3%72.7%
18.0%27.3%
50.0%
16.7%27.3%
0.0%
20.0%
40.0%
60.0%
80.0%
100.0%
2011 2012 2013 2014 2015
Figure 59: Oscar Winners,by Lead Actor Gender, Theatrical Films,
2011 - 2015 (n=11, 11, 8, 12, 11)
Male Female
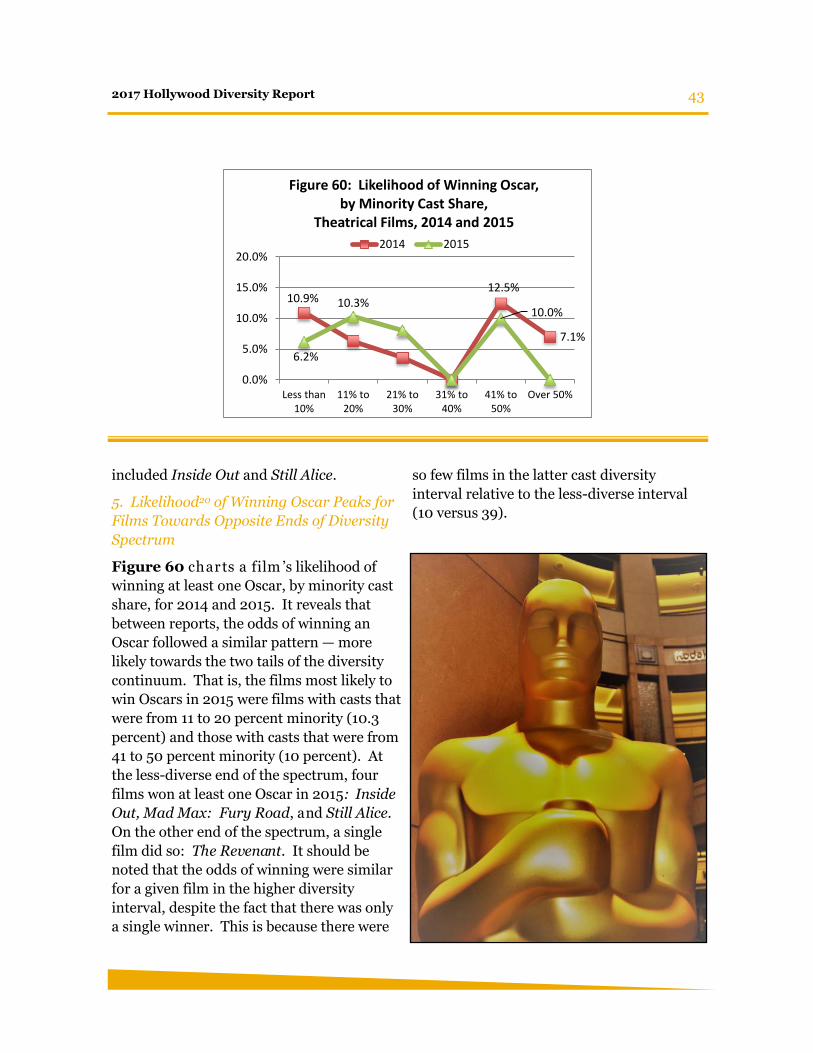
43 2017 Hollywood Diversity Report
included Inside Out and Still Alice.
5. Likelihood20 of Winning Oscar Peaks for
Films Towards Opposite Ends of Diversity
Spectrum
Figure 60 charts a film ’s likelihood of
winning at least one Oscar, by minority cast
share, for 2014 and 2015. It reveals that
between reports, the odds of winning an
Oscar followed a similar pattern — more
likely towards the two tails of the diversity
continuum. That is, the films most likely to
win Oscars in 2015 were films with casts that
were from 11 to 20 percent minority (10.3
percent) and those with casts that were from
41 to 50 percent minority (10 percent). At
the less-diverse end of the spectrum, four
films won at least one Oscar in 2015: Inside
Out, Mad Max: Fury Road, and Still Alice.
On the other end of the spectrum, a single
film did so: The Revenant. It should be
noted that the odds of winning were similar
for a given film in the higher diversity
interval, despite the fact that there was only
a single winner. This is because there were
so few films in the latter cast diversity
interval relative to the less-diverse interval
(10 versus 39).
10.9%12.5%
7.1%
6.2%
10.3%10.0%
0.0%
5.0%
10.0%
15.0%
20.0%
Less than10%
11% to20%
21% to30%
31% to40%
41% to50%
Over 50%
Figure 60: Likelihood of Winning Oscar, by Minority Cast Share,
Theatrical Films, 2014 and 2015
2014 2015
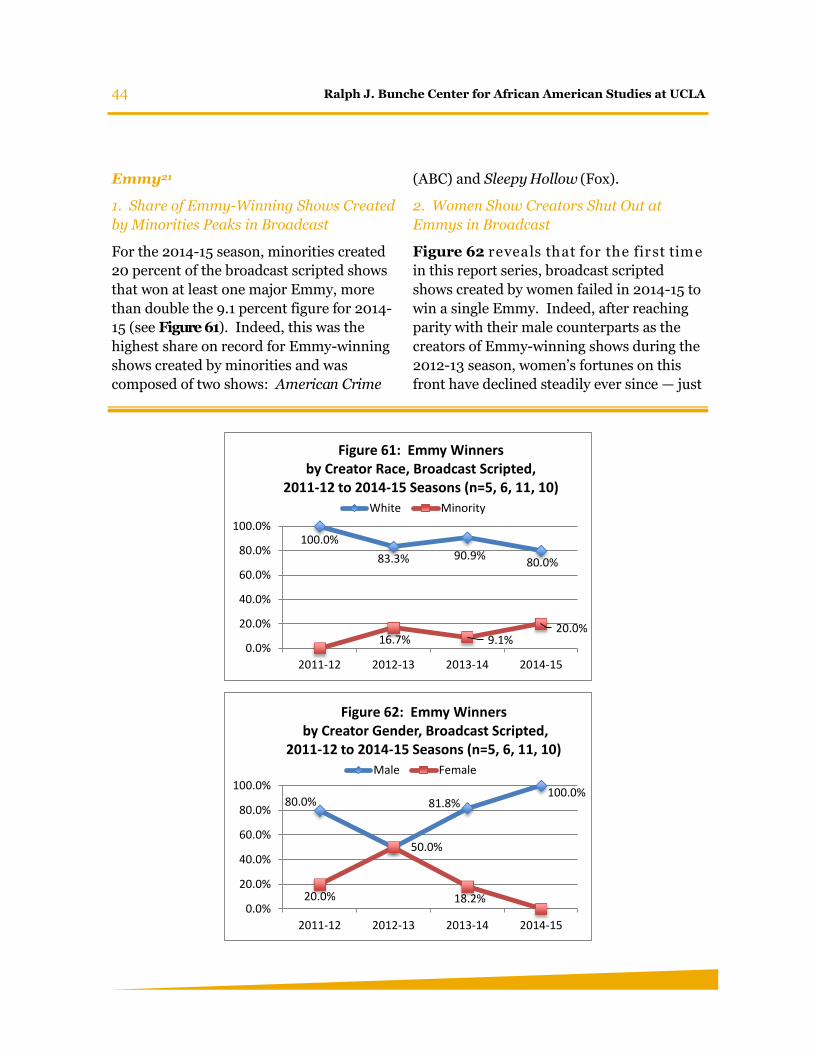
44 Ralph J. Bunche Center for African American Studies at UCLA
Emmy21
1. Share of Emmy-Winning Shows Created
by Minorities Peaks in Broadcast
For the 2014-15 season, minorities created
20 percent of the broadcast scripted shows
that won at least one major Emmy, more
than double the 9.1 percent figure for 2014-
15 (see Figure 61). Indeed, this was the
highest share on record for Emmy-winning
shows created by minorities and was
composed of two shows: American Crime
(ABC) and Sleepy Hollow (Fox).
2. Women Show Creators Shut Out at
Emmys in Broadcast
Figure 62 reveals that for the first time
in this report series, broadcast scripted
shows created by women failed in 2014-15 to
win a single Emmy. Indeed, after reaching
parity with their male counterparts as the
creators of Emmy-winning shows during the
2012-13 season, women’s fortunes on this
front have declined steadily ever since — just
100.0%
83.3% 90.9%80.0%
16.7% 9.1%20.0%
0.0%
20.0%
40.0%
60.0%
80.0%
100.0%
2011-12 2012-13 2013-14 2014-15
Figure 61: Emmy Winners by Creator Race, Broadcast Scripted,
2011-12 to 2014-15 Seasons (n=5, 6, 11, 10)
White Minority
80.0%
50.0%
81.8%100.0%
20.0% 18.2%0.0%
20.0%
40.0%
60.0%
80.0%
100.0%
2011-12 2012-13 2013-14 2014-15
Figure 62: Emmy Winnersby Creator Gender, Broadcast Scripted,
2011-12 to 2014-15 Seasons (n=5, 6, 11, 10)
Male Female
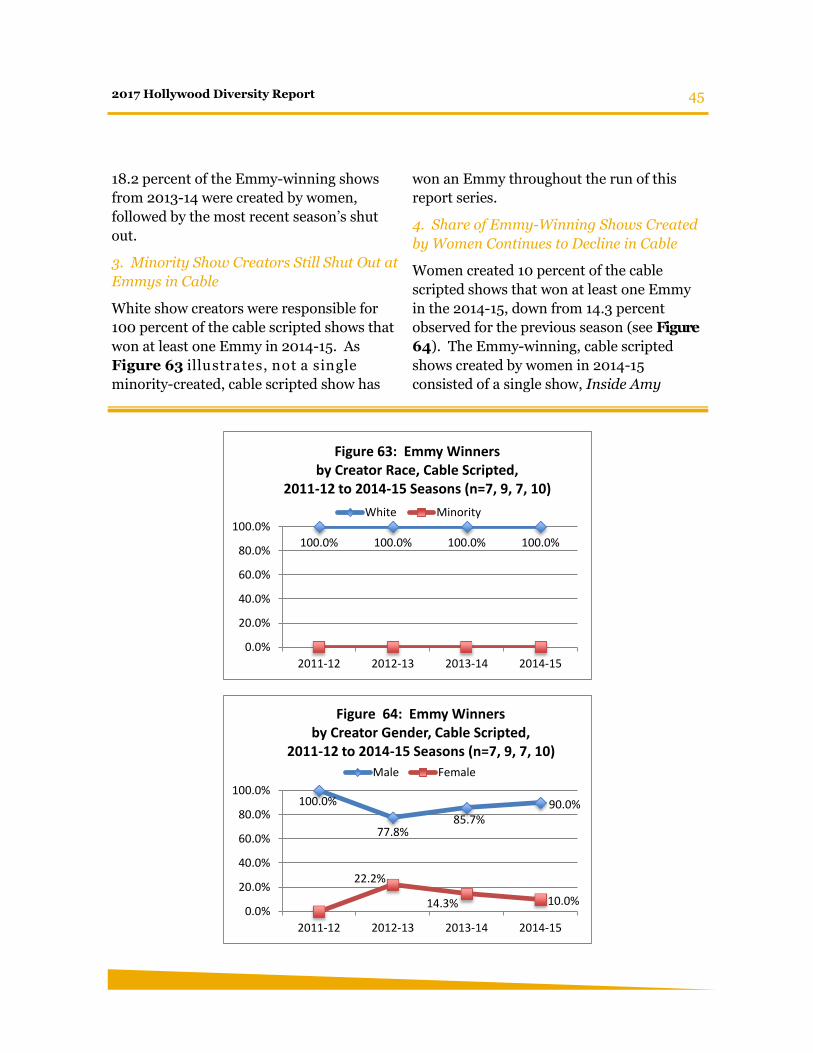
45 2017 Hollywood Diversity Report
18.2 percent of the Emmy-winning shows
from 2013-14 were created by women,
followed by the most recent season’s shut
out.
3. Minority Show Creators Still Shut Out at
Emmys in Cable
White show creators were responsible for
100 percent of the cable scripted shows that
won at least one Emmy in 2014-15. As
Figure 63 illustrates, not a single
minority-created, cable scripted show has
won an Emmy throughout the run of this
report series.
4. Share of Emmy-Winning Shows Created
by Women Continues to Decline in Cable
Women created 10 percent of the cable
scripted shows that won at least one Emmy
in the 2014-15, down from 14.3 percent
observed for the previous season (see Figure
64). The Emmy-winning, cable scripted
shows created by women in 2014-15
consisted of a single show, Inside Amy
100.0% 100.0% 100.0% 100.0%
0.0%
20.0%
40.0%
60.0%
80.0%
100.0%
2011-12 2012-13 2013-14 2014-15
Figure 63: Emmy Winners by Creator Race, Cable Scripted,
2011-12 to 2014-15 Seasons (n=7, 9, 7, 10)
White Minority
100.0%
77.8%85.7%
90.0%
22.2%
14.3% 10.0%0.0%
20.0%
40.0%
60.0%
80.0%
100.0%
2011-12 2012-13 2013-14 2014-15
Figure 64: Emmy Winners by Creator Gender, Cable Scripted,
2011-12 to 2014-15 Seasons (n=7, 9, 7, 10)
Male Female
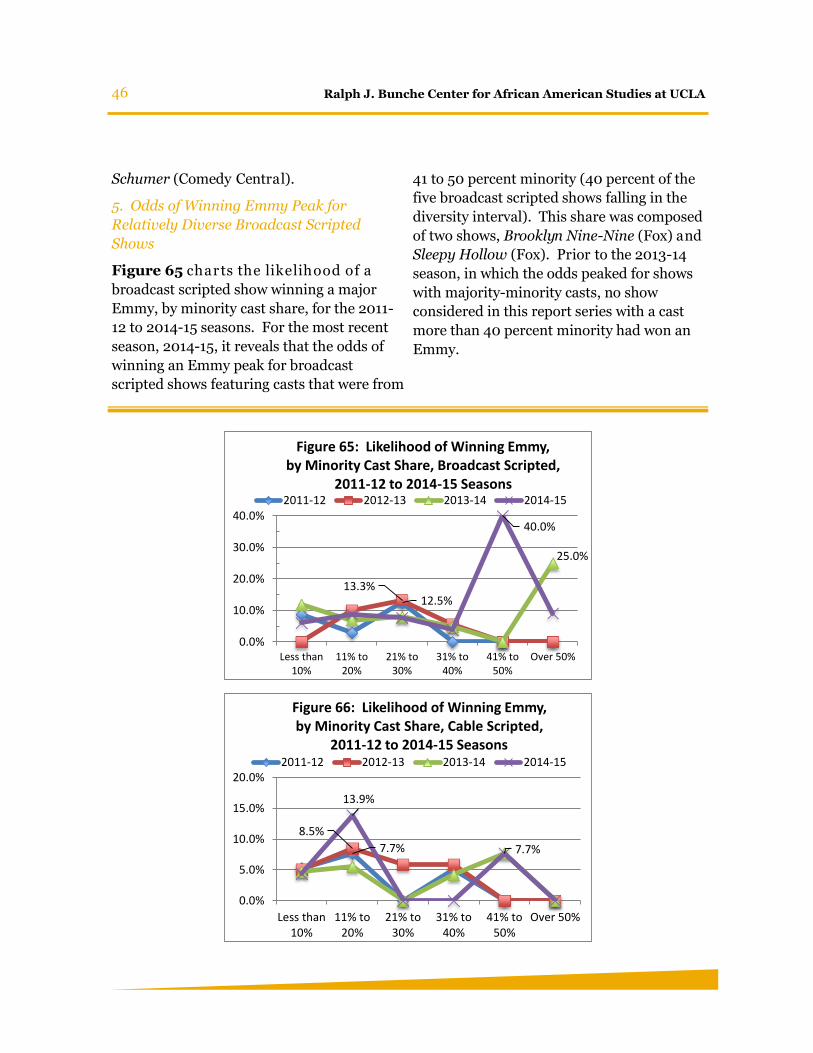
46 Ralph J. Bunche Center for African American Studies at UCLA
Schumer (Comedy Central).
5. Odds of Winning Emmy Peak for
Relatively Diverse Broadcast Scripted
Shows
Figure 65 charts the likelihood of a
broadcast scripted show winning a major
Emmy, by minority cast share, for the 2011-
12 to 2014-15 seasons. For the most recent
season, 2014-15, it reveals that the odds of
winning an Emmy peak for broadcast
scripted shows featuring casts that were from
41 to 50 percent minority (40 percent of the
five broadcast scripted shows falling in the
diversity interval). This share was composed
of two shows, Brooklyn Nine-Nine (Fox) and
Sleepy Hollow (Fox). Prior to the 2013-14
season, in which the odds peaked for shows
with majority-minority casts, no show
considered in this report series with a cast
more than 40 percent minority had won an
Emmy.
12.5%13.3%
25.0%
40.0%
0.0%
10.0%
20.0%
30.0%
40.0%
Less than10%
11% to20%
21% to30%
31% to40%
41% to50%
Over 50%
Figure 65: Likelihood of Winning Emmy, by Minority Cast Share, Broadcast Scripted,
2011-12 to 2014-15 Seasons 2011-12 2012-13 2013-14 2014-15
7.7%
8.5%
7.7%
13.9%
0.0%
5.0%
10.0%
15.0%
20.0%
Less than10%
11% to20%
21% to30%
31% to40%
41% to50%
Over 50%
Figure 66: Likelihood of Winning Emmy, by Minority Cast Share, Cable Scripted,
2011-12 to 2014-15 Seasons2011-12 2012-13 2013-14 2014-15
47 2017 Hollywood Diversity Report
6. Odds of Winning Emmy Peak for Less
Diverse Cable Scripted Shows
Figure 66 charts the likelihood of a
cable scripted show winning a major Emmy,
by minority cast share, for the 2011-12 to
2014-15 seasons. It shows that for the 2014-
15 season, the odds of winning an Emmy
peaked with shows featuring casts that were
from 11 to 20 percent minority (13.9 percent
of the 36 shows falling in this diversity
interval). Emmy winners in this cast
diversity interval included Black Sails
(Starz), Boardwalk Empire (HBO), Silicon
Valley (HBO), The Americans (FX), and
Veep (HBO). A year earlier, it’s worth
noting, the odds of wining an Emmy peaked
with shows that were much more diverse,
from 41 to 50 percent minority (7.7 percent
of these shows). The pattern charted for
2014-15, by contrast, is more similar to that
observed for earlier seasons in this report
series.
48 Ralph J. Bunche Center for African American Studies at UCLA
Gatekeeping
“Although the major talent agencies are
located in Los Angeles, the most diverse city
in the world, they seem largely unaware of
the amazing talent that exists in communi-
ties right under their noses."
— George Takei
As the intermediaries between Hollywood’s
artists and its studios and networks, talent
agencies play a pivotal role in deciding who
can participate in creating the nation’s media
landscape. Over the decades, this influence
has been increasingly concentrated within a
few major agencies, which now dominate the
lion’s share of credited talent in film and
television. At the same time, these dominant
agencies have become increasingly corpora-
tized, making for a business environment
that is principally focused on expanding
sources of revenue through mergers and
acquisitions and the entrance of private
equity firms.
Today’s corporatized agencies represent
entertainers on a global scale, as well as
athletes, former politicians, and social media
personalities. They also market their
expertise in brand management, live-event
management, and corporate hospitality with
companies far-flung from the traditional
entertainment industry.
But in today’s multifaceted business of talent
representation, unfortunately, the expansion
and diversification of business practices at
the dominant agencies has yet to coincide
with a diversification of their talent rosters
or corps of agents, as previous reports in this
series have shown. If growth and business
diversification are central goals of the
present-day agency, then the economic
benefits associated with diverse talent should
be a top priority.
The following headlines update our
understanding of the relationships between
agency representation and credited talent
diversity in film and television for 2014-
2015.
Film
1. Dominant Talent Agencies Increase
Share of Film Directors
The directors of the top films examined for
2015 were represented by a collection of 11
different talent agencies. But as noted in the
previous reports in this series, three of these
agencies claimed on their rosters the lion’s
share of credited film directors. As Figure 67
shows, the dominant agencies represented
88.8 percent of the directors from the 152
top films examined in 2015, up more than
ten percentage points over their 2014 share
(78.6 percent).
2. Minorities Underrepresented by Factor of
More than 3 to 1 among Film Directors at
Dominant Talent Agencies
Figure 68 compares the m inority
shares of film directors at the dominant and
remaining talent agencies between 2011 and
2015. In 2014, 135 of the top films examined
that year featured directors who were on the
rosters of the three dominant firms, and 14
of these directors were minorities (10.4
percent). The minority share of directors on
the dominant agency rosters had stood at 14
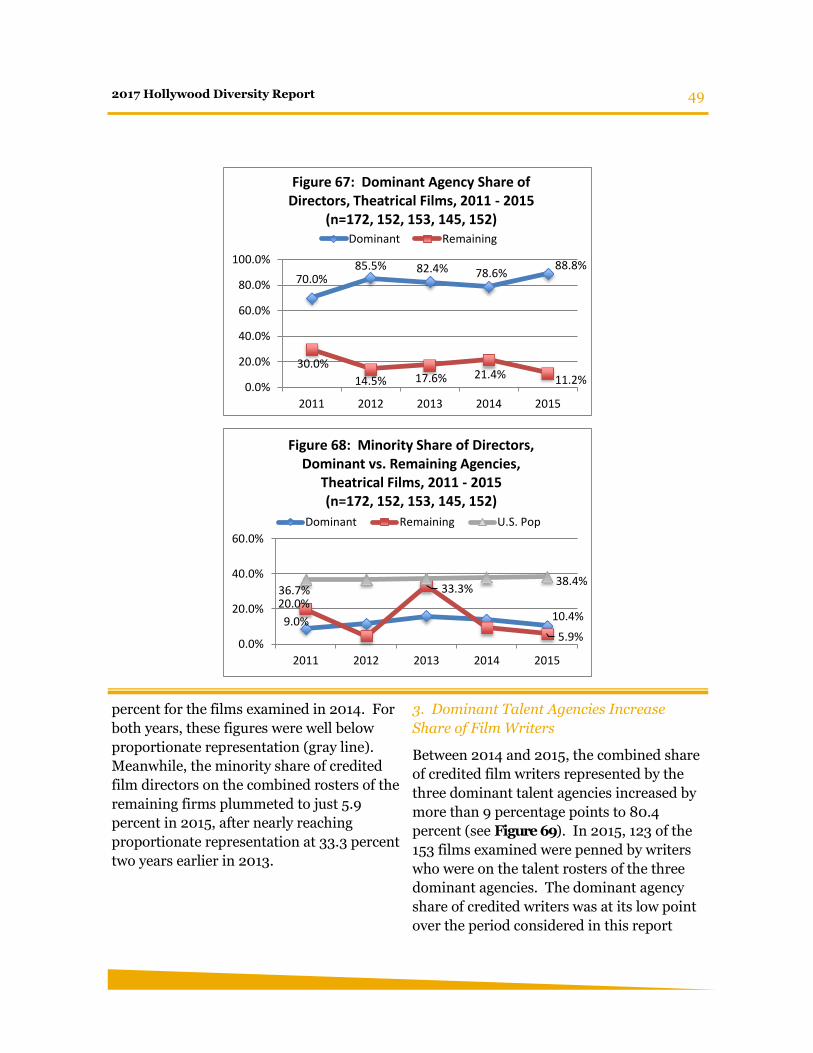
49 2017 Hollywood Diversity Report
percent for the films examined in 2014. For
both years, these figures were well below
proportionate representation (gray line).
Meanwhile, the minority share of credited
film directors on the combined rosters of the
remaining firms plummeted to just 5.9
percent in 2015, after nearly reaching
proportionate representation at 33.3 percent
two years earlier in 2013.
3. Dominant Talent Agencies Increase
Share of Film Writers
Between 2014 and 2015, the combined share
of credited film writers represented by the
three dominant talent agencies increased by
more than 9 percentage points to 80.4
percent (see Figure 69). In 2015, 123 of the
153 films examined were penned by writers
who were on the talent rosters of the three
dominant agencies. The dominant agency
share of credited writers was at its low point
over the period considered in this report
70.0%85.5% 82.4% 78.6%
88.8%
30.0%
14.5% 17.6% 21.4% 11.2%0.0%
20.0%
40.0%
60.0%
80.0%
100.0%
2011 2012 2013 2014 2015
Figure 67: Dominant Agency Share of Directors, Theatrical Films, 2011 - 2015
(n=172, 152, 153, 145, 152)Dominant Remaining
9.0% 10.4%20.0%
33.3%
5.9%
36.7%38.4%
0.0%
20.0%
40.0%
60.0%
2011 2012 2013 2014 2015
Figure 68: Minority Share of Directors, Dominant vs. Remaining Agencies,
Theatrical Films, 2011 - 2015(n=172, 152, 153, 145, 152)
Dominant Remaining U.S. Pop

50 Ralph J. Bunche Center for African American Studies at UCLA
series in 2011, when it stood at just 65.1
percent. Since then, the trend has been
toward increasing consolidation by the
dominant agencies.
4. Minority Film Writers Remain Un-
derrepresented at Both Dominant and
Remaining Talent Agencies
Figure 70 com pares the m inority share
of film writers for the dominant and
remaining talent agencies between 2011 and
2015. It reveals that the minority share of
film writers represented by the dominant
agencies increased slightly between 2014 and
2015 — from the 5.1 percent figure noted in
the previous report, to 6.5 percent in 2015 (8
of 123 writers). Meanwhile, the minority
share of credited writers for the remaining
firms in 2015 plummeted to zero, after
peaking at 10.5 percent in 2011. Throughout
the run of this report series, neither
dominant nor remaining agencies ap-
proached anything close to proportionate
representation with their rosters of credited
65.1%74.8% 76.3% 71.0%
80.4%
34.9%25.2% 23.7% 29.0% 19.6%
0.0%
20.0%
40.0%
60.0%
80.0%
100.0%
2011 2012 2013 2014 2015
Figure 69: Dominant Agency Share of Writers, Theatrical Films, 2011 - 2015
(n=172, 151, 152, 138, 153)
Dominant Remaining
6.3% 6.5%
10.5%
36.7%38.4%
0.0%
20.0%
40.0%
60.0%
2011 2012 2013 2014 2015
Figure 70: Minority Share of Writers, Dominant vs. Remaining Agencies,
Theatrical Films, 2011 - 2015 (n=172, 151, 152, 138, 153)
Dominant Remaining U.S. Pop

51 2017 Hollywood Diversity Report
minority film writers (gray line).
5. Dominant Talent Agencies’ Share of Film
Leads Increases
Figure 71 show s that the dom inant
talent agencies represented 84.4 percent of
the credited leads in the 160 top films
examined for 2015. This share represents a 3
percentage-point increase over the 81.2
percent share the dominant agencies posted
in 2014. Though dominant agencies’ share
of leads peaked in 2013, the overall trend
charted in Figure 71 is one of increasing
concentration on this front.
6. Minorities Underrepresented by Factor
of More than 3 to 1 among Film Leads at
Dominant Talent Agencies
Figure 72 com pares the m inority share
of film leads for the dominant and remaining
talent agencies between 2011 and 2015. In
2015, the minority share of the film leads
represented by the three dominant talent
agencies was 11.1 percent (15 of 135 leads),
72.1%79.9%
89.1%
81.2%
84.4%
27.9%21.1%
10.9% 18.8% 15.6%0.0%
20.0%
40.0%
60.0%
80.0%
100.0%
2011 2012 2013 2014 2015
Figure 71: Dominant Agency Share of Leads, Theatrical Films, 2011 - 2015 (n=172, 159, 165, 154, 160)
Dominant Remaining
7.3%11.1%
18.8%
50.0%
24.0%36.7%
38.4%
0.0%
20.0%
40.0%
60.0%
2011 2012 2013 2014 2015
Figure 72: Minority Share of Leads, Dominant vs. Remaining Agencies,
Theatrical Films, 2011 - 2015 (n=172, 159, 165, 154, 160)
Dominant Remaining U.S. Pop
52 Ralph J. Bunche Center for African American Studies at UCLA
up slightly from the 9.6 percent figure
observed a year earlier. This figure corre-
sponds to underrepresentation by a factor of
more than 3 to 1 (gray line). By contrast, 24
percent of the credited leads represented by
the remaining agencies in 2015 were
minorities (6 of 25 leads).
Television
1. Dominant Talent Agency Share of Show
Creators Continues to Rise in Broadcast
The creators of the 116 broadcast scripted
shows examined for the 2014-15 season were
represented by a collection of nine talent
agencies. The same three agencies that
dominated talent representation in film also
did so in television. Collectively, these three
agencies claimed on their talent rosters 85.5
percent of the show creators that season (98
of 116 show creators), which exceeded their
combined 80 percent share noted in the
previous report for the 2013-14 season (see
Figure 73). As the graph clear ly
shows, the three dominant agencies have
increased their share of these important
decision makers in every year over the run of
this report series.
2. Minority Show Creators in Broadcast
Underrepresented by Factor of Nearly 5 to 1
at Dominant Talent Agencies
Figure 74 reveals that the m inority
share of the creators of broadcast scripted
shows represented by the three dominant
agencies has increased since the previous
report, from just 2.4 percent for the 2013-14
season to 8.2 percent in 2014-15 (8 of 98
show creators). As a result, minorities were
underrepresented by a factor of nearly 5 to 1
among the ranks of broadcast show creators
at the dominant agencies that season (gray
line). Meanwhile, the minority share of the
show creators represented by the remaining
talent agencies also increased between the
seasons, from 9.5 percent of the show
creators on their rosters in 2013-14 to 11.1
percent in 2014-15 (2 of 18 show creators).
3. Dominant Talent Agencies Represent
Two-Thirds of Leads in Broadcast
Fourteen talent agencies represented the
lead talent credited on broadcast scripted
shows examined for the 2014-15 season.
Figure 75 show s the share of leads
represented by the three dominant talent
agencies was 65 percent in 2014-15 (76 of 117
leads). The dominant agency share had stood
at 63.4 percent in 2013-14, which was well
below the peak share of 69.2 percent in 2012
-13 but significantly higher than the 2011-12
figure of 55.6 percent.
4. Minority Leads in Broadcast Un-
derrepresented by Factor of More than 2 to
1 at Dominant Talent Agencies
Figure 76 show s that 15.8 percent of
the broadcast scripted leads represented by
the dominant agencies were minorities in
2014-15 (12 of 76 leads), up from the 9.9
percent figure observed a season earlier. By
contrast, the share of minority broadcast
scripted leads on the rosters of the remaining
firms has been cut in half since the last
report, from 9.9 percent in 2013-14 to 4.9
percent in 2014-15 (just 2 of 41 leads).
Despite the gains for minority leads at the
dominant agencies since the last report,
minorities remained well below proportion-
ate representation among leads at both the
dominant and remaining agencies in 2014-15
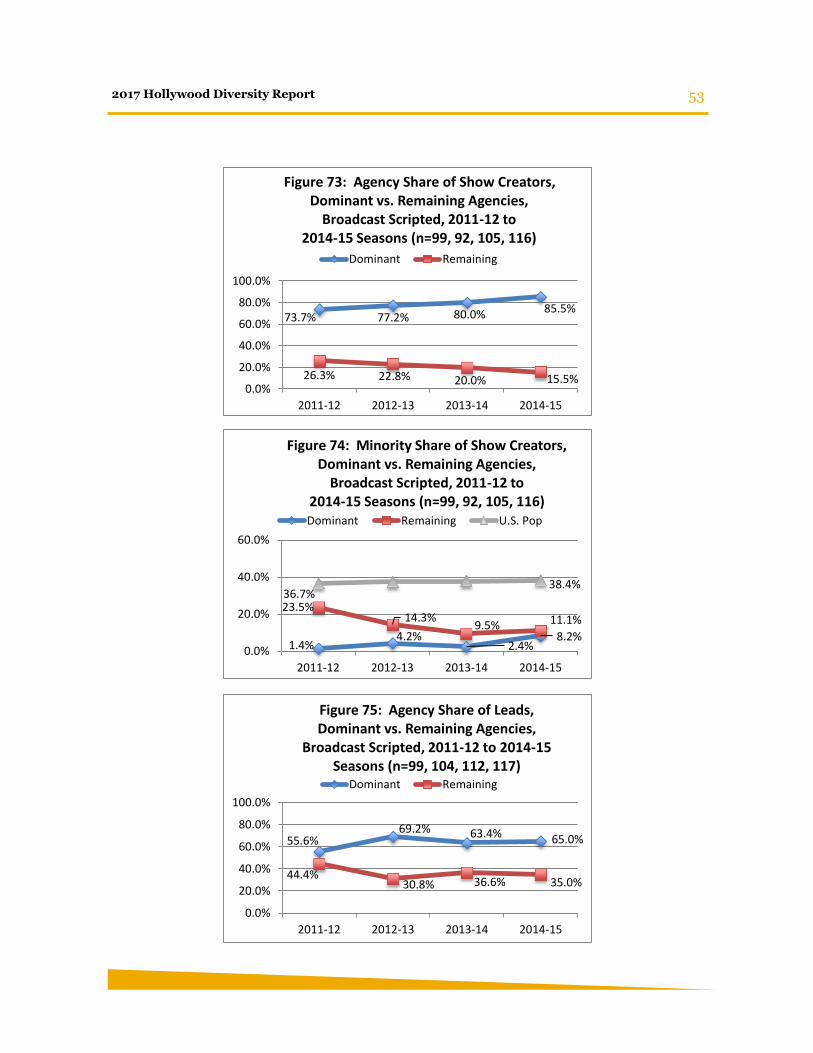
53 2017 Hollywood Diversity Report
73.7% 77.2% 80.0% 85.5%
26.3% 22.8% 20.0% 15.5%0.0%
20.0%
40.0%
60.0%
80.0%
100.0%
2011-12 2012-13 2013-14 2014-15
Figure 73: Agency Share of Show Creators, Dominant vs. Remaining Agencies,
Broadcast Scripted, 2011-12 to 2014-15 Seasons (n=99, 92, 105, 116)
Dominant Remaining
1.4%4.2%
2.4%8.2%
23.5%14.3%
9.5% 11.1%
36.7%38.4%
0.0%
20.0%
40.0%
60.0%
2011-12 2012-13 2013-14 2014-15
Figure 74: Minority Share of Show Creators, Dominant vs. Remaining Agencies,
Broadcast Scripted, 2011-12 to 2014-15 Seasons (n=99, 92, 105, 116)Dominant Remaining U.S. Pop
55.6%69.2% 63.4% 65.0%
44.4%30.8% 36.6% 35.0%
0.0%
20.0%
40.0%
60.0%
80.0%
100.0%
2011-12 2012-13 2013-14 2014-15
Figure 75: Agency Share of Leads,Dominant vs. Remaining Agencies,
Broadcast Scripted, 2011-12 to 2014-15 Seasons (n=99, 104, 112, 117)
Dominant Remaining
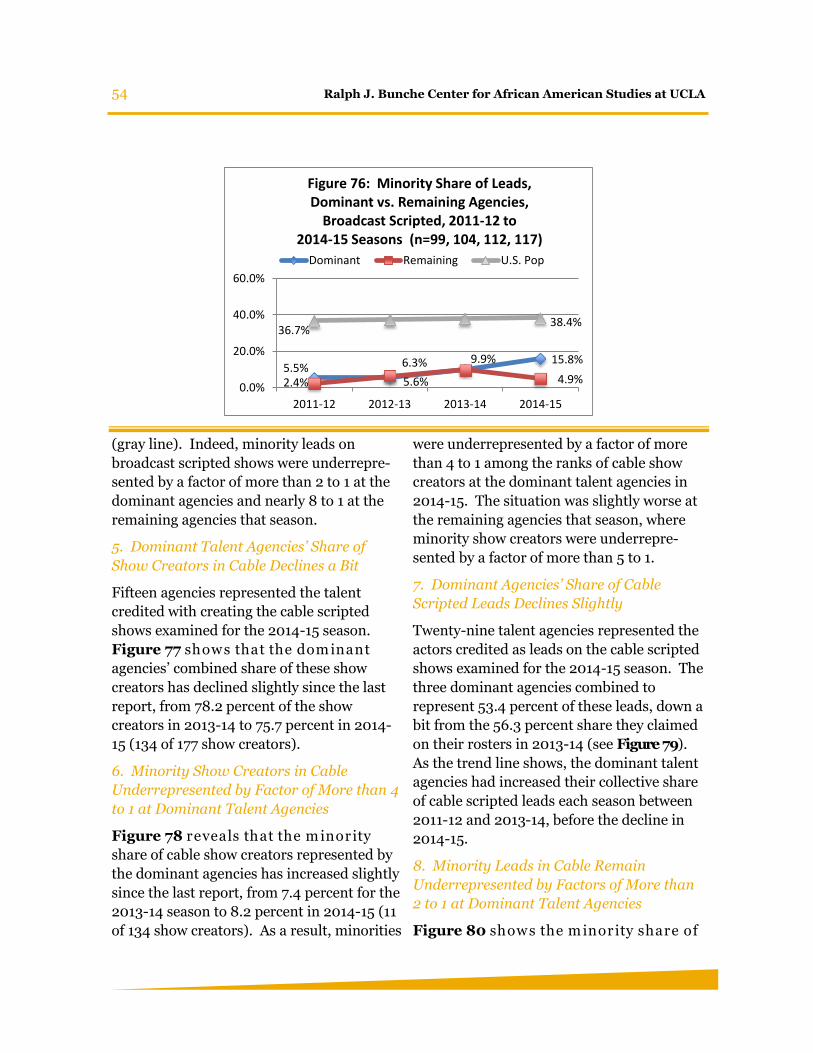
54 Ralph J. Bunche Center for African American Studies at UCLA
(gray line). Indeed, minority leads on
broadcast scripted shows were underrepre-
sented by a factor of more than 2 to 1 at the
dominant agencies and nearly 8 to 1 at the
remaining agencies that season.
5. Dominant Talent Agencies’ Share of
Show Creators in Cable Declines a Bit
Fifteen agencies represented the talent
credited with creating the cable scripted
shows examined for the 2014-15 season.
Figure 77 show s that the dom inant
agencies’ combined share of these show
creators has declined slightly since the last
report, from 78.2 percent of the show
creators in 2013-14 to 75.7 percent in 2014-
15 (134 of 177 show creators).
6. Minority Show Creators in Cable
Underrepresented by Factor of More than 4
to 1 at Dominant Talent Agencies
Figure 78 reveals that the m inority
share of cable show creators represented by
the dominant agencies has increased slightly
since the last report, from 7.4 percent for the
2013-14 season to 8.2 percent in 2014-15 (11
of 134 show creators). As a result, minorities
were underrepresented by a factor of more
than 4 to 1 among the ranks of cable show
creators at the dominant talent agencies in
2014-15. The situation was slightly worse at
the remaining agencies that season, where
minority show creators were underrepre-
sented by a factor of more than 5 to 1.
7. Dominant Agencies’ Share of Cable
Scripted Leads Declines Slightly
Twenty-nine talent agencies represented the
actors credited as leads on the cable scripted
shows examined for the 2014-15 season. The
three dominant agencies combined to
represent 53.4 percent of these leads, down a
bit from the 56.3 percent share they claimed
on their rosters in 2013-14 (see Figure 79).
As the trend line shows, the dominant talent
agencies had increased their collective share
of cable scripted leads each season between
2011-12 and 2013-14, before the decline in
2014-15.
8. Minority Leads in Cable Remain
Underrepresented by Factors of More than
2 to 1 at Dominant Talent Agencies
Figure 80 show s the m inority share of
5.5%5.6%
9.9% 15.8%
2.4%
6.3%
4.9%
36.7%38.4%
0.0%
20.0%
40.0%
60.0%
2011-12 2012-13 2013-14 2014-15
Figure 76: Minority Share of Leads, Dominant vs. Remaining Agencies,
Broadcast Scripted, 2011-12 to 2014-15 Seasons (n=99, 104, 112, 117)
Dominant Remaining U.S. Pop
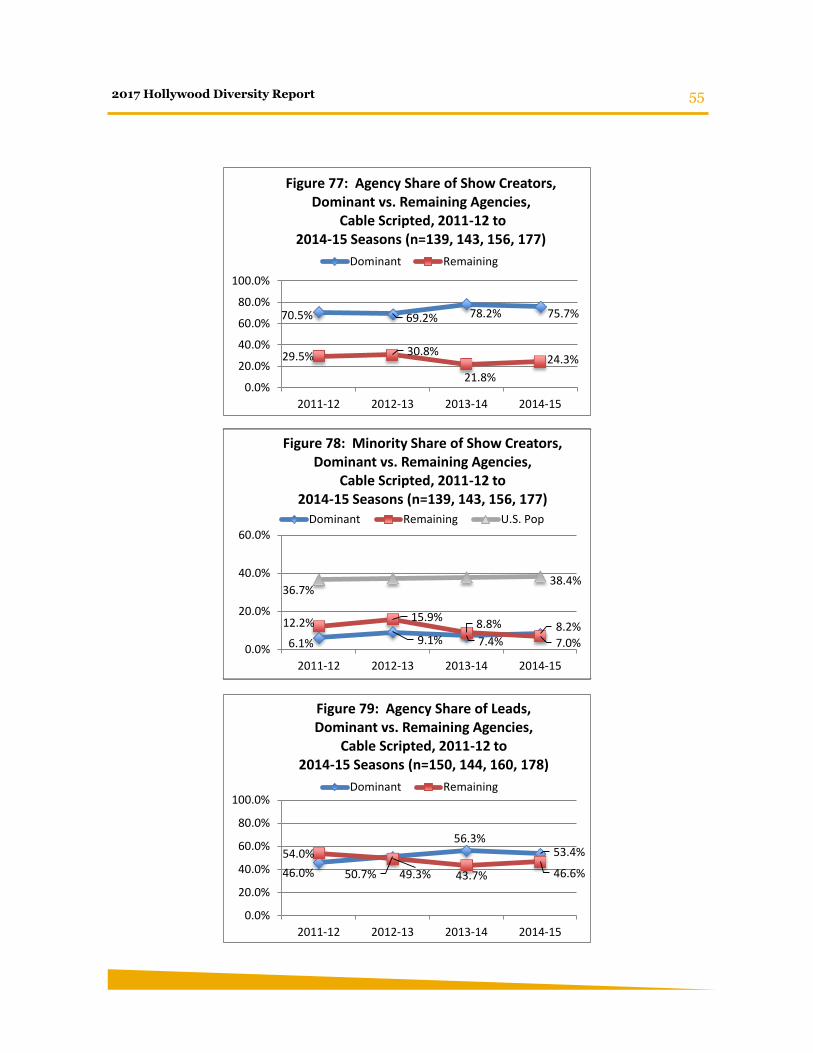
55 2017 Hollywood Diversity Report
70.5% 69.2% 78.2% 75.7%
29.5% 30.8%
21.8%
24.3%
0.0%
20.0%
40.0%
60.0%
80.0%
100.0%
2011-12 2012-13 2013-14 2014-15
Figure 77: Agency Share of Show Creators,Dominant vs. Remaining Agencies,
Cable Scripted, 2011-12 to 2014-15 Seasons (n=139, 143, 156, 177)
Dominant Remaining
6.1% 9.1% 7.4%8.2%12.2% 15.9%
8.8%
7.0%
36.7%38.4%
0.0%
20.0%
40.0%
60.0%
2011-12 2012-13 2013-14 2014-15
Figure 78: Minority Share of Show Creators, Dominant vs. Remaining Agencies,
Cable Scripted, 2011-12 to 2014-15 Seasons (n=139, 143, 156, 177)
Dominant Remaining U.S. Pop
46.0% 50.7%
56.3%53.4%54.0%
49.3% 43.7% 46.6%
0.0%
20.0%
40.0%
60.0%
80.0%
100.0%
2011-12 2012-13 2013-14 2014-15
Figure 79: Agency Share of Leads, Dominant vs. Remaining Agencies,
Cable Scripted, 2011-12 to 2014-15 Seasons (n=150, 144, 160, 178)
Dominant Remaining
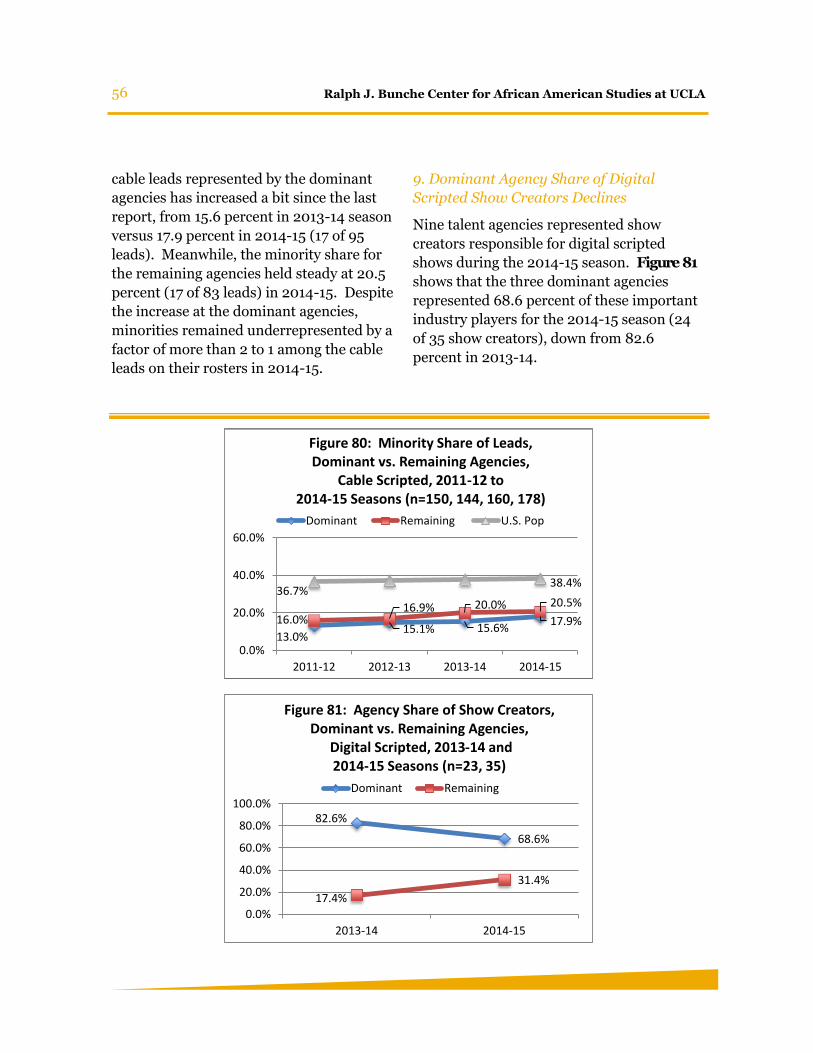
56 Ralph J. Bunche Center for African American Studies at UCLA
cable leads represented by the dominant
agencies has increased a bit since the last
report, from 15.6 percent in 2013-14 season
versus 17.9 percent in 2014-15 (17 of 95
leads). Meanwhile, the minority share for
the remaining agencies held steady at 20.5
percent (17 of 83 leads) in 2014-15. Despite
the increase at the dominant agencies,
minorities remained underrepresented by a
factor of more than 2 to 1 among the cable
leads on their rosters in 2014-15.
9. Dominant Agency Share of Digital
Scripted Show Creators Declines
Nine talent agencies represented show
creators responsible for digital scripted
shows during the 2014-15 season. Figure 81
shows that the three dominant agencies
represented 68.6 percent of these important
industry players for the 2014-15 season (24
of 35 show creators), down from 82.6
percent in 2013-14.
13.0%15.1% 15.6%
17.9%16.0%16.9% 20.0% 20.5%
36.7%38.4%
0.0%
20.0%
40.0%
60.0%
2011-12 2012-13 2013-14 2014-15
Figure 80: Minority Share of Leads, Dominant vs. Remaining Agencies,
Cable Scripted, 2011-12 to 2014-15 Seasons (n=150, 144, 160, 178)
Dominant Remaining U.S. Pop
82.6%
68.6%
17.4%
31.4%
0.0%
20.0%
40.0%
60.0%
80.0%
100.0%
2013-14 2014-15
Figure 81: Agency Share of Show Creators,Dominant vs. Remaining Agencies,
Digital Scripted, 2013-14 and 2014-15 Seasons (n=23, 35)
Dominant Remaining
57 2017 Hollywood Diversity Report
10. Minorities Underrepresented by Factor
of 9 to 1 among Digital Scripted Show
Creators at Dominant Agencies
Figure 82 presents the m inority shares
of digital show creators represented by the
dominant and remaining talent agencies for
the 2013-14 and 2014-15 seasons. While the
remaining agencies had no credited minority
show creators on their rosters either season,
only 4.2 percent of the show creators
represented by the dominant agencies were
minorities (1 of 24 show creators) in 2014-15.
As a result, minorities were underrepresent-
ed among the ranks of credited show
creators at the dominant agencies by a factor
about 9 to 1 that season.
11. Dominant Agencies Represent Nearly 60
Percent of Digital Scripted Leads
Fourteen talent agencies represented the
actors credited as leads on the cable scripted
shows examined for the 2014-15 season.
Figure 83 show s that the three
dominant agencies combined to represent
59.1 percent of these leads (26 of 44 leads),
down slightly from the 63 percent share
these agencies claimed a season earlier.
12. Minorities Underrepresented by Factor
of Nearly 5 to 1 among Digital Scripted
Leads at Dominant Agencies
Figure 84 presents the m inority shares
of digital scripted leads represented by the
dominant and remaining talent agencies for
the 2013-14 and 2014-15 seasons. Only 7.7
percent of the credited leads on the talent
rosters of the dominant agencies that season
were minorities (2 of 26 leads), up slightly
from the 5.9 share from a season earlier.
Minorities fared better on the rosters of the
remaining firms in 2014-15, accounting for
22.2 percent of credited leads. Minorities
were thus underrepresented by a factor of
about 5 to 1 among the ranks of digital
scripted leads at the dominant agencies for
the 2014-15 season, and by a factor of less
than 2 to 1 at the remaining agencies.
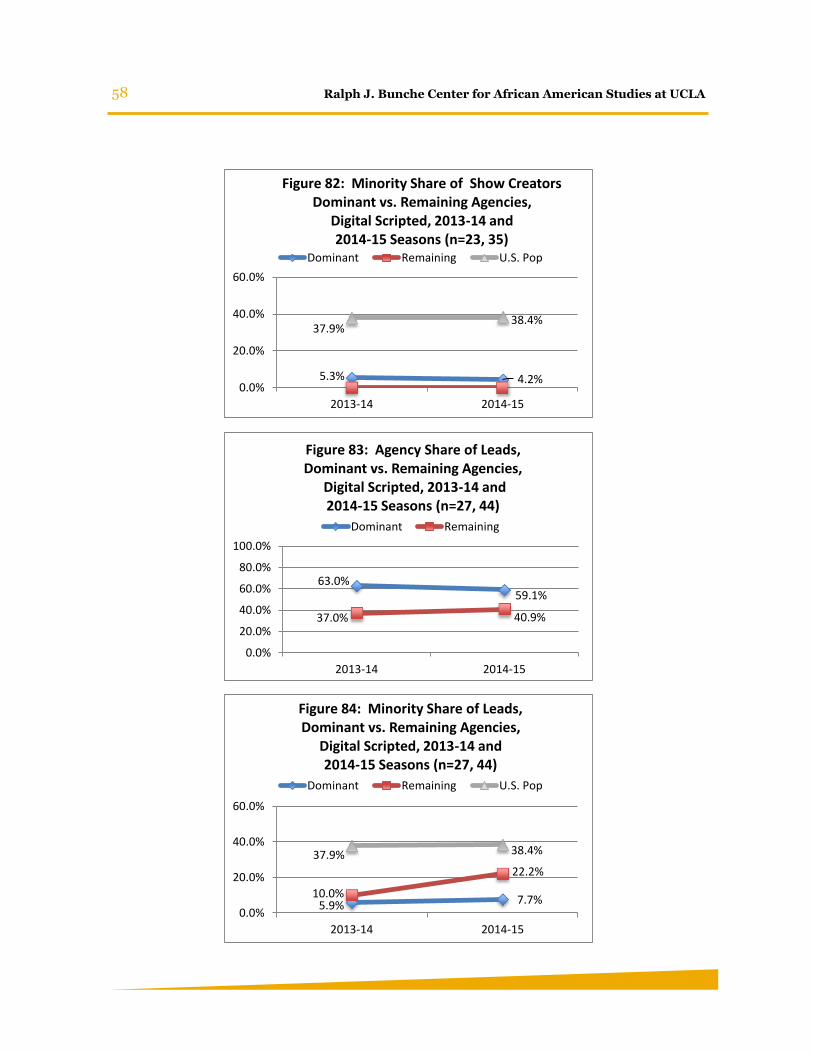
58 Ralph J. Bunche Center for African American Studies at UCLA
5.3% 4.2%
37.9%38.4%
0.0%
20.0%
40.0%
60.0%
2013-14 2014-15
Figure 82: Minority Share of Show Creators Dominant vs. Remaining Agencies,
Digital Scripted, 2013-14 and2014-15 Seasons (n=23, 35)
Dominant Remaining U.S. Pop
63.0%59.1%
37.0% 40.9%
0.0%
20.0%
40.0%
60.0%
80.0%
100.0%
2013-14 2014-15
Figure 83: Agency Share of Leads,Dominant vs. Remaining Agencies,
Digital Scripted, 2013-14 and 2014-15 Seasons (n=27, 44)
Dominant Remaining
5.9% 7.7%10.0%
22.2%
37.9% 38.4%
0.0%
20.0%
40.0%
60.0%
2013-14 2014-15
Figure 84: Minority Share of Leads, Dominant vs. Remaining Agencies,
Digital Scripted, 2013-14 and2014-15 Seasons (n=27, 44)
Dominant Remaining U.S. Pop
59 2017 Hollywood Diversity Report
Diversity Initiatives
“It is time to be clear — structural changes
are needed. Those who control the pipeline
and entryway to jobs must move beyond the
‘old boy’ network and word-of-mouth hiring.”
— Paris Barclay
In response to pressure from a coalition of
media and social justice organizations at the
close of the 1990s, major television networks
and studios created an array of diversity
initiatives aimed at addressing the systemat-
ic exclusion of people of color and women in
the television and film industries.22 In recent
years, independent media organizations have
joined efforts in creating talent development
programs designed to eliminate entrance
barriers and financial obstacles for appli-
cants from underrepresented groups. These
initiatives often work in partnership with
historically black colleges and universities
(HBCUs) and minority associations to
identify and reach out to diverse talent.
Access to diversity programs is highly
competitive, with only a handful of appli-
cants typically selected from thousands of
submissions. Some film initiatives provide
grants that assist with project completion,
while some television programs offer entry-
level salaried staffing positions that are fully
subsidized by networks. Others are unpaid
apprenticeships, accompanied by mentoring,
intensive courses, and seminars. Most
programs do not guarantee employment post
tenure but are nonetheless highly sought
after for the invaluable networking opportu-
nities they provide with studio executives,
showrunners, and other industry decision
makers.
Table 3a provides a breakdow n of
major diversity initiatives operating in the
film and television sectors. (A complete list
of the programs considered is presented in
Table 3b in the Appendix.) Our data
suggest that the most prevalent form of
diversity initiative in the film and television
sectors are writers’ programs, 25 percent and
39 percent of the totals, respectively. Grant
programs assisting filmmakers to manage
the financial costs associated with film
production are also prominent in the film
sector (25 percent of initiatives). The
remaining initiatives are dispersed among
various types of industry programs, with the
fewest aimed at actors, production assis-
tantships, and executive leadership
programs.
Critics of existing diversity initiatives have
underscored the limitations of these
programs — namely perceptions that the
diversity hires they produce are less
qualified,23 the alienation and tokenization
diversity hires face in white-dominated
workplace cultures and, most importantly,
the failure of such initiatives thus far to
significantly impact the abysmal industry
inclusion statistics presented earlier in this
report.24
Nonetheless, longstanding industry diversity
initiatives have undoubtedly made a
difference in that industry shortcomings on
the diversity front would have been much
more pronounced without them. But if the
goal is to actually make significant progress
on the industry diversity front, a major shift
in thinking is required that resets the
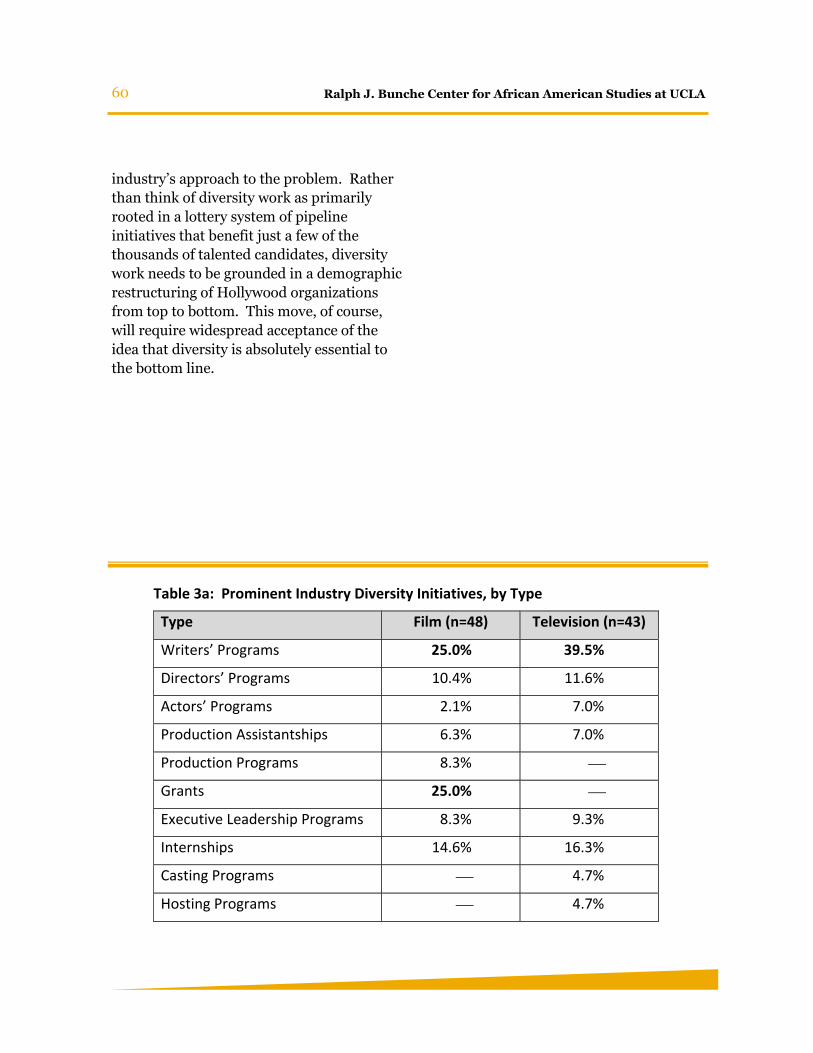
60 Ralph J. Bunche Center for African American Studies at UCLA
industry’s approach to the problem. Rather
than think of diversity work as primarily
rooted in a lottery system of pipeline
initiatives that benefit just a few of the
thousands of talented candidates, diversity
work needs to be grounded in a demographic
restructuring of Hollywood organizations
from top to bottom. This move, of course,
will require widespread acceptance of the
idea that diversity is absolutely essential to
the bottom line.
Table 3a: Prominent Industry Diversity Initiatives, by Type
Type Film (n=48) Television (n=43)
Writers’ Programs 25.0% 39.5%
Directors’ Programs 10.4% 11.6%
Actors’ Programs 2.1% 7.0%
Production Assistantships 6.3% 7.0%
Production Programs 8.3%
Grants 25.0%
Executive Leadership Programs 8.3% 9.3%
Internships 14.6% 16.3%
Casting Programs 4.7%
Hosting Programs 4.7%
61 2017 Hollywood Diversity Report
Diversity and the Bottom
Line: Casting, Box Office, and
Ratings
“I was determined the lead [for a film] would
be a black woman, and I remember the
executive saying, ‘Why does she have to be
black?’ And me saying: ‘She doesn’t have to
be; I want her to be black. Why would you
not consider it?’”
— John Ridley
In the previous three reports in this series, a
consideration of overall cast diversity in
theatrical releases and television shows has
consistently revealed a curious disconnect
between Hollywood industry production
choices and market realities. That is, the
industry produces an inordinate number of
low-performing films and television shows
year in and year out that are not very diverse,
while the films and television shows that
actually perform best, on average, better
reflect the diversity of America.
The current report extends the analysis of
the relationships between overall cast
diversity and bottom-line performance an
additional year in order to consider the top
200 theatrical films released in 2015 and the
television shows airing during the 2014-15
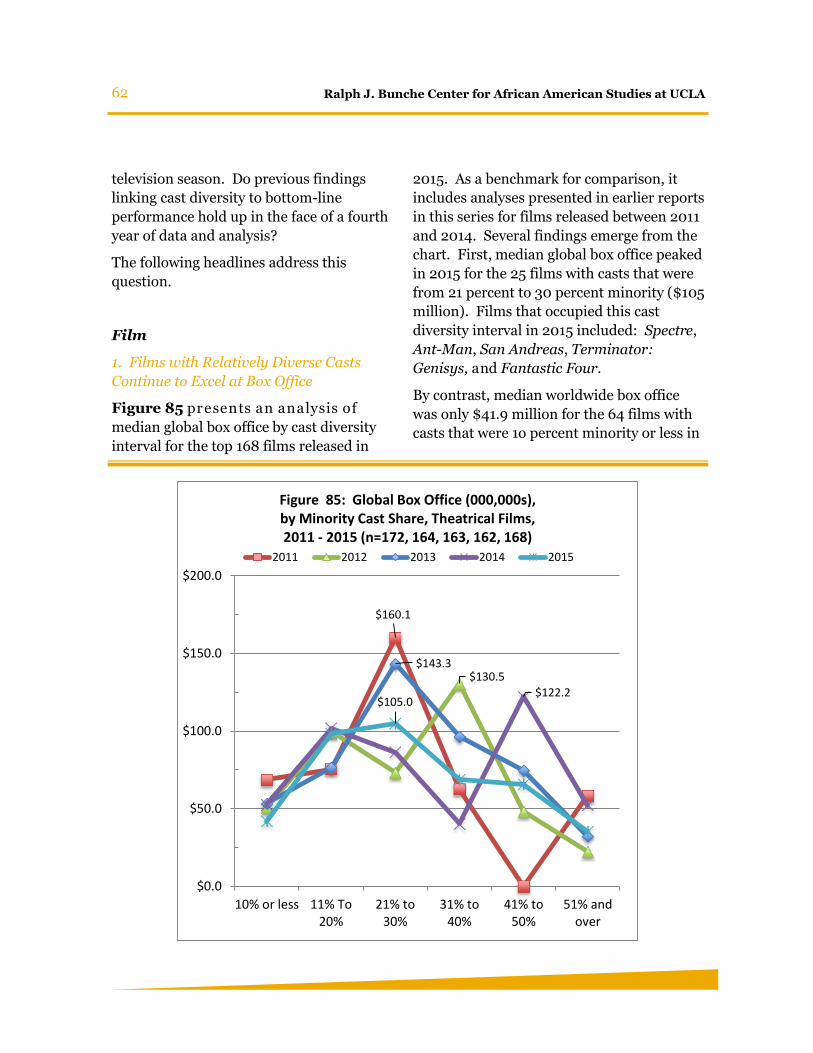
62 Ralph J. Bunche Center for African American Studies at UCLA
television season. Do previous findings
linking cast diversity to bottom-line
performance hold up in the face of a fourth
year of data and analysis?
The following headlines address this
question.
Film
1. Films with Relatively Diverse Casts
Continue to Excel at Box Office
Figure 85 presents an analysis of
median global box office by cast diversity
interval for the top 168 films released in
2015. As a benchmark for comparison, it
includes analyses presented in earlier reports
in this series for films released between 2011
and 2014. Several findings emerge from the
chart. First, median global box office peaked
in 2015 for the 25 films with casts that were
from 21 percent to 30 percent minority ($105
million). Films that occupied this cast
diversity interval in 2015 included: Spectre,
Ant-Man, San Andreas, Terminator:
Genisys, and Fantastic Four.
By contrast, median worldwide box office
was only $41.9 million for the 64 films with
casts that were 1o percent minority or less in
$160.1
$130.5$143.3
$122.2$105.0
$0.0
$50.0
$100.0
$150.0
$200.0
10% or less 11% To20%
21% to30%
31% to40%
41% to50%
51% andover
Figure 85: Global Box Office (000,000s), by Minority Cast Share, Theatrical Films, 2011 - 2015 (n=172, 164, 163, 162, 168)
2011 2012 2013 2014 2015

63 2017 Hollywood Diversity Report
2015. Interestingly, though films in this cast
diversity interval were the poorest perform-
ers, on average, they were by far the most
numerous. Indeed, the relatively large
number of low-performing films that lack
cast diversity has been a consistent finding
throughout this report series. By contrast,
median box office peaked for films that were
from 41 percent to 50 percent minority in
2014 ($122.2 million), those that were from
21 percent to 3o percent minority in 2011
and 2013 ($160.1 million and $143.3 million,
respectively) and those that were from 31
percent to 40 percent minority in 2012
($130.5 million).
2. Films with Relatively Diverse Casts
Continue to Excel in Terms of Return on
Investment
If we consider return on investment,25 which
factors a film’s budget into the analysis, we
see a similar pattern, which echoes findings
from the previous reports. As Figure 86
illustrates, the 25 films that fell into the 21
percent to 30 percent minority interval in
2015 also posted the highest median return
on investment (2.5). This was also the
diversity interval associated with the highest
return on investment in 2011 and 2013, while
41 percent to 50 percent minority was the
2.2
5
2.1
3.4
2.5
0
1
2
3
4
5
6
10% or less 11% To20%
21% to30%
31% to40%
41% to50%
51% andover
Figure 86: Return on Investment, by Minority Cast Share, Theatrical Films, 2011 - 2015 (n=160, 147, 153, 162, 168)
2011 2012 2013 2014 2015
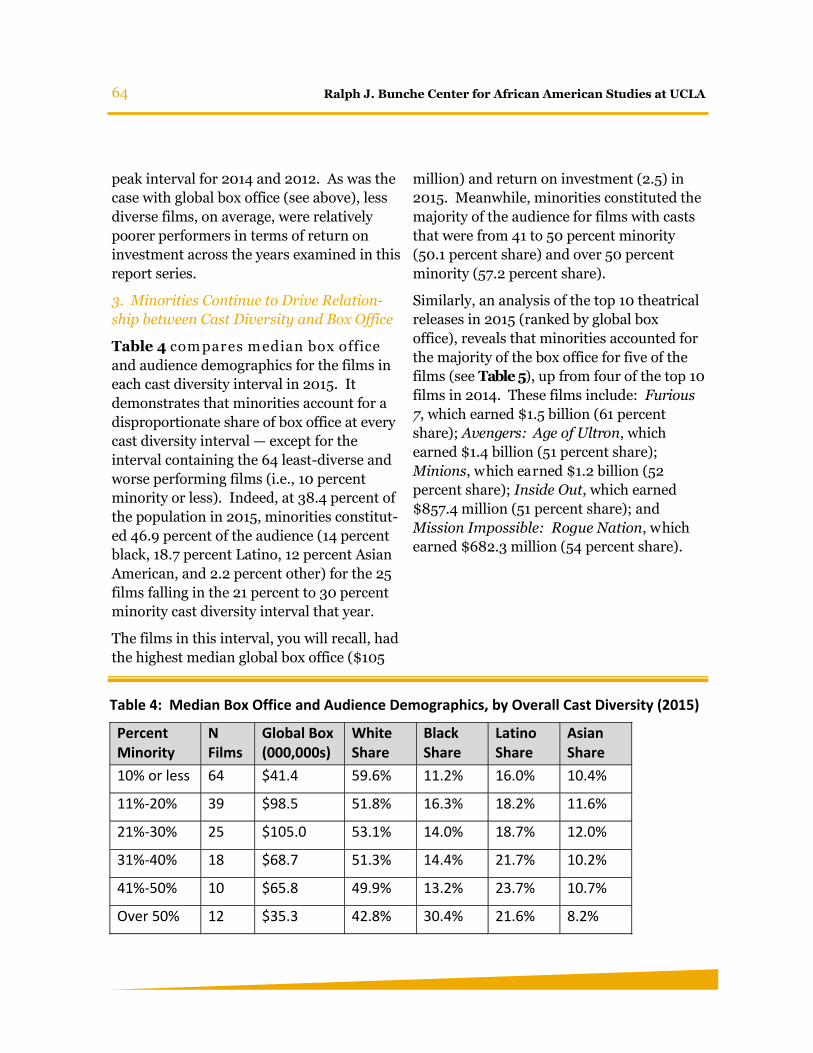
64 Ralph J. Bunche Center for African American Studies at UCLA
peak interval for 2014 and 2012. As was the
case with global box office (see above), less
diverse films, on average, were relatively
poorer performers in terms of return on
investment across the years examined in this
report series.
3. Minorities Continue to Drive Relation-
ship between Cast Diversity and Box Office
Table 4 com pares median box office
and audience demographics for the films in
each cast diversity interval in 2015. It
demonstrates that minorities account for a
disproportionate share of box office at every
cast diversity interval — except for the
interval containing the 64 least-diverse and
worse performing films (i.e., 10 percent
minority or less). Indeed, at 38.4 percent of
the population in 2015, minorities constitut-
ed 46.9 percent of the audience (14 percent
black, 18.7 percent Latino, 12 percent Asian
American, and 2.2 percent other) for the 25
films falling in the 21 percent to 30 percent
minority cast diversity interval that year.
The films in this interval, you will recall, had
the highest median global box office ($105
million) and return on investment (2.5) in
2015. Meanwhile, minorities constituted the
majority of the audience for films with casts
that were from 41 to 50 percent minority
(50.1 percent share) and over 50 percent
minority (57.2 percent share).
Similarly, an analysis of the top 10 theatrical
releases in 2015 (ranked by global box
office), reveals that minorities accounted for
the majority of the box office for five of the
films (see Table 5), up from four of the top 10
films in 2014. These films include: Furious
7, which earned $1.5 billion (61 percent
share); Avengers: Age of Ultron, which
earned $1.4 billion (51 percent share);
Minions, which earned $1.2 billion (52
percent share); Inside Out, which earned
$857.4 million (51 percent share); and
Mission Impossible: Rogue Nation, which
earned $682.3 million (54 percent share).
Table 4: Median Box Office and Audience Demographics, by Overall Cast Diversity (2015)
Percent Minority
N Films
Global Box (000,000s)
White Share
Black Share
Latino Share
Asian Share
10% or less 64 $41.4 59.6% 11.2% 16.0% 10.4%
11%-20% 39 $98.5 51.8% 16.3% 18.2% 11.6%
21%-30% 25 $105.0 53.1% 14.0% 18.7% 12.0%
31%-40% 18 $68.7 51.3% 14.4% 21.7% 10.2%
41%-50% 10 $65.8 49.9% 13.2% 23.7% 10.7%
Over 50% 12 $35.3 42.8% 30.4% 21.6% 8.2%
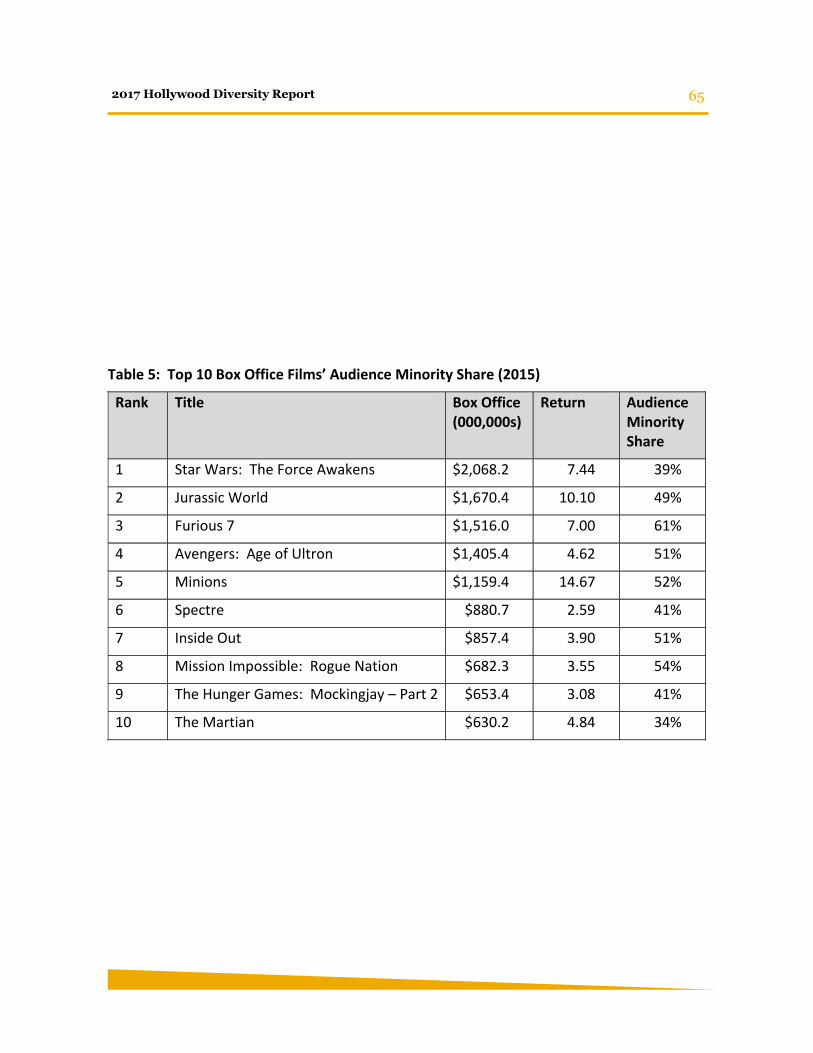
65 2017 Hollywood Diversity Report
Table 5: Top 10 Box Office Films’ Audience Minority Share (2015)
Rank Title Box Office (000,000s)
Return Audience Minority Share
1 Star Wars: The Force Awakens $2,068.2 7.44 39%
2 Jurassic World $1,670.4 10.10 49%
3 Furious 7 $1,516.0 7.00 61%
4 Avengers: Age of Ultron $1,405.4 4.62 51%
5 Minions $1,159.4 14.67 52%
6 Spectre $880.7 2.59 41%
7 Inside Out $857.4 3.90 51%
8 Mission Impossible: Rogue Nation $682.3 3.55 54%
9 The Hunger Games: Mockingjay – Part 2 $653.4 3.08 41%
10 The Martian $630.2 4.84 34%
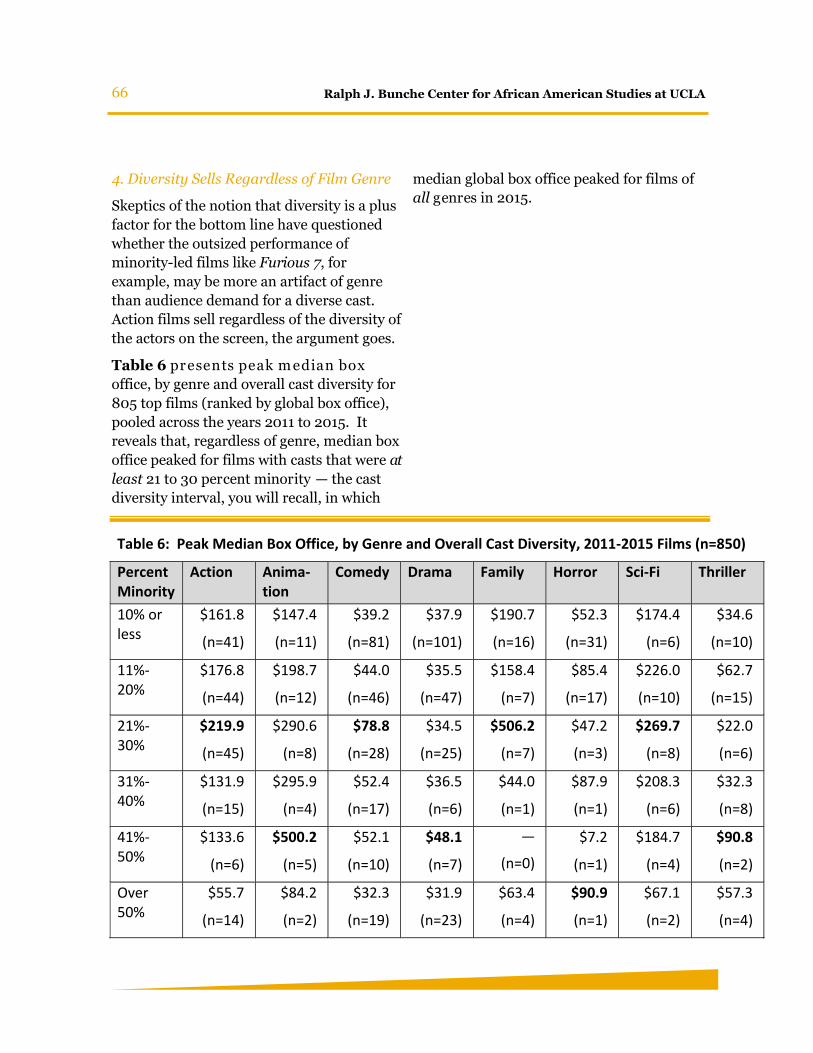
66 Ralph J. Bunche Center for African American Studies at UCLA
4. Diversity Sells Regardless of Film Genre
Skeptics of the notion that diversity is a plus
factor for the bottom line have questioned
whether the outsized performance of
minority-led films like Furious 7, for
example, may be more an artifact of genre
than audience demand for a diverse cast.
Action films sell regardless of the diversity of
the actors on the screen, the argument goes.
Table 6 presents peak m edian box
office, by genre and overall cast diversity for
805 top films (ranked by global box office),
pooled across the years 2011 to 2015. It
reveals that, regardless of genre, median box
office peaked for films with casts that were at
least 21 to 30 percent minority — the cast
diversity interval, you will recall, in which
median global box office peaked for films of
all genres in 2015.
Table 6: Peak Median Box Office, by Genre and Overall Cast Diversity, 2011-2015 Films (n=850)
Percent Minority
Action Anima-tion
Comedy Drama Family Horror Sci-Fi Thriller
10% or less
$161.8
(n=41)
$147.4
(n=11)
$39.2
(n=81)
$37.9
(n=101)
$190.7
(n=16)
$52.3
(n=31)
$174.4
(n=6)
$34.6
(n=10)
11%-20%
$176.8
(n=44)
$198.7
(n=12)
$44.0
(n=46)
$35.5
(n=47)
$158.4
(n=7)
$85.4
(n=17)
$226.0
(n=10)
$62.7
(n=15)
21%-30%
$219.9
(n=45)
$290.6
(n=8)
$78.8
(n=28)
$34.5
(n=25)
$506.2
(n=7)
$47.2
(n=3)
$269.7
(n=8)
$22.0
(n=6)
31%-40%
$131.9
(n=15)
$295.9
(n=4)
$52.4
(n=17)
$36.5
(n=6)
$44.0
(n=1)
$87.9
(n=1)
$208.3
(n=6)
$32.3
(n=8)
41%-50%
$133.6
(n=6)
$500.2
(n=5)
$52.1
(n=10)
$48.1
(n=7)
—
(n=0)
$7.2
(n=1)
$184.7
(n=4)
$90.8
(n=2)
Over 50%
$55.7
(n=14)
$84.2
(n=2)
$32.3
(n=19)
$31.9
(n=23)
$63.4
(n=4)
$90.9
(n=1)
$67.1
(n=2)
$57.3
(n=4)
67 Ralph J. Bunche Center for African American Studies at UCLA
Television26
1. Broadcast Scripted Shows with Diverse
Casts Continue to Excel in Ratings
Figure 87 presents an analysis of
median ratings (18-49, white households,
black households, Latino households, and
Asian American households) by minority
cast share for broadcast scripted shows from
the 2014-15 season. The general upward
trajectory of the lines, as in the previous
reports in this series, suggests that cast
diversity has a meaningful, positive
relationship to the ratings bottom line. For
white households (4.98 ratings points), black
households (6.24 ratings points), and Latino
households (2.77 ratings points), median
ratings peaked for shows featuring casts that
were majority minority. Eleven shows fell
into to this cast diversity interval during the
2014-15 season, including Empire (Fox),
Black-ish (ABC), Law and Order: Special
Victims Unit (NBC), Hawaii Five-O (CBS),
and The Carmichael Show (NBC).
Meanwhile, for viewers 18-49 (2.37 ratings
points) and Asian American households
(2.96 ratings points), median ratings peaked
for shows with casts that were from 41 to 50
percent minority. Examples of these shows
include Brooklyn Nine-Nine (Fox), Elemen-
tary (CBS), New Girl (Fox), and Sleepy
Hollow (Fox).
Despite the obvious popularity of more
diverse shows across the various audience
segments, it is worth noting that the majority
of broadcast scripted shows examined in
2015 — as in previous years — had casts that
were only 20 percent minority or less (67 of
123 shows).
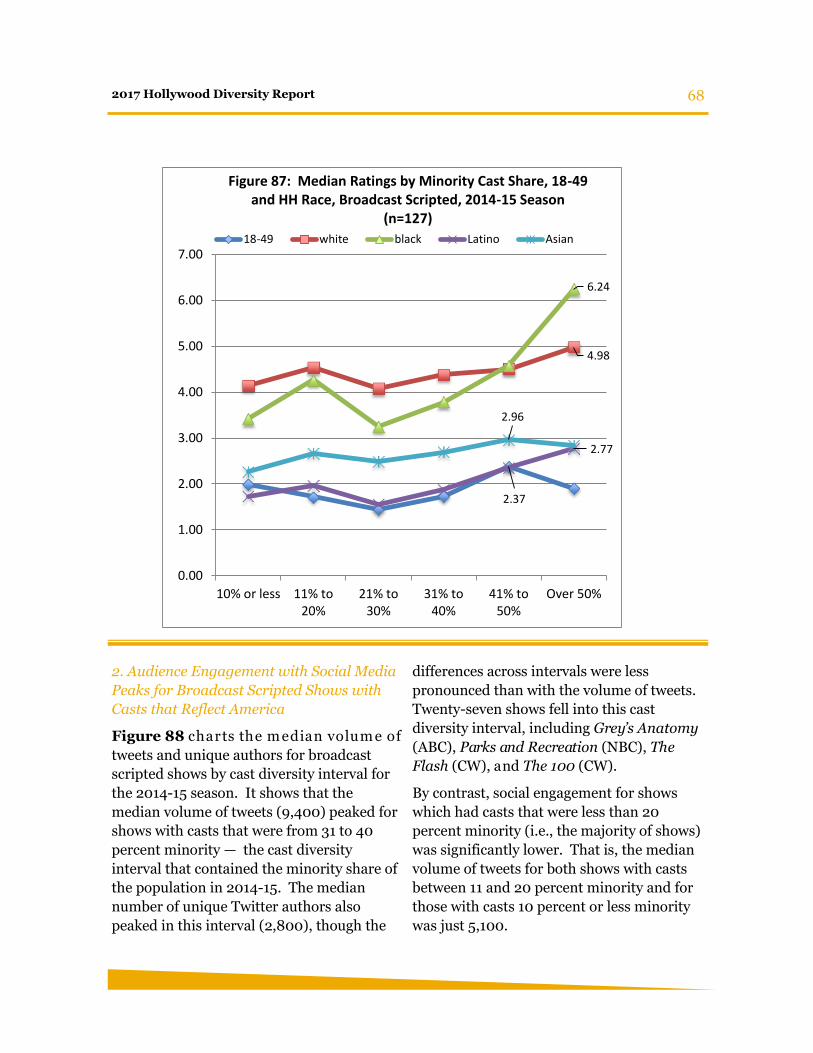
68 2017 Hollywood Diversity Report
2. Audience Engagement with Social Media
Peaks for Broadcast Scripted Shows with
Casts that Reflect America
Figure 88 charts the m edian volum e of
tweets and unique authors for broadcast
scripted shows by cast diversity interval for
the 2014-15 season. It shows that the
median volume of tweets (9,400) peaked for
shows with casts that were from 31 to 40
percent minority — the cast diversity
interval that contained the minority share of
the population in 2014-15. The median
number of unique Twitter authors also
peaked in this interval (2,800), though the
differences across intervals were less
pronounced than with the volume of tweets.
Twenty-seven shows fell into this cast
diversity interval, including Grey’s Anatomy
(ABC), Parks and Recreation (NBC), The
Flash (CW), and The 100 (CW).
By contrast, social engagement for shows
which had casts that were less than 20
percent minority (i.e., the majority of shows)
was significantly lower. That is, the median
volume of tweets for both shows with casts
between 11 and 20 percent minority and for
those with casts 10 percent or less minority
was just 5,100.
2.37
4.98
6.24
2.77
2.96
0.00
1.00
2.00
3.00
4.00
5.00
6.00
7.00
10% or less 11% to20%
21% to30%
31% to40%
41% to50%
Over 50%
Figure 87: Median Ratings by Minority Cast Share, 18-49 and HH Race, Broadcast Scripted, 2014-15 Season
(n=127)
18-49 white black Latino Asian
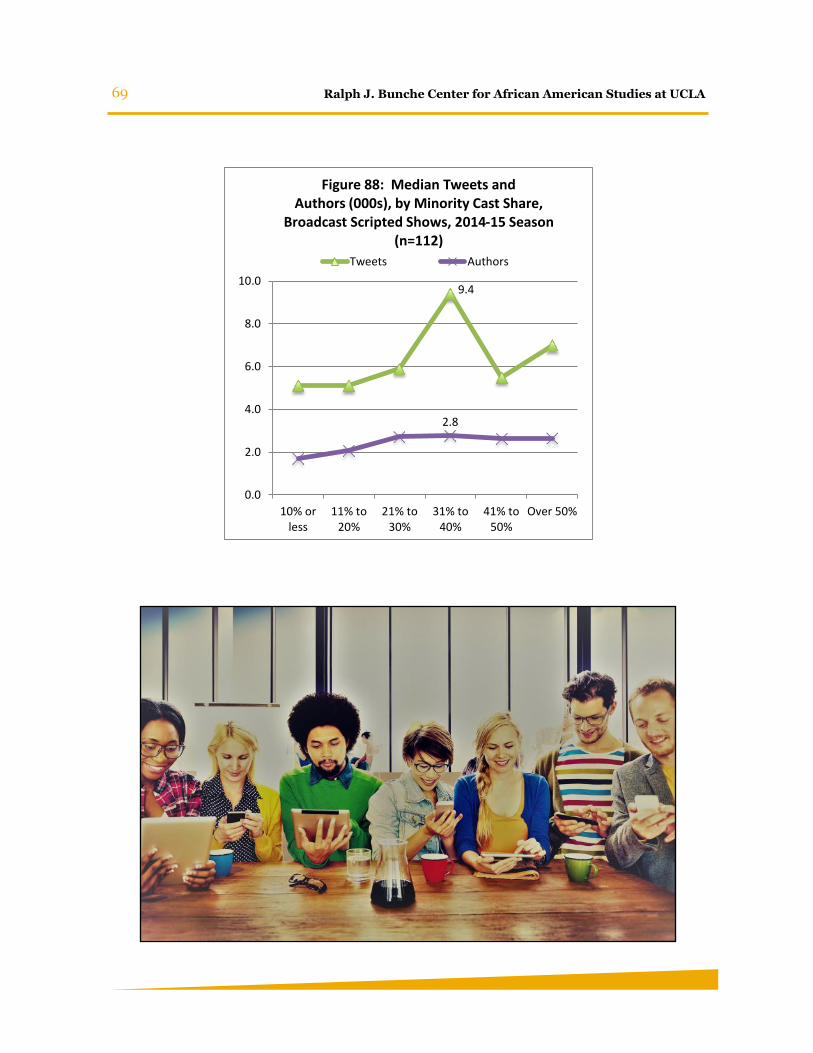
69 Ralph J. Bunche Center for African American Studies at UCLA
9.4
2.8
0.0
2.0
4.0
6.0
8.0
10.0
10% orless
11% to20%
21% to30%
31% to40%
41% to50%
Over 50%
Figure 88: Median Tweets and Authors (000s), by Minority Cast Share,
Broadcast Scripted Shows, 2014-15 Season (n=112)
Tweets Authors
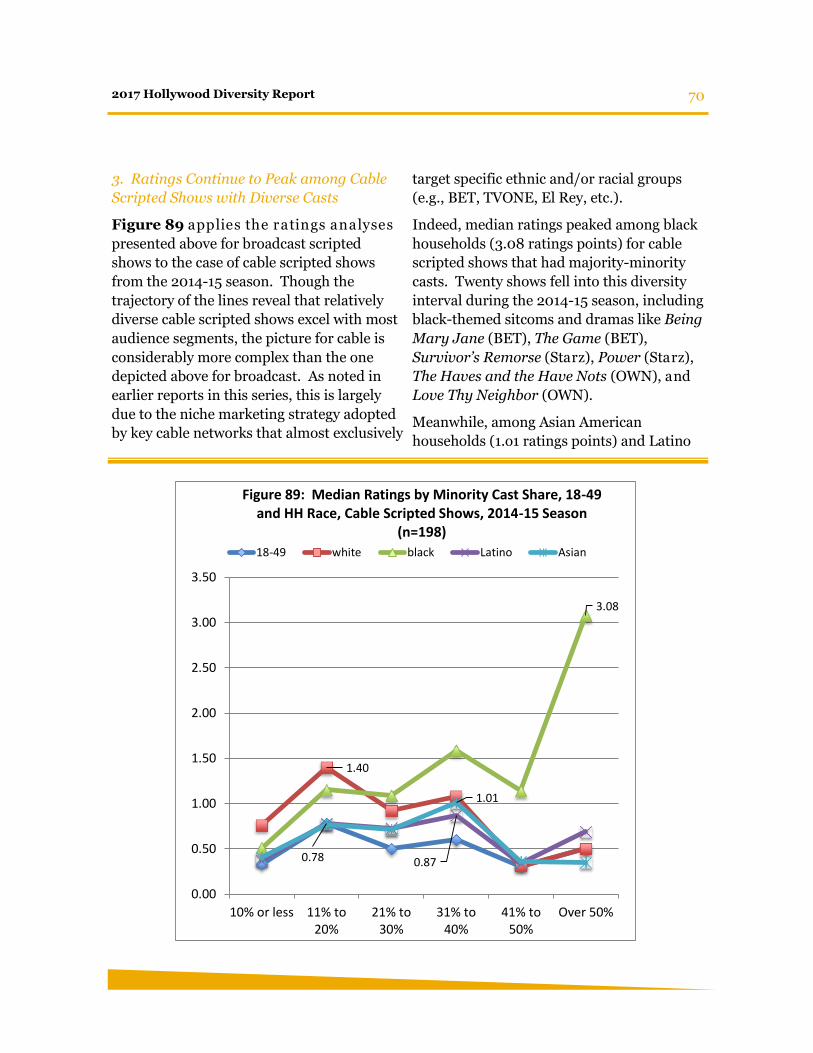
70 2017 Hollywood Diversity Report
3. Ratings Continue to Peak among Cable
Scripted Shows with Diverse Casts
Figure 89 applies the ratings analyses
presented above for broadcast scripted
shows to the case of cable scripted shows
from the 2014-15 season. Though the
trajectory of the lines reveal that relatively
diverse cable scripted shows excel with most
audience segments, the picture for cable is
considerably more complex than the one
depicted above for broadcast. As noted in
earlier reports in this series, this is largely
due to the niche marketing strategy adopted
by key cable networks that almost exclusively
target specific ethnic and/or racial groups
(e.g., BET, TVONE, El Rey, etc.).
Indeed, median ratings peaked among black
households (3.08 ratings points) for cable
scripted shows that had majority-minority
casts. Twenty shows fell into this diversity
interval during the 2014-15 season, including
black-themed sitcoms and dramas like Being
Mary Jane (BET), The Game (BET),
Survivor’s Remorse (Starz), Power (Starz),
The Haves and the Have Nots (OWN), and
Love Thy Neighbor (OWN).
Meanwhile, among Asian American
households (1.o1 ratings points) and Latino
0.78
1.40
3.08
0.87
1.01
0.00
0.50
1.00
1.50
2.00
2.50
3.00
3.50
10% or less 11% to20%
21% to30%
31% to40%
41% to50%
Over 50%
Figure 89: Median Ratings by Minority Cast Share, 18-49 and HH Race, Cable Scripted Shows, 2014-15 Season
(n=198)
18-49 white black Latino Asian
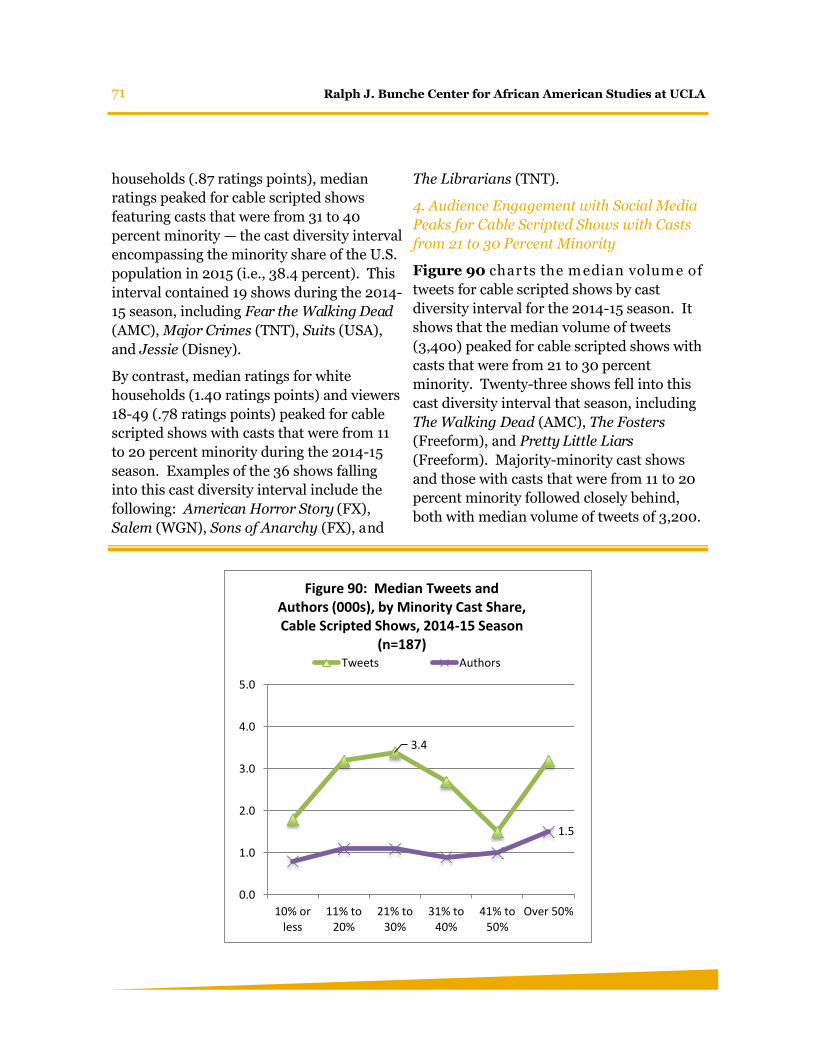
71 Ralph J. Bunche Center for African American Studies at UCLA
households (.87 ratings points), median
ratings peaked for cable scripted shows
featuring casts that were from 31 to 40
percent minority — the cast diversity interval
encompassing the minority share of the U.S.
population in 2015 (i.e., 38.4 percent). This
interval contained 19 shows during the 2014-
15 season, including Fear the Walking Dead
(AMC), Major Crimes (TNT), Suits (USA),
and Jessie (Disney).
By contrast, median ratings for white
households (1.40 ratings points) and viewers
18-49 (.78 ratings points) peaked for cable
scripted shows with casts that were from 11
to 20 percent minority during the 2014-15
season. Examples of the 36 shows falling
into this cast diversity interval include the
following: American Horror Story (FX),
Salem (WGN), Sons of Anarchy (FX), and
The Librarians (TNT).
4. Audience Engagement with Social Media
Peaks for Cable Scripted Shows with Casts
from 21 to 30 Percent Minority
Figure 90 charts the m edian volum e of
tweets for cable scripted shows by cast
diversity interval for the 2014-15 season. It
shows that the median volume of tweets
(3,400) peaked for cable scripted shows with
casts that were from 21 to 30 percent
minority. Twenty-three shows fell into this
cast diversity interval that season, including
The Walking Dead (AMC), The Fosters
(Freeform), and Pretty Little Liars
(Freeform). Majority-minority cast shows
and those with casts that were from 11 to 20
percent minority followed closely behind,
both with median volume of tweets of 3,200.
3.4
1.5
0.0
1.0
2.0
3.0
4.0
5.0
10% orless
11% to20%
21% to30%
31% to40%
41% to50%
Over 50%
Figure 90: Median Tweets and Authors (000s), by Minority Cast Share, Cable Scripted Shows, 2014-15 Season
(n=187)Tweets Authors
72 2017 Hollywood Diversity Report
Meanwhile, the median number of unique
Twitter authors (1,500) peaked for cable
scripted shows with majority-minority casts.
73 Ralph J. Bunche Center for African American Studies at UCLA
Conclusion: Setting the
Record Straight
“It’s always a weird conversation when you’re
trying to explain how a film about kids from
Inglewood can be mainstream, but you don’t
have the same conversation about a very
specific set of kids in suburban Chicago or
South Boston.”
— Rick Famuyiwa
“Networks say, ‘We’re on board with
diversity,’ and they’ll develop it, but they
seldom program it.”
— Eva Longoria
The goal of the Hollywood Diversity Report
series is to the set the record straight with
respect to the myths, half-truths, and excuses
industry decision makers have used to justify
business-as-usual on the diversity front.
Since the last report, the good news is that
minorities and
women have made
some progress,
particularly in
television, which is
currently engaged
in what might be
characterized as a
“golden age.”
The bad news is
that despite these
gains, minorities
and women
remained un-
derrepresented on
every measure in
television during the 2014-15 season.
Meanwhile, because underrepresentation
was much more severe for minorities and
women in film in 2015, both groups had
much further to go in this sector before they
approached anything resembling proportion-
ate representation.
Still, the most important takeaway from this
report — and the three before it — is, yes,
diversity does indeed sell in film and
television. This is not to say that it is enough
to hastily append a few actors of color or
women to a cast that is at its core white and
male. No, the appeal of diversity for today’s
audiences has everything to do with the
storytelling, which extends beyond who’s in
front of the camera to the earliest moments
of the creative process, when ideas for films
and television shows are first pitched to
agents, studios and networks.
Diversity sells, first and foremost, because
today’s audiences are themselves diverse and
in search of stories and characters with

74 2017 Hollywood Diversity Report
whom they can identify. And these audienc-
es are becoming more diverse with each
passing day, meaning that the patterns
identified in this report series linking
diversity to the bottom line will only become
more pronounced.
Indeed, the combined buying power of
people of color in America approached $3.5
trillion in 2015,27 and these growing, diverse
audience segments purchased more movie
tickets and watched more television on a per
capita basis than their white counterparts.
For the Hollywood industry to continue to
produce as many low-performing films and
television shows as it does, which are not
very diverse, simply does not make good
business sense in light of these facts.
Telling It Like It Is
The problem, as we have pointed out in
earlier reports, is that the Hollywood
industry is not currently structured to make
the most of today’s market realities. The
studios, networks, talent agencies, and
academies are demographically and
culturally out of step with the diverse
audiences on which their collective future
will increasingly depend.
Pipeline initiatives are useful interventions
but no panacea for Hollywood’s diversity
problems. In the final analysis, it’s not about
the availability of diverse talent. There’s
more than enough of that to go around. It’s
more about the failure of Hollywood
organizations, at their own peril, to find ways
to include this talent beyond just the
margins.
Hollywood’s diversity problems begin at the
very top of the studios and networks, in the
executive suites, where decisions are made
about what gets made and with what size
production and marketing budgets.
Unfortunately, the individuals in these
decision-making positions (typically white
men) are not motivated to share their power
with diverse women and men whose
reservoirs of experience equip them with the
perspectives necessary to connect more
effectively with today’s audiences.
Despite false claims to the contrary, there is
no tradeoff in Hollywood today between
diversity and profitability. Diversity is clearly
a plus factor for the bottom line. Nor is there
a tradeoff between diversity and quality.
Quality storytelling plus rich, diverse
performances equals box office and ratings
success. Year after year, the evidence
supporting this equation continues to
mount.
75 Ralph J. Bunche Center for African American Studies at UCLA
Endnotes
1. These films included the top 200
theatrical 2015, ranked by worldwide box
office, minus foreign films.
2. The 2014-15 season is defined as
television programming that originally
aired between September 1, 2014 and
August 31, 2015.
3. Total numbers for the various analyses in
this report may deviate from the overall
total for the number of films or television
shows considered due to focused
analyses on a subset of the data (noted
below) or missing values for some cases
(e.g., many reality shows do not identify a
cast, directors, or writers).
4. Household ratings (HH) are defined as
the percentage of the universe of
households tuned to a particular TV
program during the average minute of
the program. This includes incremental
viewing to programs watched at the time
of the telecast as well as watched in DVR
playback that occurs within 7 days of the
original telecast. The HH ratings
presented by race are based on the race
of the head of household, while 18-49
ratings are based on individual viewers.
Social media ratings consist of tweets and
unique authors, which are measures of
relevant U.S. Twitter activity from three
hours before through three hours after a
broadcast, local time. “Tweets” are
ascribed to a linear TV episode, while
“unique authors” refer to unique Twitter
accounts that have sent at least one tweet
ascribed to a specific TV episode.
5. Theatrical Market Statistics: 2014.
MPAA (2014), p. 2.
6. These figures include films that received
any domestic box office in a given year.
Ibid, p. 19.
7. Ibid., pp. 12-13.
8. Genres were derived from the keywords
The Studio System identified for each
film.
9. “Other” programming includes news,
sports, and animated.
10. According to the Los Angeles Times, the
number of top-grossing films made in
California has dropped 60 percent in the
last 15 years (Horsey, January 8, 2014).
A large share of television production has
also left the state for other locales, where
incentives offered to television producers
enhance the bottom line (Watt, August
28, 2013).
11. “Lead role” is defined in this report as the
first credited actor/performer for a given
project’s list of cast members.
12. http://www.nytimes.com/2013/06/02/
movies/coming-soon-a-breakout-for-
black-filmmakers.html?
pagewanted=all&_r=0
13. The cast diversity measure used in this
report for both film and television is
based on the first eight credited actors
for a given title.
14. Women and minorities were counted as
“writer” for the film analyses if they were
credited as the sole writer or at least as
part of a writing team.
15. The number for native actors was so low
(just 3) that the Native American share of
76 2017 Hollywood Diversity Report
cable scripted roles rounded to 0 percent.
16. The analysis of creator racial status and
gender was limited to individuals clearly
credited as “creator.”
17. For example, see Hunt, D. (2014).
Turning Missed Opportunities Into
Realized Ones: The 2014 Hollywood
Writers Report. Los Angeles: Writers
Guild of America, West.
18. http://variety.com/2015/tv/news/dga-
study-shows-women-minorities-lagging-
as-first-time-tv-directors-1201395895/
19. In the analyses for this section, a film or
television show that received an Oscar or
Emmy in any category is counted as an
“Oscar winner” or “Emmy winner.” No
distinction is made between films or
television shows that won a single or
multiple awards.
20. In this chart (and others that consider
the odds of winning an Emmy), the
conditional probability of Event A
(winning an award) is computed, given
that Event B (overall cast diversity) has
already occurred.
21. “Emmy winners” for each season are
defined as shows that won at least one
major Emmy award. The relevant
categories include the following:
Outstanding Lead Actress in a Drama
Series; Outstanding Lead Actor in a
Drama Series; Outstanding Supporting
Actress in a Drama Series; Outstanding
Supporting Actor in a Drama Series;
Outstanding Guest Actress in a Drama
Series; Outstanding Guest Actor in a
Drama Series; Outstanding Writing for a
Drama Series; Outstanding Directing for
a Drama Series; Outstanding Drama
Series; Outstanding Lead Actress in a
Comedy Series; Outstanding Lead Actor
in a Comedy Series; Outstanding
Supporting Actress in a Comedy Series;
Outstanding Supporting Actor in a
Comedy Series; Outstanding Guest
Actress in a Comedy Series; Outstanding
Guest Actor in a Comedy Series;
Outstanding Writing for a Comedy
Series; Outstanding Directing for a
Comedy Series; Outstanding Comedy
Series.
22. Downing, J.D. and M. Beltrán. (2002).
“The TeleVisions Project: An Explorato-
ry Project on U.S. Entertainment and
‘Race.’” Ford Foundation Report.
23. Rebecca Sun. “TV Diversity Programs:
Launching Pad or Scarlett Letter?”
http://www.hollywoodreporter.com/
features/tv-diversity-programs-
launching-pad-831880
24. Aisha Harris. “Same Old Script.” http://
www.slate.com/articles/arts/
culturebox/2015/10/
diversi-
ty_in_the_tv_writers_room_writers_an
d_showrunners_of_color_lag_far.html
25. For these analyses, simple return on
investment is computed as follows:
(Revenue – Budget)/Budget. That is, the
higher the ratio, the higher the rate of
return.
26. Only dramas and comedies are consid-
ered in these analyses.
27. “2015 Multicultural Economy Report,”
Selig Center for Economic Growth,
University of Georgia, Athens, GA.
77 Ralph J. Bunche Center for African American Studies at UCLA
About the Authors
Dr. Darnell Hunt is director of the
Ralph J. Bunche Center for African American
Studies, chair of the Department of Sociolo-
gy, and professor of sociology and African
American Studies at UCLA. Dr. Hunt has
written extensively on race and media. He is
editor of Channeling Blackness: Studies on
Television and Race in America, (Oxford
University Press, 2005), an anthology of
classic and contemporary studies examining
television access and images of race. He also
is the lead author on the past three annual
Hollywood Diversity Reports. Over the past
20 years, Dr. Hunt has contributed to
numerous projects addressing the issues of
access and diversity in the entertainment
industry, including work with the WGA,
SAG, AFTRA, NAACP and U.S. Commission
on Civil Rights.
Dr. Ana-Christina Ramon, Assistant
Director and Associate Researcher of the
Bunche Center, is a social psychologist
trained in quantitative and qualitative
methods. For the past twelve years, she has
worked extensively on social justice issues
related to equity and access in higher
education and the entertainment industry.
Her past research has also focused on
conflict perceptions and racial and gender
stereotypes. She co-edited (with Dr. Darnell
Hunt) Black Los Angeles: American Dreams
and Racial Realities (New York University
Press, 2010). On behalf of California Social
Science Researchers, she (with Dr. Hunt) co-
authored amicus briefs in support of
affirmative action which were submitted to
the U.S. Federal Court of Appeals and to the
U.S. Supreme Court. She previously worked
at a market research company and was a
summer research associate at the RAND
Corporation.
Michael Tran is a Graduate Student
Researcher with the Ralph J. Bunche Center
for African American Studies at UCLA. He is
one of many graduate students who
contribute to the data collection efforts that
goes into the Hollywood Diversity Report. In
addition to his participation in the Holly-
wood Advancement Project, his interests in
race and media have led to a number of
ongoing research studies, including an
investigation into the cultural politics of
independent filmmakers of color and a study
of the role of art in minority community
politics. He has previously earned master's
degrees in demographics and social analysis
and in sociology, and is currently working
towards a PhD in sociology.
Amberia Sargent is a doctoral candi-
date in Sociology at UCLA. Her
work examines the relationship between the
body and workplace inequality in three
complementary case studies, each centering
on different spheres of the comedy industry:
stand-up comedy, acting, and television
writing. Her research takes an intersection-
al approach to unpack the ways women
deploy various embodiment strategies to
navigate the double binds they encounter in
the workplace.
Dr. Vanessa Díaz is an anthropologist,
journalist, and filmmaker. She is an
Assistant Professor of Communications at
California State University, Fullerton.
Currently, she is a Ford Foundation
Postdoctoral Fellow and a Visiting Research-
er in UCLA’s Chicano Studies Research
78 2017 Hollywood Diversity Report
Center. She holds a PhD in Anthropology
from the University of Michigan. Dr. Díaz’s
research focuses on the production of media,
celebrity, and popular culture. Grounded in
her experience as a red carpet reporter for
People magazine, Díaz’s current work
focuses on hierarchies of labor and racial
politics in the production of celebrity-
focused media in the U.S. In addition to her
research on media in the U.S., she has also
done extensive research on HipHop culture
in Cuba.
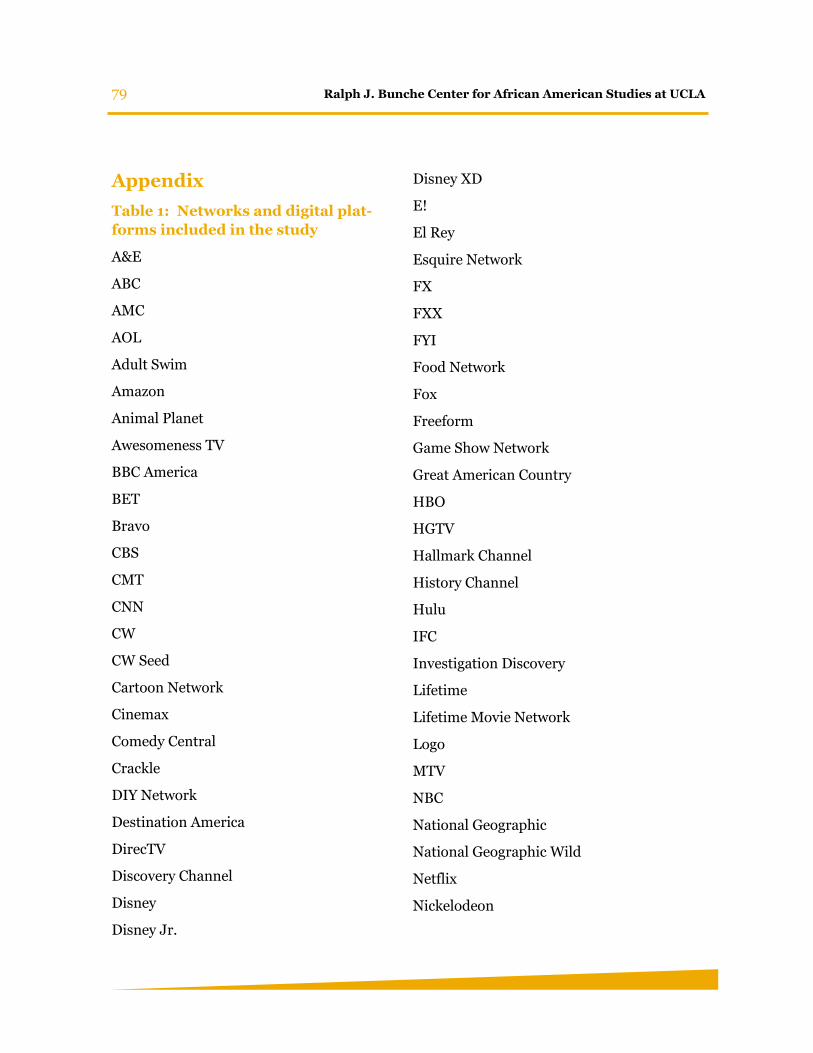
79 Ralph J. Bunche Center for African American Studies at UCLA
Appendix
Table 1: Networks and digital plat-
forms included in the study
A&E
ABC
AMC
AOL
Adult Swim
Amazon
Animal Planet
Awesomeness TV
BBC America
BET
Bravo
CBS
CMT
CNN
CW
CW Seed
Cartoon Network
Cinemax
Comedy Central
Crackle
DIY Network
Destination America
DirecTV
Discovery Channel
Disney
Disney Jr.
Disney XD
E!
El Rey
Esquire Network
FX
FXX
FYI
Food Network
Fox
Freeform
Game Show Network
Great American Country
HBO
HGTV
Hallmark Channel
History Channel
Hulu
IFC
Investigation Discovery
Lifetime
Lifetime Movie Network
Logo
MTV
NBC
National Geographic
National Geographic Wild
Netflix
Nickelodeon
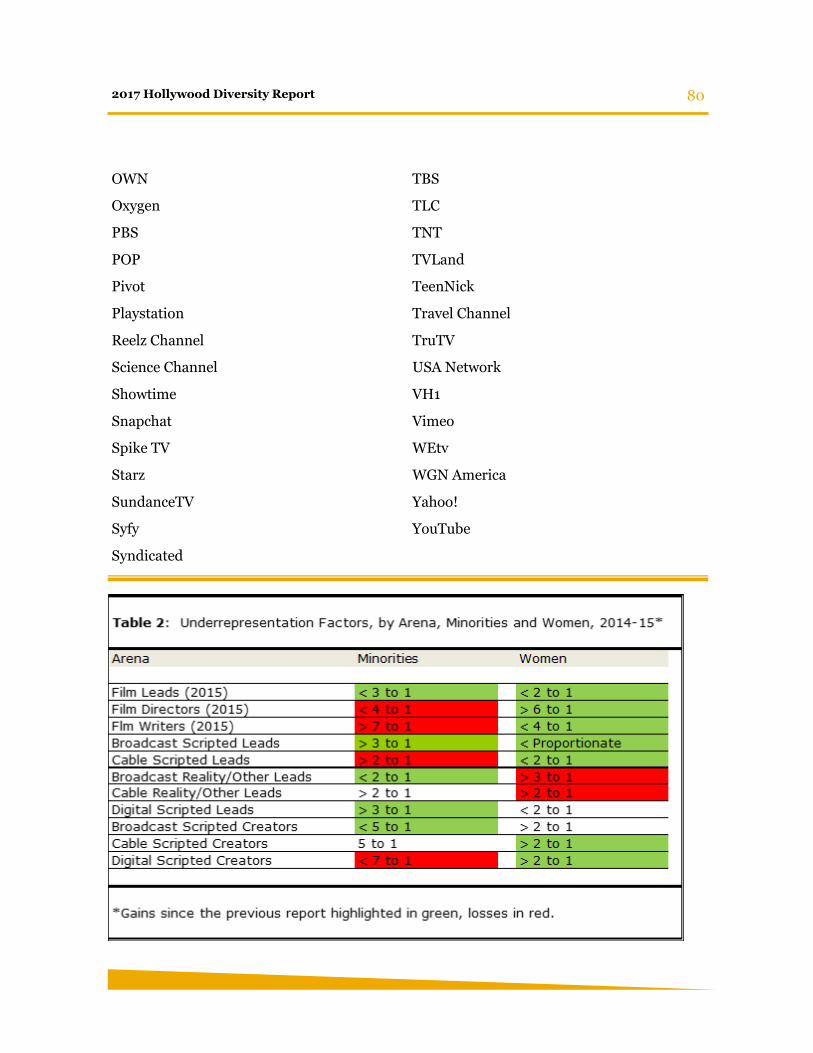
80 2017 Hollywood Diversity Report
OWN
Oxygen
PBS
POP
Pivot
Playstation
Reelz Channel
Science Channel
Showtime
Snapchat
Spike TV
Starz
SundanceTV
Syfy
Syndicated
TBS
TLC
TNT
TVLand
TeenNick
Travel Channel
TruTV
USA Network
VH1
Vimeo
WEtv
WGN America
Yahoo!
YouTube
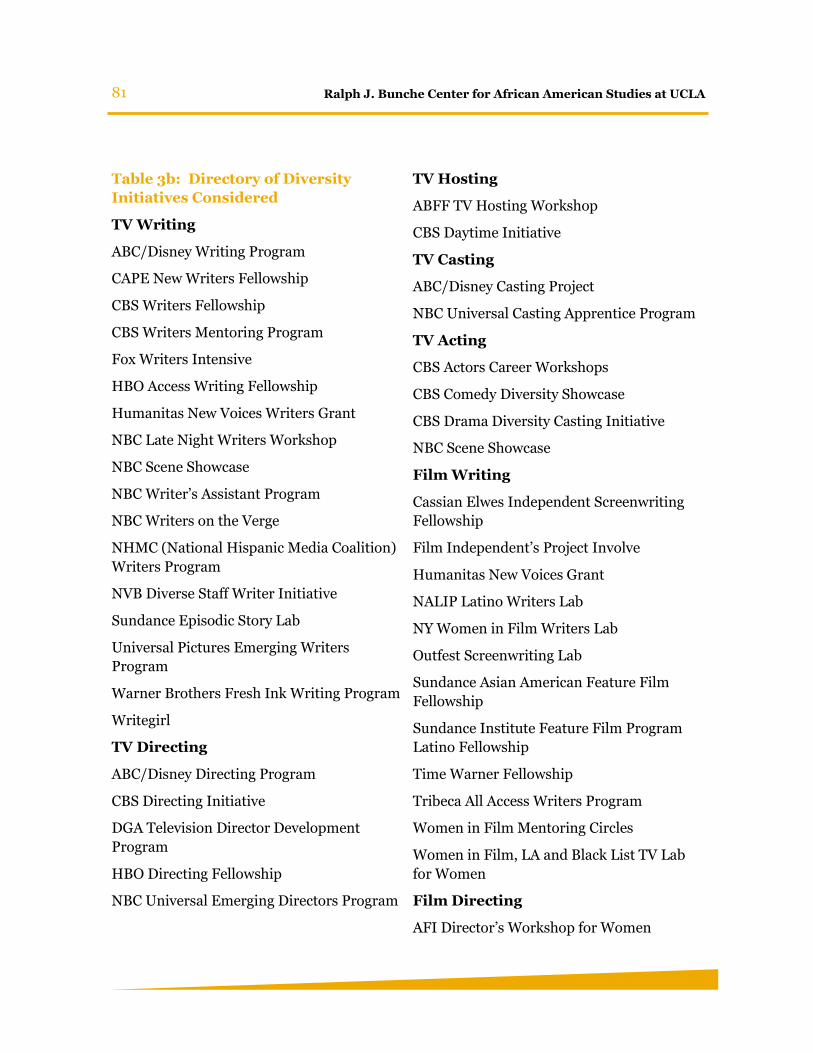
81 Ralph J. Bunche Center for African American Studies at UCLA
Table 3b: Directory of Diversity
Initiatives Considered
TV Writing
ABC/Disney Writing Program
CAPE New Writers Fellowship
CBS Writers Fellowship
CBS Writers Mentoring Program
Fox Writers Intensive
HBO Access Writing Fellowship
Humanitas New Voices Writers Grant
NBC Late Night Writers Workshop
NBC Scene Showcase
NBC Writer’s Assistant Program
NBC Writers on the Verge
NHMC (National Hispanic Media Coalition)
Writers Program
NVB Diverse Staff Writer Initiative
Sundance Episodic Story Lab
Universal Pictures Emerging Writers
Program
Warner Brothers Fresh Ink Writing Program
Writegirl
TV Directing
ABC/Disney Directing Program
CBS Directing Initiative
DGA Television Director Development
Program
HBO Directing Fellowship
NBC Universal Emerging Directors Program
TV Hosting
ABFF TV Hosting Workshop
CBS Daytime Initiative
TV Casting
ABC/Disney Casting Project
NBC Universal Casting Apprentice Program
TV Acting
CBS Actors Career Workshops
CBS Comedy Diversity Showcase
CBS Drama Diversity Casting Initiative
NBC Scene Showcase
Film Writing
Cassian Elwes Independent Screenwriting
Fellowship
Film Independent’s Project Involve
Humanitas New Voices Grant
NALIP Latino Writers Lab
NY Women in Film Writers Lab
Outfest Screenwriting Lab
Sundance Asian American Feature Film
Fellowship
Sundance Institute Feature Film Program
Latino Fellowship
Time Warner Fellowship
Tribeca All Access Writers Program
Women in Film Mentoring Circles
Women in Film, LA and Black List TV Lab
for Women
Film Directing
AFI Director’s Workshop for Women
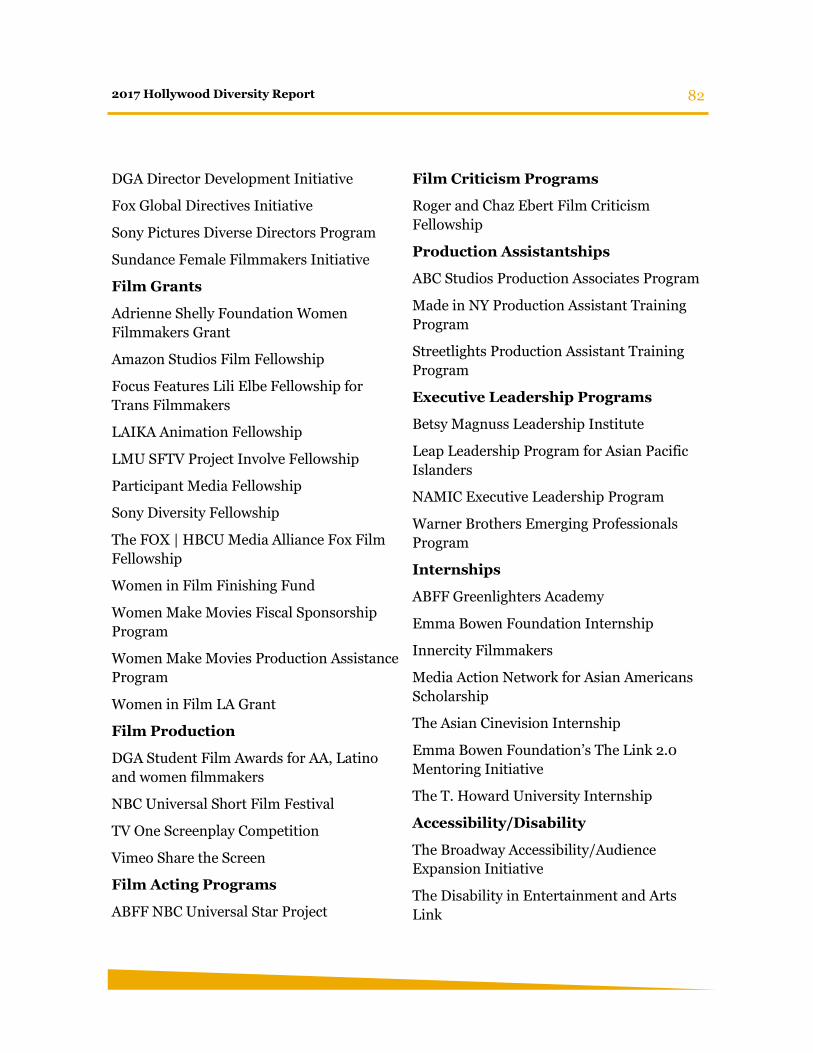
82 2017 Hollywood Diversity Report
DGA Director Development Initiative
Fox Global Directives Initiative
Sony Pictures Diverse Directors Program
Sundance Female Filmmakers Initiative
Film Grants
Adrienne Shelly Foundation Women
Filmmakers Grant
Amazon Studios Film Fellowship
Focus Features Lili Elbe Fellowship for
Trans Filmmakers
LAIKA Animation Fellowship
LMU SFTV Project Involve Fellowship
Participant Media Fellowship
Sony Diversity Fellowship
The FOX | HBCU Media Alliance Fox Film
Fellowship
Women in Film Finishing Fund
Women Make Movies Fiscal Sponsorship
Program
Women Make Movies Production Assistance
Program
Women in Film LA Grant
Film Production
DGA Student Film Awards for AA, Latino
and women filmmakers
NBC Universal Short Film Festival
TV One Screenplay Competition
Vimeo Share the Screen
Film Acting Programs
ABFF NBC Universal Star Project
Film Criticism Programs
Roger and Chaz Ebert Film Criticism
Fellowship
Production Assistantships
ABC Studios Production Associates Program
Made in NY Production Assistant Training
Program
Streetlights Production Assistant Training
Program
Executive Leadership Programs
Betsy Magnuss Leadership Institute
Leap Leadership Program for Asian Pacific
Islanders
NAMIC Executive Leadership Program
Warner Brothers Emerging Professionals
Program
Internships
ABFF Greenlighters Academy
Emma Bowen Foundation Internship
Innercity Filmmakers
Media Action Network for Asian Americans
Scholarship
The Asian Cinevision Internship
Emma Bowen Foundation’s The Link 2.0
Mentoring Initiative
The T. Howard University Internship
Accessibility/Disability
The Broadway Accessibility/Audience
Expansion Initiative
The Disability in Entertainment and Arts
Link

Ralph J. Bunche Center for African American Studies at UCLA 160 Haines Hall, Box 951545 ● Los Angeles, CA 90095-1545
310.825.7403 www.bunchecenter.ucla.edu
www.facebook.com/BuncheCenter.UCLA www.twitter.com/BuncheUCLA
www.youtube.com/user/uclabunchecenter