2017-2022 south florida comprehensive economic...
TRANSCRIPT

0 | P a g e
2017-2022 South Florida Comprehensive Economic
Development Strategy Approved by the South Florida Regional Planning Council, November 27, 2017

South Florida Comprehensive Economic Development Strategy: 2017–2022 1

South Florida Comprehensive Economic Development Strategy: 2017–2022 2
CONTENTS
SUMMARY BACKGROUND ...................................................................................... 3
Economic Development District ........................................................................ 3
Comprehensive Economic Development Strategy (CEDS) ....................... 3
Defining the Region ............................................................................................... 3
Geography ................................................................................................................ 3
South Florida CEDS: Visualized .......................................................................... 4
SWOT ANALYSIS ......................................................................................................... 9
ACTION PLAN ............................................................................................................. 10
STRATEGIC DIRECTION ....................................................................................... 11
Florida Chamber Six Pillars Matrix of Congruence ................................ 11
Innovation & Competitiveness .......................................................................... 13
Goals ..................................................................................................................... 13
Objectives ............................................................................................................ 13
Performance Measures ........................................................................................ 13
Opportunity & Prosperity ................................................................................... 14
Goals ..................................................................................................................... 14
Objectives ............................................................................................................ 14
Performance Measures ................................................................................... 14
Vitality & Sustainability ........................................................................................ 15
Goals ..................................................................................................................... 15
Objectives ............................................................................................................ 15
Performance Measures ................................................................................... 15
EVALUATION FRAMEWORK ................................................................................... 15
ECONOMIC RESILENCE............................................................................................ 17
RESILIENCY IN SOUTH FLORIDA ...................................................................... 19
DATA TABLES AND REGIONAL FACTS .............................................................. 20
Population Trends ................................................................................................ 20
Continued Growth ........................................................................................... 20
Diversity and Mobility ...................................................................................... 21
Place of Birth ...................................................................................................... 21
Age & Diversity ................................................................................................. 22
Education ................................................................................................................ 23
Educational Attainment ................................................................................. 23
Institutions of Higher Learning ................................................................... 23
Industry Location Quotient and Brain Drain ............................................... 24
Employment ........................................................................................................... 25
Equity ....................................................................................................................... 26
Income ................................................................................................................ 26
Poverty ................................................................................................................ 28
Housing and Vehicle Access ............................................................................. 29
ALICE Index ............................................................................................................ 30
Health Insurance ............................................................................................... 31
County Health Rankings ................................................................................. 31
Development and Density ................................................................................ 32
Economic Conditions .......................................................................................... 32
Energy ................................................................................................................. 33
Regional Industry Clusters ................................................................................ 34
Innovation and Technology .............................................................................. 35
Innovation Index 2.0 – Innovation Index for US Regions ................... 35
Bloomberg US Innovation Index ................................................................ 36
The Kauffman Index of Startup Activity ................................................... 36
Transportation Networks .................................................................................... 37
Commuting in South Florida ........................................................................ 37
Tri-Rail ................................................................................................................. 38
Ridership ............................................................................................................. 38
Tri-Rail Coastal Link ........................................................................................ 38
Trade and Travel................................................................................................... 39
Foreign Trade ........................................................................................................ 39
Seaports .............................................................................................................. 39
Import and Export Trade Value .................................................................. 40
Environmental Profile.......................................................................................... 40
Coral Reef Decline ................................................................................................ 41
Community Participation: The CEDS Steering Committee ......................... 42

South Florida Comprehensive Economic Development Strategy: 2017–2022 3
SUMMARY BACKGROUND Economic Development District
The South Florida Regional Planning Council (Council) is one of ten regional councils within Florida created to address issues and plan solutions that are
greater than local scope, as well as providing input into state policy development, the Council also serves as the only multipurpose regional entity that is
in position to plan for intergovernmental solutions to growth related problems, and meet other needs of communities in each region. The Council serves
as the Economic Development District (EDD) for three counties: Broward, Miami-Dade, and Monroe Counties residents. EDDs serve as geographic
districts for the US Economic Development Administration (EDA) to deploy various programs.
Comprehensive Economic Development Strategy (CEDS)
EDA directs each designated Economic Development District to develop and maintain a Comprehensive Economic Development Strategy (CEDS) with
the assistance of public involvement. A CEDS is a strategy-driven plan for regional economic development. A CEDS is the result of a regionally-owned
planning process designed to build capacity and guide the economic prosperity and resiliency of an area or region. Economic Development Districts
are required to fully update the CEDS every five years and can update the CEDS on an annual basis. This update includes five main sections:
• Summary Background of the economic conditions in the region;
• SWOT Analysis to identify strengths, weaknesses, opportunities, and threats;
• Strategic Action Plan incorporating tactics identified through the planning process, other regional plans, and stakeholder feedback to develop
priority strategies for the region;
• Evaluation Framework to identify and monitor performance measures associated with the plan;
• and Economic Resilience.
Defining the Region
The South Florida EDD Region is comprised of Broward, Miami-Dade and Monroe Counties. “South
Florida” often refers to the Metropolitan Statistical Area of Miami, Broward, and Palm Beach Counties or
“Miami-Fort Lauderdale-West Palm Beach.” Palm Beach County is part of the Treasure Coast Regional
Planning Council.
South Florida may also be defined by commuting patterns as the Greater Miami Area or the Miami-Fort
Lauderdale-Port St Lucie Combined Statistical Area.
Geography
The South Florida Region is approximately 7,500 square miles, of which approximately 45% (3,338
square miles) is water.1 The region is bordered by the Atlantic Ocean to the east, the Everglades and the
Gulf of Mexico to the west, and Florida Bay and the convergence of the Atlantic Ocean and the Gulf of
Mexico to the south.
1 https://factfinder.census.gov/

South Florida Comprehensive Economic Development Strategy: 2017–2022 4
The Region is characterized by a relatively flat topography with elevations trending
downwards from the east and along the Atlantic Coastal Ridge to the west. Elevation is
generally under 10 feet above sea level, excluding the Coastal ridge where it reaches 20
feet above sea level in select areas.2
Most of South Florida’s landscape is composed of karst landforms, created through the
dissolution of the limestone bedrock by groundwater. This creates honeycombed
underground formations, subterranean tunnels, and cavities filled with freshwater,
collectively termed the Floridian Aquifer overlaid by the Biscayne Aquifer. The water table is
also very close to the surface.3
South Florida experiences a tropical climate year-round with average temperature of 77° F.
The region receives an average annual rainfall of 60 inches, mostly during the wet season
of summer and early fall.
The combination of low topography, karst substrate, and coastal proximity creates unique
environmental vulnerabilities for South Florida, exacerbated by hurricanes between June
and November every year.
South Florida CEDS: Visualized
For more information about many of the topics
discussed in this report, please visit us online at
www.sfregionalcouncil.org/CEDS_Visualized. Look
for the blue text boxes throughout this report;
they indicate that interactive maps are available
for exploration on our website, allowing users to
pan around the region and inspect a variety of
spatial trends that may exist.
2 https://pubs.usgs.gov/sim/3047/downloads/SIM3047.pdf 3 https://pubs.usgs.gov/ha/ha730/ch_g/G-text6.html
For additional information and maps,
please visit our CEDS: Visualized
page, which can be found here:
sfregionalcouncil.org/CEDS_Visualized

17%
21%
41%
21%
AGE
5-19
20-34
35-64
Over 65
HOUSING
HOUSING UNITS
2010/2016
1.85/1.90
MILLION
HOMEOWNER RATE
56%
RENTER OCCUPIED
44% HOUSEHOLDS LIVING
BELOW ALICE
THRESHOLD
>50%
SYSTEMS
3 PUBLIC SCHOOL SYSTEMS
2 PUBLIC UNIVERSITIES/3 STATE COLLEGES
3 RELIGIOUS AND MAJOR PRIVATE
UNIVERSITIES
3 INTERNATIONAL AIRPORTS
2 SEAPORTS
2 COUNTY TRANSIT SYSTEMS
1 REGIONAL RAIL
7 MAJOR HIGHWAYS
3 PERFORMING ARTS CENTERS
16 STATE PARKS/3 NATIONAL PARKS
POPULATION
3 COUNTIES, 71 MUNICIPALITIES
2010/2016 ESTIMATE
4.32/4.63 MILLION
2030 ESTIMATE
5.41 MILLION
GROWTH RATE 2000-2015/2015-2030
15.14%/18.85%
MEDIAN AGE
40
EDUCATIONAL ATTAINMENT, POPULATION OVER 25
BACHELOR’S DEGREE OR HIGHER: 29.7% HIGH SCHOOL DIPLOMA OR SOME COLLEGE: 54.7%
LESS THAN HIGH SCHOOL DIPLOMA: 15.5%
WHITE NON-
HISPANIC
BLACK
HISPANIC/ LATINO
MULTIRACIAL AND OTHER
FOREIGN BORN
62.1%
OUT OF
2.35
MILLION
HISPANIC/
LATINO
POPULATION
US BORN
37.9 %
The region’s eleven private non-farm sectors with the highest levels of employment
in 2014 accounted for 80% of regional employment. Other Industries: Mining, Forestry, Fishing, Utilities, Manufacturing, Information
Management of Co, Enterprises, Educational Services, Arts and Entertainment.
ECONOMIC
GROSS DOMESTIC PRODUCT- GDP
$226 BILLION
THAT IS
26%
OF THE STATE OF FLORIDA’S OUTPUT AND
1.4%
OF US’S GDP IN 2014
SOUTH FLORIDA’S EMPLOYMENT EXPECTED
GROWTH (2014-2022)
1.4%
UNEMPLOYMENT RATE
5.5%
MALE
49%
FEMALE
51%

24%
20%41%
15%
AGE
≤ 19
20-34
35-64
Over 65
HOUSING
HOUSING UNITS
2010/2016
810/823
THOUSAND
OWNER OCCUPIED
63.5%
RENTER OCCUPIED
36.5% HOUSEHOLDS LIVING
BELOW ALICE
THRESHOLD
44%
ECONOMIC
GROSS DOMESTIC PRODUCT- GDP
$89 BILLION
THAT IS
10.3%
OF THE STATE OF FLORIDA’S OUTPUT AND
39.2%
OF THE REGION’S OUTPUT IN 2014
PER CAPITA INCOME IN 2015
$28,381
UNEMPLOYMENT RATE, JUNE 2017
4.0%
SYSTEMS
BROWARD COUNTY SCHOOL BOARD
BROWARD COLLEGE, FLORIDA ATLANTIC
UNIVERSITY, NOVA SOUTHEASTERN
UNIVERSITY
HOLLYWOOD/FT LAUDERDALE
INTERNATIONAL AIRPORT
PORT EVERGLADES
BROWARD COUNTY TRANSIT, TRI-RAIL
SAWGRASS EXPRESSWAY
INTERSTATE 75, INTERSTATE 595
BROWARD CENTER FOR THE PERFORMING
ARTS, HOLLYWOOD CENTRAL PERFORMING
ARTS CENTER
HUGH TAYLOR BIRCH & DR. VON D.
MIZELL-EULA JOHNSON STATE PARKS
POPULATION
31 MUNICIPALITIES
2016 ESTIMATE
1.85 MILLION
2030 ESTIMATE
2.1 MILLION
GROWTH RATE 2000-2015/2015-2030
12.6%/15.9%
MEDIAN AGE
40.3
MALE
49%
FEMALE
51%
EDUCATIONAL ATTAINMENT, POPULATION OVER 25
BACHELOR’S DEGREE OR HIGHER: 30.8% HIGH SCHOOL DIPLOMA OR SOME COLLEGE: 57.4%
LESS THAN HIGH SCHOOL DIPLOMA: 11.8%
FOREIGN BORN
50.9%
US BORN
49.1 %
OUT OF
497
THOUSAND
HISPANIC/
LATINO
POPULATION
INDUSTRY STRUCTURE %, 2015

23%
21%41%
15%
AGE
≤ 19
20-34
35-64
Over 65
HOUSING
HOUSING UNITS
2010/2016
989
THOUSAND/1.02
MILLION
OWNER OCCUPIED
53.8%
RENTER OCCUPIED
46.2% HOUSEHOLDS LIVING
BELOW ALICE
THRESHOLD
55-61%
ECONOMIC
GROSS DOMESTIC PRODUCT- GDP
$133 BILLION
THAT IS
15.4%
OF THE STATE OF FLORIDA’S OUTPUT AND
59.0%
OF THE REGION’S OUTPUT IN 2014
PER CAPITA INCOME IN 2015
$23,850
UNEMPLOYMENT RATE, JUNE 2017
4.9%
POPULATION
35 MUNICIPALITIES
2016 ESTIMATE
2.7 MILLION
2030 ESTIMATE
3.2 MILLION
GROWTH RATE 2000-2015/2015-2030
17.7%/21.3%
MEDIAN AGE
39.9
MALE
48%
FEMALE
52%
EDUCATIONAL ATTAINMENT, POPULATION OVER 25
BACHELOR’S DEGREE OR HIGHER: 26.9% HIGH SCHOOL DIPLOMA OR SOME COLLEGE: 53.2%
LESS THAN HIGH SCHOOL DIPLOMA: 19.9%
FOREIGN BORN
65.0%
US BORN
35.0 %
OUT OF
1.73
MILLION
HISPANIC/
LATINO
POPULATION
INDUSTRY STRUCTURE %, 2015
SYSTEMS
MIAMI-DADE COUNTY SCHOOL BOARD
FLORIDA INTERNATIONAL UNIVERSITY,
MIAMI-DADE COLLEGE
UNIVERSITY OF MIAMI, BARRY UNIVERSITY,
ST THOMAS UNIVERSITY, MIAMI
INTERNATIONAL AIRPORT, PORT MIAMI
MIAMI-DADE COUNTY TRANSIT, TRI-RAIL
DOLPHIN EXPRESSWAY, INTERSTATE 95,
INTERSTATE 195, PALMETTO EXPRESSWAY
ADRIENNE ARSHT CENTER FOR THE
PERFORMING ARTS, NEW WORLD CENTER,
AND MANY MORE
OLETA RIVER, BILL BAGGS CAPE FLORIDA,
THE BARNACLE STATE PARKS
BISCAYNE & EVERGLADES NATIONAL PARKS

17%
17%
46%
20%
AGE
≤ 19
20-34
35-64
Over 65
HOUSING
HOUSING UNITS
2010/2016
52.7/53.1
THOUSAND
OWNER OCCUPIED
61.0%
RENTER OCCUPIED
39.0% HOUSEHOLDS LIVING
BELOW ALICE
THRESHOLD
46%
POPULATION
5 MUNICIPALITIES
2016 ESTIMATE
76 THOUSAND
2030 ESTIMATE
77 THOUSAND
GROWTH RATE 2000-2015/2015-2030
-6.8%/3.6%
MEDIAN AGE
47.2
MALE
53% FEMALE
47%
EDUCATIONAL ATTAINMENT, POPULATION OVER 25
BACHELOR’S DEGREE OR HIGHER: 31.4% HIGH SCHOOL DIPLOMA OR SOME COLLEGE: 59.5%
LESS THAN HIGH SCHOOL DIPLOMA: 9.1%
FOREIGN BORN
47.4%
US BORN
52.6 %
OUT OF
16.7
THOUSAND
HISPANIC/
LATINO
POPULATION
INDUSTRY STRUCTURE %, 2015 ECONOMIC
GROSS DOMESTIC PRODUCT- GDP
$4 BILLION
THAT IS
0.5%
OF THE STATE OF FLORIDA’S OUTPUT AND
1.75%
OF THE REGION’S OUTPUT IN 2014
PER CAPITA INCOME IN 2015
$36,208
UNEMPLOYMENT RATE, JUNE 2017
2.8%
SYSTEMS
MONROE COUNTY SCHOOL BOARD
FLORIDA KEYS COMMUNITY COLLEGE
KEY WEST INTERNATIONAL AIRPORT
MONROE COUNTY TRANSIT
US1
THE KEY WEST THEATER, MARATHON COMMUNITY
THEATRE AND MANY MORE
FORT ZACHARY TAYLOR, JOHN PENNEKAMP CORAL
REEF, BAHIA HONDA, LIGNUMVITAE KEY
BOTANICAL, INDIAN KEY HISTORIC, FLORIDA KEYS
OVERSEAS HERITAGE TRAIL, WINDLEY KEY FOSSIL
REEF, DAGNEY JOHNSON KEY LARGO HAMMOCK
BOTANICAL, SAN PEDRO UNDERWATER
ARCHAEOLOGICAL PRESERVE, AND CURRY
HAMMOCK STATE PARKS
DRY TORTUGAS NATIONAL PARK

South Florida Comprehensive Economic Development Strategy: 2017–2022 9
SWOT ANALYSIS
In August 2017, the South Florida Regional Planning Council conducted a SWOT analysis of the region –strengths, weaknesses, opportunities, and
threats- the analysis identifies what local government staff, elected officials, and community stakeholders believe to be important in each category. This
helps guide the process to identify regional priorities for economic and community development. The 2017 SWOT Analysis had 21 respondents among
the three counties of Broward, Miami-Dade, and Monroe. The results of the SWOT are shown below.
STRENGTHS
• Higher Education student population
• #1 in startups
• Number of STEM degrees awarded and STEM pipeline starting at youth
• Gateway to Latin America
• Good weather
• Diversity of languages spoken diversity
• Airports and seaports
• NAP (Network Access Point)
• Technology-friendly ecosystem
• Regional natural resources
• Global/international cultural acceptance (“glocal”)
• Healthcare Partnerships (e.g. UMiami and Cleveland Clinic)
• Tech/life science/aviation space
WEAKNESSES
• Housing affordability (affects ability to attract/ retain talent)
• High inequality
• Perception that the region is not a business destination
• Perception that K-12 education is inadequate
• Mass transit infrastructure and networks
• Lack of access to capital (patient, venture, other)
• Limited number of tech startups (no leadership commitment)
• no commitment to coordinated environmental sustainability efforts
• Lack of coordination to address interconnected issues
• How do houses built/ purchased compare with occupancy rates?
• Intergenerational job competition
• Number of STEM degrees awarded is less than the number of STEM
jobs available
OPPORTUNITIES
• Anticipating and supporting millennials’ needs
• Leadership in climate resiliency
• Universities, use them to develop creative, problem-solving graduates
• Partnerships with business community to create internships
• Use certificates/vocational training to create jobs
• Create blended four-year degree and trade/vocational/hands-on
programs
• Marine research hubs (R&D): four institutions in the region
• Regionalism
• Systems are in place to assist students in completing various
certifications
• Linking education to relevant regional issues
• Options that create income jobs without requiring degrees,
encouragement of entrepreneurship
• Small business resiliency plans
• Resiliency officers – 100 Resilient Cities
THREATS
• Weather
• Examine development standards to meet emerging challenges
• Brain drain
• Number of STEM degrees is less than the number of STEM jobs
available
• Housing affordability/mass transit cost burden
• Funding sources
• Small businesses are not positioned to survive catastrophic events
• Economic diversification - currently very small business reliant
• Lack of fair share of federal and leveraged investment
• Mindset changes needed, a more regional approach
• Lack of infrastructure investment
• Corruption, transparency, accountability

South Florida Comprehensive Economic Development Strategy: 2017–2022 10
ACTION PLAN Goal #1: Innovation and Competitiveness
• To support programs and strategies, including international trade, which assist in the attraction, retention, and expansion of businesses, and
improve the capacity of small businesses to participate fully in South Florida’s economic activities.
• To support complementary data collection and dissemination efforts among local jurisdictions, combining data on available “ready” sites and
workforce characteristics. Encourage the development of a complete “ecosystem” of workforce training throughout the region
• To enhance the resilience of the South Florida economy in the face of natural disasters and changes to the national and state economies through
increased awareness and preparation by businesses for environmental risks.
Goal #2: Opportunity and Prosperity
• To support the development of a diversified economy by expanding the quantity and quality of job opportunities.
• To prepare a skilled workforce that supports the business community through programs and tools that address education, training and the
attraction/retention of qualified workers.
• To promote the retention and continued improvement of existing partnerships (intergovernmental, public-private, interagency, etc.), and the
creation of new partnerships to meet South Florida's economic challenges.
• To ensure that there is a superior network of public infrastructure with supportive land use regulations to maintain the region as a competitive
location for targeted industries and to provide for public safety and homeland security.
• To educate government and businesses on continuity and recovery plans and to support plan implementation in the event of natural or man-
made disasters.
• To promote a regional perspective on multi-modal transportation system for people, goods, and services that includes transit, highway, seaport,
airport, rail, broadband, and multi-use trail planning and development.
Goal #3: Vitality and Sustainability
• To promote a high quality of life and ensure a sustainable community offering an array of affordable housing, quality education and healthcare
systems, historical and cultural facilities, tourist attractions and beaches, special events, festivals, and sports.
• To promote the sustainable use of the natural resources (especially water resources and green building through sound economic development
activities consistent with environmental management goals.

South Florida Comprehensive Economic Development Strategy: 2017–2022 11
STRATEGIC DIRECTION
As South Florida continues to emerge as a globally connected metropolitan area, the EDD continues to develop robust goals with implementation action
tactics that address the CEDS goals for the next five years. While some of these threats cannot be changed -i.e. hurricanes or annual king tides-- current
weaknesses threat the quality of life of residents and business owners. These same weaknesses and threats impact the ability of these to bounce back if
catastrophic events occur or a single South Florida-reliant industry falls into decline. , the South Florida CEDS provides a strategy for resilient regional
development through the lens of the State of Florida’s Six-Pillars framework, which includes Talent Supply and Education, Innovation and Economic
Development, Infrastructure and Growth Leadership, Business Climate and Competitiveness, Civic and Governance Systems, and Quality of Life and
Quality of Place. By using this framework and incorporating each of the three counties’ comprehensive plans, the South Florida CEDS successfully
identifies existing vulnerabilities—such as critical infrastructure in flood-prone areas along the coast—and provides a plan of action for lessening the
regional economy’s exposure to hazards.
Florida Chamber Six Pillars Matrix of Congruence
Innovation & Economic Development – Economic Leadership Business Climate & Competitiveness - Smart, Quality Growth
South Florida’s prosperous economy continues to grow because of its trade infrastructure, access to global markets, business tax environment, culture
and diversity, and its entrepreneurial and talented workforce. Even so, many of the region’s residents are not fully employed or connected to the larger
economy. The region has a long tradition of entrepreneurship and small business success. What are the benefits of attracting and retaining larger
businesses and increasing interest and spending in sectors such as research and technological development? How do we define business size and what
local characteristics attract larger businesses? How do we make sure that we continue to concurrently support smaller businesses in these efforts?
Talent Supply & Education – Education
Education serves as a firm foundation on which to expand access to opportunity for all members of our community. It provides a pathway to
employment and economic opportunity, and allows individuals to explore their interests, potential, and purpose to create a higher quality of life. In
addition to strong traditional primary, secondary, institutions of higher learning, and technical and vocational schools, the opportunity for continued
education at all ages is critical in the development of quality communities and robust economies.
As a major business and tourist destination, South Florida is home to residents from all over the world who bring with them diverse skills, educational
backgrounds, culture, and experiences that contribute to the regional economy. This diversity of culture and experience can be fully tapped when
educational attainment and community engagement are priorities.
Infrastructure & Growth Leadership – Environment
Maintaining affordable housing and smart land use planning in South Florida’s communities is essential in fostering thriving families and neighborhoods.
As a primary building block of prosperity, these factors impact the entire population, from very low-income and middle-class residents, to upper-middle
class and wealthy individuals and families, especially during times of unemployment to economic downturn. Affordable housing is particularly needed
for families who pay more than 30 percent of their income for housing. In Palm Beach, Broward and Miami-Dade counties, 25 percent of households

South Florida Comprehensive Economic Development Strategy: 2017–2022 12
spend more than half of their incomes on housing costs, giving the region the second highest cost burden in the country4. To cater to the array of needs
within our communities, we must strive to provide a diverse mix of housing styles, locations, and costs.
Land use describes the ways in which we utilize, manage, and modify our built and natural environments, including urban development, agriculture,
parks, and natural ecosystems, and has an overwhelming impact on a region’s economy, sustainable growth, preservation of natural habitat, and quality
of life. Through careful examination of existing conditions and thoughtful planning for the future, South Florida can continue to prosper without
sacrificing natural resources or wastefully utilizing developed space.
Quality of Life & Quality of Place
Advancing the quality of life in South Florida’s communities is paramount in maintaining the vibrancy and vitality of the region; with proper attention to
this indicator, the region will flourish with exceptional economic development and growth opportunities. Quality of life is a broad category with many
indicators; examples include access to parks and natural areas, walkability of communities, and presence of cultural attractions, among others.
The health of our residents is equally important; recognizing the correlation between how we plan and build and the health of our communities is vital.
Ensuring access to healthcare, recreation, and healthy food are all components of planning quality metropolitan areas. Recognizing and evaluating these
factors can also assist in developing vulnerability assessments to determine areas that may need additional attention or funding.
Civic & Governance System – Fragmented Region
Demographics are statistical data about the characteristics of a population or segment of a larger population, including age, income, race, gender, etc.
These metrics provide general information about a region or community that can then be used to answer more complex questions about a population.
This section of the CEDS will serve to provide some baseline information about the communities in South Florida in generalized terms, allowing the user
to apply the information as specifically needed.
The Greater Miami Metropolitan Area is one of the largest economic hubs in the country, and as a result, significant demand is put on the region’s
transportation networks. Unlike some metropolitan regions that emanate outwards from one or more central business districts, South Florida is bordered
by the Everglades to the west and the Atlantic Ocean to the east. Interstate 95 and Florida’s Turnpike are the two major north-south arteries, like legs of
a ladder. Historically, development began along the coast and grown west over time. As population and developed areas grow, greater strain is put
upon our transportation networks and there is a need for more connections.
At present, the Tri-Rail commuter line runs regularly between West Palm Beach and Miami, and county and municipal bus lines serve communities
throughout the region. However, these systems are presently struggling to keep pace with increased population growth, traffic congestion, and a desire
for alternative methods of transit.
4 http://www.sun-sentinel.com/business/realestate/fl-housing-cost-burden-20160621-story.html

South Florida Comprehensive Economic Development Strategy: 2017–2022 13
Innovation & Competitiveness
Goals
• To support programs and strategies, including international trade, which assist in the retention, expansion and the attraction of businesses, and
improve the capacity of small businesses to participate fully in South Florida’s economic activities.
• To support complementary data collection and dissemination efforts among local jurisdictions, combining data on available “ready” sites and
workforce characteristics. Encourage the development of a complete “ecosystem” of workforce training throughout the region
• To enhance the resilience of the South Florida economy in the face of natural disasters and changes to the national and state economies through
increased awareness and preparation by businesses for environmental risks.
Objectives
• Support organizations that increase international trade, achieve a positive trade balance with partners
o Provide technical assistance to organizations such as MIA, FLL, Key West Airport and Port Miami, Port Everglades, Port Miami.
• Invest in small business training and incubators
o Support efforts by higher education institutions and others by providing technical support and support grant opportunities and the
development of venture capital.
• Coordinate activities regarding all Goals to enhance the workforce and employment opportunities
o Coordinate data sharing, communication with partners regularly to ensure that data needs are met
• Train government staff and disseminate information to the public on recovery plans and contingency actions before, during and after disasters
o Maintain informational programs, update data and prepare studies to update future information
Performance Measures
Goal Metrics 6 Pillars Correspondence Source
Goal #1: Innovation and Competitiveness
Average wages per Job Business Climate and Competitiveness US Bureau of Economic Analysis
Gross Domestic Product Business Climate and Competitiveness REMI PI+
Employment by Industry Business Climate and Competitiveness REMI PI+
Employment by Sector or Occupation Business Climate and Competitiveness REMI PI+
Average Annual Wages by Industry Business Climate and Competitiveness REMI PI+
Tourism Development Tax Collections Innovation and Economic Development FL Department of Revenue, Local Govt Tax Receipts by
County
Trade Imports and Exports Innovation and Economic Development REMI PI+
Regional Purchase Coefficient Innovation and Economic Development REMI PI+
Shift-Share Innovation and Economic Development REMI PI+
Location Quotients Innovation and Economic Development REMI PI+
Innovation Index Innovation and Economic Development http://statsamerica.org/ii2/overview.aspx

South Florida Comprehensive Economic Development Strategy: 2017–2022 14
Opportunity & Prosperity
Goals
• To support the development of a diversified economy by expanding the quantity and quality of job opportunities.
• To prepare a skilled workforce that supports the business community through programs and tools that address education, training and the
attraction/retention of qualified workers.
• To promote the retention and continued improvement of existing partnerships (intergovernmental, public-private, interagency, etc.), and the
creation of new partnerships to meet South Florida's economic challenges.
• To ensure that there is a superior network of public infrastructure with supportive land use regulations to maintain the region as a competitive
location for targeted industries and to provide for public safety and homeland security.
• To educate government and businesses on continuity and recovery plans and to support plan implementation in the event of natural or man-
made disasters.
• To promote a regional perspective on multi-modal transportation system for people, goods, and services that includes transit, highway, seaport,
airport, rail, broadband, and multi-use trail planning and development. (Pillar 3)
Objectives
• Invest in STEM education, showing gains in total graduates in each higher education class
o Recruit top-notch faculty to higher education institutions, market the region to relocating firms
• Invest in apprenticeship programs to enhance the workforce
o Support organizations such as AmSkills in identifying the program’s impacts on the workforce
• Strengthen partnerships with existing regional organizations, look for opportunities for joint projects
o Host regional roundtables around topics of mutual interest
• Invest in public infrastructure and retain industrial and developable parcels
o Conduct regional land use inventories
• Train government staff and disseminate information on plans and contingency actions before, during and after disasters
o Maintain informational programs, update data and prepare studies to update future information
• Consider alternatives to projects that discourage multi-modalism, accounting for all users of the system
o Encourage widespread use of design charrettes and other venues for public input into project development
Performance Measures
Goal #2: Opportunity and Prosperity
High School Graduation Rates Talent Supply and Education FL Dept. of Education, Data Publications and Reports:
Students
Population Counts, Estimates, and Projections Talent Supply and Education BEBR, FL Statistical Abstract
Annual Building Permits Infrastructure and Growth Leadership
Daily Vehicle Miles Traveled Infrastructure and Growth Leadership FDOT, FL Highway Mileage and Travel Report, Summary
since 1990
Average Annual Unemployment Rates Talent Supply and Education Florida Department of Economic Opportunity Local Area
Unemployment Statistics
Employment by Industry Talent Supply and Education REMI PI+

South Florida Comprehensive Economic Development Strategy: 2017–2022 15
Employment by Sector or Occupation Talent Supply and Education REMI PI+
Average Annual Wages by Industry Talent Supply and Education REMI PI+
Vitality & Sustainability
Goals
• To promote a high quality of life and ensure a sustainable community offering an array of affordable housing, quality education and health care
systems, historical and cultural facilities, tourist attractions and beaches, special events, festivals, and sports. (Pillar 6)
• To promote the sustainable use of the natural resources (especially water resources and green building through sound economic development
activities consistent with environmental management goals. (Pillar 6)
Objectives
• Support local decision makers with regular data updates
o Prepare annual data updates of the CEDS document, assist other organizations with data as needed
• Maintain best practices regarding the natural environment and its interactions with the built environment
o Maintain ongoing monitoring programs and prepare studies that shed light on ongoing activities on regional natural resources
Performance Measures
Goal #3: Vitality and Sustainability
Registered 501©3 Organizations Public and Private
Foundation Charities
Civic and Governance System
Quality of Life and Quality of Places
Internal Revenue Service, Exempt Business Master File,
501c3 Charities, The Urban Institute, National Center
for Charitable Statistics
Real Personal Pet Capita Income Quality of Life and Quality of Places REMI PI+
Relative Housing Price Quality of Life and Quality of Places REMI PI+
Percent of persons Living in Poverty Quality of Life and Quality of Places US Census
EVALUATION FRAMEWORK
The evaluation framework identifies the metrics used and which
pillar the metric is related to. These metrics will be updated
periodically to monitor progress on the goals and objectives
they intend to ensure are being achieved.
Innovation and Competitiveness
•Innovation and Economic Development, Business Climate and Competitiveness
Opportunity and Prosperity
•Talent Supply and Education, Infrastructure and Growth Leadership
Vitality and Sustainability
•Quality of Life and Quality of Places' Civic and Governance System

South Florida Comprehensive Economic Development Strategy: 2017–2022 16
Goal Metrics 6 Pillars Correspondence Source
Goal #1: Innovation and Competitiveness
Average wages per Job Business Climate and Competitiveness US Bureau of Economic Analysis
Gross Domestic Product Business Climate and Competitiveness REMI PI+
Employment by Industry Business Climate and Competitiveness REMI PI+
Employment by Sector or Occupation Business Climate and Competitiveness REMI PI+
Average Annual Wages by Industry Business Climate and Competitiveness REMI PI+
Tourism Development Tax Collections Innovation and Economic Development FL Department of Revenue, Local Govt Tax Receipts by
County
Trade Imports and Exports Innovation and Economic Development REMI PI+
Regional Purchase Coefficient Innovation and Economic Development REMI PI+
Shift-Share Innovation and Economic Development REMI PI+
Location Quotients Innovation and Economic Development REMI PI+
Innovation Index Innovation and Economic Development http://statsamerica.org/ii2/overview.aspx
Goal #2: Opportunity and Prosperity
High School Graduation Rates Talent Supply and Education FL Dept. of Education, Data Publications and Reports:
Students
Population Counts, Estimates, and Projections Talent Supply and Education BEBR, FL Statistical Abstract
Annual Building Permits Infrastructure and Growth Leadership
Daily Vehicle Miles Traveled Infrastructure and Growth Leadership FDOT, FL Highway Mileage and Travel Report, Summary
since 1990
Average Annual Unemployment Rates Talent Supply and Education Florida Department of Economic Opportunity Local Area
Unemployment Statistics
Employment by Industry Talent Supply and Education REMI PI+
Employment by Sector or Occupation Talent Supply and Education REMI PI+
Average Annual Wages by Industry Talent Supply and Education REMI PI+
Goal #3: Vitality and Sustainability
Registered 501©3 Organizations Public and
Private Foundation Charities
Civic and Governance System
Quality of Life and Quality of Places
Internal Revenue Service, Exempt Business Master File,
501c3 Charities, The Urban Institute, National Center for
Charitable Statistics
Real Personal Pet Capita Income Quality of Life and Quality of Places REMI PI+
Relative Housing Price Quality of Life and Quality of Places REMI PI+
Percent of persons Living in Poverty Quality of Life and Quality of Places US Census

South Florida Comprehensive Economic Development Strategy: 2017–2022 17
ECONOMIC RESILENCE EDA has expanded the range of topics that Districts must consider in their CEDS to include resiliency in the economy. Resiliency takes on many forms
but its critical definition entails how flexible and ‘tough’ a region’s economy is under adverse conditions. As with the relatively quick recovery from the
2008 recession, the South Florida economy produces a wide enough range of services and goods that any one event is unlikely to inflict unrecoverable
damage in the event of an environmental disaster. However, there many potential risks that require more attention to the issue in the South Florida
CEDS.
What is Economic Resiliency?
A resilient economy is one where pre-existing economic conditions or vulnerability to natural disasters does not create a situation where a major adverse
event can cause irreversible damage. For example, New Orleans is a city that has not yet recovered from Hurricane Katrina and. The reasons why New
Orleans has not returned to its pre-hurricane population are manifold, but an economy that is over-dependent upon tourism, where a significant share
of its displaced population lacked transportation access, skills and personal resources to return to the city and rebuild are fundamental causes in the
city’s overall population decline since 2006. More recently, South Florida will take time to recover from Hurricane Irma. They Florida Keys are also heavily
reliant on the tourism industry, therefore any displaced workforce with little or no safety net or resources will take time to return.
Facing the Atlantic Ocean and susceptible to hurricanes and flooding events, the South Florida Area shares some of the characteristics of an
environmentally vulnerable region. As such, the region could face devastating damage should a powerful hurricane score a direct hit on the area.
Regions reliant on a single industry are vulnerable to high stress when faced with changes.
A resilient economy is one that is based upon well managed infrastructure, functioning insurance markets and capable emergency response measures as
key elements of a region’s ability to recover from natural disaster. But there are specifically economic characteristics of resiliency. A resilient economy is
one which can withstand long-term changes to industry, can manage the impacts of disaster through a combination of self-supply of key goods and
with access to key goods when self-supply sources are limited by circumstances.
Generally, EDA identifies three primary attributes of a resilient economy: the ability to recover quickly from a shock, the ability to withstand a shock, and
the ability to avoid the shock altogether.
As such, economic resiliency should be characterized by:
• Widespread knowledge of how to respond to emergency situations
• A flexible intellectual and creative economic base that can respond to long term economic trends
• A highly-trained workforce that can retrain to other industries
• A broad range of robust industries that are independent of each other
• Adequate transportation and communication infrastructure that can adapt to temporary changes in the supply chain

South Florida Comprehensive Economic Development Strategy: 2017–2022 18
Supporting economic resiliency in a CEDS context
The CEDS establishes a process to bring public and private stakeholders together to plan for economic resilience by identifying the issues, setting goals
and actionable responses. As EDA notes on its website5, these actionable responses include (regional responses are in blue):
1. Undertaking efforts to broaden the industrial base with diversification initiatives, such as targeting the development of emerging clusters or
industries that (a) build on the region’s unique assets and competitive strengths; and (b) provide stability during downturns that
disproportionately impact any single cluster or industry;
a. Undertaken by South Florida Economic Development Organizations
2. Adapting business retention and expansion programs (e.g., economic gardening or other enterprise supports) to assist firms with economic
recovery post-disruption;
a. Undertaken by South Florida Economic Development Organizations
3. Building a resilient workforce that can better shift between jobs or industries when their core employment is threatened through job-driven skills
strategies and support organizations;
a. Undertaken by South Florida Economic Development Organizations
4. Maintaining geographic information systems (GIS) that link with municipal business licenses, tax information, and other business establishment
data bases to track local and regional “churn” and available development sites. GIS can also be integrated with hazard information to make rapid
post-incident impact assessments;
a. Partly undertaken by South Florida Economic Development Organizations and the South Florida Regional Planning Council
5. Ensuring redundancy in telecommunications and broadband networks to protect commerce and public safety in the event of natural or
manmade disasters;
a. Emergency Services
6. Promoting business continuity and preparedness (i.e., ensuring businesses understand their vulnerabilities—including supply chains—in the face
of disruptions and are prepared to take actions to resume operations after an event);
a. Promoted by utilities and the South Florida Regional Planning Council
7. Employing safe development practices in business districts and surrounding communities. Strategies may include locating structures outside of
floodplains, preserving natural lands that act as buffers from storms, and protecting downtowns and other existing development from the
impacts of extreme weather.
a. Local government responsibility, varying levels of success
8. Conducting pre-disaster recovery planning to define key stakeholders, roles, responsibilities, and key actions;
a. South Florida Regional Planning Council
5 https://www.eda.gov/ceds/content/economic-resilience.htm

South Florida Comprehensive Economic Development Strategy: 2017–2022 19
RESILIENCY IN SOUTH FLORIDA
Key Strategies for Success:
• Continue to engage with local, state, and federal entities to advance regional adaptive capacity through climate change and sea-level rise
planning initiatives, including the use of funding prioritization tools, vulnerability assessment trainings, and inter-agency and inter-governmental
coordination.
• Improve communication and outreach with the general public and business communities via coordinated education campaigns that focus on
environmental conservation, natural disaster emergency preparedness, and local sustainability initiatives.
• 3)Dissemination of current data, support for ongoing local monitoring, and incorporation of up-to-date projections
Climate Change and Natural Disasters: South Florida Regional Planning Council (South Florida Economic Development District)
Recognizing their heightened vulnerability to natural hazards and economic downturns, the South Florida Regional Planning Council (SFRPC) was one of
the first organizations to effectively and comprehensively integrate resilience into their Comprehensive Economic Development Strategy (CEDS). For the
three counties within the SFRPC region—Monroe, Miami-Dade, and Broward—long-term economic competitiveness is directly tied to their ability to
balance growth and development with the opportunities and limitations posed by both natural and manmade hazards.
Southeast Florida is expected to experience 3–7 inches of sea level
rise by 2030 and 9–24 inches by 2060.6 With an increasing
frequency of flooding at high tide and salt water intrusion into the
Biscayne Aquifer during droughts, the effects of rising sea levels are
already being felt throughout the region.7 In addition to this
looming threat, the danger of hurricanes also holds the potential
for substantial economic disruption on an annual basis. When
combined with the fact that the regional economy has been
historically reliant on tourism and growth-related industries that are
more susceptible to economic instability, there is a clear need to
diversify the region’s economy and institutionalize the concept of
resiliency.
To ease the burden that these risks place on residents, business
owners, and potential private investors, the South Florida CEDS provides a strategy for resilient regional development through the lens of the State of
Florida’s Six-Pillars framework, which includes Talent Supply and Education, Innovation and Economic Development, Infrastructure and Growth
Leadership, Business Climate and Competitiveness, Civic and Governance Systems, and Quality of Life and Quality of Place. By using this framework and
incorporating each of the three counties’ comprehensive plans, the South Florida CEDS successfully identifies existing vulnerabilities—such as critical
infrastructure in flood-prone areas along the coast—and provides a plan of action for lessening the regional economy’s exposure to hazards. Examples
6 http://www.nado.org/wp-content/uploads/2014/08/FL-South-Florida-Regional-Planning-Council-2012-2017.pdf p. 58 7 http://www.nado.org/wp-content/uploads/2014/08/FL-South-Florida-Regional-Planning-Council-2012-2017.pdf p. 58
Figure 1: USACE relative sea-level change projections, Miami Beach. 1992 as baseline year.

South Florida Comprehensive Economic Development Strategy: 2017–2022 20
of these recommendations include ensuring that public infrastructure investments are made in locations that are most likely to be viable for at least the
expected life of the project, fostering economic diversity by nurturing emerging industries and entrepreneurial ventures, and supporting comprehensive
emergency management planning to enhance preparedness and continuity in the face of disruptions.8
DATA TABLES AND REGIONAL FACTS Population Trends
Continued Growth
The Region is home to 4.67 million people, a population larger than 26 individual states.9 This is an 8.05% increase represents from 4.32 million in 2010.
This growth in population can be attributed to net international migration, natural growth, and domestic migration.
South Florida’s population is highly mobile, combining a large influx of
international migration with large intra-regional shifts and a significant
number of domestic migrants. Although the Region’s population is still
slightly older than the rest of the nation, having been a popular
retirement destination for decades, it is getting older more slowly now
because of a reduction in the number of new retirees arriving, a higher
rate of natural increase of the population (births minus deaths), and
continued international migration.
Population growth rates fell significantly in South Florida during the
first decade of this century (only 9.1% for the entire decade, down from
21.0% in the decade before), mostly in response to the global recession,
beginning in 2007. During the first half of the current decade, South
Florida resumed growth, at almost twice the pace of the nation as a
whole—the Region’s population grew by 8.1%, compared to 7.8% for
the State of Florida and only 4.1% for the U.S. Between 2015 and 2030,
South Florida is projected to add a net ~140 residents per day, which
would represent an increase of over 780,000 people (see Figure 1). For
the Region, that represents an increase of ~18.5%, compared to the
State of Florida’s projected growth of 21.5% and the U.S. pace of 11.6%.
Miami-Dade County is expected to lead South Florida’s growth, with an
~21% increase between 2015 and 2030, followed by Broward County
(~16%); Monroe County’s permanent resident population is projected to remain essentially unchanged (~0.5%).
8 http://www.nado.org/wp-content/uploads/2014/08/FL-South-Florida-Regional-Planning-Council-2012-2017.pdf p 11 and p? 9 ACS data is published every year. 2016 U.S. Census data shows the region is home to 4.6 million people.
2010 2015 2020 2025 2030 2035 2040 2045
Broward 1,748,0 1,854,5 1,940,7 2,038,4 2,117,2 2,182,2 2,237,8 2,290,8
Miami Dade 2,496,4 2,700,7 2,861,3 3,048,6 3,220,0 3,374,2 3,515,7 3,642,7
Monroe County 73,090 76,047 76,223 76,458 76,943 77,227 77,122 76,968
SF Region 4,317,6 4,631,3 4,878,3 5,163,5 5,414,1 5,633,7 5,830,7 6,010,5
0
1,000
2,000
3,000
4,000
5,000
6,000
7,000
Po
pu
lati
on
Tho
usa
nd
s
Population Projections by Geography: 2010–2045
Figure 2: Population projections by geography in South Florida, 2010 U.S. Census Bureau, 2015 5-year ACS Estimates, and BEBR Projections June 2016

South Florida Comprehensive Economic Development Strategy: 2017–2022 21
South Florida's population is slightly older than the rest of the nation, but
younger than the rest of the State of Florida. The Region’s median age in
2015 was 40.1, compared to 41.8 in the State of Florida and the national
average of 37.8. The median was higher in Monroe (47.2), but lower in
Miami-Dade (39.9) and Broward (40.3).
Diversity and Mobility
International migration, domestic migration and natural increase all
contribute to population growth in South Florida. During the first half of the
current decade, the Region absorbed almost 348,000 new residents, of which
over 80% arrived as international migrants10. Natural increase (the excess of
births over deaths) contributed 100,000 new residents. In contrast, the Region
lost approximately 47,000 residents to net domestic out-migration (includes
foreign-born and native). In 2015, 44% of the Region’s residents were born
abroad, up from 26% in 1980 (see Figure 2). The flow of migrants in and out
of the Region contributes to the exceptional diversity in the cultural, as well
as ethnic and
racial, composition of South Florida's population.
Place of Birth
Native 55.76% and Foreign Born 44.23%. Of the native population, 59% were born Florida,
35% born in another state, and 6% born abroad. Median age of residents born in the Florida
is 20. Of those born in other state the median age is 51. For foreign born the median age is
48.
Of foreign born, 75% are from Latin America (Central and South America, Mexico, and the
Caribbean), and increase from 66% in 1990. Most of those from Latin American hail from the
Caribbean.11 Of foreign born South Florida residents, ~55% entered the country prior to the
year 2000.
10 U.S. Bureau of the Census, Population Estimates, July 1, 2015 (March 2016; http://www.census.gov/programs-surveys/popest/data/data-sets.2015.html) 11 http://www.migrationpolicy.org/data/state-profiles/state/demographics/FL
0%
10%
20%
30%
40%
50%
60%
70%
80%
90%
100%
Monroe Miami-Dade Broward South Florida Florida US
Foreign born
Native, born outside the US
Born in other state in the US
Born in state of residence
Figure 3: Florida in-migration, 2010-2014. Source: Wang and Rayer, 2016.
Figure 4: Place of origin by geography, 2015 5-year ACS estimates.

South Florida Comprehensive Economic Development Strategy: 2017–2022 22
Age & Diversity
.
Median Age
Broward Miami-Dade Monroe
40.3 39.9 47.2 Table S0101, 2015 ACS 5-year estimates
0%
20%
40%
60%
80%
100%
Broward Miami-Dade Monroe South Florida
Race/Ethnicity by Geography
White, non-Hispanic Black/African American, non-Hispanic
Other or multiracial non-Hispanic Hispanic of any race
49% 48% 53%
51% 52% 47%
0%
20%
40%
60%
80%
100%
Broward Miami-Dade Monroe
Sex Ratio by County
Male Female
Figure 5: Table B01001, 2015 ACS 5-year estimates.
Figure 7: Table B03002, 2015 ACS 5-year estimates.
0% 10% 20% 30% 40% 50%
Monroe
Miami-Dade
Broward
South Florida Age: General Breakdown
≥65 35-64 20-34 <20
Figure 6. Table S0101, 2015 ACS 5-year estimates.

South Florida Comprehensive Economic Development Strategy: 2017–2022 23
Education
Educational Attainment
Institutions of Higher Learning
Ordered by total enrollment:
• Miami-Dade College – MDC has eight campuses and is one of the largest colleges in the country, and has awarded hundreds of thousands of
degrees since it’s opening in 1960
• Florida International University – founded in 1942, FIU is a research university that is part of the State University System of Florida and offers a
variety of undergraduate and graduate degree programs, including business administration, engineering and architecture, law, and medicine
• Broward College – Broward College, established in 1959, is part of the Florida College System, offering associates and bachelor’s degrees in the
social sciences, liberal arts, and STEM fields
• Florida Atlantic University – FAU is a research university, established in 1961, belonging to the State University System of Florida
• Nova Southeastern University – NSU is a private, non-profit research university offering over 150 undergraduate, graduate, and professional
programs, specializing in medicine, law, business, education, pharmacy, dentistry, and more
• Keiser University – KU is a private, non-profit university catering particularly to adult learners; KU specializes in STEM and healthcare fields
• University of Miami – UM is a private research university, recently ranked among the top universities in the country by U.S. News & World Report
16%
55%
29%
South Florida Educational Attainment:
Population Over 25
Less than high school diploma
High school diploma or some college
Bachelors degree or higher
0% 10% 20% 30% 40% 50% 60% 70%
Broward
Miami-Dade
Monroe
Educational Attainment by County: Population Over 25
Less than high school
High school diploma or equivalency, some college, or associates degree
Bachelors or higher
Figure 9: Table S1501, 2015 ACS 5-year estimates. Figure 8:Table S1501, 2015 ACS 5-year estimates.

South Florida Comprehensive Economic Development Strategy: 2017–2022 24
Industry Location Quotient and Brain Drain
A location quotient (LQ) analysis quantifies how concentrated specific
industries or sectors are in a given region when compared to the
nation. An LQ can be useful in determining both what makes a
region unique, and where shortcomings exist.
South Florida has a high concentration in several median to high-
paying job sectors: Wholesale Trade, Transportation, Financial and
Insurance Services, and Professional and Technical Services sector,
and compares well to the rest of the nation. On the other hand,
South Florida has a higher concentration of low-paying job sectors
than the nation: Real Estate, Rental, and Leasing; Other Services; and
Administrative, Support and Waste Services. Additionally, South
Florida has as a much lower concentration of very high-paying job
sectors, such as Utilities and Management of Companies and
Enterprises.
According to a July 2012 study by the Georgetown University Center
on Education and the Workforce, there is an inherent relationship
between educational investment, increasing the share of jobs that
require postsecondary talent, and brain drain. Slow and consistent
increases in state postsecondary attainment can attract high-value-
added industries over the long term. However, in the short term,
available jobs determine the demand for postsecondary training,
talent and skill.
Increasing postsecondary attainment without sufficiently increasing the jobs that require advanced talent simply furthers the brain drain into states
where college-level and higher-skilled jobs are available. While individual State residents will benefit from increased investment in higher education, the
community or the regional economy will not reap the full benefit of the investment in higher education. Conversely, where a region succeeds in
economic development and the creation of higher skilled jobs but fails to invest in education, successful economic development may not translate into
opportunities for residents as the good jobs will tend to go to those educated elsewhere.12
12 Carnevale, Anthony; Smith, Nicole. Georgetown Public Policy Institute, Center on Education and the Workforce “A Decade Behind: BREAKING OUT of the LOW-SKILL TRAP in the
SOUTHERN ECONOMY.” July 2012; https://cew.georgetown.edu/cew-reports/a-decade-behind/
0.00 0.50 1.00 1.50 2.00
Mining
Manufacturing
Forestry, Fishing, Other
Utilities
Mgmt of Co, Enterprises
Construction
Arts, Enter, Rec
Health Care, Social Asst
Information
Educational Services
Prof, Tech Services
Retail Trade
Finance, Insurance
Accom, Food Services
Admin, Waste Services
Other Services (excl Gov)
Transp, Warehousing
Wholesale Trade
Real Estate, Rental, Leasing
Location Quotients for Private Industry Sectors in South Florida (2014)
Figure 10: LQs for private industry sectors, based on REMI Policy Insight Plus data, derived from Bureau of Economic Analysis, U.S. Department of Commerce

South Florida Comprehensive Economic Development Strategy: 2017–2022 25
Employment
South Florida’s labor force was 2.4 million in 2016; the labor force at the state and national levels was 9.8 million and 159.2 million, respectively. The
Region’s economy lost over 226,000 jobs between 2008 and 2010, but gradually recovered, adding more than 302,000 in the following six years. South
Florida’s average annual unemployment rates, which hit a historic low of 2.9% in 2006, rising through 2010 due to the Great Recession, then falling to
5.0% in 2016 and 4.0% in 2017.
The Region’s labor force participation rate in 2010 was about 64.0%,
compared to 60.4% for the State of Florida and 64.4% for the nation—
Broward County led the Region with a rate of 68.0%. Labor force
participation rates in 2016 were 65.4% in Broward, 61.7% in Miami-Dade,
and 65.4% in Monroe.
Some economists argue that the labor force participation rate is a better
measure of the state of the job market because the unemployment rate
does not factor in individuals that have left the “labor force” due to the
inability to find a job.13 Labor force participation is better measure of
engagement with the job market. In 2016, rates for the South Florida
Region were slightly higher than for both the national (63.1%) and the
State of Florida (58.2%). It’s important to note that the lower rates for the
State may be due to a higher percentage of retired individuals for the
State than for the South Florida Region.
13 http://www.pewresearch.org/fact-tank/2017/03/07/employment-vs-unemployment-different-stories-from-the-jobs-numbers/
0.0%
2.0%
4.0%
6.0%
8.0%
10.0%
12.0%
14.0%
2006 2007 2008 2009 2010 2011 2012 2013 2014 2015 2016 2017
Unemployment Rate by County, 2006–2017
Broward Miami-Dade MonroeFigure 11: BLS LAUS data, 2006–2007

South Florida Comprehensive Economic Development Strategy: 2017–2022 26
Equity
Income
While wages have gradually increased over the last several years in South Florida,
when adjusted for inflation, those numbers are relatively stagnant. In some areas,
real median household income has fallen by roughly 10% since 2007.
Due in part to an exodus of middle-income jobs during the Great Recession, several
independent reports have found South Florida, particularly Miami, to have one of
the highest income inequalities of large metropolitan areas in the country.14
Additionally, the Region ranks towards the top of lists ranking the gap between
wages and housing costs.
14 Bloomberg: https://www.bloomberg.com/news/articles/2016-10-05/miami-is-the-newly-crowned-most-unequal-city-in-the-u-s
The Brookings Institute: https://www.brookings.edu/research/some-cities-are-still-more-unequal-than-others-an-update/
Average Weekly Wage Increases, 2012-2016
Broward Miami-Dade Monroe
Quarterly Increase
$5.70 $5.57 $2.75
Annual Increase
$22.79 $22.28 $10.99
Figure 13: BLS Quarterly Census of Employment and Wages, 2012–2016
m = $5.6965
m = $5.5702
m = $2.7474
$600
$650
$700
$750
$800
$850
$900
$950
$1,000
$1,050
$1,100
2012 2013 2014 2015 2016
Average Weekly Wages by County, 2012-16
Broward Miami-Dade Monroe
Linear (Broward) Linear (Miami-Dade) Linear (Monroe)
Figure 12: Average weekly wages by county in Florida, 2016. Source: US Bureau of Labor Statistics.
Figure 14: Average weekly wage increases from 2012–2017. Source: US Bureau of Labor Statistics.

South Florida Comprehensive Economic Development Strategy: 2017–2022 27
According to the U.S Census Bureau, the median household income in the U.S. is
$55,775; the median household income in Florida is $49,426.15 Both Broward and
Monroe Counties’ median household income values are within 5% of the national
median, and are above the median for the State of Florida. Miami-Dade’s median
household income was more than 20% lower than the national median and more than
10% lower than the State median at the time this data was collected.
The image to the right display variations in median household income since the Great
Recession. Inflation adjusted median household incomes continued to fall in the Region
through 2011, and largely remained stagnant through 2013. Median household incomes
began to rise in 2014 and 2015, however have still not returned to pre-recession values
when adjusted for inflation.
15 U.S. Census Bureau, 2015 5-year ACS estimates.
South Florida Income
Broward Miami-Dade Monroe
Per Capita Income
$28,381 $23,850 $36,208
Median Household Income
$53,926 $43,786 $57,290
Figure 15: Table B19301, 2015 ACS 5-year estimates.
South Florida Income
sfregionalcouncil.org/CEDS_Visualized
Broward County: Change in Medium Household Income
U.S. Census Bureau, American Community Survey
All income values used were adjusted to 2015 dollars
Credit: Yiran Zhu, Sun Sentinel, 2016
Miami-Dade County: Change in Median Household Income
U.S. Census Bureau, American Community Survey
All income values used were adjusted to 2015 dollars
Credit: Yiran Zhu, Sun Sentinel, 2016

South Florida Comprehensive Economic Development Strategy: 2017–2022 28
Poverty
The US Census Bureau calculates the official measure of
poverty by comparing a household’s income and the
characteristics of the people within the household to an
inflation-adjusted threshold. In 2017, for a household
comprised of two adults and two children, that threshold
nationwide is $24,339.
Because in many cases this is an overly simplified metric,
the Census Bureau has released an additional report, the
Supplemental Poverty Measure (SPM), since 2010. This
metric takes additional cost of living variables into
consideration (utilities, clothing costs, etc.), and reflects how
the cost of these variables vary with geography. Because of
cost of living fluctuates with geography, the SPM threshold
fluctuates spatially. This is shown in Figure 16; in regions
where the cost of living is generally higher, the poverty
threshold is set higher. While the official threshold of
poverty may be applicable in much of the county, it is likely
set too low for South Florida, where the threshold is
between $27,500 and $29,999. This indicates that many
more households are struggling than what is reported in the
standard measure of poverty.
Poverty in South Florida Region
Broward % Miami-Dade % Monroe % People in Poverty in the 3-County Region SFRPC % U.S. %
13.9% 20.0% 13.4% 805,884 17.9% 15.5%
Figure 17: Table S1701, 2015 5-year ACS
Figure 16: US Census Bureau, 2015 ACS 5-Year estimates.

South Florida Comprehensive Economic Development Strategy: 2017–2022 29
Housing and Vehicle Access
The majority of occupied housing units (~58%) in South Florida are owned
by a member that lives in the unit; the rate in Miami-Dade (54%) is lower
than both Broward (64%) and Monroe (61%). This is typical at the national
level, as more Americans are renting rather than buying home. This is
particularly true in large cities; whereas of 2015, 52 of the 100 largest cities
in the U.S. were majority renter.16 This is a somewhat recent trend in many
of these cities, beginning around the time of the 2008 recession.
Housing Cost Burden
A lack of affordable housing has long been a concern in South Florida, as
the gap between housing costs and median incomes is one of the largest
in the county. According to a newly released report by Harvard’s Joint
Center for Housing Studies, ~60% of renting households are cost burdened
in the South Florida region, meaning more than 30% of their income is
spent on housing; 30–35% are severely cost burdened, spending more than
50% of their income on housing. While these percentages are lower for
homeowners, the rate of cost-burdened households in South Florida is still
one of the highest in the country.
Vehicles Available and Commuting
Between 8–12% of households in Broward, Miami-Dade, and Monroe
Counties are without vehicles, which is right around the national average.
The reasons a household may be without a vehicle vary, including financial
constraints or preferential use of other means of transportation (public
transit, carpooling, bicycling, or walking).
16 Source: https://www.bloomberg.com/news/articles/2017-03-23/renters-now-rule-half-of-u-s-cities
Regional Housing Stock in Units
Broward Miami-Dade Monroe Total
814,454 998,833 52,913 1,866,200
Figure 18: Table B25001, 2015 ACS 5-year estimates.
64%54%
61%
36%46%
39%
0%
10%
20%
30%
40%
50%
60%
70%
80%
90%
100%
Broward Miami-Dade Monroe
Housing Tenure by County: Occupied Housing Units
% Owner % Renter
43.0% 43.3% 46.1%
20.5% 24.7%10.9%
36.5% 32.0%43.0%
0%
20%
40%
60%
80%
100%
Broward Miami-Dade Monroe
Married, Unmarried, and Nonfamily Households
Married Family Households Other Family Households Nonfamily Households
Figure 19: Table B25001, 2015 ACS 5-year estimates.
Figure 20:Table S2501, 2015 ACS 5-year estimates.

South Florida Comprehensive Economic Development Strategy: 2017–2022 30
ALICE Index
The ALICE Index, which stands for Asset Limited, Income Constrained, and Employed provides a different view of financial burden than the official
measure of poverty as issues by the Census Bureau. The developer of the index, United Way, describes ALICE as representing “those who work hard and
are above the poverty line, but due to high costs and factors often beyond their control, must live paycheck to paycheck.” Their most recent 2017 report,
unexpected expenses like car repairs or routine healthcare costs can “plunge” working families into financial chaos.
Figure 22: Broward County, United Way 2017 ALICE Report
Figure 21: Miami Dade County, United Way 2017 ALICE Report
Figure 23: Monroe County, United Way 2017 ALICE Report
Broward County
44% of households in Broward
County are below the ALICE
threshold.
According to the 2017 report, few
families in the South Florida
region have access to substantial
liquid assets, such as savings
accounts and retirement
accounts. While home ownership
is valuable for wealth building,
liquidity is important for
unexpected emergencies.
Miami-Dade County ⮚
55–61% of households in Miami-Dade County
are below the ALICE threshold.
When ALICE households do not have the
necessary income to make ends meet week-
to-week, difficult choices are often made.
These may include taking high-interest cash
advances or payday loans, purchasing
cheaper food (which tends to be less healthy,
and skipping over necessary home
maintenance or visits to healthcare providers.
Monroe County
46% of households in Monroe County are
below the ALICE threshold.
The 2017 report outlines several suggestions
for meeting these widespread financial
challenges, including an increase in medium-
and high-paying jobs, improvements in the
availability of affordable housing, and reform
to the health care delivery system.
Addressing these concerns is beneficial entire
communities, both socially and economically,
and reduces the strain on the entire Region
at large.

South Florida Comprehensive Economic Development Strategy: 2017–2022 31
Health Insurance
The percent of the population with health insurance coverage in the South Florida Region has
increased substantially over the last five years (for 2015 data, please visit the “South Florida
Without Health Insurance” visualization on our website). This follows a general trend state- and
nation-wide. In 2010, between 20–25% of the population in Florida was uninsured; by 2016, that
range had fallen to 10–15%.17 Despite this improvement, the percentage of the State of Florida
population that is uninsured is still one of the highest in the county.
County Health Rankings
The ranking in health outcomes represent how healthy counties are in Florida18. The ranks are
based on life expectancy and how healthy people feel while alive and helps us understand what
influences these factors. The ranking in health factors represent what impacts the health of a
county. The ranks are based on health behaviors, clinical care, social and economic, and physical
environmental factors. Factors that could impact the health of communities are high school
graduation rates, access to healthy foods, rates of smoking obesity, and teen births.19 They are
estimates of the future health of counties as compared to other counties in Florida. The ranks are
based on the total number of counties in Florida (67).
County Ranking in Health
Outcomes
Ranking in Health
Factors
Broward 19 14
Miami-Dade 23 28
Monroe 10 6 Figure 27. Florida County Health Rankings.
17 U.S. Census Bureau 2015 ACS 5-Year Data 18 http://www.countyhealthrankings.org/app/florida/2017/overview 19 http://www.countyhealthrankings.org/sites/default/files/state/downloads/CHR2017_FL.pdf
Figure 25: Table B25001, 2015 ACS 5-year estimates
County Population Without
Health Insurance
%
Broward 256,724 13.5
Miami-Dade 449,995 16.8
Monroe 15,757 20.5
Figure 24. Overall Rankings in Health Outcomes. Source: County Health Rankings and Roadmaps.
Figure 26. Overall Rankings in Health Factors. Source: County Health Rankings and Roadmaps.

South Florida Comprehensive Economic Development Strategy: 2017–2022 32
Development and Density
Scarcity of developable land in South Florida creates problems, especially within the context
of projected population increases. While urban infill and redevelopment are viable
strategies for managing population growth and encouraging economic development,
South Florida is already one of the densest regions in the state, bordered by the Atlantic
Ocean to the east and the Everglades to the west.
Economic Conditions
With a total value of $226 billion20 in goods and services (Gross Domestic Product, GDP),
the South Florida Region produced 26% of the State of Florida’s output and accounted for
almost 1.4% of the nation’s GDP in 2014.
The region’s six private non-farm sectors (in 2-digit NAICS21 codes) with the highest levels
of employment in 2014 were: Retail Trade, Health Care and Social Assistance, Administrative
Support and Waste Management Services, Other Services22, Accommodation and Food
Services, and Professional and Technical Services. Together with Real Estate, Finance and
Insurance, Wholesale Trade, Transportation, and Construction, these 11 sectors accounted
for 80% of regional employment. The Region’s economy accounts for a little over one-
fourth of total employment in the State of Florida. Total South Florida employment is
projected to grow at an average annual pace of 1.4% from 2014 to 2022, only slightly faster
than the nation’s annual pace of 1.0%. Among the six largest private sectors, the total number of jobs in the Health Care and Social Assistance sector is
projected to grow most dramatically, from 280,000 in 2014 to 348,000 in 2022, a 24% increase. Substantial growth is also projected for the
Accommodation and Food Services (41,000, 18%) and the Professional and Technical Services (39,000, 19%) sectors during the same period.
South Florida’s workers’ compensation rates affect the Region’s competitiveness in each industry: a comparatively higher compensation rate helps attract
skilled workers to the Region but also implies a higher labor cost to businesses. Generally, compensation rates in South Florida in 2014 were about the
same as or slightly higher than the average rates for most comparable sectors in the State of Florida. Exceptions were in Mining, Manufacturing and
Other Services, where South Florida workers received only 54%, 86% and 88% of the State average, respectively. The Region’s compensation rates in
most sectors were lower than the comparable national averages in 2014, with exceptions for the Retail Trade (109%), Educational Services (104%), Arts
Entertainment and Recreation (117%), and Accommodation and Food Services (123%) sectors. However, a decent wage is just one side of the equation of
20 Expressed in 2009 Dollars. Source: Policy Insight Plus, a nationally acclaimed economic and demographic forecasting model, developed by Regional Economic Models, Inc. (REMI). Version 2.0.3, used for this analysis, contains actual economic data through 2014, with forecast data from 2015 to 2060. 21 NAICS: The North American Industry Classification System (NAICS) was developed as the standard for use by federal statistical agencies in classifying business establishments for the collection, analysis, and publication of statistical data related to the business economy of the US. NAICS was developed under the auspices of the Office of Management and Budget (OMB), and adopted in 1997 to replace the old Standard Industrial Classification (SIC) system. 22 Establishments in this sector are primarily engaged in activities such as equipment and machinery repairing, promoting or administering religious activities, grant-making, advocacy, and providing dry cleaning and laundry services, personal care services, death care services, pet care services, photofinishing services, temporary parking services, and dating services.
Figure 28: Relative population density in Florida. Source: U.S. Census Bureau.
South Florida Comprehensive Economic Development Strategy: 2017–2022 33
the quality of life. Residents of the Region are paying more than the national average price for food and beverages, housing, insurance, and
transportation, which directly affects the quality of life and the attractiveness of the Region for wage workers.
In the analysis of Location Quotients (LQ) for all private sectors, the proportion of regional employment is above average in ten 2-digit NAICS code
sectors (Graph 8). The LQs are especially high in the Real Estate, Wholesale Trade, Transportation, Other Services, and Administrative and Support
Services sectors. In addition, the Accommodation and Food Services, Finance and Insurance, Retail Trade, Professional and Technical Services, and
Educational Services sectors have shares of the Regional economy above the national average (LQ>1).
A shift-share analysis projects the employment growth or decline of specific industry sectors in a region over a given future time period, measured by
three variables: share change, mix change, and shift change. Share change measures the degree to which an industry sector expands as a result of
general economic growth in the country or the region. Mix change is growth that can be attributed to a specific industry, measured as the difference of
an industry’s growth in the region as compared to that industry’s growth nationally. Share change is similar to mix change, but measures the difference
between a specific regional industry change in employment compared to the composite national growth rate. Between 2017-2021, based on these
metrics, most of the private sector industries are projected to grow, except for Utilities and Manufacturing. Perhaps most notably, the Professional &
Tech Services and Healthcare & Social Assistance industries are projected to expand dramatically, followed by Accommodation & Food Services and
Construction.
Both the quantity and quality of economic growth are important aspects in assessing the Region’s economic development status. South Florida grew
more slowly than the nation during the recession, but it is projected to grow at a faster rate over the next five years. In addition, a more diversified
economic structure—a more favorable sectoral and geographic distribution of economic activity—needs to be achieved to increase the long-term
sustainability of the economic growth. Diversification is a critical component of the Region’s economic development effort because a large, varied
economic structure is crucial for the Region’s stability, prosperity, and global competitiveness. A cluster industry development strategy can help identify
the strengths and weaknesses of the economy and accelerate the diversification of the regional economy through a targeted focus on high-wage, high
value-added cluster economic growth.
Energy
Florida is the nation’s second largest energy producer. The state also has the capacity to be a leader in renewable energy production. According to the
U.S. Army Corp of Engineers’ 2017 Infrastructure Report Card, Florida ranks 12th in the nation in production of energy from renewables.23 The state ranks
third in the nation for solar panel potential, and is currently one of only four states with utility-scale electricity generation from solar technology. The
state also has viable coastlines for successful wind farms in some areas. Both industries would improve the region’s long-term sustainability and provide
thousands of new jobs, while also reducing greenhouse gas emissions.
23 https://www.infrastructurereportcard.org/infrastructure-super-map/

South Florida Comprehensive Economic Development Strategy: 2017–2022 34
Regional Industry Clusters
Broward County Industry Clusters ⮚
Figure 29. 2015 ACS 5-year estimates, produced by Deloitte, Datawheel, C. Hidalgo
(https://datausa.io/about/#about-datawheel)
Miami-Dade County Industry Clusters
Figure 30. 2015 ACS 5-year estimates, produced by Deloitte, Datawheel, C. Hidalgo
(https://datausa.io/about/#about-datawheel)
Monroe County Industry Clusters ⮚
Figure 31. 2015 ACS 5-year estimates, produced by Deloitte, Datawheel, C. Hidalgo
(https://datausa.io/about/#about-datawheel)

South Florida Comprehensive Economic Development Strategy: 2017–2022 35
Innovation and Technology
Innovation Index 2.0 – Innovation Index for US Regions
#44 of 384 Economic Development Districts.
The Innovation Index 2.0, developed by the U.S. EDA, tracks a region’s innovation
performance against other regions around the country. The South Florida Region
ranks as having a “very high relative capacity for innovation,” coming in at 44 out of
a total 384 Economic Development Districts (EDDs) countrywide.
High Points
Of the constituent indices, the Region places towards the front of the pack in the
Human Capital and Knowledge Creation Index, Business Dynamics Index, and
Business Profile Index. Within the Human Capital index, South Florida receives high
ranks for university-based knowledge centers, business incubators, and percent of
residents holding bachelor’s and master’s degrees. With the Business Dynamics and
Business Profile indices, the Region ranks in the top 10 in the nation regarding the
establishment of new businesses and jobs associated directly with those businesses.
Industry diversity and cluster growth, however, tend to be low.
Room for Improvement
South Florida ranks particularly low in the Economic Well Being Index. Personal
income growth in the region tends to be low, while income inequality is very high.
Poverty is also higher than the average of other EDDs. Interestingly, South Florida
also ranks at the end of pack in the net migration metric. While the Region is an
attractor for a variety of reasons, this metric also considers the quantity of people that
migrate out—high out-migration can be indicative of poor or stagnant economic
conditions, poor wage growth, or unaffordable housing. These factors are especially
important as they concern the retention of innovative talent.
Figure 32: Innovation Index 2.0, showing the composite "Headline Index" score, as well as constituent indices.
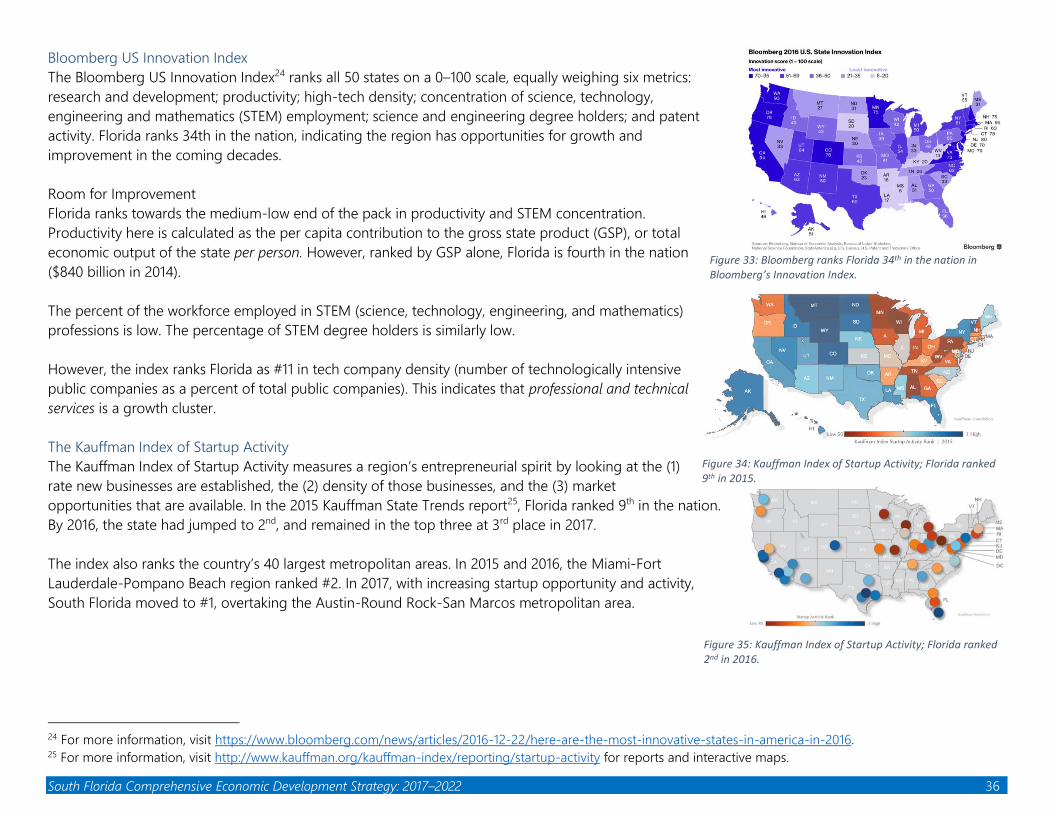
South Florida Comprehensive Economic Development Strategy: 2017–2022 36
Bloomberg US Innovation Index
The Bloomberg US Innovation Index24 ranks all 50 states on a 0–100 scale, equally weighing six metrics:
research and development; productivity; high-tech density; concentration of science, technology,
engineering and mathematics (STEM) employment; science and engineering degree holders; and patent
activity. Florida ranks 34th in the nation, indicating the region has opportunities for growth and
improvement in the coming decades.
Room for Improvement
Florida ranks towards the medium-low end of the pack in productivity and STEM concentration.
Productivity here is calculated as the per capita contribution to the gross state product (GSP), or total
economic output of the state per person. However, ranked by GSP alone, Florida is fourth in the nation
($840 billion in 2014).
The percent of the workforce employed in STEM (science, technology, engineering, and mathematics)
professions is low. The percentage of STEM degree holders is similarly low.
However, the index ranks Florida as #11 in tech company density (number of technologically intensive
public companies as a percent of total public companies). This indicates that professional and technical
services is a growth cluster.
The Kauffman Index of Startup Activity
The Kauffman Index of Startup Activity measures a region’s entrepreneurial spirit by looking at the (1)
rate new businesses are established, the (2) density of those businesses, and the (3) market
opportunities that are available. In the 2015 Kauffman State Trends report25, Florida ranked 9th in the nation.
By 2016, the state had jumped to 2nd, and remained in the top three at 3rd place in 2017.
The index also ranks the country’s 40 largest metropolitan areas. In 2015 and 2016, the Miami-Fort
Lauderdale-Pompano Beach region ranked #2. In 2017, with increasing startup opportunity and activity,
South Florida moved to #1, overtaking the Austin-Round Rock-San Marcos metropolitan area.
24 For more information, visit https://www.bloomberg.com/news/articles/2016-12-22/here-are-the-most-innovative-states-in-america-in-2016. 25 For more information, visit http://www.kauffman.org/kauffman-index/reporting/startup-activity for reports and interactive maps.
Figure 33: Bloomberg ranks Florida 34th in the nation in Bloomberg’s Innovation Index.
Figure 34: Kauffman Index of Startup Activity; Florida ranked 9th in 2015.
Figure 35: Kauffman Index of Startup Activity; Florida ranked 2nd in 2016.

South Florida Comprehensive Economic Development Strategy: 2017–2022 37
Transportation Networks
Commuting in South Florida
Average commute times in South Florida have continued to
rise over the last several years. Despite increasing traffic
congestion in South Florida, the average commute times for
those that drive themselves are still substantially lower than
those that utilize public transportation. In 2015, average
commute time by personal vehicle was ~31 minutes,
compared to ~51 minutes when using public transit—an
increase of roughly 65%. While commuters have been shown
to use public transportation when travel times are less,
comparable, or slightly higher, substantial increases in travel
times are prohibitive to many. The percentage of commuters
in the Miami metropolitan area with commutes longer than 30 minutes increased from ~48% to ~55%
from 2011 to 2015.26 Research shows that additional time spent commuting is detrimental to personal well-
being and worker productivity, and has financial implications for the region as well.27
26 http://ourmiami.org/our-study-2/issue-areas/transportation/#transportation3 27 Van Ommeren, J. N., & Gutiérrez-i-Puigarnau, E. (2011). Are workers with a long commute less productive? An empirical analysis of absenteeism. Regional Science and Urban Economics, 41(1), 1-8.
0%
10%
20%
30%
40%
50%
60%
70%
80%
90%
100%
Broward Miami-Dade Monroe
Means of Commuting to Work
Worked at home
Taxicab, motorcycle, bicycle, other
Walked
Public transportation
Carpooled
Drove alone
Figure 37: Table B08101, 2015 ACS 5-year estimates.
0%
10%
20%
30%
40%
50%
60%
2012 2016 2012 2016 2012 2016
Broward Miami-Dade Monroe
Percent Working Population With ≥30 Minute Commute - 2012 and 2016
South Florida Commute Destinations
and Times
sfregionalcouncil.org/CEDS_Visualized
Figure 36:Table B08012, 2012 and 2016 ACS 1-year estimates.
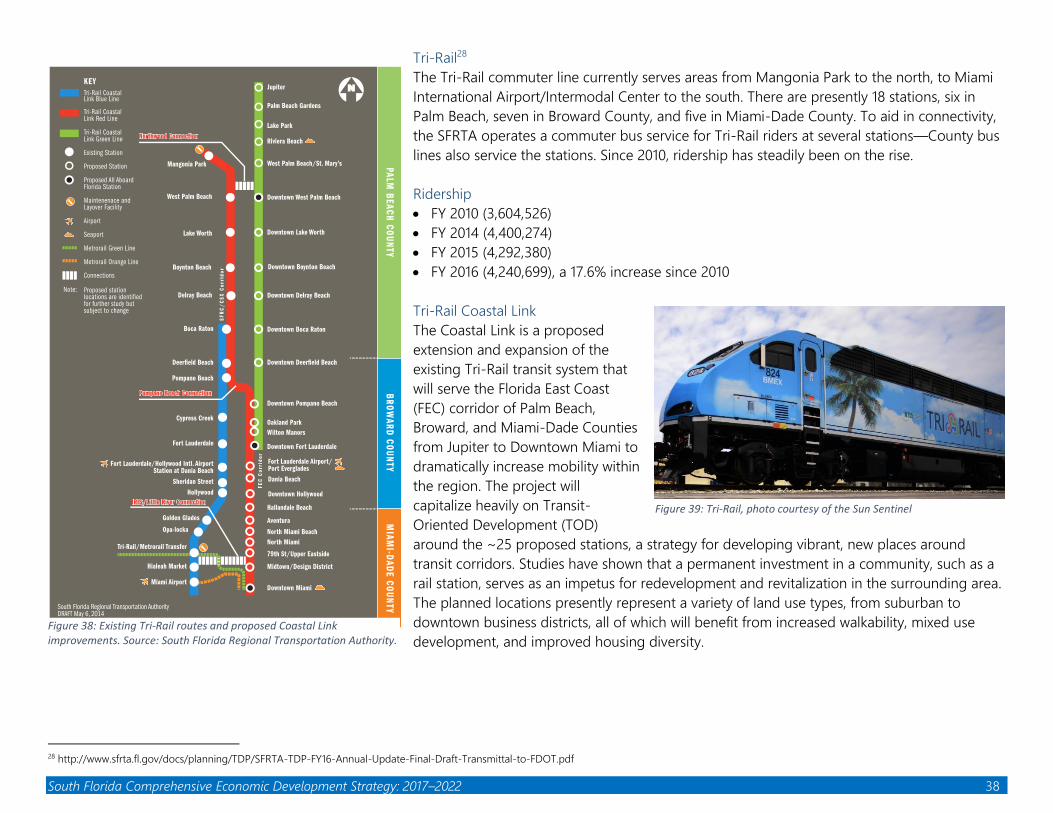
South Florida Comprehensive Economic Development Strategy: 2017–2022 38
Tri-Rail28
The Tri-Rail commuter line currently serves areas from Mangonia Park to the north, to Miami
International Airport/Intermodal Center to the south. There are presently 18 stations, six in
Palm Beach, seven in Broward County, and five in Miami-Dade County. To aid in connectivity,
the SFRTA operates a commuter bus service for Tri-Rail riders at several stations—County bus
lines also service the stations. Since 2010, ridership has steadily been on the rise.
Ridership
• FY 2010 (3,604,526)
• FY 2014 (4,400,274)
• FY 2015 (4,292,380)
• FY 2016 (4,240,699), a 17.6% increase since 2010
Tri-Rail Coastal Link
The Coastal Link is a proposed
extension and expansion of the
existing Tri-Rail transit system that
will serve the Florida East Coast
(FEC) corridor of Palm Beach,
Broward, and Miami-Dade Counties
from Jupiter to Downtown Miami to
dramatically increase mobility within
the region. The project will
capitalize heavily on Transit-
Oriented Development (TOD)
around the ~25 proposed stations, a strategy for developing vibrant, new places around
transit corridors. Studies have shown that a permanent investment in a community, such as a
rail station, serves as an impetus for redevelopment and revitalization in the surrounding area.
The planned locations presently represent a variety of land use types, from suburban to
downtown business districts, all of which will benefit from increased walkability, mixed use
development, and improved housing diversity.
28 http://www.sfrta.fl.gov/docs/planning/TDP/SFRTA-TDP-FY16-Annual-Update-Final-Draft-Transmittal-to-FDOT.pdf
Figure 38: Existing Tri-Rail routes and proposed Coastal Link improvements. Source: South Florida Regional Transportation Authority.
Figure 39: Tri-Rail, photo courtesy of the Sun Sentinel
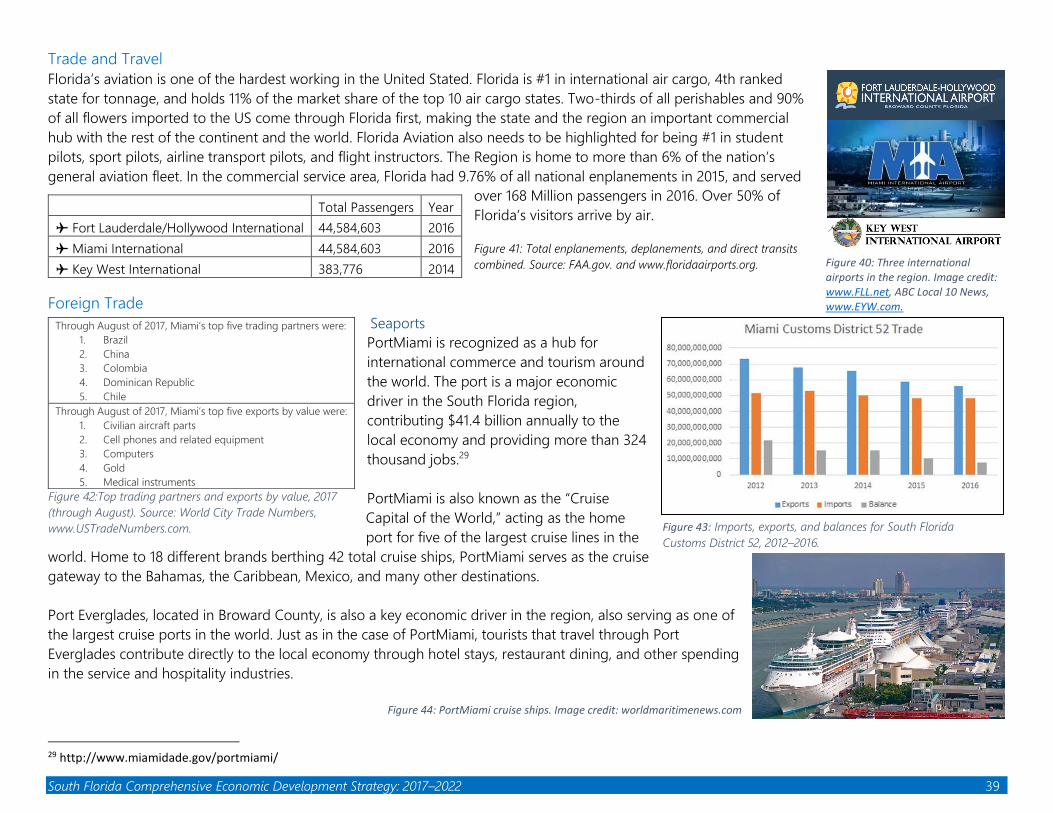
South Florida Comprehensive Economic Development Strategy: 2017–2022 39
Trade and Travel
Florida’s aviation is one of the hardest working in the United Stated. Florida is #1 in international air cargo, 4th ranked
state for tonnage, and holds 11% of the market share of the top 10 air cargo states. Two-thirds of all perishables and 90%
of all flowers imported to the US come through Florida first, making the state and the region an important commercial
hub with the rest of the continent and the world. Florida Aviation also needs to be highlighted for being #1 in student
pilots, sport pilots, airline transport pilots, and flight instructors. The Region is home to more than 6% of the nation’s
general aviation fleet. In the commercial service area, Florida had 9.76% of all national enplanements in 2015, and served
over 168 Million passengers in 2016. Over 50% of
Florida’s visitors arrive by air.
Figure 41: Total enplanements, deplanements, and direct transits
combined. Source: FAA.gov. and www.floridaairports.org.
Foreign Trade
Seaports
PortMiami is recognized as a hub for
international commerce and tourism around
the world. The port is a major economic
driver in the South Florida region,
contributing $41.4 billion annually to the
local economy and providing more than 324
thousand jobs.29
PortMiami is also known as the “Cruise
Capital of the World,” acting as the home
port for five of the largest cruise lines in the
world. Home to 18 different brands berthing 42 total cruise ships, PortMiami serves as the cruise
gateway to the Bahamas, the Caribbean, Mexico, and many other destinations.
Port Everglades, located in Broward County, is also a key economic driver in the region, also serving as one of
the largest cruise ports in the world. Just as in the case of PortMiami, tourists that travel through Port
Everglades contribute directly to the local economy through hotel stays, restaurant dining, and other spending
in the service and hospitality industries.
29 http://www.miamidade.gov/portmiami/
Total Passengers Year
✈ Fort Lauderdale/Hollywood International 44,584,603 2016
✈ Miami International 44,584,603 2016
✈ Key West International 383,776 2014
Through August of 2017, Miami’s top five trading partners were:
1. Brazil
2. China
3. Colombia
4. Dominican Republic
5. Chile
Through August of 2017, Miami’s top five exports by value were:
1. Civilian aircraft parts
2. Cell phones and related equipment
3. Computers
4. Gold
5. Medical instruments
Figure 42:Top trading partners and exports by value, 2017
(through August). Source: World City Trade Numbers,
www.USTradeNumbers.com.
Figure 40: Three international airports in the region. Image credit: www.FLL.net, ABC Local 10 News, www.EYW.com.
Figure 43: Imports, exports, and balances for South Florida
Customs District 52, 2012–2016.
Figure 44: PortMiami cruise ships. Image credit: worldmaritimenews.com

South Florida Comprehensive Economic Development Strategy: 2017–2022 40
Import and Export Trade Value
South Florida’s total trade (imports and exports) with the rest of the world has increased in value
from $65.9 billion in 2005 to $106.8 billion in 2016, despite the recent drop-off shown in from
January to July 2017, trade is up 2.41% when compared to the same period in 2016. According to the
Census Bureau, Miami’s trade surplus amounted to $7.75 billion in 2016, and it remains one of a very
few Customs Districts that continues to enjoy a trade surplus in the U.S.
Environmental Profile
Most of the South Florida Region’s climate is considered tropical, with wet savanna, monsoon, or
rainforest subclimates. All three sub-classifications are characterized by average monthly
temperatures that are greater than 64°. Within the two most prominent climates in the Region,
tropical savanna and tropical monsoon, a distinct wet season typically occurs in late summer, and a
dry season occurs in late winter to early spring.
As a direct result of South Florida’s warm climate, uniquely diverse ecosystems, and cultural heritage
sites, environmental tourism thrives, exemplified by the abundance of national, state, county, and
local parks in the region. Ecotourism, distinguished from environmental tourism as low impact,
education based, and conservation conscientious, has also gained traction in recent decades. A shift
from high-impact tourism to ecotourism signifies a growing regional interest in both environmental
and economic sustainability.
The Everglades are one of the richest natural ecosystems in the world, and largest expanse of
undeveloped subtropical wilderness in the country. In 2016, it was estimated that Everglades National
Park generated a $136 million economic benefit in local communities in tourism alone.30
30 https://www.nps.gov/nature/customcf/NPS_Data_Visualization/docs/2016_VSE.pdf
Figure 47: Hugh Taylor Birch State Park. Image credit: FL DEP. Figure 47: Dry Tortugas National Park. Image credit: NPS.
Figure 48: Mean rainfall and high and low temperatures, by month, Miami, Florida. Source: USClimateData.com.
Figure 45: Köppen climate classification. Image source: Oregon State University.

South Florida Comprehensive Economic Development Strategy: 2017–2022 41
Coral Reef Decline
Coral reefs are one of the most ecologically diverse and productive biomes
in the world—they are also one of the most threatened. Coral reefs are
found all over the world, but are typically most prolific near the equatorial
region. Coral reefs are economically important for a variety of reasons,
including support for commercial and recreational fisheries, contributions to
medical science, and tourism. Large swaths of reef exist off the South Florida
coast, extending down into the Keys.
Recent studies have concluded that there have been significant declines in
South Florida’s coral reefs over the last several decades. These declines are
due to many factors. Direct human disruption, such as high-impact
recreation and damage from ships, is especially problematic in densely
population areas such as South Florida. Overfishing also contributes to the
decline of coral reef health, disrupting the balance of food webs and in some cases leading to
overgrowth of microalgae.31 Ocean acidification, caused primarily by an increasing uptake of
atmospheric carbon dioxide, is also a leading contributor to declining coral reef health.
Increasingly acidic water leads to the dissolution of carbonate-based corals.
31 http://ufdcimages.uflib.ufl.edu/IR/00/00/31/58/00001/SS51800.pdf
Help Maintain Florida’s Reefs
• Research, public education, and outreach
• Community participation in reef management decisions
• Encourage low-impact recreation, discourage coral harvesting and trade
• Reduce nutrient runoff and point-source pollution
Figure 49: Loss of living coral on Carysfort Reef between 1975 and 2000. Credit: Dustan and Halas; FKNMS Coral Reef Evaluation and Monitoring Project. Figure 50: Time series for Carysfort Reef, Florida. Source: Biosphere Foundation, 2013.

South Florida Comprehensive Economic Development Strategy: 2017–2022 42
Community Participation: The CEDS Steering Committee
The CEDS steering committee is made up of a diverse yet focused group of interested community
leaders and citizens who shaped this CEDS and as how they want to see the region grow. Their work is
greatly appreciated and the South Florida Economic Development District looks forward to a
continued partnership with the committee in the future. The majority of CEDS Steering Committee
members come from the private sector, non-profits, and major academic institutions.
Alexina E. Alonso Florida International University/Life Sciences of South Florida
Luther Brewster FIU NeighborhoodHELP
Shekeria Brown South Florida Community Development Coalition
Sheri Colas-Gervais Beacon Council
Mildred Coyne Broward College Workforce Education and Economic Development
Robin Giblin Davis University of Florida Extension Center
Jaap Donath Beacon Council
Ron Drew Greater Fort Lauderdale Alliance
Jean-Pierre Fortin Broward College CTE Program/Workforce
Roman Gastesi Monroe County
Diana Gonzalez Economic Development Council of South Miami-Dade
Dale Gregory InternetCoast
James Knapp Florida International University/Life Sciences of South Florida
Diane Peart Broward College Workforce Education and Economic Development
Valeria Perez-Ferreiro Citi Foundation
Phil Purcell Marine Industries Association
Amanda Sanfilippo South Florida Cultural Consortium
Janisse Schoepp Health Foundation of South Florida
Jack Stephens South Florida Transportation Authority
Lori Wheeler Marine Industries Association
June Wolfe South Florida Manufacturers Association

South Florida Comprehensive Economic Development Strategy: 2017–2022 43
2017-2022 South Florida Comprehensive Economic Development Strategy
Available online at http://sfregionalcouncil.org/portfolio-item/ceds_visualized/
South Florida Regional Planning Council
3440 Hollywood Blvd, Suite 140, Hollywood, FL 33021
(954)985-4416
The work that provided the basis for this publication was supported by funding under an award with the U.S. Department of Commerce’s Economic
Development Administration (EDA)