2016annualreport - lennox international...
TRANSCRIPT
2016ANNUALREPORT
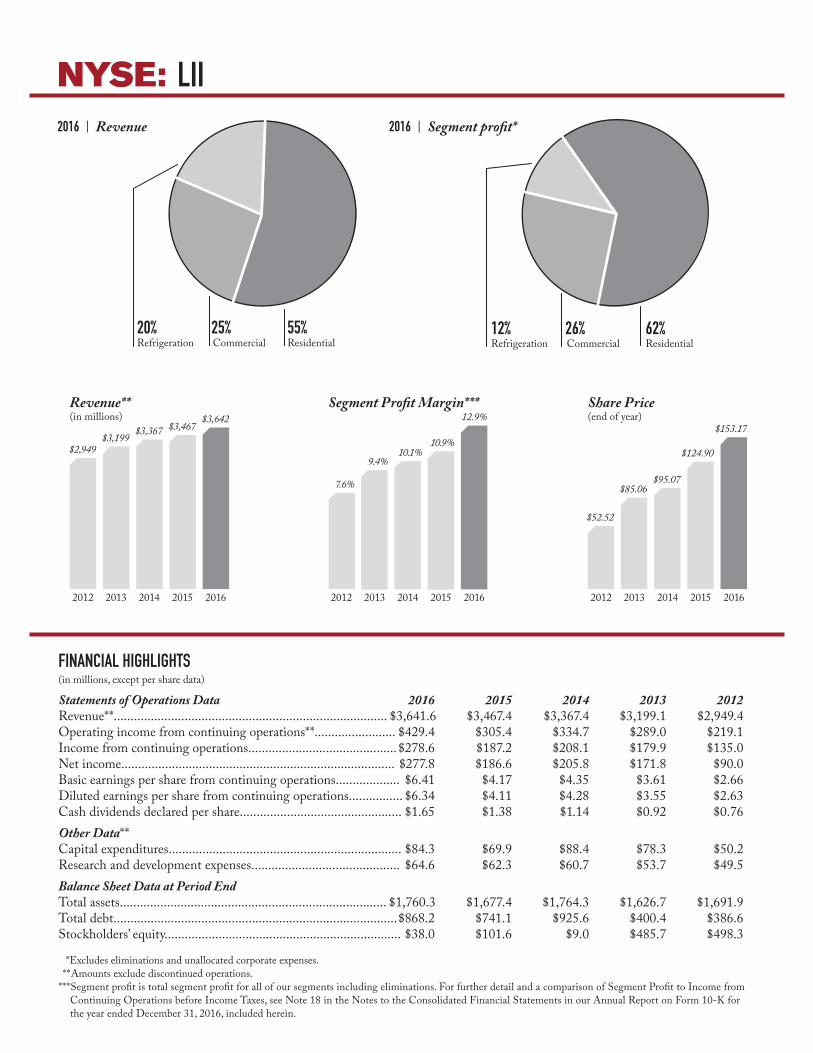
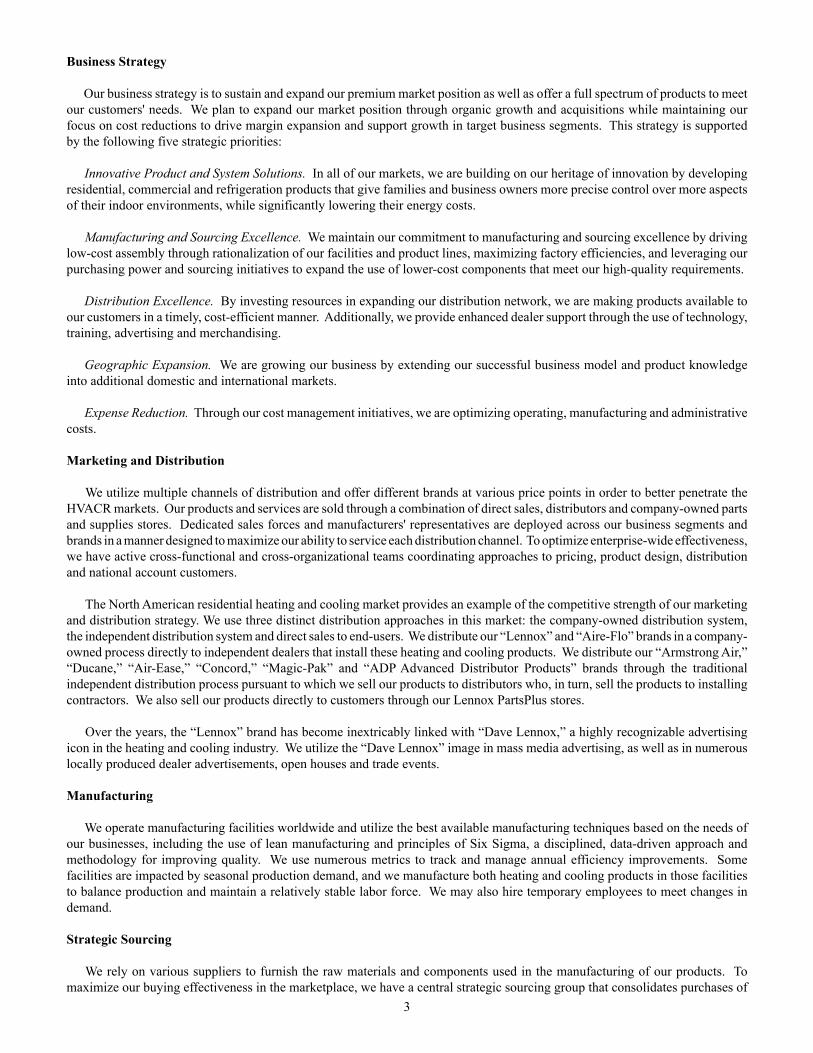
2016 | Revenue 2016 | Segment profit*
20% 25% 55%Refrigeration Commercial Residential
12% 26% 62%Refrigeration Commercial Residential
FINANCIAL HIGHLIGHTS (in millions, except per share data)
Statements of Operations Data 2016 2015 2014 2013 2012 Revenue**................................................................................. $3,641.6 $3,467.4 $3,367.4 $3,199.1 $2,949.4 Operating income from continuing operations**........................ $429.4 $305.4 $334.7 $289.0 $219.1 Income from continuing operations............................................ $278.6 $187.2 $208.1 $179.9 $135.0 Net income................................................................................. $277.8 $186.6 $205.8 $171.8 $90.0 Basic earnings per share from continuing operations................... $6.41 $4.17 $4.35 $3.61 $2.66 Diluted earnings per share from continuing operations................ $6.34 $4.11 $4.28 $3.55 $2.63 Cash dividends declared per share................................................ $1.65 $1.38 $1.14 $0.92 $0.76 Other Data**Capital expenditures..................................................................... $84.3 $69.9 $88.4 $78.3 $50.2 Research and development expenses............................................ $64.6 $62.3 $60.7 $53.7 $49.5 Balance Sheet Data at Period EndTotal assets............................................................................... $1,760.3 $1,677.4 $1,764.3 $1,626.7 $1,691.9 Total debt.................................................................................... $868.2 $741.1 $925.6 $400.4 $386.6 Stockholders’ equity...................................................................... $38.0 $101.6 $9.0 $485.7 $498.3
*Excludes eliminations and unallocated corporate expenses. **Amounts exclude discontinued operations.***Segment profit is total segment profit for all of our segments including eliminations. For further detail and a comparison of Segment Profit to Income from Continuing Operations before Income Taxes, see Note 18 in the Notes to the Consolidated Financial Statements in our Annual Report on Form 10-K for the year ended December 31, 2016, included herein.
NYSE: LII
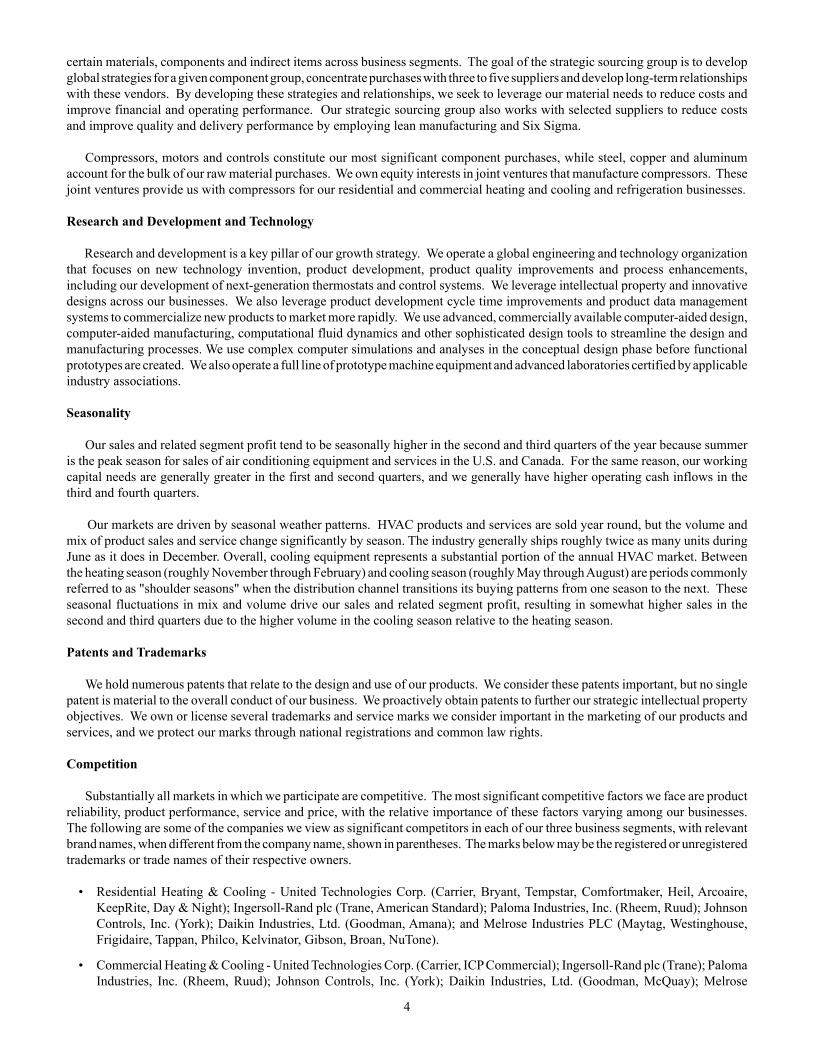
Revenue**(in millions)
$3,199$2,949
$3,367 $3,467$3,642
2012 2013 2014 2015 2016
Share Price(end of year)
$52.52
$85.06$95.07
$124.90
$153.17
2012 2013 2014 2015 2016
Segment Profit Margin***
7.6%
9.4%10.1%
12.9%
10.9%
2012 2013 2014 2015 2016
TO OUR STOCKHOLDERS2016 was a year of record margin, profit and cash flow for Lennox International. On a GAAP basis, operating income rose 41 percent to a record $429 million on 5 percent revenue growth to $3.6 billion. Earnings per share from continuing operations rose 54 percent to a record $6.34. On an adjusted basis, total segment profit increased 24 percent to a record $470 million as total segment margin expanded 200
basis points to a record 12.9 percent. Adjusted earnings per share from continuing operations for the full year rose 35 percent to a record $6.95.
Cash from operations of $355 million for the year set a new record, and we continued to make significant investments for the future growth and profitability of the company, including $84 million of capital expenditures. The company raised its dividend 19 percent and paid a total of $69 million in dividends in 2016. In addition, we repurchased $300 million of company stock.
All three of our businesses were up in 2016, and Residential and Commercial set new highs for revenue, margin, and profit. In Refrigeration, profit rose 30 percent as segment margin expanded 210 basis points to 9.5 percent.
Residential revenue was up 7 percent for the year to a record $2.0 billion on strength in both replacement and new construction business. Residential profit rose 25 percent to a record $349 million, and segment margin expanded 250 basis points to a new high of 17.4 percent.
Operationally in Residential, we continued to drive manufact- uring productivity, including approximately $10 million of incremental savings for the year from our second manufacturing plant in Saltillo, Mexico opened in 2014. In distribution, we continued to expand our footprint with 23 new Lennox PartsPlus® stores to bring the total to 209 locations at the end of 2016. Over the last seven years, we have expanded physical distribution more than 240 percent in our Residential business, which has been a key factor in winning new contractor customers and providing excellent service to our existing customers. Benefits from this initiative include significant advances in on-time delivery and same-day fulfillment, as well as improved inventory turns and distribution costs per dollar of revenue. We view the target market for a PartsPlus store to be within a 30-minute drive radius for a contractor. Currently, our footprintof stores covers about 35 percent of our total market under thisparameter. With a systematic pace of store expansion each year, we envision more than 325 stores in total in the next three years as wecontinue to focus on outgrowing the market and providingservice excellence.
In our Commercial business in 2016, revenue was up 3 percent, including a negative 1 percent impact from foreign exchange, to a record $918 million. Commercial profit rose 14 percent to a record $149 million, and segment margin expanded 160 basis points to a record 16.3 percent.
In North America, commercial revenue grew at a mid-single digit rate in 2016. Revenue from replacement business was up high-single digits, and revenue from commercial new construction was up low-single digits.
National account equipment revenue was up low-single digits - with broad strength in non-retail national accounts partially offset by a decline in HVAC capital spending at certain retail accounts. Lennox continued to win in the marketplace with a record 31 new national account equipment customers. We continued to advance our leadership position with retailers at their stores and increasingly at their warehouse and distribution facilities that support their online sales. In other national accounts, we expanded further into hotels, restaurants, schools, entertainment complexes, medical facilities, financial branches and with real estate firms. On the services side of our national account business, revenue was up mid-single digits for the year as steady growth continued. Revenue from our non-national account business was up mid-single digits for the year. We continued to see success in the emergency replacement market as we drive initiatives to gain further share in this segment of the market. Over the last four years, our emergency replacement revenue is up approximately 40 percent.
Since entering the VRF market in North America, we are seeing increasing momentum in winning business in mid-rise buildings - with stand-alone VRF systems or in a bundled solution with our unitary rooftop products. We see the VRF market growing at a mid-teens rate to $750 million over the next four years in North America. We have been growing at a triple-digit pace and continue to target $100 million of annual VRF revenue in the coming years.
In Europe, markets remained soft in 2016. Our commercial HVAC revenue was down slightly including the negative impact from foreign exchange and flat excluding that impact.
In our Refrigeration business, revenue was up 1 percent, including a negative 1 percent impact from foreign exchange. Refrigeration revenue was up low-single digits in North America and Europe. South America was flat including a negative 5 percent impact from foreign exchange, and Asia Pacific was flat including a negative 1 percent impact from foreign exchange. Refrigeration profit rose 30 percent to $69 million, and segment margin expanded 210 basis points to 9.5 percent. In addition to growth across all regions at constant currency, the business realized significant improvement in profitability from lower
factory and material costs, including sourcing and engineering- led cost reductions, and higher productivity.
Across all three of our businesses, the company continued to realize significant material cost reductions through global sourcing programs and engineering-led cost reductions. The company has been making significant investments in computational analytics that enable us to dramatically reduce the time to implement cost savings. Instead of manual testing and field trials, we increasingly model lifetime equipment perfor-mance on the computer and in the lab. Computational analytics also enables us to more precisely understand the performance specification to provide our suppliers in order to optimize costs, quality, and performance.
Another area of significant investment that we are leveraging across the entire enterprise is our advanced control systems. In Residential, our iComfort® S30 control system has an industry-leading user interface and can provide prognostics and diagnostics in a way that enables a technician to arrive at a home with the right part to fix a system the right way the first time.
We are now leveraging the investments in our residential control systems and our intellectual property in software and hardware to develop the same leading capabilities for light commercial applications. In a convenience store or restaurant, for example, monitoring and controlling the HVAC and refrigeration systems are critical. Our new systems provide these commercial customers with a leading user-interface, remote monitoring, and prognostics and diagnostics to help keep their businesses running smoothly and maximize profitability.
The company is also making significant investments in e-commerce, including our industry-leading LennoxPROs.comsite and app for our Lennox dealers. The LennoxPROs™ toolprovides online ordering, warranty support, training, and partsand equipment availability. We are leveraging our expertise withe-commerce in our Lennox residential business to introduce newe-commerce systems for our Allied® residential business and ourNorth America Heatcraft® refrigeration business in 2017.
Investments like these, combined with the continued expansion of our distribution footprint, keep the company well-positioned to win in the market place now and for the future. In addition, with the company’s record cash generation and strong balance sheet, we continued to return cash to shareholders through competitive dividends and significant stock repurchases. The company established many new financial records in 2016, and we remain focused on taking company performance to new levels as we capitalize on end-market growth, capture market share, and continue to drive operational initiatives for higher profitability.
Todd M. BluedornChairman of the Board & Chief Executive Officer
*For a reconciliation of 2016 GAAP and adjusted financials, refer to the company’s February 7, 2017 earnings release and financial statements available at www.lennoxintl.com.
BOARD OF DIRECTORSTodd M. BluedornChairman of the Board and Chief Executive Officer
Janet K. CooperFormer Senior Vice President and TreasurerQwest Communications International Inc.Committees: 1, 4
John E. MajorPresident MTSGCommittees: 2, 3
Max H. MitchellPresident and Chief Executive Officer Crane Co.Committees: 1, 2
John W. Norris, IIICo-FounderMaine Network PartnersCommittees: 3, 4
Karen H. QuintosExecutive Vice President and Chief Customer OfficerDell Technologies Inc.Committees: 3, 4
Kim K. W. RuckerExecutive Vice President, General Counsel and SecretaryTesoro Corp.Committees: 2, 3
Paul W. SchmidtFormer Corporate ControllerGeneral Motors CorporationCommittees: 1, 4
Gregory T. SwientonFormer Chairman and Chief Executive OfficerRyder System, Inc.Committees: 1, 2
Todd J. TeskeLII Lead Independent DirectorChairman, President and Chief Executive OfficerBriggs & Stratton CorporationCommittees: 2, 3
BOARD OF DIRECTORSAND MANAGEMENT TEAM
MANAGEMENT TEAMTodd M. BluedornChairman of the Board and Chief Executive Officer
Joseph W. ReitmeierExecutive Vice President and Chief Financial Officer
Prakash BedapudiExecutive Vice President and Chief Technology Officer
Terry L. JohnstonExecutive Vice PresidentPresident and Chief Operating OfficerNorth America Commercial Heating & Cooling
David W. MoonExecutive Vice PresidentPresident and Chief Operating OfficerWorldwide Refrigeration
Daniel M. SessaExecutive Vice President and Chief Human Resources Officer
John D. TorresExecutive Vice President, Chief Legal Officer and Secretary
Douglas L. YoungExecutive Vice PresidentPresident and Chief Operating OfficerResidential Heating & Cooling
Roy A. Rumbough, Jr.Vice President, Controller and Chief Accounting Officer
Committee Legend (bold indicates chairperson)1: Audit 2: Board Governance3: Compensation & Human Resources 4: Public Policyas of March 20, 2017

2016FORM 10-K
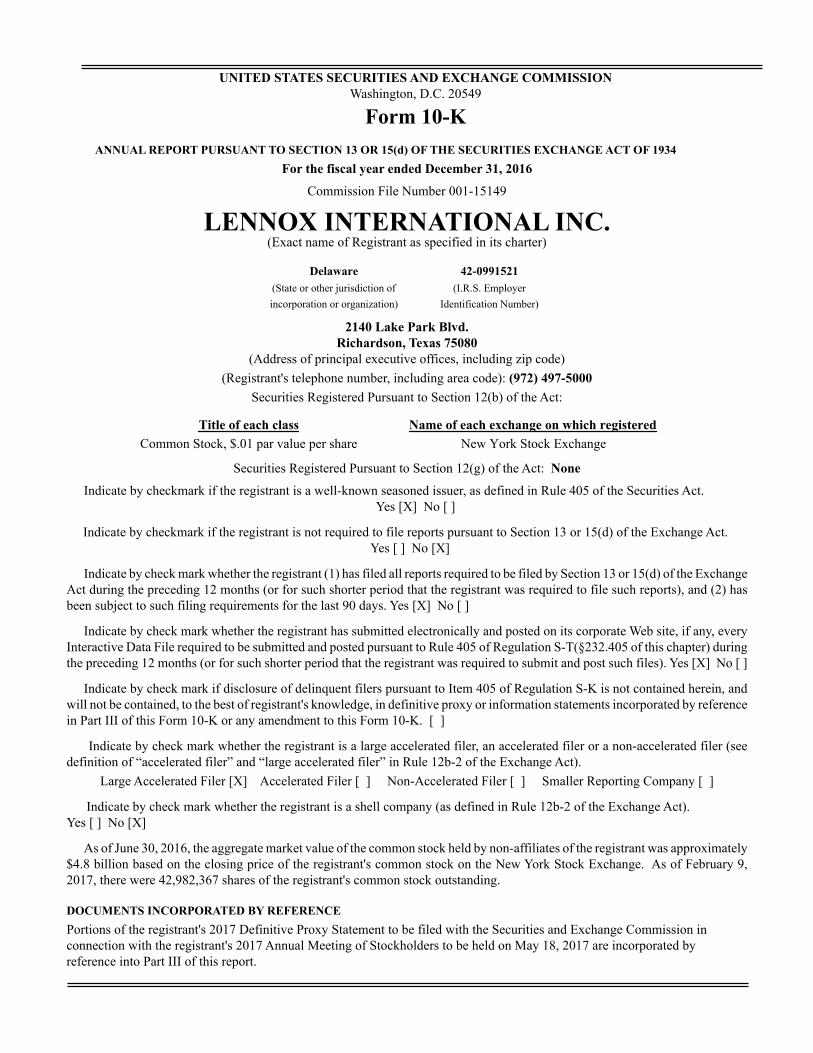
UNITED STATES SECURITIES AND EXCHANGE COMMISSIONWashington, D.C. 20549
Form 10-KANNUAL REPORT PURSUANT TO SECTION 13 OR 15(d) OF THE SECURITIES EXCHANGE ACT OF 1934
For the fiscal year ended December 31, 2016
Commission File Number 001-15149
LENNOX INTERNATIONAL INC.(Exact name of Registrant as specified in its charter)
Delaware 42-0991521(State or other jurisdiction of (I.R.S. Employerincorporation or organization) Identification Number)
2140 Lake Park Blvd.Richardson, Texas 75080
(Address of principal executive offices, including zip code)(Registrant's telephone number, including area code): (972) 497-5000
Securities Registered Pursuant to Section 12(b) of the Act:
Title of each class Name of each exchange on which registeredCommon Stock, $.01 par value per share New York Stock Exchange
Securities Registered Pursuant to Section 12(g) of the Act: None
Indicate by checkmark if the registrant is a well-known seasoned issuer, as defined in Rule 405 of the Securities Act. Yes [X] No [ ]
Indicate by checkmark if the registrant is not required to file reports pursuant to Section 13 or 15(d) of the Exchange Act. Yes [ ] No [X]
Indicate by check mark whether the registrant (1) has filed all reports required to be filed by Section 13 or 15(d) of the Exchange Act during the preceding 12 months (or for such shorter period that the registrant was required to file such reports), and (2) has been subject to such filing requirements for the last 90 days. Yes [X] No [ ]
Indicate by check mark whether the registrant has submitted electronically and posted on its corporate Web site, if any, every Interactive Data File required to be submitted and posted pursuant to Rule 405 of Regulation S-T(§232.405 of this chapter) during the preceding 12 months (or for such shorter period that the registrant was required to submit and post such files). Yes [X] No [ ]
Indicate by check mark if disclosure of delinquent filers pursuant to Item 405 of Regulation S-K is not contained herein, and will not be contained, to the best of registrant's knowledge, in definitive proxy or information statements incorporated by reference in Part III of this Form 10-K or any amendment to this Form 10-K. [ ]
Indicate by check mark whether the registrant is a large accelerated filer, an accelerated filer or a non-accelerated filer (see definition of “accelerated filer” and “large accelerated filer” in Rule 12b-2 of the Exchange Act).
Large Accelerated Filer [X] Accelerated Filer [ ] Non-Accelerated Filer [ ] Smaller Reporting Company [ ]
Indicate by check mark whether the registrant is a shell company (as defined in Rule 12b-2 of the Exchange Act).Yes [ ] No [X]
As of June 30, 2016, the aggregate market value of the common stock held by non-affiliates of the registrant was approximately $4.8 billion based on the closing price of the registrant's common stock on the New York Stock Exchange. As of February 9, 2017, there were 42,982,367 shares of the registrant's common stock outstanding.
DOCUMENTS INCORPORATED BY REFERENCEPortions of the registrant's 2017 Definitive Proxy Statement to be filed with the Securities and Exchange Commission in connection with the registrant's 2017 Annual Meeting of Stockholders to be held on May 18, 2017 are incorporated by reference into Part III of this report.
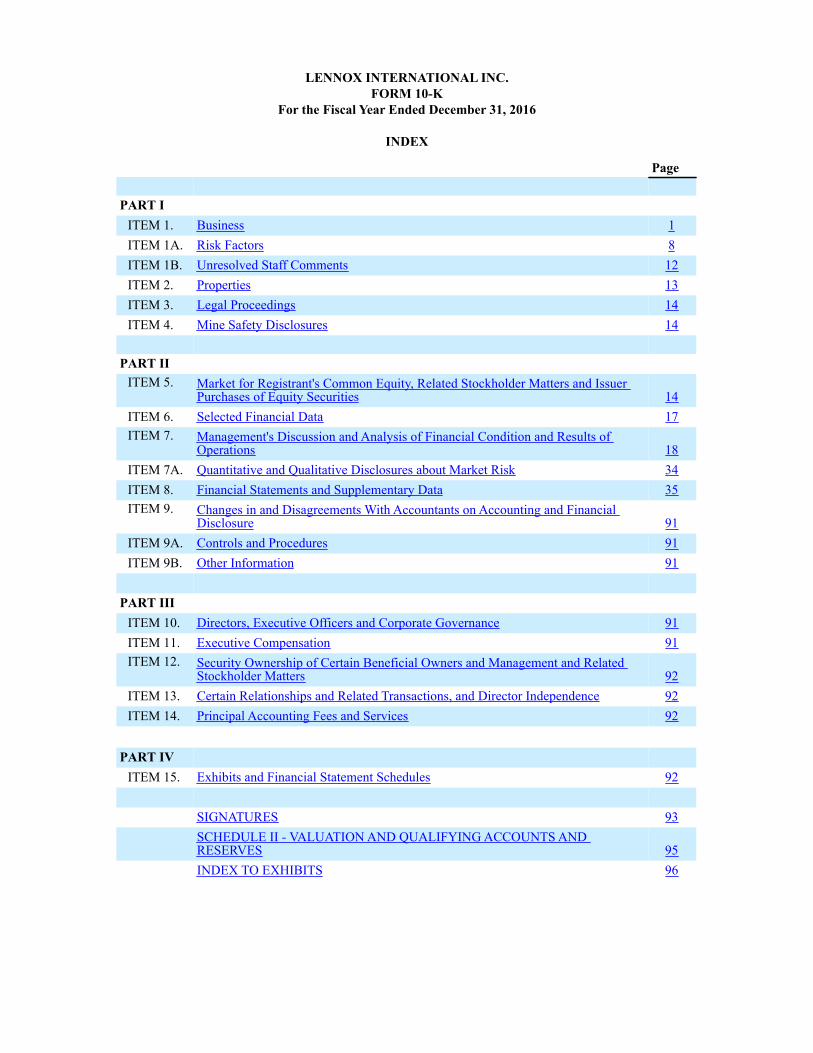
LENNOX INTERNATIONAL INC.FORM 10-K
For the Fiscal Year Ended December 31, 2016
INDEX
Page
PART IITEM 1. BusinessITEM 1A. Risk FactorsITEM 1B. Unresolved Staff CommentsITEM 2. PropertiesITEM 3. Legal ProceedingsITEM 4. Mine Safety Disclosures
PART IIITEM 5. Market for Registrant's Common Equity, Related Stockholder Matters and Issuer
Purchases of Equity SecuritiesITEM 6. Selected Financial DataITEM 7. Management's Discussion and Analysis of Financial Condition and Results of
OperationsITEM 7A. Quantitative and Qualitative Disclosures about Market RiskITEM 8. Financial Statements and Supplementary DataITEM 9. Changes in and Disagreements With Accountants on Accounting and Financial
DisclosureITEM 9A. Controls and ProceduresITEM 9B. Other Information
PART IIIITEM 10. Directors, Executive Officers and Corporate GovernanceITEM 11. Executive CompensationITEM 12. Security Ownership of Certain Beneficial Owners and Management and Related
Stockholder MattersITEM 13. Certain Relationships and Related Transactions, and Director IndependenceITEM 14. Principal Accounting Fees and Services
PART IVITEM 15. Exhibits and Financial Statement Schedules
SIGNATURESSCHEDULE II - VALUATION AND QUALIFYING ACCOUNTS AND RESERVESINDEX TO EXHIBITS
1812131414
1417
183435
919191
9191
929292
92
93
9596
1
PART I Item 1. Business
References in this Annual Report on Form 10-K to “we,” “our,” “us,” “LII” or the “Company” refer to Lennox International Inc. and its subsidiaries, unless the context requires otherwise.
The Company
We are a leading global provider of climate control solutions. We design, manufacture and market a broad range of products for the heating, ventilation, air conditioning and refrigeration (“HVACR”) markets. We have leveraged our expertise to become an industry leader known for innovation, quality and reliability. Our products and services are sold through multiple distribution channels under various brand names. The Company was founded in 1895, in Marshalltown, Iowa, by Dave Lennox, the owner of a machine repair business for railroads. He designed and patented a riveted steel coal-fired furnace, which led to numerous advancements in heating, cooling and climate control solutions.
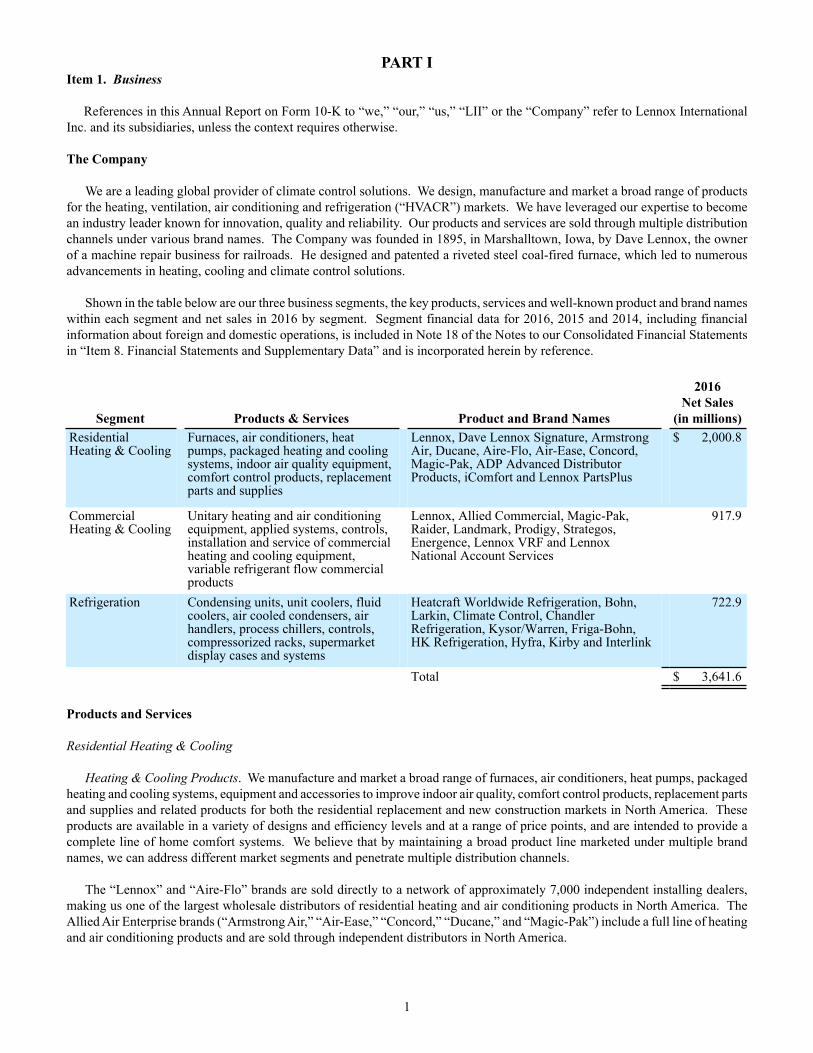
Shown in the table below are our three business segments, the key products, services and well-known product and brand names within each segment and net sales in 2016 by segment. Segment financial data for 2016, 2015 and 2014, including financial information about foreign and domestic operations, is included in Note 18 of the Notes to our Consolidated Financial Statements in “Item 8. Financial Statements and Supplementary Data” and is incorporated herein by reference.
Segment Products & Services Product and Brand Names
2016Net Sales
(in millions)ResidentialHeating & Cooling
Furnaces, air conditioners, heatpumps, packaged heating and coolingsystems, indoor air quality equipment,comfort control products, replacementparts and supplies
Lennox, Dave Lennox Signature, ArmstrongAir, Ducane, Aire-Flo, Air-Ease, Concord,Magic-Pak, ADP Advanced DistributorProducts, iComfort and Lennox PartsPlus
$ 2,000.8
CommercialHeating & Cooling
Unitary heating and air conditioningequipment, applied systems, controls,installation and service of commercialheating and cooling equipment,variable refrigerant flow commercialproducts
Lennox, Allied Commercial, Magic-Pak,Raider, Landmark, Prodigy, Strategos,Energence, Lennox VRF and LennoxNational Account Services
917.9
Refrigeration Condensing units, unit coolers, fluidcoolers, air cooled condensers, airhandlers, process chillers, controls,compressorized racks, supermarketdisplay cases and systems
Heatcraft Worldwide Refrigeration, Bohn,Larkin, Climate Control, ChandlerRefrigeration, Kysor/Warren, Friga-Bohn,HK Refrigeration, Hyfra, Kirby and Interlink
722.9
Total $ 3,641.6
Products and Services
Residential Heating & Cooling
Heating & Cooling Products. We manufacture and market a broad range of furnaces, air conditioners, heat pumps, packaged heating and cooling systems, equipment and accessories to improve indoor air quality, comfort control products, replacement parts and supplies and related products for both the residential replacement and new construction markets in North America. These products are available in a variety of designs and efficiency levels and at a range of price points, and are intended to provide a complete line of home comfort systems. We believe that by maintaining a broad product line marketed under multiple brand names, we can address different market segments and penetrate multiple distribution channels.
The “Lennox” and “Aire-Flo” brands are sold directly to a network of approximately 7,000 independent installing dealers, making us one of the largest wholesale distributors of residential heating and air conditioning products in North America. The Allied Air Enterprise brands (“Armstrong Air,” “Air-Ease,” “Concord,” “Ducane,” and “Magic-Pak”) include a full line of heating and air conditioning products and are sold through independent distributors in North America.
2
We are continuing to grow our network of 209 Lennox PartsPlus stores across the United States and Canada. These stores provide an easy access solution for contractors and independent dealers to obtain universal service and replacement parts, supplies, convenience items, tools, Lennox equipment and OEM parts.
Our Advanced Distributor Products (“ADP”) operation builds evaporator coils and air handlers under the “ADP Advanced Distributor Products” brand and also builds evaporator coils under the “Lennox” brand and Allied Air Enterprise brands. ADP sells its own ADP branded evaporator coils to over 400 HVAC wholesale distributors across North America.
Commercial Heating & Cooling
North America. In North America, we manufacture and sell unitary heating and cooling equipment used in light commercial applications, such as low-rise office buildings, restaurants, retail centers, churches and schools. Our product offerings for these applications include rooftop units ranging from 2 to 50 tons of cooling capacity and split system/air handler combinations, which range from 1.5 to 20 tons of cooling capacity. These products are distributed primarily through commercial contractors and directly to national account customers. In 2014, we launched Lennox-branded variable refrigerant flow ("VRF") commercial products through Lennox company-owned distribution. We believe the success of our products is attributable to their efficiency, design flexibility, total cost of ownership, low life-cycle cost, ease of service and advanced control technology.
National Account Services. National Account Service ("NAS") provides installation, service and preventive maintenance for commercial HVAC national account customers in the United States and Canada.
Europe. In Europe, we manufacture and sell unitary products, which range from 2 to 70 tons of cooling capacity, and applied systems with up to 200 tons of cooling capacity. Our European products consist of small package units, rooftop units, chillers, air handlers and fan coils that serve medium-rise commercial buildings, shopping malls, other retail and entertainment buildings, institutional applications and other field-engineered applications. We manufacture heating and cooling products in several locations in Europe and market these products through both direct and indirect distribution channels in Europe, Russia, Turkey and the Middle East.
Refrigeration
We manufacture and market equipment for the global commercial refrigeration markets under the Heatcraft Worldwide Refrigeration name. We sell these products to distributors, installing contractors, engineering design firms, original equipment manufacturers and end-users. Our global manufacturing, distribution, sales and marketing footprint serves customers in over 70 countries worldwide.
North America. Our commercial refrigeration products for the North American market include condensing units, unit coolers, fluid coolers, air-cooled condensers, air handlers, display cases and refrigeration rack systems. These products preserve food and other perishables in supermarkets, convenience stores, restaurants, warehouses and distribution centers. In addition, our products are used to cool a wide variety of industrial processes, including data centers, machine tooling, and other critical cooling applications. We routinely provide application engineering for consulting engineers, contractors, store planners, end customers and others to support the sale of commercial refrigeration products. In addition to providing complete refrigeration systems and display cases, we also provide turnkey installations for our supermarket customers in Mexico.
International. In international markets, we manufacture and market refrigeration products including condensing units, unit coolers, air-cooled condensers, fluid coolers, compressor racks and industrial process chillers. We have manufacturing locations in Germany, France, Brazil and China. In Australia and New Zealand, we are the leading wholesale distribution business serving the HVACR industry with more than 60 locations serving our customers, which also includes the sale of refrigerant. In addition, we own a 50% common stock interest in a joint venture in Mexico that produces unit coolers, air-cooled condensers, condensing units, compressors and compressorized racks of the same design and quality as those manufactured by our U.S. business. This joint venture product line is complemented with imports from the U.S., which are sold through the joint venture's distribution network.
3
Business Strategy
Our business strategy is to sustain and expand our premium market position as well as offer a full spectrum of products to meet our customers' needs. We plan to expand our market position through organic growth and acquisitions while maintaining our focus on cost reductions to drive margin expansion and support growth in target business segments. This strategy is supported by the following five strategic priorities:
Innovative Product and System Solutions. In all of our markets, we are building on our heritage of innovation by developing residential, commercial and refrigeration products that give families and business owners more precise control over more aspects of their indoor environments, while significantly lowering their energy costs.
Manufacturing and Sourcing Excellence. We maintain our commitment to manufacturing and sourcing excellence by driving low-cost assembly through rationalization of our facilities and product lines, maximizing factory efficiencies, and leveraging our purchasing power and sourcing initiatives to expand the use of lower-cost components that meet our high-quality requirements.
Distribution Excellence. By investing resources in expanding our distribution network, we are making products available to our customers in a timely, cost-efficient manner. Additionally, we provide enhanced dealer support through the use of technology, training, advertising and merchandising.
Geographic Expansion. We are growing our business by extending our successful business model and product knowledge into additional domestic and international markets.
Expense Reduction. Through our cost management initiatives, we are optimizing operating, manufacturing and administrative costs.
Marketing and Distribution
We utilize multiple channels of distribution and offer different brands at various price points in order to better penetrate the HVACR markets. Our products and services are sold through a combination of direct sales, distributors and company-owned parts and supplies stores. Dedicated sales forces and manufacturers' representatives are deployed across our business segments and brands in a manner designed to maximize our ability to service each distribution channel. To optimize enterprise-wide effectiveness, we have active cross-functional and cross-organizational teams coordinating approaches to pricing, product design, distribution and national account customers.
The North American residential heating and cooling market provides an example of the competitive strength of our marketing and distribution strategy. We use three distinct distribution approaches in this market: the company-owned distribution system, the independent distribution system and direct sales to end-users. We distribute our “Lennox” and “Aire-Flo” brands in a company-owned process directly to independent dealers that install these heating and cooling products. We distribute our “Armstrong Air,” “Ducane,” “Air-Ease,” “Concord,” “Magic-Pak” and “ADP Advanced Distributor Products” brands through the traditional independent distribution process pursuant to which we sell our products to distributors who, in turn, sell the products to installing contractors. We also sell our products directly to customers through our Lennox PartsPlus stores.
Over the years, the “Lennox” brand has become inextricably linked with “Dave Lennox,” a highly recognizable advertising icon in the heating and cooling industry. We utilize the “Dave Lennox” image in mass media advertising, as well as in numerous locally produced dealer advertisements, open houses and trade events.
Manufacturing
We operate manufacturing facilities worldwide and utilize the best available manufacturing techniques based on the needs of our businesses, including the use of lean manufacturing and principles of Six Sigma, a disciplined, data-driven approach and methodology for improving quality. We use numerous metrics to track and manage annual efficiency improvements. Some facilities are impacted by seasonal production demand, and we manufacture both heating and cooling products in those facilities to balance production and maintain a relatively stable labor force. We may also hire temporary employees to meet changes in demand.
Strategic Sourcing
We rely on various suppliers to furnish the raw materials and components used in the manufacturing of our products. To maximize our buying effectiveness in the marketplace, we have a central strategic sourcing group that consolidates purchases of
4
certain materials, components and indirect items across business segments. The goal of the strategic sourcing group is to develop global strategies for a given component group, concentrate purchases with three to five suppliers and develop long-term relationships with these vendors. By developing these strategies and relationships, we seek to leverage our material needs to reduce costs and improve financial and operating performance. Our strategic sourcing group also works with selected suppliers to reduce costs and improve quality and delivery performance by employing lean manufacturing and Six Sigma.
Compressors, motors and controls constitute our most significant component purchases, while steel, copper and aluminum account for the bulk of our raw material purchases. We own equity interests in joint ventures that manufacture compressors. These joint ventures provide us with compressors for our residential and commercial heating and cooling and refrigeration businesses.
Research and Development and Technology
Research and development is a key pillar of our growth strategy. We operate a global engineering and technology organization that focuses on new technology invention, product development, product quality improvements and process enhancements, including our development of next-generation thermostats and control systems. We leverage intellectual property and innovative designs across our businesses. We also leverage product development cycle time improvements and product data management systems to commercialize new products to market more rapidly. We use advanced, commercially available computer-aided design, computer-aided manufacturing, computational fluid dynamics and other sophisticated design tools to streamline the design and manufacturing processes. We use complex computer simulations and analyses in the conceptual design phase before functional prototypes are created. We also operate a full line of prototype machine equipment and advanced laboratories certified by applicable industry associations.
Seasonality
Our sales and related segment profit tend to be seasonally higher in the second and third quarters of the year because summer is the peak season for sales of air conditioning equipment and services in the U.S. and Canada. For the same reason, our working capital needs are generally greater in the first and second quarters, and we generally have higher operating cash inflows in the third and fourth quarters.
Our markets are driven by seasonal weather patterns. HVAC products and services are sold year round, but the volume and mix of product sales and service change significantly by season. The industry generally ships roughly twice as many units during June as it does in December. Overall, cooling equipment represents a substantial portion of the annual HVAC market. Between the heating season (roughly November through February) and cooling season (roughly May through August) are periods commonly referred to as "shoulder seasons" when the distribution channel transitions its buying patterns from one season to the next. These seasonal fluctuations in mix and volume drive our sales and related segment profit, resulting in somewhat higher sales in the second and third quarters due to the higher volume in the cooling season relative to the heating season.
Patents and Trademarks
We hold numerous patents that relate to the design and use of our products. We consider these patents important, but no single patent is material to the overall conduct of our business. We proactively obtain patents to further our strategic intellectual property objectives. We own or license several trademarks and service marks we consider important in the marketing of our products and services, and we protect our marks through national registrations and common law rights.
Competition
Substantially all markets in which we participate are competitive. The most significant competitive factors we face are product reliability, product performance, service and price, with the relative importance of these factors varying among our businesses. The following are some of the companies we view as significant competitors in each of our three business segments, with relevant brand names, when different from the company name, shown in parentheses. The marks below may be the registered or unregistered trademarks or trade names of their respective owners.
• Residential Heating & Cooling - United Technologies Corp. (Carrier, Bryant, Tempstar, Comfortmaker, Heil, Arcoaire, KeepRite, Day & Night); Ingersoll-Rand plc (Trane, American Standard); Paloma Industries, Inc. (Rheem, Ruud); Johnson Controls, Inc. (York); Daikin Industries, Ltd. (Goodman, Amana); and Melrose Industries PLC (Maytag, Westinghouse, Frigidaire, Tappan, Philco, Kelvinator, Gibson, Broan, NuTone).
• Commercial Heating & Cooling - United Technologies Corp. (Carrier, ICP Commercial); Ingersoll-Rand plc (Trane); Paloma Industries, Inc. (Rheem, Ruud); Johnson Controls, Inc. (York); Daikin Industries, Ltd. (Goodman, McQuay); Melrose
5
Industries PLC (Mammoth); and AAON, Inc.
• Refrigeration - Hussmann Corporation; Paloma Industries, Inc. (Rheem Manufacturing Company (Heat Transfer Products Group)); Emerson Electric Co. (Copeland); United Technologies Corp. (Carrier); GEA Group (Kuba, Searle, Goedhart); Alfa Laval; Guntner GmbH; and Panasonic Corp. (Sanyo).
Employees
As of December 31, 2016, we employed approximately 10,600 employees. Approximately 5,100 of these employees were salaried and 5,500 were hourly. The number of hourly workers we employ may vary in order to match our labor needs during periods of fluctuating demand. Approximately 2,400 employees, including international locations, are represented by unions. We believe we have good relationships with our employees and with the unions representing our employees. We currently do not anticipate any material adverse consequences resulting from negotiations to renew any collective bargaining agreements.
Environmental Regulation
Our operations are subject to evolving and often increasingly stringent international, federal, state and local laws and regulations concerning the environment. Environmental laws that affect or could affect our domestic operations include, among others, the National Appliance Energy Conservation Act of 1987, as amended (“NAECA”), the Energy Policy Act, the Energy Policy and Conservation Act, the Clean Air Act, the Clean Water Act, the Resource Conservation and Recovery Act, the Comprehensive Environmental Response, Compensation and Liability Act, the National Environmental Policy Act, the Toxic Substances Control Act, any regulations promulgated under these acts and various other international, federal, state and local laws and regulations governing environmental matters. We believe we are in substantial compliance with such existing environmental laws and regulations.
Energy Efficiency. The U.S. Department of Energy has numerous active energy conservation rulemakings that impact residential and commercial heating, air conditioning and refrigeration equipment. We are actively involved in U.S. Department of Energy and Congressional activities related to energy efficiency. We are prepared to have compliant products in place in advance of the effectiveness of all such regulations being considered by the U.S. Department of Energy.
Refrigerants. The use of hydrochlorofluorocarbons ("HCFCs”) and hydroflurocarbons ("HFCs") as refrigerants for air conditioning and refrigeration equipment is common practice in the HVACR industry and is regulated. We believe we have complied with applicable rules and regulations in various countries governing the use of HCFCs and HFCs. The U.S. Congress and the Environmental Protection Agency are considering steps to phase down the future use of HFCs in HVACR products and an international accord was adopted in October 2016 which would significantly phase-down the use of HFCs when ratified. We are an active participant in the ongoing international and domestic dialogue on this subject and are well positioned to react in a timely manner to changes in the regulatory landscape. In addition, we are taking proactive steps to implement responsible use principles and guidelines with respect to limiting refrigerants from escaping into the atmosphere throughout the life span of our HVACR equipment.
Remediation Activity. In addition to affecting our ongoing operations, applicable environmental laws can impose obligations to remediate hazardous substances at our properties, at properties formerly owned or operated by us and at facilities to which we have sent or send waste for treatment or disposal. We are aware of contamination at some of our facilities; however, based on facts presently known, we do not believe that any future remediation costs at such facilities will be material to our results of operations. For more information, see Note 10 in the Notes to our Consolidated Financial Statements.
In the past, we have received notices that we are a potentially responsible party along with other potentially responsible parties in Superfund proceedings under the Comprehensive Environmental Response, Compensation and Liability Act for cleanup of hazardous substances at certain sites to which the potentially responsible parties are alleged to have sent waste. Based on the facts presently known, we do not believe environmental cleanup costs associated with any Superfund sites about which we have received notice that we are a potentially responsible party will be material.
European WEEE and RoHS Compliance. In the European marketplace, electrical and electronic equipment is required to comply with the Directive on Waste Electrical and Electronic Equipment (“WEEE”) and the Directive on Restriction of Use of Certain Hazardous Substances (“RoHS”). WEEE aims to prevent waste by encouraging reuse and recycling and RoHS restricts the use of six hazardous substances in electrical and electronic products. All HVACR products and certain components of such products “put on the market” in the EU (whether or not manufactured in the EU) are potentially subject to WEEE and RoHS. Because all HVACR manufacturers selling within or from the EU are subject to the standards promulgated under WEEE and RoHS, we believe that neither WEEE nor RoHS uniquely impacts us as compared to such other manufacturers. Similar directives
6
are being introduced in other parts of the world, including the U.S. For example, California, China and Japan have all adopted standards possessing similar intent as RoHS. We are actively monitoring the development of such directives and believe we are well positioned to comply with such directives in the required time frames.
Available Information
Our web site address is www.lennoxinternational.com. We make available, free of charge through our web site, our annual reports on Form 10-K, quarterly reports on Form 10-Q, current reports on Form 8-K and amendments to those reports filed or furnished pursuant to the Securities Exchange Act of 1934, as amended (the "Exchange Act"), as soon as reasonably possible after such material is electronically filed with, or furnished to, the Securities and Exchange Commission. The information on our web site is not a part of, or incorporated by reference into, this annual report on Form 10-K.
You can also read and copy any document that we file, including this Annual Report on Form 10-K, at the Securities and Exchange Commission's Public Reference Room at 100 F Street, N.E., Washington, D.C. 20549. Call the Securities and Exchange Commission at 1-800-SEC-0330 for information on the operation of the Public Reference Room. In addition, the Securities and Exchange Commission maintains a website at www.sec.gov that contains reports, proxy and information statements, and other information regarding issuers, including Lennox International, that file electronically with the Securities and Exchange Commission.
Executive Officers of the Company
Our executive officers, their present positions and their ages are as follows as of February 4, 2016:
Name Age PositionTodd M. Bluedorn 53 Chairman of the Board and Chief Executive Officer
Joseph W. Reitmeier 52 Executive Vice President and Chief Financial Officer
Douglas L. Young 54 Executive Vice President and President and Chief OperatingOfficer, LII Residential Heating & Cooling
Terry L. Johnston 59 Executive Vice President and President and Chief OperatingOfficer, LII North America Commercial Heating & Cooling
David W. Moon 55 Executive Vice President and President and Chief OperatingOfficer, LII Worldwide Refrigeration
Prakash Bedapudi 50 Executive Vice President and Chief Technology Officer
Daniel M. Sessa 52 Executive Vice President and Chief Human Resources Officer
John D. Torres 58 Executive Vice President, Chief Legal Officer and Secretary
Roy A. Rumbough, Jr. 61 Vice President, Controller and Chief Accounting Officer
Todd M. Bluedorn was appointed Chief Executive Officer and was elected to our Board of Directors in April 2007. Mr. Bluedorn was elected Chairman of the Board of Directors in May 2012. Prior to joining Lennox International, Mr. Bluedorn served in numerous senior management positions for United Technologies since 1995, including President, Americas - Otis Elevator Company; President, North America - Commercial Heating, Ventilation and Air Conditioning for Carrier Corporation; and President, Hamilton Sundstrand Industrial. He began his professional career with McKinsey & Company in 1992. A graduate of the United States Military Academy at West Point with a bachelor of science in electrical engineering, Mr. Bluedorn served in the United States Army as a combat engineer officer and United States Army Ranger from 1985 to 1990. He received his MBA from Harvard University School of Business in 1992. Mr. Bluedorn also serves on the Board of Directors of Eaton Corporation, a diversified industrial manufacturer, on the Board of Directors of Texas Instruments Incorporated, a global designer and manufacturer of semiconductors (effective March 1, 2017), and on the Board of Trustees of Washington University in St. Louis. Mr. Bluedorn possesses considerable industry knowledge and executive leadership experience. Mr. Bluedorn’s extensive knowledge of our Company and its business, combined with his drive for excellence and innovation, position him well to serve as CEO and a director of our Company.
7
Joseph W. Reitmeier was appointed Executive Vice President and Chief Financial Officer in July 2012. He had served as Vice President of Finance for the LII’s Commercial Heating & Cooling segment since 2007 and as Director of Internal Audit from 2005 to 2007. Before joining the company, he held financial leadership roles at Cummins Inc. and PolyOne Corporation. He is a director of Watts Water Technologies, Inc., a global provider of plumbing, heating and water quality solutions for residential, industrial, municipal and commercial settings. Mr. Reitmeier holds a bachelor’s degree in accounting from the University of Akron and an MBA from Case Western Reserve University. He is also a Certified Public Accountant.
Douglas L. Young was appointed Executive Vice President and President and Chief Operating Officer of LII's Residential Heating & Cooling segment in October 2006. Mr. Young had previously served as Vice President and General Manager of North American Residential Products since 2003 and as Vice President and General Manager of Lennox North American Residential Sales, Marketing, and Distribution from 1999 to 2003. Prior to his career with LII, Mr. Young was employed in the Appliances division of GE, where he held various management positions before serving as General Manager of Marketing for GE Appliance division's retail group from 1997 to 1999 and as General Manager of Strategic Initiatives in 1999. He holds a BSBA from Creighton University and a master’s of science in management from Purdue University. Mr. Young serves on the Board of Directors of Beacon Roofing Supply, a general building material distributor and is on the Board of Directors of AHRI (the Air-Conditioning, Heating, and Refrigeration Institute), the trade association for the HVACR and water heating equipment industries.
Terry L. Johnston was appointed Executive Vice President and President and Chief Operating Officer of LII's North America Commercial Heating & Cooling business in January 2013. Since May 2007, he had served as Vice President and General Manager, North America Commercial. He had previously served as Vice President, Marketing and Product Management, LII Worldwide Heating & Cooling and as Vice President, Marketing and Product Management for Lennox Industries. Before joining LII in 2001, Mr. Johnston worked for 20 years at GE in a variety of product management and sales and marketing roles. He is on the Board of Directors of CSW Industrials, Inc., a diversified industrial growth company with businesses in industrial products, coatings, sealants and adhesives and specialty chemicals segments. He holds a bachelor of science in marketing from the University of Arkansas.
David W. Moon was appointed Executive Vice President and President and Chief Operating Officer of LII's Worldwide Refrigeration business in August 2006. He had previously served as Vice President and General Manager of Worldwide Refrigeration, Americas Operations since 2002. Prior to serving in that position, he served as Managing Director in Australia beginning in 1999, where his responsibilities included heat transfer manufacturing and distribution, refrigeration wholesaling and manufacturing and HVAC manufacturing and distribution in Australia and New Zealand. Mr. Moon originally joined LII in 1998 as Operations Director, Asia Pacific. Prior to that time, Mr. Moon held various management positions at Allied Signal, Inc., Case Corporation, and Tenneco Inc. in the United States, Hong Kong, Taiwan and Germany. He holds a bachelor of science in civil engineering and an MBA from Texas A&M University. Mr. Moon serves on the Board of Directors of American Woodmark Corporation, a kitchen and bath cabinet manufacturer.
Prakash Bedapudi was appointed Executive Vice President and Chief Technology Officer in July 2008. He had previously served as Vice President, Global Engineering and Program Management for Trane Inc. Commercial Systems from 2006 through 2008, and as Vice President, Engineering and Technology for Trane's Residential Systems division from 2003 through 2006. Prior to his career at Trane, Mr. Bedapudi served in senior engineering leadership positions for GE Transportation Systems, a division of General Electric Company, and for Cummins Engine Company. He holds a bachelor of science in mechanical/automotive engineering from Karnataka University, India and a master's of science in mechanical/aeronautical engineering from the University of Cincinnati.
Daniel M. Sessa was appointed Executive Vice President and Chief Human Resources Officer in June 2007. He had previously served in numerous senior human resources and legal leadership positions for United Technologies Corporation since 1996, including Vice President, Human Resources for Otis Elevator Company - Americas from 2005 to 2007, Director, Employee Benefits and Human Resources Systems for United Technologies Corporation from 2004 to 2005, and Director, Human Resources for Pratt & Whitney from 2002 to 2004. He holds a bachelor of arts in law and society from the State University of New York at Binghamton and a juris doctor from the Hofstra University School of Law.
John D. Torres was appointed Executive Vice President and Chief Legal Officer and Secretary in December 2008. He had previously served as Senior Vice President, General Counsel and Secretary for Freescale Semiconductor, a semiconductor manufacturer that was originally part of Motorola. He joined Motorola's legal department as Senior Counsel in 1996 and was appointed Vice President, General Counsel of the company's semiconductor business in 2001. Prior to joining Motorola, Mr. Torres served 13 years in private practice in Phoenix, specializing in commercial law. He holds a bachelor of arts from Notre Dame and a juris doctor from the University of Chicago.
8
Roy A. Rumbough, Jr. was appointed Vice President, Controller and Chief Accounting Officer in July 2006. He had previously served as Vice President, Corporate Controller of Maytag Corporation, a position he held since 2002. From 1998 to 2002, he served as Vice President, Controller of Blodgett Corporation, a portfolio of food service equipment companies and former affiliate of Maytag. Mr. Rumbough's career at Maytag spanned 17 years and included internal audit, financial planning and analysis, and business unit controller roles. Prior to his career at Maytag, he worked for Deloitte and Touche, LLP. He holds a bachelor of arts in accounting from North Carolina State University and an MBA from the Kellogg School of Management, Northwestern University.
Item 1A. Risk Factors
Forward-Looking Statements
This Annual Report on Form 10-K contains forward-looking statements within the meaning of Section 27A of the Securities Act of 1933, as amended, and Section 21E of the Exchange Act that are based on information currently available to management as well as management's assumptions and beliefs as of the date hereof. All statements, other than statements of historical fact, included in this Annual Report on Form 10-K constitute forward-looking statements within the meaning of the Private Securities Litigation Reform Act of 1995. Forward-looking statements can be identified by the words “may,” “will,” “should,” “plan,” “predict,” “anticipate,” “believe,” “intend,” “estimate” and “expect” and similar expressions. Statements that are not historical should also be considered forward-looking statements. Such statements reflect our current views with respect to future events. Readers are cautioned not to place undue reliance on these forward-looking statements. We believe these statements are based on reasonable assumptions; however, such statements are inherently subject to risks and uncertainties, including but not limited to the specific uncertainties discussed elsewhere in this Annual Report on Form 10-K and the risk factors set forth in Item 1A. Risk Factors in this Annual Report on Form 10-K. These risks and uncertainties may affect our performance and results of operations. Should one or more of these risks or uncertainties materialize, or should underlying assumptions prove incorrect, actual results may differ materially from those in the forward-looking statements. We disclaim any intention or obligation to update or review any forward-looking statements or information, whether as a result of new information, future events or otherwise unless required by law.
Risk Factors
The following risk factors and other information included in this Annual Report on Form 10-K should be carefully considered. We believe these are the principal material risks currently facing our business; however, additional risks and uncertainties not presently known to us or that we presently deem less significant may also impair our business operations. If any of the following risks or those disclosed in our other SEC filings actually occur, our business, financial condition or results of operations could be materially adversely affected.
We May Not be Able to Compete Favorably in the Competitive HVACR Business.
Substantially all of the markets in which we operate are competitive. The most significant competitive factors we face are product reliability, product performance, reputation of our company and brands, service and price, with the relative importance of these factors varying among our product lines. Other factors that affect competition in the HVACR market include the development and application of new technologies, an increasing emphasis on the development of more efficient HVACR products and new product introductions. We may not be able to adapt to market changes as quickly or effectively as our current and future competitors. Also, the establishment of manufacturing operations in low-cost countries could provide cost advantages to existing and emerging competitors. Some of our competitors may have greater financial resources than we have, allowing them to invest in more extensive research and development and/or marketing activity and making them better able to withstand adverse HVACR market conditions. Current and future competitive pressures may cause us to reduce our prices or lose market share, or could negatively affect our cash flow, all of which could have an adverse effect on our results of operations.
Our Financial Performance Is Affected by the Conditions of the U.S. Construction Industry.
Our business is affected by the performance of the U.S. construction industry. Our sales in the residential and commercial new construction markets correlate to the number of new homes and buildings that are built, which in turn is influenced by cyclical factors such as interest rates, inflation, availability of financing, consumer spending habits and confidence, employment rates and other macroeconomic factors over which we have no control. Although the industry has improved for the last several years, our sales may not continue to improve or such improvement may be limited or lower than expected.
9
Cooler than Normal Summers and Warmer than Normal Winters May Depress Our Sales.
Demand for our products and for our services is seasonal and strongly affected by the weather. Cooler than normal summers depress our sales of replacement air conditioning and refrigeration products and services. Similarly, warmer than normal winters have the same effect on our heating products and services.
Changes in Legislation or Government Regulations or Policies Can Have a Significant Impact on Our Results of Operations.
The sales, gross margins and profitability for each of our segments could be directly impacted by changes in legislation, trade agreements or government regulations, such as the changes to taxes, tariffs and trade agreements being discussed by the new U.S. administration. Changes in environmental and energy efficiency standards and regulations, such as the recent amendments to the Montreal Protocol to phase down the use of hydrofluorocarbons, may particularly have a significant impact on the types of products that we are allowed to develop and sell, and the types of products that are developed and sold by our competitors. Our inability or delay in developing or marketing products that match customer demand and that meet applicable efficiency and environmental standards may negatively impact our results. The demand for our products and services could also be affected by the size and availability of tax incentives for purchasers of our products and services. Future legislation or regulations, including environmental matters, product certification, product liability, tariffs, duties, taxes, tax incentives and other matters, may impact the results of each of our operating segments and our consolidated results.
Global General Business, Economic and Market Conditions Could Adversely Affect Our Financial Performance and Limit our Access to the Capital Markets.
Future disruptions in U.S. or global financial and credit markets or increases in the costs of capital might have an adverse impact on our business. The tightening, unavailability or increased costs of credit adversely affects the ability of our customers to obtain financing for significant purchases and operations, which could result in a decrease in sales of our products and services and may impact the ability of our customers to make payments to us. Similarly, tightening of credit may adversely affect our supplier base and increase the potential for one or more of our suppliers to experience financial distress or bankruptcy. Our business may also be adversely affected by future decreases in the general level of economic activity and increases in borrowing costs, which may cause our customers to cancel, decrease or delay their purchases of our products and services.
If financial markets were to deteriorate, or costs of capital were to increase significantly due to a lowering of our credit ratings, prevailing industry conditions, the volatility of the capital markets or other factors, we may be unable to obtain new financing on acceptable terms, or at all. A deterioration in our financial performance could also limit our future ability to access amounts currently available under our domestic credit facility. In addition, availability under our asset securitization agreement may be adversely impacted by credit quality and performance of our customer accounts receivable. The availability under our asset securitization agreement is based on the amount of accounts receivable that meet the eligibility criteria of the asset securitization agreement. If receivable losses increase or credit quality deteriorates, the amount of eligible receivables could decline and, in turn, lower the availability under the asset securitization.
We cannot predict the likelihood, duration or severity of any future disruption in financial markets or any adverse economic conditions in the U.S. and other countries.
Our International Operations Subject Us to Risks Including Foreign Currency Fluctuations, Regulations and Other Risks.
We earn revenue, pay expenses, own assets and incur liabilities in countries using currencies other than the U.S. dollar. Our consolidated financial statements are presented in U.S. dollars and we translate revenue, income, expenses, assets and liabilities into U.S. dollars at exchange rates in effect during or at the end of each reporting period. Therefore, increases or decreases in the value of the U.S. dollar relative to other currencies may affect our net operating revenues, operating income and the value of balance sheet items denominated in foreign currencies. Because of the geographic diversity of our operations, weaknesses in some currencies might be offset by strengths in others over time. However, we cannot assure that fluctuations in foreign currency exchange rates, particularly the strengthening of the U.S. dollar against major currencies, would not materially affect our financial results.
In addition to the currency exchange risks inherent in operating in foreign countries, our international sales and operations, including purchases of raw materials from international suppliers, are subject to risks associated with local government laws, regulations and policies (including those related to tariffs and trade barriers, investments, taxation, exchange controls, employment regulations and changes in laws and regulations). Our international sales and operations are also sensitive to changes in foreign national priorities, including government budgets, as well as to geopolitical and economic instability. International transactions may involve increased financial and legal risks due to differing legal systems and customs in foreign countries, as well as compliance
10
with anti-corruption laws such as the U.S. Foreign Corrupt Practices Act and the U.K. Bribery Act. The ability to manage these risks could be difficult and may limit our operations and make the manufacture and sale of our products internationally more difficult, which could negatively affect our business and results of operations.
Conflicts, wars, natural disasters or terrorist acts could also cause significant damage or disruption to our operations, employees, facilities, systems, suppliers, distributors, resellers or customers in the United States and internationally for extended periods of time and could also affect demand for our products.
Net sales outside of the United States comprised 18.5% of our net sales in 2016.
Our Ability to Meet Customer Demand may be Limited by Our Single-Location Production Facilities, Reliance on Certain Key Suppliers and Unanticipated Significant Shifts in Customer Demand.
We manufacture many of our products at single-location production facilities, and we rely on certain suppliers who also may concentrate production in single locations. Any significant interruptions in production at one or more of our facilities, or at a facility of one of our suppliers, could negatively impact our ability to deliver our products to our customers. Further, even with all of our facilities running at full production, we could potentially be unable to fully meet demand during an unanticipated period of exceptionally high demand. Our inability to meet our customers' demand for our products could have a material adverse impact on our business, financial condition and results of operations.
Price Volatility for Commodities and Components We Purchase or Significant Supply Interruptions Could Have an Adverse Effect on Our Cash Flow or Results of Operations.
We depend on raw materials, such as steel, copper and aluminum, and components purchased from third parties to manufacture our products. We generally concentrate purchases for a given raw material or component with a small number of suppliers. If a supplier is unable or unwilling to meet our supply requirements, including suffering any disruptions at its facilities or in its supply chain, we could experience supply interruptions or cost increases, either of which could have an adverse effect on our results of operations. Similarly, suppliers of components that we purchase for use in our products may be affected by rising material costs and pass these increased costs on to us. Although we regularly pre-purchase a portion of our raw materials at fixed prices each year to hedge against price increases, an increase in raw materials prices not covered by our fixed price arrangements could significantly increase our cost of goods sold and negatively impact our margins if we are unable to effectively pass such price increases on to our customers. Alternatively, if we increase our prices in response to increases in the prices or quantities of raw materials or components or if we encounter significant supply interruptions, our competitive position could be adversely affected, which may result in depressed sales and profitability.
In addition, we use derivatives to hedge price risk associated with forecasted purchases of certain raw materials. Our hedged prices could result in paying higher or lower prices for commodities as compared to the market prices for those commodities when purchased.
We May Incur Substantial Costs as a Result of Claims Which Could Have an Adverse Effect on Our Results of Operations.
The development, manufacture, sale and use of our products involve warranty, intellectual property infringement, product liability claim and other risks. In some cases, we may incur liability claims for the installation and service of our products. Our product liability insurance policies have limits that, if exceeded, may result in substantial costs that would have an adverse effect on our results of operations. In addition, warranty claims are not covered by our product liability insurance and certain product liability claims may also not be covered by our product liability insurance.
For some of our HVAC products, we provide warranty terms ranging from one to 20 years to customers for certain components such as compressors or heat exchangers. For certain limited products, we provided lifetime warranties for heat exchangers. Warranties of such extended lengths pose a risk to us as actual future costs may exceed our current estimates of those costs. Warranty expense is recorded on the date that revenue is recognized and requires significant assumptions about what costs will be incurred in the future. We may be required to record material adjustments to accruals and expense in the future if actual costs for these warranties are different from our assumptions.
11
If We Cannot Successfully Execute our Business Strategy, Our Results of Operations Could be Adversely Impacted
Our future success depends on our continued investment in research and new product development as well as our ability to commercialize new HVACR technological advances in domestic and global markets. If we are unable to continue to timely and successfully develop and market new products, achieve technological advances or extend our business model and technological advances into international markets, our business and results of operations could be adversely impacted.
We are engaged in various manufacturing rationalization actions designed to achieve our strategic priorities of manufacturing sourcing and distribution excellence and of lowering our cost structure. For example, we are continuing to reorganize our North American distribution network in order to better serve our customers' needs by deploying parts and equipment inventory closer to them and are expanding our sourcing activities outside of the U.S. We also continue to rationalize and reorganize various support and administrative functions in order to reduce ongoing selling and administrative expenses. If we cannot successfully implement such distribution and restructuring strategies or other cost savings plans, we may not achieve our expected cost savings in the time anticipated, or at all. In such case, our results of operations and profitability may be negatively impacted, making us less competitive and potentially causing us to lose market share.
We May Not be Able to Successfully Integrate and Operate Businesses that We May Acquire nor Realize the Anticipated Benefits of Strategic Relationships We May Form.
From time to time, we may seek to complement or expand our businesses through strategic acquisitions, joint ventures and strategic relationships. The success of these transactions will depend, in part, on our ability to timely identify those relationships, negotiate and close the transactions and then integrate, manage and operate those businesses profitably. If we are unable to successfully do those things, we may not realize the anticipated benefits associated with such transactions, which could adversely affect our business and results of operations.
Because a Significant Percentage of Our Workforce is Unionized in Certain Manufacturing Facilities, We Face Risks of Work Stoppages and Other Labor Relations Problems.
As of February 6, 2017, approximately 23% of our workforce, including international locations, was unionized. The results of future negotiations with these unions and the effects of any production interruptions or labor stoppages could have an adverse effect on our results of operations.
We are Subject to Litigation and Tax, Environmental and Other Regulations that Could Have an Adverse Effect on Our Results of Operations.
We are involved in various claims and lawsuits incidental to our business, including those involving product liability, labor relations, alleged exposure to asbestos-containing materials and environmental matters, some of which claim significant damages. Estimates related to our claims and lawsuits, including estimates for asbestos-related claims and related insurance recoveries, involve numerous uncertainties. Given the inherent uncertainty of litigation and estimates, we cannot be certain that existing claims or litigation or any future adverse legal developments will not have a material adverse impact on our financial condition. In addition, we are subject to extensive and changing federal, state and local laws and regulations designed to protect the environment. These laws and regulations could impose liability for remediation costs and civil or criminal penalties in cases of non-compliance. Compliance with environmental laws increases our costs of doing business. Because these laws are subject to frequent change, we are unable to predict the future costs resulting from environmental compliance.
Any Future Determination that a Significant Impairment of the Value of Our Goodwill Intangible Asset Occurred Could Have a Material Adverse Effect on Our Results of Operations.
As of December 31, 2016, we had goodwill of $195.1 million on our Consolidated Balance Sheet. Any future determination that an impairment of the value of goodwill occurred would require a write-down of the impaired portion of goodwill to fair value and would reduce our assets and stockholders' equity and could have a material adverse effect on our results of operations.
12
Volatility in Capital Markets Could Necessitate Increased Cash Contributions by Us to Our Pension Plans to Maintain Required Levels of Funding.
Volatility in the capital markets may have a significant impact on the funding status of our defined benefit pension plans. If the performance of the capital markets depresses the value of our defined benefit pension plan assets or increases the liabilities, we would be required to make additional contributions to the pension plans. The amount of contributions we may be required to make to our pension plans in the future is uncertain and could be significant, which may have a material impact on our results of operations.
Security Breaches and Other Disruptions or Misuse of Information Systems We Rely Upon Could Affect Our Ability to Conduct Our Business Effectively.
Our information systems and those of our business partners are important to our business activities. We also outsource various information systems, including data management, to third party service providers. Despite our security measures as well as those of our business partners and third-party service providers, the information systems we rely upon may be vulnerable to interruption or damage from computer hackings, computer viruses, worms or other destructive or disruptive software, process breakdowns, denial of service attacks, malicious social engineering or other malicious activities, or any combination thereof. These information systems have been, and will likely continue to be, subject to attack. While we have implemented controls and taken other preventative actions to strengthen these systems against future attacks, we can give no assurance that these controls and preventative actions will be effective. Any breach of data security could result in a disruption of our services or improper disclosure of personal data or confidential information, which could harm our reputation, require us to expend resources to remedy such a security breach or defend against further attacks or subject us to liability under laws that protect personal data, resulting in increased operating costs or loss of revenue.
Our Results of Operations May Suffer if We Cannot Continue to License or Enforce the Intellectual Property Rights on Which Our Businesses Depend or if Third Parties Assert That We Violate Their Intellectual Property Rights.
We rely upon patent, copyright, trademark and trade secret laws and agreements to establish and maintain intellectual property rights in the products we sell. Our intellectual property rights could be challenged, invalidated, infringed, circumvented, or be insufficient to permit us to take advantage of current market trends or to otherwise provide competitive advantages. Further, the laws of certain countries do not protect proprietary rights to the same extent as the laws of the United States.
Third parties may also claim that we are infringing upon their intellectual property rights. If we do not license infringed intellectual property or if we are required to substitute similar technology from another source, our operations could be adversely affected. Even if we believe that intellectual property claims are without merit, they can be time consuming, require significant resources and be costly to defend. Claims of intellectual property infringement also might require us to redesign affected products, pay costly damage awards, or face injunction prohibiting us from manufacturing, importing, marketing or selling certain of our products. Even if we have agreements to indemnify us, indemnifying parties may be unable or unwilling to do so.
Item 1B. Unresolved Staff Comments
None.
13
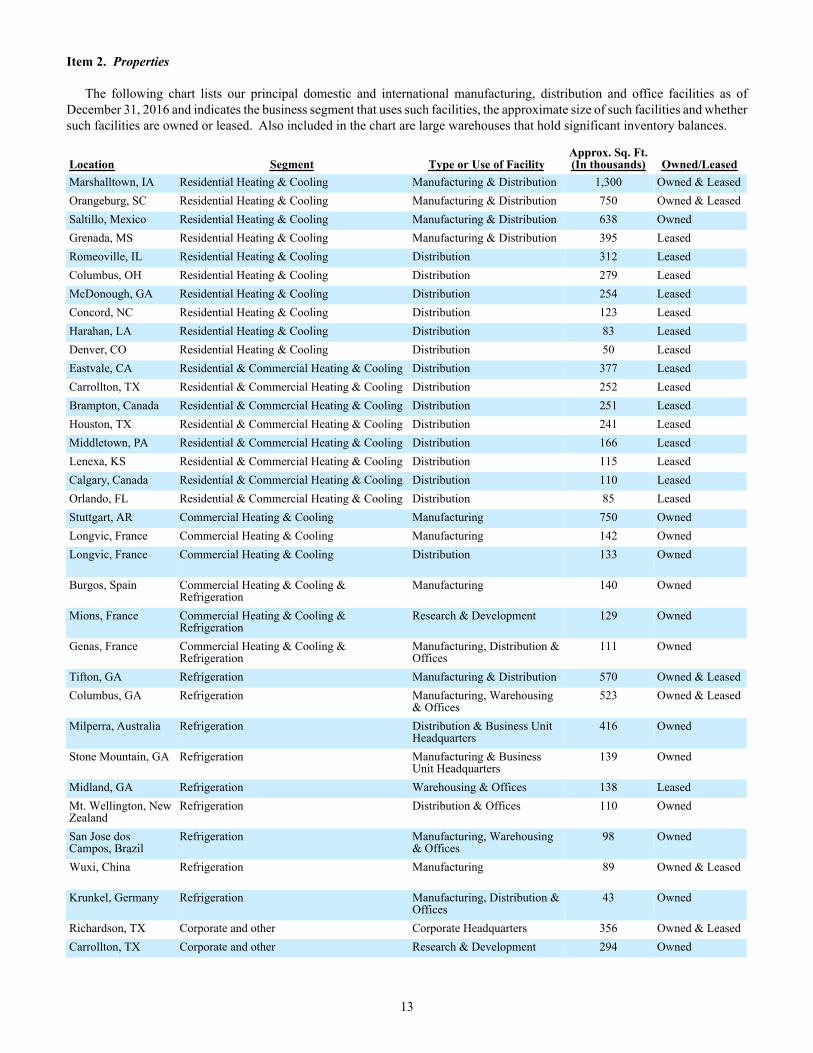
Item 2. Properties
The following chart lists our principal domestic and international manufacturing, distribution and office facilities as of December 31, 2016 and indicates the business segment that uses such facilities, the approximate size of such facilities and whether such facilities are owned or leased. Also included in the chart are large warehouses that hold significant inventory balances.
Location Segment Type or Use of FacilityApprox. Sq. Ft. (In thousands) Owned/Leased
Marshalltown, IA Residential Heating & Cooling Manufacturing & Distribution 1,300 Owned & LeasedOrangeburg, SC Residential Heating & Cooling Manufacturing & Distribution 750 Owned & LeasedSaltillo, Mexico Residential Heating & Cooling Manufacturing & Distribution 638 OwnedGrenada, MS Residential Heating & Cooling Manufacturing & Distribution 395 LeasedRomeoville, IL Residential Heating & Cooling Distribution 312 LeasedColumbus, OH Residential Heating & Cooling Distribution 279 LeasedMcDonough, GA Residential Heating & Cooling Distribution 254 LeasedConcord, NC Residential Heating & Cooling Distribution 123 LeasedHarahan, LA Residential Heating & Cooling Distribution 83 LeasedDenver, CO Residential Heating & Cooling Distribution 50 LeasedEastvale, CA Residential & Commercial Heating & Cooling Distribution 377 LeasedCarrollton, TX Residential & Commercial Heating & Cooling Distribution 252 LeasedBrampton, Canada Residential & Commercial Heating & Cooling Distribution 251 LeasedHouston, TX Residential & Commercial Heating & Cooling Distribution 241 LeasedMiddletown, PA Residential & Commercial Heating & Cooling Distribution 166 LeasedLenexa, KS Residential & Commercial Heating & Cooling Distribution 115 LeasedCalgary, Canada Residential & Commercial Heating & Cooling Distribution 110 LeasedOrlando, FL Residential & Commercial Heating & Cooling Distribution 85 LeasedStuttgart, AR Commercial Heating & Cooling Manufacturing 750 OwnedLongvic, France Commercial Heating & Cooling Manufacturing 142 OwnedLongvic, France Commercial Heating & Cooling Distribution 133 Owned
Burgos, Spain Commercial Heating & Cooling &Refrigeration
Manufacturing 140 Owned
Mions, France Commercial Heating & Cooling &Refrigeration
Research & Development 129 Owned
Genas, France Commercial Heating & Cooling &Refrigeration
Manufacturing, Distribution &Offices
111 Owned
Tifton, GA Refrigeration Manufacturing & Distribution 570 Owned & LeasedColumbus, GA Refrigeration Manufacturing, Warehousing
& Offices523 Owned & Leased
Milperra, Australia Refrigeration Distribution & Business UnitHeadquarters
416 Owned
Stone Mountain, GA Refrigeration Manufacturing & BusinessUnit Headquarters
139 Owned
Midland, GA Refrigeration Warehousing & Offices 138 LeasedMt. Wellington, NewZealand
Refrigeration Distribution & Offices 110 Owned
San Jose dosCampos, Brazil
Refrigeration Manufacturing, Warehousing& Offices
98 Owned
Wuxi, China Refrigeration Manufacturing 89 Owned & Leased
Krunkel, Germany Refrigeration Manufacturing, Distribution &Offices
43 Owned
Richardson, TX Corporate and other Corporate Headquarters 356 Owned & LeasedCarrollton, TX Corporate and other Research & Development 294 Owned
14
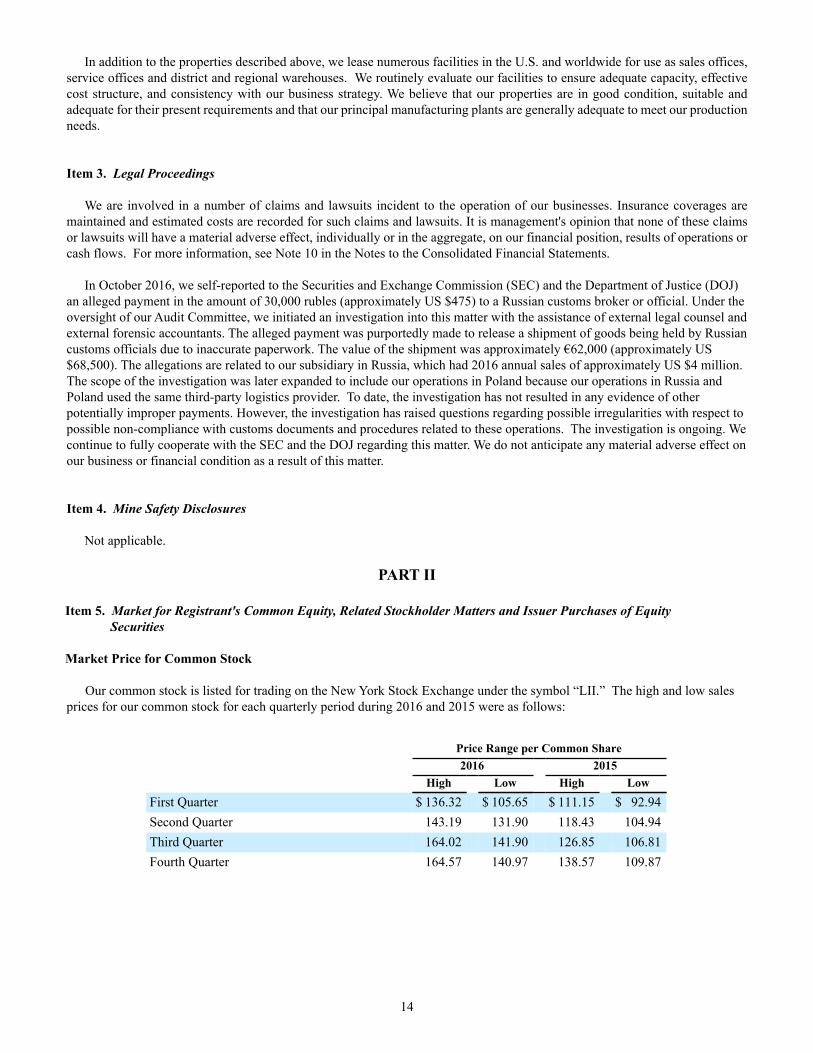
In addition to the properties described above, we lease numerous facilities in the U.S. and worldwide for use as sales offices, service offices and district and regional warehouses. We routinely evaluate our facilities to ensure adequate capacity, effective cost structure, and consistency with our business strategy. We believe that our properties are in good condition, suitable and adequate for their present requirements and that our principal manufacturing plants are generally adequate to meet our production needs.
Item 3. Legal Proceedings
We are involved in a number of claims and lawsuits incident to the operation of our businesses. Insurance coverages are maintained and estimated costs are recorded for such claims and lawsuits. It is management's opinion that none of these claims or lawsuits will have a material adverse effect, individually or in the aggregate, on our financial position, results of operations or cash flows. For more information, see Note 10 in the Notes to the Consolidated Financial Statements.
In October 2016, we self-reported to the Securities and Exchange Commission (SEC) and the Department of Justice (DOJ) an alleged payment in the amount of 30,000 rubles (approximately US $475) to a Russian customs broker or official. Under the oversight of our Audit Committee, we initiated an investigation into this matter with the assistance of external legal counsel and external forensic accountants. The alleged payment was purportedly made to release a shipment of goods being held by Russian customs officials due to inaccurate paperwork. The value of the shipment was approximately €62,000 (approximately US $68,500). The allegations are related to our subsidiary in Russia, which had 2016 annual sales of approximately US $4 million. The scope of the investigation was later expanded to include our operations in Poland because our operations in Russia and Poland used the same third-party logistics provider. To date, the investigation has not resulted in any evidence of other potentially improper payments. However, the investigation has raised questions regarding possible irregularities with respect to possible non-compliance with customs documents and procedures related to these operations. The investigation is ongoing. We continue to fully cooperate with the SEC and the DOJ regarding this matter. We do not anticipate any material adverse effect on our business or financial condition as a result of this matter.
Item 4. Mine Safety Disclosures
Not applicable.
PART II
Item 5. Market for Registrant's Common Equity, Related Stockholder Matters and Issuer Purchases of Equity Securities
Market Price for Common Stock
Our common stock is listed for trading on the New York Stock Exchange under the symbol “LII.” The high and low sales prices for our common stock for each quarterly period during 2016 and 2015 were as follows:
Price Range per Common Share2016 2015
High Low High LowFirst Quarter $ 136.32 $ 105.65 $ 111.15 $ 92.94Second Quarter 143.19 131.90 118.43 104.94Third Quarter 164.02 141.90 126.85 106.81Fourth Quarter 164.57 140.97 138.57 109.87
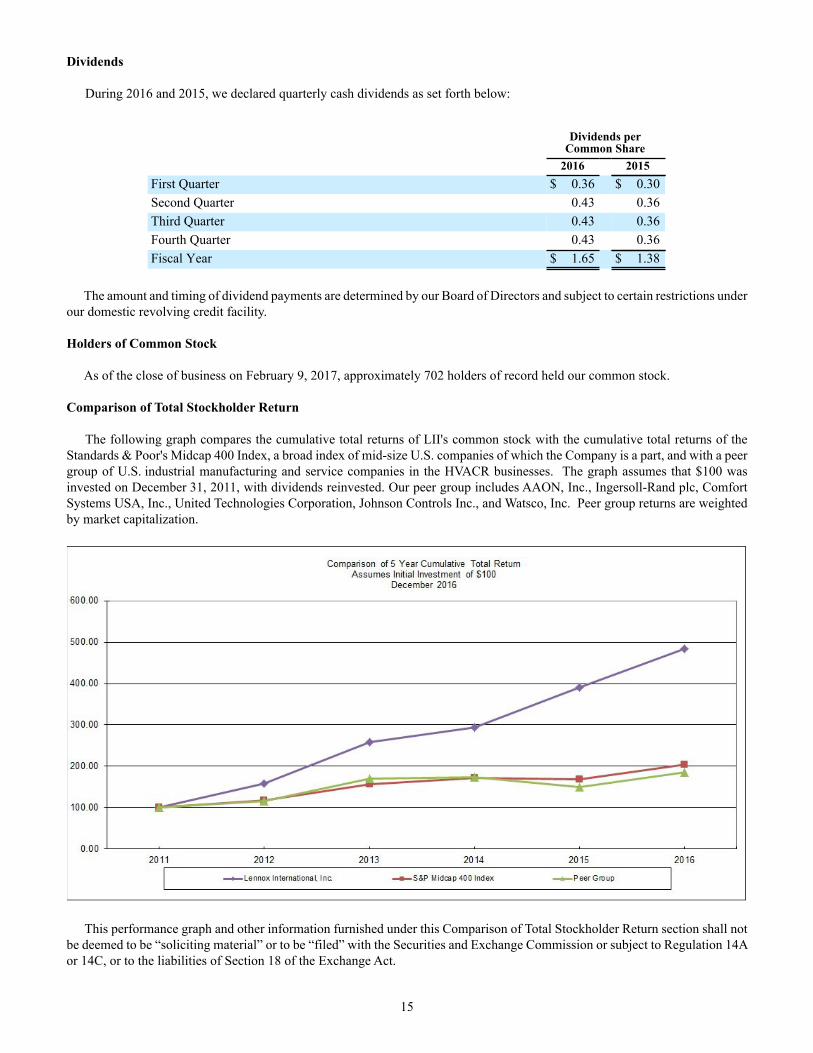
15
Dividends
During 2016 and 2015, we declared quarterly cash dividends as set forth below:
Dividends perCommon Share
2016 2015First Quarter $ 0.36 $ 0.30Second Quarter 0.43 0.36Third Quarter 0.43 0.36Fourth Quarter 0.43 0.36Fiscal Year $ 1.65 $ 1.38
The amount and timing of dividend payments are determined by our Board of Directors and subject to certain restrictions under our domestic revolving credit facility.
Holders of Common Stock
As of the close of business on February 9, 2017, approximately 702 holders of record held our common stock.
Comparison of Total Stockholder Return
The following graph compares the cumulative total returns of LII's common stock with the cumulative total returns of the Standards & Poor's Midcap 400 Index, a broad index of mid-size U.S. companies of which the Company is a part, and with a peer group of U.S. industrial manufacturing and service companies in the HVACR businesses. The graph assumes that $100 was invested on December 31, 2011, with dividends reinvested. Our peer group includes AAON, Inc., Ingersoll-Rand plc, Comfort Systems USA, Inc., United Technologies Corporation, Johnson Controls Inc., and Watsco, Inc. Peer group returns are weighted by market capitalization.
This performance graph and other information furnished under this Comparison of Total Stockholder Return section shall not be deemed to be “soliciting material” or to be “filed” with the Securities and Exchange Commission or subject to Regulation 14A or 14C, or to the liabilities of Section 18 of the Exchange Act.
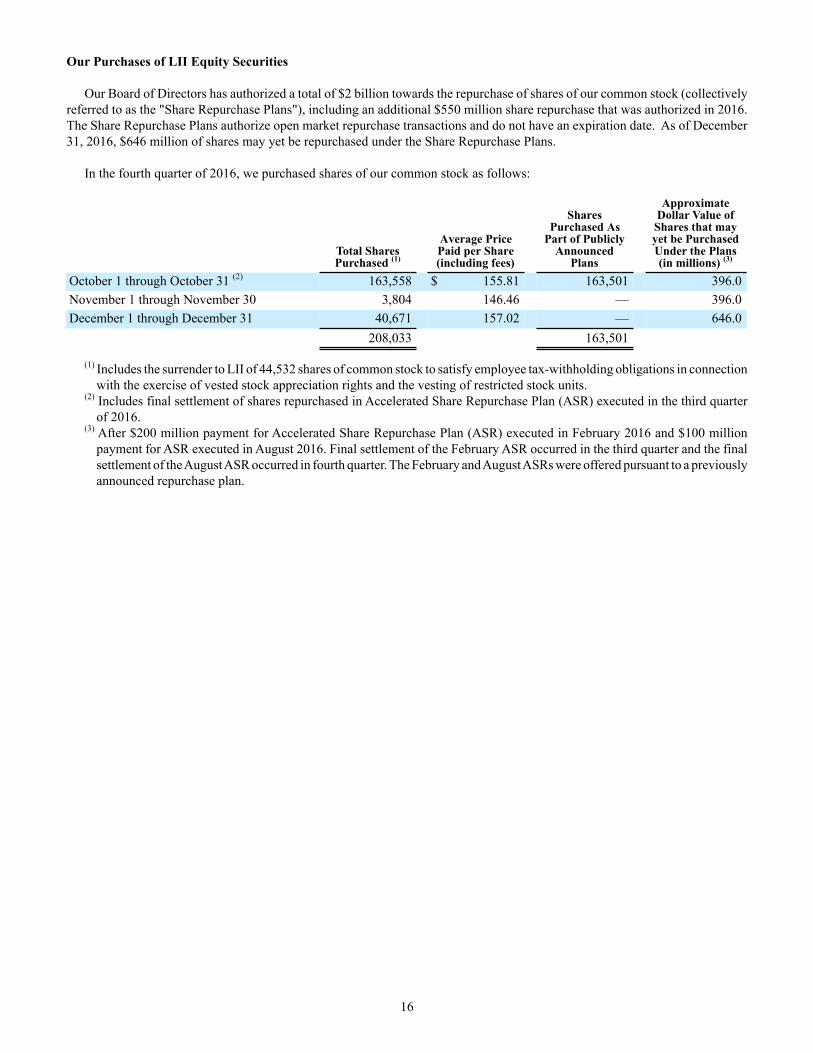
16
Our Purchases of LII Equity Securities Our Board of Directors has authorized a total of $2 billion towards the repurchase of shares of our common stock (collectively
referred to as the "Share Repurchase Plans"), including an additional $550 million share repurchase that was authorized in 2016. The Share Repurchase Plans authorize open market repurchase transactions and do not have an expiration date. As of December 31, 2016, $646 million of shares may yet be repurchased under the Share Repurchase Plans.
In the fourth quarter of 2016, we purchased shares of our common stock as follows:
Total Shares Purchased (1)
Average PricePaid per Share(including fees)
SharesPurchased As
Part of PubliclyAnnounced
Plans
Approximate Dollar Value of Shares that may yet be Purchased Under the Plans (in millions) (3)
October 1 through October 31 (2) 163,558 $ 155.81 163,501 396.0November 1 through November 30 3,804 146.46 — 396.0December 1 through December 31 40,671 157.02 — 646.0
208,033 163,501
(1) Includes the surrender to LII of 44,532 shares of common stock to satisfy employee tax-withholding obligations in connection with the exercise of vested stock appreciation rights and the vesting of restricted stock units.
(2) Includes final settlement of shares repurchased in Accelerated Share Repurchase Plan (ASR) executed in the third quarter of 2016.
(3) After $200 million payment for Accelerated Share Repurchase Plan (ASR) executed in February 2016 and $100 million payment for ASR executed in August 2016. Final settlement of the February ASR occurred in the third quarter and the final settlement of the August ASR occurred in fourth quarter. The February and August ASRs were offered pursuant to a previously announced repurchase plan.
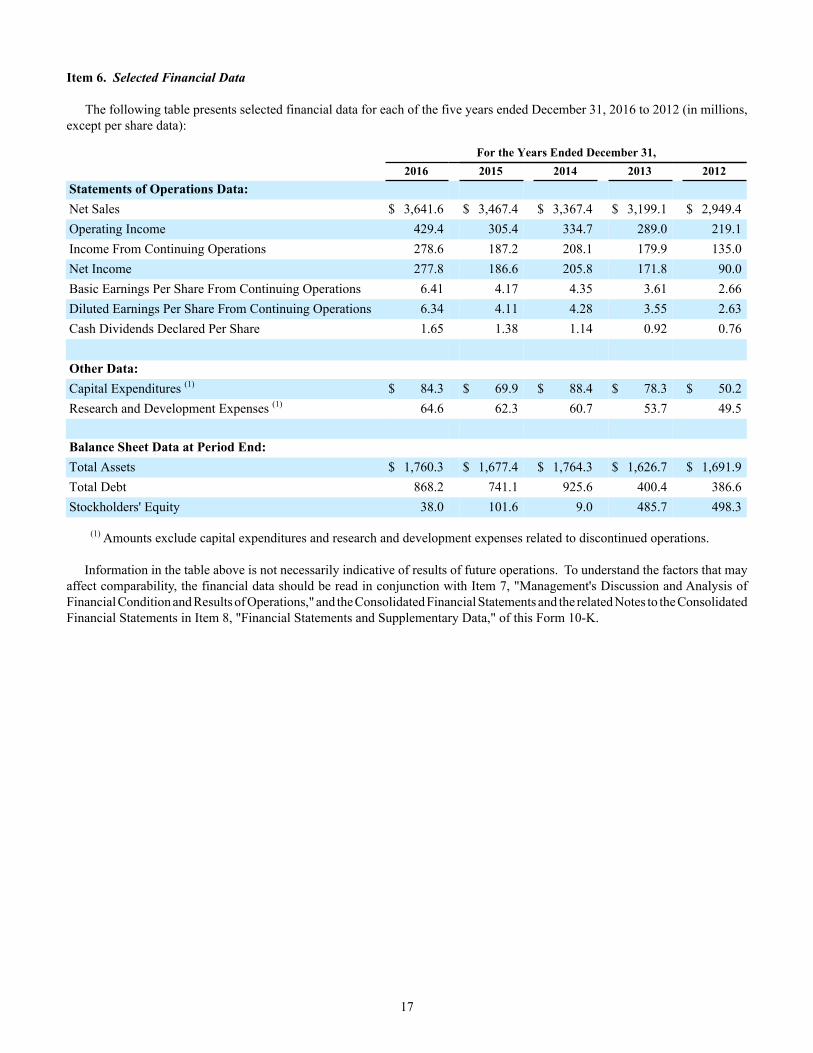
17
Item 6. Selected Financial Data
The following table presents selected financial data for each of the five years ended December 31, 2016 to 2012 (in millions, except per share data):
For the Years Ended December 31,2016 2015 2014 2013 2012
Statements of Operations Data:Net Sales $ 3,641.6 $ 3,467.4 $ 3,367.4 $ 3,199.1 $ 2,949.4Operating Income 429.4 305.4 334.7 289.0 219.1Income From Continuing Operations 278.6 187.2 208.1 179.9 135.0Net Income 277.8 186.6 205.8 171.8 90.0Basic Earnings Per Share From Continuing Operations 6.41 4.17 4.35 3.61 2.66Diluted Earnings Per Share From Continuing Operations 6.34 4.11 4.28 3.55 2.63Cash Dividends Declared Per Share 1.65 1.38 1.14 0.92 0.76
Other Data:Capital Expenditures (1) $ 84.3 $ 69.9 $ 88.4 $ 78.3 $ 50.2Research and Development Expenses (1) 64.6 62.3 60.7 53.7 49.5
Balance Sheet Data at Period End:Total Assets $ 1,760.3 $ 1,677.4 $ 1,764.3 $ 1,626.7 $ 1,691.9Total Debt 868.2 741.1 925.6 400.4 386.6Stockholders' Equity 38.0 101.6 9.0 485.7 498.3
(1) Amounts exclude capital expenditures and research and development expenses related to discontinued operations.
Information in the table above is not necessarily indicative of results of future operations. To understand the factors that may affect comparability, the financial data should be read in conjunction with Item 7, "Management's Discussion and Analysis of Financial Condition and Results of Operations," and the Consolidated Financial Statements and the related Notes to the Consolidated Financial Statements in Item 8, "Financial Statements and Supplementary Data," of this Form 10-K.
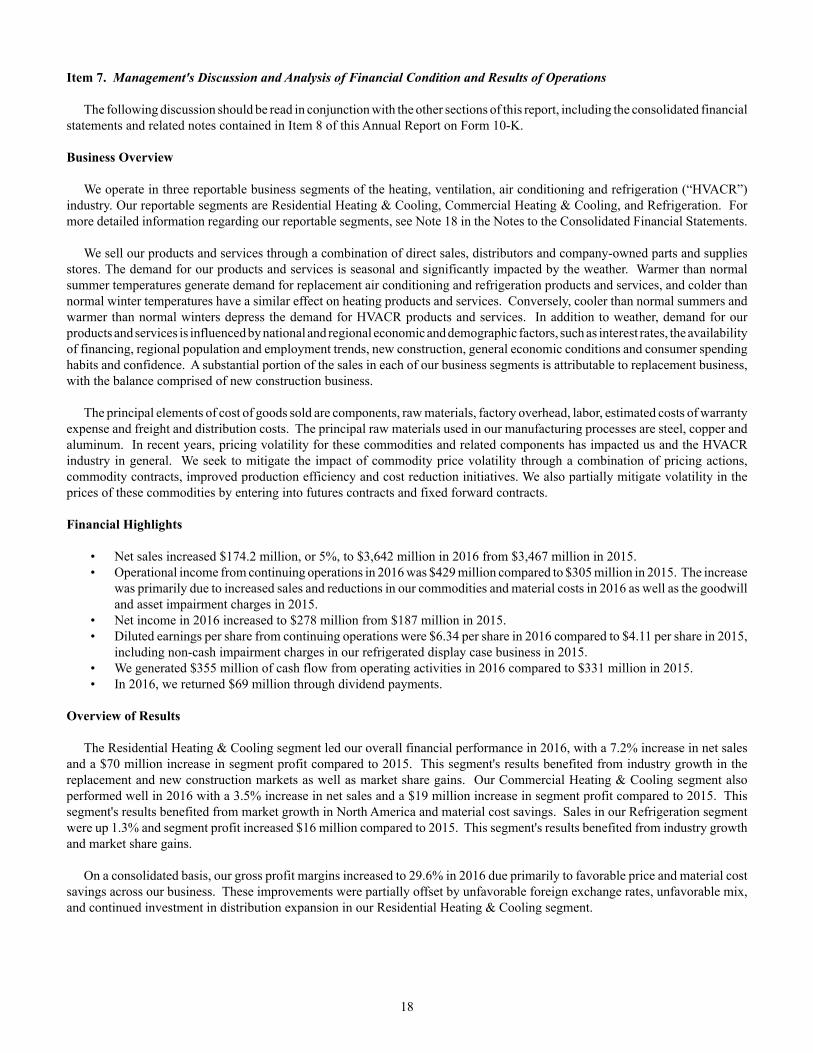
18
Item 7. Management's Discussion and Analysis of Financial Condition and Results of Operations
The following discussion should be read in conjunction with the other sections of this report, including the consolidated financial statements and related notes contained in Item 8 of this Annual Report on Form 10-K.
Business Overview
We operate in three reportable business segments of the heating, ventilation, air conditioning and refrigeration (“HVACR”) industry. Our reportable segments are Residential Heating & Cooling, Commercial Heating & Cooling, and Refrigeration. For more detailed information regarding our reportable segments, see Note 18 in the Notes to the Consolidated Financial Statements.
We sell our products and services through a combination of direct sales, distributors and company-owned parts and supplies stores. The demand for our products and services is seasonal and significantly impacted by the weather. Warmer than normal summer temperatures generate demand for replacement air conditioning and refrigeration products and services, and colder than normal winter temperatures have a similar effect on heating products and services. Conversely, cooler than normal summers and warmer than normal winters depress the demand for HVACR products and services. In addition to weather, demand for our products and services is influenced by national and regional economic and demographic factors, such as interest rates, the availability of financing, regional population and employment trends, new construction, general economic conditions and consumer spending habits and confidence. A substantial portion of the sales in each of our business segments is attributable to replacement business, with the balance comprised of new construction business.
The principal elements of cost of goods sold are components, raw materials, factory overhead, labor, estimated costs of warranty expense and freight and distribution costs. The principal raw materials used in our manufacturing processes are steel, copper and aluminum. In recent years, pricing volatility for these commodities and related components has impacted us and the HVACR industry in general. We seek to mitigate the impact of commodity price volatility through a combination of pricing actions, commodity contracts, improved production efficiency and cost reduction initiatives. We also partially mitigate volatility in the prices of these commodities by entering into futures contracts and fixed forward contracts.
Financial Highlights
• Net sales increased $174.2 million, or 5%, to $3,642 million in 2016 from $3,467 million in 2015. • Operational income from continuing operations in 2016 was $429 million compared to $305 million in 2015. The increase
was primarily due to increased sales and reductions in our commodities and material costs in 2016 as well as the goodwill and asset impairment charges in 2015.
• Net income in 2016 increased to $278 million from $187 million in 2015. • Diluted earnings per share from continuing operations were $6.34 per share in 2016 compared to $4.11 per share in 2015,
including non-cash impairment charges in our refrigerated display case business in 2015. • We generated $355 million of cash flow from operating activities in 2016 compared to $331 million in 2015. • In 2016, we returned $69 million through dividend payments.
Overview of Results
The Residential Heating & Cooling segment led our overall financial performance in 2016, with a 7.2% increase in net sales and a $70 million increase in segment profit compared to 2015. This segment's results benefited from industry growth in the replacement and new construction markets as well as market share gains. Our Commercial Heating & Cooling segment also performed well in 2016 with a 3.5% increase in net sales and a $19 million increase in segment profit compared to 2015. This segment's results benefited from market growth in North America and material cost savings. Sales in our Refrigeration segment were up 1.3% and segment profit increased $16 million compared to 2015. This segment's results benefited from industry growth and market share gains.
On a consolidated basis, our gross profit margins increased to 29.6% in 2016 due primarily to favorable price and material cost savings across our business. These improvements were partially offset by unfavorable foreign exchange rates, unfavorable mix, and continued investment in distribution expansion in our Residential Heating & Cooling segment.
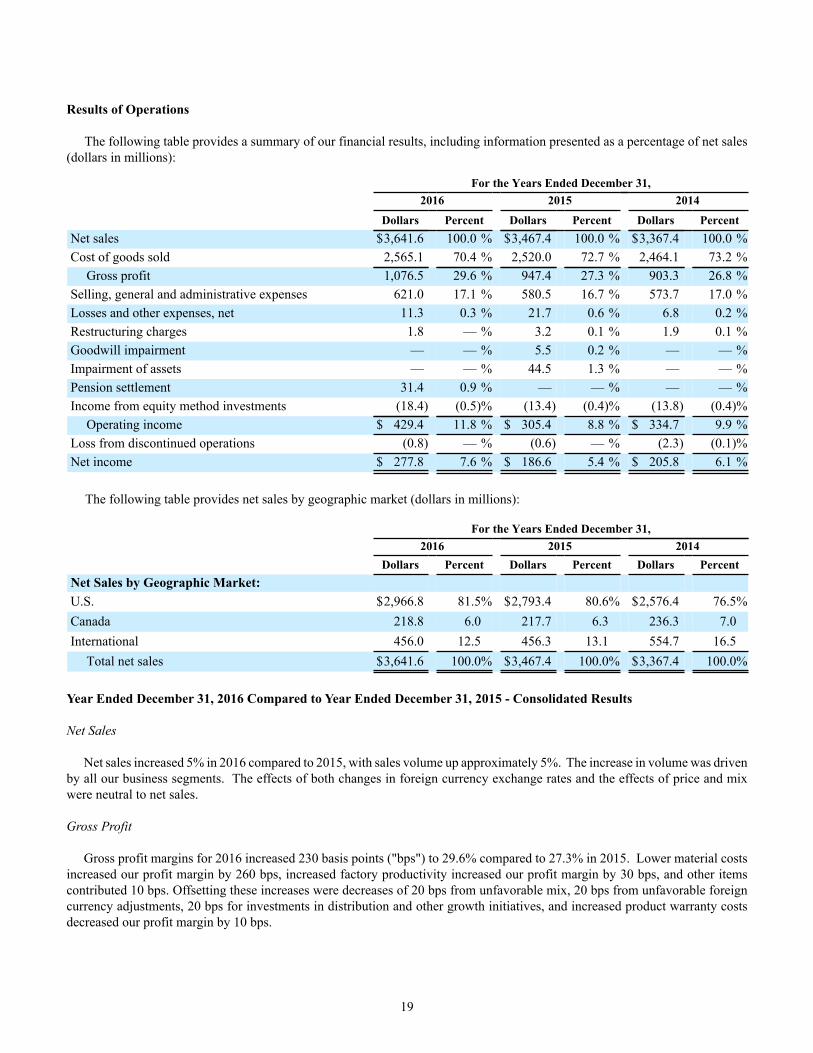
19
Results of Operations
The following table provides a summary of our financial results, including information presented as a percentage of net sales (dollars in millions):
For the Years Ended December 31,2016 2015 2014
Dollars Percent Dollars Percent Dollars PercentNet sales $3,641.6 100.0 % $3,467.4 100.0 % $3,367.4 100.0 %Cost of goods sold 2,565.1 70.4 % 2,520.0 72.7 % 2,464.1 73.2 %
Gross profit 1,076.5 29.6 % 947.4 27.3 % 903.3 26.8 %Selling, general and administrative expenses 621.0 17.1 % 580.5 16.7 % 573.7 17.0 %Losses and other expenses, net 11.3 0.3 % 21.7 0.6 % 6.8 0.2 %Restructuring charges 1.8 — % 3.2 0.1 % 1.9 0.1 %Goodwill impairment — — % 5.5 0.2 % — — %Impairment of assets — — % 44.5 1.3 % — — %Pension settlement 31.4 0.9 % — — % — — %Income from equity method investments (18.4) (0.5)% (13.4) (0.4)% (13.8) (0.4)%
Operating income $ 429.4 11.8 % $ 305.4 8.8 % $ 334.7 9.9 %Loss from discontinued operations (0.8) — % (0.6) — % (2.3) (0.1)%Net income $ 277.8 7.6 % $ 186.6 5.4 % $ 205.8 6.1 %
The following table provides net sales by geographic market (dollars in millions):
For the Years Ended December 31,2016 2015 2014
Dollars Percent Dollars Percent Dollars PercentNet Sales by Geographic Market:U.S. $2,966.8 81.5% $2,793.4 80.6% $2,576.4 76.5%Canada 218.8 6.0 217.7 6.3 236.3 7.0International 456.0 12.5 456.3 13.1 554.7 16.5
Total net sales $3,641.6 100.0% $3,467.4 100.0% $3,367.4 100.0%
Year Ended December 31, 2016 Compared to Year Ended December 31, 2015 - Consolidated Results
Net Sales
Net sales increased 5% in 2016 compared to 2015, with sales volume up approximately 5%. The increase in volume was driven by all our business segments. The effects of both changes in foreign currency exchange rates and the effects of price and mix were neutral to net sales.
Gross Profit
Gross profit margins for 2016 increased 230 basis points ("bps") to 29.6% compared to 27.3% in 2015. Lower material costs increased our profit margin by 260 bps, increased factory productivity increased our profit margin by 30 bps, and other items contributed 10 bps. Offsetting these increases were decreases of 20 bps from unfavorable mix, 20 bps from unfavorable foreign currency adjustments, 20 bps for investments in distribution and other growth initiatives, and increased product warranty costs decreased our profit margin by 10 bps.
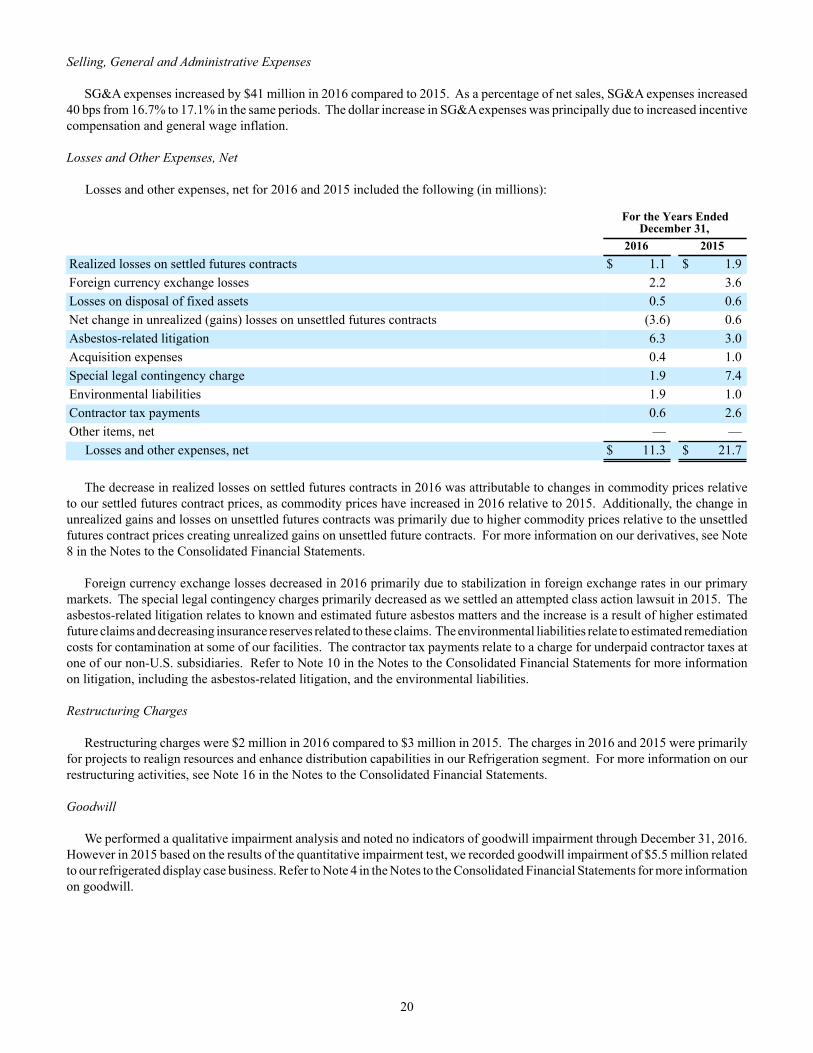
20
Selling, General and Administrative Expenses
SG&A expenses increased by $41 million in 2016 compared to 2015. As a percentage of net sales, SG&A expenses increased 40 bps from 16.7% to 17.1% in the same periods. The dollar increase in SG&A expenses was principally due to increased incentive compensation and general wage inflation. Losses and Other Expenses, Net
Losses and other expenses, net for 2016 and 2015 included the following (in millions):
For the Years EndedDecember 31,
2016 2015Realized losses on settled futures contracts $ 1.1 $ 1.9Foreign currency exchange losses 2.2 3.6Losses on disposal of fixed assets 0.5 0.6Net change in unrealized (gains) losses on unsettled futures contracts (3.6) 0.6Asbestos-related litigation 6.3 3.0Acquisition expenses 0.4 1.0Special legal contingency charge 1.9 7.4Environmental liabilities 1.9 1.0Contractor tax payments 0.6 2.6Other items, net — —
Losses and other expenses, net $ 11.3 $ 21.7
The decrease in realized losses on settled futures contracts in 2016 was attributable to changes in commodity prices relative to our settled futures contract prices, as commodity prices have increased in 2016 relative to 2015. Additionally, the change in unrealized gains and losses on unsettled futures contracts was primarily due to higher commodity prices relative to the unsettled futures contract prices creating unrealized gains on unsettled future contracts. For more information on our derivatives, see Note 8 in the Notes to the Consolidated Financial Statements.
Foreign currency exchange losses decreased in 2016 primarily due to stabilization in foreign exchange rates in our primary markets. The special legal contingency charges primarily decreased as we settled an attempted class action lawsuit in 2015. The asbestos-related litigation relates to known and estimated future asbestos matters and the increase is a result of higher estimated future claims and decreasing insurance reserves related to these claims. The environmental liabilities relate to estimated remediation costs for contamination at some of our facilities. The contractor tax payments relate to a charge for underpaid contractor taxes at one of our non-U.S. subsidiaries. Refer to Note 10 in the Notes to the Consolidated Financial Statements for more information on litigation, including the asbestos-related litigation, and the environmental liabilities.
Restructuring Charges
Restructuring charges were $2 million in 2016 compared to $3 million in 2015. The charges in 2016 and 2015 were primarily for projects to realign resources and enhance distribution capabilities in our Refrigeration segment. For more information on our restructuring activities, see Note 16 in the Notes to the Consolidated Financial Statements.
Goodwill
We performed a qualitative impairment analysis and noted no indicators of goodwill impairment through December 31, 2016. However in 2015 based on the results of the quantitative impairment test, we recorded goodwill impairment of $5.5 million related to our refrigerated display case business. Refer to Note 4 in the Notes to the Consolidated Financial Statements for more information on goodwill.
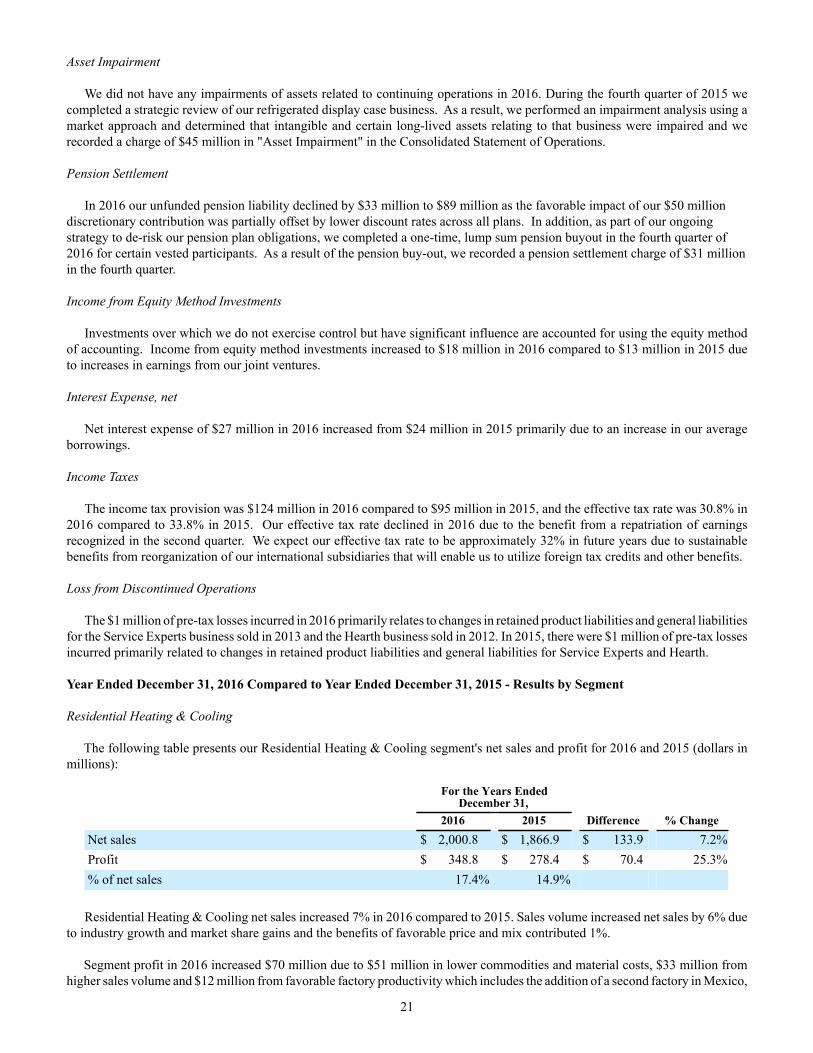
21
Asset Impairment
We did not have any impairments of assets related to continuing operations in 2016. During the fourth quarter of 2015 we completed a strategic review of our refrigerated display case business. As a result, we performed an impairment analysis using a market approach and determined that intangible and certain long-lived assets relating to that business were impaired and we recorded a charge of $45 million in "Asset Impairment" in the Consolidated Statement of Operations.
Pension Settlement
In 2016 our unfunded pension liability declined by $33 million to $89 million as the favorable impact of our $50 million discretionary contribution was partially offset by lower discount rates across all plans. In addition, as part of our ongoing strategy to de-risk our pension plan obligations, we completed a one-time, lump sum pension buyout in the fourth quarter of 2016 for certain vested participants. As a result of the pension buy-out, we recorded a pension settlement charge of $31 million in the fourth quarter.
Income from Equity Method Investments
Investments over which we do not exercise control but have significant influence are accounted for using the equity method of accounting. Income from equity method investments increased to $18 million in 2016 compared to $13 million in 2015 due to increases in earnings from our joint ventures.
Interest Expense, net
Net interest expense of $27 million in 2016 increased from $24 million in 2015 primarily due to an increase in our average borrowings.
Income Taxes
The income tax provision was $124 million in 2016 compared to $95 million in 2015, and the effective tax rate was 30.8% in 2016 compared to 33.8% in 2015. Our effective tax rate declined in 2016 due to the benefit from a repatriation of earnings recognized in the second quarter. We expect our effective tax rate to be approximately 32% in future years due to sustainable benefits from reorganization of our international subsidiaries that will enable us to utilize foreign tax credits and other benefits.
Loss from Discontinued Operations
The $1 million of pre-tax losses incurred in 2016 primarily relates to changes in retained product liabilities and general liabilities for the Service Experts business sold in 2013 and the Hearth business sold in 2012. In 2015, there were $1 million of pre-tax losses incurred primarily related to changes in retained product liabilities and general liabilities for Service Experts and Hearth.
Year Ended December 31, 2016 Compared to Year Ended December 31, 2015 - Results by Segment
Residential Heating & Cooling
The following table presents our Residential Heating & Cooling segment's net sales and profit for 2016 and 2015 (dollars in millions):
For the Years EndedDecember 31,
2016 2015 Difference % ChangeNet sales $ 2,000.8 $ 1,866.9 $ 133.9 7.2%Profit $ 348.8 $ 278.4 $ 70.4 25.3%% of net sales 17.4% 14.9%
Residential Heating & Cooling net sales increased 7% in 2016 compared to 2015. Sales volume increased net sales by 6% due
to industry growth and market share gains and the benefits of favorable price and mix contributed 1%.
Segment profit in 2016 increased $70 million due to $51 million in lower commodities and material costs, $33 million from higher sales volume and $12 million from favorable factory productivity which includes the addition of a second factory in Mexico,
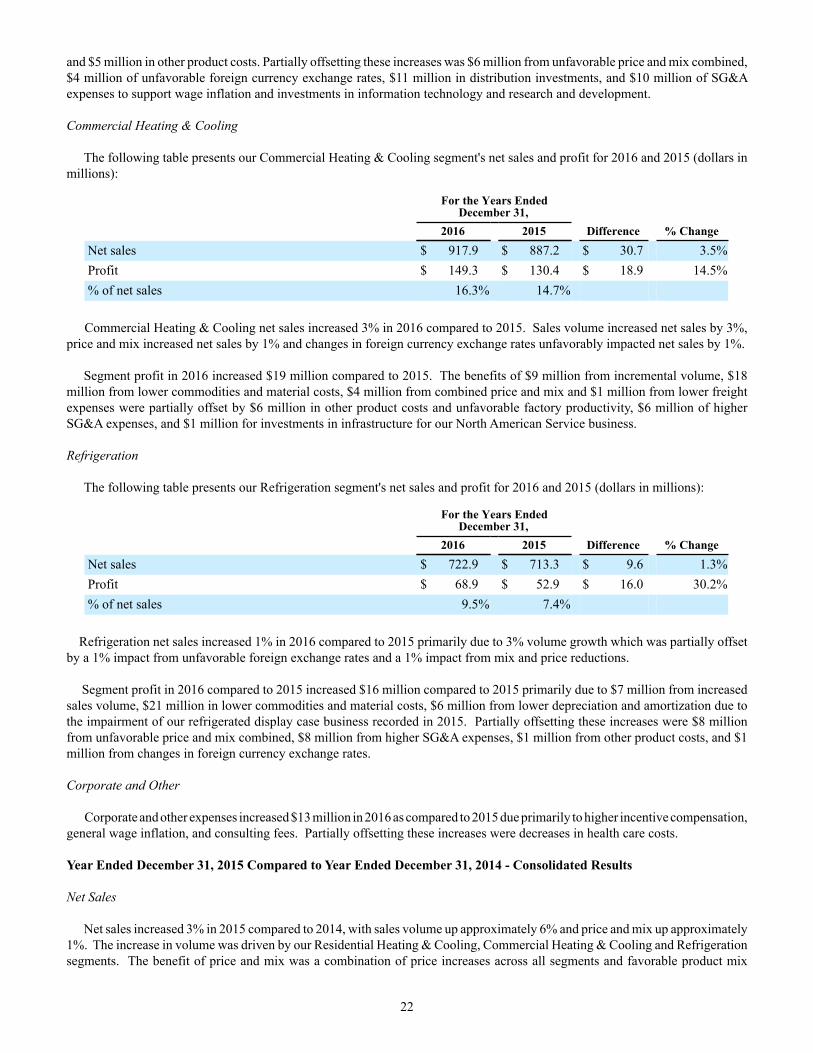
22
and $5 million in other product costs. Partially offsetting these increases was $6 million from unfavorable price and mix combined, $4 million of unfavorable foreign currency exchange rates, $11 million in distribution investments, and $10 million of SG&A expenses to support wage inflation and investments in information technology and research and development.
Commercial Heating & Cooling
The following table presents our Commercial Heating & Cooling segment's net sales and profit for 2016 and 2015 (dollars in millions):
For the Years EndedDecember 31,
2016 2015 Difference % ChangeNet sales $ 917.9 $ 887.2 $ 30.7 3.5%Profit $ 149.3 $ 130.4 $ 18.9 14.5%% of net sales 16.3% 14.7%
Commercial Heating & Cooling net sales increased 3% in 2016 compared to 2015. Sales volume increased net sales by 3%, price and mix increased net sales by 1% and changes in foreign currency exchange rates unfavorably impacted net sales by 1%.
Segment profit in 2016 increased $19 million compared to 2015. The benefits of $9 million from incremental volume, $18 million from lower commodities and material costs, $4 million from combined price and mix and $1 million from lower freight expenses were partially offset by $6 million in other product costs and unfavorable factory productivity, $6 million of higher SG&A expenses, and $1 million for investments in infrastructure for our North American Service business.
Refrigeration
The following table presents our Refrigeration segment's net sales and profit for 2016 and 2015 (dollars in millions):
For the Years EndedDecember 31,
2016 2015 Difference % ChangeNet sales $ 722.9 $ 713.3 $ 9.6 1.3%Profit $ 68.9 $ 52.9 $ 16.0 30.2%% of net sales 9.5% 7.4%
Refrigeration net sales increased 1% in 2016 compared to 2015 primarily due to 3% volume growth which was partially offset by a 1% impact from unfavorable foreign exchange rates and a 1% impact from mix and price reductions.
Segment profit in 2016 compared to 2015 increased $16 million compared to 2015 primarily due to $7 million from increased sales volume, $21 million in lower commodities and material costs, $6 million from lower depreciation and amortization due to the impairment of our refrigerated display case business recorded in 2015. Partially offsetting these increases were $8 million from unfavorable price and mix combined, $8 million from higher SG&A expenses, $1 million from other product costs, and $1 million from changes in foreign currency exchange rates.
Corporate and Other
Corporate and other expenses increased $13 million in 2016 as compared to 2015 due primarily to higher incentive compensation, general wage inflation, and consulting fees. Partially offsetting these increases were decreases in health care costs.
Year Ended December 31, 2015 Compared to Year Ended December 31, 2014 - Consolidated Results
Net Sales
Net sales increased 3% in 2015 compared to 2014, with sales volume up approximately 6% and price and mix up approximately 1%. The increase in volume was driven by our Residential Heating & Cooling, Commercial Heating & Cooling and Refrigeration segments. The benefit of price and mix was a combination of price increases across all segments and favorable product mix
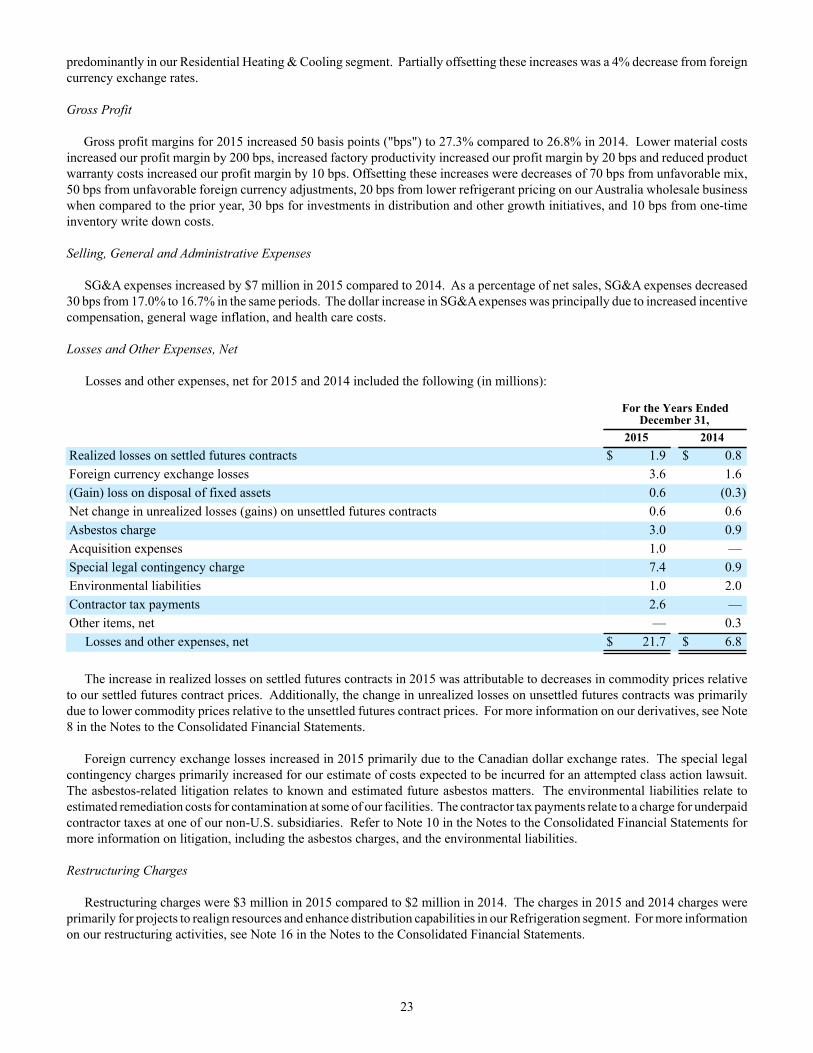
23
predominantly in our Residential Heating & Cooling segment. Partially offsetting these increases was a 4% decrease from foreign currency exchange rates.
Gross Profit
Gross profit margins for 2015 increased 50 basis points ("bps") to 27.3% compared to 26.8% in 2014. Lower material costs increased our profit margin by 200 bps, increased factory productivity increased our profit margin by 20 bps and reduced product warranty costs increased our profit margin by 10 bps. Offsetting these increases were decreases of 70 bps from unfavorable mix, 50 bps from unfavorable foreign currency adjustments, 20 bps from lower refrigerant pricing on our Australia wholesale business when compared to the prior year, 30 bps for investments in distribution and other growth initiatives, and 10 bps from one-time inventory write down costs.
Selling, General and Administrative Expenses
SG&A expenses increased by $7 million in 2015 compared to 2014. As a percentage of net sales, SG&A expenses decreased 30 bps from 17.0% to 16.7% in the same periods. The dollar increase in SG&A expenses was principally due to increased incentive compensation, general wage inflation, and health care costs. Losses and Other Expenses, Net
Losses and other expenses, net for 2015 and 2014 included the following (in millions):
For the Years EndedDecember 31,
2015 2014Realized losses on settled futures contracts $ 1.9 $ 0.8Foreign currency exchange losses 3.6 1.6(Gain) loss on disposal of fixed assets 0.6 (0.3)Net change in unrealized losses (gains) on unsettled futures contracts 0.6 0.6Asbestos charge 3.0 0.9Acquisition expenses 1.0 —Special legal contingency charge 7.4 0.9Environmental liabilities 1.0 2.0Contractor tax payments 2.6 —Other items, net — 0.3
Losses and other expenses, net $ 21.7 $ 6.8
The increase in realized losses on settled futures contracts in 2015 was attributable to decreases in commodity prices relative to our settled futures contract prices. Additionally, the change in unrealized losses on unsettled futures contracts was primarily due to lower commodity prices relative to the unsettled futures contract prices. For more information on our derivatives, see Note 8 in the Notes to the Consolidated Financial Statements.
Foreign currency exchange losses increased in 2015 primarily due to the Canadian dollar exchange rates. The special legal contingency charges primarily increased for our estimate of costs expected to be incurred for an attempted class action lawsuit. The asbestos-related litigation relates to known and estimated future asbestos matters. The environmental liabilities relate to estimated remediation costs for contamination at some of our facilities. The contractor tax payments relate to a charge for underpaid contractor taxes at one of our non-U.S. subsidiaries. Refer to Note 10 in the Notes to the Consolidated Financial Statements for more information on litigation, including the asbestos charges, and the environmental liabilities.
Restructuring Charges
Restructuring charges were $3 million in 2015 compared to $2 million in 2014. The charges in 2015 and 2014 charges were primarily for projects to realign resources and enhance distribution capabilities in our Refrigeration segment. For more information on our restructuring activities, see Note 16 in the Notes to the Consolidated Financial Statements.
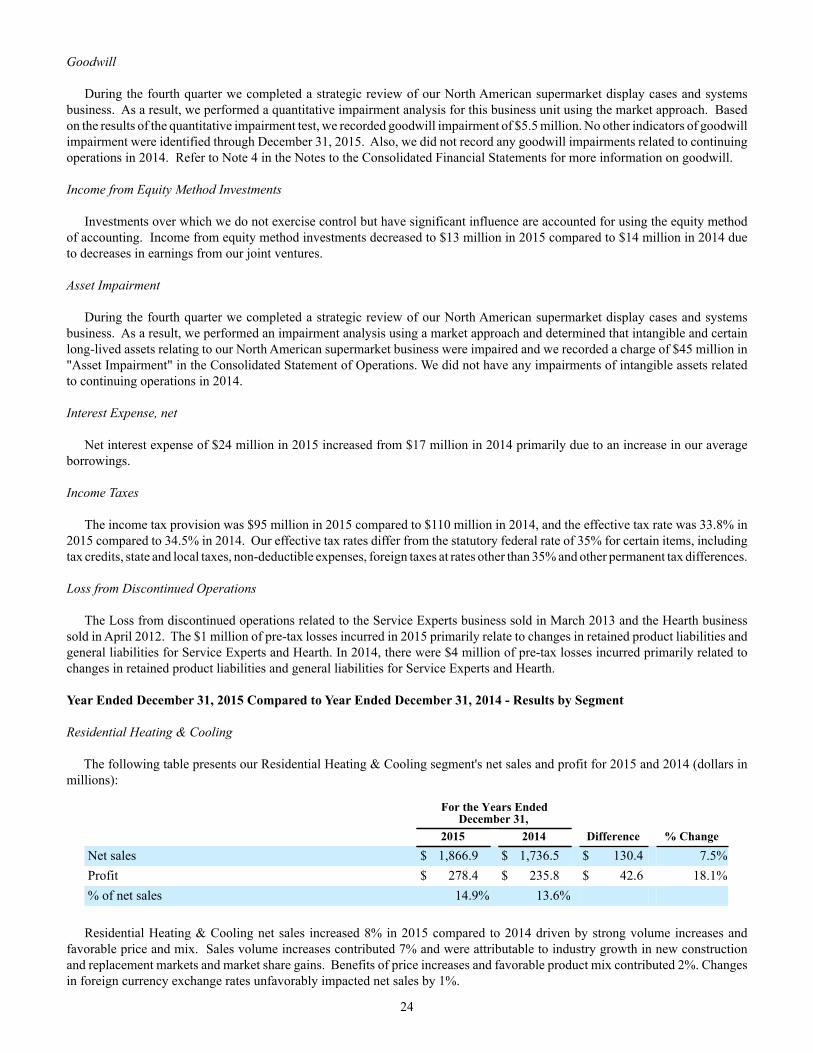
24
Goodwill
During the fourth quarter we completed a strategic review of our North American supermarket display cases and systems business. As a result, we performed a quantitative impairment analysis for this business unit using the market approach. Based on the results of the quantitative impairment test, we recorded goodwill impairment of $5.5 million. No other indicators of goodwill impairment were identified through December 31, 2015. Also, we did not record any goodwill impairments related to continuing operations in 2014. Refer to Note 4 in the Notes to the Consolidated Financial Statements for more information on goodwill.
Income from Equity Method Investments
Investments over which we do not exercise control but have significant influence are accounted for using the equity method of accounting. Income from equity method investments decreased to $13 million in 2015 compared to $14 million in 2014 due to decreases in earnings from our joint ventures.
Asset Impairment
During the fourth quarter we completed a strategic review of our North American supermarket display cases and systems business. As a result, we performed an impairment analysis using a market approach and determined that intangible and certain long-lived assets relating to our North American supermarket business were impaired and we recorded a charge of $45 million in "Asset Impairment" in the Consolidated Statement of Operations. We did not have any impairments of intangible assets related to continuing operations in 2014.
Interest Expense, net
Net interest expense of $24 million in 2015 increased from $17 million in 2014 primarily due to an increase in our average borrowings.
Income Taxes
The income tax provision was $95 million in 2015 compared to $110 million in 2014, and the effective tax rate was 33.8% in 2015 compared to 34.5% in 2014. Our effective tax rates differ from the statutory federal rate of 35% for certain items, including tax credits, state and local taxes, non-deductible expenses, foreign taxes at rates other than 35% and other permanent tax differences.
Loss from Discontinued Operations
The Loss from discontinued operations related to the Service Experts business sold in March 2013 and the Hearth business sold in April 2012. The $1 million of pre-tax losses incurred in 2015 primarily relate to changes in retained product liabilities and general liabilities for Service Experts and Hearth. In 2014, there were $4 million of pre-tax losses incurred primarily related to changes in retained product liabilities and general liabilities for Service Experts and Hearth.
Year Ended December 31, 2015 Compared to Year Ended December 31, 2014 - Results by Segment
Residential Heating & Cooling
The following table presents our Residential Heating & Cooling segment's net sales and profit for 2015 and 2014 (dollars in millions):
For the Years EndedDecember 31,
2015 2014 Difference % ChangeNet sales $ 1,866.9 $ 1,736.5 $ 130.4 7.5%Profit $ 278.4 $ 235.8 $ 42.6 18.1%% of net sales 14.9% 13.6%
Residential Heating & Cooling net sales increased 8% in 2015 compared to 2014 driven by strong volume increases and
favorable price and mix. Sales volume increases contributed 7% and were attributable to industry growth in new construction and replacement markets and market share gains. Benefits of price increases and favorable product mix contributed 2%. Changes in foreign currency exchange rates unfavorably impacted net sales by 1%.
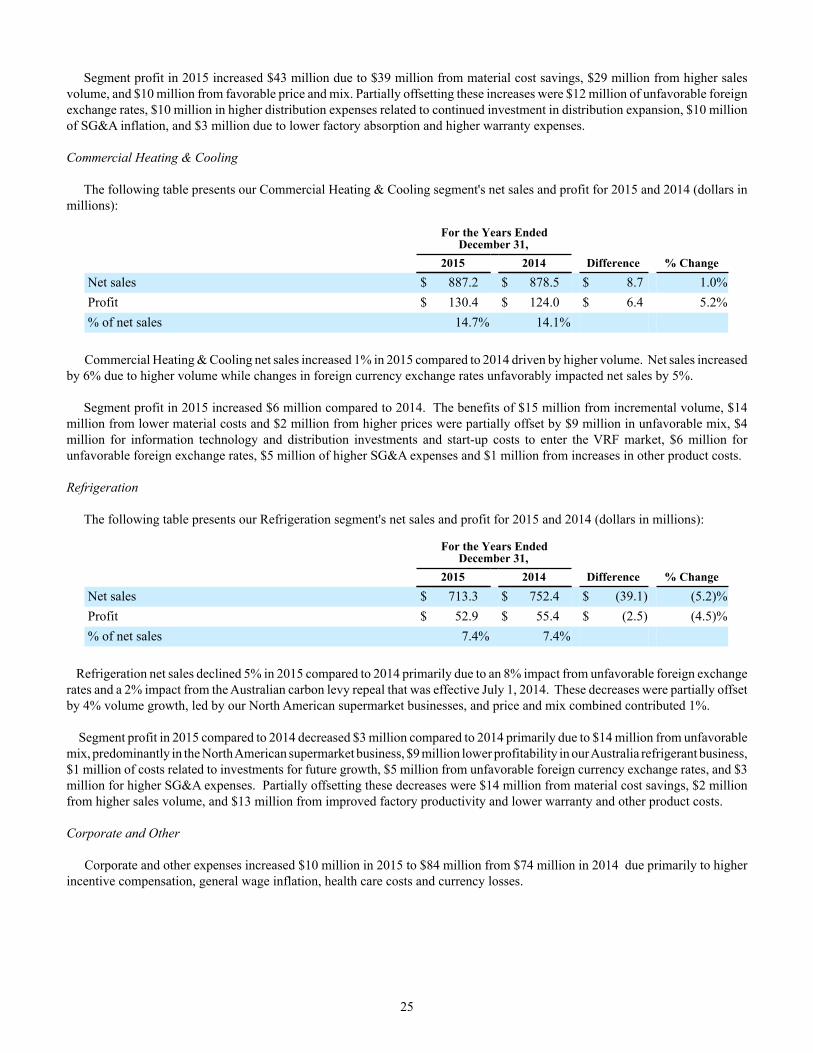
25
Segment profit in 2015 increased $43 million due to $39 million from material cost savings, $29 million from higher sales volume, and $10 million from favorable price and mix. Partially offsetting these increases were $12 million of unfavorable foreign exchange rates, $10 million in higher distribution expenses related to continued investment in distribution expansion, $10 million of SG&A inflation, and $3 million due to lower factory absorption and higher warranty expenses.
Commercial Heating & Cooling
The following table presents our Commercial Heating & Cooling segment's net sales and profit for 2015 and 2014 (dollars in millions):
For the Years EndedDecember 31,
2015 2014 Difference % ChangeNet sales $ 887.2 $ 878.5 $ 8.7 1.0%Profit $ 130.4 $ 124.0 $ 6.4 5.2%% of net sales 14.7% 14.1%
Commercial Heating & Cooling net sales increased 1% in 2015 compared to 2014 driven by higher volume. Net sales increased by 6% due to higher volume while changes in foreign currency exchange rates unfavorably impacted net sales by 5%.
Segment profit in 2015 increased $6 million compared to 2014. The benefits of $15 million from incremental volume, $14 million from lower material costs and $2 million from higher prices were partially offset by $9 million in unfavorable mix, $4 million for information technology and distribution investments and start-up costs to enter the VRF market, $6 million for unfavorable foreign exchange rates, $5 million of higher SG&A expenses and $1 million from increases in other product costs.
Refrigeration
The following table presents our Refrigeration segment's net sales and profit for 2015 and 2014 (dollars in millions):
For the Years EndedDecember 31,
2015 2014 Difference % ChangeNet sales $ 713.3 $ 752.4 $ (39.1) (5.2)%Profit $ 52.9 $ 55.4 $ (2.5) (4.5)%% of net sales 7.4% 7.4%
Refrigeration net sales declined 5% in 2015 compared to 2014 primarily due to an 8% impact from unfavorable foreign exchange rates and a 2% impact from the Australian carbon levy repeal that was effective July 1, 2014. These decreases were partially offset by 4% volume growth, led by our North American supermarket businesses, and price and mix combined contributed 1%.
Segment profit in 2015 compared to 2014 decreased $3 million compared to 2014 primarily due to $14 million from unfavorable mix, predominantly in the North American supermarket business, $9 million lower profitability in our Australia refrigerant business, $1 million of costs related to investments for future growth, $5 million from unfavorable foreign currency exchange rates, and $3 million for higher SG&A expenses. Partially offsetting these decreases were $14 million from material cost savings, $2 million from higher sales volume, and $13 million from improved factory productivity and lower warranty and other product costs.
Corporate and Other
Corporate and other expenses increased $10 million in 2015 to $84 million from $74 million in 2014 due primarily to higher incentive compensation, general wage inflation, health care costs and currency losses.
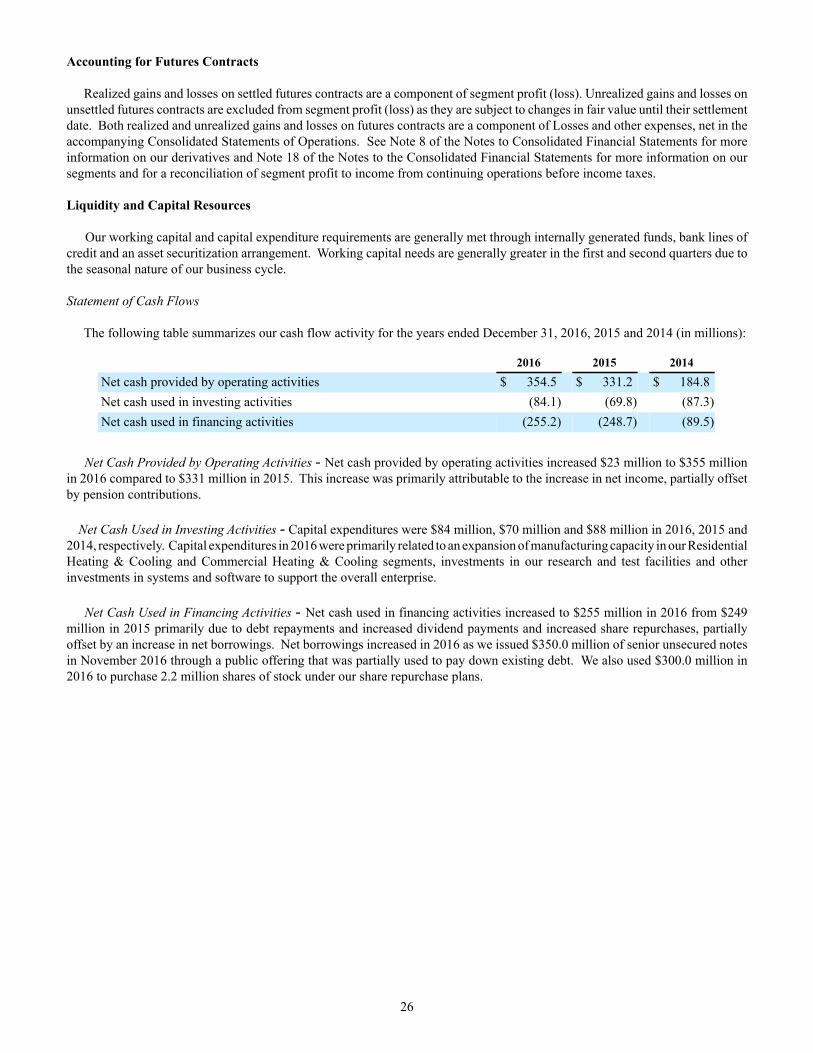
26
Accounting for Futures Contracts
Realized gains and losses on settled futures contracts are a component of segment profit (loss). Unrealized gains and losses on unsettled futures contracts are excluded from segment profit (loss) as they are subject to changes in fair value until their settlement date. Both realized and unrealized gains and losses on futures contracts are a component of Losses and other expenses, net in the accompanying Consolidated Statements of Operations. See Note 8 of the Notes to Consolidated Financial Statements for more information on our derivatives and Note 18 of the Notes to the Consolidated Financial Statements for more information on our segments and for a reconciliation of segment profit to income from continuing operations before income taxes.
Liquidity and Capital Resources
Our working capital and capital expenditure requirements are generally met through internally generated funds, bank lines of credit and an asset securitization arrangement. Working capital needs are generally greater in the first and second quarters due to the seasonal nature of our business cycle.
Statement of Cash Flows
The following table summarizes our cash flow activity for the years ended December 31, 2016, 2015 and 2014 (in millions):
2016 2015 2014Net cash provided by operating activities $ 354.5 $ 331.2 $ 184.8Net cash used in investing activities (84.1) (69.8) (87.3)Net cash used in financing activities (255.2) (248.7) (89.5)
Net Cash Provided by Operating Activities - Net cash provided by operating activities increased $23 million to $355 millionin 2016 compared to $331 million in 2015. This increase was primarily attributable to the increase in net income, partially offset by pension contributions.
Net Cash Used in Investing Activities - Capital expenditures were $84 million, $70 million and $88 million in 2016, 2015 and 2014, respectively. Capital expenditures in 2016 were primarily related to an expansion of manufacturing capacity in our Residential Heating & Cooling and Commercial Heating & Cooling segments, investments in our research and test facilities and other investments in systems and software to support the overall enterprise.
Net Cash Used in Financing Activities - Net cash used in financing activities increased to $255 million in 2016 from $249 million in 2015 primarily due to debt repayments and increased dividend payments and increased share repurchases, partially offset by an increase in net borrowings. Net borrowings increased in 2016 as we issued $350.0 million of senior unsecured notes in November 2016 through a public offering that was partially used to pay down existing debt. We also used $300.0 million in 2016 to purchase 2.2 million shares of stock under our share repurchase plans.
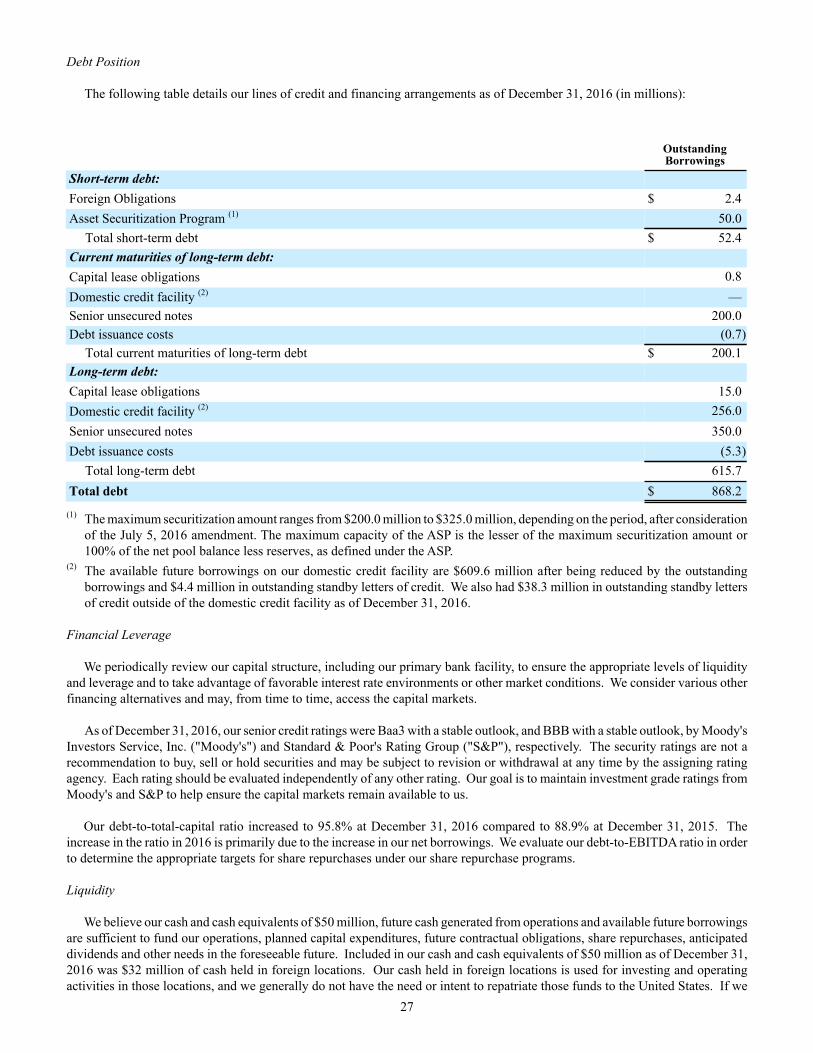
27
Debt Position
The following table details our lines of credit and financing arrangements as of December 31, 2016 (in millions):
OutstandingBorrowings
Short-term debt:Foreign Obligations $ 2.4Asset Securitization Program (1) 50.0
Total short-term debt $ 52.4Current maturities of long-term debt:Capital lease obligations 0.8Domestic credit facility (2) —Senior unsecured notes 200.0Debt issuance costs (0.7)
Total current maturities of long-term debt $ 200.1Long-term debt:Capital lease obligations 15.0Domestic credit facility (2) 256.0Senior unsecured notes 350.0Debt issuance costs (5.3)
Total long-term debt 615.7Total debt $ 868.2
(1) The maximum securitization amount ranges from $200.0 million to $325.0 million, depending on the period, after consideration of the July 5, 2016 amendment. The maximum capacity of the ASP is the lesser of the maximum securitization amount or 100% of the net pool balance less reserves, as defined under the ASP.
(2) The available future borrowings on our domestic credit facility are $609.6 million after being reduced by the outstanding borrowings and $4.4 million in outstanding standby letters of credit. We also had $38.3 million in outstanding standby letters of credit outside of the domestic credit facility as of December 31, 2016.
Financial Leverage
We periodically review our capital structure, including our primary bank facility, to ensure the appropriate levels of liquidity and leverage and to take advantage of favorable interest rate environments or other market conditions. We consider various other financing alternatives and may, from time to time, access the capital markets.
As of December 31, 2016, our senior credit ratings were Baa3 with a stable outlook, and BBB with a stable outlook, by Moody's Investors Service, Inc. ("Moody's") and Standard & Poor's Rating Group ("S&P"), respectively. The security ratings are not a recommendation to buy, sell or hold securities and may be subject to revision or withdrawal at any time by the assigning rating agency. Each rating should be evaluated independently of any other rating. Our goal is to maintain investment grade ratings from Moody's and S&P to help ensure the capital markets remain available to us.
Our debt-to-total-capital ratio increased to 95.8% at December 31, 2016 compared to 88.9% at December 31, 2015. The increase in the ratio in 2016 is primarily due to the increase in our net borrowings. We evaluate our debt-to-EBITDA ratio in order to determine the appropriate targets for share repurchases under our share repurchase programs.
Liquidity
We believe our cash and cash equivalents of $50 million, future cash generated from operations and available future borrowings are sufficient to fund our operations, planned capital expenditures, future contractual obligations, share repurchases, anticipated dividends and other needs in the foreseeable future. Included in our cash and cash equivalents of $50 million as of December 31, 2016 was $32 million of cash held in foreign locations. Our cash held in foreign locations is used for investing and operating activities in those locations, and we generally do not have the need or intent to repatriate those funds to the United States. If we
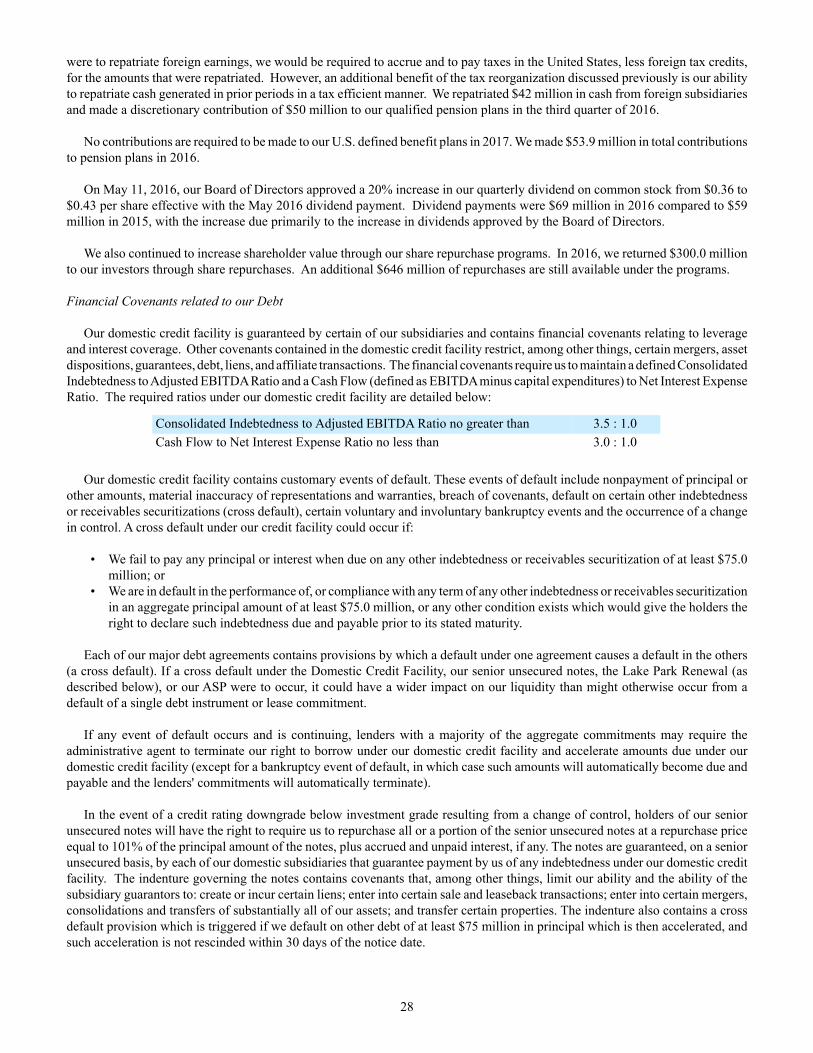
28
were to repatriate foreign earnings, we would be required to accrue and to pay taxes in the United States, less foreign tax credits, for the amounts that were repatriated. However, an additional benefit of the tax reorganization discussed previously is our ability to repatriate cash generated in prior periods in a tax efficient manner. We repatriated $42 million in cash from foreign subsidiaries and made a discretionary contribution of $50 million to our qualified pension plans in the third quarter of 2016.
No contributions are required to be made to our U.S. defined benefit plans in 2017. We made $53.9 million in total contributions to pension plans in 2016.
On May 11, 2016, our Board of Directors approved a 20% increase in our quarterly dividend on common stock from $0.36 to $0.43 per share effective with the May 2016 dividend payment. Dividend payments were $69 million in 2016 compared to $59 million in 2015, with the increase due primarily to the increase in dividends approved by the Board of Directors.
We also continued to increase shareholder value through our share repurchase programs. In 2016, we returned $300.0 millionto our investors through share repurchases. An additional $646 million of repurchases are still available under the programs.
Financial Covenants related to our Debt
Our domestic credit facility is guaranteed by certain of our subsidiaries and contains financial covenants relating to leverage and interest coverage. Other covenants contained in the domestic credit facility restrict, among other things, certain mergers, asset dispositions, guarantees, debt, liens, and affiliate transactions. The financial covenants require us to maintain a defined Consolidated Indebtedness to Adjusted EBITDA Ratio and a Cash Flow (defined as EBITDA minus capital expenditures) to Net Interest Expense Ratio. The required ratios under our domestic credit facility are detailed below:
Consolidated Indebtedness to Adjusted EBITDA Ratio no greater than 3.5 : 1.0Cash Flow to Net Interest Expense Ratio no less than 3.0 : 1.0
Our domestic credit facility contains customary events of default. These events of default include nonpayment of principal or other amounts, material inaccuracy of representations and warranties, breach of covenants, default on certain other indebtedness or receivables securitizations (cross default), certain voluntary and involuntary bankruptcy events and the occurrence of a change in control. A cross default under our credit facility could occur if:
• We fail to pay any principal or interest when due on any other indebtedness or receivables securitization of at least $75.0 million; or
• We are in default in the performance of, or compliance with any term of any other indebtedness or receivables securitization in an aggregate principal amount of at least $75.0 million, or any other condition exists which would give the holders the right to declare such indebtedness due and payable prior to its stated maturity.
Each of our major debt agreements contains provisions by which a default under one agreement causes a default in the others (a cross default). If a cross default under the Domestic Credit Facility, our senior unsecured notes, the Lake Park Renewal (as described below), or our ASP were to occur, it could have a wider impact on our liquidity than might otherwise occur from a default of a single debt instrument or lease commitment.
If any event of default occurs and is continuing, lenders with a majority of the aggregate commitments may require the administrative agent to terminate our right to borrow under our domestic credit facility and accelerate amounts due under our domestic credit facility (except for a bankruptcy event of default, in which case such amounts will automatically become due and payable and the lenders' commitments will automatically terminate).
In the event of a credit rating downgrade below investment grade resulting from a change of control, holders of our senior unsecured notes will have the right to require us to repurchase all or a portion of the senior unsecured notes at a repurchase price equal to 101% of the principal amount of the notes, plus accrued and unpaid interest, if any. The notes are guaranteed, on a senior unsecured basis, by each of our domestic subsidiaries that guarantee payment by us of any indebtedness under our domestic credit facility. The indenture governing the notes contains covenants that, among other things, limit our ability and the ability of the subsidiary guarantors to: create or incur certain liens; enter into certain sale and leaseback transactions; enter into certain mergers, consolidations and transfers of substantially all of our assets; and transfer certain properties. The indenture also contains a cross default provision which is triggered if we default on other debt of at least $75 million in principal which is then accelerated, and such acceleration is not rescinded within 30 days of the notice date.
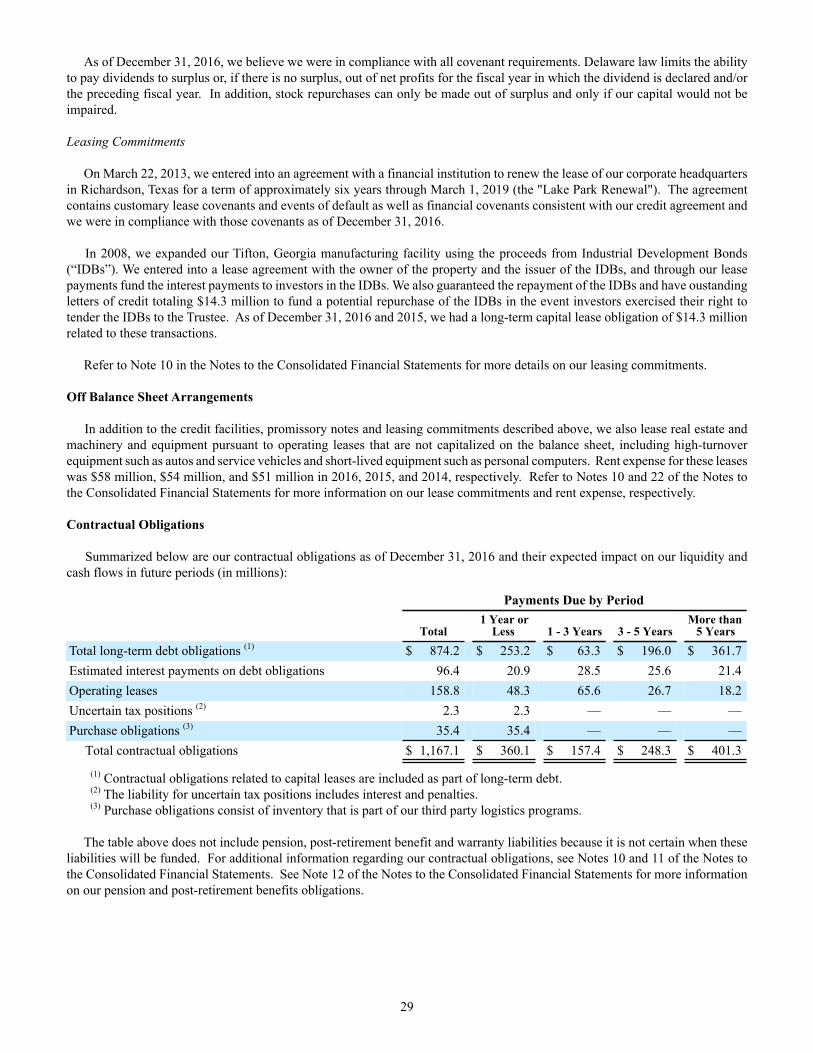
29
As of December 31, 2016, we believe we were in compliance with all covenant requirements. Delaware law limits the ability to pay dividends to surplus or, if there is no surplus, out of net profits for the fiscal year in which the dividend is declared and/or the preceding fiscal year. In addition, stock repurchases can only be made out of surplus and only if our capital would not be impaired.
Leasing Commitments
On March 22, 2013, we entered into an agreement with a financial institution to renew the lease of our corporate headquarters in Richardson, Texas for a term of approximately six years through March 1, 2019 (the "Lake Park Renewal"). The agreement contains customary lease covenants and events of default as well as financial covenants consistent with our credit agreement and we were in compliance with those covenants as of December 31, 2016.
In 2008, we expanded our Tifton, Georgia manufacturing facility using the proceeds from Industrial Development Bonds (“IDBs”). We entered into a lease agreement with the owner of the property and the issuer of the IDBs, and through our lease payments fund the interest payments to investors in the IDBs. We also guaranteed the repayment of the IDBs and have oustanding letters of credit totaling $14.3 million to fund a potential repurchase of the IDBs in the event investors exercised their right to tender the IDBs to the Trustee. As of December 31, 2016 and 2015, we had a long-term capital lease obligation of $14.3 million related to these transactions.
Refer to Note 10 in the Notes to the Consolidated Financial Statements for more details on our leasing commitments.
Off Balance Sheet Arrangements
In addition to the credit facilities, promissory notes and leasing commitments described above, we also lease real estate and machinery and equipment pursuant to operating leases that are not capitalized on the balance sheet, including high-turnover equipment such as autos and service vehicles and short-lived equipment such as personal computers. Rent expense for these leases was $58 million, $54 million, and $51 million in 2016, 2015, and 2014, respectively. Refer to Notes 10 and 22 of the Notes to the Consolidated Financial Statements for more information on our lease commitments and rent expense, respectively.
Contractual Obligations
Summarized below are our contractual obligations as of December 31, 2016 and their expected impact on our liquidity and cash flows in future periods (in millions):
Payments Due by Period
Total1 Year or
Less 1 - 3 Years 3 - 5 YearsMore than
5 YearsTotal long-term debt obligations (1) $ 874.2 $ 253.2 $ 63.3 $ 196.0 $ 361.7Estimated interest payments on debt obligations 96.4 20.9 28.5 25.6 21.4Operating leases 158.8 48.3 65.6 26.7 18.2Uncertain tax positions (2) 2.3 2.3 — — —Purchase obligations (3) 35.4 35.4 — — —
Total contractual obligations $ 1,167.1 $ 360.1 $ 157.4 $ 248.3 $ 401.3
(1) Contractual obligations related to capital leases are included as part of long-term debt.(2) The liability for uncertain tax positions includes interest and penalties.(3) Purchase obligations consist of inventory that is part of our third party logistics programs.
The table above does not include pension, post-retirement benefit and warranty liabilities because it is not certain when these liabilities will be funded. For additional information regarding our contractual obligations, see Notes 10 and 11 of the Notes to the Consolidated Financial Statements. See Note 12 of the Notes to the Consolidated Financial Statements for more information on our pension and post-retirement benefits obligations.
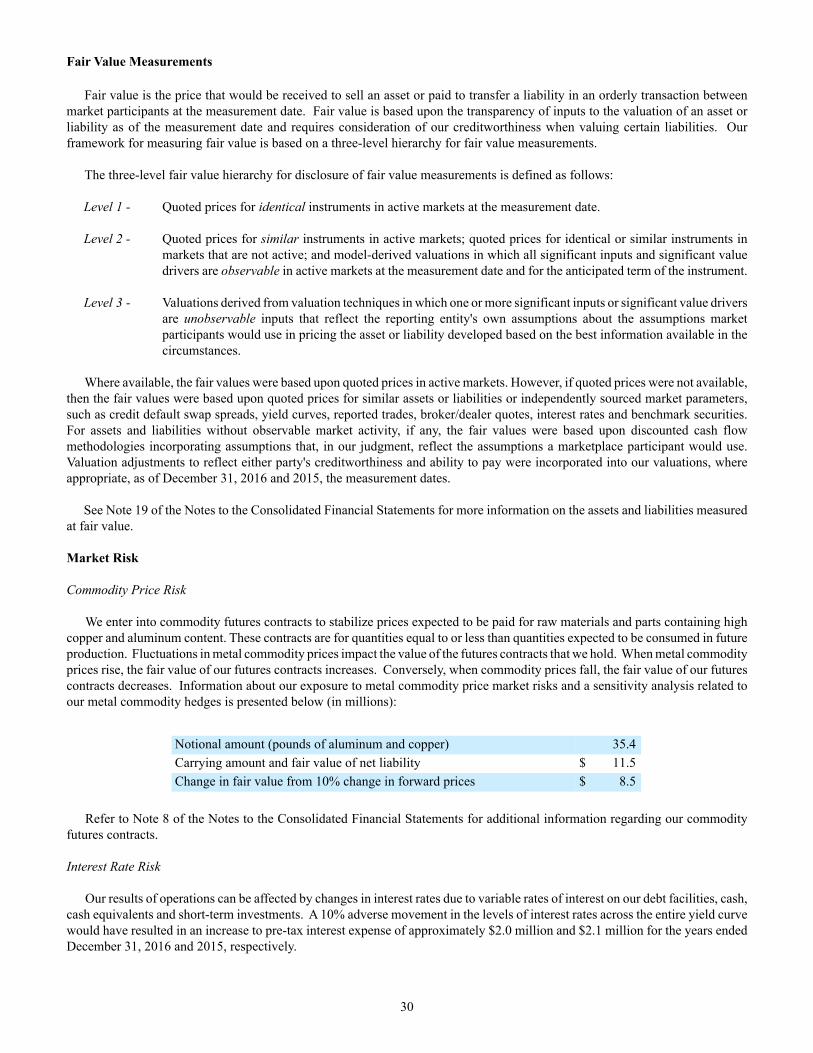
30
Fair Value Measurements
Fair value is the price that would be received to sell an asset or paid to transfer a liability in an orderly transaction between market participants at the measurement date. Fair value is based upon the transparency of inputs to the valuation of an asset or liability as of the measurement date and requires consideration of our creditworthiness when valuing certain liabilities. Our framework for measuring fair value is based on a three-level hierarchy for fair value measurements.
The three-level fair value hierarchy for disclosure of fair value measurements is defined as follows:
Level 1 - Quoted prices for identical instruments in active markets at the measurement date.
Level 2 - Quoted prices for similar instruments in active markets; quoted prices for identical or similar instruments in markets that are not active; and model-derived valuations in which all significant inputs and significant value drivers are observable in active markets at the measurement date and for the anticipated term of the instrument.
Level 3 - Valuations derived from valuation techniques in which one or more significant inputs or significant value drivers are unobservable inputs that reflect the reporting entity's own assumptions about the assumptions market participants would use in pricing the asset or liability developed based on the best information available in the circumstances.
Where available, the fair values were based upon quoted prices in active markets. However, if quoted prices were not available, then the fair values were based upon quoted prices for similar assets or liabilities or independently sourced market parameters, such as credit default swap spreads, yield curves, reported trades, broker/dealer quotes, interest rates and benchmark securities. For assets and liabilities without observable market activity, if any, the fair values were based upon discounted cash flow methodologies incorporating assumptions that, in our judgment, reflect the assumptions a marketplace participant would use. Valuation adjustments to reflect either party's creditworthiness and ability to pay were incorporated into our valuations, where appropriate, as of December 31, 2016 and 2015, the measurement dates.
See Note 19 of the Notes to the Consolidated Financial Statements for more information on the assets and liabilities measured at fair value.
Market Risk
Commodity Price Risk
We enter into commodity futures contracts to stabilize prices expected to be paid for raw materials and parts containing high copper and aluminum content. These contracts are for quantities equal to or less than quantities expected to be consumed in future production. Fluctuations in metal commodity prices impact the value of the futures contracts that we hold. When metal commodity prices rise, the fair value of our futures contracts increases. Conversely, when commodity prices fall, the fair value of our futures contracts decreases. Information about our exposure to metal commodity price market risks and a sensitivity analysis related to our metal commodity hedges is presented below (in millions):
Notional amount (pounds of aluminum and copper) 35.4Carrying amount and fair value of net liability $ 11.5Change in fair value from 10% change in forward prices $ 8.5
Refer to Note 8 of the Notes to the Consolidated Financial Statements for additional information regarding our commodity futures contracts.
Interest Rate Risk
Our results of operations can be affected by changes in interest rates due to variable rates of interest on our debt facilities, cash, cash equivalents and short-term investments. A 10% adverse movement in the levels of interest rates across the entire yield curve would have resulted in an increase to pre-tax interest expense of approximately $2.0 million and $2.1 million for the years ended December 31, 2016 and 2015, respectively.
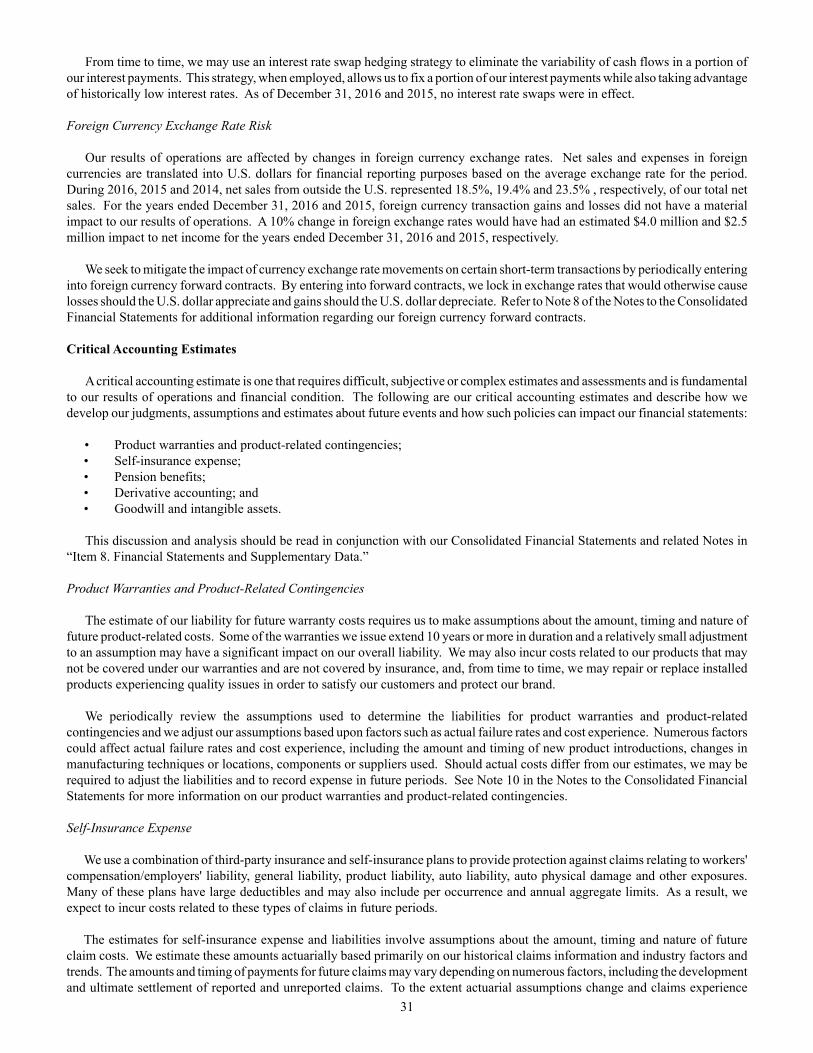
31
From time to time, we may use an interest rate swap hedging strategy to eliminate the variability of cash flows in a portion of our interest payments. This strategy, when employed, allows us to fix a portion of our interest payments while also taking advantage of historically low interest rates. As of December 31, 2016 and 2015, no interest rate swaps were in effect.
Foreign Currency Exchange Rate Risk
Our results of operations are affected by changes in foreign currency exchange rates. Net sales and expenses in foreign currencies are translated into U.S. dollars for financial reporting purposes based on the average exchange rate for the period. During 2016, 2015 and 2014, net sales from outside the U.S. represented 18.5%, 19.4% and 23.5% , respectively, of our total net sales. For the years ended December 31, 2016 and 2015, foreign currency transaction gains and losses did not have a material impact to our results of operations. A 10% change in foreign exchange rates would have had an estimated $4.0 million and $2.5 million impact to net income for the years ended December 31, 2016 and 2015, respectively.
We seek to mitigate the impact of currency exchange rate movements on certain short-term transactions by periodically entering into foreign currency forward contracts. By entering into forward contracts, we lock in exchange rates that would otherwise cause losses should the U.S. dollar appreciate and gains should the U.S. dollar depreciate. Refer to Note 8 of the Notes to the Consolidated Financial Statements for additional information regarding our foreign currency forward contracts.
Critical Accounting Estimates
A critical accounting estimate is one that requires difficult, subjective or complex estimates and assessments and is fundamental to our results of operations and financial condition. The following are our critical accounting estimates and describe how we develop our judgments, assumptions and estimates about future events and how such policies can impact our financial statements:
• Product warranties and product-related contingencies; • Self-insurance expense;• Pension benefits;• Derivative accounting; and• Goodwill and intangible assets.
This discussion and analysis should be read in conjunction with our Consolidated Financial Statements and related Notes in “Item 8. Financial Statements and Supplementary Data.”
Product Warranties and Product-Related Contingencies
The estimate of our liability for future warranty costs requires us to make assumptions about the amount, timing and nature of future product-related costs. Some of the warranties we issue extend 10 years or more in duration and a relatively small adjustment to an assumption may have a significant impact on our overall liability. We may also incur costs related to our products that may not be covered under our warranties and are not covered by insurance, and, from time to time, we may repair or replace installed products experiencing quality issues in order to satisfy our customers and protect our brand.
We periodically review the assumptions used to determine the liabilities for product warranties and product-related contingencies and we adjust our assumptions based upon factors such as actual failure rates and cost experience. Numerous factors could affect actual failure rates and cost experience, including the amount and timing of new product introductions, changes in manufacturing techniques or locations, components or suppliers used. Should actual costs differ from our estimates, we may be required to adjust the liabilities and to record expense in future periods. See Note 10 in the Notes to the Consolidated Financial Statements for more information on our product warranties and product-related contingencies.
Self-Insurance Expense
We use a combination of third-party insurance and self-insurance plans to provide protection against claims relating to workers' compensation/employers' liability, general liability, product liability, auto liability, auto physical damage and other exposures. Many of these plans have large deductibles and may also include per occurrence and annual aggregate limits. As a result, we expect to incur costs related to these types of claims in future periods.
The estimates for self-insurance expense and liabilities involve assumptions about the amount, timing and nature of future claim costs. We estimate these amounts actuarially based primarily on our historical claims information and industry factors and trends. The amounts and timing of payments for future claims may vary depending on numerous factors, including the development and ultimate settlement of reported and unreported claims. To the extent actuarial assumptions change and claims experience
32
differ from historical rates, our liabilities may change. The self-insurance liabilities as of December 31, 2016 represent the best estimate of the future payments to be made on reported and unreported losses. See Note 10 in the Notes to the Consolidated Financial Statements for additional information on our self-insurance expense and liabilities.
Pension Benefits
Over the past several years, we have frozen many of our defined benefit pension and profit sharing plans and replaced them with defined contribution plans. We have a liability for the benefits earned under these inactive plans prior to the date the benefits were frozen. Our defined contribution plans generally include both company and employee contributions based on predetermined percentages of compensation earned by the employee. We also have several active defined benefit plans that provide benefits based on years of service. In the years ended December 31, 2016 and December 31, 2015, we contributed $53.9 million and $3.9 million to our pension plans, respectively.
We make several assumptions to calculate our liability and the expense for these benefit plans, including the discount rate and expected return on assets. We used an assumed discount rate of 4.17% for pension benefits of our U.S.-based plans as of December 31, 2016. Our discount rates were selected using the yield curve for high-quality corporate bonds, which is dependent upon risk-free interest rates and current credit market conditions. In 2016 and 2015, we utilized an assumed long-term rate of return on assets of 7.50% in both years. These are long-term estimates of equity values and are not dependent on short-term variations of the equity markets. Differences between actual experience and our assumptions are quantified as actuarial gains and losses. These actuarial gains and losses do not immediately impact our earnings as they are deferred in accumulated other comprehensive income (“AOCI”) and are amortized into net periodic benefit cost over the estimated service period. During 2015, we adopted the new mortality tables, MP-2015, from the Society of Actuaries, which reflects increasing life expectancies in the United States. In 2016, we adopted the additional revisions to the mortality tables included in MP-2016.
The assumed long-term rate of return on assets and the discount rate have significant effects on the amounts reported for our defined benefit plans. A 25 bps decrease in the long-term rate of return on assets or discount rate would have the following effects (in millions):
25 Basis PointDecrease in
Long-Term Rateof Return
25 Basis PointDecrease in
Discount RateIncrease to net periodic benefit cost for U.S. pension plans $ 0.6 $ 1.1Increase to the pension benefit obligations for U.S. pension plans n/a 11.1
Should actual results differ from our estimates and assumptions, revisions to the benefit plan liabilities and the related expenses would be required. Refer to Note 12 in the Notes to the Consolidated Financial Statements for more information on our pension benefits.
Derivative Accounting
We use futures contracts and fixed forward contracts to mitigate our exposure to volatility in metal commodity prices in the ordinary course of business. Fluctuations in metal commodity prices impact the value of the derivative instruments that we hold. When metal commodity prices rise, the fair value of our futures contracts increases and conversely, when commodity prices fall, the fair value of our futures contracts decreases. We are required to prepare and maintain contemporaneous documentation for futures contracts that are formally designated as cash flow hedges. Our failure to comply with the strict documentation requirements could result in the de-designation of cash flow hedges, which may significantly impact our consolidated financial statements. Refer to "Market Risk" above and to Note 8 in the Notes to the Consolidated Financial Statements for more information on our derivatives.
Goodwill and Intangible Assets
Goodwill is calculated as the excess of cost over fair value of assets from acquired businesses. Goodwill is not amortized, but is reviewed for impairment annually in the fourth quarter and whenever events or changes in circumstances indicate the asset may be impaired. We assign goodwill to the reporting units that benefit from the synergies of our acquisitions. If we reorganize our management structure, the related goodwill is allocated to the affected reporting units based upon the relative fair values of those reporting units. Assets and liabilities, including deferred income taxes, are generally directly assigned to the reporting units. However, certain assets and liabilities, including intellectual property assets, information technology assets and pension, self-insurance and environmental liabilities, are centrally managed and are not allocated to the segments in the normal course of our
33
financial reporting process, and therefore must be assigned to the reporting units based upon appropriate methods. Reporting units that we test are generally equivalent to our business segments, or in some cases one level below. Components that are determined to be reporting units are aggregated when those reporting units share similar economic characteristics. We review our reporting unit structure each year as part of our annual goodwill impairment testing.
The provisions of the accounting standard for goodwill allow us to first assess qualitative factors to determine whether it is necessary to perform a two-step quantitative goodwill impairment test. As part of our qualitative assessment, we monitor economic, legal, regulatory and other factors, industry trends, our market capitalization, recent and forecasted financial performance of our reporting units and the timing and nature of our restructuring activities for LII as a whole and for each reporting unit.
For those reporting units which require the two-step quantitative goodwill impairment test, we estimate reporting unit fair values using the discounted cash flow approach or the market approach. The discounted cash flows used to estimate fair value are based on assumptions regarding each reporting unit’s estimated projected future cash flows and the estimated weighted-average cost of capital that a market participant would use in evaluating the reporting unit in a purchase transaction. The estimated weighted-average cost of capital is based on the risk-free interest rate and other factors such as equity risk premiums and the ratio of total debt to equity capital. In performing these impairment tests, we take steps to ensure that appropriate and reasonable cash flow projections and assumptions are used. We reconcile our estimated enterprise value to our market capitalization and determine the reasonableness of the cost of capital used by comparing to market data. We also perform sensitivity analyses on the key assumptions used, such as the weighted-average cost of capital and terminal growth rates. If the market approach is used, it is based on objective evidence of market values. Refer to Note 4 of the Notes to the Consolidated Financial Statements for further details.
We review our indefinite-lived intangible assets for impairment annually in the fourth quarter and whenever events or changes in circumstances indicate the asset may be impaired. The provisions of the accounting standard for indefinite-lived intangible assets allow us to first assess qualitative factors to determine whether it is necessary to perform a two-step quantitative impairment test. As part of our qualitative assessment, we monitor economic, legal, regulatory and other factors, industry trends, recent and forecasted financial performance of our reporting units and the timing and nature of our restructuring activities for LII as a whole and as they relate to the fair value of the assets.
We also periodically review intangible assets with estimable useful lives for impairment as events or changes in circumstances indicate that the carrying amount of such assets might not be recoverable. We assess recoverability by comparing the estimated expected undiscounted future cash flows identified with each intangible asset or related asset group to the carrying amount of such assets. If the expected future cash flows do not exceed the carrying value of the asset or assets being reviewed, an impairment loss is recognized based on the excess of the carrying amount of the impaired assets over their fair value. In assessing the fair value of these intangible assets, we must make assumptions that a market participant would make regarding estimated future cash flows and other factors to determine the fair value of the respective assets.
Refer to Note 4 of the Notes to the Consolidated Financial Statements for more information on our goodwill and intangible assets.
Recent Accounting Pronouncements
On May 28, 2014, the Financial Accounting Standard Board ("FASB") issued ASU No. 2014-09, Revenue from Contracts with Customers, which requires an entity to recognize the amount of revenue to which it expects to be entitled for the transfer of promised goods or services to customers. The ASU will replace most existing revenue recognition guidance in U.S. GAAP when it becomes effective. The new standard is effective for us on January 1, 2018. Early application is not permitted. We substantially completed our evaluation of the effect that ASU 2014-09 will have on our Consolidated Financial Statements and related disclosures. We do not expect the ASU to have a material impact on the amount and timing of revenue recognition. We will adopt the new standard using the modified retrospective approach.
In November 2015, the FASB issued ASU No. 2015-17, Balance Sheet Classification of Deferred Taxes (Topic 740) that simplifies the presentation of deferred taxes by requiring deferred tax assets and liabilities be classified as noncurrent on the balance sheet. ASU 2015-17 is effective for public companies for annual reporting periods beginning after December 15, 2016, and interim periods within those fiscal years. We adopted this standard retrospectively as of December 31, 2015.
On February 25, 2016, the FASB issued ASU No. 2016-02, Leases (ASC 842). Lessees will need to recognize almost all leases on their balance sheet as a right-of-use asset and a lease liability. It will be critical to identify leases embedded in a contract to avoid misstating the lessee’s balance sheet. For income statement purposes, the FASB retained a dual model, requiring leases to be classified as either operating or finance. Classification will be based on criteria that are largely similar to those applied in current lease accounting, but without explicit bright lines. ASU 2016-02 is effective for public companies for annual reporting periods beginning after December 15, 2018, and interim periods within those fiscal years. We have not yet selected a transition method
34
nor have we determined the effect of the standard on our ongoing financial reporting. As a result of the new standard, all of our leases greater than one year in duration will be recognized on our Consolidated Balance Sheets as both operating lease liabilities and right-of-use assets upon adoption of the standard.
On March 30, 2016, the FASB issued ASU No. 2016-09, Compensation—Stock Compensation (Topic 718): Improvements to Employee Share-Based Payment Accounting. The ASU includes multiple provisions intended to simplify various aspects of the accounting for share-based payments. Excess tax benefits for share-based payments will be recorded as a reduction of income taxes and reflected in operating cash flows upon the adoption of this ASU. Excess tax benefits are currently recorded in equity and as financing activity under the current rules. This guidance is effective for annual and interim reporting periods of public entities beginning after December 15, 2016 and is expected to have a favorable impact on earnings in 2016.
In August 2016, the FASB issued ASU 2016-15, Classification of Certain Cash Receipts and Cash Payments. The amendments in this ASU clarify the classification for eight different types of activities, including debt prepayment and extinguishment costs, proceeds from insurance claims and distributions from equity method investees. For public business entities, the standard is effective for financial statements issued for fiscal years beginning after December 15, 2017. This standard is not expected to have a material impact on our consolidated financial statements.
On October 24, 2016, the FASB issued ASU 2016-16, Accounting for Income Taxes: Intra-Entity Asset Transfers of Assets Other than Inventory. The new ASU eliminates the existing exception from recognition of the tax consequences of intercompany sales of assets other than inventory. Under the new standard, when an asset (other than inventory) is sold from one consolidated entity to another, the tax consequences to the seller will be recognized currently as a component of the current tax provision. The new guidance will be effective for public business entities in fiscal years beginning after December 15, 2017, including interim periods within those years. Early adoption is permitted in fiscal years beginning after December 15, 2016. We plan to early adopt this standard in 2017. In accordance with the ASU, our previously deferred tax costs and unrecognized deferred tax assets related to intra-entity asset transfers will need be recognized at the date of transition through a cumulative effect adjustment to opening retained earnings upon adoption of the standard.
Item 7A. Quantitative and Qualitative Disclosures About Market Risk
The information required by this item is included under the caption “Market Risk” in Item 7 above.
35
Item 8. Financial Statements and Supplementary Data
MANAGEMENT'S REPORT ON INTERNAL CONTROL OVER FINANCIAL REPORTING
Our management is responsible for establishing and maintaining adequate internal control over financial reporting. As defined by the Securities and Exchange Commission, internal control over financial reporting is a process designed to provide reasonable assurance regarding the reliability of financial reporting and the preparation of the consolidated financial statements in accordance with U.S. generally accepted accounting principles.
Because of its inherent limitations, internal control over financial reporting may not prevent or detect misstatements. Also, projections of any evaluation of effectiveness to future periods are subject to the risk that controls may become inadequate because of changes in conditions, or that the degree of compliance with the policies or procedures may deteriorate.
Management, including our Chief Executive Officer and Chief Financial Officer, has undertaken an assessment of the effectiveness of the Company's internal control over financial reporting as of December 31, 2016, based on criteria established in Internal Control - Integrated Framework (2013) by the Committee of Sponsoring Organizations of the Treadway Commission. Management's assessment included an evaluation of the design of the Company's internal control over financial reporting and testing of the operational effectiveness of those controls.
Based on this assessment, management concluded that as of December 31, 2016, the Company's internal control over financial reporting was effective.
KPMG LLP, the independent registered public accounting firm that audited the Company's consolidated financial statements, has issued an audit report including an opinion on the effectiveness of our internal control over financial reporting as of December 31, 2016, a copy of which is included herein.
36
REPORT OF INDEPENDENT REGISTERED PUBLIC ACCOUNTING FIRM
The Board of Directors and StockholdersLennox International Inc.:
We have audited the accompanying consolidated balance sheets of Lennox International Inc. and subsidiaries (the Company) as of December 31, 2016 and 2015, and the related consolidated statements of operations, comprehensive income, stockholders’ equity, and cash flows for each of the years in the three-year period ended December 31, 2016. In connection with our audits of the consolidated financial statements, we have audited Schedule II - Valuation and Qualifying Accounts and Reserves (the Schedule). We also have audited the Company’s internal control over financial reporting as of December 31, 2016, based on criteria established in Internal Control - Integrated Framework (2013) issued by the Committee of Sponsoring Organizations of the Treadway Commission (COSO). The Company’s management is responsible for these consolidated financial statements, for maintaining effective internal control over financial reporting, and for its assessment of the effectiveness of internal control over financial reporting, included in the accompanying Management’s Report on Internal Control Over Financial Reporting. Our responsibility is to express an opinion on these consolidated financial statements and the Schedule and an opinion on the Company’s internal control over financial reporting based on our audits.
We conducted our audits in accordance with the standards of the Public Company Accounting Oversight Board (United States). Those standards require that we plan and perform the audits to obtain reasonable assurance about whether the financial statements are free of material misstatement and whether effective internal control over financial reporting was maintained in all material respects. Our audits of the consolidated financial statements included examining, on a test basis, evidence supporting the amounts and disclosures in the financial statements, assessing the accounting principles used and significant estimates made by management, and evaluating the overall financial statement presentation. Our audit of internal control over financial reporting included obtaining an understanding of internal control over financial reporting, assessing the risk that a material weakness exists, and testing and evaluating the design and operating effectiveness of internal control based on the assessed risk. Our audits also included performing such other procedures as we considered necessary in the circumstances. We believe that our audits provide a reasonable basis for our opinions.
A company’s internal control over financial reporting is a process designed to provide reasonable assurance regarding the reliability of financial reporting and the preparation of financial statements for external purposes in accordance with generally accepted accounting principles. A company’s internal control over financial reporting includes those policies and procedures that (1) pertain to the maintenance of records that, in reasonable detail, accurately and fairly reflect the transactions and dispositions of the assets of the company; (2) provide reasonable assurance that transactions are recorded as necessary to permit preparation of financial statements in accordance with generally accepted accounting principles, and that receipts and expenditures of the company are being made only in accordance with authorizations of management and directors of the company; and (3) provide reasonable assurance regarding prevention or timely detection of unauthorized acquisition, use, or disposition of the company’s assets that could have a material effect on the financial statements.
Because of its inherent limitations, internal control over financial reporting may not prevent or detect misstatements. Also, projections of any evaluation of effectiveness to future periods are subject to the risk that controls may become inadequate because of changes in conditions, or that the degree of compliance with the policies or procedures may deteriorate.
In our opinion, the consolidated financial statements referred to above present fairly, in all material respects, the financial position of the Company as of December 31, 2016 and 2015, and the results of its operations and its cash flows for each of the years in the three-year period ended December 31, 2016, in conformity with U.S. generally accepted accounting principles. Additionally, Schedule II - Valuation and Qualifying Accounts and Reserves, when considered in relation to the basic consolidated financial statements taken as a whole, presents fairly, in all material respects, the information set forth therein. Also in our opinion, the Company maintained, in all material respects, effective internal control over financial reporting as of December 31, 2016, based on criteria established in Internal Control - Integrated Framework (2013) issued by the Committee of Sponsoring Organizations of the Treadway Commission (COSO).
/s/ KPMG LLP
Dallas, TexasFebruary 21, 2017
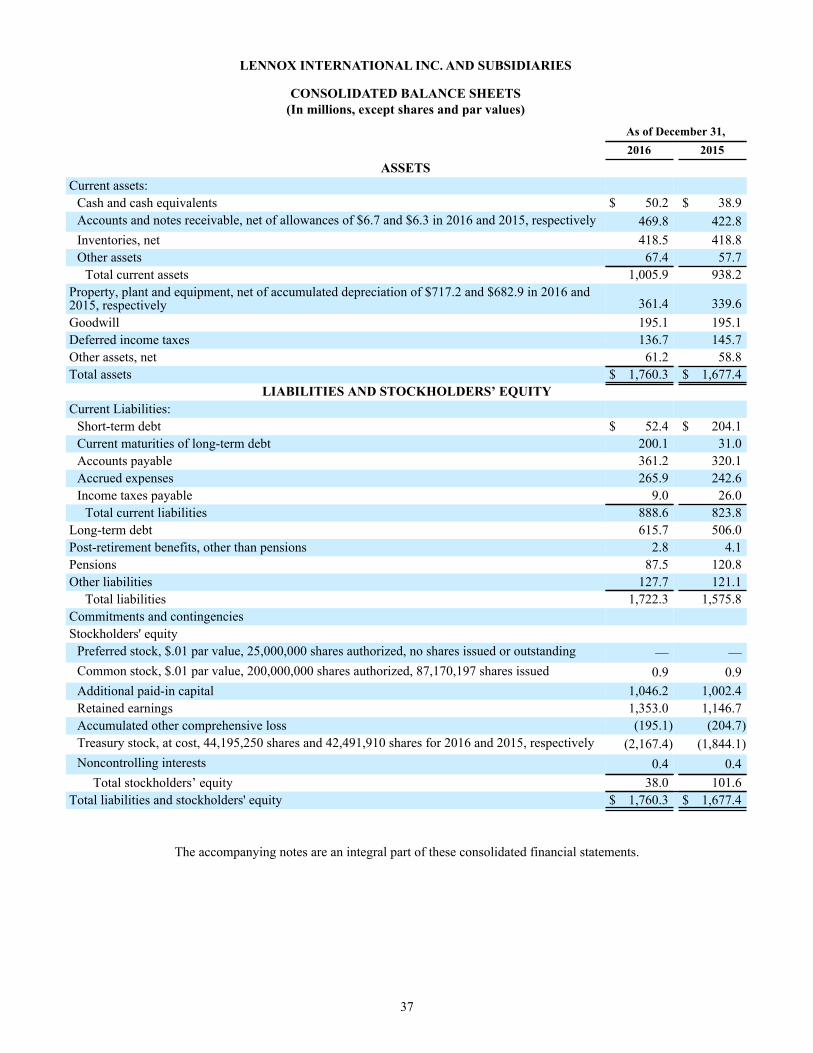
37
LENNOX INTERNATIONAL INC. AND SUBSIDIARIES
CONSOLIDATED BALANCE SHEETS(In millions, except shares and par values)
As of December 31,2016 2015
ASSETSCurrent assets:
Cash and cash equivalents $ 50.2 $ 38.9Accounts and notes receivable, net of allowances of $6.7 and $6.3 in 2016 and 2015, respectively 469.8 422.8Inventories, net 418.5 418.8Other assets 67.4 57.7
Total current assets 1,005.9 938.2Property, plant and equipment, net of accumulated depreciation of $717.2 and $682.9 in 2016 and2015, respectively 361.4 339.6Goodwill 195.1 195.1Deferred income taxes 136.7 145.7Other assets, net 61.2 58.8Total assets $ 1,760.3 $ 1,677.4
LIABILITIES AND STOCKHOLDERS’ EQUITYCurrent Liabilities:
Short-term debt $ 52.4 $ 204.1Current maturities of long-term debt 200.1 31.0Accounts payable 361.2 320.1Accrued expenses 265.9 242.6Income taxes payable 9.0 26.0
Total current liabilities 888.6 823.8Long-term debt 615.7 506.0Post-retirement benefits, other than pensions 2.8 4.1Pensions 87.5 120.8Other liabilities 127.7 121.1
Total liabilities 1,722.3 1,575.8Commitments and contingenciesStockholders' equity
Preferred stock, $.01 par value, 25,000,000 shares authorized, no shares issued or outstanding — —Common stock, $.01 par value, 200,000,000 shares authorized, 87,170,197 shares issued 0.9 0.9Additional paid-in capital 1,046.2 1,002.4Retained earnings 1,353.0 1,146.7Accumulated other comprehensive loss (195.1) (204.7)Treasury stock, at cost, 44,195,250 shares and 42,491,910 shares for 2016 and 2015, respectively (2,167.4) (1,844.1)Noncontrolling interests 0.4 0.4
Total stockholders’ equity 38.0 101.6Total liabilities and stockholders' equity $ 1,760.3 $ 1,677.4
The accompanying notes are an integral part of these consolidated financial statements.
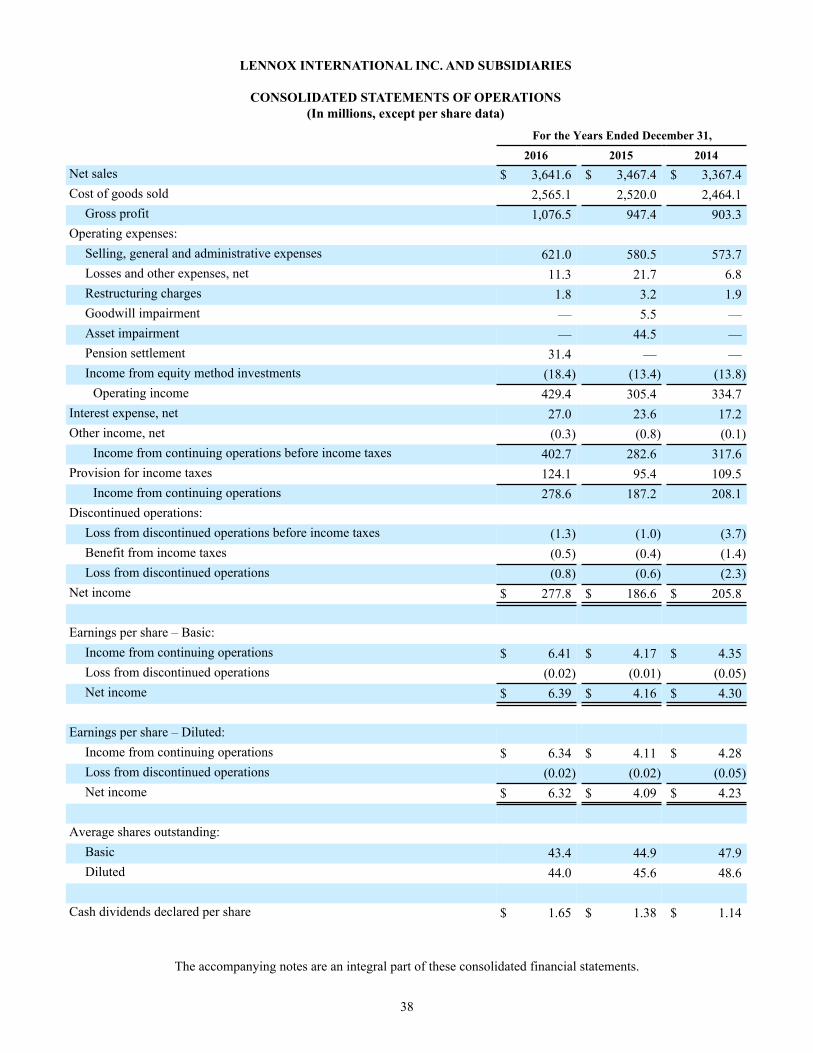
38
LENNOX INTERNATIONAL INC. AND SUBSIDIARIES
CONSOLIDATED STATEMENTS OF OPERATIONS(In millions, except per share data)
For the Years Ended December 31,
2016 2015 2014Net sales $ 3,641.6 $ 3,467.4 $ 3,367.4Cost of goods sold 2,565.1 2,520.0 2,464.1
Gross profit 1,076.5 947.4 903.3Operating expenses:
Selling, general and administrative expenses 621.0 580.5 573.7Losses and other expenses, net 11.3 21.7 6.8Restructuring charges 1.8 3.2 1.9Goodwill impairment — 5.5 —Asset impairment — 44.5 —Pension settlement 31.4 — —Income from equity method investments (18.4) (13.4) (13.8)
Operating income 429.4 305.4 334.7Interest expense, net 27.0 23.6 17.2Other income, net (0.3) (0.8) (0.1)
Income from continuing operations before income taxes 402.7 282.6 317.6Provision for income taxes 124.1 95.4 109.5
Income from continuing operations 278.6 187.2 208.1Discontinued operations:
Loss from discontinued operations before income taxes (1.3) (1.0) (3.7)Benefit from income taxes (0.5) (0.4) (1.4)Loss from discontinued operations (0.8) (0.6) (2.3)
Net income $ 277.8 $ 186.6 $ 205.8
Earnings per share – Basic:Income from continuing operations $ 6.41 $ 4.17 $ 4.35Loss from discontinued operations (0.02) (0.01) (0.05)Net income $ 6.39 $ 4.16 $ 4.30
Earnings per share – Diluted:Income from continuing operations $ 6.34 $ 4.11 $ 4.28Loss from discontinued operations (0.02) (0.02) (0.05)Net income $ 6.32 $ 4.09 $ 4.23
Average shares outstanding:Basic 43.4 44.9 47.9Diluted 44.0 45.6 48.6
Cash dividends declared per share $ 1.65 $ 1.38 $ 1.14
The accompanying notes are an integral part of these consolidated financial statements.
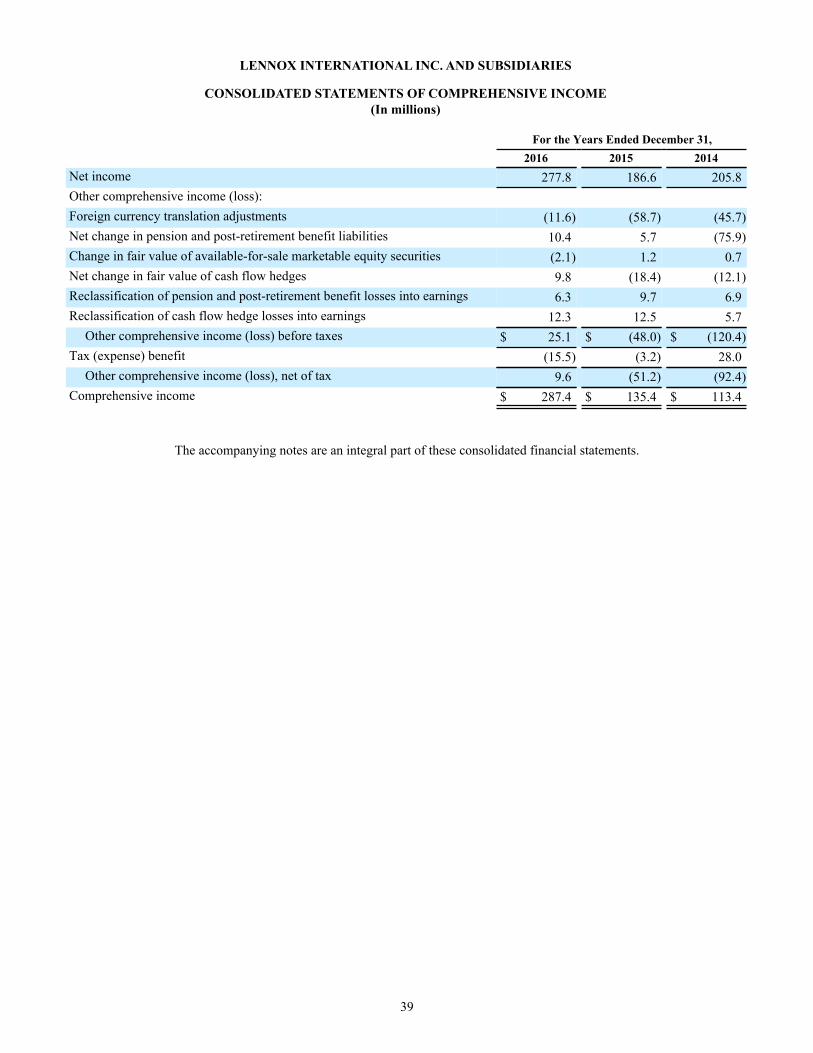
39
LENNOX INTERNATIONAL INC. AND SUBSIDIARIES
CONSOLIDATED STATEMENTS OF COMPREHENSIVE INCOME(In millions)
For the Years Ended December 31, 2016 2015 2014Net income 277.8 186.6 205.8Other comprehensive income (loss):Foreign currency translation adjustments (11.6) (58.7) (45.7)Net change in pension and post-retirement benefit liabilities 10.4 5.7 (75.9)Change in fair value of available-for-sale marketable equity securities (2.1) 1.2 0.7Net change in fair value of cash flow hedges 9.8 (18.4) (12.1)Reclassification of pension and post-retirement benefit losses into earnings 6.3 9.7 6.9Reclassification of cash flow hedge losses into earnings 12.3 12.5 5.7
Other comprehensive income (loss) before taxes $ 25.1 $ (48.0) $ (120.4)Tax (expense) benefit (15.5) (3.2) 28.0
Other comprehensive income (loss), net of tax 9.6 (51.2) (92.4)Comprehensive income $ 287.4 $ 135.4 $ 113.4
The accompanying notes are an integral part of these consolidated financial statements.
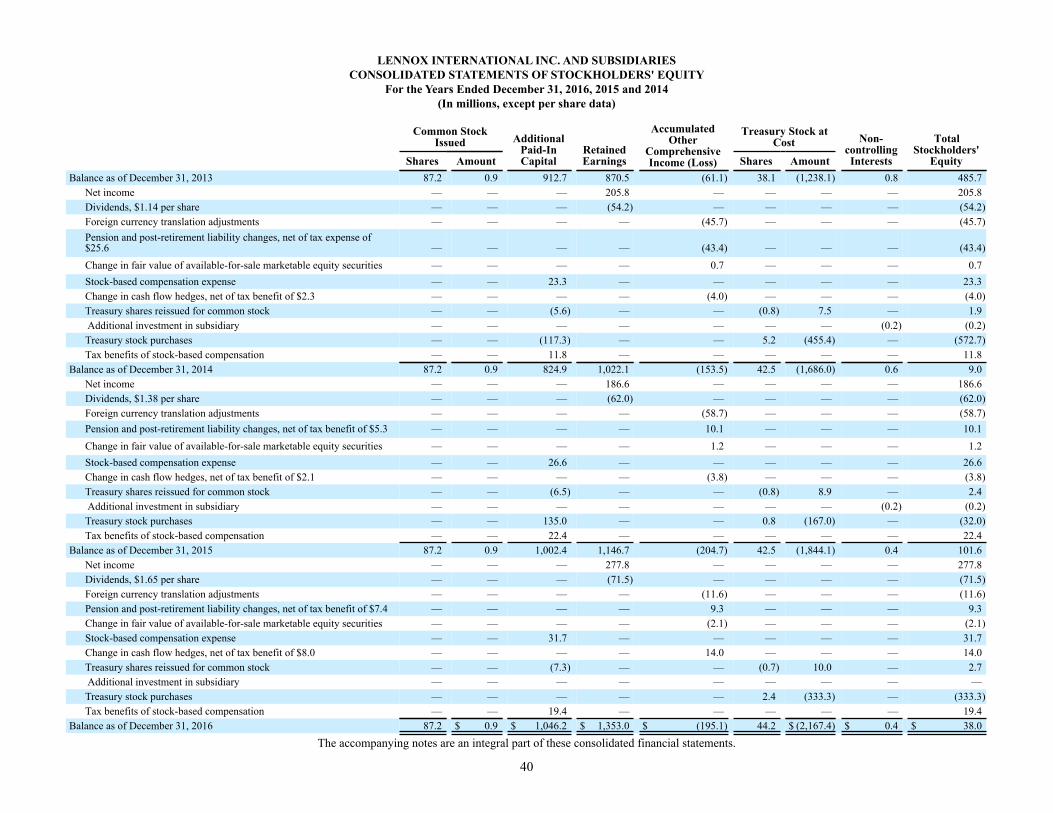
40
LENNOX INTERNATIONAL INC. AND SUBSIDIARIESCONSOLIDATED STATEMENTS OF STOCKHOLDERS' EQUITY
For the Years Ended December 31, 2016, 2015 and 2014(In millions, except per share data)
Common StockIssued Additional
Paid-InCapital
RetainedEarnings
AccumulatedOther
ComprehensiveIncome (Loss)
Treasury Stock atCost Non-
controllingInterests
TotalStockholders'
EquityShares Amount Shares AmountBalance as of December 31, 2013 87.2 0.9 912.7 870.5 (61.1) 38.1 (1,238.1) 0.8 485.7
Net income — — — 205.8 — — — — 205.8Dividends, $1.14 per share — — — (54.2) — — — — (54.2)Foreign currency translation adjustments — — — — (45.7) — — — (45.7)Pension and post-retirement liability changes, net of tax expense of$25.6 — — — — (43.4) — — — (43.4)Change in fair value of available-for-sale marketable equity securities — — — — 0.7 — — — 0.7Stock-based compensation expense — — 23.3 — — — — — 23.3Change in cash flow hedges, net of tax benefit of $2.3 — — — — (4.0) — — — (4.0)Treasury shares reissued for common stock — — (5.6) — — (0.8) 7.5 — 1.9 Additional investment in subsidiary — — — — — — — (0.2) (0.2)Treasury stock purchases — — (117.3) — — 5.2 (455.4) — (572.7)Tax benefits of stock-based compensation — — 11.8 — — — — — 11.8
Balance as of December 31, 2014 87.2 0.9 824.9 1,022.1 (153.5) 42.5 (1,686.0) 0.6 9.0Net income — — — 186.6 — — — — 186.6Dividends, $1.38 per share — — — (62.0) — — — — (62.0)Foreign currency translation adjustments — — — — (58.7) — — — (58.7)Pension and post-retirement liability changes, net of tax benefit of $5.3 — — — — 10.1 — — — 10.1Change in fair value of available-for-sale marketable equity securities — — — — 1.2 — — — 1.2Stock-based compensation expense — — 26.6 — — — — — 26.6Change in cash flow hedges, net of tax benefit of $2.1 — — — — (3.8) — — — (3.8)Treasury shares reissued for common stock — — (6.5) — — (0.8) 8.9 — 2.4 Additional investment in subsidiary — — — — — — — (0.2) (0.2)Treasury stock purchases — — 135.0 — — 0.8 (167.0) — (32.0)Tax benefits of stock-based compensation — — 22.4 — — — — — 22.4
Balance as of December 31, 2015 87.2 0.9 1,002.4 1,146.7 (204.7) 42.5 (1,844.1) 0.4 101.6Net income — — — 277.8 — — — — 277.8Dividends, $1.65 per share — — — (71.5) — — — — (71.5)Foreign currency translation adjustments — — — — (11.6) — — — (11.6)Pension and post-retirement liability changes, net of tax benefit of $7.4 — — — — 9.3 — — — 9.3Change in fair value of available-for-sale marketable equity securities — — — — (2.1) — — — (2.1)Stock-based compensation expense — — 31.7 — — — — — 31.7Change in cash flow hedges, net of tax benefit of $8.0 — — — — 14.0 — — — 14.0Treasury shares reissued for common stock — — (7.3) — — (0.7) 10.0 — 2.7 Additional investment in subsidiary — — — — — — — — —Treasury stock purchases — — — — — 2.4 (333.3) — (333.3)Tax benefits of stock-based compensation — — 19.4 — — — — — 19.4
Balance as of December 31, 2016 87.2 $ 0.9 $ 1,046.2 $ 1,353.0 $ (195.1) 44.2 $ (2,167.4) $ 0.4 $ 38.0
The accompanying notes are an integral part of these consolidated financial statements.
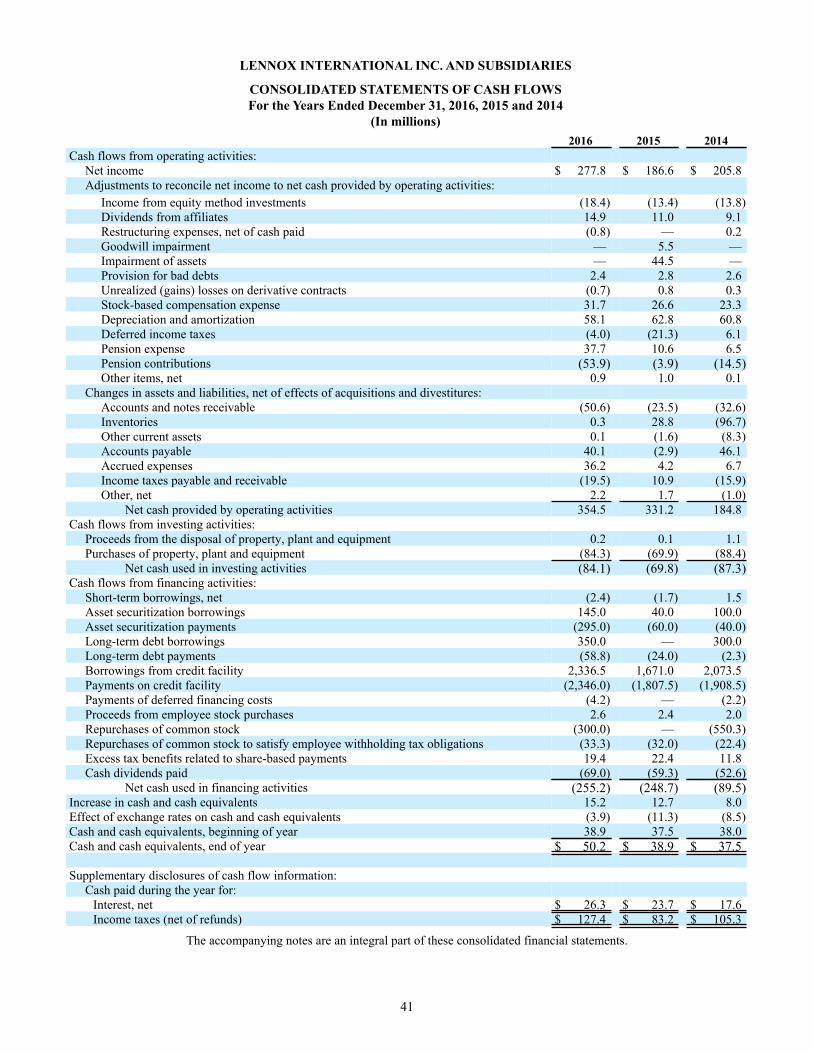
41
LENNOX INTERNATIONAL INC. AND SUBSIDIARIES
CONSOLIDATED STATEMENTS OF CASH FLOWSFor the Years Ended December 31, 2016, 2015 and 2014
(In millions)2016 2015 2014
Cash flows from operating activities:Net income $ 277.8 $ 186.6 $ 205.8Adjustments to reconcile net income to net cash provided by operating activities:
Income from equity method investments (18.4) (13.4) (13.8)Dividends from affiliates 14.9 11.0 9.1Restructuring expenses, net of cash paid (0.8) — 0.2Goodwill impairment — 5.5 —Impairment of assets — 44.5 —Provision for bad debts 2.4 2.8 2.6Unrealized (gains) losses on derivative contracts (0.7) 0.8 0.3Stock-based compensation expense 31.7 26.6 23.3Depreciation and amortization 58.1 62.8 60.8Deferred income taxes (4.0) (21.3) 6.1Pension expense 37.7 10.6 6.5Pension contributions (53.9) (3.9) (14.5)Other items, net 0.9 1.0 0.1
Changes in assets and liabilities, net of effects of acquisitions and divestitures:Accounts and notes receivable (50.6) (23.5) (32.6)Inventories 0.3 28.8 (96.7)Other current assets 0.1 (1.6) (8.3)Accounts payable 40.1 (2.9) 46.1Accrued expenses 36.2 4.2 6.7Income taxes payable and receivable (19.5) 10.9 (15.9)Other, net 2.2 1.7 (1.0)
Net cash provided by operating activities 354.5 331.2 184.8Cash flows from investing activities:
Proceeds from the disposal of property, plant and equipment 0.2 0.1 1.1Purchases of property, plant and equipment (84.3) (69.9) (88.4)
Net cash used in investing activities (84.1) (69.8) (87.3)Cash flows from financing activities:
Short-term borrowings, net (2.4) (1.7) 1.5Asset securitization borrowings 145.0 40.0 100.0Asset securitization payments (295.0) (60.0) (40.0)Long-term debt borrowings 350.0 — 300.0Long-term debt payments (58.8) (24.0) (2.3)Borrowings from credit facility 2,336.5 1,671.0 2,073.5Payments on credit facility (2,346.0) (1,807.5) (1,908.5)Payments of deferred financing costs (4.2) — (2.2)Proceeds from employee stock purchases 2.6 2.4 2.0Repurchases of common stock (300.0) — (550.3)Repurchases of common stock to satisfy employee withholding tax obligations (33.3) (32.0) (22.4)Excess tax benefits related to share-based payments 19.4 22.4 11.8Cash dividends paid (69.0) (59.3) (52.6)
Net cash used in financing activities (255.2) (248.7) (89.5)Increase in cash and cash equivalents 15.2 12.7 8.0Effect of exchange rates on cash and cash equivalents (3.9) (11.3) (8.5)Cash and cash equivalents, beginning of year 38.9 37.5 38.0Cash and cash equivalents, end of year $ 50.2 $ 38.9 $ 37.5
Supplementary disclosures of cash flow information:Cash paid during the year for:
Interest, net $ 26.3 $ 23.7 $ 17.6Income taxes (net of refunds) $ 127.4 $ 83.2 $ 105.3
The accompanying notes are an integral part of these consolidated financial statements.
42
LENNOX INTERNATIONAL INC.
NOTES TO CONSOLIDATED FINANCIAL STATEMENTS1. Nature of Operations:
Lennox International Inc., a Delaware corporation, through its subsidiaries (referred to herein as "we," "our," "us," "LII," or the "Company"), is a leading global provider of climate control solutions. We design, manufacture, market and service a broad range of products for the heating, ventilation, air conditioning and refrigeration ("HVACR") markets and sell our products and services through a combination of direct sales, distributors and company-owned parts and supplies stores. We operate in threereportable business segments: Residential Heating & Cooling, Commercial Heating & Cooling, and Refrigeration. See Note 18 for financial information regarding our reportable segments.
2. Summary of Significant Accounting Policies:
Principles of Consolidation
The consolidated financial statements include the accounts of Lennox International Inc. and our majority-owned subsidiaries. All intercompany transactions, profits and balances have been eliminated.
Cash and Cash Equivalents
We consider all highly liquid temporary investments with original maturity dates of three months or less to be cash equivalents. Cash and cash equivalents consisted primarily of bank deposits.
Accounts and Notes Receivable
Accounts and notes receivable are shown in the accompanying Consolidated Balance Sheets, net of allowance for doubtful accounts. The allowance for doubtful accounts is generally established during the period in which receivables are recognized and is based on the age of the receivables and management's judgment on our ability to collect. Management considers the historical trends of write-offs and recoveries of previously written-off accounts, the financial strength of customers and projected economic and market conditions. We determine the delinquency status of receivables predominantly based on contractual terms and we write-off uncollectible receivables after management's review of our ability to collect, as noted above. We have no significant concentrations of credit risk within our accounts and notes receivable.
Inventories
Inventory costs include material, labor, depreciation and plant overhead. Inventories of $221.4 million and $212.4 million as of December 31, 2016 and 2015, respectively, were valued at the lower of cost or market using the last-in, first-out (“LIFO”) cost method. The remainder of inventory is valued at the lower of cost or market with cost determined primarily using either the first-in, first-out (“FIFO”) or average cost methods.
We elected to use the LIFO cost method for our domestic manufacturing companies in 1974 and continued to elect the LIFO cost method for new operations through the late 1980s. The types of inventory costs that use LIFO include raw materials, purchased components, work-in-process, repair parts and finished goods. Since the late 1990s, we have adopted the FIFO cost method for all new domestic manufacturing operations (primarily acquisitions). Our operating entities with a previous LIFO election continue to use the LIFO cost method. We use the FIFO cost method for our foreign-based manufacturing facilities. See Note 3 for more information on our inventories.
Property, Plant and Equipment
Property, plant and equipment is stated at cost, net of accumulated depreciation. Expenditures that increase the utility or extend the useful lives of fixed assets are capitalized while expenditures for maintenance and repairs are charged to expense as incurred.
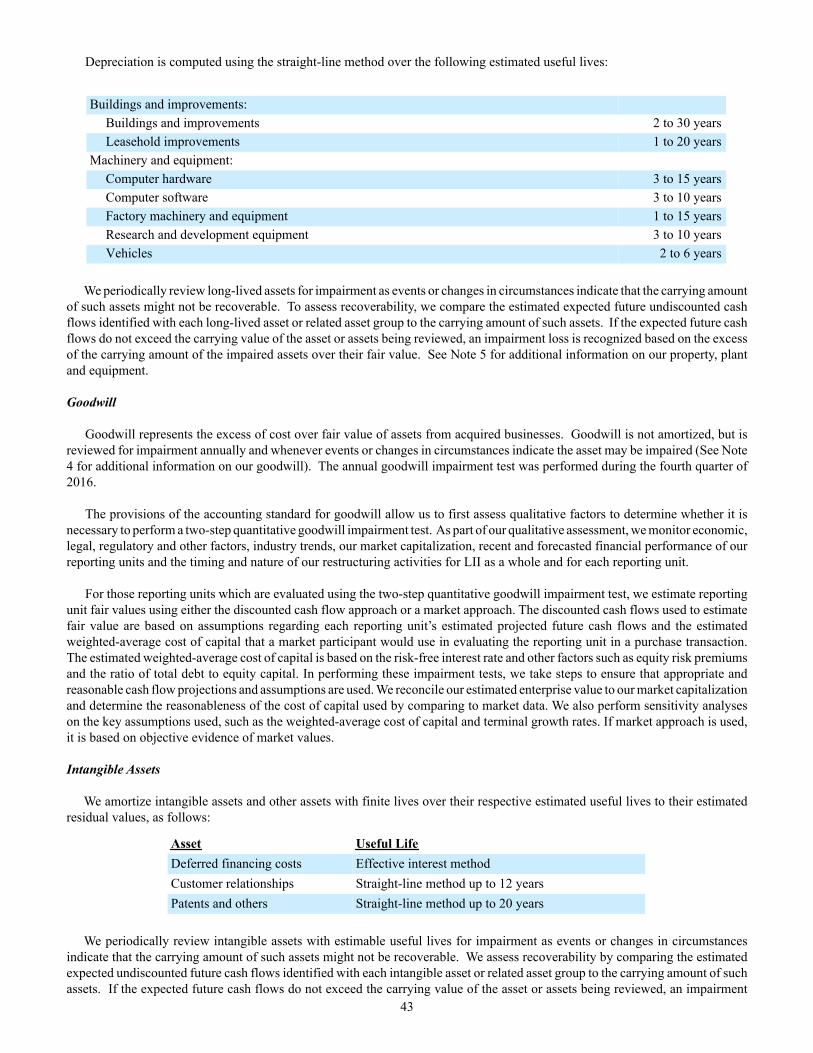
43
Depreciation is computed using the straight-line method over the following estimated useful lives:
Buildings and improvements:Buildings and improvements 2 to 30 yearsLeasehold improvements 1 to 20 years
Machinery and equipment:Computer hardware 3 to 15 yearsComputer software 3 to 10 yearsFactory machinery and equipment 1 to 15 yearsResearch and development equipment 3 to 10 yearsVehicles 2 to 6 years
We periodically review long-lived assets for impairment as events or changes in circumstances indicate that the carrying amount
of such assets might not be recoverable. To assess recoverability, we compare the estimated expected future undiscounted cash flows identified with each long-lived asset or related asset group to the carrying amount of such assets. If the expected future cash flows do not exceed the carrying value of the asset or assets being reviewed, an impairment loss is recognized based on the excess of the carrying amount of the impaired assets over their fair value. See Note 5 for additional information on our property, plant and equipment.
Goodwill
Goodwill represents the excess of cost over fair value of assets from acquired businesses. Goodwill is not amortized, but is reviewed for impairment annually and whenever events or changes in circumstances indicate the asset may be impaired (See Note 4 for additional information on our goodwill). The annual goodwill impairment test was performed during the fourth quarter of 2016.
The provisions of the accounting standard for goodwill allow us to first assess qualitative factors to determine whether it is necessary to perform a two-step quantitative goodwill impairment test. As part of our qualitative assessment, we monitor economic, legal, regulatory and other factors, industry trends, our market capitalization, recent and forecasted financial performance of our reporting units and the timing and nature of our restructuring activities for LII as a whole and for each reporting unit.
For those reporting units which are evaluated using the two-step quantitative goodwill impairment test, we estimate reporting unit fair values using either the discounted cash flow approach or a market approach. The discounted cash flows used to estimate fair value are based on assumptions regarding each reporting unit’s estimated projected future cash flows and the estimated weighted-average cost of capital that a market participant would use in evaluating the reporting unit in a purchase transaction. The estimated weighted-average cost of capital is based on the risk-free interest rate and other factors such as equity risk premiums and the ratio of total debt to equity capital. In performing these impairment tests, we take steps to ensure that appropriate and reasonable cash flow projections and assumptions are used. We reconcile our estimated enterprise value to our market capitalization and determine the reasonableness of the cost of capital used by comparing to market data. We also perform sensitivity analyses on the key assumptions used, such as the weighted-average cost of capital and terminal growth rates. If market approach is used, it is based on objective evidence of market values.
Intangible Assets
We amortize intangible assets and other assets with finite lives over their respective estimated useful lives to their estimated residual values, as follows:
Asset Useful LifeDeferred financing costs Effective interest methodCustomer relationships Straight-line method up to 12 yearsPatents and others Straight-line method up to 20 years
We periodically review intangible assets with estimable useful lives for impairment as events or changes in circumstances indicate that the carrying amount of such assets might not be recoverable. We assess recoverability by comparing the estimated expected undiscounted future cash flows identified with each intangible asset or related asset group to the carrying amount of such assets. If the expected future cash flows do not exceed the carrying value of the asset or assets being reviewed, an impairment
44
loss is recognized based on the excess of the carrying amount of the impaired assets over their fair value. In assessing the fair value of these intangible assets, we must make assumptions that a market participant would make regarding estimated future cash flows and other factors to determine the fair value of the respective assets. If these estimates or the related assumptions change, we may be required to record impairment charges for these assets in the future.
We review our indefinite-lived intangible assets for impairment annually in the fourth quarter and whenever events or changes in circumstances indicate the asset may be impaired. The provisions of the accounting standard for indefinite-lived intangible assets allow us to first assess qualitative factors to determine whether it is necessary to perform a two-step quantitative impairment test. As part of our qualitative assessment, we monitor economic, legal, regulatory and other factors, industry trends, recent and forecasted financial performance of our reporting units and the timing and nature of our restructuring activities for LII as a whole and as they relate to the fair value of the assets. For those intangible assets which are evaluated using the two-step quantitative impairment test, we compare the estimated expected undiscounted future cash flows identified with each intangible asset or related asset group to the carrying amount of such assets. If the expected future cash flows do not exceed the carrying value of the asset or assets being reviewed, an impairment loss is recognized based on the excess of the carrying amount of the impaired assets over their fair value. See Note 4 for additional information on our intangible assets.
Product Warranties
For some of our heating, ventilation and air conditioning (“HVAC”) products, we provide warranty terms ranging from one to 20 years to customers for certain components such as compressors or heat exchangers. For select products, we also provide limited lifetime warranties. A liability for estimated warranty expense is recorded on the date that revenue is recognized. Our estimates of future warranty costs are determined by product line. The number of units we expect to repair or replace is determined by applying an estimated failure rate, which is generally based on historical experience, to the number of units that were sold and are still under warranty. The estimated units to be repaired under warranty are multiplied by the average cost to repair or replace such products to determine the estimated future warranty cost. We do not discount product warranty liabilities as the amounts are not fixed and the timing of future cash payments is neither fixed nor reliably determinable. We also provide for specifically-identified warranty obligations. Estimated future warranty costs are subject to adjustment depending on changes in actual failure rate and cost experience. Subsequent costs incurred for warranty claims serve to reduce the accrued product warranty liability. See Note 10 for more information on our estimated future warranty costs.
Pensions and Post-retirement Benefits
We provide pension and post-retirement medical benefits to eligible domestic and foreign employees and we recognize pension and post-retirement benefit costs over the estimated service life or average life expectancy of those employees. We also recognize the funded status of our benefit plans, as measured at year-end by the difference between plan assets at fair value and the benefit obligation, in the Consolidated Balance Sheets. Changes in the funded status are recognized in the year in which the changes occur through accumulated other comprehensive income (“AOCI”). Actuarial gains or losses are amortized into net period benefit cost over the estimated service life of covered employees or average life expectancy of participants depending on the plan.
The benefit plan assets and liabilities reflect assumptions about the long-range performance of our benefit plans. Should actual
results differ from management's estimates, revisions to the benefit plan assets and liabilities would be required. See Note 12 for information regarding those estimates and additional disclosures on pension and post-retirement medical benefits.
Self-Insurance
Self-insurance expense and liabilities were actuarially determined based primarily on our historical claims information and industry factors and trends. The self-insurance liabilities as of December 31, 2016 represent the best estimate of the future payments to be made on reported and unreported losses for 2016 and prior years. The amounts and timing of payments for claims reserved may vary depending on various factors, including the development and ultimate settlement of reported and unreported claims. To the extent actuarial assumptions change and claims experience rates differ from historical rates, our liabilities may change. See Note 10 for additional information on our self-insured risks and liabilities.
Derivatives
We use futures contracts, forward contracts and fixed forward contracts to mitigate our exposure to volatility in metal commodity prices and foreign exchange rates. We hedge only exposures in the ordinary course of business and do not hold or trade derivatives for profit. All derivatives are recognized in the Consolidated Balance Sheets at fair value and the classification of each derivative instrument is based upon whether the maturity of the instrument is less than or greater than 12 months. See Note 8 for more information on our derivatives.
45
Income Taxes
We recognize deferred tax assets and liabilities for the future tax consequences attributable to differences between the financial statement carrying amounts of existing assets and liabilities and their respective tax bases and operating loss and tax credit carry forwards. Deferred tax assets and liabilities are measured using enacted tax rates expected to apply to taxable income in the years in which those temporary differences are expected to be recovered or settled. The effect of a change in tax rates on deferred tax assets and liabilities is recognized in income in the period that includes the enactment date. Unrecognized tax benefits are accounted for as required by the Financial Accounting Standards Board (“FASB”) Accounting Standards Codification (“ASC”) Topic 740. See Note 9 for more information related to income taxes.
Revenue Recognition
Our revenue recognition practices for the sale of goods depend upon the shipping terms for each transaction. Shipping terms are primarily FOB Shipping Point and, therefore, revenue is recognized for these transactions when products are shipped to customers and title passes. Certain customers in our smaller operations, primarily outside of North America, have shipping terms where title and risk of ownership do not transfer until the product is delivered to the customer. For these transactions, revenue is recognized on the date that the product is received and accepted by such customers. We experience returns for miscellaneous reasons and record a reserve for these returns at the time we recognize revenue based on historical experience. Our historical rates of return are insignificant as a percentage of sales. We also recognize revenue net of sales taxes.
For our businesses that provide services, revenue is recognized at the time services are completed. Our Commercial Heating & Cooling segment also provides sales, installation, maintenance and repair services under fixed-price contracts. Revenue for these services is recognized over the life of the contract.
We engage in cooperative advertising, customer rebate, and other miscellaneous programs that result in payments or credits being issued to our customers. We record these customer discounts and incentives as a reduction of sales when the sales are recorded. For certain cooperative advertising programs, we also receive an identifiable benefit (goods or services) in exchange for the consideration given, and, accordingly, record a ratable portion of the expenditure to Selling, general and administrative (“SG&A”) expenses. All other advertising, promotions and marketing costs are expensed as incurred. See Note 22 for more information on these costs.
Cost of Goods Sold
The principal elements of cost of goods sold are components, raw materials, factory overhead, labor, estimated costs of warranty expense and freight and distribution costs.
Selling, General and Administrative Expenses
SG&A expenses include payroll and benefit costs, advertising, commissions, research and development, information technology costs, and other selling, general and administrative related costs such as insurance, travel, non-production depreciation and rent.
Stock-Based Compensation
We recognize compensation expense for stock-based arrangements over the required employee service periods. We measure stock-based compensation costs on the estimated grant-date fair value of the stock-based awards that are expected to ultimately vest and we adjust expected vesting rates to actual rates as additional information becomes known. For stock-based arrangements with performance conditions, we periodically adjust performance achievement rates based on our best estimates of those rates at the end of the performance period. See Note 14 for more information.
Translation of Foreign Currencies
All assets and liabilities of foreign subsidiaries and joint ventures are translated into U.S. dollars using rates of exchange in effect at the balance sheet date. Revenue and expenses are translated at weighted average exchange rates during the year. Unrealized translation gains and losses are included in AOCI in the accompanying Consolidated Balance Sheets. Transaction gains and losses are included in Losses and other expenses, net in the accompanying Consolidated Statements of Operations.
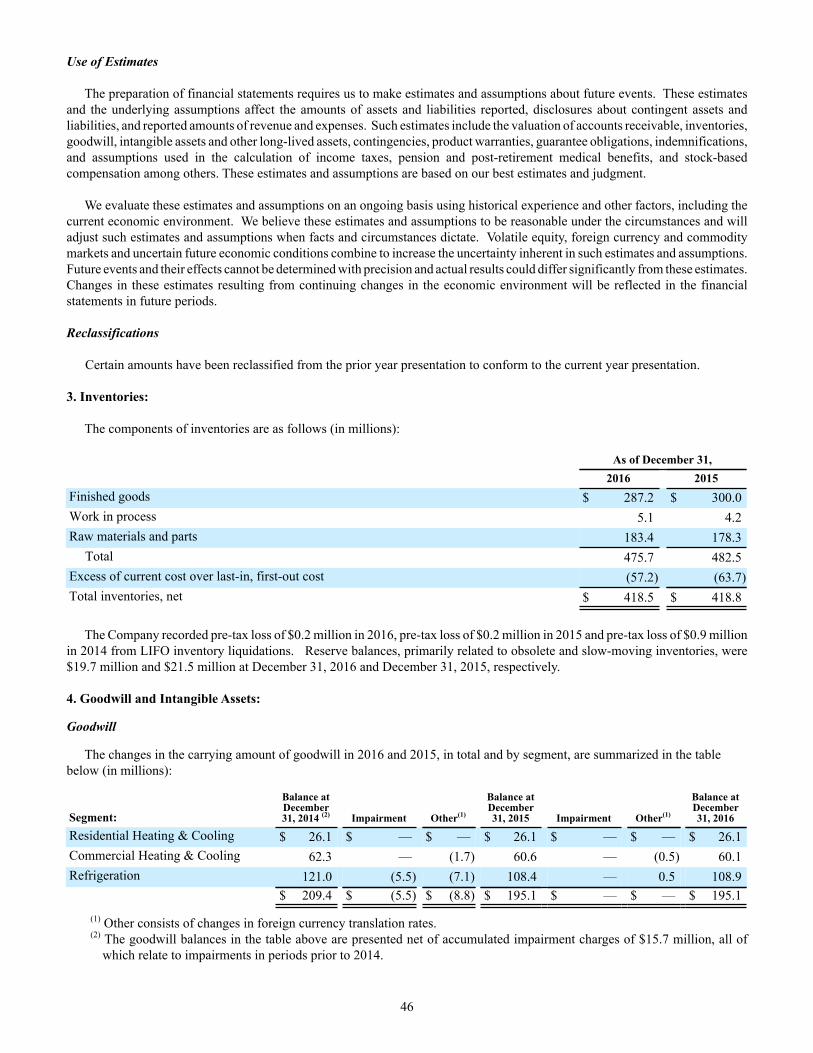
46
Use of Estimates
The preparation of financial statements requires us to make estimates and assumptions about future events. These estimates and the underlying assumptions affect the amounts of assets and liabilities reported, disclosures about contingent assets and liabilities, and reported amounts of revenue and expenses. Such estimates include the valuation of accounts receivable, inventories, goodwill, intangible assets and other long-lived assets, contingencies, product warranties, guarantee obligations, indemnifications, and assumptions used in the calculation of income taxes, pension and post-retirement medical benefits, and stock-based compensation among others. These estimates and assumptions are based on our best estimates and judgment.
We evaluate these estimates and assumptions on an ongoing basis using historical experience and other factors, including the current economic environment. We believe these estimates and assumptions to be reasonable under the circumstances and will adjust such estimates and assumptions when facts and circumstances dictate. Volatile equity, foreign currency and commodity markets and uncertain future economic conditions combine to increase the uncertainty inherent in such estimates and assumptions. Future events and their effects cannot be determined with precision and actual results could differ significantly from these estimates. Changes in these estimates resulting from continuing changes in the economic environment will be reflected in the financial statements in future periods.
Reclassifications
Certain amounts have been reclassified from the prior year presentation to conform to the current year presentation.
3. Inventories:
The components of inventories are as follows (in millions):
As of December 31,2016 2015
Finished goods $ 287.2 $ 300.0Work in process 5.1 4.2Raw materials and parts 183.4 178.3
Total 475.7 482.5Excess of current cost over last-in, first-out cost (57.2) (63.7)Total inventories, net $ 418.5 $ 418.8
The Company recorded pre-tax loss of $0.2 million in 2016, pre-tax loss of $0.2 million in 2015 and pre-tax loss of $0.9 million in 2014 from LIFO inventory liquidations. Reserve balances, primarily related to obsolete and slow-moving inventories, were$19.7 million and $21.5 million at December 31, 2016 and December 31, 2015, respectively.
4. Goodwill and Intangible Assets:
Goodwill
The changes in the carrying amount of goodwill in 2016 and 2015, in total and by segment, are summarized in the table below (in millions):
Segment:
Balance at December 31, 2014 (2) Impairment Other(1)
Balance at December 31, 2015 Impairment Other(1)
Balance atDecember31, 2016
Residential Heating & Cooling $ 26.1 $ — $ — $ 26.1 $ — $ — $ 26.1Commercial Heating & Cooling 62.3 — (1.7) 60.6 — (0.5) 60.1Refrigeration 121.0 (5.5) (7.1) 108.4 — 0.5 108.9
$ 209.4 $ (5.5) $ (8.8) $ 195.1 $ — $ — $ 195.1
(1) Other consists of changes in foreign currency translation rates.(2) The goodwill balances in the table above are presented net of accumulated impairment charges of $15.7 million, all of
which relate to impairments in periods prior to 2014.
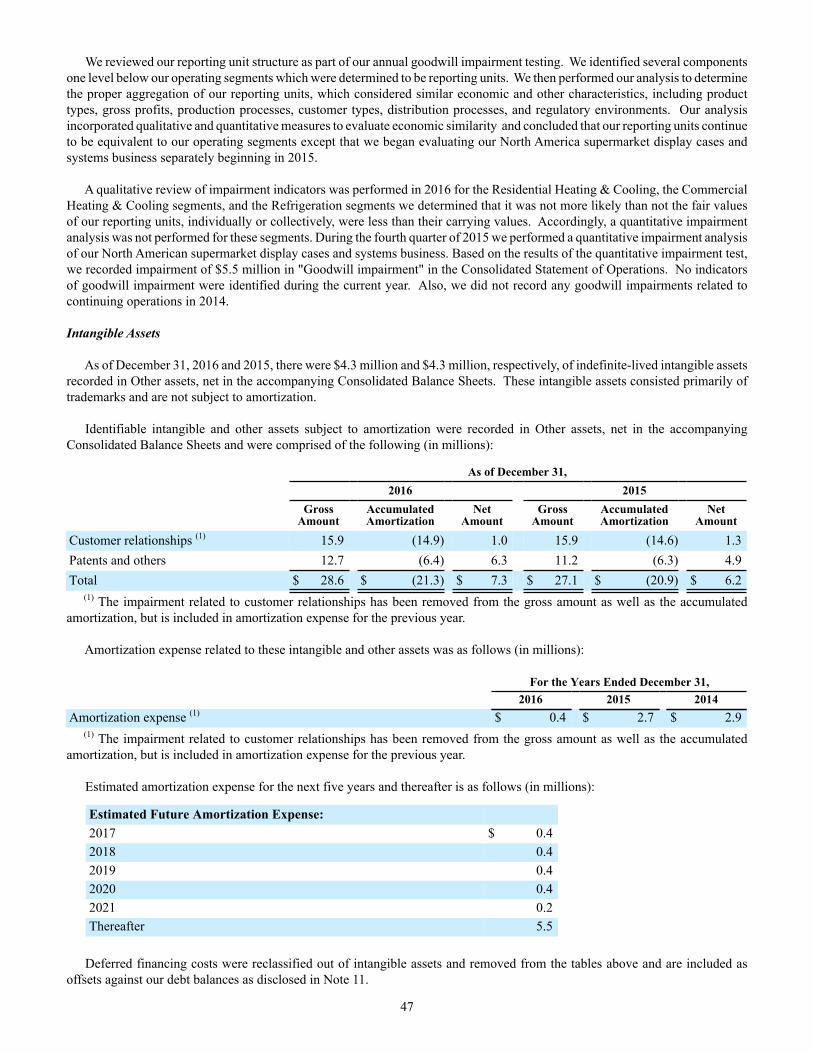
47
We reviewed our reporting unit structure as part of our annual goodwill impairment testing. We identified several components one level below our operating segments which were determined to be reporting units. We then performed our analysis to determine the proper aggregation of our reporting units, which considered similar economic and other characteristics, including product types, gross profits, production processes, customer types, distribution processes, and regulatory environments. Our analysis incorporated qualitative and quantitative measures to evaluate economic similarity and concluded that our reporting units continue to be equivalent to our operating segments except that we began evaluating our North America supermarket display cases and systems business separately beginning in 2015.
A qualitative review of impairment indicators was performed in 2016 for the Residential Heating & Cooling, the Commercial Heating & Cooling segments, and the Refrigeration segments we determined that it was not more likely than not the fair values of our reporting units, individually or collectively, were less than their carrying values. Accordingly, a quantitative impairment analysis was not performed for these segments. During the fourth quarter of 2015 we performed a quantitative impairment analysis of our North American supermarket display cases and systems business. Based on the results of the quantitative impairment test, we recorded impairment of $5.5 million in "Goodwill impairment" in the Consolidated Statement of Operations. No indicators of goodwill impairment were identified during the current year. Also, we did not record any goodwill impairments related to continuing operations in 2014.
Intangible Assets
As of December 31, 2016 and 2015, there were $4.3 million and $4.3 million, respectively, of indefinite-lived intangible assets recorded in Other assets, net in the accompanying Consolidated Balance Sheets. These intangible assets consisted primarily of trademarks and are not subject to amortization.
Identifiable intangible and other assets subject to amortization were recorded in Other assets, net in the accompanying Consolidated Balance Sheets and were comprised of the following (in millions):
As of December 31,2016 2015
GrossAmount
AccumulatedAmortization
NetAmount
GrossAmount
AccumulatedAmortization
NetAmount
Customer relationships (1) 15.9 (14.9) 1.0 15.9 (14.6) 1.3Patents and others 12.7 (6.4) 6.3 11.2 (6.3) 4.9Total $ 28.6 $ (21.3) $ 7.3 $ 27.1 $ (20.9) $ 6.2
(1) The impairment related to customer relationships has been removed from the gross amount as well as the accumulated amortization, but is included in amortization expense for the previous year.
Amortization expense related to these intangible and other assets was as follows (in millions):
For the Years Ended December 31,2016 2015 2014
Amortization expense (1) $ 0.4 $ 2.7 $ 2.9(1) The impairment related to customer relationships has been removed from the gross amount as well as the accumulated
amortization, but is included in amortization expense for the previous year.
Estimated amortization expense for the next five years and thereafter is as follows (in millions):
Estimated Future Amortization Expense:2017 $ 0.42018 0.42019 0.42020 0.42021 0.2Thereafter 5.5
Deferred financing costs were reclassified out of intangible assets and removed from the tables above and are included as offsets against our debt balances as disclosed in Note 11.
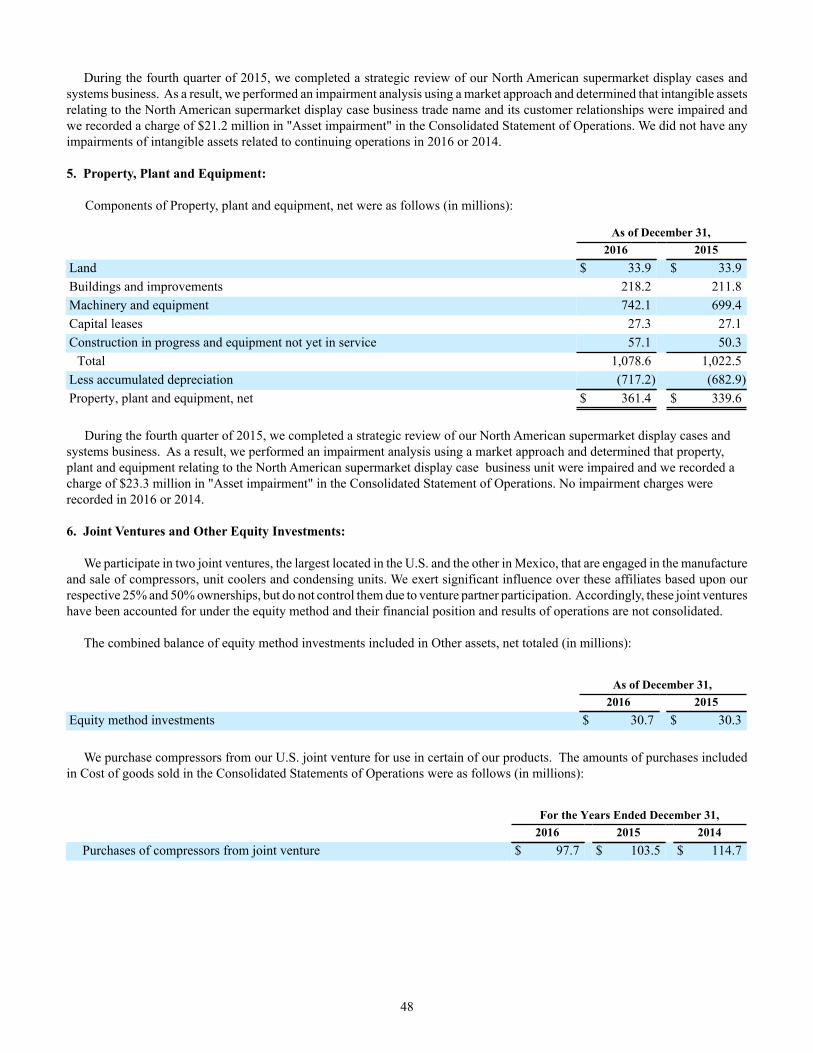
48
During the fourth quarter of 2015, we completed a strategic review of our North American supermarket display cases and systems business. As a result, we performed an impairment analysis using a market approach and determined that intangible assets relating to the North American supermarket display case business trade name and its customer relationships were impaired and we recorded a charge of $21.2 million in "Asset impairment" in the Consolidated Statement of Operations. We did not have any impairments of intangible assets related to continuing operations in 2016 or 2014.
5. Property, Plant and Equipment:
Components of Property, plant and equipment, net were as follows (in millions):
As of December 31,2016 2015
Land $ 33.9 $ 33.9Buildings and improvements 218.2 211.8Machinery and equipment 742.1 699.4Capital leases 27.3 27.1Construction in progress and equipment not yet in service 57.1 50.3
Total 1,078.6 1,022.5Less accumulated depreciation (717.2) (682.9)Property, plant and equipment, net $ 361.4 $ 339.6
During the fourth quarter of 2015, we completed a strategic review of our North American supermarket display cases and systems business. As a result, we performed an impairment analysis using a market approach and determined that property, plant and equipment relating to the North American supermarket display case business unit were impaired and we recorded a charge of $23.3 million in "Asset impairment" in the Consolidated Statement of Operations. No impairment charges were recorded in 2016 or 2014.
6. Joint Ventures and Other Equity Investments:
We participate in two joint ventures, the largest located in the U.S. and the other in Mexico, that are engaged in the manufacture and sale of compressors, unit coolers and condensing units. We exert significant influence over these affiliates based upon our respective 25% and 50% ownerships, but do not control them due to venture partner participation. Accordingly, these joint ventures have been accounted for under the equity method and their financial position and results of operations are not consolidated.
The combined balance of equity method investments included in Other assets, net totaled (in millions):
As of December 31,2016 2015
Equity method investments $ 30.7 $ 30.3
We purchase compressors from our U.S. joint venture for use in certain of our products. The amounts of purchases included in Cost of goods sold in the Consolidated Statements of Operations were as follows (in millions):
For the Years Ended December 31,2016 2015 2014
Purchases of compressors from joint venture $ 97.7 $ 103.5 $ 114.7
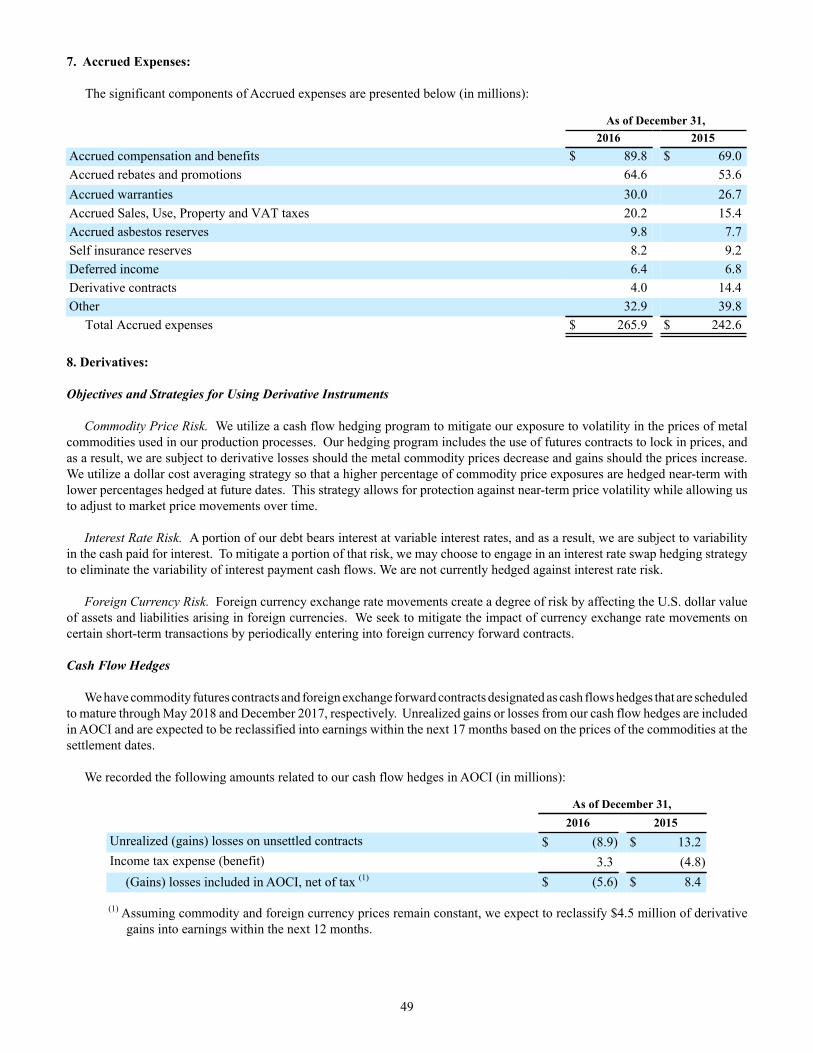
49
7. Accrued Expenses:
The significant components of Accrued expenses are presented below (in millions):
As of December 31,2016 2015
Accrued compensation and benefits $ 89.8 $ 69.0Accrued rebates and promotions 64.6 53.6Accrued warranties 30.0 26.7Accrued Sales, Use, Property and VAT taxes 20.2 15.4Accrued asbestos reserves 9.8 7.7Self insurance reserves 8.2 9.2Deferred income 6.4 6.8Derivative contracts 4.0 14.4Other 32.9 39.8
Total Accrued expenses $ 265.9 $ 242.6
8. Derivatives:
Objectives and Strategies for Using Derivative Instruments
Commodity Price Risk. We utilize a cash flow hedging program to mitigate our exposure to volatility in the prices of metal commodities used in our production processes. Our hedging program includes the use of futures contracts to lock in prices, and as a result, we are subject to derivative losses should the metal commodity prices decrease and gains should the prices increase. We utilize a dollar cost averaging strategy so that a higher percentage of commodity price exposures are hedged near-term with lower percentages hedged at future dates. This strategy allows for protection against near-term price volatility while allowing us to adjust to market price movements over time.
Interest Rate Risk. A portion of our debt bears interest at variable interest rates, and as a result, we are subject to variability in the cash paid for interest. To mitigate a portion of that risk, we may choose to engage in an interest rate swap hedging strategy to eliminate the variability of interest payment cash flows. We are not currently hedged against interest rate risk.
Foreign Currency Risk. Foreign currency exchange rate movements create a degree of risk by affecting the U.S. dollar value of assets and liabilities arising in foreign currencies. We seek to mitigate the impact of currency exchange rate movements on certain short-term transactions by periodically entering into foreign currency forward contracts.
Cash Flow Hedges
We have commodity futures contracts and foreign exchange forward contracts designated as cash flows hedges that are scheduled to mature through May 2018 and December 2017, respectively. Unrealized gains or losses from our cash flow hedges are included in AOCI and are expected to be reclassified into earnings within the next 17 months based on the prices of the commodities at the settlement dates.
We recorded the following amounts related to our cash flow hedges in AOCI (in millions):
As of December 31,2016 2015
Unrealized (gains) losses on unsettled contracts $ (8.9) $ 13.2Income tax expense (benefit) 3.3 (4.8)
(Gains) losses included in AOCI, net of tax (1) $ (5.6) $ 8.4
(1) Assuming commodity and foreign currency prices remain constant, we expect to reclassify $4.5 million of derivative gains into earnings within the next 12 months.
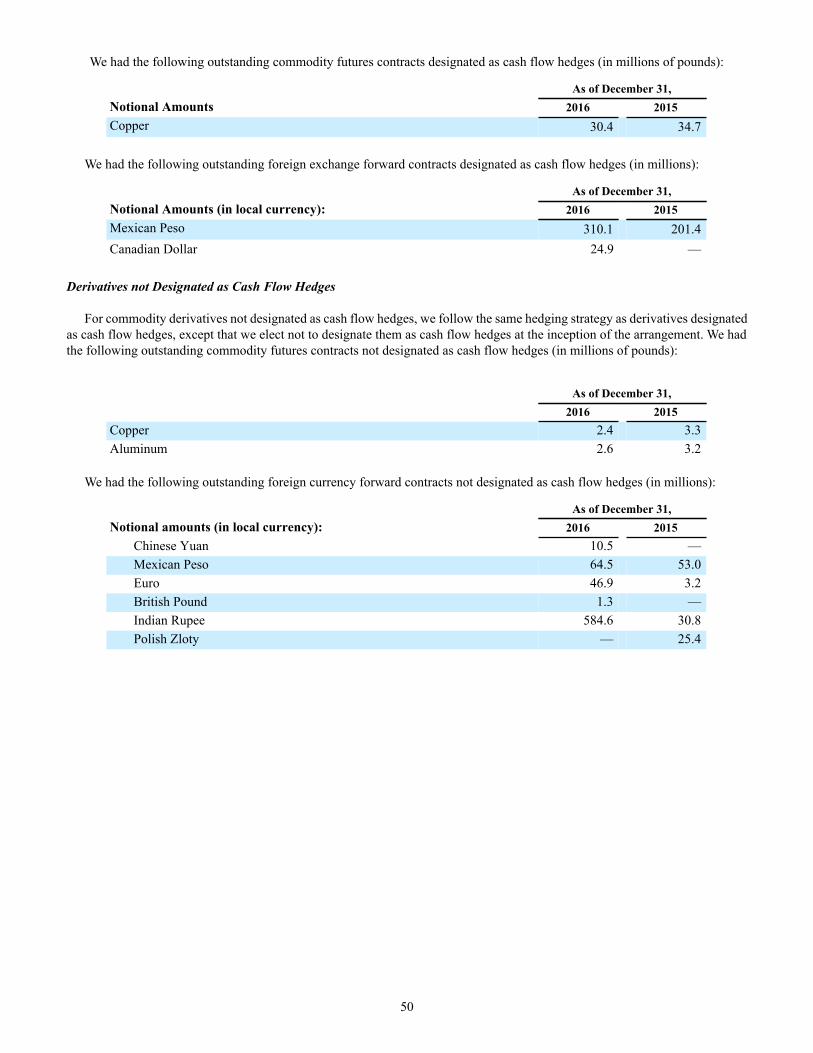
50
We had the following outstanding commodity futures contracts designated as cash flow hedges (in millions of pounds):
As of December 31,Notional Amounts 2016 2015Copper 30.4 34.7
We had the following outstanding foreign exchange forward contracts designated as cash flow hedges (in millions):
As of December 31,Notional Amounts (in local currency): 2016 2015Mexican Peso 310.1 201.4Canadian Dollar 24.9 —
Derivatives not Designated as Cash Flow Hedges
For commodity derivatives not designated as cash flow hedges, we follow the same hedging strategy as derivatives designated as cash flow hedges, except that we elect not to designate them as cash flow hedges at the inception of the arrangement. We had the following outstanding commodity futures contracts not designated as cash flow hedges (in millions of pounds):
As of December 31,2016 2015
Copper 2.4 3.3Aluminum 2.6 3.2
We had the following outstanding foreign currency forward contracts not designated as cash flow hedges (in millions):
As of December 31,Notional amounts (in local currency): 2016 2015
Chinese Yuan 10.5 —Mexican Peso 64.5 53.0Euro 46.9 3.2British Pound 1.3 —Indian Rupee 584.6 30.8Polish Zloty — 25.4
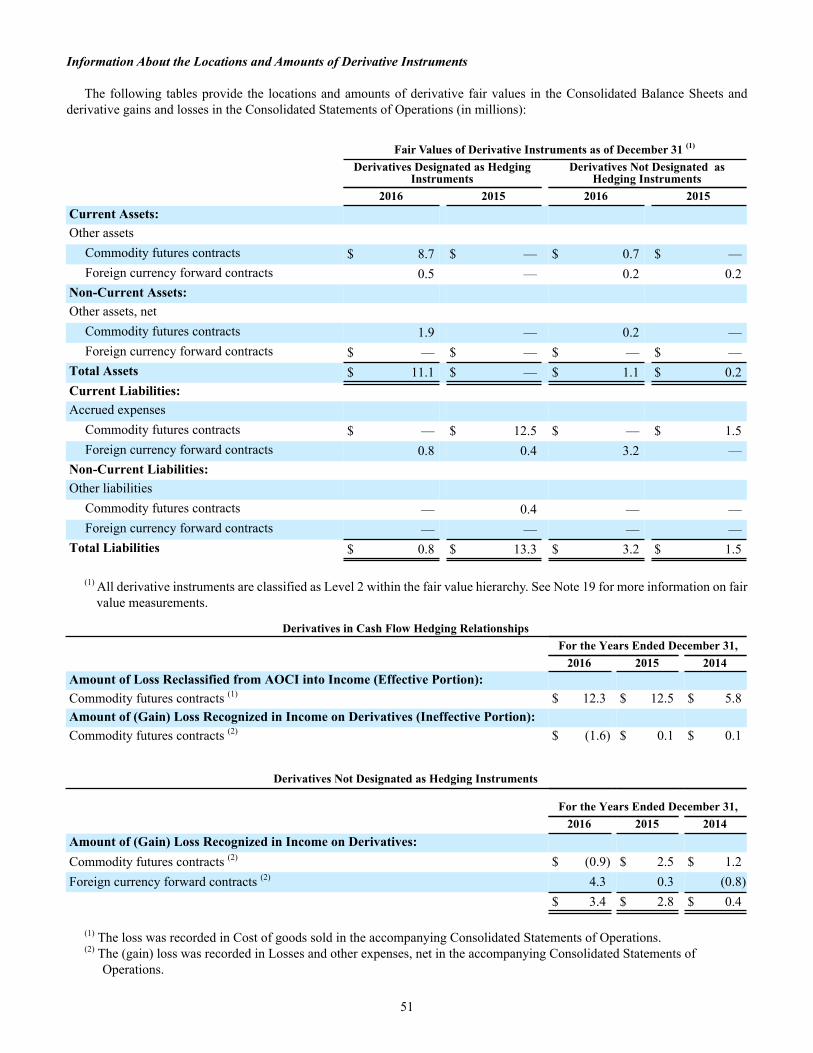
51
Information About the Locations and Amounts of Derivative Instruments
The following tables provide the locations and amounts of derivative fair values in the Consolidated Balance Sheets and derivative gains and losses in the Consolidated Statements of Operations (in millions):
Fair Values of Derivative Instruments as of December 31 (1)
Derivatives Designated as Hedging
InstrumentsDerivatives Not Designated as
Hedging Instruments 2016 2015 2016 2015Current Assets:Other assets
Commodity futures contracts $ 8.7 $ — $ 0.7 $ —Foreign currency forward contracts 0.5 — 0.2 0.2
Non-Current Assets:Other assets, net
Commodity futures contracts 1.9 — 0.2 —Foreign currency forward contracts $ — $ — $ — $ —
Total Assets $ 11.1 $ — $ 1.1 $ 0.2Current Liabilities:Accrued expenses
Commodity futures contracts $ — $ 12.5 $ — $ 1.5Foreign currency forward contracts 0.8 0.4 3.2 —
Non-Current Liabilities:Other liabilities
Commodity futures contracts — 0.4 — —Foreign currency forward contracts — — — —
Total Liabilities $ 0.8 $ 13.3 $ 3.2 $ 1.5
(1) All derivative instruments are classified as Level 2 within the fair value hierarchy. See Note 19 for more information on fair value measurements.
Derivatives in Cash Flow Hedging Relationships For the Years Ended December 31, 2016 2015 2014Amount of Loss Reclassified from AOCI into Income (Effective Portion):Commodity futures contracts (1) $ 12.3 $ 12.5 $ 5.8Amount of (Gain) Loss Recognized in Income on Derivatives (Ineffective Portion):Commodity futures contracts (2) $ (1.6) $ 0.1 $ 0.1
Derivatives Not Designated as Hedging Instruments
For the Years Ended December 31, 2016 2015 2014Amount of (Gain) Loss Recognized in Income on Derivatives:Commodity futures contracts (2) $ (0.9) $ 2.5 $ 1.2Foreign currency forward contracts (2) 4.3 0.3 (0.8)
$ 3.4 $ 2.8 $ 0.4
(1) The loss was recorded in Cost of goods sold in the accompanying Consolidated Statements of Operations.(2) The (gain) loss was recorded in Losses and other expenses, net in the accompanying Consolidated Statements of
Operations.
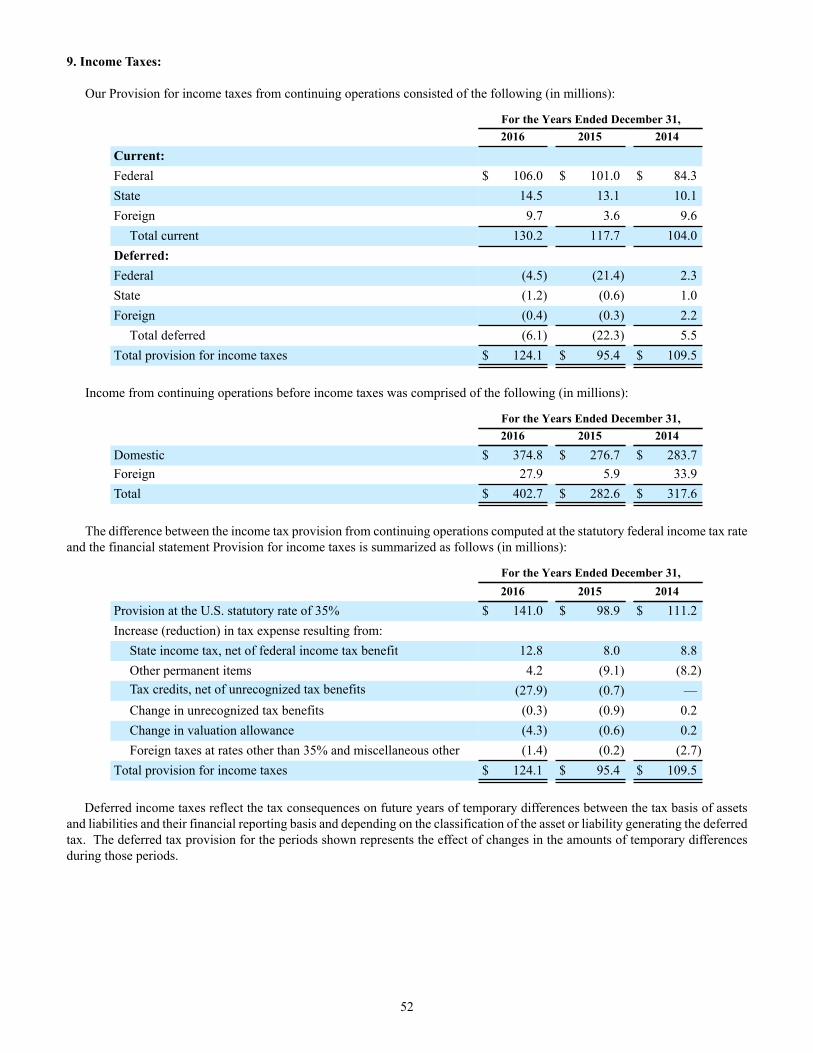
52
9. Income Taxes:
Our Provision for income taxes from continuing operations consisted of the following (in millions):
For the Years Ended December 31,2016 2015 2014
Current:Federal $ 106.0 $ 101.0 $ 84.3State 14.5 13.1 10.1Foreign 9.7 3.6 9.6
Total current 130.2 117.7 104.0Deferred:Federal (4.5) (21.4) 2.3State (1.2) (0.6) 1.0Foreign (0.4) (0.3) 2.2
Total deferred (6.1) (22.3) 5.5Total provision for income taxes $ 124.1 $ 95.4 $ 109.5
Income from continuing operations before income taxes was comprised of the following (in millions):
For the Years Ended December 31,2016 2015 2014
Domestic $ 374.8 $ 276.7 $ 283.7Foreign 27.9 5.9 33.9Total $ 402.7 $ 282.6 $ 317.6
The difference between the income tax provision from continuing operations computed at the statutory federal income tax rate and the financial statement Provision for income taxes is summarized as follows (in millions):
For the Years Ended December 31,2016 2015 2014
Provision at the U.S. statutory rate of 35% $ 141.0 $ 98.9 $ 111.2Increase (reduction) in tax expense resulting from:
State income tax, net of federal income tax benefit 12.8 8.0 8.8Other permanent items 4.2 (9.1) (8.2)Tax credits, net of unrecognized tax benefits (27.9) (0.7) —Change in unrecognized tax benefits (0.3) (0.9) 0.2Change in valuation allowance (4.3) (0.6) 0.2Foreign taxes at rates other than 35% and miscellaneous other (1.4) (0.2) (2.7)
Total provision for income taxes $ 124.1 $ 95.4 $ 109.5
Deferred income taxes reflect the tax consequences on future years of temporary differences between the tax basis of assets and liabilities and their financial reporting basis and depending on the classification of the asset or liability generating the deferred tax. The deferred tax provision for the periods shown represents the effect of changes in the amounts of temporary differences during those periods.
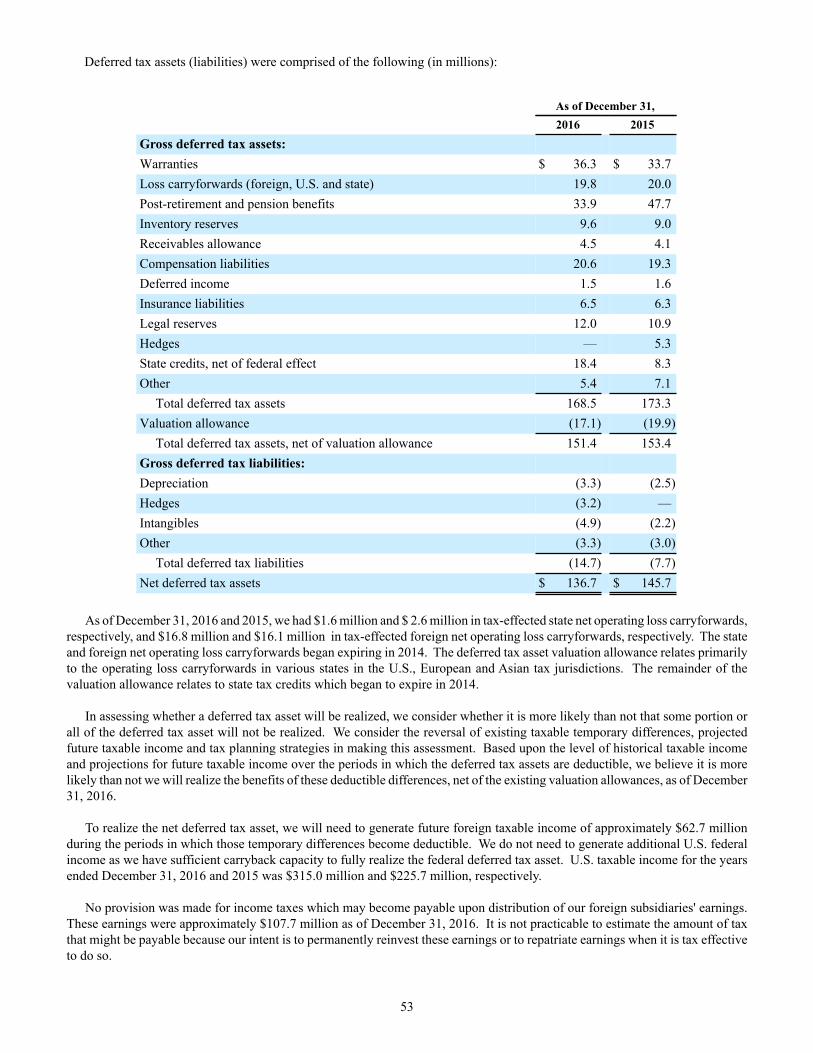
53
Deferred tax assets (liabilities) were comprised of the following (in millions):
As of December 31,2016 2015
Gross deferred tax assets:Warranties $ 36.3 $ 33.7Loss carryforwards (foreign, U.S. and state) 19.8 20.0Post-retirement and pension benefits 33.9 47.7Inventory reserves 9.6 9.0Receivables allowance 4.5 4.1Compensation liabilities 20.6 19.3Deferred income 1.5 1.6Insurance liabilities 6.5 6.3Legal reserves 12.0 10.9Hedges — 5.3State credits, net of federal effect 18.4 8.3Other 5.4 7.1
Total deferred tax assets 168.5 173.3Valuation allowance (17.1) (19.9)
Total deferred tax assets, net of valuation allowance 151.4 153.4Gross deferred tax liabilities:Depreciation (3.3) (2.5)Hedges (3.2) —Intangibles (4.9) (2.2)Other (3.3) (3.0)
Total deferred tax liabilities (14.7) (7.7)Net deferred tax assets $ 136.7 $ 145.7
As of December 31, 2016 and 2015, we had $1.6 million and $ 2.6 million in tax-effected state net operating loss carryforwards, respectively, and $16.8 million and $16.1 million in tax-effected foreign net operating loss carryforwards, respectively. The state and foreign net operating loss carryforwards began expiring in 2014. The deferred tax asset valuation allowance relates primarily to the operating loss carryforwards in various states in the U.S., European and Asian tax jurisdictions. The remainder of the valuation allowance relates to state tax credits which began to expire in 2014.
In assessing whether a deferred tax asset will be realized, we consider whether it is more likely than not that some portion or all of the deferred tax asset will not be realized. We consider the reversal of existing taxable temporary differences, projected future taxable income and tax planning strategies in making this assessment. Based upon the level of historical taxable income and projections for future taxable income over the periods in which the deferred tax assets are deductible, we believe it is more likely than not we will realize the benefits of these deductible differences, net of the existing valuation allowances, as of December 31, 2016.
To realize the net deferred tax asset, we will need to generate future foreign taxable income of approximately $62.7 millionduring the periods in which those temporary differences become deductible. We do not need to generate additional U.S. federal income as we have sufficient carryback capacity to fully realize the federal deferred tax asset. U.S. taxable income for the years ended December 31, 2016 and 2015 was $315.0 million and $225.7 million, respectively.
No provision was made for income taxes which may become payable upon distribution of our foreign subsidiaries' earnings. These earnings were approximately $107.7 million as of December 31, 2016. It is not practicable to estimate the amount of tax that might be payable because our intent is to permanently reinvest these earnings or to repatriate earnings when it is tax effective to do so.
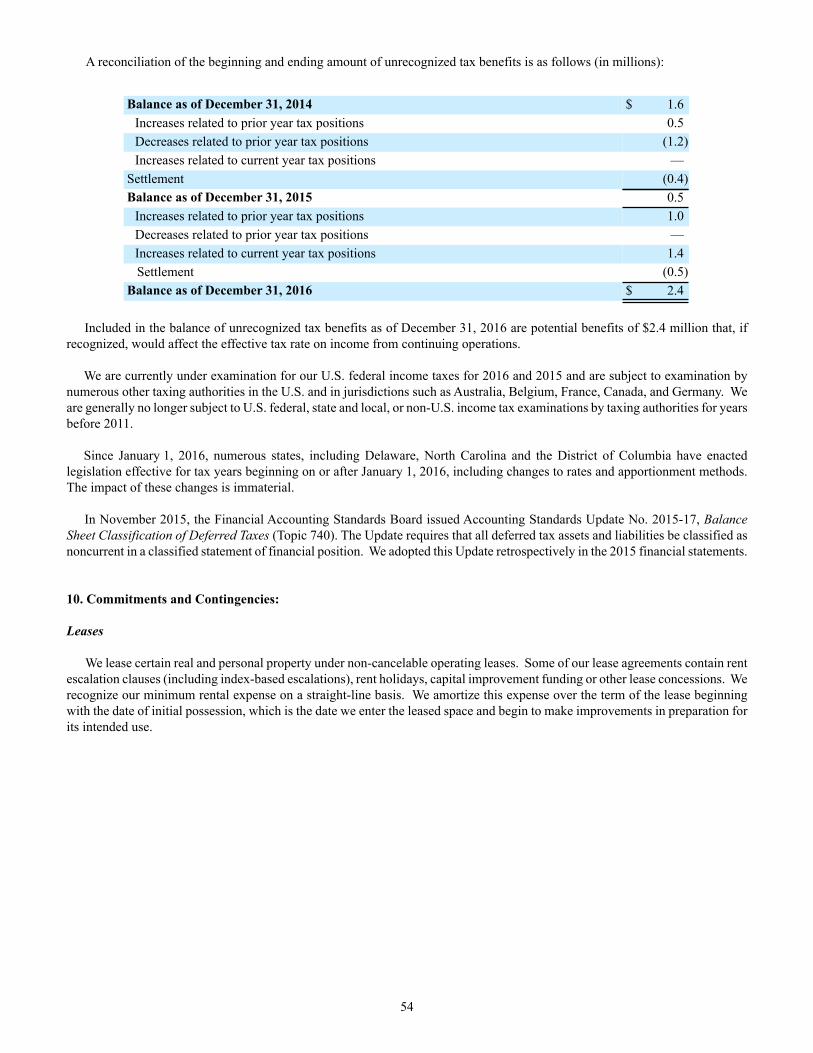
54
A reconciliation of the beginning and ending amount of unrecognized tax benefits is as follows (in millions):
Balance as of December 31, 2014 $ 1.6Increases related to prior year tax positions 0.5Decreases related to prior year tax positions (1.2)Increases related to current year tax positions —
Settlement (0.4)Balance as of December 31, 2015 0.5
Increases related to prior year tax positions 1.0Decreases related to prior year tax positions —Increases related to current year tax positions 1.4
Settlement (0.5)Balance as of December 31, 2016 $ 2.4
Included in the balance of unrecognized tax benefits as of December 31, 2016 are potential benefits of $2.4 million that, if recognized, would affect the effective tax rate on income from continuing operations.
We are currently under examination for our U.S. federal income taxes for 2016 and 2015 and are subject to examination by numerous other taxing authorities in the U.S. and in jurisdictions such as Australia, Belgium, France, Canada, and Germany. We are generally no longer subject to U.S. federal, state and local, or non-U.S. income tax examinations by taxing authorities for years before 2011.
Since January 1, 2016, numerous states, including Delaware, North Carolina and the District of Columbia have enacted legislation effective for tax years beginning on or after January 1, 2016, including changes to rates and apportionment methods. The impact of these changes is immaterial.
In November 2015, the Financial Accounting Standards Board issued Accounting Standards Update No. 2015-17, Balance Sheet Classification of Deferred Taxes (Topic 740). The Update requires that all deferred tax assets and liabilities be classified as noncurrent in a classified statement of financial position. We adopted this Update retrospectively in the 2015 financial statements.
10. Commitments and Contingencies:
Leases
We lease certain real and personal property under non-cancelable operating leases. Some of our lease agreements contain rent escalation clauses (including index-based escalations), rent holidays, capital improvement funding or other lease concessions. We recognize our minimum rental expense on a straight-line basis. We amortize this expense over the term of the lease beginning with the date of initial possession, which is the date we enter the leased space and begin to make improvements in preparation for its intended use.
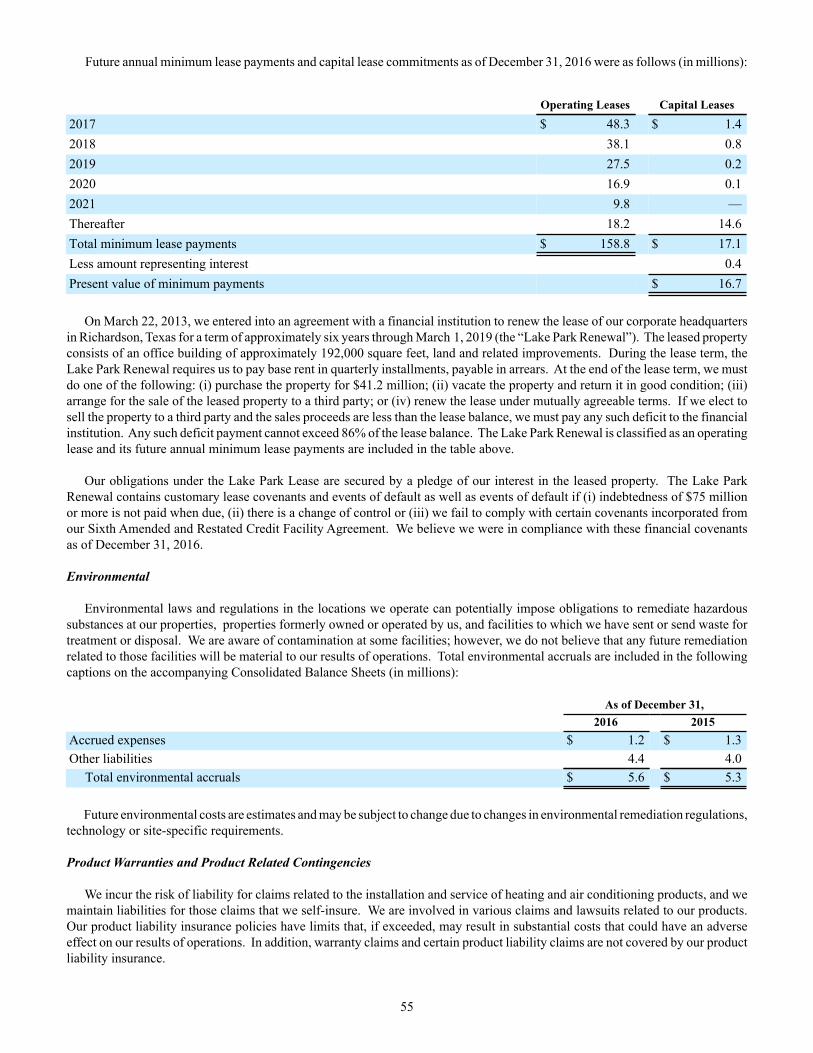
55
Future annual minimum lease payments and capital lease commitments as of December 31, 2016 were as follows (in millions):
Operating Leases Capital Leases2017 $ 48.3 $ 1.42018 38.1 0.82019 27.5 0.22020 16.9 0.12021 9.8 —Thereafter 18.2 14.6Total minimum lease payments $ 158.8 $ 17.1Less amount representing interest 0.4Present value of minimum payments $ 16.7
On March 22, 2013, we entered into an agreement with a financial institution to renew the lease of our corporate headquarters in Richardson, Texas for a term of approximately six years through March 1, 2019 (the “Lake Park Renewal”). The leased property consists of an office building of approximately 192,000 square feet, land and related improvements. During the lease term, the Lake Park Renewal requires us to pay base rent in quarterly installments, payable in arrears. At the end of the lease term, we must do one of the following: (i) purchase the property for $41.2 million; (ii) vacate the property and return it in good condition; (iii) arrange for the sale of the leased property to a third party; or (iv) renew the lease under mutually agreeable terms. If we elect to sell the property to a third party and the sales proceeds are less than the lease balance, we must pay any such deficit to the financial institution. Any such deficit payment cannot exceed 86% of the lease balance. The Lake Park Renewal is classified as an operating lease and its future annual minimum lease payments are included in the table above.
Our obligations under the Lake Park Lease are secured by a pledge of our interest in the leased property. The Lake Park Renewal contains customary lease covenants and events of default as well as events of default if (i) indebtedness of $75 millionor more is not paid when due, (ii) there is a change of control or (iii) we fail to comply with certain covenants incorporated from our Sixth Amended and Restated Credit Facility Agreement. We believe we were in compliance with these financial covenants as of December 31, 2016.
Environmental
Environmental laws and regulations in the locations we operate can potentially impose obligations to remediate hazardous substances at our properties, properties formerly owned or operated by us, and facilities to which we have sent or send waste for treatment or disposal. We are aware of contamination at some facilities; however, we do not believe that any future remediation related to those facilities will be material to our results of operations. Total environmental accruals are included in the following captions on the accompanying Consolidated Balance Sheets (in millions):
As of December 31,2016 2015
Accrued expenses $ 1.2 $ 1.3Other liabilities 4.4 4.0
Total environmental accruals $ 5.6 $ 5.3
Future environmental costs are estimates and may be subject to change due to changes in environmental remediation regulations, technology or site-specific requirements.
Product Warranties and Product Related Contingencies
We incur the risk of liability for claims related to the installation and service of heating and air conditioning products, and we maintain liabilities for those claims that we self-insure. We are involved in various claims and lawsuits related to our products. Our product liability insurance policies have limits that, if exceeded, may result in substantial costs that could have an adverse effect on our results of operations. In addition, warranty claims and certain product liability claims are not covered by our product liability insurance.
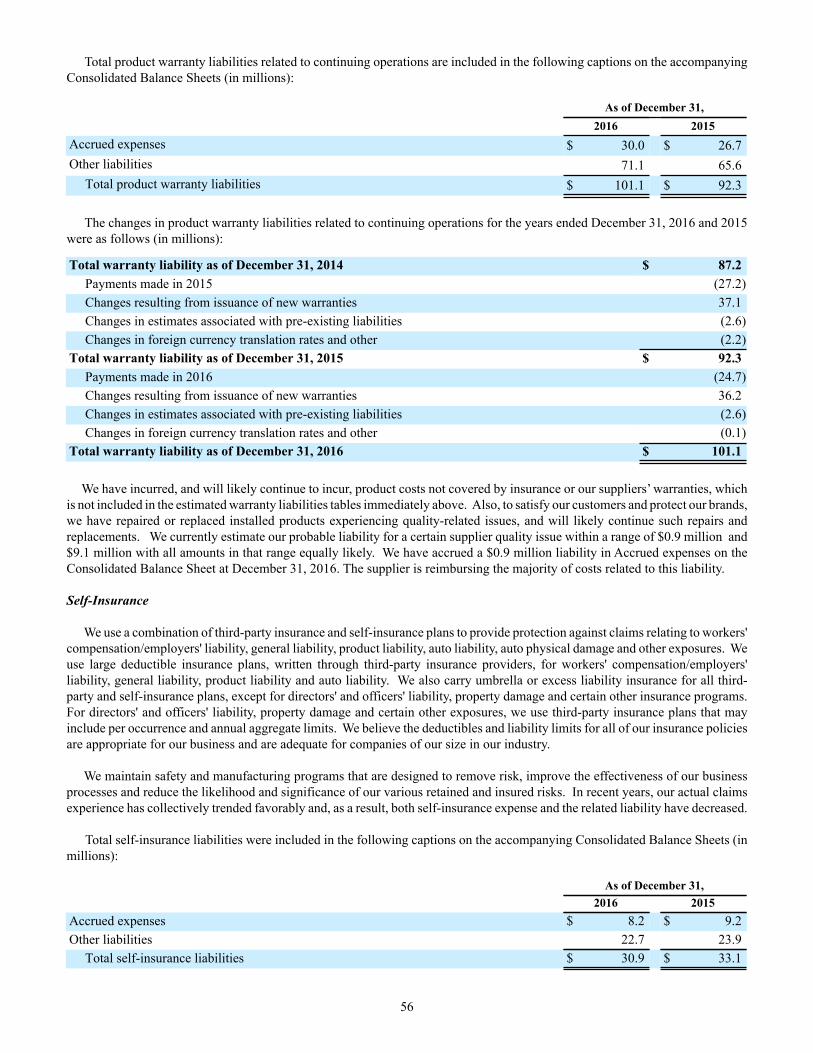
56
Total product warranty liabilities related to continuing operations are included in the following captions on the accompanying Consolidated Balance Sheets (in millions):
As of December 31,2016 2015
Accrued expenses $ 30.0 $ 26.7Other liabilities 71.1 65.6
Total product warranty liabilities $ 101.1 $ 92.3
The changes in product warranty liabilities related to continuing operations for the years ended December 31, 2016 and 2015were as follows (in millions):
Total warranty liability as of December 31, 2014 $ 87.2Payments made in 2015 (27.2)Changes resulting from issuance of new warranties 37.1Changes in estimates associated with pre-existing liabilities (2.6)Changes in foreign currency translation rates and other (2.2)
Total warranty liability as of December 31, 2015 $ 92.3Payments made in 2016 (24.7)Changes resulting from issuance of new warranties 36.2Changes in estimates associated with pre-existing liabilities (2.6)Changes in foreign currency translation rates and other (0.1)
Total warranty liability as of December 31, 2016 $ 101.1
We have incurred, and will likely continue to incur, product costs not covered by insurance or our suppliers’ warranties, which is not included in the estimated warranty liabilities tables immediately above. Also, to satisfy our customers and protect our brands, we have repaired or replaced installed products experiencing quality-related issues, and will likely continue such repairs and replacements. We currently estimate our probable liability for a certain supplier quality issue within a range of $0.9 million and $9.1 million with all amounts in that range equally likely. We have accrued a $0.9 million liability in Accrued expenses on the Consolidated Balance Sheet at December 31, 2016. The supplier is reimbursing the majority of costs related to this liability.
Self-Insurance
We use a combination of third-party insurance and self-insurance plans to provide protection against claims relating to workers' compensation/employers' liability, general liability, product liability, auto liability, auto physical damage and other exposures. We use large deductible insurance plans, written through third-party insurance providers, for workers' compensation/employers' liability, general liability, product liability and auto liability. We also carry umbrella or excess liability insurance for all third-party and self-insurance plans, except for directors' and officers' liability, property damage and certain other insurance programs. For directors' and officers' liability, property damage and certain other exposures, we use third-party insurance plans that may include per occurrence and annual aggregate limits. We believe the deductibles and liability limits for all of our insurance policies are appropriate for our business and are adequate for companies of our size in our industry.
We maintain safety and manufacturing programs that are designed to remove risk, improve the effectiveness of our business processes and reduce the likelihood and significance of our various retained and insured risks. In recent years, our actual claims experience has collectively trended favorably and, as a result, both self-insurance expense and the related liability have decreased.
Total self-insurance liabilities were included in the following captions on the accompanying Consolidated Balance Sheets (in millions):
As of December 31,2016 2015
Accrued expenses $ 8.2 $ 9.2Other liabilities 22.7 23.9
Total self-insurance liabilities $ 30.9 $ 33.1
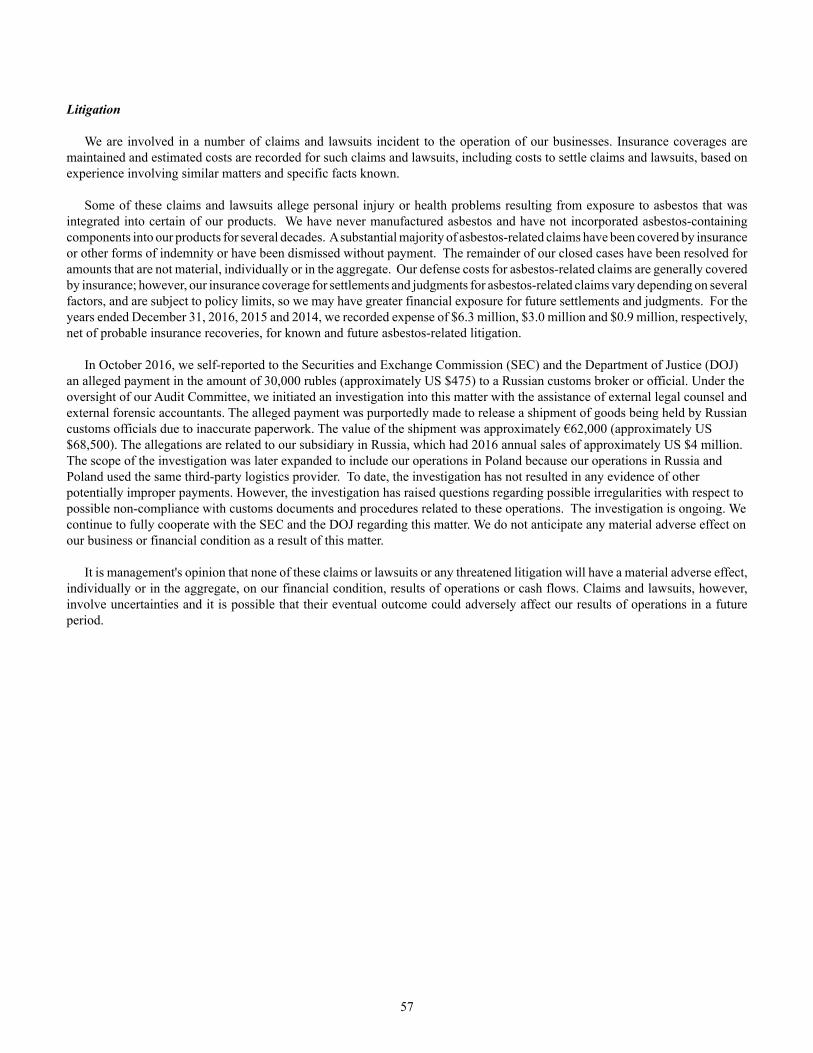
57
Litigation
We are involved in a number of claims and lawsuits incident to the operation of our businesses. Insurance coverages are maintained and estimated costs are recorded for such claims and lawsuits, including costs to settle claims and lawsuits, based on experience involving similar matters and specific facts known.
Some of these claims and lawsuits allege personal injury or health problems resulting from exposure to asbestos that was integrated into certain of our products. We have never manufactured asbestos and have not incorporated asbestos-containing components into our products for several decades. A substantial majority of asbestos-related claims have been covered by insurance or other forms of indemnity or have been dismissed without payment. The remainder of our closed cases have been resolved for amounts that are not material, individually or in the aggregate. Our defense costs for asbestos-related claims are generally covered by insurance; however, our insurance coverage for settlements and judgments for asbestos-related claims vary depending on several factors, and are subject to policy limits, so we may have greater financial exposure for future settlements and judgments. For the years ended December 31, 2016, 2015 and 2014, we recorded expense of $6.3 million, $3.0 million and $0.9 million, respectively, net of probable insurance recoveries, for known and future asbestos-related litigation.
In October 2016, we self-reported to the Securities and Exchange Commission (SEC) and the Department of Justice (DOJ) an alleged payment in the amount of 30,000 rubles (approximately US $475) to a Russian customs broker or official. Under the oversight of our Audit Committee, we initiated an investigation into this matter with the assistance of external legal counsel and external forensic accountants. The alleged payment was purportedly made to release a shipment of goods being held by Russian customs officials due to inaccurate paperwork. The value of the shipment was approximately €62,000 (approximately US $68,500). The allegations are related to our subsidiary in Russia, which had 2016 annual sales of approximately US $4 million. The scope of the investigation was later expanded to include our operations in Poland because our operations in Russia and Poland used the same third-party logistics provider. To date, the investigation has not resulted in any evidence of other potentially improper payments. However, the investigation has raised questions regarding possible irregularities with respect to possible non-compliance with customs documents and procedures related to these operations. The investigation is ongoing. We continue to fully cooperate with the SEC and the DOJ regarding this matter. We do not anticipate any material adverse effect on our business or financial condition as a result of this matter.
It is management's opinion that none of these claims or lawsuits or any threatened litigation will have a material adverse effect, individually or in the aggregate, on our financial condition, results of operations or cash flows. Claims and lawsuits, however, involve uncertainties and it is possible that their eventual outcome could adversely affect our results of operations in a future period.
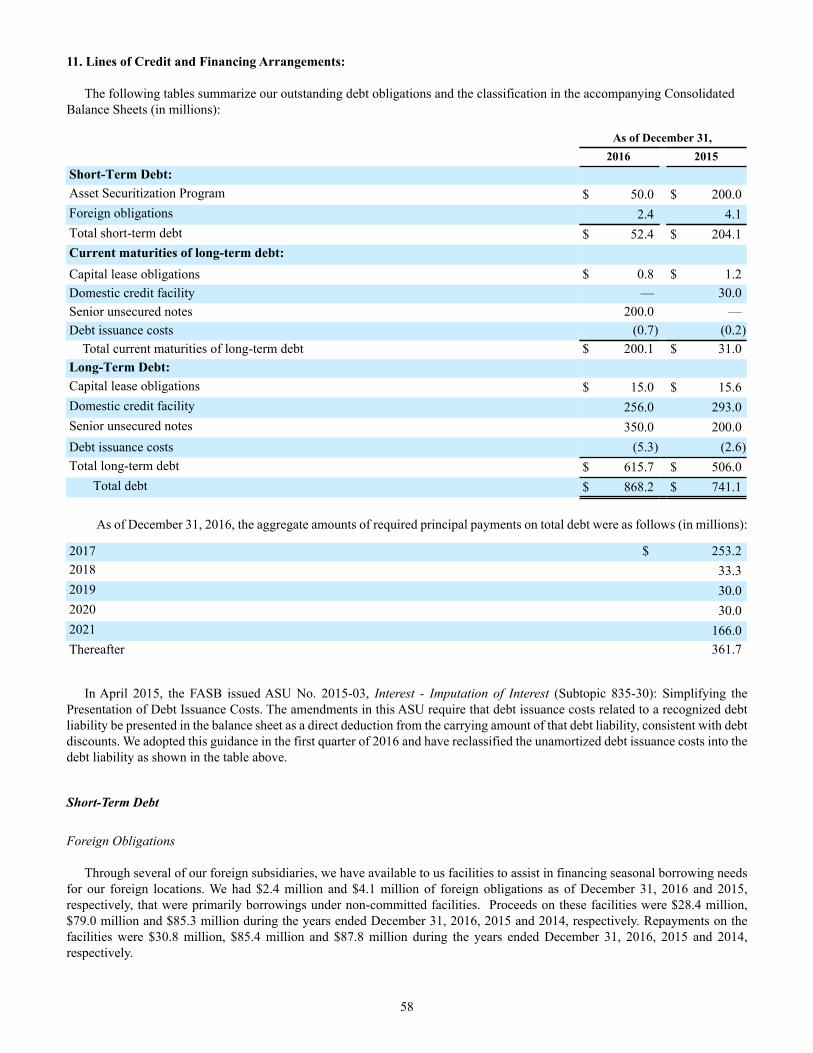
58
11. Lines of Credit and Financing Arrangements:
The following tables summarize our outstanding debt obligations and the classification in the accompanying Consolidated Balance Sheets (in millions):
As of December 31,2016 2015
Short-Term Debt:Asset Securitization Program $ 50.0 $ 200.0Foreign obligations 2.4 4.1Total short-term debt $ 52.4 $ 204.1Current maturities of long-term debt:Capital lease obligations $ 0.8 $ 1.2Domestic credit facility — 30.0Senior unsecured notes 200.0 —Debt issuance costs (0.7) (0.2) Total current maturities of long-term debt $ 200.1 $ 31.0Long-Term Debt:Capital lease obligations $ 15.0 $ 15.6Domestic credit facility 256.0 293.0Senior unsecured notes 350.0 200.0Debt issuance costs (5.3) (2.6)Total long-term debt $ 615.7 $ 506.0
Total debt $ 868.2 $ 741.1
As of December 31, 2016, the aggregate amounts of required principal payments on total debt were as follows (in millions):
2017 $ 253.22018 33.32019 30.02020 30.02021 166.0Thereafter 361.7
In April 2015, the FASB issued ASU No. 2015-03, Interest - Imputation of Interest (Subtopic 835-30): Simplifying the Presentation of Debt Issuance Costs. The amendments in this ASU require that debt issuance costs related to a recognized debt liability be presented in the balance sheet as a direct deduction from the carrying amount of that debt liability, consistent with debt discounts. We adopted this guidance in the first quarter of 2016 and have reclassified the unamortized debt issuance costs into the debt liability as shown in the table above.
Short-Term Debt
Foreign Obligations
Through several of our foreign subsidiaries, we have available to us facilities to assist in financing seasonal borrowing needs for our foreign locations. We had $2.4 million and $4.1 million of foreign obligations as of December 31, 2016 and 2015, respectively, that were primarily borrowings under non-committed facilities. Proceeds on these facilities were $28.4 million, $79.0 million and $85.3 million during the years ended December 31, 2016, 2015 and 2014, respectively. Repayments on the facilities were $30.8 million, $85.4 million and $87.8 million during the years ended December 31, 2016, 2015 and 2014, respectively.
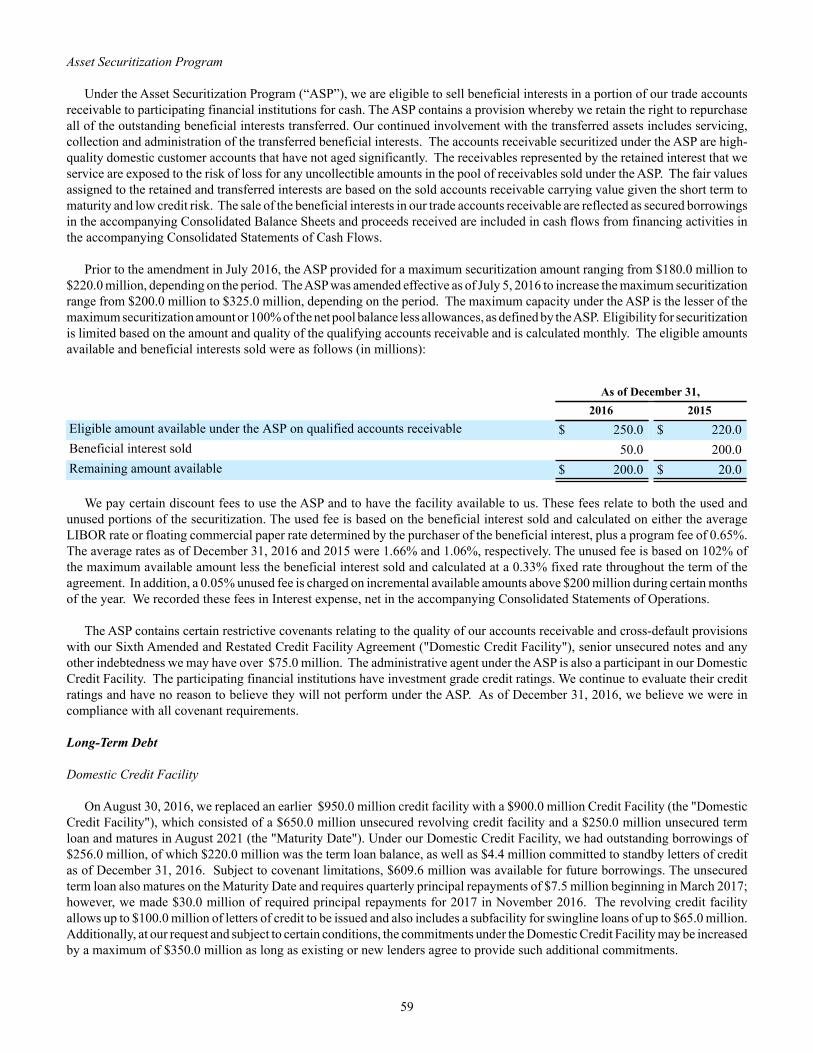
59
Asset Securitization Program
Under the Asset Securitization Program (“ASP”), we are eligible to sell beneficial interests in a portion of our trade accounts receivable to participating financial institutions for cash. The ASP contains a provision whereby we retain the right to repurchase all of the outstanding beneficial interests transferred. Our continued involvement with the transferred assets includes servicing, collection and administration of the transferred beneficial interests. The accounts receivable securitized under the ASP are high-quality domestic customer accounts that have not aged significantly. The receivables represented by the retained interest that we service are exposed to the risk of loss for any uncollectible amounts in the pool of receivables sold under the ASP. The fair values assigned to the retained and transferred interests are based on the sold accounts receivable carrying value given the short term to maturity and low credit risk. The sale of the beneficial interests in our trade accounts receivable are reflected as secured borrowings in the accompanying Consolidated Balance Sheets and proceeds received are included in cash flows from financing activities in the accompanying Consolidated Statements of Cash Flows.
Prior to the amendment in July 2016, the ASP provided for a maximum securitization amount ranging from $180.0 million to $220.0 million, depending on the period. The ASP was amended effective as of July 5, 2016 to increase the maximum securitization range from $200.0 million to $325.0 million, depending on the period. The maximum capacity under the ASP is the lesser of the maximum securitization amount or 100% of the net pool balance less allowances, as defined by the ASP. Eligibility for securitization is limited based on the amount and quality of the qualifying accounts receivable and is calculated monthly. The eligible amounts available and beneficial interests sold were as follows (in millions):
As of December 31,2016 2015
Eligible amount available under the ASP on qualified accounts receivable $ 250.0 $ 220.0Beneficial interest sold 50.0 200.0Remaining amount available $ 200.0 $ 20.0
We pay certain discount fees to use the ASP and to have the facility available to us. These fees relate to both the used and unused portions of the securitization. The used fee is based on the beneficial interest sold and calculated on either the average LIBOR rate or floating commercial paper rate determined by the purchaser of the beneficial interest, plus a program fee of 0.65%. The average rates as of December 31, 2016 and 2015 were 1.66% and 1.06%, respectively. The unused fee is based on 102% of the maximum available amount less the beneficial interest sold and calculated at a 0.33% fixed rate throughout the term of the agreement. In addition, a 0.05% unused fee is charged on incremental available amounts above $200 million during certain months of the year. We recorded these fees in Interest expense, net in the accompanying Consolidated Statements of Operations.
The ASP contains certain restrictive covenants relating to the quality of our accounts receivable and cross-default provisions with our Sixth Amended and Restated Credit Facility Agreement ("Domestic Credit Facility"), senior unsecured notes and any other indebtedness we may have over $75.0 million. The administrative agent under the ASP is also a participant in our Domestic Credit Facility. The participating financial institutions have investment grade credit ratings. We continue to evaluate their credit ratings and have no reason to believe they will not perform under the ASP. As of December 31, 2016, we believe we were in compliance with all covenant requirements.
Long-Term Debt
Domestic Credit Facility
On August 30, 2016, we replaced an earlier $950.0 million credit facility with a $900.0 million Credit Facility (the "Domestic Credit Facility"), which consisted of a $650.0 million unsecured revolving credit facility and a $250.0 million unsecured term loan and matures in August 2021 (the "Maturity Date"). Under our Domestic Credit Facility, we had outstanding borrowings of $256.0 million, of which $220.0 million was the term loan balance, as well as $4.4 million committed to standby letters of credit as of December 31, 2016. Subject to covenant limitations, $609.6 million was available for future borrowings. The unsecured term loan also matures on the Maturity Date and requires quarterly principal repayments of $7.5 million beginning in March 2017; however, we made $30.0 million of required principal repayments for 2017 in November 2016. The revolving credit facility allows up to $100.0 million of letters of credit to be issued and also includes a subfacility for swingline loans of up to $65.0 million. Additionally, at our request and subject to certain conditions, the commitments under the Domestic Credit Facility may be increased by a maximum of $350.0 million as long as existing or new lenders agree to provide such additional commitments.
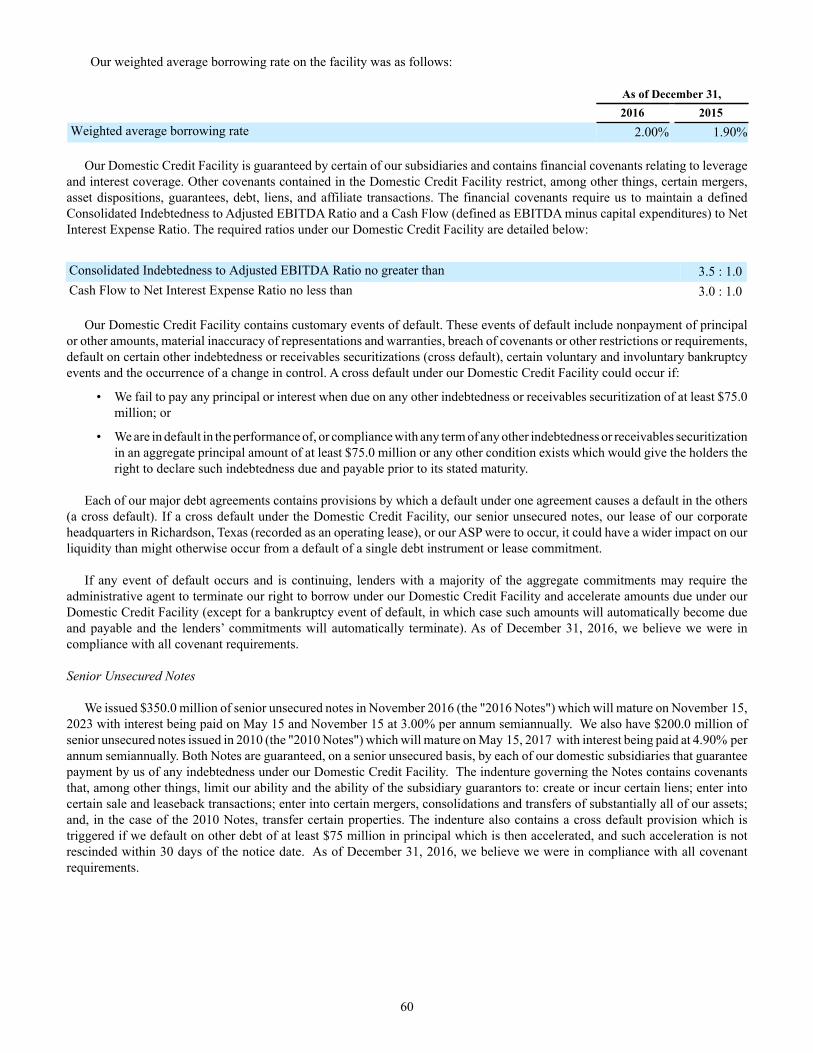
60
Our weighted average borrowing rate on the facility was as follows:
As of December 31,2016 2015
Weighted average borrowing rate 2.00% 1.90%
Our Domestic Credit Facility is guaranteed by certain of our subsidiaries and contains financial covenants relating to leverage and interest coverage. Other covenants contained in the Domestic Credit Facility restrict, among other things, certain mergers, asset dispositions, guarantees, debt, liens, and affiliate transactions. The financial covenants require us to maintain a defined Consolidated Indebtedness to Adjusted EBITDA Ratio and a Cash Flow (defined as EBITDA minus capital expenditures) to Net Interest Expense Ratio. The required ratios under our Domestic Credit Facility are detailed below:
Consolidated Indebtedness to Adjusted EBITDA Ratio no greater than 3.5 : 1.0Cash Flow to Net Interest Expense Ratio no less than 3.0 : 1.0
Our Domestic Credit Facility contains customary events of default. These events of default include nonpayment of principal or other amounts, material inaccuracy of representations and warranties, breach of covenants or other restrictions or requirements, default on certain other indebtedness or receivables securitizations (cross default), certain voluntary and involuntary bankruptcy events and the occurrence of a change in control. A cross default under our Domestic Credit Facility could occur if:
• We fail to pay any principal or interest when due on any other indebtedness or receivables securitization of at least $75.0 million; or
• We are in default in the performance of, or compliance with any term of any other indebtedness or receivables securitization in an aggregate principal amount of at least $75.0 million or any other condition exists which would give the holders the right to declare such indebtedness due and payable prior to its stated maturity.
Each of our major debt agreements contains provisions by which a default under one agreement causes a default in the others (a cross default). If a cross default under the Domestic Credit Facility, our senior unsecured notes, our lease of our corporate headquarters in Richardson, Texas (recorded as an operating lease), or our ASP were to occur, it could have a wider impact on our liquidity than might otherwise occur from a default of a single debt instrument or lease commitment.
If any event of default occurs and is continuing, lenders with a majority of the aggregate commitments may require the administrative agent to terminate our right to borrow under our Domestic Credit Facility and accelerate amounts due under our Domestic Credit Facility (except for a bankruptcy event of default, in which case such amounts will automatically become due and payable and the lenders’ commitments will automatically terminate). As of December 31, 2016, we believe we were in compliance with all covenant requirements.
Senior Unsecured Notes
We issued $350.0 million of senior unsecured notes in November 2016 (the "2016 Notes") which will mature on November 15, 2023 with interest being paid on May 15 and November 15 at 3.00% per annum semiannually. We also have $200.0 million of senior unsecured notes issued in 2010 (the "2010 Notes") which will mature on May 15, 2017 with interest being paid at 4.90% per annum semiannually. Both Notes are guaranteed, on a senior unsecured basis, by each of our domestic subsidiaries that guarantee payment by us of any indebtedness under our Domestic Credit Facility. The indenture governing the Notes contains covenants that, among other things, limit our ability and the ability of the subsidiary guarantors to: create or incur certain liens; enter into certain sale and leaseback transactions; enter into certain mergers, consolidations and transfers of substantially all of our assets; and, in the case of the 2010 Notes, transfer certain properties. The indenture also contains a cross default provision which is triggered if we default on other debt of at least $75 million in principal which is then accelerated, and such acceleration is not rescinded within 30 days of the notice date. As of December 31, 2016, we believe we were in compliance with all covenant requirements.
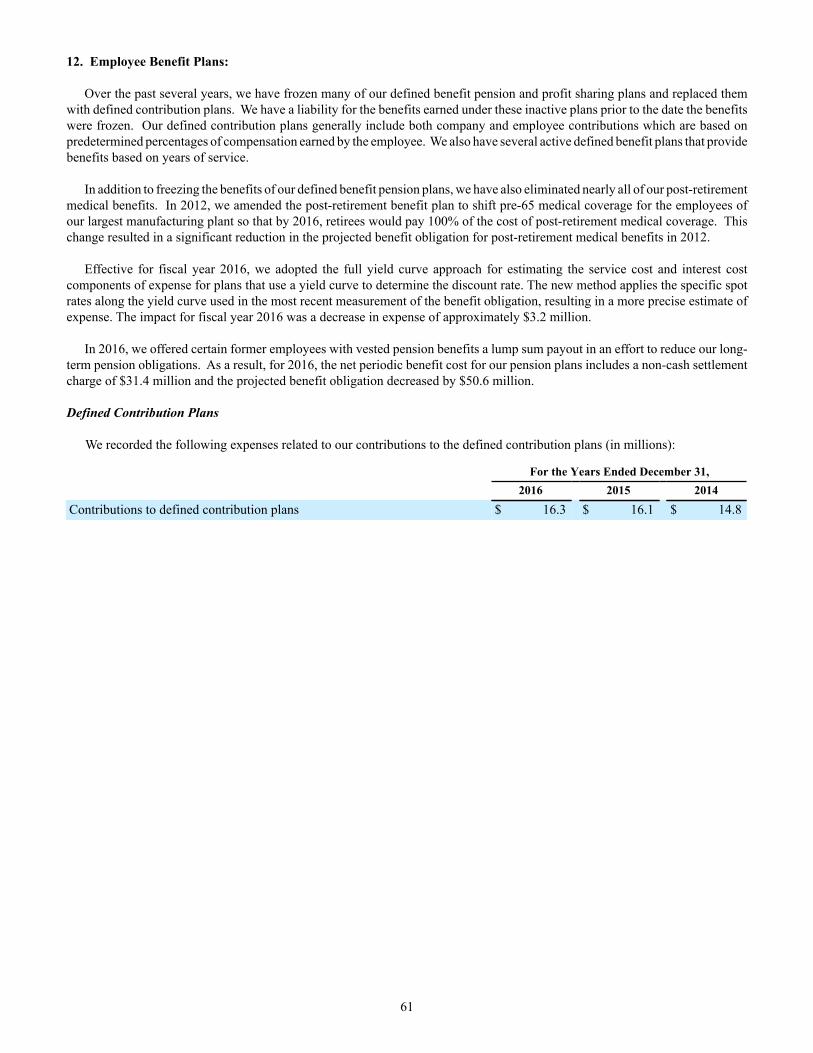
61
12. Employee Benefit Plans:
Over the past several years, we have frozen many of our defined benefit pension and profit sharing plans and replaced them with defined contribution plans. We have a liability for the benefits earned under these inactive plans prior to the date the benefits were frozen. Our defined contribution plans generally include both company and employee contributions which are based on predetermined percentages of compensation earned by the employee. We also have several active defined benefit plans that provide benefits based on years of service.
In addition to freezing the benefits of our defined benefit pension plans, we have also eliminated nearly all of our post-retirement medical benefits. In 2012, we amended the post-retirement benefit plan to shift pre-65 medical coverage for the employees of our largest manufacturing plant so that by 2016, retirees would pay 100% of the cost of post-retirement medical coverage. This change resulted in a significant reduction in the projected benefit obligation for post-retirement medical benefits in 2012.
Effective for fiscal year 2016, we adopted the full yield curve approach for estimating the service cost and interest cost components of expense for plans that use a yield curve to determine the discount rate. The new method applies the specific spot rates along the yield curve used in the most recent measurement of the benefit obligation, resulting in a more precise estimate of expense. The impact for fiscal year 2016 was a decrease in expense of approximately $3.2 million.
In 2016, we offered certain former employees with vested pension benefits a lump sum payout in an effort to reduce our long-term pension obligations. As a result, for 2016, the net periodic benefit cost for our pension plans includes a non-cash settlement charge of $31.4 million and the projected benefit obligation decreased by $50.6 million.
Defined Contribution Plans
We recorded the following expenses related to our contributions to the defined contribution plans (in millions):
For the Years Ended December 31,2016 2015 2014
Contributions to defined contribution plans $ 16.3 $ 16.1 $ 14.8
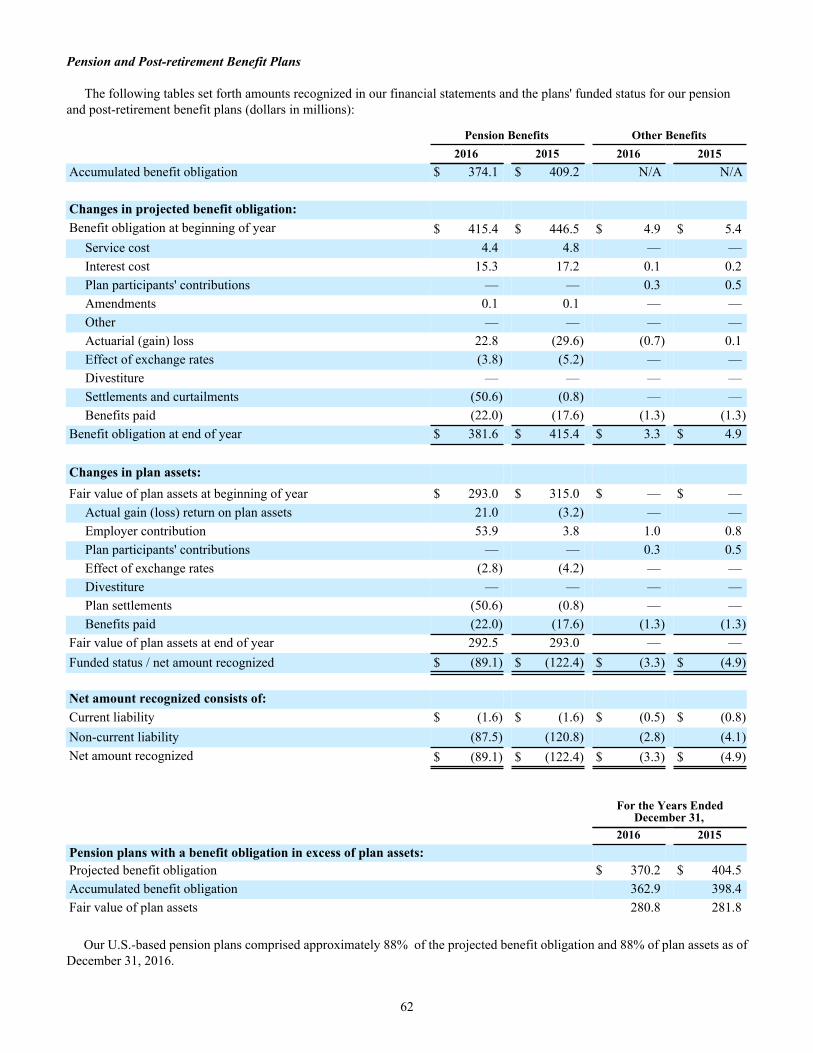
62
Pension and Post-retirement Benefit Plans
The following tables set forth amounts recognized in our financial statements and the plans' funded status for our pension and post-retirement benefit plans (dollars in millions):
Pension Benefits Other Benefits2016 2015 2016 2015
Accumulated benefit obligation $ 374.1 $ 409.2 N/A N/A
Changes in projected benefit obligation:Benefit obligation at beginning of year $ 415.4 $ 446.5 $ 4.9 $ 5.4
Service cost 4.4 4.8 — —Interest cost 15.3 17.2 0.1 0.2Plan participants' contributions — — 0.3 0.5Amendments 0.1 0.1 — —Other — — — —Actuarial (gain) loss 22.8 (29.6) (0.7) 0.1Effect of exchange rates (3.8) (5.2) — —Divestiture — — — —Settlements and curtailments (50.6) (0.8) — —Benefits paid (22.0) (17.6) (1.3) (1.3)
Benefit obligation at end of year $ 381.6 $ 415.4 $ 3.3 $ 4.9
Changes in plan assets:Fair value of plan assets at beginning of year $ 293.0 $ 315.0 $ — $ —
Actual gain (loss) return on plan assets 21.0 (3.2) — —Employer contribution 53.9 3.8 1.0 0.8Plan participants' contributions — — 0.3 0.5Effect of exchange rates (2.8) (4.2) — —Divestiture — — — —Plan settlements (50.6) (0.8) — —Benefits paid (22.0) (17.6) (1.3) (1.3)
Fair value of plan assets at end of year 292.5 293.0 — —Funded status / net amount recognized $ (89.1) $ (122.4) $ (3.3) $ (4.9)
Net amount recognized consists of:Current liability $ (1.6) $ (1.6) $ (0.5) $ (0.8)Non-current liability (87.5) (120.8) (2.8) (4.1)Net amount recognized $ (89.1) $ (122.4) $ (3.3) $ (4.9)
For the Years EndedDecember 31,
2016 2015Pension plans with a benefit obligation in excess of plan assets:Projected benefit obligation $ 370.2 $ 404.5Accumulated benefit obligation 362.9 398.4Fair value of plan assets 280.8 281.8
Our U.S.-based pension plans comprised approximately 88% of the projected benefit obligation and 88% of plan assets as of December 31, 2016.
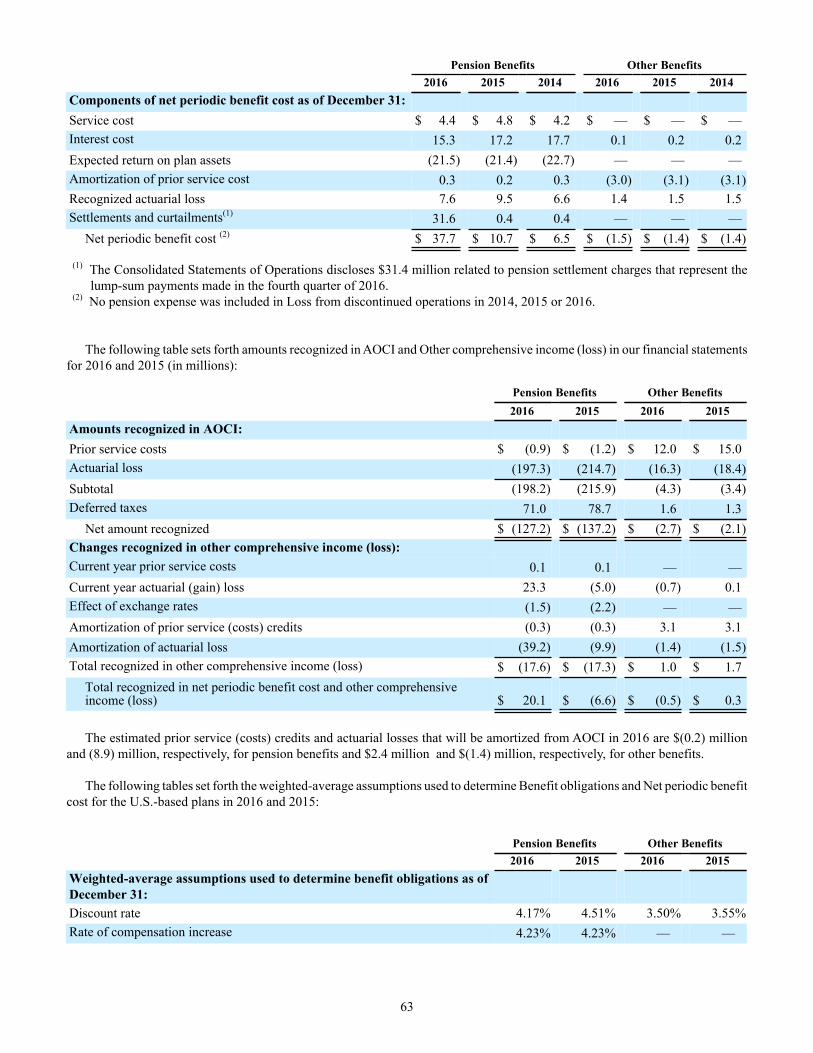
63
Pension Benefits Other Benefits2016 2015 2014 2016 2015 2014
Components of net periodic benefit cost as of December 31:Service cost $ 4.4 $ 4.8 $ 4.2 $ — $ — $ —Interest cost 15.3 17.2 17.7 0.1 0.2 0.2Expected return on plan assets (21.5) (21.4) (22.7) — — —Amortization of prior service cost 0.3 0.2 0.3 (3.0) (3.1) (3.1)Recognized actuarial loss 7.6 9.5 6.6 1.4 1.5 1.5Settlements and curtailments(1) 31.6 0.4 0.4 — — —
Net periodic benefit cost (2) $ 37.7 $ 10.7 $ 6.5 $ (1.5) $ (1.4) $ (1.4)
(1) The Consolidated Statements of Operations discloses $31.4 million related to pension settlement charges that represent the lump-sum payments made in the fourth quarter of 2016.
(2) No pension expense was included in Loss from discontinued operations in 2014, 2015 or 2016.
The following table sets forth amounts recognized in AOCI and Other comprehensive income (loss) in our financial statements for 2016 and 2015 (in millions):
Pension Benefits Other Benefits2016 2015 2016 2015
Amounts recognized in AOCI:Prior service costs $ (0.9) $ (1.2) $ 12.0 $ 15.0Actuarial loss (197.3) (214.7) (16.3) (18.4)Subtotal (198.2) (215.9) (4.3) (3.4)Deferred taxes 71.0 78.7 1.6 1.3
Net amount recognized $ (127.2) $ (137.2) $ (2.7) $ (2.1)Changes recognized in other comprehensive income (loss):Current year prior service costs 0.1 0.1 — —Current year actuarial (gain) loss 23.3 (5.0) (0.7) 0.1Effect of exchange rates (1.5) (2.2) — —Amortization of prior service (costs) credits (0.3) (0.3) 3.1 3.1Amortization of actuarial loss (39.2) (9.9) (1.4) (1.5)Total recognized in other comprehensive income (loss) $ (17.6) $ (17.3) $ 1.0 $ 1.7
Total recognized in net periodic benefit cost and other comprehensiveincome (loss) $ 20.1 $ (6.6) $ (0.5) $ 0.3
The estimated prior service (costs) credits and actuarial losses that will be amortized from AOCI in 2016 are $(0.2) millionand (8.9) million, respectively, for pension benefits and $2.4 million and $(1.4) million, respectively, for other benefits.
The following tables set forth the weighted-average assumptions used to determine Benefit obligations and Net periodic benefit cost for the U.S.-based plans in 2016 and 2015:
Pension Benefits Other Benefits2016 2015 2016 2015
Weighted-average assumptions used to determine benefit obligations as ofDecember 31:Discount rate 4.17% 4.51% 3.50% 3.55%Rate of compensation increase 4.23% 4.23% — —
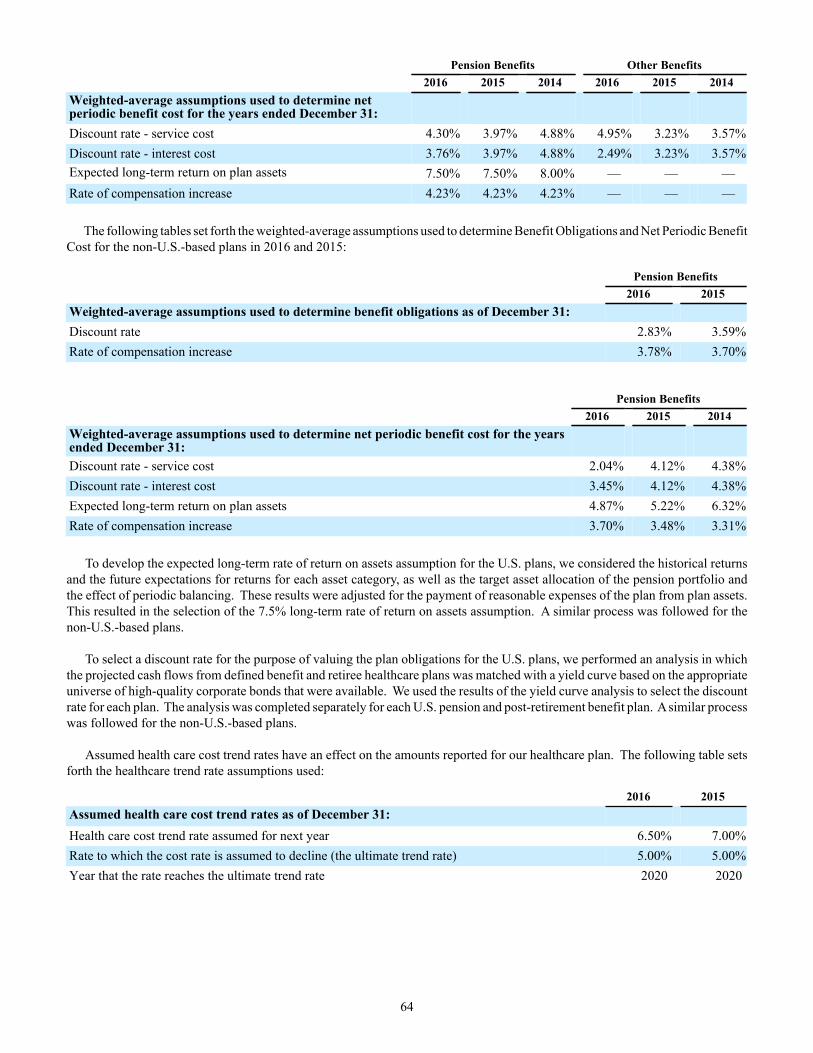
64
Pension Benefits Other Benefits2016 2015 2014 2016 2015 2014
Weighted-average assumptions used to determine netperiodic benefit cost for the years ended December 31:Discount rate - service cost 4.30% 3.97% 4.88% 4.95% 3.23% 3.57%Discount rate - interest cost 3.76% 3.97% 4.88% 2.49% 3.23% 3.57%Expected long-term return on plan assets 7.50% 7.50% 8.00% — — —Rate of compensation increase 4.23% 4.23% 4.23% — — —
The following tables set forth the weighted-average assumptions used to determine Benefit Obligations and Net Periodic Benefit Cost for the non-U.S.-based plans in 2016 and 2015:
Pension Benefits2016 2015
Weighted-average assumptions used to determine benefit obligations as of December 31:Discount rate 2.83% 3.59%Rate of compensation increase 3.78% 3.70%
Pension Benefits2016 2015 2014
Weighted-average assumptions used to determine net periodic benefit cost for the yearsended December 31:Discount rate - service cost 2.04% 4.12% 4.38%Discount rate - interest cost 3.45% 4.12% 4.38%Expected long-term return on plan assets 4.87% 5.22% 6.32%Rate of compensation increase 3.70% 3.48% 3.31%
To develop the expected long-term rate of return on assets assumption for the U.S. plans, we considered the historical returns and the future expectations for returns for each asset category, as well as the target asset allocation of the pension portfolio and the effect of periodic balancing. These results were adjusted for the payment of reasonable expenses of the plan from plan assets. This resulted in the selection of the 7.5% long-term rate of return on assets assumption. A similar process was followed for the non-U.S.-based plans.
To select a discount rate for the purpose of valuing the plan obligations for the U.S. plans, we performed an analysis in which the projected cash flows from defined benefit and retiree healthcare plans was matched with a yield curve based on the appropriate universe of high-quality corporate bonds that were available. We used the results of the yield curve analysis to select the discount rate for each plan. The analysis was completed separately for each U.S. pension and post-retirement benefit plan. A similar process was followed for the non-U.S.-based plans.
Assumed health care cost trend rates have an effect on the amounts reported for our healthcare plan. The following table sets forth the healthcare trend rate assumptions used:
2016 2015Assumed health care cost trend rates as of December 31:Health care cost trend rate assumed for next year 6.50% 7.00%Rate to which the cost rate is assumed to decline (the ultimate trend rate) 5.00% 5.00%Year that the rate reaches the ultimate trend rate 2020 2020
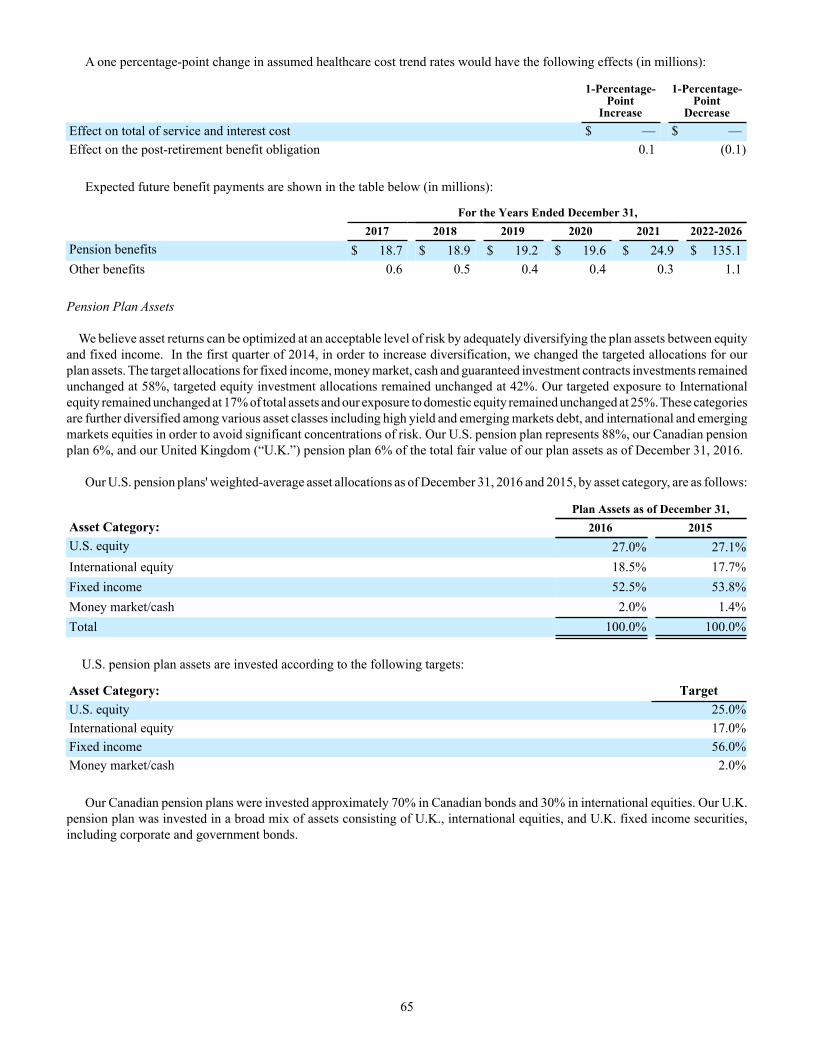
65
A one percentage-point change in assumed healthcare cost trend rates would have the following effects (in millions):
1-Percentage-Point
Increase
1-Percentage-Point
DecreaseEffect on total of service and interest cost $ — $ —Effect on the post-retirement benefit obligation 0.1 (0.1)
Expected future benefit payments are shown in the table below (in millions):
For the Years Ended December 31,2017 2018 2019 2020 2021 2022-2026
Pension benefits $ 18.7 $ 18.9 $ 19.2 $ 19.6 $ 24.9 $ 135.1Other benefits 0.6 0.5 0.4 0.4 0.3 1.1
Pension Plan Assets
We believe asset returns can be optimized at an acceptable level of risk by adequately diversifying the plan assets between equity and fixed income. In the first quarter of 2014, in order to increase diversification, we changed the targeted allocations for our plan assets. The target allocations for fixed income, money market, cash and guaranteed investment contracts investments remained unchanged at 58%, targeted equity investment allocations remained unchanged at 42%. Our targeted exposure to International equity remained unchanged at 17% of total assets and our exposure to domestic equity remained unchanged at 25%. These categories are further diversified among various asset classes including high yield and emerging markets debt, and international and emerging markets equities in order to avoid significant concentrations of risk. Our U.S. pension plan represents 88%, our Canadian pension plan 6%, and our United Kingdom (“U.K.”) pension plan 6% of the total fair value of our plan assets as of December 31, 2016.
Our U.S. pension plans' weighted-average asset allocations as of December 31, 2016 and 2015, by asset category, are as follows:
Plan Assets as of December 31,Asset Category: 2016 2015U.S. equity 27.0% 27.1%International equity 18.5% 17.7%Fixed income 52.5% 53.8%Money market/cash 2.0% 1.4%Total 100.0% 100.0%
U.S. pension plan assets are invested according to the following targets:
Asset Category: TargetU.S. equity 25.0%International equity 17.0%Fixed income 56.0%Money market/cash 2.0%
Our Canadian pension plans were invested approximately 70% in Canadian bonds and 30% in international equities. Our U.K. pension plan was invested in a broad mix of assets consisting of U.K., international equities, and U.K. fixed income securities, including corporate and government bonds.
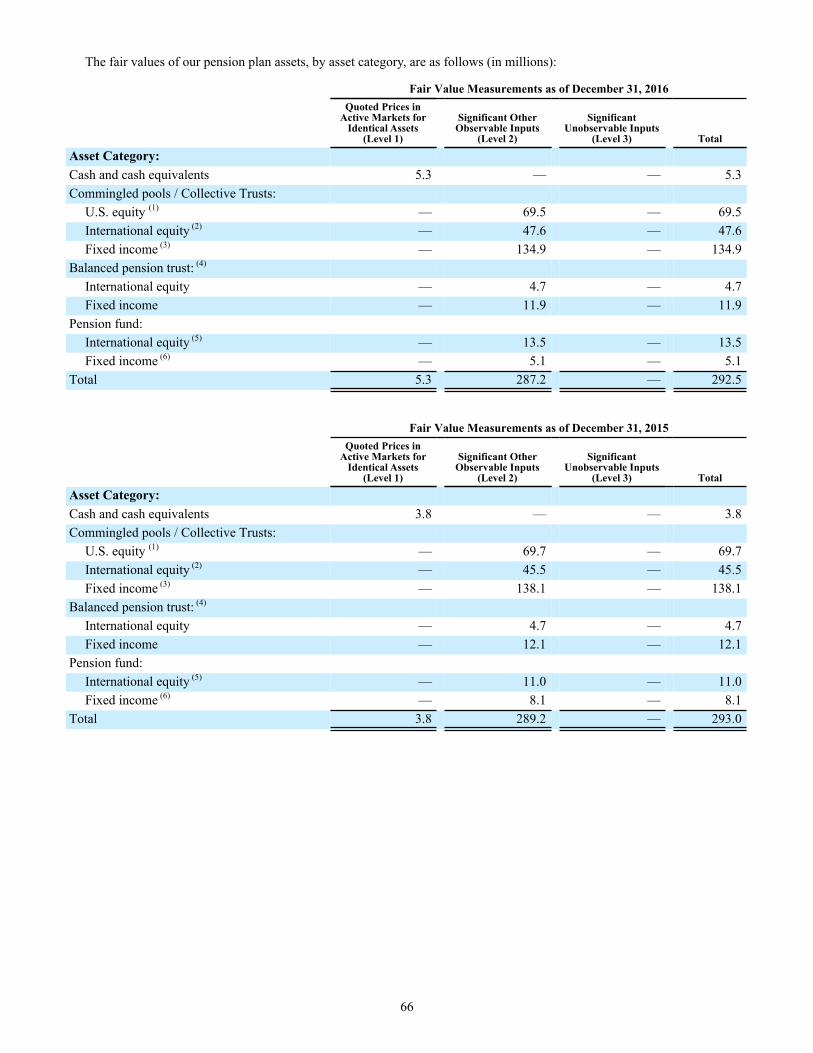
66
The fair values of our pension plan assets, by asset category, are as follows (in millions):
Fair Value Measurements as of December 31, 2016Quoted Prices in
Active Markets for Identical Assets
(Level 1)
Significant Other Observable Inputs
(Level 2)
Significant Unobservable Inputs
(Level 3) Total
Asset Category:Cash and cash equivalents 5.3 — — 5.3Commingled pools / Collective Trusts:
U.S. equity (1) — 69.5 — 69.5International equity (2) — 47.6 — 47.6Fixed income (3) — 134.9 — 134.9
Balanced pension trust: (4)
International equity — 4.7 — 4.7Fixed income — 11.9 — 11.9
Pension fund:International equity (5) — 13.5 — 13.5Fixed income (6) — 5.1 — 5.1
Total 5.3 287.2 — 292.5
Fair Value Measurements as of December 31, 2015Quoted Prices in
Active Markets for Identical Assets
(Level 1)
Significant Other Observable Inputs
(Level 2)
Significant Unobservable Inputs
(Level 3) Total
Asset Category:Cash and cash equivalents 3.8 — — 3.8Commingled pools / Collective Trusts:
U.S. equity (1) — 69.7 — 69.7International equity (2) — 45.5 — 45.5Fixed income (3) — 138.1 — 138.1
Balanced pension trust: (4)
International equity — 4.7 — 4.7Fixed income — 12.1 — 12.1
Pension fund:International equity (5) — 11.0 — 11.0Fixed income (6) — 8.1 — 8.1
Total 3.8 289.2 — 293.0
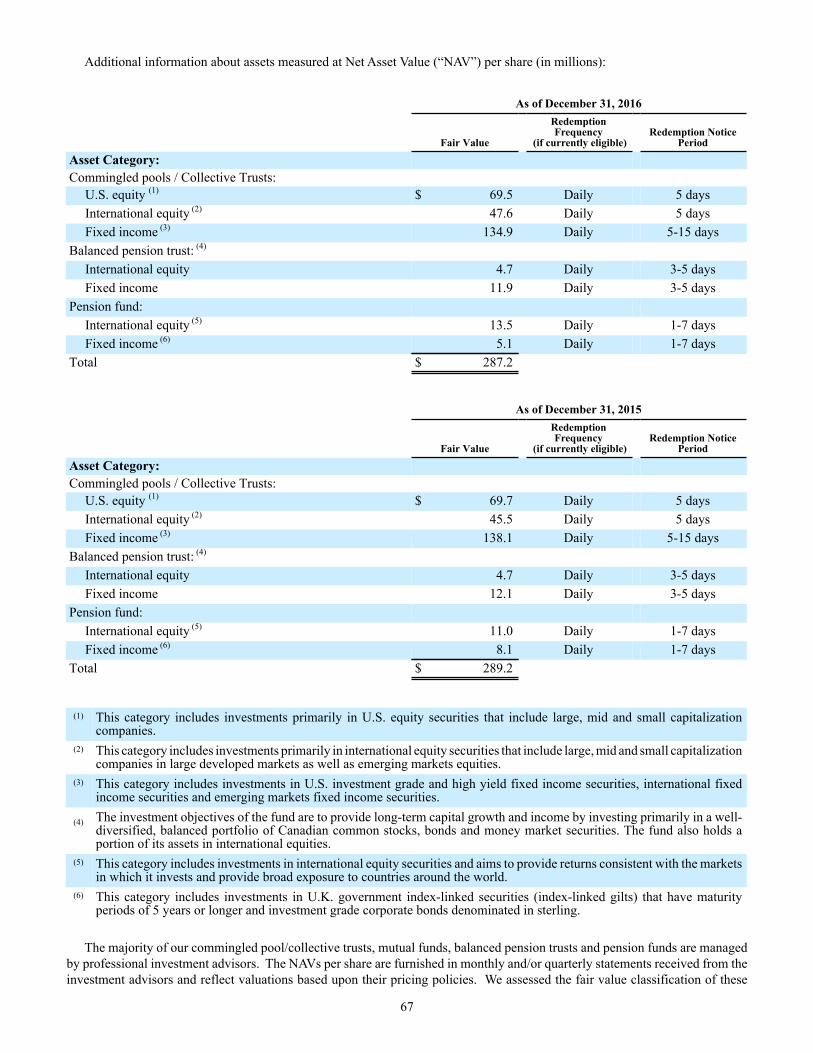
67
Additional information about assets measured at Net Asset Value (“NAV”) per share (in millions):
As of December 31, 2016
Fair Value
Redemption Frequency
(if currently eligible)Redemption Notice
Period
Asset Category:Commingled pools / Collective Trusts:
U.S. equity (1) $ 69.5 Daily 5 daysInternational equity (2) 47.6 Daily 5 daysFixed income (3) 134.9 Daily 5-15 days
Balanced pension trust: (4)
International equity 4.7 Daily 3-5 daysFixed income 11.9 Daily 3-5 days
Pension fund:International equity (5) 13.5 Daily 1-7 daysFixed income (6) 5.1 Daily 1-7 days
Total $ 287.2
As of December 31, 2015
Fair Value
Redemption Frequency
(if currently eligible)Redemption Notice
Period
Asset Category:Commingled pools / Collective Trusts:
U.S. equity (1) $ 69.7 Daily 5 daysInternational equity (2) 45.5 Daily 5 daysFixed income (3) 138.1 Daily 5-15 days
Balanced pension trust: (4)
International equity 4.7 Daily 3-5 daysFixed income 12.1 Daily 3-5 days
Pension fund:International equity (5) 11.0 Daily 1-7 daysFixed income (6) 8.1 Daily 1-7 days
Total $ 289.2
(1) This category includes investments primarily in U.S. equity securities that include large, mid and small capitalization companies.
(2) This category includes investments primarily in international equity securities that include large, mid and small capitalization companies in large developed markets as well as emerging markets equities.
(3) This category includes investments in U.S. investment grade and high yield fixed income securities, international fixed income securities and emerging markets fixed income securities.
(4) The investment objectives of the fund are to provide long-term capital growth and income by investing primarily in a well-diversified, balanced portfolio of Canadian common stocks, bonds and money market securities. The fund also holds a portion of its assets in international equities.
(5) This category includes investments in international equity securities and aims to provide returns consistent with the markets in which it invests and provide broad exposure to countries around the world.
(6) This category includes investments in U.K. government index-linked securities (index-linked gilts) that have maturity periods of 5 years or longer and investment grade corporate bonds denominated in sterling.
The majority of our commingled pool/collective trusts, mutual funds, balanced pension trusts and pension funds are managed by professional investment advisors. The NAVs per share are furnished in monthly and/or quarterly statements received from the investment advisors and reflect valuations based upon their pricing policies. We assessed the fair value classification of these
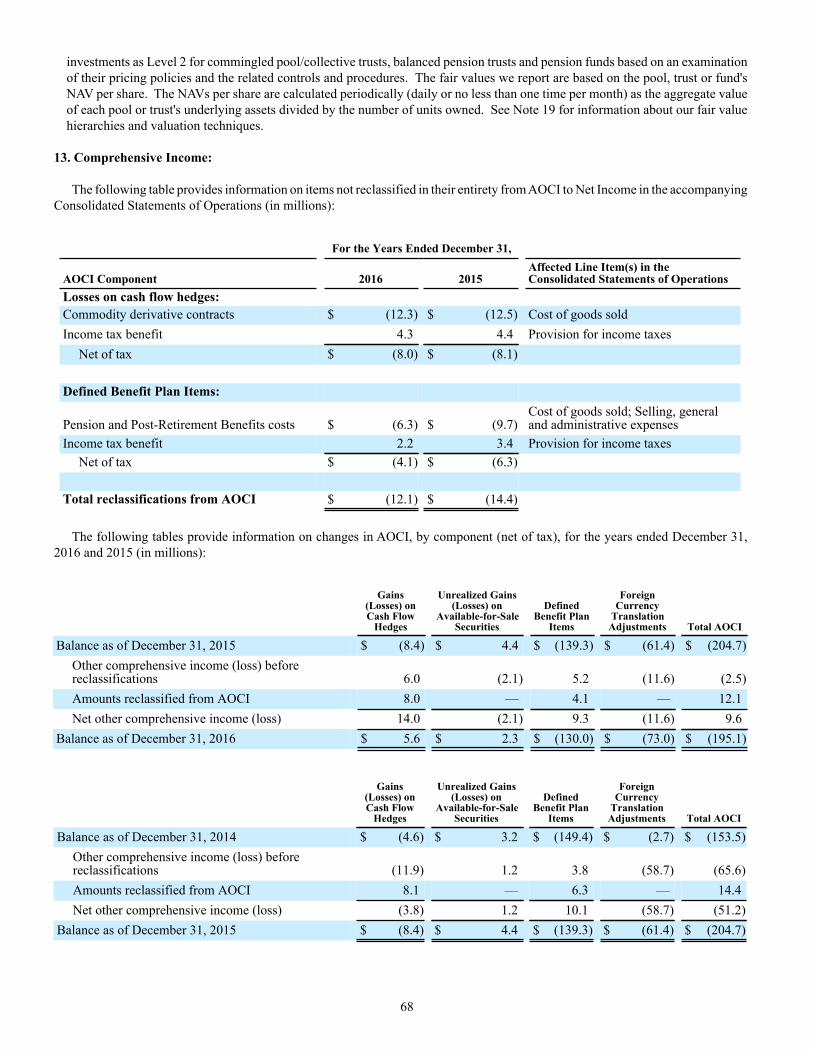
68
investments as Level 2 for commingled pool/collective trusts, balanced pension trusts and pension funds based on an examination of their pricing policies and the related controls and procedures. The fair values we report are based on the pool, trust or fund's NAV per share. The NAVs per share are calculated periodically (daily or no less than one time per month) as the aggregate value of each pool or trust's underlying assets divided by the number of units owned. See Note 19 for information about our fair value hierarchies and valuation techniques.
13. Comprehensive Income:
The following table provides information on items not reclassified in their entirety from AOCI to Net Income in the accompanying Consolidated Statements of Operations (in millions):
For the Years Ended December 31,
AOCI Component 2016 2015Affected Line Item(s) in theConsolidated Statements of Operations
Losses on cash flow hedges:Commodity derivative contracts $ (12.3) $ (12.5) Cost of goods soldIncome tax benefit 4.3 4.4 Provision for income taxes
Net of tax $ (8.0) $ (8.1)
Defined Benefit Plan Items:
Pension and Post-Retirement Benefits costs $ (6.3) $ (9.7)Cost of goods sold; Selling, generaland administrative expenses
Income tax benefit 2.2 3.4 Provision for income taxesNet of tax $ (4.1) $ (6.3)
Total reclassifications from AOCI $ (12.1) $ (14.4)
The following tables provide information on changes in AOCI, by component (net of tax), for the years ended December 31, 2016 and 2015 (in millions):
Gains(Losses) onCash Flow
Hedges
Unrealized Gains(Losses) on
Available-for-SaleSecurities
DefinedBenefit Plan
Items
ForeignCurrency
TranslationAdjustments Total AOCI
Balance as of December 31, 2015 $ (8.4) $ 4.4 $ (139.3) $ (61.4) $ (204.7)Other comprehensive income (loss) beforereclassifications 6.0 (2.1) 5.2 (11.6) (2.5)Amounts reclassified from AOCI 8.0 — 4.1 — 12.1Net other comprehensive income (loss) 14.0 (2.1) 9.3 (11.6) 9.6
Balance as of December 31, 2016 $ 5.6 $ 2.3 $ (130.0) $ (73.0) $ (195.1)
Gains(Losses) onCash Flow
Hedges
Unrealized Gains(Losses) on
Available-for-SaleSecurities
DefinedBenefit Plan
Items
ForeignCurrency
TranslationAdjustments Total AOCI
Balance as of December 31, 2014 $ (4.6) $ 3.2 $ (149.4) $ (2.7) $ (153.5)Other comprehensive income (loss) beforereclassifications (11.9) 1.2 3.8 (58.7) (65.6)Amounts reclassified from AOCI 8.1 — 6.3 — 14.4Net other comprehensive income (loss) (3.8) 1.2 10.1 (58.7) (51.2)
Balance as of December 31, 2015 $ (8.4) $ 4.4 $ (139.3) $ (61.4) $ (204.7)
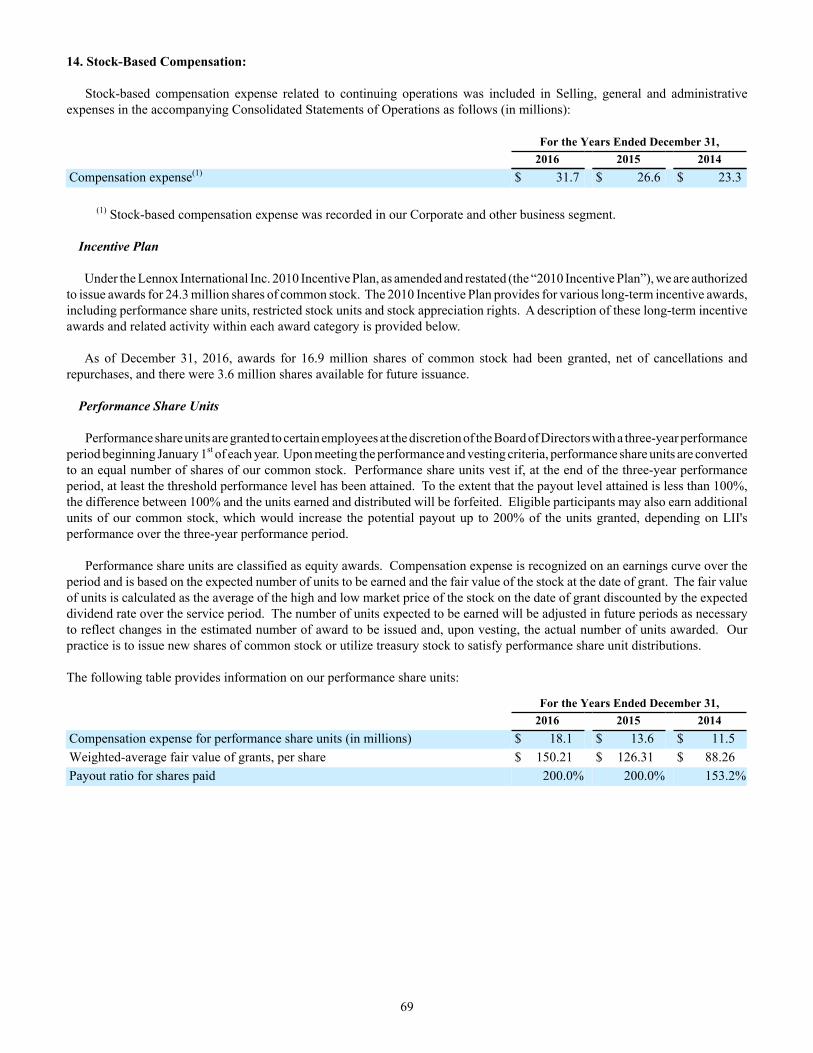
69
14. Stock-Based Compensation:
Stock-based compensation expense related to continuing operations was included in Selling, general and administrative expenses in the accompanying Consolidated Statements of Operations as follows (in millions):
For the Years Ended December 31,2016 2015 2014
Compensation expense(1) $ 31.7 $ 26.6 $ 23.3
(1) Stock-based compensation expense was recorded in our Corporate and other business segment.
Incentive Plan
Under the Lennox International Inc. 2010 Incentive Plan, as amended and restated (the “2010 Incentive Plan”), we are authorized to issue awards for 24.3 million shares of common stock. The 2010 Incentive Plan provides for various long-term incentive awards, including performance share units, restricted stock units and stock appreciation rights. A description of these long-term incentive awards and related activity within each award category is provided below.
As of December 31, 2016, awards for 16.9 million shares of common stock had been granted, net of cancellations and repurchases, and there were 3.6 million shares available for future issuance.
Performance Share Units
Performance share units are granted to certain employees at the discretion of the Board of Directors with a three-year performance period beginning January 1st of each year. Upon meeting the performance and vesting criteria, performance share units are converted to an equal number of shares of our common stock. Performance share units vest if, at the end of the three-year performance period, at least the threshold performance level has been attained. To the extent that the payout level attained is less than 100%, the difference between 100% and the units earned and distributed will be forfeited. Eligible participants may also earn additional units of our common stock, which would increase the potential payout up to 200% of the units granted, depending on LII's performance over the three-year performance period.
Performance share units are classified as equity awards. Compensation expense is recognized on an earnings curve over the period and is based on the expected number of units to be earned and the fair value of the stock at the date of grant. The fair value of units is calculated as the average of the high and low market price of the stock on the date of grant discounted by the expected dividend rate over the service period. The number of units expected to be earned will be adjusted in future periods as necessary to reflect changes in the estimated number of award to be issued and, upon vesting, the actual number of units awarded. Our practice is to issue new shares of common stock or utilize treasury stock to satisfy performance share unit distributions.
The following table provides information on our performance share units:
For the Years Ended December 31,2016 2015 2014
Compensation expense for performance share units (in millions) $ 18.1 $ 13.6 $ 11.5Weighted-average fair value of grants, per share $ 150.21 $ 126.31 $ 88.26Payout ratio for shares paid 200.0% 200.0% 153.2%
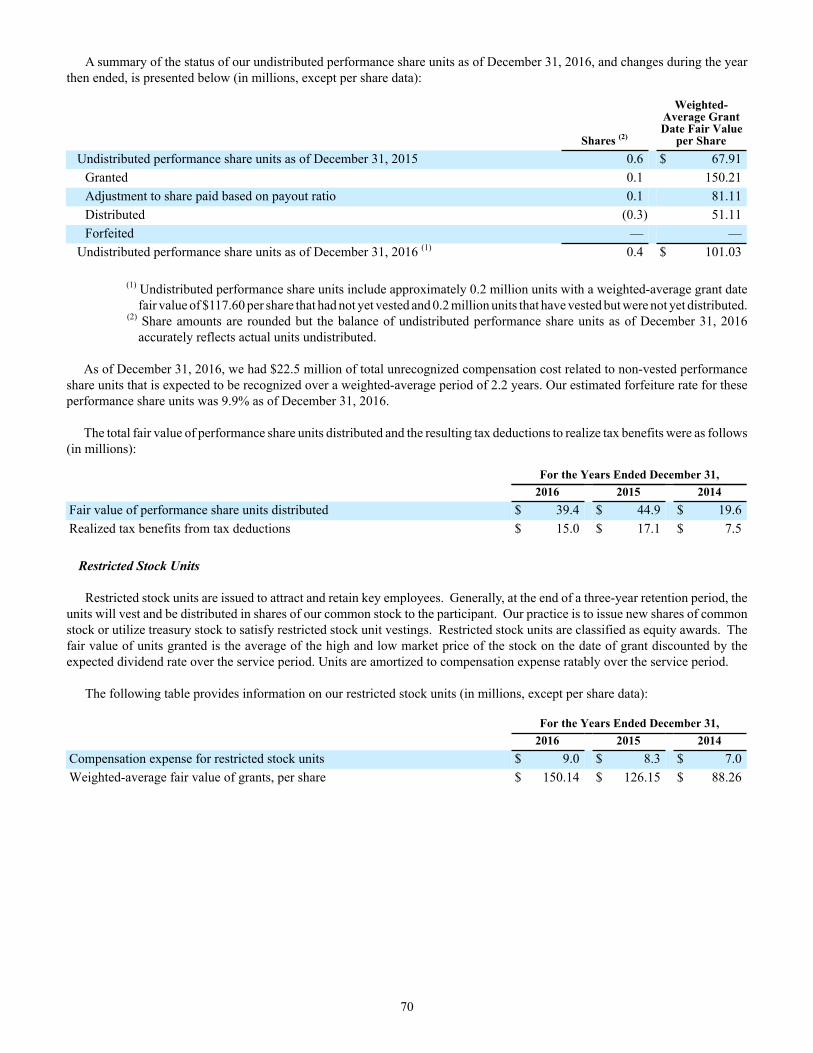
70
A summary of the status of our undistributed performance share units as of December 31, 2016, and changes during the year then ended, is presented below (in millions, except per share data):
Shares (2)
Weighted-Average GrantDate Fair Value
per ShareUndistributed performance share units as of December 31, 2015 0.6 $ 67.91
Granted 0.1 150.21Adjustment to share paid based on payout ratio 0.1 81.11Distributed (0.3) 51.11Forfeited — —
Undistributed performance share units as of December 31, 2016 (1) 0.4 $ 101.03
(1) Undistributed performance share units include approximately 0.2 million units with a weighted-average grant date fair value of $117.60 per share that had not yet vested and 0.2 million units that have vested but were not yet distributed.
(2) Share amounts are rounded but the balance of undistributed performance share units as of December 31, 2016 accurately reflects actual units undistributed.
As of December 31, 2016, we had $22.5 million of total unrecognized compensation cost related to non-vested performance
share units that is expected to be recognized over a weighted-average period of 2.2 years. Our estimated forfeiture rate for these performance share units was 9.9% as of December 31, 2016.
The total fair value of performance share units distributed and the resulting tax deductions to realize tax benefits were as follows (in millions):
For the Years Ended December 31,2016 2015 2014
Fair value of performance share units distributed $ 39.4 $ 44.9 $ 19.6Realized tax benefits from tax deductions $ 15.0 $ 17.1 $ 7.5
Restricted Stock Units
Restricted stock units are issued to attract and retain key employees. Generally, at the end of a three-year retention period, the units will vest and be distributed in shares of our common stock to the participant. Our practice is to issue new shares of common stock or utilize treasury stock to satisfy restricted stock unit vestings. Restricted stock units are classified as equity awards. The fair value of units granted is the average of the high and low market price of the stock on the date of grant discounted by the expected dividend rate over the service period. Units are amortized to compensation expense ratably over the service period.
The following table provides information on our restricted stock units (in millions, except per share data):
For the Years Ended December 31,2016 2015 2014
Compensation expense for restricted stock units $ 9.0 $ 8.3 $ 7.0Weighted-average fair value of grants, per share $ 150.14 $ 126.15 $ 88.26
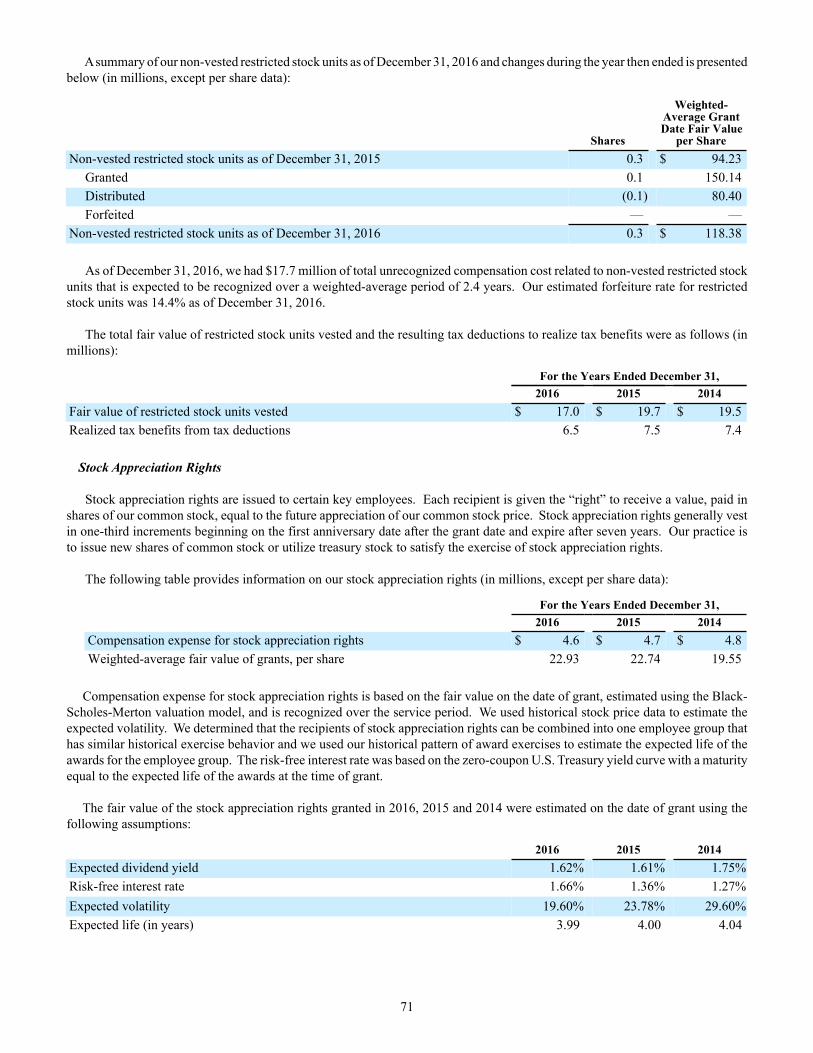
71
A summary of our non-vested restricted stock units as of December 31, 2016 and changes during the year then ended is presented below (in millions, except per share data):
Shares
Weighted-Average GrantDate Fair Value
per ShareNon-vested restricted stock units as of December 31, 2015 0.3 $ 94.23
Granted 0.1 150.14Distributed (0.1) 80.40Forfeited — —
Non-vested restricted stock units as of December 31, 2016 0.3 $ 118.38
As of December 31, 2016, we had $17.7 million of total unrecognized compensation cost related to non-vested restricted stock units that is expected to be recognized over a weighted-average period of 2.4 years. Our estimated forfeiture rate for restricted stock units was 14.4% as of December 31, 2016.
The total fair value of restricted stock units vested and the resulting tax deductions to realize tax benefits were as follows (in
millions):
For the Years Ended December 31,2016 2015 2014
Fair value of restricted stock units vested $ 17.0 $ 19.7 $ 19.5Realized tax benefits from tax deductions 6.5 7.5 7.4
Stock Appreciation Rights
Stock appreciation rights are issued to certain key employees. Each recipient is given the “right” to receive a value, paid in shares of our common stock, equal to the future appreciation of our common stock price. Stock appreciation rights generally vest in one-third increments beginning on the first anniversary date after the grant date and expire after seven years. Our practice is to issue new shares of common stock or utilize treasury stock to satisfy the exercise of stock appreciation rights.
The following table provides information on our stock appreciation rights (in millions, except per share data):
For the Years Ended December 31,2016 2015 2014
Compensation expense for stock appreciation rights $ 4.6 $ 4.7 $ 4.8Weighted-average fair value of grants, per share 22.93 22.74 19.55
Compensation expense for stock appreciation rights is based on the fair value on the date of grant, estimated using the Black-Scholes-Merton valuation model, and is recognized over the service period. We used historical stock price data to estimate the expected volatility. We determined that the recipients of stock appreciation rights can be combined into one employee group that has similar historical exercise behavior and we used our historical pattern of award exercises to estimate the expected life of the awards for the employee group. The risk-free interest rate was based on the zero-coupon U.S. Treasury yield curve with a maturity equal to the expected life of the awards at the time of grant.
The fair value of the stock appreciation rights granted in 2016, 2015 and 2014 were estimated on the date of grant using the following assumptions:
2016 2015 2014Expected dividend yield 1.62% 1.61% 1.75%Risk-free interest rate 1.66% 1.36% 1.27%Expected volatility 19.60% 23.78% 29.60%Expected life (in years) 3.99 4.00 4.04
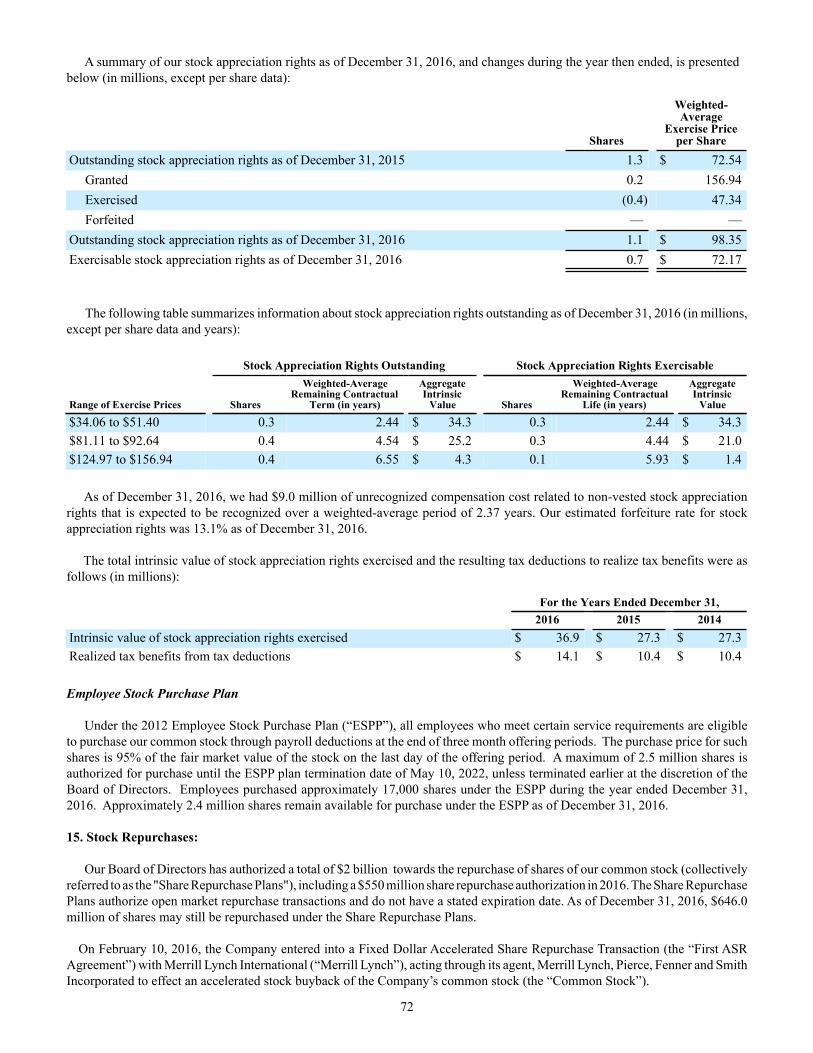
72
A summary of our stock appreciation rights as of December 31, 2016, and changes during the year then ended, is presented below (in millions, except per share data):
Shares
Weighted-Average
Exercise Priceper Share
Outstanding stock appreciation rights as of December 31, 2015 1.3 $ 72.54Granted 0.2 156.94Exercised (0.4) 47.34Forfeited — —
Outstanding stock appreciation rights as of December 31, 2016 1.1 $ 98.35Exercisable stock appreciation rights as of December 31, 2016 0.7 $ 72.17
The following table summarizes information about stock appreciation rights outstanding as of December 31, 2016 (in millions, except per share data and years):
Stock Appreciation Rights Outstanding Stock Appreciation Rights Exercisable
Range of Exercise Prices Shares
Weighted-AverageRemaining Contractual
Term (in years)
AggregateIntrinsic
Value Shares
Weighted-AverageRemaining Contractual
Life (in years)
AggregateIntrinsic
Value
$34.06 to $51.40 0.3 2.44 $ 34.3 0.3 2.44 $ 34.3$81.11 to $92.64 0.4 4.54 $ 25.2 0.3 4.44 $ 21.0$124.97 to $156.94 0.4 6.55 $ 4.3 0.1 5.93 $ 1.4
As of December 31, 2016, we had $9.0 million of unrecognized compensation cost related to non-vested stock appreciation rights that is expected to be recognized over a weighted-average period of 2.37 years. Our estimated forfeiture rate for stock appreciation rights was 13.1% as of December 31, 2016.
The total intrinsic value of stock appreciation rights exercised and the resulting tax deductions to realize tax benefits were as follows (in millions):
For the Years Ended December 31,2016 2015 2014
Intrinsic value of stock appreciation rights exercised $ 36.9 $ 27.3 $ 27.3Realized tax benefits from tax deductions $ 14.1 $ 10.4 $ 10.4
Employee Stock Purchase Plan
Under the 2012 Employee Stock Purchase Plan (“ESPP”), all employees who meet certain service requirements are eligible to purchase our common stock through payroll deductions at the end of three month offering periods. The purchase price for such shares is 95% of the fair market value of the stock on the last day of the offering period. A maximum of 2.5 million shares is authorized for purchase until the ESPP plan termination date of May 10, 2022, unless terminated earlier at the discretion of the Board of Directors. Employees purchased approximately 17,000 shares under the ESPP during the year ended December 31, 2016. Approximately 2.4 million shares remain available for purchase under the ESPP as of December 31, 2016.
15. Stock Repurchases:
Our Board of Directors has authorized a total of $2 billion towards the repurchase of shares of our common stock (collectively referred to as the "Share Repurchase Plans"), including a $550 million share repurchase authorization in 2016. The Share Repurchase Plans authorize open market repurchase transactions and do not have a stated expiration date. As of December 31, 2016, $646.0 million of shares may still be repurchased under the Share Repurchase Plans.
On February 10, 2016, the Company entered into a Fixed Dollar Accelerated Share Repurchase Transaction (the “First ASR Agreement”) with Merrill Lynch International (“Merrill Lynch”), acting through its agent, Merrill Lynch, Pierce, Fenner and Smith Incorporated to effect an accelerated stock buyback of the Company’s common stock (the “Common Stock”).
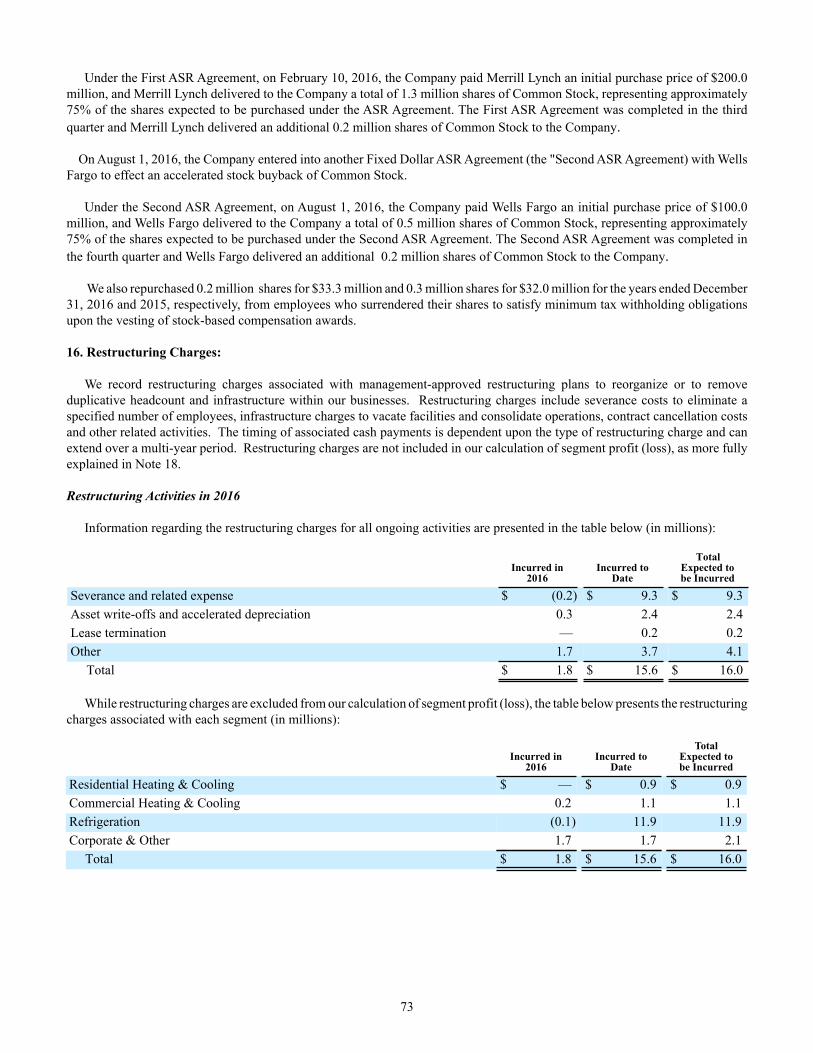
73
Under the First ASR Agreement, on February 10, 2016, the Company paid Merrill Lynch an initial purchase price of $200.0 million, and Merrill Lynch delivered to the Company a total of 1.3 million shares of Common Stock, representing approximately 75% of the shares expected to be purchased under the ASR Agreement. The First ASR Agreement was completed in the third quarter and Merrill Lynch delivered an additional 0.2 million shares of Common Stock to the Company.
On August 1, 2016, the Company entered into another Fixed Dollar ASR Agreement (the "Second ASR Agreement) with Wells Fargo to effect an accelerated stock buyback of Common Stock.
Under the Second ASR Agreement, on August 1, 2016, the Company paid Wells Fargo an initial purchase price of $100.0 million, and Wells Fargo delivered to the Company a total of 0.5 million shares of Common Stock, representing approximately 75% of the shares expected to be purchased under the Second ASR Agreement. The Second ASR Agreement was completed in the fourth quarter and Wells Fargo delivered an additional 0.2 million shares of Common Stock to the Company.
We also repurchased 0.2 million shares for $33.3 million and 0.3 million shares for $32.0 million for the years ended December 31, 2016 and 2015, respectively, from employees who surrendered their shares to satisfy minimum tax withholding obligations upon the vesting of stock-based compensation awards.
16. Restructuring Charges:
We record restructuring charges associated with management-approved restructuring plans to reorganize or to remove duplicative headcount and infrastructure within our businesses. Restructuring charges include severance costs to eliminate a specified number of employees, infrastructure charges to vacate facilities and consolidate operations, contract cancellation costs and other related activities. The timing of associated cash payments is dependent upon the type of restructuring charge and can extend over a multi-year period. Restructuring charges are not included in our calculation of segment profit (loss), as more fully explained in Note 18.
Restructuring Activities in 2016
Information regarding the restructuring charges for all ongoing activities are presented in the table below (in millions):
Incurred in 2016
Incurred toDate
TotalExpected tobe Incurred
Severance and related expense $ (0.2) $ 9.3 $ 9.3Asset write-offs and accelerated depreciation 0.3 2.4 2.4Lease termination — 0.2 0.2Other 1.7 3.7 4.1
Total $ 1.8 $ 15.6 $ 16.0
While restructuring charges are excluded from our calculation of segment profit (loss), the table below presents the restructuring charges associated with each segment (in millions):
Incurred in 2016
Incurred to Date
Total Expected to be Incurred
Residential Heating & Cooling $ — $ 0.9 $ 0.9Commercial Heating & Cooling 0.2 1.1 1.1Refrigeration (0.1) 11.9 11.9Corporate & Other 1.7 1.7 2.1
Total $ 1.8 $ 15.6 $ 16.0
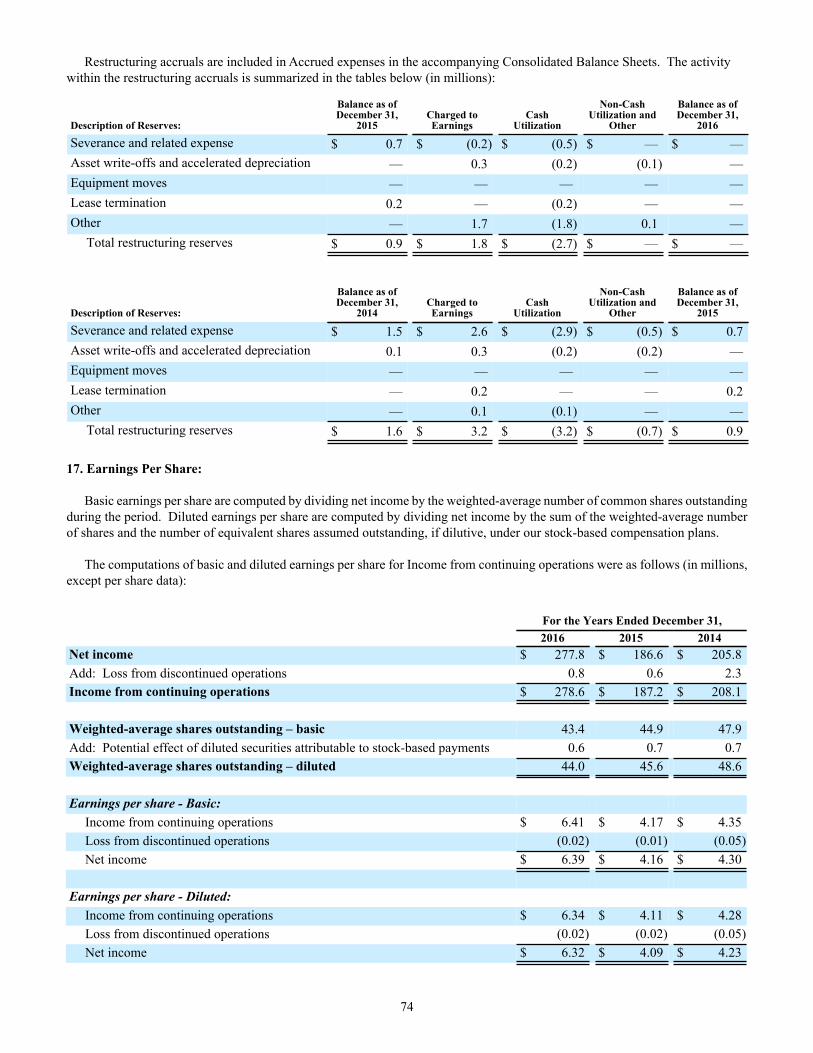
74
Restructuring accruals are included in Accrued expenses in the accompanying Consolidated Balance Sheets. The activity within the restructuring accruals is summarized in the tables below (in millions):
Description of Reserves:
Balance as of December 31,
2015Charged toEarnings
CashUtilization
Non-CashUtilization and
Other
Balance as of December 31,
2016
Severance and related expense $ 0.7 $ (0.2) $ (0.5) $ — $ —Asset write-offs and accelerated depreciation — 0.3 (0.2) (0.1) —Equipment moves — — — — —Lease termination 0.2 — (0.2) — —Other — 1.7 (1.8) 0.1 —
Total restructuring reserves $ 0.9 $ 1.8 $ (2.7) $ — $ —
Description of Reserves:
Balance as of December 31,
2014Charged toEarnings
CashUtilization
Non-CashUtilization and
Other
Balance as of December 31,
2015
Severance and related expense $ 1.5 $ 2.6 $ (2.9) $ (0.5) $ 0.7Asset write-offs and accelerated depreciation 0.1 0.3 (0.2) (0.2) —Equipment moves — — — — —Lease termination — 0.2 — — 0.2Other — 0.1 (0.1) — —
Total restructuring reserves $ 1.6 $ 3.2 $ (3.2) $ (0.7) $ 0.9
17. Earnings Per Share:
Basic earnings per share are computed by dividing net income by the weighted-average number of common shares outstanding during the period. Diluted earnings per share are computed by dividing net income by the sum of the weighted-average number of shares and the number of equivalent shares assumed outstanding, if dilutive, under our stock-based compensation plans.
The computations of basic and diluted earnings per share for Income from continuing operations were as follows (in millions, except per share data):
For the Years Ended December 31, 2016 2015 2014Net income $ 277.8 $ 186.6 $ 205.8Add: Loss from discontinued operations 0.8 0.6 2.3Income from continuing operations $ 278.6 $ 187.2 $ 208.1
Weighted-average shares outstanding – basic 43.4 44.9 47.9Add: Potential effect of diluted securities attributable to stock-based payments 0.6 0.7 0.7Weighted-average shares outstanding – diluted 44.0 45.6 48.6
Earnings per share - Basic:Income from continuing operations $ 6.41 $ 4.17 $ 4.35Loss from discontinued operations (0.02) (0.01) (0.05)Net income $ 6.39 $ 4.16 $ 4.30
Earnings per share - Diluted:Income from continuing operations $ 6.34 $ 4.11 $ 4.28Loss from discontinued operations (0.02) (0.02) (0.05)Net income $ 6.32 $ 4.09 $ 4.23
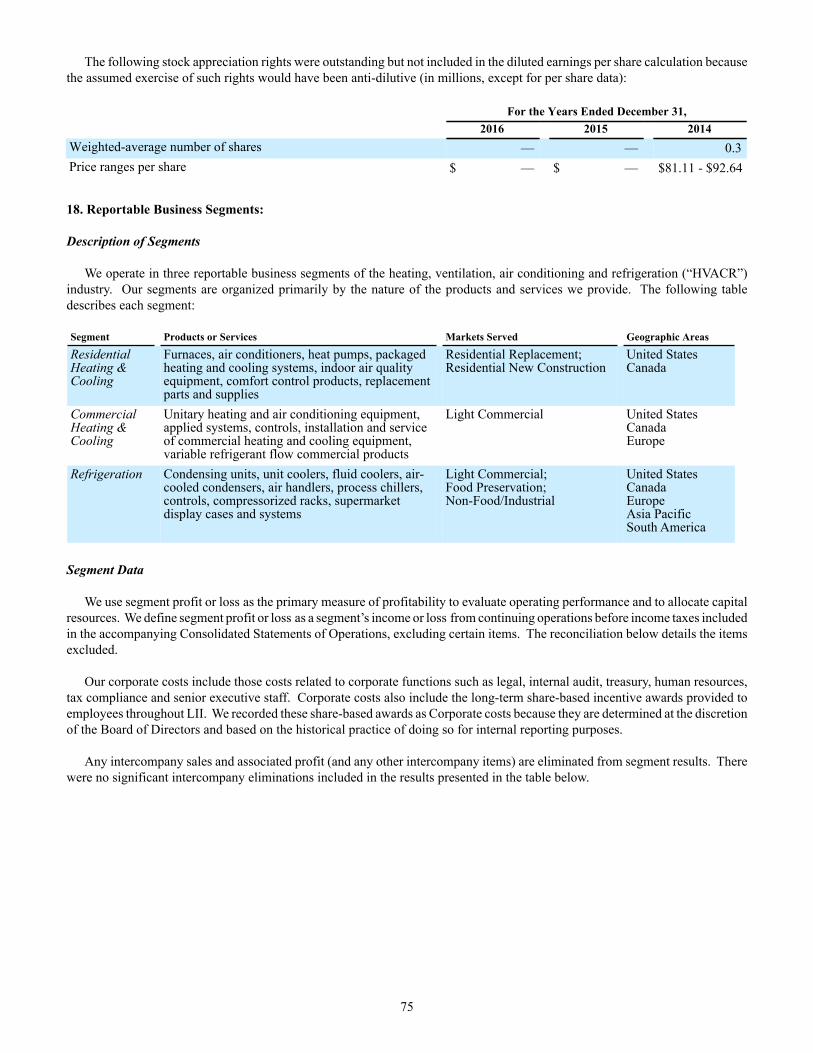
75
The following stock appreciation rights were outstanding but not included in the diluted earnings per share calculation because the assumed exercise of such rights would have been anti-dilutive (in millions, except for per share data):
For the Years Ended December 31, 2016 2015 2014Weighted-average number of shares — — 0.3Price ranges per share $ — $ — $81.11 - $92.64
18. Reportable Business Segments:
Description of Segments
We operate in three reportable business segments of the heating, ventilation, air conditioning and refrigeration (“HVACR”) industry. Our segments are organized primarily by the nature of the products and services we provide. The following table describes each segment:
Segment Products or Services Markets Served Geographic Areas
ResidentialHeating &Cooling
Furnaces, air conditioners, heat pumps, packagedheating and cooling systems, indoor air qualityequipment, comfort control products, replacementparts and supplies
Residential Replacement;Residential New Construction
United StatesCanada
CommercialHeating &Cooling
Unitary heating and air conditioning equipment,applied systems, controls, installation and serviceof commercial heating and cooling equipment,variable refrigerant flow commercial products
Light Commercial United StatesCanadaEurope
Refrigeration Condensing units, unit coolers, fluid coolers, air-cooled condensers, air handlers, process chillers,controls, compressorized racks, supermarketdisplay cases and systems
Light Commercial; Food Preservation; Non-Food/Industrial
United StatesCanadaEuropeAsia PacificSouth America
Segment Data
We use segment profit or loss as the primary measure of profitability to evaluate operating performance and to allocate capital resources. We define segment profit or loss as a segment’s income or loss from continuing operations before income taxes included in the accompanying Consolidated Statements of Operations, excluding certain items. The reconciliation below details the items excluded.
Our corporate costs include those costs related to corporate functions such as legal, internal audit, treasury, human resources, tax compliance and senior executive staff. Corporate costs also include the long-term share-based incentive awards provided to employees throughout LII. We recorded these share-based awards as Corporate costs because they are determined at the discretion of the Board of Directors and based on the historical practice of doing so for internal reporting purposes.
Any intercompany sales and associated profit (and any other intercompany items) are eliminated from segment results. There were no significant intercompany eliminations included in the results presented in the table below.
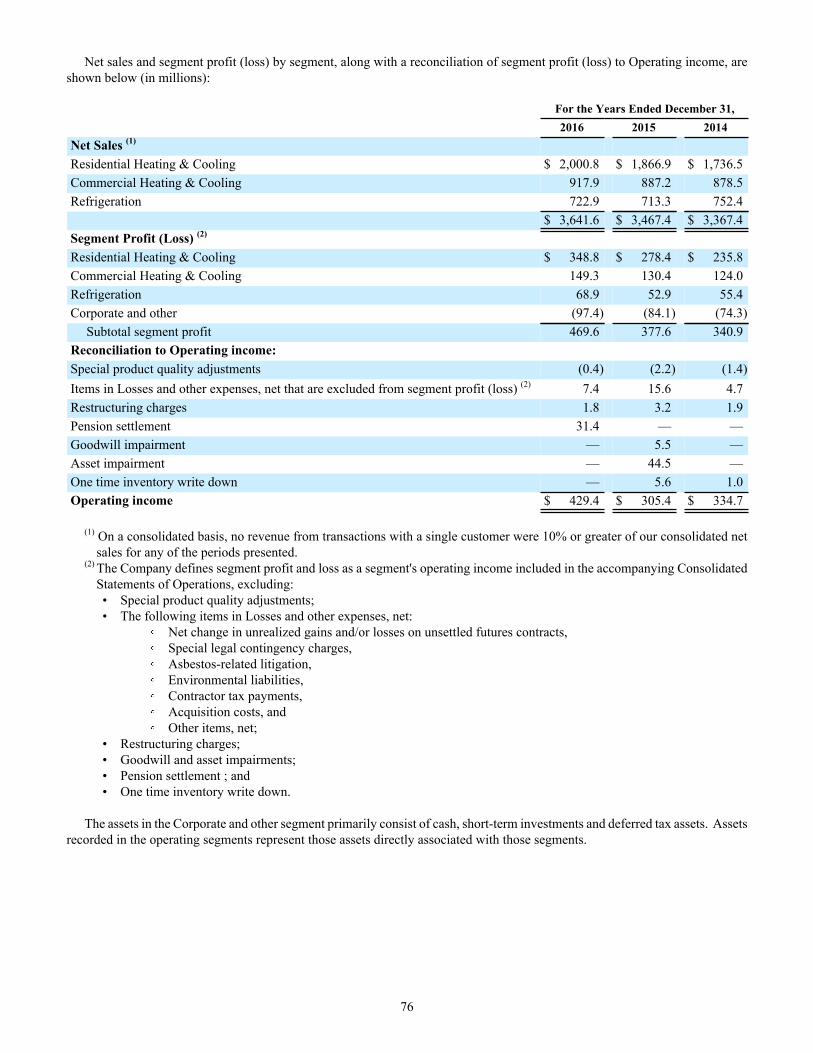
76
Net sales and segment profit (loss) by segment, along with a reconciliation of segment profit (loss) to Operating income, are shown below (in millions):
For the Years Ended December 31, 2016 2015 2014Net Sales (1) Residential Heating & Cooling $ 2,000.8 $ 1,866.9 $ 1,736.5Commercial Heating & Cooling 917.9 887.2 878.5Refrigeration 722.9 713.3 752.4
$ 3,641.6 $ 3,467.4 $ 3,367.4Segment Profit (Loss) (2) Residential Heating & Cooling $ 348.8 $ 278.4 $ 235.8Commercial Heating & Cooling 149.3 130.4 124.0Refrigeration 68.9 52.9 55.4Corporate and other (97.4) (84.1) (74.3)
Subtotal segment profit 469.6 377.6 340.9Reconciliation to Operating income:Special product quality adjustments (0.4) (2.2) (1.4)Items in Losses and other expenses, net that are excluded from segment profit (loss) (2) 7.4 15.6 4.7Restructuring charges 1.8 3.2 1.9Pension settlement 31.4 — —Goodwill impairment — 5.5 —Asset impairment — 44.5 —One time inventory write down — 5.6 1.0Operating income $ 429.4 $ 305.4 $ 334.7
(1) On a consolidated basis, no revenue from transactions with a single customer were 10% or greater of our consolidated net
sales for any of the periods presented.(2) The Company defines segment profit and loss as a segment's operating income included in the accompanying Consolidated
Statements of Operations, excluding:• Special product quality adjustments;• The following items in Losses and other expenses, net:
Net change in unrealized gains and/or losses on unsettled futures contracts, Special legal contingency charges, Asbestos-related litigation, Environmental liabilities, Contractor tax payments, Acquisition costs, andOther items, net;
• Restructuring charges;• Goodwill and asset impairments;• Pension settlement ; and• One time inventory write down.
The assets in the Corporate and other segment primarily consist of cash, short-term investments and deferred tax assets. Assets recorded in the operating segments represent those assets directly associated with those segments.
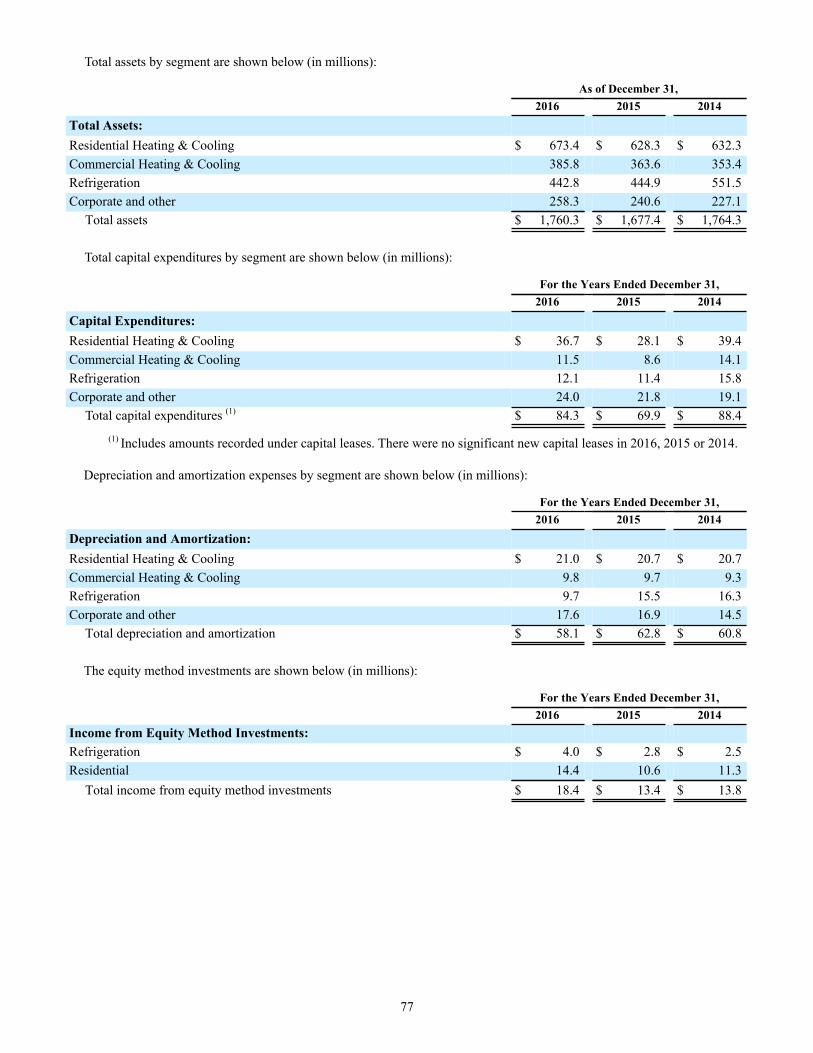
77
Total assets by segment are shown below (in millions):
As of December 31,2016 2015 2014
Total Assets:Residential Heating & Cooling $ 673.4 $ 628.3 $ 632.3Commercial Heating & Cooling 385.8 363.6 353.4Refrigeration 442.8 444.9 551.5Corporate and other 258.3 240.6 227.1
Total assets $ 1,760.3 $ 1,677.4 $ 1,764.3
Total capital expenditures by segment are shown below (in millions):
For the Years Ended December 31,2016 2015 2014
Capital Expenditures:Residential Heating & Cooling $ 36.7 $ 28.1 $ 39.4Commercial Heating & Cooling 11.5 8.6 14.1Refrigeration 12.1 11.4 15.8Corporate and other 24.0 21.8 19.1
Total capital expenditures (1) $ 84.3 $ 69.9 $ 88.4(1) Includes amounts recorded under capital leases. There were no significant new capital leases in 2016, 2015 or 2014.
Depreciation and amortization expenses by segment are shown below (in millions):
For the Years Ended December 31,2016 2015 2014
Depreciation and Amortization:Residential Heating & Cooling $ 21.0 $ 20.7 $ 20.7Commercial Heating & Cooling 9.8 9.7 9.3Refrigeration 9.7 15.5 16.3Corporate and other 17.6 16.9 14.5
Total depreciation and amortization $ 58.1 $ 62.8 $ 60.8
The equity method investments are shown below (in millions):
For the Years Ended December 31,2016 2015 2014
Income from Equity Method Investments:Refrigeration $ 4.0 $ 2.8 $ 2.5Residential 14.4 10.6 11.3
Total income from equity method investments $ 18.4 $ 13.4 $ 13.8
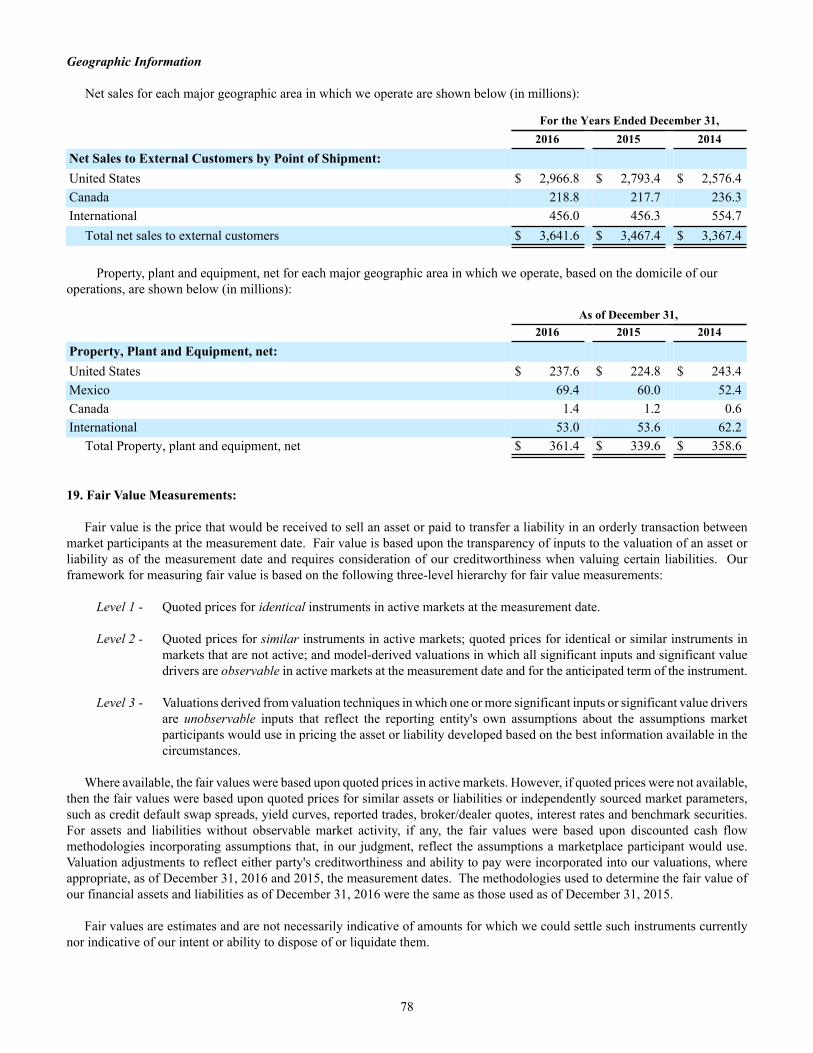
78
Geographic Information
Net sales for each major geographic area in which we operate are shown below (in millions):
For the Years Ended December 31,2016 2015 2014
Net Sales to External Customers by Point of Shipment:United States $ 2,966.8 $ 2,793.4 $ 2,576.4Canada 218.8 217.7 236.3International 456.0 456.3 554.7
Total net sales to external customers $ 3,641.6 $ 3,467.4 $ 3,367.4
Property, plant and equipment, net for each major geographic area in which we operate, based on the domicile of our operations, are shown below (in millions):
As of December 31,2016 2015 2014
Property, Plant and Equipment, net:United States $ 237.6 $ 224.8 $ 243.4Mexico 69.4 60.0 52.4Canada 1.4 1.2 0.6International 53.0 53.6 62.2
Total Property, plant and equipment, net $ 361.4 $ 339.6 $ 358.6
19. Fair Value Measurements:
Fair value is the price that would be received to sell an asset or paid to transfer a liability in an orderly transaction between market participants at the measurement date. Fair value is based upon the transparency of inputs to the valuation of an asset or liability as of the measurement date and requires consideration of our creditworthiness when valuing certain liabilities. Our framework for measuring fair value is based on the following three-level hierarchy for fair value measurements:
Level 1 - Quoted prices for identical instruments in active markets at the measurement date.
Level 2 - Quoted prices for similar instruments in active markets; quoted prices for identical or similar instruments in markets that are not active; and model-derived valuations in which all significant inputs and significant value drivers are observable in active markets at the measurement date and for the anticipated term of the instrument.
Level 3 - Valuations derived from valuation techniques in which one or more significant inputs or significant value drivers are unobservable inputs that reflect the reporting entity's own assumptions about the assumptions market participants would use in pricing the asset or liability developed based on the best information available in the circumstances.
Where available, the fair values were based upon quoted prices in active markets. However, if quoted prices were not available, then the fair values were based upon quoted prices for similar assets or liabilities or independently sourced market parameters, such as credit default swap spreads, yield curves, reported trades, broker/dealer quotes, interest rates and benchmark securities. For assets and liabilities without observable market activity, if any, the fair values were based upon discounted cash flow methodologies incorporating assumptions that, in our judgment, reflect the assumptions a marketplace participant would use. Valuation adjustments to reflect either party's creditworthiness and ability to pay were incorporated into our valuations, where appropriate, as of December 31, 2016 and 2015, the measurement dates. The methodologies used to determine the fair value of our financial assets and liabilities as of December 31, 2016 were the same as those used as of December 31, 2015.
Fair values are estimates and are not necessarily indicative of amounts for which we could settle such instruments currently nor indicative of our intent or ability to dispose of or liquidate them.
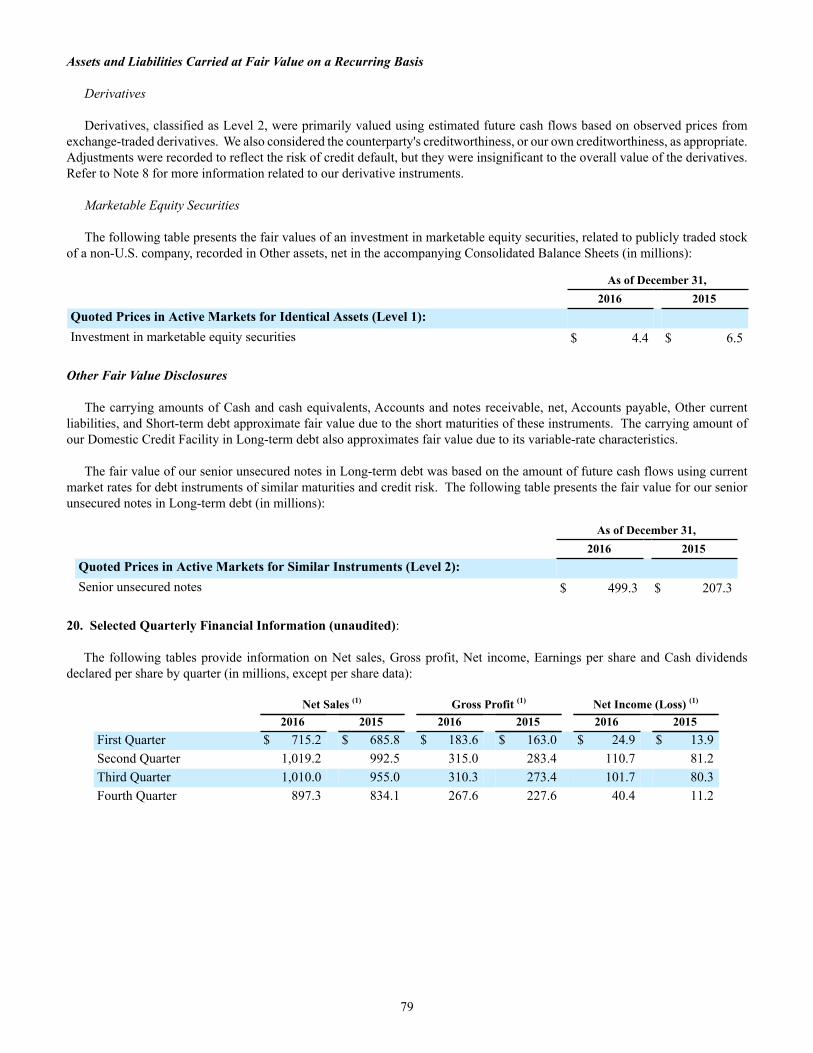
79
Assets and Liabilities Carried at Fair Value on a Recurring Basis
Derivatives
Derivatives, classified as Level 2, were primarily valued using estimated future cash flows based on observed prices from exchange-traded derivatives. We also considered the counterparty's creditworthiness, or our own creditworthiness, as appropriate. Adjustments were recorded to reflect the risk of credit default, but they were insignificant to the overall value of the derivatives. Refer to Note 8 for more information related to our derivative instruments.
Marketable Equity Securities
The following table presents the fair values of an investment in marketable equity securities, related to publicly traded stock of a non-U.S. company, recorded in Other assets, net in the accompanying Consolidated Balance Sheets (in millions):
As of December 31, 2016 2015Quoted Prices in Active Markets for Identical Assets (Level 1):Investment in marketable equity securities $ 4.4 $ 6.5
Other Fair Value Disclosures
The carrying amounts of Cash and cash equivalents, Accounts and notes receivable, net, Accounts payable, Other current liabilities, and Short-term debt approximate fair value due to the short maturities of these instruments. The carrying amount of our Domestic Credit Facility in Long-term debt also approximates fair value due to its variable-rate characteristics.
The fair value of our senior unsecured notes in Long-term debt was based on the amount of future cash flows using current market rates for debt instruments of similar maturities and credit risk. The following table presents the fair value for our senior unsecured notes in Long-term debt (in millions):
As of December 31,2016 2015
Quoted Prices in Active Markets for Similar Instruments (Level 2):Senior unsecured notes $ 499.3 $ 207.3
20. Selected Quarterly Financial Information (unaudited):
The following tables provide information on Net sales, Gross profit, Net income, Earnings per share and Cash dividends declared per share by quarter (in millions, except per share data):
Net Sales (1) Gross Profit (1) Net Income (Loss) (1)
2016 2015 2016 2015 2016 2015First Quarter $ 715.2 $ 685.8 $ 183.6 $ 163.0 $ 24.9 $ 13.9Second Quarter 1,019.2 992.5 315.0 283.4 110.7 81.2Third Quarter 1,010.0 955.0 310.3 273.4 101.7 80.3Fourth Quarter 897.3 834.1 267.6 227.6 40.4 11.2
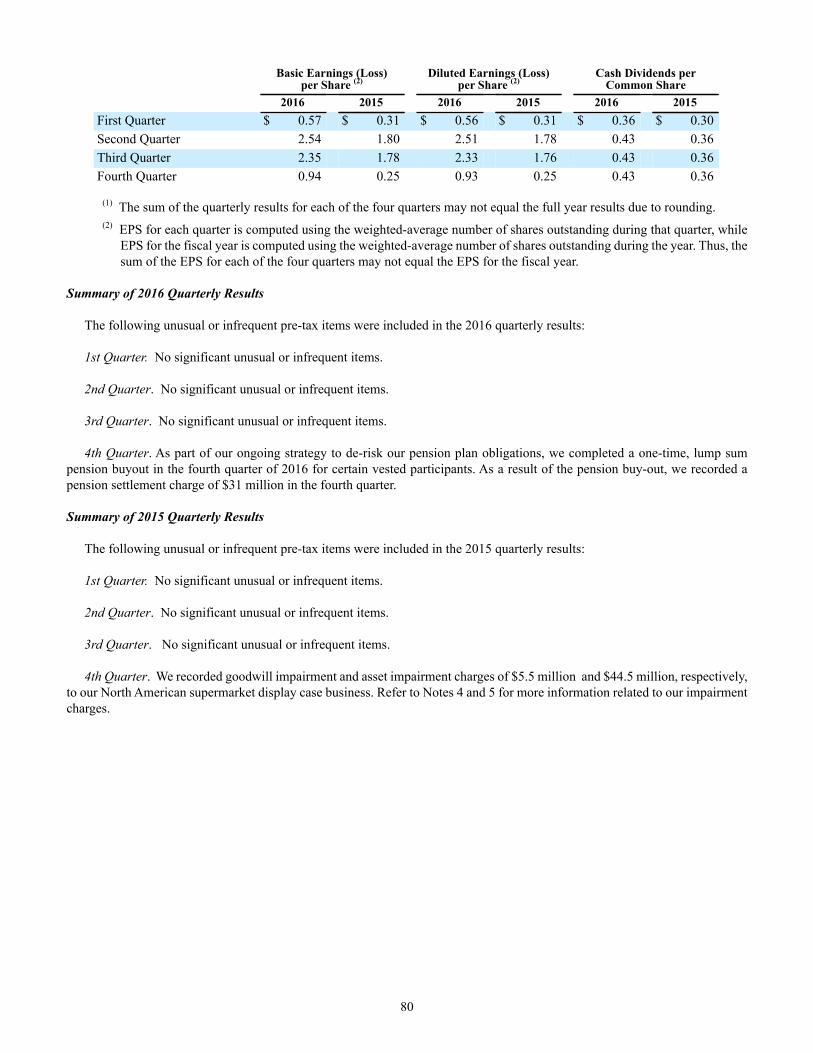
80
Basic Earnings (Loss) per Share (2)
Diluted Earnings (Loss) per Share (2)
Cash Dividends perCommon Share
2016 2015 2016 2015 2016 2015First Quarter $ 0.57 $ 0.31 $ 0.56 $ 0.31 $ 0.36 $ 0.30Second Quarter 2.54 1.80 2.51 1.78 0.43 0.36Third Quarter 2.35 1.78 2.33 1.76 0.43 0.36Fourth Quarter 0.94 0.25 0.93 0.25 0.43 0.36
(1) The sum of the quarterly results for each of the four quarters may not equal the full year results due to rounding.(2) EPS for each quarter is computed using the weighted-average number of shares outstanding during that quarter, while
EPS for the fiscal year is computed using the weighted-average number of shares outstanding during the year. Thus, the sum of the EPS for each of the four quarters may not equal the EPS for the fiscal year.
Summary of 2016 Quarterly Results
The following unusual or infrequent pre-tax items were included in the 2016 quarterly results:
1st Quarter. No significant unusual or infrequent items.
2nd Quarter. No significant unusual or infrequent items.
3rd Quarter. No significant unusual or infrequent items.
4th Quarter. As part of our ongoing strategy to de-risk our pension plan obligations, we completed a one-time, lump sum pension buyout in the fourth quarter of 2016 for certain vested participants. As a result of the pension buy-out, we recorded a pension settlement charge of $31 million in the fourth quarter.
Summary of 2015 Quarterly Results
The following unusual or infrequent pre-tax items were included in the 2015 quarterly results:
1st Quarter. No significant unusual or infrequent items.
2nd Quarter. No significant unusual or infrequent items.
3rd Quarter. No significant unusual or infrequent items.
4th Quarter. We recorded goodwill impairment and asset impairment charges of $5.5 million and $44.5 million, respectively, to our North American supermarket display case business. Refer to Notes 4 and 5 for more information related to our impairment charges.
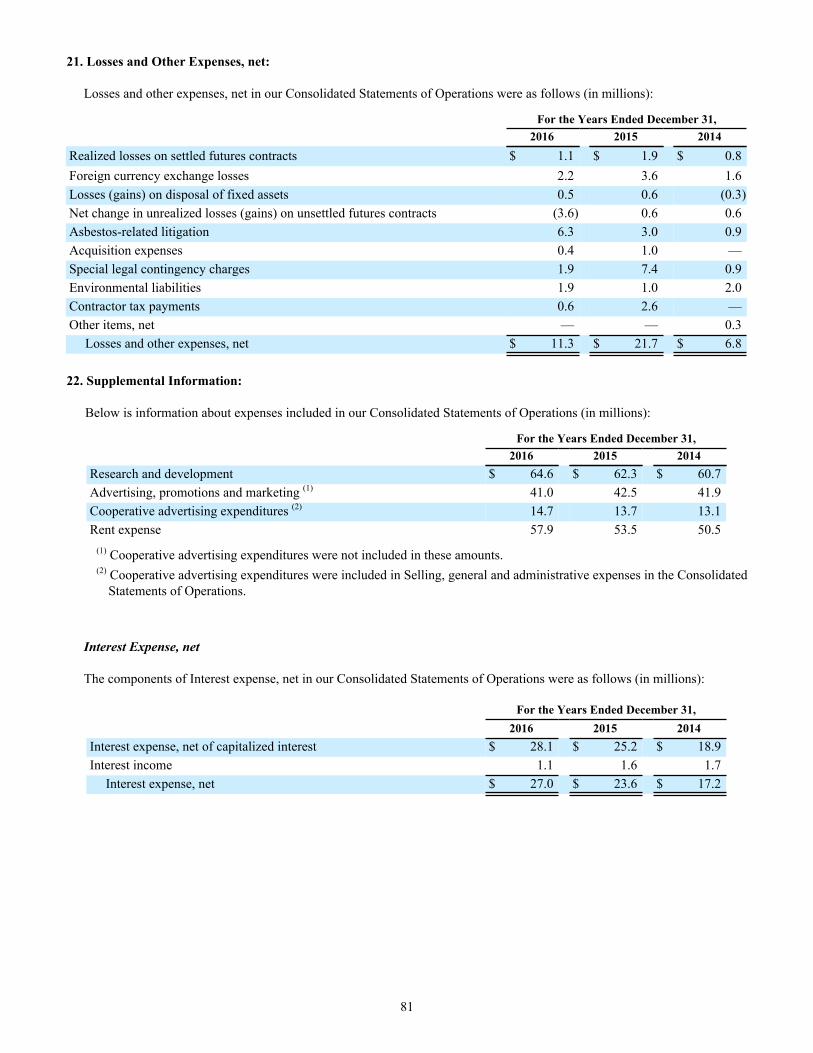
81
21. Losses and Other Expenses, net:
Losses and other expenses, net in our Consolidated Statements of Operations were as follows (in millions):
For the Years Ended December 31,2016 2015 2014
Realized losses on settled futures contracts $ 1.1 $ 1.9 $ 0.8Foreign currency exchange losses 2.2 3.6 1.6Losses (gains) on disposal of fixed assets 0.5 0.6 (0.3)Net change in unrealized losses (gains) on unsettled futures contracts (3.6) 0.6 0.6Asbestos-related litigation 6.3 3.0 0.9Acquisition expenses 0.4 1.0 —Special legal contingency charges 1.9 7.4 0.9Environmental liabilities 1.9 1.0 2.0Contractor tax payments 0.6 2.6 —Other items, net — — 0.3
Losses and other expenses, net $ 11.3 $ 21.7 $ 6.8
22. Supplemental Information:
Below is information about expenses included in our Consolidated Statements of Operations (in millions):
For the Years Ended December 31,2016 2015 2014
Research and development $ 64.6 $ 62.3 $ 60.7Advertising, promotions and marketing (1) 41.0 42.5 41.9Cooperative advertising expenditures (2) 14.7 13.7 13.1Rent expense 57.9 53.5 50.5
(1) Cooperative advertising expenditures were not included in these amounts.(2) Cooperative advertising expenditures were included in Selling, general and administrative expenses in the Consolidated
Statements of Operations.
Interest Expense, net
The components of Interest expense, net in our Consolidated Statements of Operations were as follows (in millions):
For the Years Ended December 31,2016 2015 2014
Interest expense, net of capitalized interest $ 28.1 $ 25.2 $ 18.9Interest income 1.1 1.6 1.7
Interest expense, net $ 27.0 $ 23.6 $ 17.2
82
23. Condensed Consolidating Financial Statements:
The Company’s senior unsecured notes are unconditionally guaranteed by certain of the Company’s subsidiaries (the “Guarantor Subsidiaries”) and are not secured by our other subsidiaries (the “Non-Guarantor Subsidiaries”). The Guarantor Subsidiaries are 100% owned, all guarantees are full and unconditional, and all guarantees are joint and several. As a result of the guarantee arrangements, we are required to present condensed consolidating financial statements.
The condensed consolidating financial statements reflect the investments in subsidiaries of the Company using the equity method of accounting. The principal elimination entries eliminate investments in subsidiaries and intercompany balances and transactions.
Condensed consolidating financial statements of the Company, its Guarantor Subsidiaries and Non-Guarantor Subsidiaries as of December 31, 2016 and December 31, 2015 and for the years ended December 31, 2016, 2015 and 2014 are shown on the following pages.
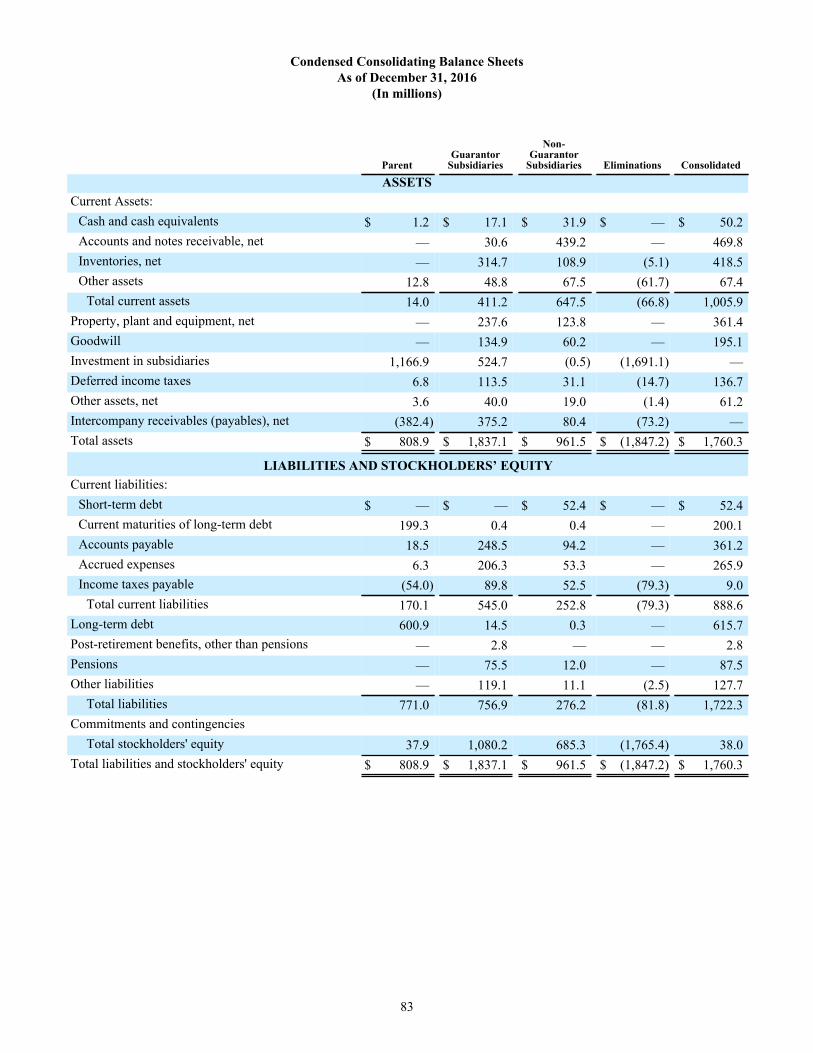
83
Condensed Consolidating Balance SheetsAs of December 31, 2016
(In millions)
ParentGuarantor
Subsidiaries
Non-Guarantor
Subsidiaries Eliminations Consolidated
ASSETSCurrent Assets:
Cash and cash equivalents $ 1.2 $ 17.1 $ 31.9 $ — $ 50.2Accounts and notes receivable, net — 30.6 439.2 — 469.8Inventories, net — 314.7 108.9 (5.1) 418.5Other assets 12.8 48.8 67.5 (61.7) 67.4
Total current assets 14.0 411.2 647.5 (66.8) 1,005.9Property, plant and equipment, net — 237.6 123.8 — 361.4Goodwill — 134.9 60.2 — 195.1Investment in subsidiaries 1,166.9 524.7 (0.5) (1,691.1) —Deferred income taxes 6.8 113.5 31.1 (14.7) 136.7Other assets, net 3.6 40.0 19.0 (1.4) 61.2Intercompany receivables (payables), net (382.4) 375.2 80.4 (73.2) —Total assets $ 808.9 $ 1,837.1 $ 961.5 $ (1,847.2) $ 1,760.3
LIABILITIES AND STOCKHOLDERS’ EQUITYCurrent liabilities:
Short-term debt $ — $ — $ 52.4 $ — $ 52.4Current maturities of long-term debt 199.3 0.4 0.4 — 200.1Accounts payable 18.5 248.5 94.2 — 361.2Accrued expenses 6.3 206.3 53.3 — 265.9Income taxes payable (54.0) 89.8 52.5 (79.3) 9.0
Total current liabilities 170.1 545.0 252.8 (79.3) 888.6Long-term debt 600.9 14.5 0.3 — 615.7Post-retirement benefits, other than pensions — 2.8 — — 2.8Pensions — 75.5 12.0 — 87.5Other liabilities — 119.1 11.1 (2.5) 127.7
Total liabilities 771.0 756.9 276.2 (81.8) 1,722.3Commitments and contingencies
Total stockholders' equity 37.9 1,080.2 685.3 (1,765.4) 38.0Total liabilities and stockholders' equity $ 808.9 $ 1,837.1 $ 961.5 $ (1,847.2) $ 1,760.3
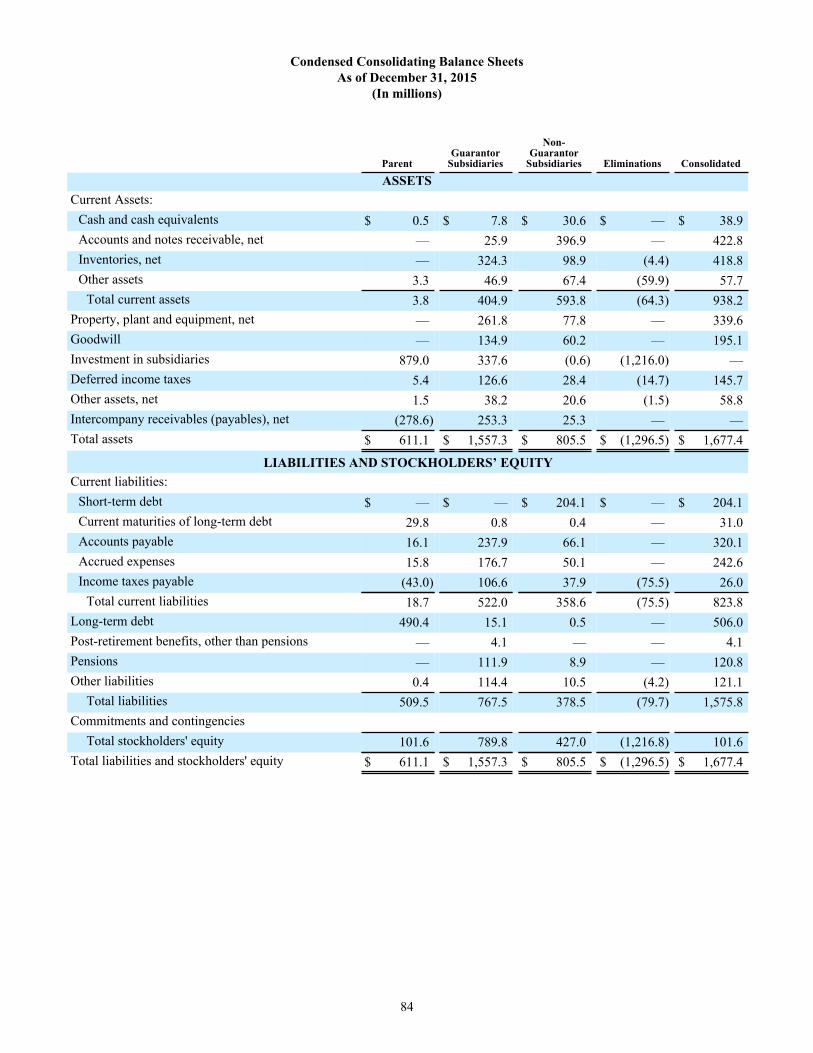
84
Condensed Consolidating Balance SheetsAs of December 31, 2015
(In millions)
ParentGuarantor
Subsidiaries
Non-Guarantor
Subsidiaries Eliminations Consolidated
ASSETSCurrent Assets:
Cash and cash equivalents $ 0.5 $ 7.8 $ 30.6 $ — $ 38.9Accounts and notes receivable, net — 25.9 396.9 — 422.8Inventories, net — 324.3 98.9 (4.4) 418.8Other assets 3.3 46.9 67.4 (59.9) 57.7
Total current assets 3.8 404.9 593.8 (64.3) 938.2Property, plant and equipment, net — 261.8 77.8 — 339.6Goodwill — 134.9 60.2 — 195.1Investment in subsidiaries 879.0 337.6 (0.6) (1,216.0) —Deferred income taxes 5.4 126.6 28.4 (14.7) 145.7Other assets, net 1.5 38.2 20.6 (1.5) 58.8Intercompany receivables (payables), net (278.6) 253.3 25.3 — —Total assets $ 611.1 $ 1,557.3 $ 805.5 $ (1,296.5) $ 1,677.4
LIABILITIES AND STOCKHOLDERS’ EQUITYCurrent liabilities:
Short-term debt $ — $ — $ 204.1 $ — $ 204.1Current maturities of long-term debt 29.8 0.8 0.4 — 31.0Accounts payable 16.1 237.9 66.1 — 320.1Accrued expenses 15.8 176.7 50.1 — 242.6Income taxes payable (43.0) 106.6 37.9 (75.5) 26.0
Total current liabilities 18.7 522.0 358.6 (75.5) 823.8Long-term debt 490.4 15.1 0.5 — 506.0Post-retirement benefits, other than pensions — 4.1 — — 4.1Pensions — 111.9 8.9 — 120.8Other liabilities 0.4 114.4 10.5 (4.2) 121.1
Total liabilities 509.5 767.5 378.5 (79.7) 1,575.8Commitments and contingencies
Total stockholders' equity 101.6 789.8 427.0 (1,216.8) 101.6Total liabilities and stockholders' equity $ 611.1 $ 1,557.3 $ 805.5 $ (1,296.5) $ 1,677.4
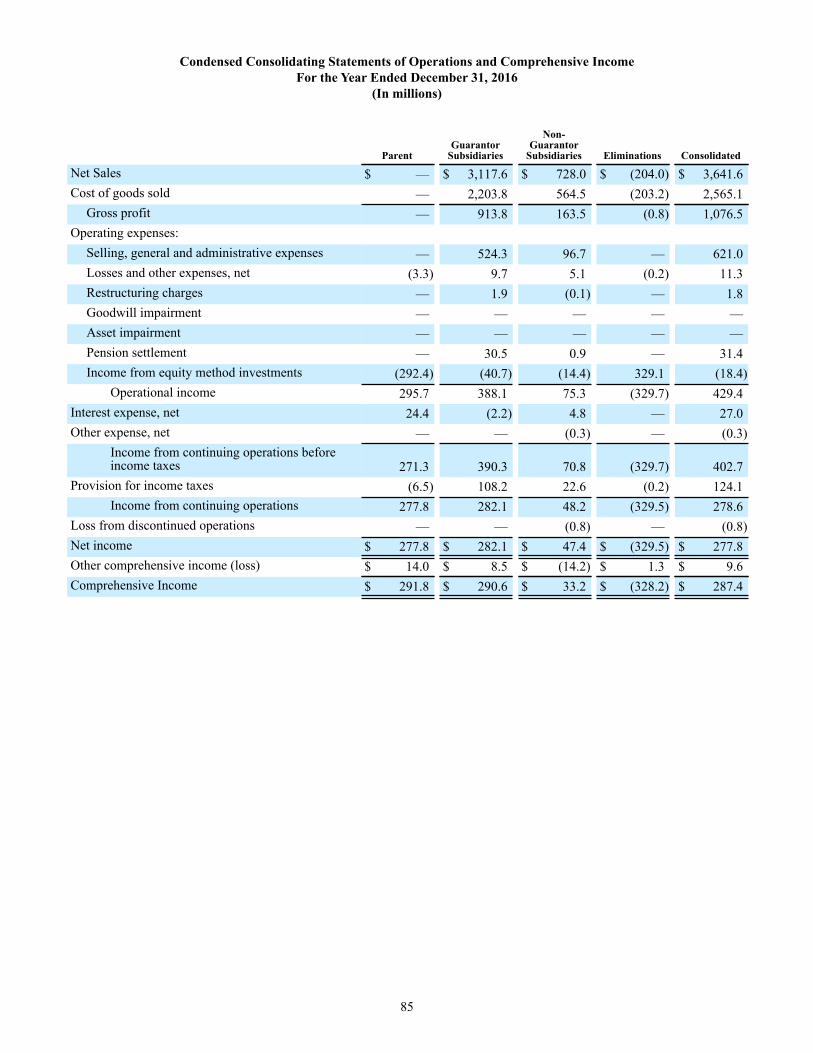
85
Condensed Consolidating Statements of Operations and Comprehensive IncomeFor the Year Ended December 31, 2016
(In millions)
ParentGuarantor
Subsidiaries
Non-Guarantor
Subsidiaries Eliminations Consolidated
Net Sales $ — $ 3,117.6 $ 728.0 $ (204.0) $ 3,641.6Cost of goods sold — 2,203.8 564.5 (203.2) 2,565.1
Gross profit — 913.8 163.5 (0.8) 1,076.5Operating expenses:
Selling, general and administrative expenses — 524.3 96.7 — 621.0Losses and other expenses, net (3.3) 9.7 5.1 (0.2) 11.3Restructuring charges — 1.9 (0.1) — 1.8Goodwill impairment — — — — —Asset impairment — — — — —Pension settlement — 30.5 0.9 — 31.4Income from equity method investments (292.4) (40.7) (14.4) 329.1 (18.4)
Operational income 295.7 388.1 75.3 (329.7) 429.4Interest expense, net 24.4 (2.2) 4.8 — 27.0Other expense, net — — (0.3) — (0.3)
Income from continuing operations beforeincome taxes 271.3 390.3 70.8 (329.7) 402.7
Provision for income taxes (6.5) 108.2 22.6 (0.2) 124.1 Income from continuing operations 277.8 282.1 48.2 (329.5) 278.6Loss from discontinued operations — — (0.8) — (0.8)Net income $ 277.8 $ 282.1 $ 47.4 $ (329.5) $ 277.8Other comprehensive income (loss) $ 14.0 $ 8.5 $ (14.2) $ 1.3 $ 9.6Comprehensive Income $ 291.8 $ 290.6 $ 33.2 $ (328.2) $ 287.4
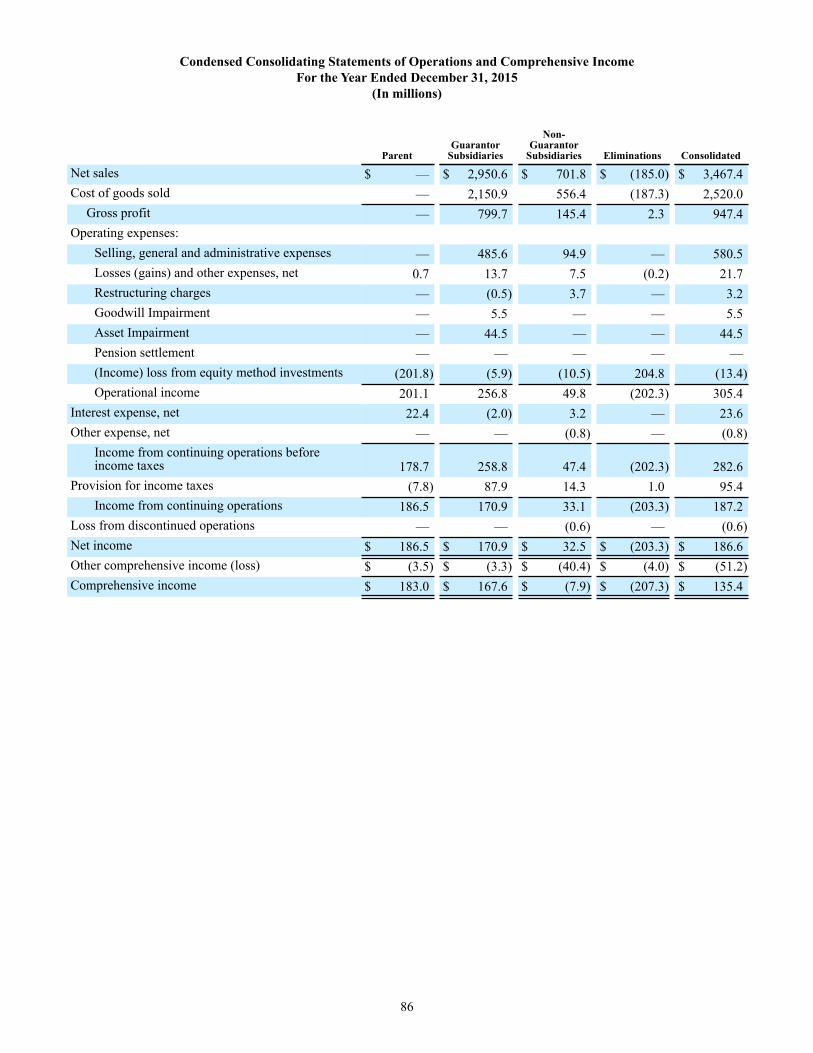
86
Condensed Consolidating Statements of Operations and Comprehensive IncomeFor the Year Ended December 31, 2015
(In millions)
ParentGuarantor
Subsidiaries
Non-Guarantor
Subsidiaries Eliminations Consolidated
Net sales $ — $ 2,950.6 $ 701.8 $ (185.0) $ 3,467.4Cost of goods sold — 2,150.9 556.4 (187.3) 2,520.0
Gross profit — 799.7 145.4 2.3 947.4Operating expenses:
Selling, general and administrative expenses — 485.6 94.9 — 580.5Losses (gains) and other expenses, net 0.7 13.7 7.5 (0.2) 21.7Restructuring charges — (0.5) 3.7 — 3.2Goodwill Impairment — 5.5 — — 5.5Asset Impairment — 44.5 — — 44.5Pension settlement — — — — —(Income) loss from equity method investments (201.8) (5.9) (10.5) 204.8 (13.4)Operational income 201.1 256.8 49.8 (202.3) 305.4
Interest expense, net 22.4 (2.0) 3.2 — 23.6Other expense, net — — (0.8) — (0.8)
Income from continuing operations beforeincome taxes 178.7 258.8 47.4 (202.3) 282.6
Provision for income taxes (7.8) 87.9 14.3 1.0 95.4Income from continuing operations 186.5 170.9 33.1 (203.3) 187.2
Loss from discontinued operations — — (0.6) — (0.6)Net income $ 186.5 $ 170.9 $ 32.5 $ (203.3) $ 186.6Other comprehensive income (loss) $ (3.5) $ (3.3) $ (40.4) $ (4.0) $ (51.2)Comprehensive income $ 183.0 $ 167.6 $ (7.9) $ (207.3) $ 135.4
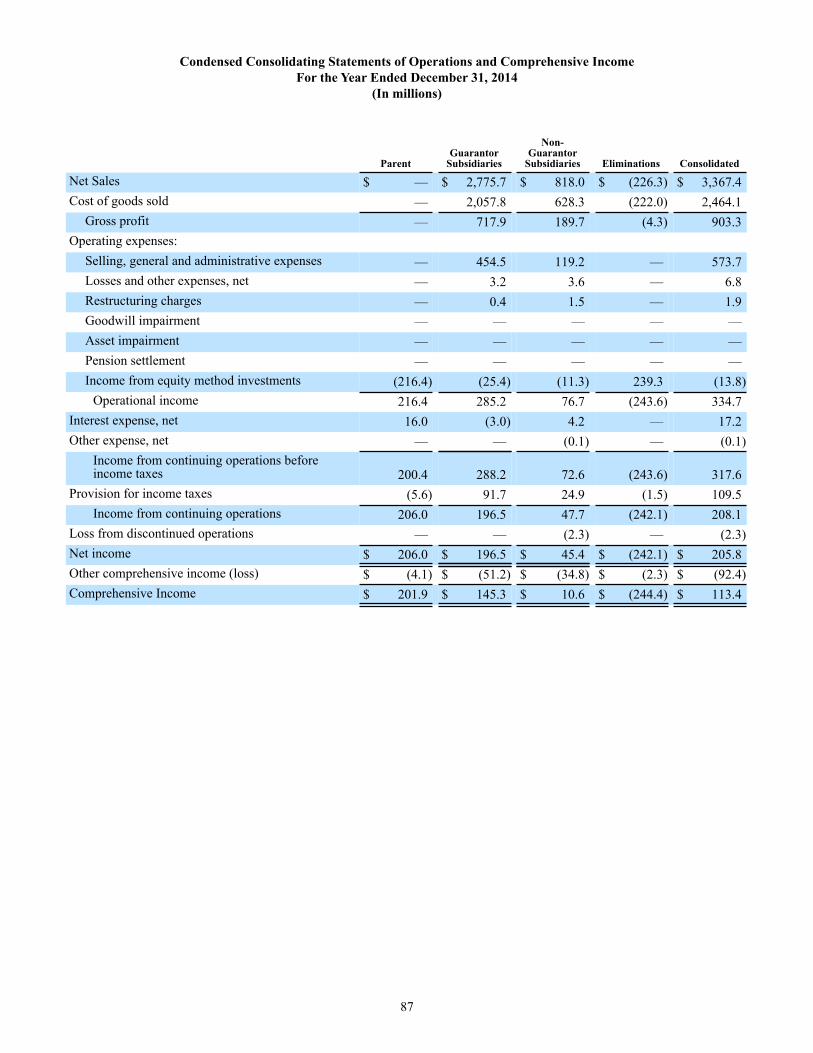
87
Condensed Consolidating Statements of Operations and Comprehensive IncomeFor the Year Ended December 31, 2014
(In millions)
ParentGuarantor
Subsidiaries
Non-Guarantor
Subsidiaries Eliminations Consolidated
Net Sales $ — $ 2,775.7 $ 818.0 $ (226.3) $ 3,367.4Cost of goods sold — 2,057.8 628.3 (222.0) 2,464.1
Gross profit — 717.9 189.7 (4.3) 903.3Operating expenses:
Selling, general and administrative expenses — 454.5 119.2 — 573.7Losses and other expenses, net — 3.2 3.6 — 6.8Restructuring charges — 0.4 1.5 — 1.9Goodwill impairment — — — — —Asset impairment — — — — —Pension settlement — — — — —Income from equity method investments (216.4) (25.4) (11.3) 239.3 (13.8)
Operational income 216.4 285.2 76.7 (243.6) 334.7Interest expense, net 16.0 (3.0) 4.2 — 17.2Other expense, net — — (0.1) — (0.1)
Income from continuing operations beforeincome taxes 200.4 288.2 72.6 (243.6) 317.6
Provision for income taxes (5.6) 91.7 24.9 (1.5) 109.5Income from continuing operations 206.0 196.5 47.7 (242.1) 208.1
Loss from discontinued operations — — (2.3) — (2.3)Net income $ 206.0 $ 196.5 $ 45.4 $ (242.1) $ 205.8Other comprehensive income (loss) $ (4.1) $ (51.2) $ (34.8) $ (2.3) $ (92.4)Comprehensive Income $ 201.9 $ 145.3 $ 10.6 $ (244.4) $ 113.4
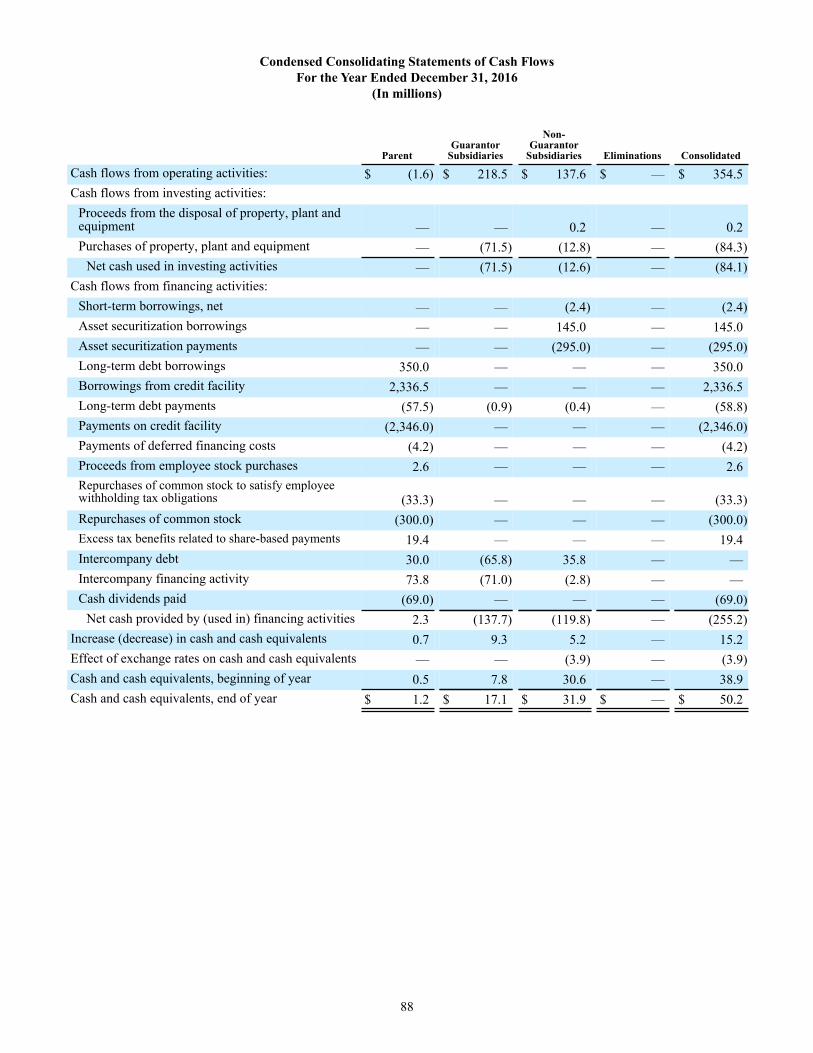
88
Condensed Consolidating Statements of Cash FlowsFor the Year Ended December 31, 2016
(In millions)
ParentGuarantor
Subsidiaries
Non-Guarantor
Subsidiaries Eliminations Consolidated
Cash flows from operating activities: $ (1.6) $ 218.5 $ 137.6 $ — $ 354.5Cash flows from investing activities:
Proceeds from the disposal of property, plant andequipment — — 0.2 — 0.2Purchases of property, plant and equipment — (71.5) (12.8) — (84.3)
Net cash used in investing activities — (71.5) (12.6) — (84.1)Cash flows from financing activities:
Short-term borrowings, net — — (2.4) — (2.4)Asset securitization borrowings — — 145.0 — 145.0Asset securitization payments — — (295.0) — (295.0)Long-term debt borrowings 350.0 — — — 350.0Borrowings from credit facility 2,336.5 — — — 2,336.5Long-term debt payments (57.5) (0.9) (0.4) — (58.8)Payments on credit facility (2,346.0) — — — (2,346.0)Payments of deferred financing costs (4.2) — — — (4.2)Proceeds from employee stock purchases 2.6 — — — 2.6Repurchases of common stock to satisfy employeewithholding tax obligations (33.3) — — — (33.3)Repurchases of common stock (300.0) — — — (300.0)Excess tax benefits related to share-based payments 19.4 — — — 19.4Intercompany debt 30.0 (65.8) 35.8 — —Intercompany financing activity 73.8 (71.0) (2.8) — —Cash dividends paid (69.0) — — — (69.0)
Net cash provided by (used in) financing activities 2.3 (137.7) (119.8) — (255.2)Increase (decrease) in cash and cash equivalents 0.7 9.3 5.2 — 15.2Effect of exchange rates on cash and cash equivalents — — (3.9) — (3.9)Cash and cash equivalents, beginning of year 0.5 7.8 30.6 — 38.9Cash and cash equivalents, end of year $ 1.2 $ 17.1 $ 31.9 $ — $ 50.2
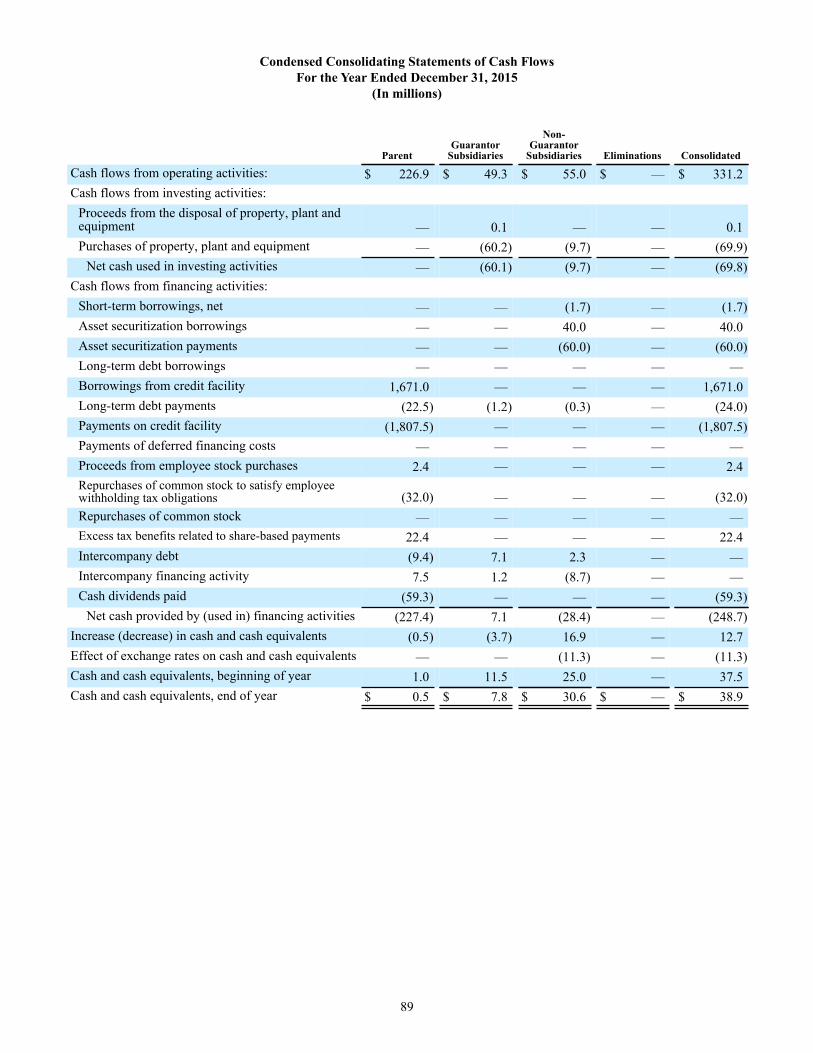
89
Condensed Consolidating Statements of Cash FlowsFor the Year Ended December 31, 2015
(In millions)
ParentGuarantor
Subsidiaries
Non-Guarantor
Subsidiaries Eliminations Consolidated
Cash flows from operating activities: $ 226.9 $ 49.3 $ 55.0 $ — $ 331.2Cash flows from investing activities:
Proceeds from the disposal of property, plant andequipment — 0.1 — — 0.1Purchases of property, plant and equipment — (60.2) (9.7) — (69.9)
Net cash used in investing activities — (60.1) (9.7) — (69.8)Cash flows from financing activities:
Short-term borrowings, net — — (1.7) — (1.7)Asset securitization borrowings — — 40.0 — 40.0Asset securitization payments — — (60.0) — (60.0)Long-term debt borrowings — — — — —Borrowings from credit facility 1,671.0 — — — 1,671.0Long-term debt payments (22.5) (1.2) (0.3) — (24.0)Payments on credit facility (1,807.5) — — — (1,807.5)Payments of deferred financing costs — — — — —Proceeds from employee stock purchases 2.4 — — — 2.4Repurchases of common stock to satisfy employeewithholding tax obligations (32.0) — — — (32.0)Repurchases of common stock — — — — —Excess tax benefits related to share-based payments 22.4 — — — 22.4Intercompany debt (9.4) 7.1 2.3 — —Intercompany financing activity 7.5 1.2 (8.7) — —Cash dividends paid (59.3) — — — (59.3)
Net cash provided by (used in) financing activities (227.4) 7.1 (28.4) — (248.7)Increase (decrease) in cash and cash equivalents (0.5) (3.7) 16.9 — 12.7Effect of exchange rates on cash and cash equivalents — — (11.3) — (11.3)Cash and cash equivalents, beginning of year 1.0 11.5 25.0 — 37.5Cash and cash equivalents, end of year $ 0.5 $ 7.8 $ 30.6 $ — $ 38.9
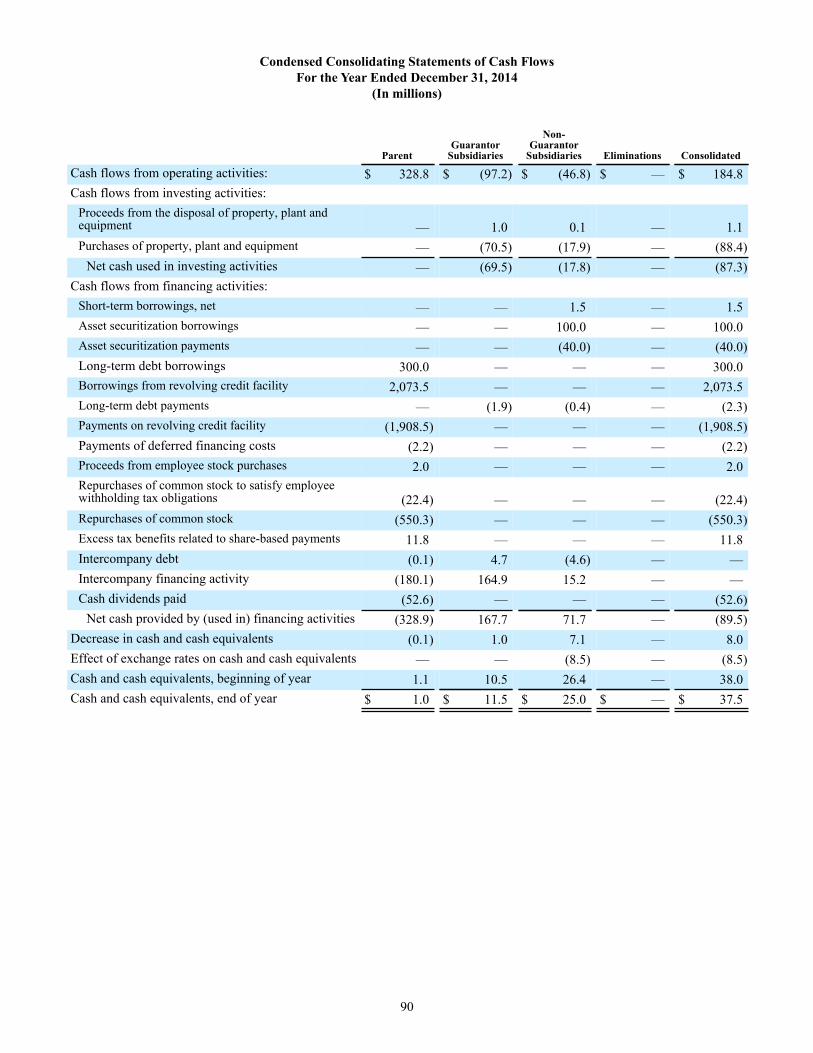
90
Condensed Consolidating Statements of Cash FlowsFor the Year Ended December 31, 2014
(In millions)
ParentGuarantor
Subsidiaries
Non-Guarantor
Subsidiaries Eliminations Consolidated
Cash flows from operating activities: $ 328.8 $ (97.2) $ (46.8) $ — $ 184.8Cash flows from investing activities:
Proceeds from the disposal of property, plant andequipment — 1.0 0.1 — 1.1Purchases of property, plant and equipment — (70.5) (17.9) — (88.4)
Net cash used in investing activities — (69.5) (17.8) — (87.3)Cash flows from financing activities:
Short-term borrowings, net — — 1.5 — 1.5Asset securitization borrowings — — 100.0 — 100.0Asset securitization payments — — (40.0) — (40.0)Long-term debt borrowings 300.0 — — — 300.0Borrowings from revolving credit facility 2,073.5 — — — 2,073.5Long-term debt payments — (1.9) (0.4) — (2.3)Payments on revolving credit facility (1,908.5) — — — (1,908.5)Payments of deferred financing costs (2.2) — — — (2.2)Proceeds from employee stock purchases 2.0 — — — 2.0Repurchases of common stock to satisfy employeewithholding tax obligations (22.4) — — — (22.4)Repurchases of common stock (550.3) — — — (550.3)Excess tax benefits related to share-based payments 11.8 — — — 11.8Intercompany debt (0.1) 4.7 (4.6) — —Intercompany financing activity (180.1) 164.9 15.2 — —Cash dividends paid (52.6) — — — (52.6)
Net cash provided by (used in) financing activities (328.9) 167.7 71.7 — (89.5)Decrease in cash and cash equivalents (0.1) 1.0 7.1 — 8.0Effect of exchange rates on cash and cash equivalents — — (8.5) — (8.5)Cash and cash equivalents, beginning of year 1.1 10.5 26.4 — 38.0Cash and cash equivalents, end of year $ 1.0 $ 11.5 $ 25.0 $ — $ 37.5
91
Item 9. Changes in and Disagreements with Accountants on Accounting and Financial Disclosure
None.
Item 9A. Controls and Procedures
Disclosure Controls and Procedures
As required by Rule 13a-15 under the Exchange Act, we carried out an evaluation, under the supervision and with the participation of our current management, including our Chief Executive Officer and Chief Financial Officer, of the effectiveness of our disclosure controls and procedures as of the end of the period covered by this report. There are inherent limitations to the effectiveness of any system of disclosure controls and procedures, including the possibility of human error and circumvention or overriding of the controls and procedures. Accordingly, even effective disclosure controls and procedures can only provide reasonable assurance of achieving their control objectives. Based on that evaluation, our Chief Executive Officer and Chief Financial Officer have concluded that, as of December 31, 2016, our disclosure controls and procedures were effective to provide reasonable assurance that information required to be disclosed by us in the reports we file or submit under the Exchange Act is recorded, processed, summarized and reported, within the time periods specified in the applicable rules and forms, and that such information is accumulated and communicated to management, including our Chief Executive Officer and Chief Financial Officer, to allow timely decisions regarding required disclosure.
Management's Annual Report on Internal Control Over Financial Reporting
See “Management's Report on Internal Control Over Financial Reporting” included in Item 8 “Financial Statements and Supplementary Data.”
Attestation Report of the Independent Registered Public Accounting Firm
See “Report of Independent Registered Public Accounting Firm” included in Item 8 “Financial Statements and Supplementary Data.”
Changes in Internal Control Over Financial Reporting
There were no changes during the fourth quarter ended December 31, 2016 in our internal control over financial reporting that have materially affected, or are reasonably likely to materially affect, our internal control over financial reporting.
Item 9B. Other Information
None.
PART III
Item 10. Directors, Executive Officers and Corporate Governance
The information in the sections of our 2017 Proxy Statement captioned “Proposal 1: Election of Directors, “Section 16(a) Beneficial Ownership Reporting Compliance,” and “Corporate Governance” is incorporated in this Item 10 by reference. Part I, Item 1 “Business - Executive Officers of the Company” of this Annual Report on Form 10-K identifies our executive officers and is incorporated in this Item 10 by reference.
Item 11. Executive Compensation
The sections of our 2017 Proxy Statement captioned “Executive Compensation,” “Director Compensation,” “Corporate Governance - Compensation and Human Resources Committee” and “Certain Relationships and Related Party Transactions - Compensation Committee Interlocks and Insider Participation” are incorporated in this Item 11 by reference.
92
Item 12. Security Ownership of Certain Beneficial Owners and Management and Related Stockholder Matters
The sections of our 2017 Proxy Statement captioned “Equity Compensation Plan Information” and “Ownership of Common Stock” are incorporated in this Item 12 by reference. Also, refer to Note 14 in the Notes to the Consolidated Financial Statements for additional information about our equity compensation plans.
Item 13. Certain Relationships and Related Transactions and Director Independence
The sections of our 2017 Proxy Statement captioned “Corporate Governance - Director Independence and - Board Committees” and “Certain Relationships and Related Party Transactions” are incorporated in this Item 13 by reference.
Item 14. Principal Accounting Fees and Services
The section of our 2017 Proxy Statement captioned “Proposal 2: Ratification of the Appointment of KPMG LLP as our Independent Registered Public Accounting Firm for the 2017 Fiscal year” is incorporated in this Item 14 by reference.
PART IV
Item 15. Exhibits and Financial Statement Schedules
Financial Statements
The following financial statements are included in Part II, Item 8 of the Annual Report on Form 10-K:• Report of Independent Registered Public Accounting Firm• Consolidated Balance Sheets as of December 31, 2016 and 2015• Consolidated Statements of Operations for the Years Ended December 31, 2016, 2015 and 2014• Consolidated Statements of Comprehensive Income for the Years Ended December 31, 2016, 2015 and 2014• Consolidated Statements of Stockholders' Equity for the Years Ended December 31, 2016, 2015 and 2014• Consolidated Statements of Cash Flows for the Years Ended December 31, 2016, 2015 and 2014• Notes to the Consolidated Financial Statements for the Years Ended December 31, 2016, 2015 and 2014
Financial Statement Schedules
The financial statement schedule included in this Annual Report on Form 10-K is Schedule II - Valuation and Qualifying Accounts and Reserves for the Years Ended December 31, 2016, 2015 and 2014 (see Schedule II immediately following the signature page of this Annual Report on Form 10-K).
Financial statement schedules not included in this Annual Report on Form 10-K have been omitted because they are not applicable or the required information is shown in the Consolidated Financial Statements or Notes thereto.
Exhibits
A list of the exhibits required to be filed or furnished as part of this Annual Report on Form 10-K is set forth in the Index to Exhibits, which immediately precedes such exhibits, and is incorporated herein by reference.
93
SIGNATURES
Pursuant to the requirements of Section 13 or 15(d) of the Securities Exchange Act of 1934, the registrant has duly caused this report to be signed on its behalf by the undersigned, thereunto duly authorized.
LENNOX INTERNATIONAL INC.
By: /s/ Todd M. Bluedorn Todd M. Bluedorn February 20, 2017 Chief Executive Officer
Pursuant to the requirements of the Securities Exchange Act of 1934, this report has been signed below by the following persons on behalf of the registrant in the capacities and on the dates indicated.
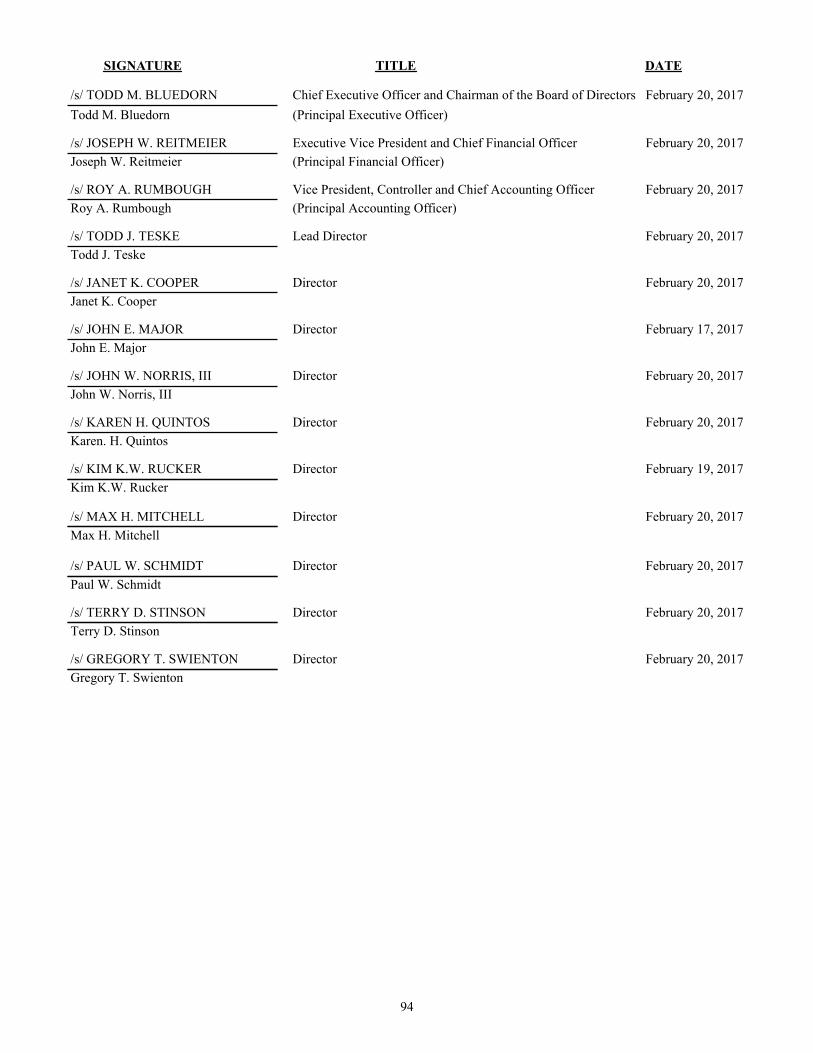
94
SIGNATURE TITLE DATE
/s/ TODD M. BLUEDORN Chief Executive Officer and Chairman of the Board of Directors February 20, 2017Todd M. Bluedorn (Principal Executive Officer)
/s/ JOSEPH W. REITMEIER Executive Vice President and Chief Financial Officer February 20, 2017Joseph W. Reitmeier (Principal Financial Officer)
/s/ ROY A. RUMBOUGH Vice President, Controller and Chief Accounting Officer February 20, 2017Roy A. Rumbough (Principal Accounting Officer)
/s/ TODD J. TESKE Lead Director February 20, 2017Todd J. Teske
/s/ JANET K. COOPER Director February 20, 2017Janet K. Cooper
/s/ JOHN E. MAJOR Director February 17, 2017John E. Major
/s/ JOHN W. NORRIS, III Director February 20, 2017John W. Norris, III
/s/ KAREN H. QUINTOS Director February 20, 2017Karen. H. Quintos
/s/ KIM K.W. RUCKER Director February 19, 2017Kim K.W. Rucker
/s/ MAX H. MITCHELL Director February 20, 2017Max H. Mitchell
/s/ PAUL W. SCHMIDT Director February 20, 2017Paul W. Schmidt
/s/ TERRY D. STINSON Director February 20, 2017Terry D. Stinson
/s/ GREGORY T. SWIENTON Director February 20, 2017Gregory T. Swienton
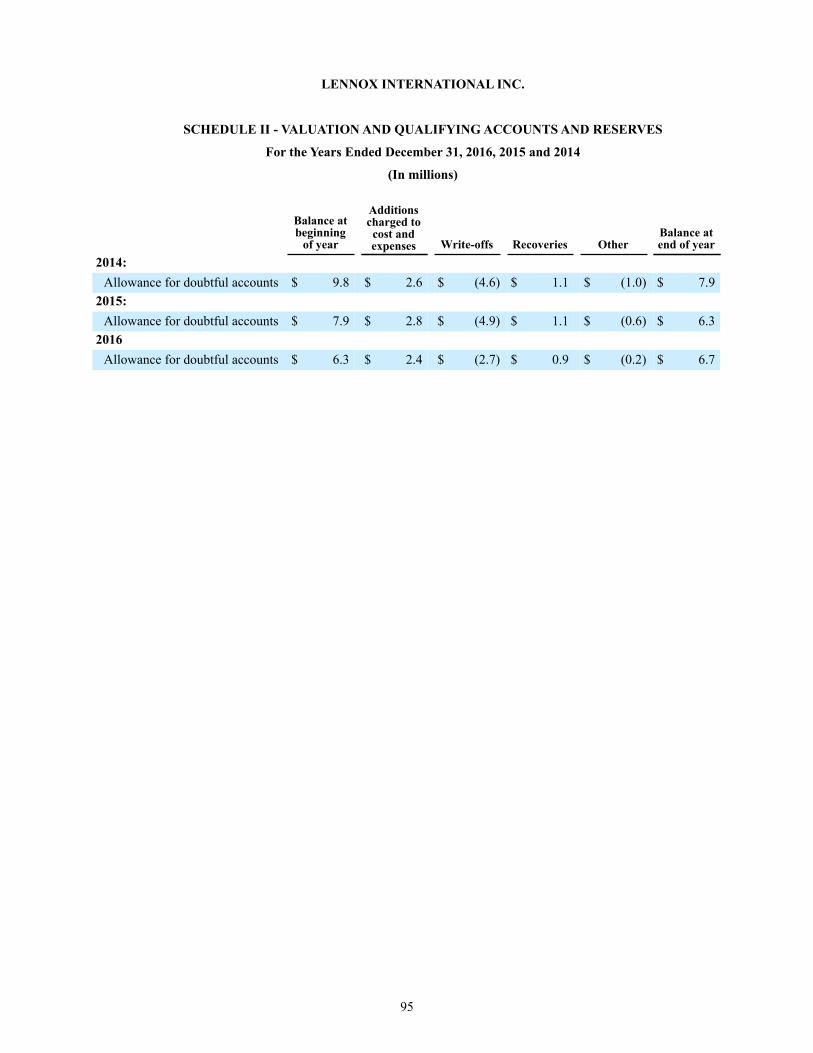
95
LENNOX INTERNATIONAL INC.
SCHEDULE II - VALUATION AND QUALIFYING ACCOUNTS AND RESERVES
For the Years Ended December 31, 2016, 2015 and 2014
(In millions)
Balance atbeginning
of year
Additionscharged tocost andexpenses Write-offs Recoveries Other
Balance atend of year
2014:Allowance for doubtful accounts $ 9.8 $ 2.6 $ (4.6) $ 1.1 $ (1.0) $ 7.9
2015:Allowance for doubtful accounts $ 7.9 $ 2.8 $ (4.9) $ 1.1 $ (0.6) $ 6.3
2016Allowance for doubtful accounts $ 6.3 $ 2.4 $ (2.7) $ 0.9 $ (0.2) $ 6.7
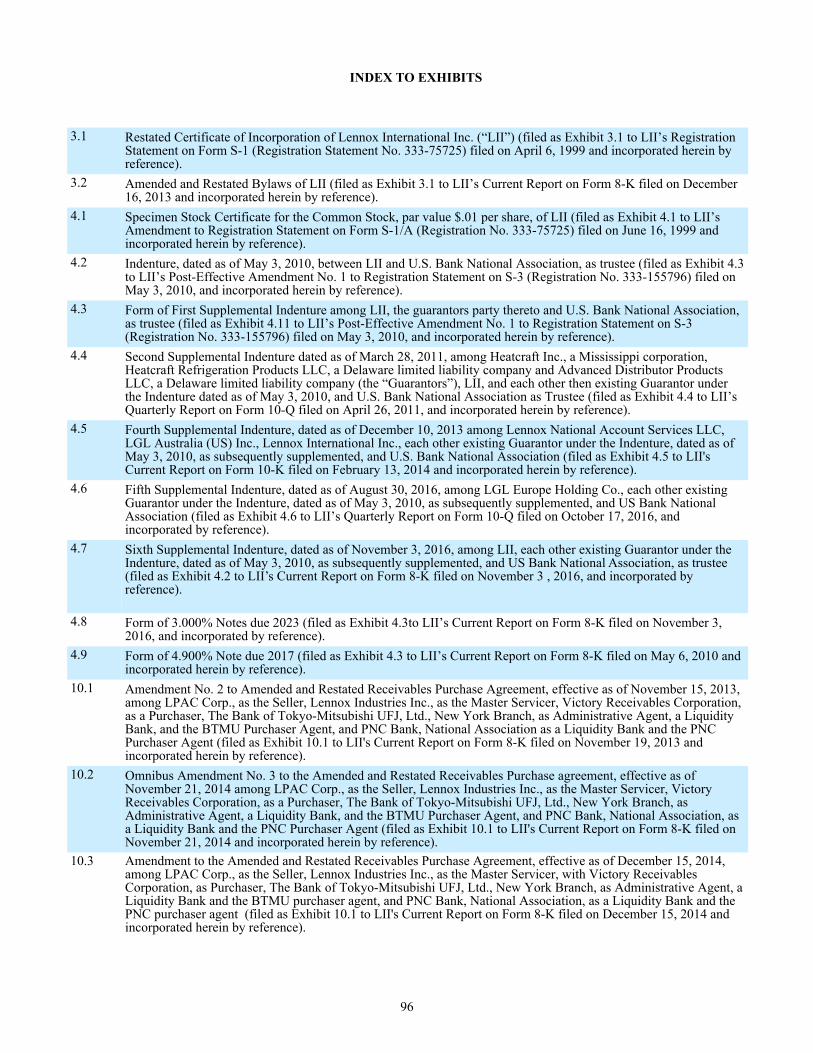
96
INDEX TO EXHIBITS
3.1 Restated Certificate of Incorporation of Lennox International Inc. (“LII”) (filed as Exhibit 3.1 to LII’s RegistrationStatement on Form S-1 (Registration Statement No. 333-75725) filed on April 6, 1999 and incorporated herein byreference).
3.2 Amended and Restated Bylaws of LII (filed as Exhibit 3.1 to LII’s Current Report on Form 8-K filed on December16, 2013 and incorporated herein by reference).
4.1 Specimen Stock Certificate for the Common Stock, par value $.01 per share, of LII (filed as Exhibit 4.1 to LII’sAmendment to Registration Statement on Form S-1/A (Registration No. 333-75725) filed on June 16, 1999 andincorporated herein by reference).
4.2 Indenture, dated as of May 3, 2010, between LII and U.S. Bank National Association, as trustee (filed as Exhibit 4.3to LII’s Post-Effective Amendment No. 1 to Registration Statement on S-3 (Registration No. 333-155796) filed onMay 3, 2010, and incorporated herein by reference).
4.3 Form of First Supplemental Indenture among LII, the guarantors party thereto and U.S. Bank National Association,as trustee (filed as Exhibit 4.11 to LII’s Post-Effective Amendment No. 1 to Registration Statement on S-3(Registration No. 333-155796) filed on May 3, 2010, and incorporated herein by reference).
4.4 Second Supplemental Indenture dated as of March 28, 2011, among Heatcraft Inc., a Mississippi corporation,Heatcraft Refrigeration Products LLC, a Delaware limited liability company and Advanced Distributor ProductsLLC, a Delaware limited liability company (the “Guarantors”), LII, and each other then existing Guarantor underthe Indenture dated as of May 3, 2010, and U.S. Bank National Association as Trustee (filed as Exhibit 4.4 to LII’sQuarterly Report on Form 10-Q filed on April 26, 2011, and incorporated herein by reference).
4.5 Fourth Supplemental Indenture, dated as of December 10, 2013 among Lennox National Account Services LLC,LGL Australia (US) Inc., Lennox International Inc., each other existing Guarantor under the Indenture, dated as ofMay 3, 2010, as subsequently supplemented, and U.S. Bank National Association (filed as Exhibit 4.5 to LII'sCurrent Report on Form 10-K filed on February 13, 2014 and incorporated herein by reference).
4.6 Fifth Supplemental Indenture, dated as of August 30, 2016, among LGL Europe Holding Co., each other existingGuarantor under the Indenture, dated as of May 3, 2010, as subsequently supplemented, and US Bank NationalAssociation (filed as Exhibit 4.6 to LII’s Quarterly Report on Form 10-Q filed on October 17, 2016, andincorporated by reference).
4.7 Sixth Supplemental Indenture, dated as of November 3, 2016, among LII, each other existing Guarantor under the Indenture, dated as of May 3, 2010, as subsequently supplemented, and US Bank National Association, as trustee (filed as Exhibit 4.2 to LII’s Current Report on Form 8-K filed on November 3 , 2016, and incorporated by reference).
4.8 Form of 3.000% Notes due 2023 (filed as Exhibit 4.3to LII’s Current Report on Form 8-K filed on November 3,2016, and incorporated by reference).
4.9 Form of 4.900% Note due 2017 (filed as Exhibit 4.3 to LII’s Current Report on Form 8-K filed on May 6, 2010 andincorporated herein by reference).
10.1 Amendment No. 2 to Amended and Restated Receivables Purchase Agreement, effective as of November 15, 2013,among LPAC Corp., as the Seller, Lennox Industries Inc., as the Master Servicer, Victory Receivables Corporation,as a Purchaser, The Bank of Tokyo-Mitsubishi UFJ, Ltd., New York Branch, as Administrative Agent, a LiquidityBank, and the BTMU Purchaser Agent, and PNC Bank, National Association as a Liquidity Bank and the PNCPurchaser Agent (filed as Exhibit 10.1 to LII's Current Report on Form 8-K filed on November 19, 2013 andincorporated herein by reference).
10.2 Omnibus Amendment No. 3 to the Amended and Restated Receivables Purchase agreement, effective as ofNovember 21, 2014 among LPAC Corp., as the Seller, Lennox Industries Inc., as the Master Servicer, VictoryReceivables Corporation, as a Purchaser, The Bank of Tokyo-Mitsubishi UFJ, Ltd., New York Branch, asAdministrative Agent, a Liquidity Bank, and the BTMU Purchaser Agent, and PNC Bank, National Association, asa Liquidity Bank and the PNC Purchaser Agent (filed as Exhibit 10.1 to LII's Current Report on Form 8-K filed onNovember 21, 2014 and incorporated herein by reference).
10.3 Amendment to the Amended and Restated Receivables Purchase Agreement, effective as of December 15, 2014,among LPAC Corp., as the Seller, Lennox Industries Inc., as the Master Servicer, with Victory ReceivablesCorporation, as Purchaser, The Bank of Tokyo-Mitsubishi UFJ, Ltd., New York Branch, as Administrative Agent, aLiquidity Bank and the BTMU purchaser agent, and PNC Bank, National Association, as a Liquidity Bank and thePNC purchaser agent (filed as Exhibit 10.1 to LII's Current Report on Form 8-K filed on December 15, 2014 andincorporated herein by reference).
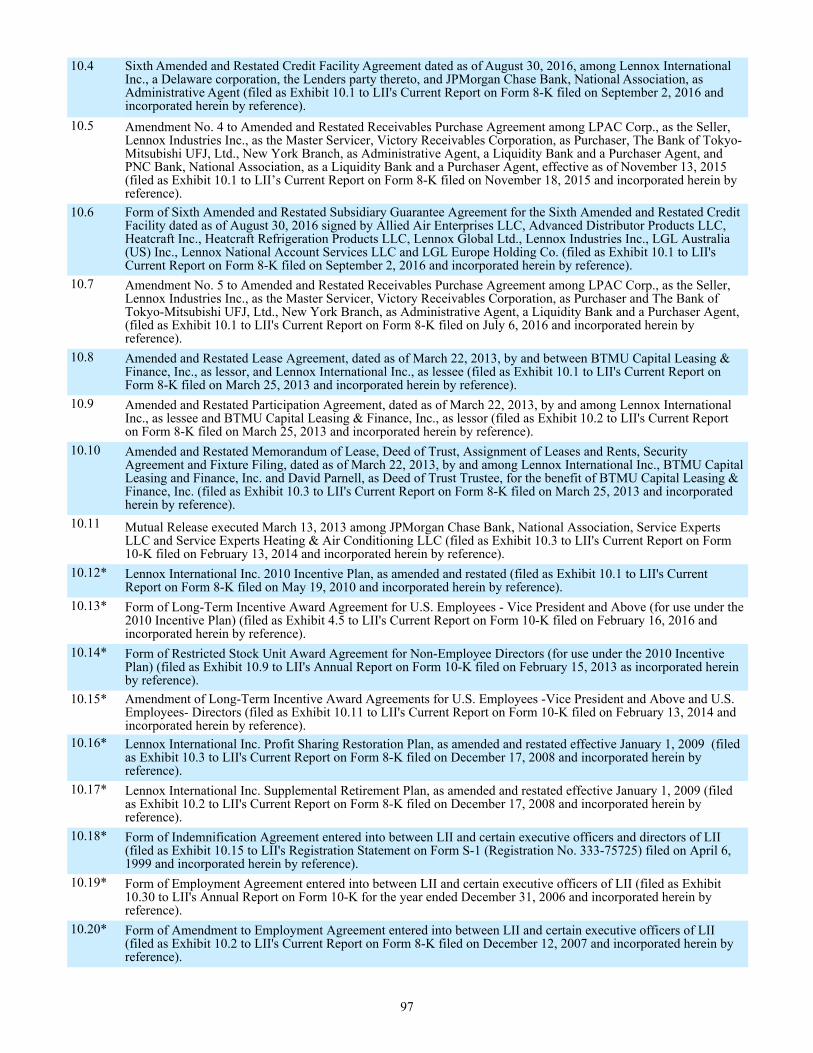
97
10.4 Sixth Amended and Restated Credit Facility Agreement dated as of August 30, 2016, among Lennox International Inc., a Delaware corporation, the Lenders party thereto, and JPMorgan Chase Bank, National Association, as Administrative Agent (filed as Exhibit 10.1 to LII's Current Report on Form 8-K filed on September 2, 2016 and incorporated herein by reference).
10.5 Amendment No. 4 to Amended and Restated Receivables Purchase Agreement among LPAC Corp., as the Seller,Lennox Industries Inc., as the Master Servicer, Victory Receivables Corporation, as Purchaser, The Bank of Tokyo-Mitsubishi UFJ, Ltd., New York Branch, as Administrative Agent, a Liquidity Bank and a Purchaser Agent, andPNC Bank, National Association, as a Liquidity Bank and a Purchaser Agent, effective as of November 13, 2015(filed as Exhibit 10.1 to LII’s Current Report on Form 8-K filed on November 18, 2015 and incorporated herein byreference).
10.6 Form of Sixth Amended and Restated Subsidiary Guarantee Agreement for the Sixth Amended and Restated CreditFacility dated as of August 30, 2016 signed by Allied Air Enterprises LLC, Advanced Distributor Products LLC,Heatcraft Inc., Heatcraft Refrigeration Products LLC, Lennox Global Ltd., Lennox Industries Inc., LGL Australia(US) Inc., Lennox National Account Services LLC and LGL Europe Holding Co. (filed as Exhibit 10.1 to LII'sCurrent Report on Form 8-K filed on September 2, 2016 and incorporated herein by reference).
10.7 Amendment No. 5 to Amended and Restated Receivables Purchase Agreement among LPAC Corp., as the Seller,Lennox Industries Inc., as the Master Servicer, Victory Receivables Corporation, as Purchaser and The Bank ofTokyo-Mitsubishi UFJ, Ltd., New York Branch, as Administrative Agent, a Liquidity Bank and a Purchaser Agent,(filed as Exhibit 10.1 to LII's Current Report on Form 8-K filed on July 6, 2016 and incorporated herein byreference).
10.8 Amended and Restated Lease Agreement, dated as of March 22, 2013, by and between BTMU Capital Leasing &Finance, Inc., as lessor, and Lennox International Inc., as lessee (filed as Exhibit 10.1 to LII's Current Report onForm 8-K filed on March 25, 2013 and incorporated herein by reference).
10.9 Amended and Restated Participation Agreement, dated as of March 22, 2013, by and among Lennox InternationalInc., as lessee and BTMU Capital Leasing & Finance, Inc., as lessor (filed as Exhibit 10.2 to LII's Current Reporton Form 8-K filed on March 25, 2013 and incorporated herein by reference).
10.10 Amended and Restated Memorandum of Lease, Deed of Trust, Assignment of Leases and Rents, SecurityAgreement and Fixture Filing, dated as of March 22, 2013, by and among Lennox International Inc., BTMU CapitalLeasing and Finance, Inc. and David Parnell, as Deed of Trust Trustee, for the benefit of BTMU Capital Leasing &Finance, Inc. (filed as Exhibit 10.3 to LII's Current Report on Form 8-K filed on March 25, 2013 and incorporatedherein by reference).
10.11 Mutual Release executed March 13, 2013 among JPMorgan Chase Bank, National Association, Service ExpertsLLC and Service Experts Heating & Air Conditioning LLC (filed as Exhibit 10.3 to LII's Current Report on Form10-K filed on February 13, 2014 and incorporated herein by reference).
10.12* Lennox International Inc. 2010 Incentive Plan, as amended and restated (filed as Exhibit 10.1 to LII's CurrentReport on Form 8-K filed on May 19, 2010 and incorporated herein by reference).
10.13* Form of Long-Term Incentive Award Agreement for U.S. Employees - Vice President and Above (for use under the2010 Incentive Plan) (filed as Exhibit 4.5 to LII's Current Report on Form 10-K filed on February 16, 2016 andincorporated herein by reference).
10.14* Form of Restricted Stock Unit Award Agreement for Non-Employee Directors (for use under the 2010 IncentivePlan) (filed as Exhibit 10.9 to LII's Annual Report on Form 10-K filed on February 15, 2013 as incorporated hereinby reference).
10.15* Amendment of Long-Term Incentive Award Agreements for U.S. Employees -Vice President and Above and U.S.Employees- Directors (filed as Exhibit 10.11 to LII's Current Report on Form 10-K filed on February 13, 2014 andincorporated herein by reference).
10.16* Lennox International Inc. Profit Sharing Restoration Plan, as amended and restated effective January 1, 2009 (filedas Exhibit 10.3 to LII's Current Report on Form 8-K filed on December 17, 2008 and incorporated herein byreference).
10.17* Lennox International Inc. Supplemental Retirement Plan, as amended and restated effective January 1, 2009 (filedas Exhibit 10.2 to LII's Current Report on Form 8-K filed on December 17, 2008 and incorporated herein byreference).
10.18* Form of Indemnification Agreement entered into between LII and certain executive officers and directors of LII(filed as Exhibit 10.15 to LII's Registration Statement on Form S-1 (Registration No. 333-75725) filed on April 6,1999 and incorporated herein by reference).
10.19* Form of Employment Agreement entered into between LII and certain executive officers of LII (filed as Exhibit10.30 to LII's Annual Report on Form 10-K for the year ended December 31, 2006 and incorporated herein byreference).
10.20* Form of Amendment to Employment Agreement entered into between LII and certain executive officers of LII(filed as Exhibit 10.2 to LII's Current Report on Form 8-K filed on December 12, 2007 and incorporated herein byreference).
98
10.21* Form of Change of Control Employment Agreement entered into between LII and certain executive officers of LII(filed as Exhibit 10.1 to LII's Current Report on Form 8-K filed on July 11, 2012 and incorporated herein byreference).
10.22* Lennox International Inc. Directors' Retirement Plan (as Amended and Restated as of January 1, 2010) (filed asExhibit 10.1 to LII's Current Report on Form 8-K filed on December 16, 2009 and incorporated herein byreference).
10.23* Form of Change of Control Employment Agreement entered into between LII and certain executive officers of LII(filed as Exhibit 10.1 to LII's Current Report on Form 8-K filed on December 17, 2008 and incorporated herein byreference).
21.1 Subsidiaries of LII (filed herewith).23.1 Consent of KPMG LLP (filed herewith).31.1 Certification of the principal executive officer (filed herewith).31.2 Certification of the principal financial officer (filed herewith).32.1 Certification of the principal executive officer and the principal financial officer pursuant to 18 U.S.C. Section 1350
(furnished herewith).
Exhibit No. (101).INS XBRL Instance DocumentExhibit No. (101).SCH XBRL Taxonomy Extension Schema DocumentExhibit No. (101).CAL XBRL Taxonomy Extension Calculation Linkbase DocumentExhibit No. (101).LAB XBRL Taxonomy Extension Label Linkbase DocumentExhibit No. (101).PRE XBRL Taxonomy Extension Presentation Linkbase DocumentExhibit No. (101).DEF XBRL Taxonomy Extension Definition Linkbase Document
* Management contract or compensatory plan or arrangement.
CORPORATE INFORMATIONCORPORATE HEADQUARTERSLennox International Inc.2140 Lake Park Blvd.Richardson, Texas 75080972-497-5000
For more information onLennox International, visit:www.lennoxinternational.com
ANNUAL MEETINGOur annual stockholders meeting will be held on May 18, 2017. Any stockholder with proper identification may attend.
The meeting will be held at:Lennox International Inc.Corporate Headquarters2140 Lake Park Blvd.Richardson, Texas 75080
INVESTOR INQUIRIESInvestors and financial analystsinterested in obtaining information about Lennox International should contact:
Steve HarrisonVice President, Investor RelationsPhone: 972-497-6670Email: [email protected]
STOCK EXCHANGELennox International’s trading symbol is LII. The common stock of LII has traded on the New York Stock Exchange since July 29, 1999.
SEC FILINGSA copy of Lennox International’sAnnual Report on Form 10-K for fiscal 2016 and other reports filedwith the Securities and ExchangeCommission are available throughour corporate website atwww.lennoxinternational.com orwill be furnished, without charge,on written request to:
Lennox InternationalInvestor RelationsP.O. Box 799900Dallas, Texas 75379-9900
TRANSFER AGENT AND REGISTRARComputershare is LennoxInternational’s Transfer Agent.Shareholder correspondence shouldbe directed to:
Lennox Internationalc/o ComputershareP.O. Box 43006Providence, RI 02940-3006
LII stockholders can access theiraccount information via the internet at:www.computershare.com/investoror by calling 1-800-797-5603.
INDEPENDENT REGISTEREDPUBLIC ACCOUNTANTSKPMG LLPDallas, Texas
DIVIDEND INFORMATIONIn recent years, Lennox Internationalhas declared dividends four times a year. The amount and timing of dividendpayments are determined by our boardof directors.
FORWARD-LOOKING STATEMENTSThis Annual Report contains forward- looking statements within the meaning of Section 27A of the Securities Act of 1933, as amended, and Section 21E of the Securities Exchange Act of 1934, as amended, that are based on information currently available to management as well as management’s assumptions and beliefs.
All statements, other than statements of historical fact, included in this Annual Report constitute forward- looking statements within the meaning of the Private Securities Litigation Reform Act of 1995, including but not limited to statements identified by the words “may,” “will,” “should,” “plan,” “predict,” “anticipate,” “believe,” “intend,” “target,” “see,” “estimate,” “expect,” and similar expressions.
Such statements reflect LII’s current views with respect to future events, based on what LII believes are reasonable assumptions; however, such statements are subject to certain risks and uncertainties.
For information concerning these risks and uncertainties, see LII’s publicly available filings with the Securities and Exchange Commission. Should one or more of these risks or uncertainties materialize, or should underlying assumptions prove incorrect, actual results may differ materially from those in the forward-looking statements. LII disclaims any intentions or obligation to update or review any forward-looking statements or information, whether as a result of new information, future events or otherwise.

2140 LAKE PARK BLVD., RICHARDSON, TX 75080www.lennoxinternational.com
©2017 Lennox In ternat ional Inc. Al l R ights Reser ved.
Printed on paper sourced from well-managed forests with 100% recycled, 30% PCW content. Printed by a Green Works certified facility using soy-based inks.