2016 water master plan - board of water supply · 2016 water master plan. 2016 water master plan...
TRANSCRIPT
Water for Life, Ka Wai Ola
2016WATER MASTER PLAN


2016
Water Master Plan
Work Honolulu Board of Water Supply
October 2016
Prepared by:
About the Cover:Oʻahu Mural, 1940 - Juliette May Fraser
Located in the Board of Water Supply, Engineering Building Lobby, between Lisbon and Alapai
Streets, this oil on canvas painting mounted on a panel depicts a map of Oʻahu that shows how
and where water is conserved, by whom, and for what purposes the water is used.
According to the 16th Biennial Report of the Board of Water Supply:
“The story of the mural tells The Rainfall Cycle – Kāne, the Life-Giver, incarnate in the Sun as well as
the rain, draws the water of life from the sea with the rays of Lā, the Sun.
Supreme in his sea realm lives the great shark god, Kamohoaliʻi.
This water pours from the clouds as rain upon Papa, the Earth Mother, who sits attended by Lono,
God of cultivated crops, and Laka, goddess of the wildwood. Circling around the Earth Mother is
Moʻo, the lizard, god of fresh water and inshore tides.
In the sky the tradewinds sweep the billowing white clouds, the men dancers in white. The dancers
whirl their arms in a motion which is the hula symbol for “wind.” As the tradewinds dance, Mahina,
the moon, queen of the night and the goddess who governs planting, rides in the heavens in all her
effulgence.
And as the drizzle intensifies into a thunder squall, the southerly wind, Kona, stormy and gray
hulamaster that he is, thunders and keeps time with his gourd drum in ever-increasing tempo.
The tempest soon passes, Kona silences his gourd drum, and the Earth Mother is left refreshed and
reinvigorated, clean and purified by the rain waters, the waters of Kāne.”
October 2016
Acknowledgements
The Water Master Plan (WMP) process was commissioned in 2013 through the vision of the
Honolulu Board of Water Supply. Critical to the development of the WMP was a diverse,
collaborative team of contributors and reviewers. The following organizations and their staff
have dedicated significant time and effort to shaping a reliable, sustainable water future for the
people of Oʻahu.Board of Water Supply
Board of Directors
Bryan Andaya, Chair
Adam Wong, Vice Chair
David Hulihee, Member
Kapua Sproat, Member
Kay Matsui, Member
Ross Sasamura, Member, Ex-officio
Ford Fuchigami, Member, Ex-officio
Executive Management
Ernest Y. W. Lau, Manager and Chief Engineer
Ellen E. Kitamura, Deputy Manager and Chief Engineer
Water Master Plan Project
Barry Usagawa, Water Master Plan Project Executive
Ron Wada, Water Master Plan Project Manager
Board of Water Supply Program Administrators
Jennifer Elflein, Customer Care
Daryl Hiromoto, Field Operations
Kevin Ihu, Water System Operations
Erwin Kawata, Water Quality
Henderson Nuuhiwa, IT
Jason Takaki, Capital Projects
Barry Usagawa, Water Resources
Program Management TeamStepp Consulting Inc. The Limtiaco Consulting Group
Consultant TeamCDM Smith
Echologics LLC
Harris & Company
Pure Engineering Services Inc.
Sea Engineering, Inc.
V&A Consulting Engineers
Ward Research, Inc.

Acknowledgements
October 2016
This page intentionally left blank.
October 2016 i
Table of Contents
Part I – Background and Approach
Section 1 Water Master Plan Background and Approach ...................................................1-1
1.1 BWS History .................................................................................................................................................................1-1
1.2 WMP Approach ...........................................................................................................................................................1-2
1.2.1 Facility Condition Assessment................................................................................................................1-2
1.2.2 System Capacity Evaluation.....................................................................................................................1-3
1.2.3 System Improvements Development ..................................................................................................1-3
1.3 WMP Report Organization .....................................................................................................................................1-4
Section 2 Related BWS Work .............................................................................................2-1
2.1 Guiding Principles......................................................................................................................................................2-1
2.1.1 Vision.................................................................................................................................................................2-1
2.1.2 Mission..............................................................................................................................................................2-1
2.1.3 Strategic Plan .................................................................................................................................................2-2
2.2 Programs and Initiatives Guiding the WMP ...................................................................................................2-3
2.2.1 Oʻahu General Plan ......................................................................................................................................2-3
2.2.2 Watershed Planning....................................................................................................................................2-4
2.2.3 Hawaiʻi Fresh Water Initiative................................................................................................................2-5
2.2.4 BWS Stakeholder Advisory Group ........................................................................................................2-6
2.3 WMP Objectives..........................................................................................................................................................2-6
Section 3 Stakeholder Advisory Group...............................................................................3-1
3.1 Key Findings.................................................................................................................................................................3-1
3.2 Purpose and Background .......................................................................................................................................3-1
3.3 Formation......................................................................................................................................................................3-2
3.4 Engagement..................................................................................................................................................................3-3
3.4.1 Interviews........................................................................................................................................................3-3
3.4.2 Commitment to Open and Public Meetings ......................................................................................3-3
3.5 Topics and Stakeholder Input ..............................................................................................................................3-3
3.5.1 Topics Presented or Discussed...............................................................................................................3-4
3.5.2 Stakeholder Advisory Group Input and Ideas..................................................................................3-5
3.5.2.1 Top Priorities ...................................................................................................................................3-5
3.5.2.2 WMP Organization .........................................................................................................................3-6
3.5.2.3 Water Conservation Concepts ..................................................................................................3-7
3.5.2.4 Ideas for the Fresh Water Initiative ........................................................................................3-7
Section 4 Water Supply Sustainability ...............................................................................4-1
4.1 Key Findings.................................................................................................................................................................4-1
4.2 Watershed Management and Protection .........................................................................................................4-1
4.2.1 Watershed Management Plans...............................................................................................................4-2
4.2.2 Watershed Partnerships ...........................................................................................................................4-2
4.3 Groundwater Protection.........................................................................................................................................4-3
4.4 Conservation ................................................................................................................................................................4-4
4.5 Alternative Supply Sources....................................................................................................................................4-6
Table of Contents
ii October 2016
Section 5 Water System Planning Standards......................................................................5-1
5.1 Key Findings.................................................................................................................................................................5-1
5.2 Standards and Criteria.............................................................................................................................................5-2
5.3 BWS Application of Standards and Criteria for the WMP ........................................................................5-4
5.3.1 Pipeline Sizing ...............................................................................................................................................5-5
5.3.2 Reservoir Capacity.......................................................................................................................................5-5
5.3.3 Pump Station Capacity ...............................................................................................................................5-6
5.3.4 Demand Factors ............................................................................................................................................5-7
5.3.5 Domestic Consumption Guidelines ......................................................................................................5-9
Section 6 The BWS Water System......................................................................................6-1
6.1 System Overview........................................................................................................................................................6-1
6.2 Sustain ............................................................................................................................................................................6-3
6.3 Capture ...........................................................................................................................................................................6-3
6.4 Treat ................................................................................................................................................................................6-4
6.5 Move ................................................................................................................................................................................6-4
6.6 Store ................................................................................................................................................................................6-5
6.7 Deliver.............................................................................................................................................................................6-6
Part II – Technical Evaluation
Section 7 Historical and Future Water Demands................................................................7-1
7.1 Key Findings.................................................................................................................................................................7-1
7.2 Historical Demands...................................................................................................................................................7-2
7.2.1 Historical System Demand .......................................................................................................................7-2
7.2.2 Historical Per Capita Demand.................................................................................................................7-4
7.2.3 Effects of Water Conservation ................................................................................................................7-5
7.2.4 Effects of Water Loss ..................................................................................................................................7-6
7.3 Demand Projection Approach ..............................................................................................................................7-7
7.3.1 O‘ahu Water Management Plan..............................................................................................................7-7
7.3.2 WMP Annual Demand Projections........................................................................................................7-7
7.4 Population and Per Capita Demand Projections ..........................................................................................7-8
7.5 Future Annual Water Demands ........................................................................................................................7-10
7.5.1 Most Probable Demand Projection ....................................................................................................7-11
7.5.2 High Range Demand Projection ..........................................................................................................7-11
7.6 Nonpotable Demands ............................................................................................................................................7-12
Section 8 Current and Future Water Supply Sources ..........................................................8-1
8.1 Key Findings.................................................................................................................................................................8-1
8.2 O‘ahu’s Water Resources ........................................................................................................................................8-2
8.2.1 Hydrology ........................................................................................................................................................8-3
8.2.2 Groundwater Resources............................................................................................................................8-5
8.3 Water Use and Supply Availability .....................................................................................................................8-7
8.3.1 Island-wide Groundwater Use................................................................................................................8-8
8.3.2 BWS Water Use .............................................................................................................................................8-9
8.3.2.1 Groundwater..................................................................................................................................8-10
8.3.2.2 Recycled Water .............................................................................................................................8-11
8.3.2.3 Brackish Water .............................................................................................................................8-11
Table of Contents
October 2016 iii
8.3.3 BWS Supply Availability .........................................................................................................................8-11
8.4 Trends Affecting Oʻahu’s Water Supply Needs...........................................................................................8-12
8.4.1 Climate Change ...........................................................................................................................................8-13
8.4.2 Water Quality ..............................................................................................................................................8-14
8.4.2.1 Agricultural and Industrial Activities..................................................................................8-15
8.4.3 Future Changes in Agricultural Demand.........................................................................................8-15
8.5 Addressing Supply Uncertainties .....................................................................................................................8-16
8.5.1 Research Efforts .........................................................................................................................................8-16
8.5.2 Monitoring....................................................................................................................................................8-16
8.5.3 Operational Flexibility.............................................................................................................................8-17
8.5.4 Supply Diversification .............................................................................................................................8-17
8.5.4.1 Desalination Projects .................................................................................................................8-18
8.5.4.2 Recycled Water Projects ...........................................................................................................8-19
Section 9 Water Quality, Regulations, and Treatment .......................................................9-1
9.1 Key Findings.................................................................................................................................................................9-1
9.2 Current and Potential Regulations .....................................................................................................................9-1
9.2.1 Current Regulations ....................................................................................................................................9-1
9.2.1.1 Ground Water Rule ........................................................................................................................9-2
9.2.1.2 Total Coliform Rule........................................................................................................................9-2
9.2.1.3 Disinfection Byproducts Rule....................................................................................................9-3
9.2.1.4 Lead and Copper Rule...................................................................................................................9-3
9.2.2 Future Regulations ......................................................................................................................................9-3
9.2.3 Issues on the Regulatory Horizon.........................................................................................................9-4
9.2.4 Internal Water Quality Goals...................................................................................................................9-5
9.3 Source Water Quality ...............................................................................................................................................9-5
9.3.1 Parameters that May Trigger Action and Potential Compliance Issues ...............................9-5
9.3.2 Potential Water Quality Compliance Strategies..............................................................................9-6
9.3.2.1 Microbiological Risks....................................................................................................................9-6
9.3.2.2 TCP........................................................................................................................................................9-7
9.3.2.3 Hexavalent Chromium..................................................................................................................9-7
9.3.2.4 Chlorides ............................................................................................................................................9-7
9.4 Potential Water Quality Improvements ...........................................................................................................9-8
Section 10 System Capacity Evaluation ............................................................................10-1
10.1 Key Findings ...........................................................................................................................................................10-1
10.2 Water System Analysis.......................................................................................................................................10-2
10.2.1 Hydraulic Models ....................................................................................................................................10-3
10.2.2 Hydraulic Model Verification.............................................................................................................10-3
10.2.3 Hydraulic Model Analysis....................................................................................................................10-4
10.2.3.1 Existing and Future ADD Demands...................................................................................10-5
10.2.3.2 Existing and Future Analysis Assumptions ...................................................................10-6
10.2.3.3 Pipeline Capacity Evaluation.............................................................................................10-13
10.2.3.4 Capacity Evaluations for Supply, Pumps and Reservoirs......................................10-15
Table of Contents
iv October 2016
10.3 Capacity Analysis Results ...............................................................................................................................10-16
10.3.1 System Wide Overview......................................................................................................................10-16
10.3.1.1 Projects Planned Within the 30-Year CIP ....................................................................10-16
10.3.1.2 Projects Planned Beyond the 30-Year CIP...................................................................10-18
10.3.2 Summary of Recommended Facilities by Model System ....................................................10-21
10.3.2.1 Metro Low Model System ...................................................................................................10-21
10.3.2.2 Metro High Model System...................................................................................................10-27
10.3.2.3 Leeward Model System........................................................................................................10-27
10.3.2.4 ‘Ewa-Waipahu Model System............................................................................................10-28
10.3.2.5 Pearl City Model System......................................................................................................10-29
10.3.2.6 ‘Aiea-Hālawa Model System...............................................................................................10-30
10.3.2.7 Windward Model System....................................................................................................10-31
10.3.2.8 Kahuku Model System..........................................................................................................10-32
10.3.2.9 North Shore Model System.................................................................................................10-32
10.3.2.10 Central Model System ........................................................................................................10-33
Section 11 Facility Condition Assessment ........................................................................11-1
11.1 Key Findings ...........................................................................................................................................................11-1
11.1.1 Pipelines......................................................................................................................................................11-1
11.1.2 Reservoirs ..................................................................................................................................................11-3
11.1.3 Pump Stations ..........................................................................................................................................11-4
11.1.4 Water Treatment.....................................................................................................................................11-4
11.1.5 Facilities ......................................................................................................................................................11-5
11.2 Pipelines ...................................................................................................................................................................11-5
11.2.1 Pipeline Condition Assessment Methodology ............................................................................11-6
11.2.2 Statistical Analysis..................................................................................................................................11-7
11.2.2.1 Lifespan Analysis (KANEW) .................................................................................................11-8
11.2.2.2 Main Breaks and Failure Factor Analysis (LEYP).....................................................11-10
11.2.2.3 Pipeline Risk Analysis (CapPlan).....................................................................................11-13
11.2.3 Forensic Analysis .................................................................................................................................11-15
11.2.3.1 Forensic Main Break Evaluation – Cast Iron Pipe ....................................................11-15
11.2.3.2 Forensic Main Break Evaluation – PVC Pipe...............................................................11-17
11.2.4 Pipeline Inspections............................................................................................................................11-17
11.2.4.1 Leak Detection .........................................................................................................................11-17
11.2.4.2 Pipe Wall Assessment...........................................................................................................11-18
11.2.5 Pipeline Materials and Corrosion Control .................................................................................11-19
11.2.6 Pipeline Renewal and Replacement Recommendations.....................................................11-21
11.3 Reservoirs .............................................................................................................................................................11-22
11.3.1 Reservoir Condition Assessment Methodology ......................................................................11-22
11.3.2 Reservoir Condition Assessment ..................................................................................................11-23
11.3.3 Numerical Structural Evaluation...................................................................................................11-23
11.3.3.1 Reservoirs Selected for Evaluation.................................................................................11-23
11.3.3.2 Structural Evaluation Findings.........................................................................................11-23
11.3.4 Reservoir Recommendations..........................................................................................................11-24
11.4 Pump Stations .....................................................................................................................................................11-25
Table of Contents
October 2016 v
11.5 Water Treatment................................................................................................................................................11-26
11.5.1 GAC Treatment Facilities ..................................................................................................................11-26
11.5.2 Microfiltration/Chlorination...........................................................................................................11-27
11.6 Facilities .................................................................................................................................................................11-27
11.6.1 SCADA .......................................................................................................................................................11-27
11.6.1.1 Existing System Assessment..............................................................................................11-27
11.6.1.2 SCADA System Findings and Recommendations......................................................11-27
11.6.2 Offices and Base Yards.......................................................................................................................11-28
11.6.3 Security.....................................................................................................................................................11-28
Part III – Findings and Implementation
Section 12 Findings and Recommendations .....................................................................12-1
Section 13 Implementation .............................................................................................13-1
13.1 Funding .....................................................................................................................................................................13-1
13.1.1 Funding Assumptions for Initial CIP Development..................................................................13-2
13.1.2 Funding Assumptions for Water Sustainability Programs ...................................................13-4
13.2 CIP Development ..................................................................................................................................................13-5
13.2.1 Project Types ............................................................................................................................................13-6
13.2.1.1 Capacity Expansion Projects ................................................................................................13-6
13.2.1.2 Renewal and Replacement Projects..................................................................................13-6
13.2.1.3 Research and Development Projects................................................................................13-6
13.2.1.4 Other Projects .............................................................................................................................13-6
13.2.2 Project Prioritization.............................................................................................................................13-7
13.2.3 Development Process............................................................................................................................13-9
13.2.4 Reliability.................................................................................................................................................13-11
13.2.4.1 Natural Disasters ....................................................................................................................13-12
13.2.4.2 Power Outages.........................................................................................................................13-13
13.2.4.3 Transmission Interruption.................................................................................................13-13
13.2.4.4 Loss of Supply ..........................................................................................................................13-14
13.3 Organizational Capacity ..................................................................................................................................13-14
13.3.1 Enterprise Organizational Study ...................................................................................................13-14
13.3.2 Capital Projects Division Study ......................................................................................................13-15
13.4 Water System Monitoring ..............................................................................................................................13-16
13.5 Adaptive Management.....................................................................................................................................13-25
Table of Contents
vi October 2016
List of Figures
Figure 2-1 BWS Plans and Programs that Relate to the WMP.............................................................................2-3
Figure 2-2 Alignment of the WMP Objectives and Watershed Management Plan Objectives...............2-8
Figure 3-1 Stakeholder Advisory Group Ranking of Water Issues....................................................................3-6
Figure 5-1 Typical Seasonal Variations in Maximum Day and Peak Hour Demand...................................5-7
Figure 5-2 Typical Peak Hour Factor Variations Between Large and Small Pressure Zones ................5-9
Figure 6-1 Historical Population and Demand Served by BWS ..........................................................................6-1
Figure 6-2 Overall BWS Infrastructure..........................................................................................................................6-2
Figure 6-3 Age Profile of Potable Pipelines .................................................................................................................6-7
Figure 6-4 Summary of Potable Pipeline Materials..................................................................................................6-7
Figure 7-1 Historical Water Demand by Land Use District...................................................................................7-3
Figure 7-2 BWS Historical Per Capita Demand Trends ..........................................................................................7-5
Figure 7-3 Most Probable Demand Projection Approach......................................................................................7-8
Figure 7-4 High Range Demand Projection Approach............................................................................................7-8
Figure 7-5 BWS Historical and Projected System-Wide Demands .................................................................7-10
Figure 8-1 Oʻahu Mean Annual Rainfall in Inches.....................................................................................................8-4
Figure 8-2 Oʻahu Streams and Irrigation Ditches......................................................................................................8-5
Figure 8-3 Aquifer Zones – Freshwater, Transition Zone, and Saltwater ......................................................8-6
Figure 8-4 Oʻahu Aquifers ...................................................................................................................................................8-7
Figure 8-5 2010 Oʻahu Groundwater Use.....................................................................................................................8-8
Figure 8-6 BWS Source Water Used in 2010............................................................................................................8-10
Figure 8-7 Comparison of BWS Average Annual Demand Projections and Currently
Planned Supplies......................................................................................................................................8-12
Figure 8-8 Historical Annual Average Rainfall for O‘ahu....................................................................................8-14
Figure 8-9 Existing Recycled Water Infrastructure and Projects – Leeward Oʻahu................................8-20
Figure 10-1A Historical and Projected MDD Compared to Available Supply, Metro Low
System ..........................................................................................................................................................10-8
Figure 10-1B Historical and Projected MDD Compared to Available Supply, Metro High
System ..........................................................................................................................................................10-9
Figure 10-1C Historical and Projected MDD Compared to Available Supply, Leeward
System ..........................................................................................................................................................10-9
Figure 10-1D Historical and Projected MDD Compared to Available Supply, ʻEwa-Waipahu
System........................................................................................................................................................10-10
Figure 10-1E Historical and Projected MDD Compared to Available Supply, Pearl City
System........................................................................................................................................................10-10
Figure 10-1F Historical and Projected MDD Compared to Available Supply, ‘Aiea-Hālawa
System........................................................................................................................................................10-11
Figure 10-1G Historical and Projected MDD Compared to Available Supply, Windward
System........................................................................................................................................................10-11
Figure 10-1H Historical and Projected MDD Compared to Available Supply, Kahuku System .......10-12
Figure 10-1I Historical and Projected MDD Compared to Available Supply, North Shore
System........................................................................................................................................................10-12
Figure 10-1J Historical and Projected MDD Compared to Available Supply, Central System..........10-13
Table of Contents
October 2016 vii
Figure 10-2 Summary of Major Recommended Capacity Improvements Within the 30-Year
Planning Period (Near-term)...........................................................................................................10-17
Figure 11-1 Pipe Renewal Needs Forecast Using Industry Standard Pipe Service Lives .....................11-9
Figure 11-2 Clustering of Main Breaks in Specific Areas .................................................................................11-10
Figure 11-3 Total Main Breaks Across the BWS System ..................................................................................11-11
Figure 11-4 Main Breaks on Pipes 16 Inches and Larger Across the BWS System...............................11-12
Figure 11-5 Pipeline Failure Risk by Miles of Pipeline......................................................................................11-15
Figure 11-6 Excavated Pipe Showing Graphitic Corrosion Before (left) and After (right)
Sandblasting............................................................................................................................................11-16
Figure 11-7 Non-uniform Electromagnetic Field Caused by Area of Weakness in Pipe Wall ..........11-19
Figure 13-1 Future CIP Funding Level Scenarios ...................................................................................................13-4
Figure 13-2 Multi-Tiered CIP Planning Process......................................................................................................13-5
Figure 13-3 Sequence of Adaptive Management Activities.............................................................................13-25
Figure 13-4 Proposed Adaptive Management Strategy for the BWS WMP and CIP.............................13-26
List of Tables
Table 2-1 BWS Strategic Plan Goals and Objectives ................................................................................................2-2
Table 2-2 Water Master Plan Objectives.......................................................................................................................2-7
Table 3-1 Stakeholder Advisory Group Meetings and Topics .............................................................................3-4
Table 3-2 Summary of Stakeholder Advisory Group Water Conservation Suggestions ..........................3-7
Table 5-1 Key State of Hawaiʻi Water System Standards that Affect the BWS System and
BWS Adaptations........................................................................................................................................5-3
Table 5-2 Historical Production Data and Seasonal Peaking Factors ..............................................................5-8
Table 5-3 Domestic Consumption Guidelines: Oʻahu Standards versus 2012 Usage Data ....................5-9
Table 6-1 Water Supply Sources by Model System..................................................................................................6-4
Table 6-2 Booster Pumps and Transmission Lines by Model System .............................................................6-5
Table 6-3 Reservoirs by Model System .........................................................................................................................6-5
Table 6-4 Distribution Pipelines by Diameter............................................................................................................6-6
Table 7-1 BWS Demand by Decade and Land Use Districts .................................................................................7-2
Table 7-2 BWS Historical Per Capita Demand by Land Use District.................................................................7-4
Table 7-3 BWS-Served Population Estimates.............................................................................................................7-9
Table 7-4 BWS Per Capita Demand Estimates............................................................................................................7-9
Table 7-5 Most Probable Demand Projection by Land Use District ...............................................................7-11
Table 7-6 High Range Demand Projection by Land Use District......................................................................7-11
Table 7-7 Existing and Future Demands by Nonpotable Users in ‘Ewa .......................................................7-13
Table 8-1 Summary of Oʻahu’s Aquifers........................................................................................................................8-9
Table 8-2 BWS Groundwater Average Annual Supplies by Aquifer Sector.................................................8-11
Table 8-3 Potential Alternative Water Sources.......................................................................................................8-18
Table 9-1 Summary of Potential Issues and Projects for Water Quality Improvement and
Regulatory Compliance............................................................................................................................9-8
Table 10-1 Existing and Future Most Probable ADD Projection by Model System .................................10-5
Table 10-2 Existing and Future High Range ADD Projection by Model System........................................10-5
Table 10-3 Supply Needs for MDD (Based on Standards) ...............................................................................10-19
Table of Contents
viii October 2016
Table 10-4 Storage Capacity Needs (Based on Standards) .............................................................................10-19
Table 10-5 Pumping Capacity Needs (Based on Standards)...........................................................................10-20
Table 10-6 Pipeline Capacity Needs (Based on 48-Hour EPS MDD and Peak Hour
Scenarios).................................................................................................................................................10-20
Table 10-7 Pipeline Capacity Needs Related to Meeting Fire Flows (Based on Standards) .............10-21
Table 11-1 Pipe Replacement Rate and Impact on Average Pipe Age...........................................................11-9
Table 11-2 Risk Analysis CoF and LoF Factors .....................................................................................................11-14
Table 11-3 Reservoirs Requiring High Priority Repairs...................................................................................11-25
Table 12-1 Water Master Plan Major Findings and Recommendations.......................................................12-2
Table 13-1 Approximate Replacement Value of Existing Potable Water System by Facility
Type...............................................................................................................................................................13-3
Table 13-2 CIP Prioritization: Consequence of Failure Criteria and Metrics .............................................13-8
Table 13-3 Method of Identifying Projects for the CIP.........................................................................................13-9
Table 13-4 Proposed Scorecard for Tracking Infrastructure Health ..........................................................13-18
October 2016 i
Abbreviations and Acronymsμg/L micrograms per liter
ACI American Concrete Institute
ADD average day demand
AL Action Level
ASCE American Society of Civil Engineers
AWWA American Water Works Association
Board BWS Board of Directors
BWS Board of Water Supply
CCL Contaminant Candidate List
CIP Capital Improvement Program
City City and County of Honolulu
CoF consequence of failure
CPD Capital Projects Division
Cr6+ hexavalent chromium
CWRM State of Hawaiʻi Commission on Water Resource Management
D/DBPR Stage 1 Disinfectant/Disinfection Byproducts Rule
DBP disinfection byproducts
DCP 1,2-dichloropropane
DCR demand-capacity ratio
DNLR Department of Land and Natural Resources
DOH Hawaii State Department of Health
DPP City and County of Honolulu Department of Planning and Permitting
EPA United States Environmental Protection Agency
EPS extended period simulation
EST Engineering Support Technicians
fps feet per second
FSMA Food Safety Modernization Act
FY fiscal year
GAC granular activated carbon
GIS Geographical Information System
gpcd gallons per capita per day
gpd gallons per day
gpd/acre gallons per day per acre
gpd/unit gallons per day per unit
gpm gallon per minute
Group Stakeholder Advisory Group
GWR Ground Water Rule
KMWP Koʻolau Mountain Watershed Partnership
LBP line booster pump
LCR Lead and Copper Rule
LF linear feet
LLC Limited Liability Company
LoF likelihood of failure
Abbreviations and Acronyms
ii October 2016
LRP BWS Long Range Planning group
M million
MCL maximum contaminant level
MDD maximum day demand
MG million gallons
mg/L milligram per liter
mgd million gallons per day
NP nonpotable
OISC Oʻahu Invasive Species Committee
OWMP O’ahu Water Management Plan
PCE tetrachloroethylene
PDR Project Definition Report
PFB probability of future breaks
PMIS Project Management Information System
PRV pressure reducing valve
psi pounds per square inch
PVC polyvinyl chloride
PWA pipe wall assessment
QUINCI Quality Infrastructure Conservation Initiative
R&D research and development
R&R renewal and replacement
RO reverse osmosis
RTU remote telemetry unit
SCADA Supervisory Control and Data Acquisition
SOP Standard Operation Procedure
Standards 2002 State of Hawai‘i Water System Standards
State State of Hawai‘i
SY sustainable yield
TCE trichloroethylene
TCP 1,2,3-trichloropropane
TCR Total Coliform Rule
TDH total dynamic head
TOD transit-oriented development
TTHM total trihalomethane
UH University of Hawai‘i
U.S. United States
USGS United States Geological Survey
WMP Water Master Plan
WMWP Waiʻanae Mountains Watershed Partnership
WRF Water Recycling Facility
WUP Water Use Permit
WWTP wastewater treatment plant
October 2016 iii
Glossary
ahupua‘a – Ancient Hawaiian land division roughly following the contours of watersheds.
Aquifer – A water bearing geological formation that stores and/or transmits water, such as to
wells and springs.
Aquifer sector area – A large region which reflects broad hydrogeological similarities yet
maintains traditional hydrographic, topographic, and historical boundaries where possible.
Oahu is divided into seven aquifer sector areas: North, Wai‘anae, Central, Windward, Pearl
Harbor, Honolulu, and ‘Ewa Caprock.
Aquifer system area – An area within an aquifer sector area showing groundwater hydraulic
continuity.
Average day demand – The average daily water volume delivered to the system over the course of
one year.
Booster pump station – A water pump station that moves water along a transmission system or
lifts water into a higher pressure zone. The BWS has both potable and nonpotable booster
pump stations.
Capacity analysis – An evaluation to determine the ability of the water system to meet Water
System Standards under current and future demand conditions.
Capacity expansion project – Projects needed to serve existing or future demands as identified by
Standards or evaluation of system capabilities.
Capital Improvement Program – Identification and schedule of capital projects needed to
maintain the BWS infrastructure. The BWS capital improvement program identifies funding
requirements for renewal and replacement (R&R), research and development (R&D), and
capacity expansion projects.
Capital cost – A capital cost represents the total cost to bring a project to operable status. It can
therefore include the cost of planning, permitting, environmental assessment, design,
construction, construction management, and startup. As used in the Water Master Plan,
capital costs estimates do not include the cost of land.
Condition assessment – An objective evaluation of infrastructure (e.g., pipelines, reservoirs, pump
stations, etc.) by qualified professionals to determine deficiencies and identify potential
repair or replacement needs.
Construction cost – The anticipated cost to build a project by hiring a responsible, qualified
contractor selected through a public low bid process.
Glossary
iv October 2016
Consequence of failure (CoF) – The impact of a potential failure of a water system infrastructure
component, for example the failure of a particular pump station. CoF is one part of the
equation to determine risk.
Dike – In the higher elevations, where rainfall is concentrated, groundwater is restrained by
impermeable vertical rock structures called “dikes” formed by lava flows that intrude into
existing, permeable rocks.
Distribution main – A smaller size water pipeline, typically less than 16 inches in diameter. See
also Transmission main.
Domestic use – Water for household purposes such as drinking, bathing, heating, cooking, and
sanitation. Domestic water use also includes non-commercial outdoor purposes such as
watering lawns and gardens.
Groundwater – Water found below the surface of the ground, filling the porous spaces in soil,
sediment, and rocks. Groundwater originates from rain and is the source of water for
aquifers, springs, wells, and tunnel supplies.
Hydraulic model – A computer-based, mathematical model that is used to analyze the behavior of
the BWS piping, pumping, and water storage system under existing and future conditions.
Kuleana – A cultural concept meaning responsibility.
Likelihood of failure (LoF) – The probability that a component of the infrastructure will fail.
Line booster pump station – A type of booster pump station that moves water along a major
transmission main. See also Booster pump station.
Main break – A common measure of pipeline condition. Whereas most agencies only count major
blow-outs or catastrophic pipe ruptures as breaks, the BWS includes the identification and
repair of pipe leaks in its main break count, if the leak is on a pipe that is four inches in
diameter or larger.
Maximum day demand – The maximum water use in a 24-hour period during the year, which
generally occurs during the maximum month of usage in summer. Maximum day demand
occurs around August or September for the BWS system.
Municipal use – The domestic, industrial, and commercial use of water.
Nonpotable water – Water that does not meet State Department of Health drinking water
standards. The BWS has separate nonpotable systems that are used only to provide water for
industrial and irrigation purposes.
Peak hour demand – The peak one-hour period of flow on the day of maximum demand.
Peaking supply – Supplementary supplies used to meet peak hour demands in certain areas.
Potable water – Water fit or suitable for drinking.
Glossary
October 2016 v
Pressure zone – An area of service within a water distribution system that is served by a
source(s) or booster pump station(s) that provides the same range of hydraulic gradient.
Renewal and replacement project – A type of capital improvement project that provides for
improvements to existing infrastructure.
Research and development project – A type of capital improvement project that provides for
development of data or consultant services. Recent examples of R&D projects are Red Hill
Groundwater Monitoring Wells and Waikele Gulch exploratory well.
Stakeholder Advisory Group – A diverse group of volunteer community leaders who provide a
community perspective to the Water Master Plan.
Risk – Risk equals the likelihood of failure times the consequence of failure.
Standards – See Water System Standards.
Surface water – Water in streams or lakes.
Sustainable yield – The withdrawal rate of groundwater that could be sustained indefinitely from
an aquifer without reducing either the quality of the pumped water or the volume of the
aquifer. Meant to be a guide for planning.
Transmission main – A larger size water pipeline, 16 inches or larger in diameter. See also
Distribution main.
Water Management Area – A geographic area which has been designated pursuant to Hawaiʻi Administrative Rules Title 13 Chapter 171 as requiring management of the ground or surface
water resource, or both. Designated by the Commission on Water Resource Management
when it is determined that water resources in the area may be threatened by existing or
proposed withdrawals or diversions of water.
Water pumpage – The volume of water pumped, generally from a groundwater source.
Water source – A place where water comes from. The BWS potable water sources include
groundwater aquifers and tunnels. Its nonpotable water sources include recycled water, and
brackish and nonpotable wells.
Water System Standards – The State of Hawaiʻi Water System Standards with amendments. The
current Standards are dated 2002, but are updated with amendments that are considered
part of the Standards. The Standards cover planning, materials, construction, approved
material list and standard details for Board of Water Supply, Department of Water Supply -
County of Hawaiʻi, Department of Water – County of Kauaʻi, and Department of Water Supply -
County of Maui.
Watershed – An area of land that is defined by ridgelines and drains into a distinct stream.

Glossary
vi October 2016
This page intentionally left blank.

Part I
Background and Approach

October 2016 1-1
Section 1
Water Master Plan Background and Approach
The City and County of Honolulu Board of Water Supply (BWS) for the City and County of
Honolulu (City) serves approximately 145 million gallons per day (mgd) of potable water and 10
mgd of nonpotable water to roughly one million customers on Oʻahu. The municipal potable
water system provides dependable service through a complex system of 2,100 miles of pipe, 386
source and booster pumps, 212 water sources (wells, tunnels, and shafts), and 171 water storage
reservoirs. The BWS provides nonpotable water for irrigation and industrial uses through a water
recycling facility and several separate brackish sources. Groundwater is the only source for the
BWS potable water supply, coming from naturally filtered aquifers that can withstand periods of
drought. The BWS water system delivers high quality water at quantities to provide for the health
and safety of the community and has built-in redundancies and resiliency, but, as is typical with
water systems of this size, some of the infrastructure is aging and needs attention.
The BWS is committed to providing the people of Oʻahu with safe, dependable, and affordable
water now and into the future. To ensure that commitment is met efficiently and effectively, the
BWS proactively undertook this Water Master Plan (WMP), a comprehensive program that looks
ahead 30 years to evaluate the entire water system, quantify future demands and source options,
identify necessary improvements, and balance needs and costs of providing water to residents
and visitors. This WMP provides an updated, comprehensive understanding of Oʻahu’s water
supplies, water needs, and the water system, giving the BWS a roadmap to meet future needs,
establish priorities, and adopt sustainable financing strategies.
The BWS engaged in a rigorous three-year process to develop the WMP. The work effort
integrated multiple elements in formulating the plan recommendations, including consistency
with watershed management plans and development of strategies to ensure long-term
sustainability in the face of growth, climate change, and other challenges. The analysis included
performing a thorough condition assessment of the BWS’s infrastructure, developing hydraulic
models for the entire BWS system, performing hydraulic evaluations of the water systems, and
assessing necessary system improvements. The WMP also provides the basis for identifying and
prioritizing Capital Improvement Program (CIP) projects and a sustainable financial program.
The BWS Board of Directors (Board) will be adopting the WMP as the comprehensive "living"
document for future water system improvements.
1.1 BWS HistoryThe BWS was created in 1929 in response to public outcry for effective water management that
would be free from political influence. In the years prior, multiple years of wasteful water use,
droughts, and ineffective management led to reduced aquifer levels and water shortages. The
BWS was formed by the territorial legislature as a semi-autonomous agency, thus separating
water management on Oʻahu from political influence, which had been destructive over the past
decades. The BWS’s responsibilities include the undertaking of investigations, surveys, and
compilation of data relating to Oʻahu’s water resources and their development, utilization, and
Section 1 Water Master Plan Background and Approach
1-2 October 2016
conservation. The BWS has continued to strive for far-sighted planning and more efficient
management of the water system.
The BWS’s governance structure was established by State law and continues to date. Each
member of a seven-member board serves five-year staggered terms, to retain depth of
understanding for the complex issues that are common to water service management. Five
members are appointed by the Mayor with confirmation by the City Council. The remaining two
members are ex-officio: the Director of the State Department of Transportation and the Engineer
of the City Department of Facility Management. Among their responsibilities and powers, the
Board appoints the Manager and Chief Engineer of the BWS, sets important policies, approves
budgets, fixes water rates and charges, issues revenue bonds, acquires real property, and
prescribes and enforces rules and regulations having the effect of law.
1.2 WMP ApproachThe BWS’s water master planning process involved extensive research and analysis to arrive at
recommendations for improvements over the next 30 years. The WMP approach included efforts
to:
Assess existing conditions of pipes, pumps, reservoirs, wells, treatment plants, and other
facilities;
Develop and compare projections of future (2040) needs with existing water supplies and
infrastructure;
Identify needs for future supplies and improvements to existing facilities;
Develop CIP projects and a prioritized 30-year CIP (with a more detailed focus of the first
10 years) based on risks to the system and providing reliable service to customers; and
Develop a comprehensive plan to implement improvements, including priorities, schedules,
costs, financing, and rates, in conjunction with the CIP.
The methodologies for the main work elements of condition assessment, system evaluation, and
improvement projects development are discussed below.
1.2.1 Facility Condition Assessment
Approximately 10 percent of the BWS pipelines and reservoirs are over 70 years old, with 2
percent of each older than 85 years. As facilities age and approach the end of their useful lives,
they begin showing signs of wear and tear, sometimes failing outright. The BWS was aware of the
system’s age and decided to undertake the most comprehensive condition assessments ever
conducted for Oʻahu’s water system to provide data that would help determine where to spend
funds based on criticality and condition. The BWS evaluated all of its potable water storage
reservoirs, granular activated carbon (GAC) treatment facilities, and pump stations, and the
physical condition of selected critical pipelines, tunnel facilities, and Base Yards. The condition
assessments were an important source of information for the WMP’s identification of significant
infrastructure risks to Oʻahu’s water system and prioritization of necessary repair, rehabilitation,
and replacement projects.
Section 1 Water Master Plan Background and Approach
October 2016 1-3
Evaluation methods varied depending upon the type of facility, accessibility, potential problems,
and information desired. They ranged from physical evaluation to analyzing data gathered using
state-of-the-art technology.
1.2.2 System Capacity Evaluation
The BWS developed hydraulic models of its water system to evaluate the existing system under
both current and future demand conditions, identify deficiencies, and evaluate capital and/or
operational improvements to address these deficiencies. The water system was divided into 13
separate sub-systems (10 potable and 3 nonpotable) and a hydraulic model was developed for
each, covering different geographic areas.
The hydraulic models simulated how each water system works, using inputs of water demands,
daily demand patterns, and locations and operational characteristics of pipelines, pump stations,
reservoirs, wells, tunnels, and valves. The model outputs included flows at wells and pump
stations, water pressure, and reservoirs levels. Each system was evaluated for its ability to meet
operational standards during average conditions, peak demand periods, and firefighting flow
conditions.
1.2.3 System Improvements Development
In identifying projects for system improvement, the BWS develops projects in three primary
categories: renewal and replacement (R&R); capacity expansion; and research and development
(R&D). R&R and capacity expansion are the two largest categories of projects included in the
annual and rolling six-year BWS CIPs. Within those categories, the system improvements projects
are evaluated and placed within five major groups, consisting of pumps, reservoirs, pipelines,
treatment facilities, and operating facilities.
The condition assessment efforts discussed in Section 1.2.1 resulted in the development of the
majority of the R&R projects included in the 30-year CIP. Capacity expansion projects included
expansion or enlargement of existing facilities (i.e., pump stations, reservoirs, pipelines, or
treatment facilities), or development of new projects to meet the existing and future needs of the
BWS system. Capacity expansion projects were identified by the hydraulic models and driven by
existing and future water demands and the need to provide additional infrastructure in order to
meet those demands. These projects were developed by evaluating the existing and future system
needs against specific criteria and standards. The BWS uses water system standards applicable to
all of the Hawaiian Islands with specific amendments for its system.
Some projects identified, particularly alternative supply or major infrastructure expansions, will
require additional studies or planning to determine the most feasible alternative before moving
them forward into design phases. These study/planning R&D projects include items such as
exploratory groundwater wells, feasibility studies to optimize water systems, facility siting
studies, and environmental documentation. Climate change research on impacts to resource
sustainability and sea level rise vulnerability are ongoing, but are funded by the BWS Operating
budget.
Section 1 Water Master Plan Background and Approach
1-4 October 2016
1.3 WMP Report OrganizationThis report highlights the key findings from the WMP process. Important findings in Sections 4
through 11 are summarized at the beginning of each chapter and identified with a code (for
example, DMND-1 for the first finding in the section on water demands). These codes are
repeated in Section 12 to easily tie findings from each section to the recommendations for BWS
action listed in Section 12.
The WMP has 13 sections organized into 3 parts. These parts group together similar types of
sections to help guide readers to relevant information.
Part I – Background and Approach
Section 1, Water Master Plan Background and Approach, describes the purpose of the WMP
and summarizes the methodology used to develop the report.
Section 2, Related BWS Work, connects the WMP efforts to programs and initiatives that are
guiding BWS actions and presents the WMP objectives.
Section 3, Stakeholder Advisory Group Recommendations, describes the purpose and process
behind the Stakeholder Advisory Group.
Section 4, Water Supply Sustainability, discusses BWS efforts to ensure that water supply is
managed in a sustainable way, consistent with the principles of conserve, recharge, and
reuse.
Section 5, Water System Planning Standards, presents the planning criteria used to define
operating performance of the water system infrastructure.
Section 6, Description of BWS Water System, presents an overview of the island-wide system
and characteristics of the 10 individual modeled water systems.
Part II – Technical Evaluation
Section 7, Historical and Future Water Demands, provides recent water demand trends, the
demand projection methodology, and the projected future water demands by each water
system.
Section 8, Current and Future Water Supply Sources, addresses the existing water supply
sources in the BWS service area, water use and facilities, trends, and uncertainties related
to these supplies, and potential future supply sources.
Section 9, Water Quality, Regulations, and Treatment, reviews current and future water
quality regulations and potential water quality issues that may affect the BWS water
system.
Section 10, System Capacity Evaluation, provides the results of the hydraulic evaluation of
each water system.
Section 1 Water Master Plan Background and Approach
October 2016 1-5
Section 11, Facility Condition Assessment, summarizes the condition assessments conducted
on the BWS’s pipelines, reservoirs, pump stations, wells, base yards, and treatment
facilities, and presents recommendations for improvements.
Part III – Findings and Implementation
Section 12, Findings and Recommendations, provides the findings drawn from the planning
and assessment efforts and a high-level summary of the CIP projects recommended over
the 30-year planning horizon.
Section 13, Implementation, reviews the range of issues, in addition to infrastructure
planning and prioritization, that are necessary for successful implementation of the WMP
and the approach and rate of CIP implementation.

Section 1 Water Master Plan Background and Approach
1-6 October 2016
This page intentionally left blank.
October 2016 2-1
Section 2
Related BWS Work
Over the past several years, the BWS has further defined its mission and vision, the principles that
are the basis of the BWS’s management of Oʻahu’s water supplies. The WMP supports the multi-
tiered planning effort of Oʻahu’s General Plan, regional watershed plans, and City plans and
policies. The BWS also embraced input from outside the utility by creating the Stakeholder
Advisory Group (Group). Section 2 discusses the water management framework and introduces
the WMP’s objectives developed by the Group. Additional information on BWS programs is
described in more detail in Section 3, Stakeholder Advisory Group, and Section 4, Water Supply
Sustainability.
2.1 Guiding Principles2.1.1 Vision
The BWS’s vision is Ka Wai Ola, Water for Life. This vision, the motivating force behind BWS
planning policies and actions, captures the critical need of water – that water is the basis for life.
With this vision comes the responsibility of the BWS’s stewardship of and the duty to manage our
natural water resources for both present and future generations. The ancient Hawaiians valued
water as one of nature’s greatest gifts and they lived in harmony with water. Land divisions
(ahupua‘a) mirrored the natural ecosystem – land was divided according to watershed
boundaries, spanning from the mountain tops through upland forests to flatlands and the shore.
Formal rules governed the use of water and regulations were established and enforced in order
to cultivate the resources in each ahupua‘a, to conserve as much as possible to lower the stress on
the resources, and to ensure that a pure supply was available to everyone whether they lived in
the mountains or close to the sea.
2.1.2 Mission
In Hawaiʻi, water is a public trust and the BWS serves its customers with this trust in mind. The
mission of the BWS is to provide a safe, dependable, and affordable water supply now and into
the future.
Safe addresses the multiple areas of individual and community needs. Water must
meet all statutory and regulatory compliance standards in providing water for
consumption and other uses. Water must provide for public health and safety such as
for firefighting and sanitation needs.
Dependable relies upon three factors:
- Sources of water must be sufficient and available now and into the future. The BWS
ensures this through management of the watershed and groundwater supply, long-
range planning, and possible development of alternative sources of water.
- A water system that is designed, constructed, and operated with system redundancy
that continues delivery of water even with disruptions in the system.
- Employees of the BWS who are committed to providing their customers with high
quality water and excellent service.
Section 2 BWS Related Work
2-2 October 2016
Affordable water delivery is primary. The BWS establishes programs for efficiency in
water use through conservation, infrastructure installation, and water system
operations and maintenance. The BWS continually implements changes to its systems
to deliver water at the most responsible cost to the customer.
2.1.3 Strategic Plan
To continue to efficiently and effectively fulfill this important mission, the BWS developed a 3-
year Strategic Plan1 in 2014. The Strategic Plan provides an internal and external perspective of
the commitment of the BWS employees to deliver its mission through focus on three strategic
goals – resource, operational, and financial sustainability. These three strategic goals are
interrelated and coordinated with the three main points of the BWS’s mission. The WMP’s
evaluations and recommendations are direct efforts to support the BWS’s goals of resource
sustainability and operational sustainability and to inform sustainable financial planning.
Resource Sustainability
Protect and manage our groundwater supplies and watersheds through adaptive and
integrated strategies.
Operational Sustainability
Foster a resilient and collaborative organization utilizing effective and proactive
operational practices consistent with current industry standards.
Financial Sustainability
Implement sound fiscal strategies to finance our operating and capital needs to
provide dependable and affordable water service.
For each goal, the Strategic Plan established the specific objectives presented in Table 2-1, each of
which is relevant to and informs this WMP.
Table 2-1 BWS Strategic Plan Goals and Objectives
Strategic Goals Category Strategic Objectives
Climate ChangeWe will adapt to climate change to manage Oʻahu’s water
resources and protect the limited water supply.
Water QualityWe will protect, preserve, and collaborate to ensure the safety and
quality of Oʻahu’s fresh water resource.
Resource
Sustainability
CommunicationWe will communicate the value of water to engage the community
in a shared stewardship of Oʻahu’s water resources.
OrganizationWe will ensure the necessary workforce and competencies to
support the BWS needs.
InfrastructureWe will renew and improve the water system to ensure water
system adequacy, dependable service, and operational efficiency.
Customer ServiceWe will proactively and consistently provide a quality experience in
every customer interaction.
Operational
Sustainability
Technology
We will ensure that our technology systems are current and
leverage opportunities in technology to effectively support current
and future BWS needs.
Financial
Sustainability
Financial
Management
We will pursue and leverage financial opportunities and implement
strategies to affordably meet our financial and regulatory
requirements.
1 BWS. Strategic Plan 2014 – 2017. Available at: http://www.boardofwatersupply.com/files/BWS%20Strategic%20Plan%202014-2017.pdf. August 25, 2014.
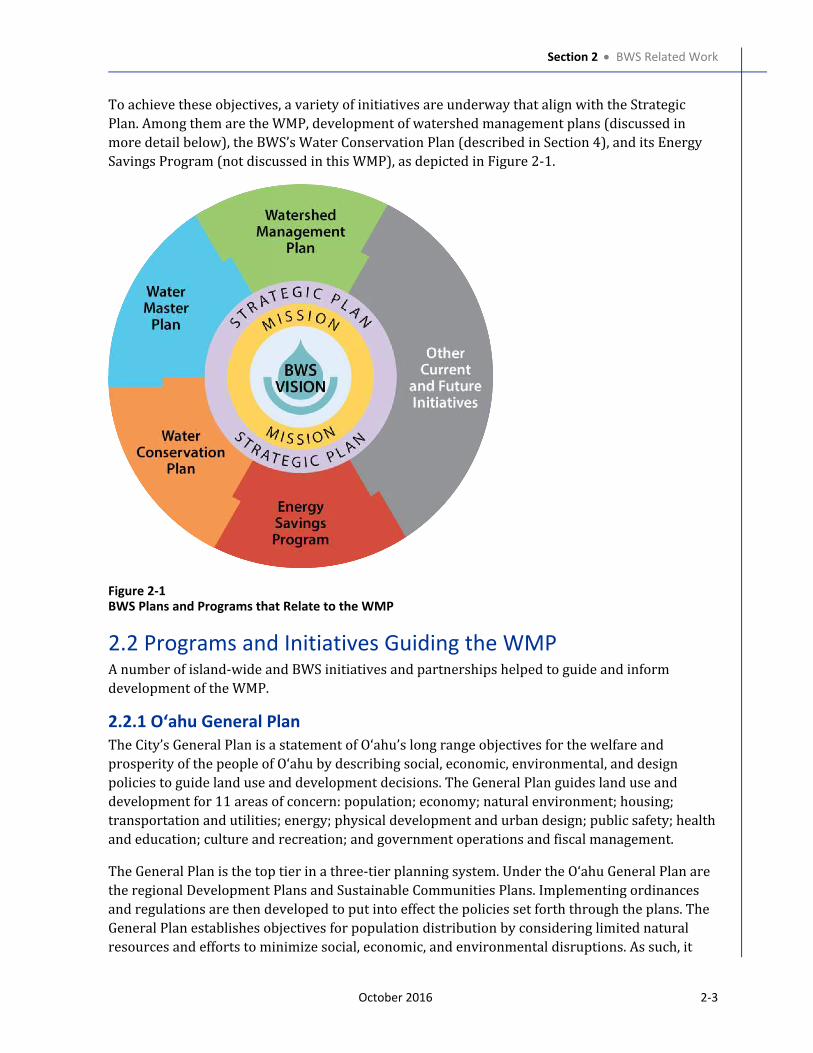
Section 2 BWS Related Work
October 2016 2-3
To achieve these objectives, a variety of initiatives are underway that align with the Strategic
Plan. Among them are the WMP, development of watershed management plans (discussed in
more detail below), the BWS’s Water Conservation Plan (described in Section 4), and its Energy
Savings Program (not discussed in this WMP), as depicted in Figure 2-1.
Figure 2-1
BWS Plans and Programs that Relate to the WMP
2.2 Programs and Initiatives Guiding the WMPA number of island-wide and BWS initiatives and partnerships helped to guide and inform
development of the WMP.
2.2.1 Oʻahu General Plan
The City’s General Plan is a statement of Oʻahu’s long range objectives for the welfare and
prosperity of the people of Oʻahu by describing social, economic, environmental, and design
policies to guide land use and development decisions. The General Plan guides land use and
development for 11 areas of concern: population; economy; natural environment; housing;
transportation and utilities; energy; physical development and urban design; public safety; health
and education; culture and recreation; and government operations and fiscal management.
The General Plan is the top tier in a three-tier planning system. Under the Oʻahu General Plan are
the regional Development Plans and Sustainable Communities Plans. Implementing ordinances
and regulations are then developed to put into effect the policies set forth through the plans. The
General Plan establishes objectives for population distribution by considering limited natural
resources and efforts to minimize social, economic, and environmental disruptions. As such, it
Section 2 BWS Related Work
2-4 October 2016
sets the stage for where future growth will occur, focusing on areas that are best suited to
accommodate sustainable growth.
2.2.2 Watershed Planning
In pre-contact Hawaiʻi, the land was divided into ahupua‘a which mirrored the lines of natural
watersheds and ecosystems. Their boundaries extended from the mountains, through upland
forests, streams and lowlands, and to the coral reefs. There was access to upland forests for
timber, stream water for drinking, agricultural lands for crops and the ocean for fishing and travel
by sea. Cultural concepts like kuleana (responsibility), pono (fairness and morality), and kapu
(code of conduct of laws) governed the ahupua‘a. No one could take more than what they could
use, and stiff penalties existed. The ahupua‘a principle ensured natural systems were kept in
balance and acknowledged inherent relationships between land and sea (mauka and makai),
natural resource management and cultural practices (which are one and the same), and between
water and life. Rules guided people’s behaviors. The ahupua‘a principle is more than a division of
land; it also embodies resource management through a balance of environmental, economic, and
social/cultural values.
The BWS continues the ahupua‘a principle through its watershed planning processes. Chapter 30,
Water Management, of the Revised Ordinances of the City established the Oʻahu Water
Management Plan (OWMP), which is a resources management plan, unlike the infrastructure
planning of the WMP. The OWMP is required by State law (Hawaiʻi Revised Statute 174c, the State
Water Code) and becomes a part of the Hawaiʻi Water Plan. Each county is required to develop its
own plan that is adopted by ordinance by the respective county council.
The OWMP has evolved into a framework of eight regional watershed management plans, one for
each City land use district, prepared by the City Department of Planning and Permitting (DPP)
and the BWS to provide short-, mid-, and long-range guidance for the sustainable management
and use of Oʻahu's valuable and finite surface and groundwater resources in meeting demands
consistent with City land use plans. The OWMP goal is to formulate an environmentally holistic,
community based, and economically viable watershed management plan that will provide a
balance between: 1) the protection, preservation and management of O‘ahu’s watersheds; and 2)
sustainable groundwater and surface water use and development to serve present users and
future generations. Five major objectives are common to all watershed management plans2:
Promote sustainable watersheds;
Protect and enhance water quality and quantity;
Protect native Hawaiian rights and traditional and customary practices;
Facilitate public participation, education, and project implementation; and
Meet future water demands at reasonable cost.
The BWS began the development of the district-wide watershed management plans in 2004. The
plans are developed with input from community stakeholders and neighborhood boards, and
2 BWS. 2015. North Shore Watershed Management Plan, Public Review Draft. Prepared for BWS. Prepared by Group 70 International. Available at: http://www.boardofwatersupply.com/files/NSWMP_PublicReviewDraft_11.3.15.pdf. November 2015.
Section 2 BWS Related Work
October 2016 2-5
align with State and City policies. The plans contain district-specific policies, watershed and water
supply projects, programs, and strategies to address a range of surface water, groundwater, land
management, cultural resources, and water supply issues. Implementation of the plans is a long-
term, ongoing process involving many project champions from public agencies, non-profit
entities, community groups, and private land owners and businesses. Funding of these projects
will potentially be provided by various federal, state, and city programs and agencies, and by
private foundations and businesses.
The BWS’s long-term planning incorporates this watershed approach and information from the
watershed management plans because water systems must be designed to align with land use
plans and provide available water supplies where demand for water is located. The siting of new
sources needs to explicitly account for the complexities of watersheds including available
sustainable yields in areas that do not impact stream flows and their associated habitat,
traditional and customary practices, water rights, and near shore waters. Siting of new sources
must also account for the long-range water needs of agriculture and should not detrimentally
affect existing sources of water supply.
The Waiʻanae, Koʻolauloa, and Koʻolaupoko watershed management plans are complete. The ʻEwa, Central Oʻahu, and North Shore watershed management plans are under development, with
the North Shore submitted for adoption. The Primary Urban Center’s plan will begin shortly, and
the East Honolulu watershed management plan will be the final plan to be developed.
2.2.3 Hawaiʻi Fresh Water Initiative
The Hawaiʻi Fresh Water Initiative was launched in 2013 to bring multiple, diverse parties
together to develop a forward-thinking and consensus-based strategy to increase water security
for the Hawaiian Islands. Organized by the independent, nonprofit Hawaiʻi Community
Foundation, the Initiative relied on the Hawaiʻi Fresh Water Council, a blue ribbon advisory panel
of individuals with deep knowledge of water and a collaborative spirit, to articulate a vision for a
more secure and sustainable water future based on shared values and shared sacrifice. Their
“Blueprint for Action” is the result of this work and provides Hawaiʻi policy and decision-makers
with a set of solutions that have broad, multi-sector support in the fresh water community that
should be adopted over the next three years to put Hawaiʻi on a path toward water security. The
Blueprint presents a state-wide goal of 100 mgd in additional fresh water capacity and focuses on
three aggressive water strategy areas and individual targets that the public and private sectors
must work together to achieve by 20303:
Conservation: Improve the efficiency in how water is transported and used so that each Hawaiʻi resident requires 15 percent less water per capita to meet our needs.
Recharge: Increase Hawaiʻi’s ability to capture rainwater in key aquifer areas by improving
stormwater capture and nearly doubling the size of our actively protected watershed areas.
By 2030, this goal will provide 30 mgd in increased water availability.
3 Hawaiʻi Community Foundation. 2015. Hawaiʻi Fresh Water Initiative, A Blueprint for Action: Water Security for an Uncertain Future, 2016 – 2018. Available at: http://www.boardofwatersupply.com/files/Fresh_Water_Blueprint_FINAL_062215_small.pdf.
Section 2 BWS Related Work
2-6 October 2016
Reuse: More than double the amount of wastewater currently being reused in the Islands to
50 mgd. By 2030, this goal will provide an additional 30 mgd in increased water
availability.
The BWS is a partner in the Fresh Water Initiative and has worked to incorporate the three water
strategy areas into its resource planning. The BWS has a long and successful track record of
promoting water conservation, as evidenced by the reduction in per capita water use in the last
30 years (conservation efforts are further discussed in Section 4 and Section 7, Historical and
Future Water Demands). The BWS has developed a recycled water system that provides eight
mgd of supply for irrigation needs in ʻEwa (recycled water is further discussed in Section 4 and
Section 8, Current and Future Water Supply Sources). The BWS is also investigating stormwater
capture in the Nuʻuanu Valley and, if successful, will add critical supply to the Honolulu aquifer
system (see Section 4).
2.2.4 BWS Stakeholder Advisory Group
In April 2015, the Board of Directors of the BWS approved the formation of a Stakeholder
Advisory Group whose purpose is to provide important feedback on the WMP, rate study, and
other important initiatives. The Group is one of many BWS initiatives that demonstrate its
commitment to increase the consistency, responsiveness, and transparency of the BWS’s
communications and public engagement. The Group, described in more detail in Section 3, is
helping the BWS obtain valuable feedback from respected professionals and community
representatives to ensure their needs are considered as the WMP is developed. The Group
consists of approximately 28 highly respected local residents and community leaders with
expertise in many disciplines and who have an active and ongoing interest in issues relevant to
the BWS. The Group represents diverse communities, interests, and geographies across Oʻahu. The Group has provided feedback related to the WMP, as well as other BWS issues, including but
not limited to water conservation, customer services, field services, outreach and education, and
future rate adjustments. They also provided input on the objectives for the WMP planning
process. Although the Group functions in an advisory capacity and does not have decision-making
authority, it will make recommendations to the BWS management and Board, which have
expressed their intent to consider and implement, if appropriate, the Group’s recommendations.
2.3 WMP ObjectivesThe BWS Stakeholder Advisory Group has developed the following objectives shown in Table 2-2
for the WMP using a consensus-based process. These plan objectives support the BWS’s water
resource planning efforts and the ahupua‘a model of sustainable resource management. In a
world of limited resources, meeting these objectives will require fiscal prudence, balance,
sensitivity, and shared kuleana. These objectives enable the BWS to fulfill its roles and
responsibilities in a larger system of agencies contributing to the management of water
resources.
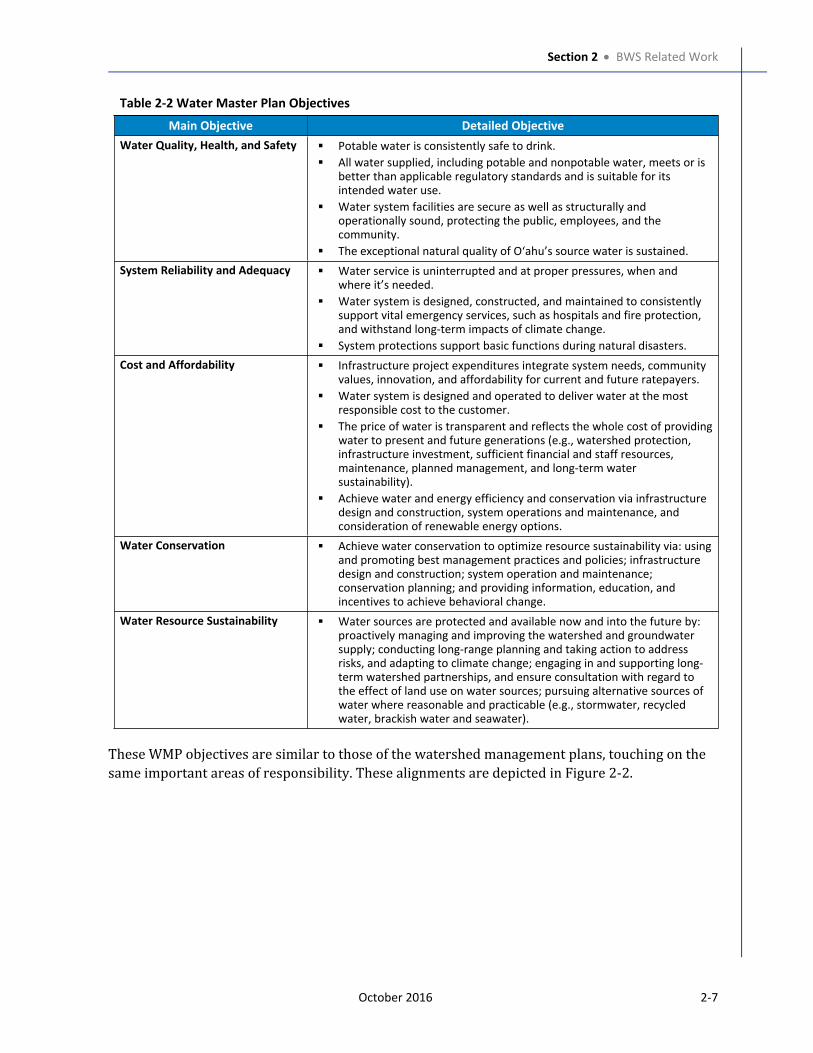
Section 2 BWS Related Work
October 2016 2-7
Table 2-2 Water Master Plan Objectives
Main Objective Detailed Objective
Water Quality, Health, and Safety Potable water is consistently safe to drink.
All water supplied, including potable and nonpotable water, meets or is
better than applicable regulatory standards and is suitable for its
intended water use.
Water system facilities are secure as well as structurally and
operationally sound, protecting the public, employees, and the
community.
The exceptional natural quality of O‘ahu’s source water is sustained.
System Reliability and Adequacy Water service is uninterrupted and at proper pressures, when and
where it’s needed.
Water system is designed, constructed, and maintained to consistently
support vital emergency services, such as hospitals and fire protection,
and withstand long-term impacts of climate change.
System protections support basic functions during natural disasters.
Cost and Affordability Infrastructure project expenditures integrate system needs, community
values, innovation, and affordability for current and future ratepayers.
Water system is designed and operated to deliver water at the most
responsible cost to the customer.
The price of water is transparent and reflects the whole cost of providing
water to present and future generations (e.g., watershed protection,
infrastructure investment, sufficient financial and staff resources,
maintenance, planned management, and long-term water
sustainability).
Achieve water and energy efficiency and conservation via infrastructure
design and construction, system operations and maintenance, and
consideration of renewable energy options.
Water Conservation Achieve water conservation to optimize resource sustainability via: using
and promoting best management practices and policies; infrastructure
design and construction; system operation and maintenance;
conservation planning; and providing information, education, and
incentives to achieve behavioral change.
Water Resource Sustainability Water sources are protected and available now and into the future by:
proactively managing and improving the watershed and groundwater
supply; conducting long-range planning and taking action to address
risks, and adapting to climate change; engaging in and supporting long-
term watershed partnerships, and ensure consultation with regard to
the effect of land use on water sources; pursuing alternative sources of
water where reasonable and practicable (e.g., stormwater, recycled
water, brackish water and seawater).
These WMP objectives are similar to those of the watershed management plans, touching on the
same important areas of responsibility. These alignments are depicted in Figure 2-2.
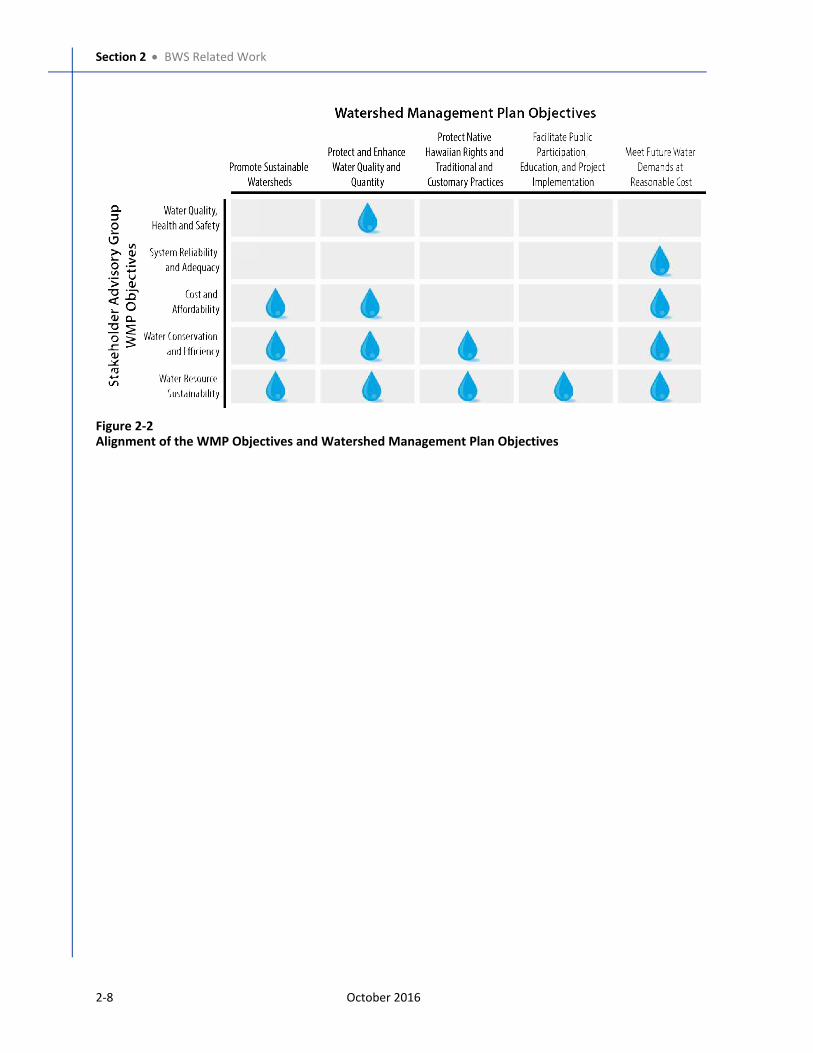
Section 2 BWS Related Work
2-8 October 2016
Figure 2-2
Alignment of the WMP Objectives and Watershed Management Plan Objectives

October 2016 3-1
Section 3
Stakeholder Advisory Group
This section describes the purpose and process
behind the BWS’s convening of a Stakeholder
Advisory Group (Group) to contribute a community
perspective to the WMP. The stakeholder group also
is providing guidance on other BWS initiatives and
will develop recommendations to the BWS
management and Board regarding both the amount
and structure of water rates to support the findings
of the WMP.
3.1 Key FindingsThe Group has been an important element in the WMP development, providing input on the
priorities, objectives, and contents of the WMP. Their continued involvement through the rate
setting process will provide the BWS with perspectives as a new rate structure is developed that
provides for sufficient infrastructure reliability while balancing costs and affordability.
3.2 Purpose and BackgroundConcurrent with early development of the WMP, the BWS faced an intensive period of challenges,
including issues with implementation of a new electronic customer information system, public
fall-out from a long-overdue rate increase, and confusion over a change to monthly billing. As it
successfully addressed and resolved these issues, significantly improving service to customers,
the BWS also committed to strengthen contact and communication with its customers,
communities, and stakeholders to be more responsive to the community and to increase public
involvement in its functions, plans, and programs. The resulting public engagement strategy
included a new customer newsletter, additional publications explaining the scope and
complexities of the water system and its operations, a continued presence at Neighborhood
Board meetings and public events, and establishment of the Group. By establishing and meeting
regularly with this Group, the BWS sought to share information and, most importantly, to hear
directly from community leaders the perspectives, values, and ideas of diverse interests across
O‘ahu.
Understanding the intensity of commitment that would be asked of Group members, the BWS
determined it would be best to engage the Group at a point in the WMP process when technical
study results would be available. Efforts to form and launch the Group began in January 2015,
allowing time for careful decision-making related to the scope of topics it would address,
organizations and communities of interest to involve, meeting format, meeting documentation,
public sharing of meeting notes, and myriad other details that would provide for timely and
smooth implementation.
provides information that
addresses the following
WMP objectives:
Water Quality, Health, and Safety
System Reliability and Adequacy
Cost and Affordability
Water Conservation
Water Resource Sustainability
Section
3
Section 3 Stakeholder Advisory Group
3-2 October 2016
Through the Group’s on-going participation, the Board seeks to learn more about the water-
related perspectives and concerns of varied constituencies. Through the Group’s links with
organizations and communities of interest, the BWS seeks to strengthen the public’s
understanding of Oʻahu’s complex water issues and enhance public confidence of the BWS’s
commitment and ability to provide safe, dependable, and affordable water now and into the
future. As the BWS has completed the WMP and now moves forward with the CIP, Financial Plan,
and Rate Study, the Group is expected to play a pivotal role by providing recommendations to the
BWS on best options to achieve the critical and delicate balance between water service adequacy
and dependability, and infrastructure costs and rate affordability.
3.3 Formation At its regularly scheduled meeting on April 27, 2015, the BWS Board authorized formation of the
Stakeholder Advisory Group to provide diverse perspectives and input in development of the
WMP and other BWS initiatives, eventually extending into the upcoming Financial Plan and Rate
Study. Initial roles of the Group were to:
Meet with BWS staff over the course of two years to consider a broad range of water-
related topics and issues;
Provide feedback on a 30-year WMP and other initiatives on the balance of needs and costs,
water conservation, customer service, outreach and education, and rates;
Contribute to a WMP that meets the needs and interests of the people of Oʻahu; and
Share information with their communities and help build understanding of Oʻahu’s complex
water system.
Considerable work and attention went into forming an active group of a manageable size for
interactive sessions. Equally significant was assuring representation of diverse interests with a
high stake in water policies, as well as coverage of all Council Districts. An additional requirement
was participants’ willingness to devote the necessary time and effort for sustained active and
meaningful participation.
A diverse and balanced group was formed of 28 individual stakeholders representing the
following interests.
Agriculture General contractors
Community organizations Large water users
Developers Military
Environment Realtors
Every Council District Restaurants
Financial Seniors/low income
Golf Travel/tourism industry
Hawaiian culture Small businesses
Homeowner associations Utilities
Section 3 Stakeholder Advisory Group
October 2016 3-3
3.4 Engagement3.4.1 Interviews
To establish a framework for participants and provide a strong start for their input to the BWS,
individual face-to-face interview/discussions were held with each person joining the Group. Two
people representing the BWS (typically, one BWS employee and one member of the consultant
team) attended each interview to facilitate clearer understanding and allow for note taking. Most
interviews ran about an hour. All of these interviews demonstrated high interest in water issues
and in sharing ideas with the BWS, as demonstrated by these stakeholder quotes.
“When the Water Master Plan is completed and as it is implemented over the next 30 years, we
stakeholders may not be here, but we were chosen to have our voices heard.”
“The Water Master Plan should have tangible solutions. Making the right decisions today is our
responsibility and our legacy to continue from now forward.”
“I believe the Water Master Plan will benefit all of us if we commit to being a part of it.”
“Agreement across the different interest areas represented by the stakeholders and the planning
group is a sign of success for the Stakeholder Advisory Group.”
“We have a chance to plan for our water future the right way and not like it was done in the past.”
“It is apparent that everyone involved with planning the Stakeholder Advisory Group really cares; you
can’t fake that.”
“These aren’t the usual players, and it is refreshing because I know we are all invested in O‘ahu’s
future.”
“It will be a success if the stakeholders and planning team can really take the different views of the
stakeholders into account while working on the Water Master Plan, and keep working until we get to
the serendipity moment where we know we have a plan that really works.”
3.4.2 Commitment to Open and Public Meetings
While Group meetings may not be subject to Hawaiʻi’s Sunshine Law, to maximize openness and
transparency these meetings have followed the Law’s intent. Meetings are announced and posted
in advance, are open to the public, include time for public comment, and are followed by posting
of meeting presentations, notes, and materials on the BWS web site1.
3.5 Topics and Stakeholder InputEarly meetings focused on building a foundational understanding of the scope and challenges of
the BWS’s complex water system. This will help the Group to consider and balance funding and
rate options. Print material, including infographics and fact sheets, were developed to help build
understanding and enable Group members to share information within their organizations and
communities.
1 The BWS Stakeholder Advisory Group materials can be found at http://www.boardofwatersupply.com/cssweb/display.cfm?sid=125077.
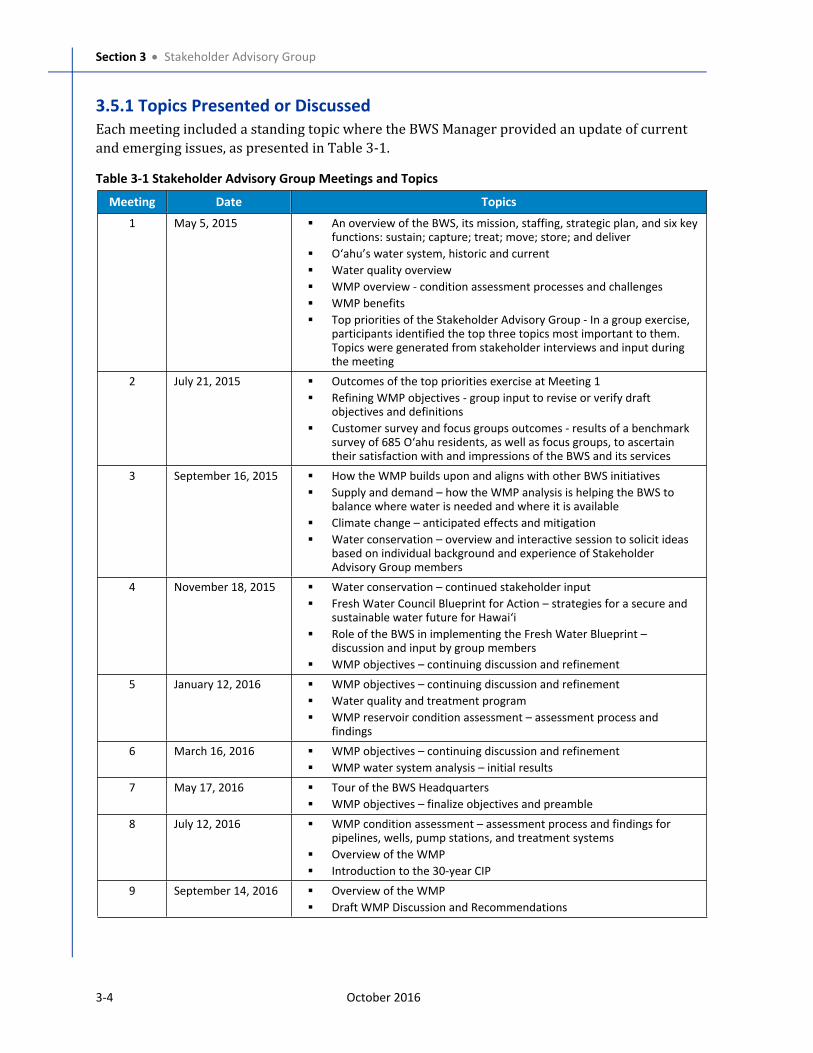
Section 3 Stakeholder Advisory Group
3-4 October 2016
3.5.1 Topics Presented or Discussed
Each meeting included a standing topic where the BWS Manager provided an update of current
and emerging issues, as presented in Table 3-1.
Table 3-1 Stakeholder Advisory Group Meetings and Topics
Meeting Date Topics
1 May 5, 2015 An overview of the BWS, its mission, staffing, strategic plan, and six key functions: sustain; capture; treat; move; store; and deliver
Oʻahu’s water system, historic and current
Water quality overview
WMP overview - condition assessment processes and challenges
WMP benefits
Top priorities of the Stakeholder Advisory Group - In a group exercise, participants identified the top three topics most important to them. Topics were generated from stakeholder interviews and input during the meeting
2 July 21, 2015 Outcomes of the top priorities exercise at Meeting 1
Refining WMP objectives - group input to revise or verify draft objectives and definitions
Customer survey and focus groups outcomes - results of a benchmark survey of 685 Oʻahu residents, as well as focus groups, to ascertain their satisfaction with and impressions of the BWS and its services
3 September 16, 2015 How the WMP builds upon and aligns with other BWS initiatives
Supply and demand – how the WMP analysis is helping the BWS to balance where water is needed and where it is available
Climate change – anticipated effects and mitigation
Water conservation – overview and interactive session to solicit ideas based on individual background and experience of Stakeholder Advisory Group members
4 November 18, 2015 Water conservation – continued stakeholder input
Fresh Water Council Blueprint for Action – strategies for a secure and sustainable water future for Hawaiʻi
Role of the BWS in implementing the Fresh Water Blueprint – discussion and input by group members
WMP objectives – continuing discussion and refinement
5 January 12, 2016 WMP objectives – continuing discussion and refinement
Water quality and treatment program
WMP reservoir condition assessment – assessment process and findings
6 March 16, 2016 WMP objectives – continuing discussion and refinement
WMP water system analysis – initial results
7 May 17, 2016 Tour of the BWS Headquarters
WMP objectives – finalize objectives and preamble
8 July 12, 2016 WMP condition assessment – assessment process and findings for pipelines, wells, pump stations, and treatment systems
Overview of the WMP
Introduction to the 30-year CIP
9 September 14, 2016 Overview of the WMP
Draft WMP Discussion and Recommendations
Section 3 Stakeholder Advisory Group
October 2016 3-5
Moving forward through 2016, the group continued meeting every other month. The Group
explored how the consensus-adopted WMP objectives led to policy recommendations made to the
Board. Topics included:
Technical analysis results;
Understanding risk-based prioritization;
CIP, Financial Plan, and Rate Study; and
BWS updates on emerging issues.
Prior to Meeting no. 8, the Draft WMP was made available for public comment, and presented to
the Group at the meeting. At Meeting no. 9, the public comments were reviewed, and the Group
was given the opportunity to discuss and make recommendations on the WMP. At the conclusion
of Meeting no. 9, the Group made a recommendation to forward the WMP to the BWS Board for
adoption.
Rates will be the dominant topic for 2017, as the Group explores options to achieve a balance
between water service adequacy and dependability, and infrastructure costs and rate
affordability. Meetings will be held monthly, with the Group applying their understanding of
water issues developed through the prior years’ activities. Through a facilitated consensus
process, the Group will advise on important choices about Oʻahu’s water future, with
recommendations to the Board to address:
What is an appropriate level of reliability?
How should the BWS support non-infrastructure initiatives?
What are the community values that influence how and to what extent costs will be
distributed among customer types?
3.5.2 Stakeholder Advisory Group Input and Ideas
Members of the Group have provided significant input, both in terms of quality and quantity.
Group members have openly shared their ideas during interactive sessions and in response to
presentations. A sampling of their more formal contributions is provided below.
3.5.2.1 Top Priorities
The Group exercise at Meeting 1 rated the significance of a range of water-related topics. While
not empirical, these results provide a general sense of the water issues deemed most significant
by stakeholders, shown in Figure 3-1.
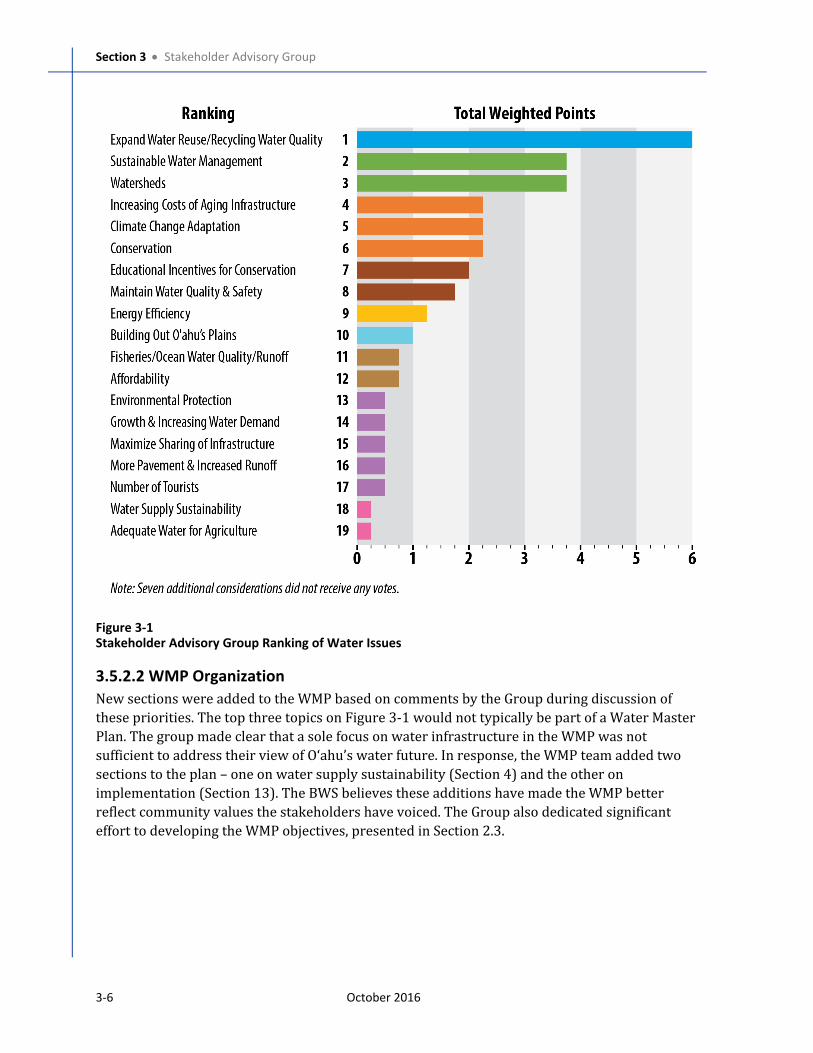
Section 3 Stakeholder Advisory Group
3-6 October 2016
Figure 3-1
Stakeholder Advisory Group Ranking of Water Issues
3.5.2.2 WMP Organization
New sections were added to the WMP based on comments by the Group during discussion of
these priorities. The top three topics on Figure 3-1 would not typically be part of a Water Master
Plan. The group made clear that a sole focus on water infrastructure in the WMP was not
sufficient to address their view of Oʻahu’s water future. In response, the WMP team added two
sections to the plan – one on water supply sustainability (Section 4) and the other on
implementation (Section 13). The BWS believes these additions have made the WMP better
reflect community values the stakeholders have voiced. The Group also dedicated significant
effort to developing the WMP objectives, presented in Section 2.3.
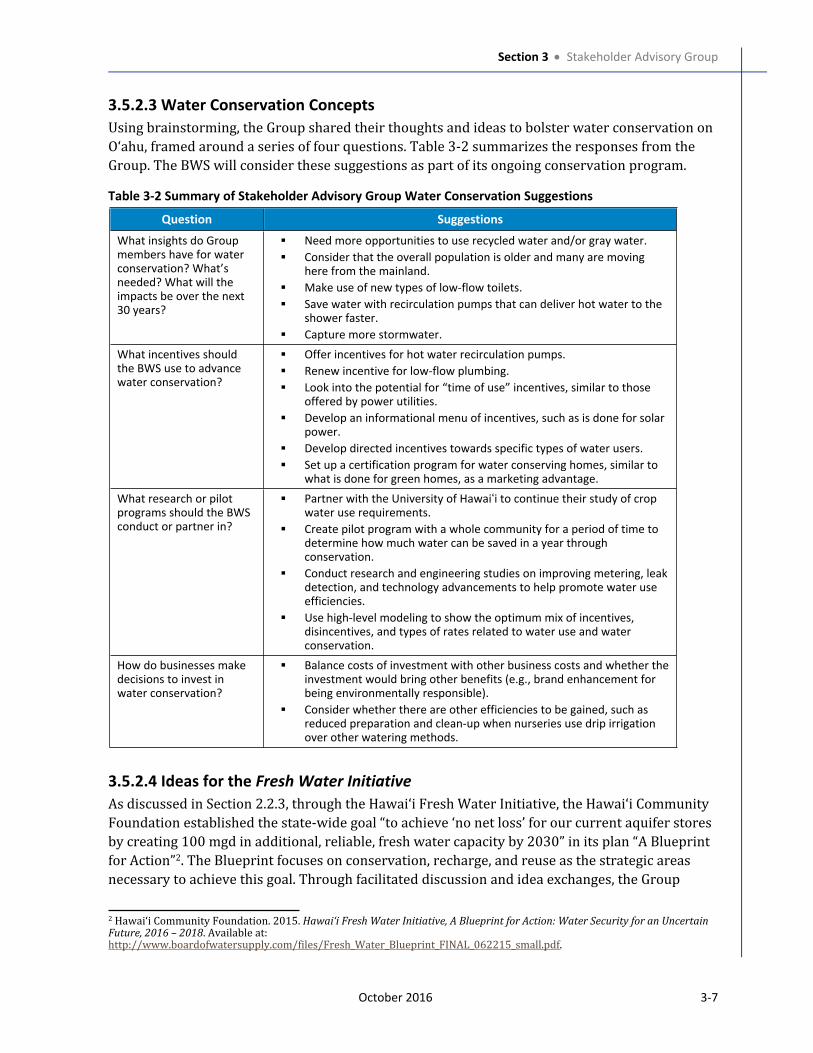
Section 3 Stakeholder Advisory Group
October 2016 3-7
3.5.2.3 Water Conservation Concepts
Using brainstorming, the Group shared their thoughts and ideas to bolster water conservation on Oʻahu, framed around a series of four questions. Table 3-2 summarizes the responses from the
Group. The BWS will consider these suggestions as part of its ongoing conservation program.
Table 3-2 Summary of Stakeholder Advisory Group Water Conservation Suggestions
Question Suggestions
What insights do Group members have for water conservation? What’s needed? What will the impacts be over the next 30 years?
Need more opportunities to use recycled water and/or gray water.
Consider that the overall population is older and many are moving here from the mainland.
Make use of new types of low-flow toilets.
Save water with recirculation pumps that can deliver hot water to the shower faster.
Capture more stormwater.
What incentives should the BWS use to advance water conservation?
Offer incentives for hot water recirculation pumps.
Renew incentive for low-flow plumbing.
Look into the potential for “time of use” incentives, similar to those offered by power utilities.
Develop an informational menu of incentives, such as is done for solar power.
Develop directed incentives towards specific types of water users.
Set up a certification program for water conserving homes, similar to what is done for green homes, as a marketing advantage.
What research or pilot programs should the BWS conduct or partner in?
Partner with the University of Hawaiʻi to continue their study of crop water use requirements.
Create pilot program with a whole community for a period of time to determine how much water can be saved in a year through conservation.
Conduct research and engineering studies on improving metering, leak detection, and technology advancements to help promote water use efficiencies.
Use high-level modeling to show the optimum mix of incentives, disincentives, and types of rates related to water use and water conservation.
How do businesses make decisions to invest in water conservation?
Balance costs of investment with other business costs and whether the investment would bring other benefits (e.g., brand enhancement for being environmentally responsible).
Consider whether there are other efficiencies to be gained, such as reduced preparation and clean-up when nurseries use drip irrigation over other watering methods.
3.5.2.4 Ideas for the Fresh Water Initiative
As discussed in Section 2.2.3, through the Hawaiʻi Fresh Water Initiative, the Hawaiʻi Community
Foundation established the state-wide goal “to achieve ‘no net loss’ for our current aquifer stores
by creating 100 mgd in additional, reliable, fresh water capacity by 2030” in its plan “A Blueprint
for Action”2. The Blueprint focuses on conservation, recharge, and reuse as the strategic areas
necessary to achieve this goal. Through facilitated discussion and idea exchanges, the Group
2 Hawaiʻi Community Foundation. 2015. Hawaiʻi Fresh Water Initiative, A Blueprint for Action: Water Security for an Uncertain Future, 2016 – 2018. Available at: http://www.boardofwatersupply.com/files/Fresh_Water_Blueprint_FINAL_062215_small.pdf.
Section 3 Stakeholder Advisory Group
3-8 October 2016
framed the appropriate role for the BWS in working to achieve the Blueprint goals. The Group
concurred that the BWS should take a lead in water conservation. BWS will collaborate with
willing partners, the City Department of Environmental Services, City administration, and
developers to expand water reuse opportunities that arise. For recharge, the BWS is an important
player and a direct beneficiary of forestry management activities and projects in priority
watersheds that sustain large BWS pumping stations within the watershed. The BWS also owns
large dams that can capture stormwater and be used to recharge the aquifer, directly supplying
downgradient BWS pumping stations.
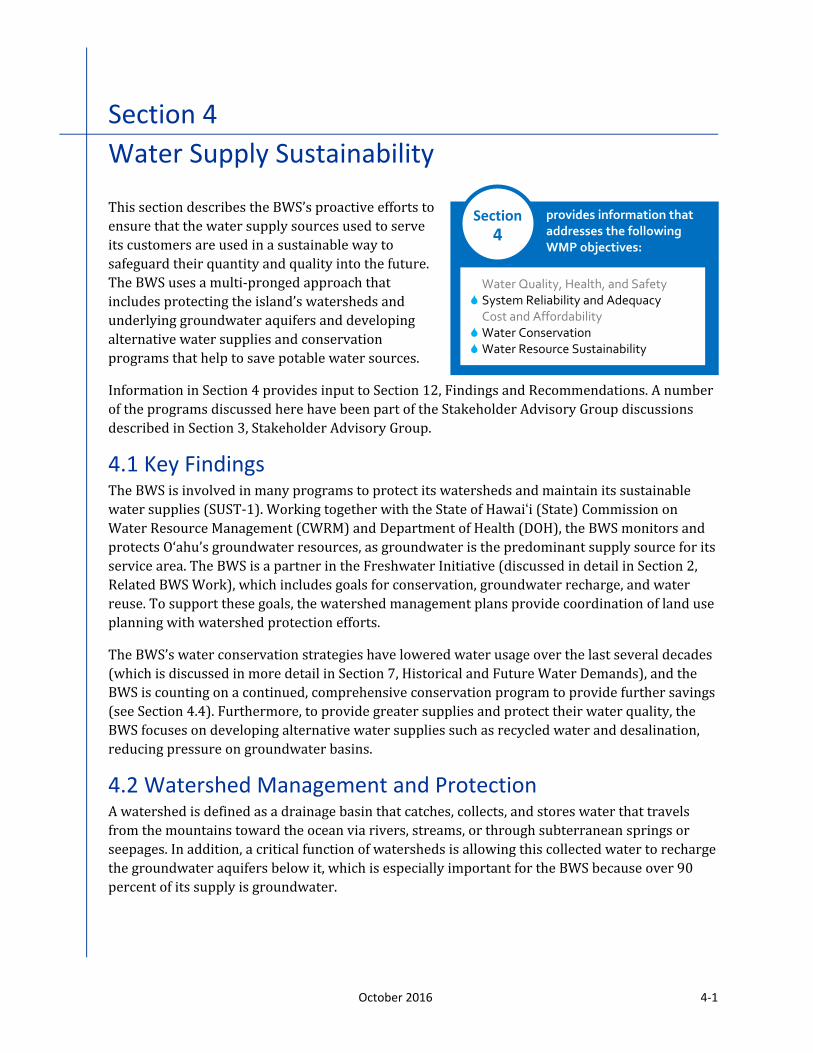
October 2016 4-1
Section 4
Water Supply Sustainability
This section describes the BWS’s proactive efforts to
ensure that the water supply sources used to serve
its customers are used in a sustainable way to
safeguard their quantity and quality into the future.
The BWS uses a multi-pronged approach that
includes protecting the island’s watersheds and
underlying groundwater aquifers and developing
alternative water supplies and conservation
programs that help to save potable water sources.
Information in Section 4 provides input to Section 12, Findings and Recommendations. A number
of the programs discussed here have been part of the Stakeholder Advisory Group discussions
described in Section 3, Stakeholder Advisory Group.
4.1 Key FindingsThe BWS is involved in many programs to protect its watersheds and maintain its sustainable
water supplies (SUST-1). Working together with the State of Hawaiʻi (State) Commission on
Water Resource Management (CWRM) and Department of Health (DOH), the BWS monitors and
protects Oʻahu’s groundwater resources, as groundwater is the predominant supply source for its
service area. The BWS is a partner in the Freshwater Initiative (discussed in detail in Section 2,
Related BWS Work), which includes goals for conservation, groundwater recharge, and water
reuse. To support these goals, the watershed management plans provide coordination of land use
planning with watershed protection efforts.
The BWS’s water conservation strategies have lowered water usage over the last several decades
(which is discussed in more detail in Section 7, Historical and Future Water Demands), and the
BWS is counting on a continued, comprehensive conservation program to provide further savings
(see Section 4.4). Furthermore, to provide greater supplies and protect their water quality, the
BWS focuses on developing alternative water supplies such as recycled water and desalination,
reducing pressure on groundwater basins.
4.2 Watershed Management and ProtectionA watershed is defined as a drainage basin that catches, collects, and stores water that travels
from the mountains toward the ocean via rivers, streams, or through subterranean springs or
seepages. In addition, a critical function of watersheds is allowing this collected water to recharge
the groundwater aquifers below it, which is especially important for the BWS because over 90
percent of its supply is groundwater.
provides information that
addresses the following
WMP objectives:
Water Quality, Health, and Safety
System Reliability and Adequacy
Cost and Affordability
Water Conservation
Water Resource Sustainability
Section
4
Section 4 Water Supply Sustainability
4-2 October 2016
4.2.1 Watershed Management Plans
As discussed in detail in Section 2, the BWS is in the process of developing watershed
management plans for each of Oʻahu’s eight land use districts through a planning process that
emphasizes:
Community participation and consultation;
Holistic management of watershed resources;
Alignment with important State and City policies and programs;
An action orientation: implementation of important watershed management programs; and
Ahupuaʻa principles.
The goal of the watershed management plans is to develop environmentally holistic, economically
viable, and community-based plans that balance the protection of groundwater and surface water
resources with managed use and development. A key factor integrating land use and water
planning is the maintenance of a healthy watershed. Land use plans and water use and
development plans that support growth and existing communities on Oʻahu must ensure that
watersheds remain healthy through sustainable planning practices, watershed protection
projects, and best management practices that minimize impacts.
4.2.2 Watershed Partnerships
Healthy watersheds sustain the quality and quantity of O‘ahu’s streams and groundwater
supplies and the BWS has a responsibility to care, protect, and preserve these areas for future
generations. One of the ways the BWS is protecting forested watersheds, and encouraging
community involvement which is a key part of the watershed management plan process, is by
participating in watershed partnerships that protect and enhance the watersheds through
resource management. The BWS has partnered with government agencies (both local and
Federal), private landowners, and school and community groups. The current watershed
partnerships that the BWS is involved in include the following.
Koʻolau Mountain Watershed Partnership (KMWP): The BWS helps fund KMWP projects
which protect priority watershed forests in the Koʻolau Mountains that will enhance
watershed function, such as pig control, fence enclosures, and restoration projects;
partners include Department of Land and Natural Resources (DLNR), Agribusiness
Development Corporation, Department of Hawaiian Home Lands, United States (U.S.) Army,
Queen Emma Foundation, Kamehameha Schools, Dole Food Company, Inc., Hiʻipaka Limited
Liability Company (LLC, doing business as Waimea Valley), ʻOhulehule Forest Conservancy
LLC, University of Hawai‘i (UH) Mānoa/Lyon Arboretum, U.S. Fish and Wildlife Service,
Tiana Partners, Bishop Museum, Kualoa Ranch, Hawai‘i Reserves Incorporated, and O‘ahu
Country Club.
Waiheʻe Ahupuaʻa Initiative: Restore and protect Waiheʻe/Kahaluʻu watershed. Completed
a fish passage project in Waiheʻe Stream to allow Oʻopu (Hawaiian gobi) to travel upstream;
Section 4 Water Supply Sustainability
October 2016 4-3
working on a riparian learning center near the trail head to the upper valley; partnering
with Kualoa-Heʻeia Ecumenical Youth Project and Hui O Koʻolaupoko. Waiʻanae Mountains Watershed Partnership (WMWP): The BWS is working with WMWP
to protect priority watershed areas in the Waiʻanae Mountains. The BWS helps fund WMWP
natural resource management projects that control threats and restores forested areas to
enhance groundwater recharge, including fire presuppression, reforestation, and weed
mapping and control; partners include DLNR, Gill-Olson Joint Venture, MAʻO Organic Farms,
U.S. Army Garrison Hawaiʻi, Navy Region Hawaiʻi, and Kaʻala Farms Incorporated.
Mohala I Ka Wai: Projects include stream monitoring, rainfall data collection, and
restoration of archeological sites. Mohala I Ka Wai also has a land license with BWS to
restore loʻi in Mākaha Valley, which will help revitalize the land and educate a new
generation on land stewardship; partners include members of Mohala I Ka Wai and Ka‘ala
Farm, Incorporated, Waiʻanae High School, Nānākuli High School, Mākaha Elementary
School, and Hoa ʻĀina o Mākaha. Makua Implementation Plan with U.S. Army: On-going efforts to install fences in Mākaha to
protect endangered species from pigs and goats and on the bog on Ka‘ala to keep out pigs;
other projects include rodent control, vegetation monitoring, rare plant, and snail
conservation; partners include the Oʻahu Army Natural Resource Program along with other
land owners in the Waiʻanae mountains.
Oʻahu Invasive Species Committee (OISC): OISC is a voluntary partnership of private, state
and federal agencies that work together to control incipient species of concern that may
significantly impact the watershed. The BWS provides funding to OISC to control their
target species on BWS lands and other priority watershed areas, the main target being
Miconia calvescens.
Oʻahu Plant Extinction Prevention Program: The BWS works with this program to survey,
monitor and maintain their target species – endangered plants with less than 50
individuals left in the wild on Oʻahu. Hawaiʻi Snail Extinction Prevention Program: The BWS works with this program to survey
and monitor rare and endangered snail species on BWS lands.
4.3 Groundwater ProtectionActivities above ground, such as using pesticides or fertilizers, can impact the water quality below
ground. Because of the porous soils overlying the fractured and porous basalt groundwater
aquifers that underlie much of Oʻahu, organics and chemicals that are not consumed biologically
or absorbed chemically can pass through the top layers of soil and into the groundwater aquifer.
Leaking fuel storage tanks, pipelines, and chemical spills are also major threats to groundwater
aquifers. To protect the groundwater aquifers that provide water supply, the BWS recognizes that
all people on the island have a responsibility to use chemicals, fertilizers, and pesticides
responsibly and to dispose of wastes properly to avoid potential contamination.
Section 4 Water Supply Sustainability
4-4 October 2016
On a larger scale, the BWS and DOH work together to monitor and protect the island’s
groundwater resources. Their approach includes:
Understanding the impact of activities above and below ground on groundwater supply
wells: The BWS works to provide safe water to the community that meets all State and
Federal drinking water standards. The DOH established source water protection
boundaries for public water systems that identify capture zone areas (using 2- and 10-year
contaminant travel times) where contaminants could reach drinking water sources to
determine the susceptibility of public water systems.
Continually monitoring the health of groundwater sources, which is critical to ensuring a
sustainable water supply: The BWS uses a network of shallow and deep monitoring wells
to track the quality of its groundwater supply, ensuring that the water provided to
customers meets all State and Federal drinking water standards.
Educating customers about the quality and safety of drinking water: The BWS believes that
keeping the public informed about the quality and safety of its drinking water is an
important part of its mission. Protecting the island’s water resources begins with
protecting the environment and everyone has a role in protecting the watersheds that
provide water supply.
In September 2015, the Board adopted Resolution 860 recognizing that pristine aquifers are a
critical public trust resource that should be protected and defended. The Board resolved that
BWS should take necessary measures to protect the groundwater, and that the groundwater
around Red Hill should be restored by the Navy, and that the Navy should prevent future leaks.
4.4 ConservationHistorically conservation has reduced water demands, thereby conserving natural water
resources, and can offset the need for new water supplies and infrastructure needed to meet
demands. Water conservation is less expensive than the construction of traditional system
infrastructure for capacity expansion and could defer costly system improvements. It will also be
important to continue and increase these water conservation efforts into the future.
The BWS’s conservation program, developed over a number of years and guided most recently by
the comprehensive Water Conservation Program Plan1 finalized in May 2011, uses a multi-
faceted approach to promote water conservation both within the distribution system and with its
customer base. Elements of the BWS’s conservation program are detailed below.
Leak Detection, Repairs, and Maintenance Program – Preventing water loss system-
wide involves vigilant efforts of BWS crews to detect and fix leaks. Improving distribution
system efficiencies reduces operations and maintenance costs and reduces water loss.
Infrastructure water loss and efficiency measures include leak detection, repair of existing
pipelines, and the renewal and replacement of water system facilities (e.g., pipelines, pump
stations, reservoirs, and treatment systems). The BWS Leak Detection Team was tasked to
1 BWS. 2011. Water Conservation Program Plan. Prepared for Honolulu Board of Water Supply. Prepared by Brown & Caldwell. May 4, 2011.
Section 4 Water Supply Sustainability
October 2016 4-5
proactively survey and identify leaks in the BWS system using a combination of digital
correlating loggers to record pipe vibrations as water flows through the pipes and toning
equipment to pinpoint the location of the leak. The data collected is used to prioritize and
schedule planned repairs to the water system, which resulted in the prevention of potential
emergency main breaks equating to even more water savings. Better data collection and
validation, pressure management evaluation and the expansion of the District Metered
Areas program can help continue to reduce the volume of lost water (called non-revenue
water). The Leak Detection Team intends to survey the entire water system on a two-year
cycle, or 87.5 miles per month.
Large Water Users Program – The BWS helps Oʻahu businesses save water and money
through water audits and partnerships. Proposed conservation incentives will be tailored
for large water users in collaboration with energy conservation programs. Commercial,
government, hotel/motel/resorts, multi-family residential, and large landscape water
surveys help identify ways large water users can conserve water. Promoting demand-side
management programs supports hardware and behavioral modifications of customer water
use. Water conservation tips, public service announcements, and specific programs tailored
to distinct user categories will effectively reduce water use and defer development of new
water sources.
Water Conservation Regulatory Program – Drought plans, wasteful water use
enforcement, and low-flow fixture requirements all help increase conservation. The BWS is
considering expanded conservation requirements (measures or performance metrics) for
new development such as Transit Oriented Development.
Developing New Conservation Opportunities – Capturing stormwater, using recycled
water for irrigation, new green infrastructure plumbing codes, and research are all
contributing to new opportunities for conserving more potable water. The BWS Rain Barrel
Program provides workshops throughout the year that promote rain barrel water
catchment as an alternative and effective educational tool for conserving water outdoors.
Gray water reuse for outdoor irrigation can also reduce the demand on potable water. The
BWS will continue to evaluate opportunities for the use of recycled water for industrial
customers, e.g., cooling towers, industrial processes, and other non-drinking water uses.
Education and Outreach – The BWS has many programs to inform the public about
conserving water. In 2016, the BWS held its 38th annual water conservation poster contest
and its 8th annual poetry contest, helping to educate students to be life-time water
conservationists. The Hālawa Xeriscape Garden displays a series of xeric (dry) plants in a
residential-scale setting to demonstrate species capable of providing a visually attractive
garden, while using less water than most currently popular plants. The garden opened to
public in September 1989 as a way to educate Oʻahu residents on ways to save water in
lawns, gardens, and landscaped areas. Among the water-efficient irrigation systems
demonstrated in the Hālawa Xeriscape Garden are automatic timers, moisture sensors, rain
shutdown devices, and low output irrigation equipment such as spray sprinkler heads,
micro-spray sprinkler heads, emitters, and dripper lines.
Section 4 Water Supply Sustainability
4-6 October 2016
Implementation and expansion of these programs is key to the assumptions that the BWS per
capita water demands will continue to decrease through the 2040 planning horizon. The
Stakeholder Advisory Group provided input on a number of ways that the BWS can enhance its
water conservation efforts (see Section 3.5.2.3). Section 12, Findings and Recommendations, calls
out the need to continue the BWS’s investment in conservation.
4.5 Alternative Supply SourcesAs discussed in Section 8, Current and Future Water Supply Sources, encouraging supply
diversity is a critical planning principle for the BWS. The BWS invests in the development of
alternative supplies to potable groundwater to protect and conserve that important resource or
to provide supply in areas where potable water is not available in sufficient quantities to meet
local demand. Some of these alternative supplies have the benefit of being drought resistant,
meaning the yield from these supplies is not reduced during droughts, which further decreases
the stress on groundwater sources which are affected by drought. BWS alternatives supplies
include:
Recycled Water Projects – Expansion of the capacity of the Honouliuli Water Recycling
Facility (WRF) will be used to meet future demands for irrigation and industrial process
water in ʻEwa, freeing up potable water for domestic uses. There are a number of relatively
new project areas that are planned to be added to the existing recycled water distribution
system. As ʻEwa develops, there will be additional opportunities to expand recycled water
use. Recycled water will provide almost 40 percent of the total water needs of ʻEwa at full
build-out. Continued and increased use of recycled water will help to preserve potable
groundwater resources and could also be used to recharge the aquifer in the future. There
are also recycled water membrane bioreactor projects being considered for the Ala Wai golf
course (0.5 mgd) and Mililani Wastewater Treatment Plant (WWTP) for Central Oʻahu
Regional Park (1.0 mgd).
Desalination Projects – The Kalaeloa Seawater Desalination Plant is currently anticipated to
be designed in 2018 to 2019 and constructed in the 2020 to 2022 timeframe, and will bring
an additional 1 mgd of potable water supply to the ʻEwa and Waiʻanae land use districts. As
‘Ewa demands increase in the future towards build-out, the plant capacity could be
increased as needed. In addition, BWS acquired the State’s demonstration brackish water
desalination plant land and facilities in Kapolei Business Park, which will be reconstructed
to produce 0.7 mgd of potable water supply for Kapolei.
October 2016 5-1
Section 5
Water System Planning
Standards
Water utilities use planning criteria to define the
allowable operating performance of their water
system infrastructure and improve the level of
reliability in the design of water facilities. These
planning criteria vary depending on the size,
location, and specific characteristics of water
utilities, but the types of parameters are similar
across utilities related to the sizing of pipelines,
reservoirs, and pump stations.
The BWS has standards and criteria that are used in the planning and design of the BWS facilities
and affect the sizing of both existing and future facilities. The BWS used the 2002 State of Hawaiʻi Water System Standards (Standards) as the basis for its system planning criteria. The purpose of
the Standards is to provide guidelines for planning and designing of water systems at a
fundamental level. This section describes the current BWS standards and criteria and how they
were used for the purposes of the WMP analyses. The planning system standards were applied to
the individual pressure zones, and the combination of pressure zones, making up the 10 model
systems for the hydraulic model analyses described in Section 10, System Capacity Evaluation.
The analysis of existing and future 2040 facility requirements is also presented in Section 10.
5.1 Key FindingsThe key findings related to system planning criteria are listed below. These findings are identified
with a code (an abbreviation for the section name) and number (for example, STND-1). These
codes are repeated in Section 12, Findings and Recommendations, to easily tie the findings in this
section to the recommendations for BWS action listed in Section 12.
STND-1 Some Standards were found to be insufficiently defined for the various and
complex configurations of the BWS water systems, where the objectives of the
Standards may be met by different combinations of facilities and operation.
Because these details are not spelled out in the Standards, the BWS has added
clarification in how the Standards were applied and/or adapted to evaluating
overall system requirements and not just the individual components of the
system. The application of these adaptations is explained in more detail in
Section 10. The BWS should formalize adaptation of Standards where
appropriate.
STND-2 Some Standards may no longer be appropriate for a water system the size and
complexity of the BWS’s. The BWS should review the Standards to determine if
provides information that
addresses the following
WMP objectives:
Water Quality, Health, and Safety
System Reliability and Adequacy
Cost and Affordability
Water Conservation
Water Resource Sustainability
Section
5
Section 5 Water System Planning Standards
5-2 October 2016
updates are required. The BWS should modify current Standards as appropriate
and install or improve infrastructure where appropriate to meet Standards.
STND-3 The maximum day demand (MDD) and peak hour factors given in the Standards
may not be appropriate for systems with historical data. The BWS should utilize
actual historical MDD and peak hour factors where available, and utilize the
Standards where insufficient data exists.
5.2 Standards and CriteriaThe BWS uses the Standards for its system planning criteria, with specific applications made for
the individual BWS systems. As discussed in the Standards1, “These standards of planning are not
intended to limit the initiative and resourcefulness of the engineer in developing water system
plans but they shall be viewed as the minimum limits in design criteria.” Some of these
applications are discussed in Section 5.3 and also later in Section 10.
The primary planning criteria from the Standards (Division 100 Planning, Section 111 Water
Requirements) that affect the BWS are presented in Table 5-1, and adaptations that BWS has
made to the Standards.
The main Standards sections used in the WMP evaluation include:
Domestic Consumption Guidelines (Standards Section 111.02);
Fire Flows, Duration, and Hydrant Spacing (Standards Section 111.03, Table 100-19);
System Capacity (Standards Section 111.04);
Demand Factors (Standards Section 111.05 and Table 100-20);
Pipeline Sizing (Standards Section 111.06, Table 100-21);
Reservoir Capacity (Standards Section 111.07); and
Total Pump Capacity (Standards Section 111.08).
1 State of Hawaiʻi. 2002. Water System Standards, Division 100 Planning, Section 111 Water Requirements, 111.01 General. Available from http://www.boardofwatersupply.com/files/With%20Amendments%20Final%20Complete%20Copy%20of%20Water%20System%20Standards%202002.pdf.
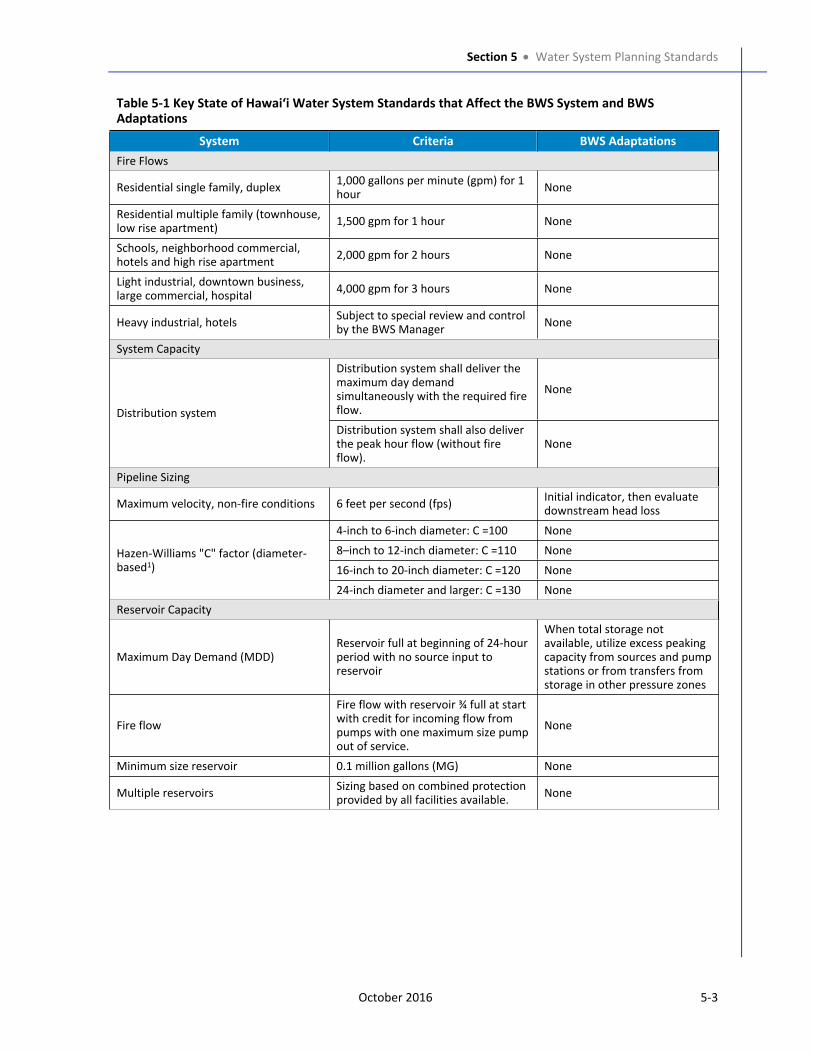
Section 5 Water System Planning Standards
October 2016 5-3
Table 5-1 Key State of Hawaiʻi Water System Standards that Affect the BWS System and BWS Adaptations
System Criteria BWS Adaptations
Fire Flows
Residential single family, duplex1,000 gallons per minute (gpm) for 1 hour
None
Residential multiple family (townhouse, low rise apartment)
1,500 gpm for 1 hour None
Schools, neighborhood commercial, hotels and high rise apartment
2,000 gpm for 2 hours None
Light industrial, downtown business, large commercial, hospital
4,000 gpm for 3 hours None
Heavy industrial, hotels Subject to special review and control by the BWS Manager
None
System Capacity
Distribution system shall deliver the maximum day demand simultaneously with the required fire flow.
None
Distribution system
Distribution system shall also deliver the peak hour flow (without fire flow).
None
Pipeline Sizing
Maximum velocity, non-fire conditions 6 feet per second (fps)Initial indicator, then evaluate downstream head loss
4-inch to 6-inch diameter: C =100 None
8–inch to 12-inch diameter: C =110 None
16-inch to 20-inch diameter: C =120 None
Hazen-Williams "C" factor (diameter-based1)
24-inch diameter and larger: C =130 None
Reservoir Capacity
Maximum Day Demand (MDD)Reservoir full at beginning of 24-hour period with no source input to reservoir
When total storage not available, utilize excess peaking capacity from sources and pump stations or from transfers from storage in other pressure zones
Fire flow
Fire flow with reservoir ¾ full at start with credit for incoming flow from pumps with one maximum size pump out of service.
None
Minimum size reservoir 0.1 million gallons (MG) None
Multiple reservoirsSizing based on combined protection provided by all facilities available.
None
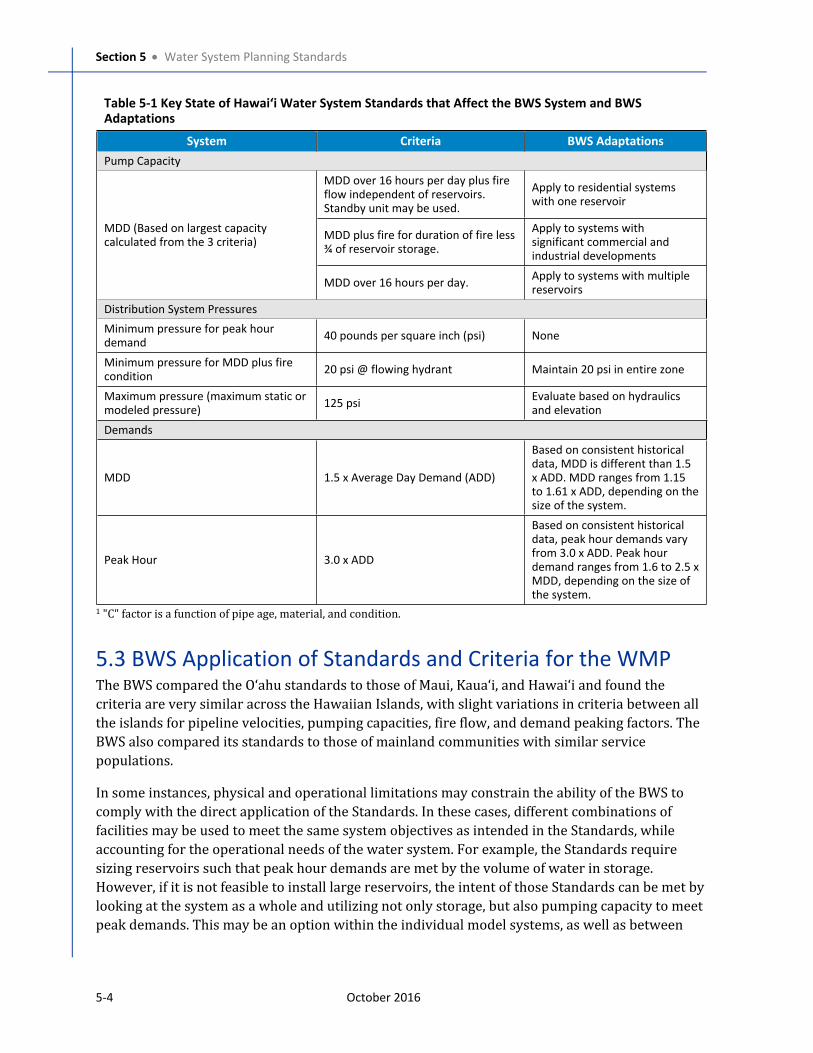
Section 5 Water System Planning Standards
5-4 October 2016
Table 5-1 Key State of Hawaiʻi Water System Standards that Affect the BWS System and BWS Adaptations
System Criteria BWS Adaptations
Pump Capacity
MDD over 16 hours per day plus fire flow independent of reservoirs. Standby unit may be used.
Apply to residential systems with one reservoir
MDD plus fire for duration of fire less ¾ of reservoir storage.
Apply to systems with significant commercial and industrial developments
MDD (Based on largest capacity calculated from the 3 criteria)
MDD over 16 hours per day.Apply to systems with multiple reservoirs
Distribution System Pressures
Minimum pressure for peak hour demand
40 pounds per square inch (psi) None
Minimum pressure for MDD plus fire condition
20 psi @ flowing hydrant Maintain 20 psi in entire zone
Maximum pressure (maximum static or modeled pressure)
125 psiEvaluate based on hydraulics and elevation
Demands
MDD 1.5 x Average Day Demand (ADD)
Based on consistent historical data, MDD is different than 1.5 x ADD. MDD ranges from 1.15 to 1.61 x ADD, depending on the size of the system.
Peak Hour 3.0 x ADD
Based on consistent historical data, peak hour demands vary from 3.0 x ADD. Peak hour demand ranges from 1.6 to 2.5 x MDD, depending on the size of the system.
1 "C" factor is a function of pipe age, material, and condition.
5.3 BWS Application of Standards and Criteria for the WMPThe BWS compared the Oʻahu standards to those of Maui, Kaua‘i, and Hawaiʻi and found the
criteria are very similar across the Hawaiian Islands, with slight variations in criteria between all
the islands for pipeline velocities, pumping capacities, fire flow, and demand peaking factors. The
BWS also compared its standards to those of mainland communities with similar service
populations.
In some instances, physical and operational limitations may constrain the ability of the BWS to
comply with the direct application of the Standards. In these cases, different combinations of
facilities may be used to meet the same system objectives as intended in the Standards, while
accounting for the operational needs of the water system. For example, the Standards require
sizing reservoirs such that peak hour demands are met by the volume of water in storage.
However, if it is not feasible to install large reservoirs, the intent of those Standards can be met by
looking at the system as a whole and utilizing not only storage, but also pumping capacity to meet
peak demands. This may be an option within the individual model systems, as well as between
Section 5 Water System Planning Standards
October 2016 5-5
systems to share capacity. The following sections describes the BWS criteria’s differences from
the Standards.
Several of the criteria are based on meeting certain levels of demand. Average day demand (ADD)
refers to the average daily water use over the course of the year. MDD is the maximum water use
in a 24-hour period during the year, which generally occurs during most of the maximum month
of usage in summer. Peak hour demand is the peak flow during a one-hour period on the day of
maximum demand. Where available, historical MDD and peak hour factors were used in the
analysis with the exception of pipeline sizing, which retained 1.5 multiplied by ADD to be
conservative.
5.3.1 Pipeline Sizing
Criteria: Maximum velocity in a distribution main (without fire flow) is 6 feet per second (fps).
Pipeline flows exceeding the six fps velocity criterion provide an initial indication of potential
operational or capacity issues, but do not necessarily result in the need for parallel pipelines.
Areas with velocities in excess of six fps were assessed in conjunction with other key evaluation
criteria, such as low pressure or excessive head loss causing operational problems, to determine
whether improvements are necessary to meet the hydraulic requirements of the system
efficiently and economically. Pipelines that exceed 10 fps, regardless of excessive head loss, were
considered for improvements. This evaluation and application is typical of large metropolitan
water systems.Oʻahu does not have criteria for maximum velocity with fire flow. Some mainland agencies do
have a criterion for maximum flow of 10 to 12 fps; however, this criterion was not applied to the
sizing of BWS pipelines.
5.3.2 Reservoir Capacity
There are four criteria associated with sizing the system reservoirs:
Criteria: Meet MDD with the reservoir full at beginning of a 24-hour period, with no source
input.
Criteria: Meet fire flow with reservoir three-quarters full at start with credit for incoming
flow from pumps, with one maximum size pump out of service.
Criteria: Minimum size reservoir is 0.1 million gallons (MG).
Criteria: Where there are two or more reservoirs serving the same system, sizing shall be
based on combined protection provided by all available facilities.
Historically, the BWS has not been able to meet all of the storage requirements for some of the
pressure zones, particularly in the Metro Low system. Currently, this is primarily due to lack of
sites to place large reservoirs at appropriate elevations. To compensate for the limited storage,
the BWS has met peak hour demands with well sources. This is a typical application for large
metropolitan water systems where excess peaking supply capacity is used to meet the objectives
of the Standard.
Section 5 Water System Planning Standards
5-6 October 2016
Where adding storage is feasible, recommendations for new storage are included in Section 10,
System Capacity Evaluation, and Section 12, Findings and Recommendations. Where
implementation of multiple large reservoirs to fully meet the calculated storage requirements
(e.g., the Metro Low system) is either not feasible or very costly, alternatives were presented
combining additional storage, local peaking wells, and installation of transmission facilities to
convey the needed maximum day and peak hour needs into these systems.
5.3.3 Pump Station Capacity
There are three criteria associated with sizing pump station capacity, with the most restrictive
criteria providing the planning-level sizing. The primary intent of these criteria is to provide
redundancy in the initial sizing of facilities. However, as discussed in Section 10, where these
criteria are applied in initially identifying sizing, engineering judgement and operational
flexibility may also provide similar levels of redundancy. Also, a key part of the capacity analysis
in Section 10 is the appropriate sizing of these facilities.
Criteria: Meet MDD with an operating time of 16 hours simultaneously with maximum fire
flow required independent of the reservoir. The standby unit may be used to determine the
total flow required.
The BWS applies this to residential systems with one reservoir because the pump station will
need to meet fire flow if the reservoir is out of service during a fire. In the case of multiple
reservoirs and pump stations, the multiple supply sources and reservoirs provide the
redundancy.
Criteria: Meet MDD over the duration of fire plus fire demand less 75 percent of reservoir
storage. The largest pumping unit shall be considered out of service (standby).
The BWS applies this to systems with significant commercial and industrial developments, which
tend to have large fire flows and durations (e.g., 4,000 gallons per minute [gpm] for 3 hours).
Criteria: Meet MDD with an operating time of 16 hours. The largest pumping unit shall be
considered out of service (standby).
The BWS applies this to systems with multiple reservoirs. Having enough pump capacity to
deliver the MDD within 16 hours, as opposed to 24 hours, gives the BWS the operational
flexibility to turn off the pumps and not have to operate for the full day. It also allows flexibility as
water demands increase or some pumping capacity is offline for maintenance.
The requirement for pump stations to have a standby unit (largest unit) out of service during
certain operations is designed for pump stations that may have multiple pumps, allowing for
redundant capacity for maintenance operations and some additional capacity for unforeseen
situations. This requirement may be overly conservative for groundwater systems, where a local
well field may have from one to seven independent wells (independent units pumping from the
same well field), or multiple wells and well fields that can meet the supply needs within the
pressure zone or model system (combined pressure zones). The individual well systems were
evaluated to meet the level of service goal with 75 to 90 percent of the active well sources
available/operational at all times. This percentage varies depending on the size of the well
pumping units, and whether they can be operated at the rated capacity continuously for at least
24 hours. The lower the percentage, the more excess capacity that is available from the combined
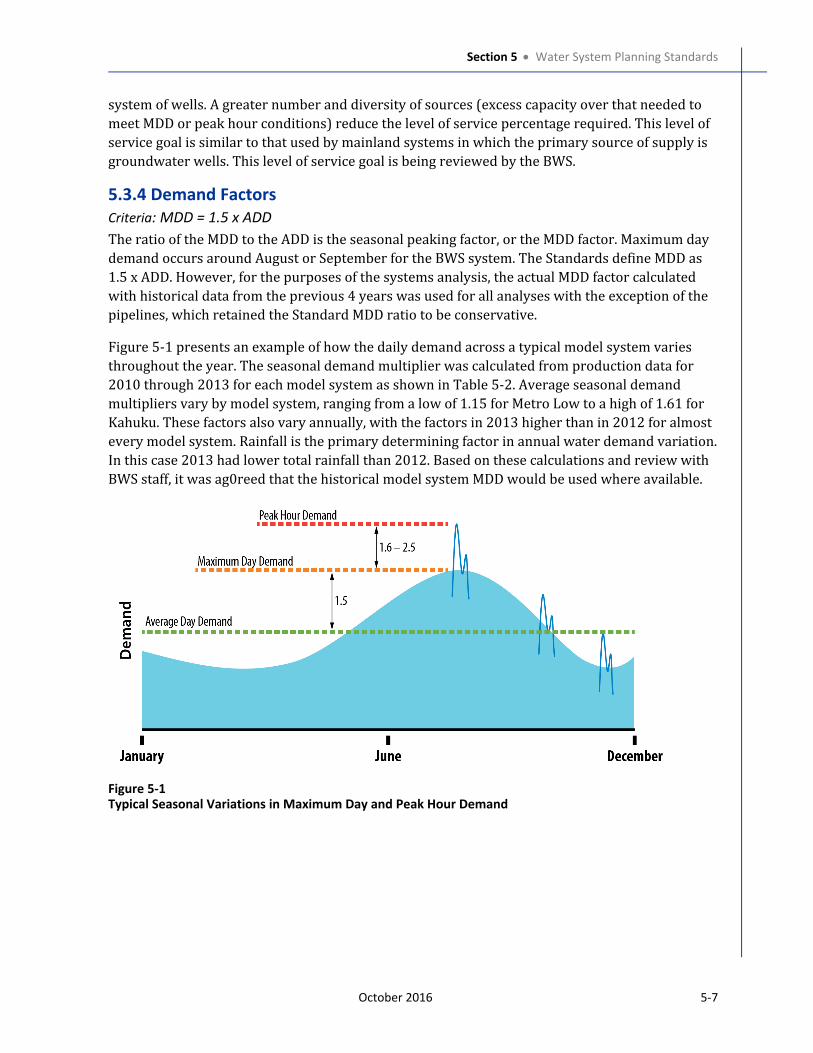
Section 5 Water System Planning Standards
October 2016 5-7
system of wells. A greater number and diversity of sources (excess capacity over that needed to
meet MDD or peak hour conditions) reduce the level of service percentage required. This level of
service goal is similar to that used by mainland systems in which the primary source of supply is
groundwater wells. This level of service goal is being reviewed by the BWS.
5.3.4 Demand Factors
Criteria: MDD = 1.5 x ADD
The ratio of the MDD to the ADD is the seasonal peaking factor, or the MDD factor. Maximum day
demand occurs around August or September for the BWS system. The Standards define MDD as
1.5 x ADD. However, for the purposes of the systems analysis, the actual MDD factor calculated
with historical data from the previous 4 years was used for all analyses with the exception of the
pipelines, which retained the Standard MDD ratio to be conservative.
Figure 5-1 presents an example of how the daily demand across a typical model system varies
throughout the year. The seasonal demand multiplier was calculated from production data for
2010 through 2013 for each model system as shown in Table 5-2. Average seasonal demand
multipliers vary by model system, ranging from a low of 1.15 for Metro Low to a high of 1.61 for
Kahuku. These factors also vary annually, with the factors in 2013 higher than in 2012 for almost
every model system. Rainfall is the primary determining factor in annual water demand variation.
In this case 2013 had lower total rainfall than 2012. Based on these calculations and review with
BWS staff, it was ag0reed that the historical model system MDD would be used where available.
Figure 5-1Typical Seasonal Variations in Maximum Day and Peak Hour Demand
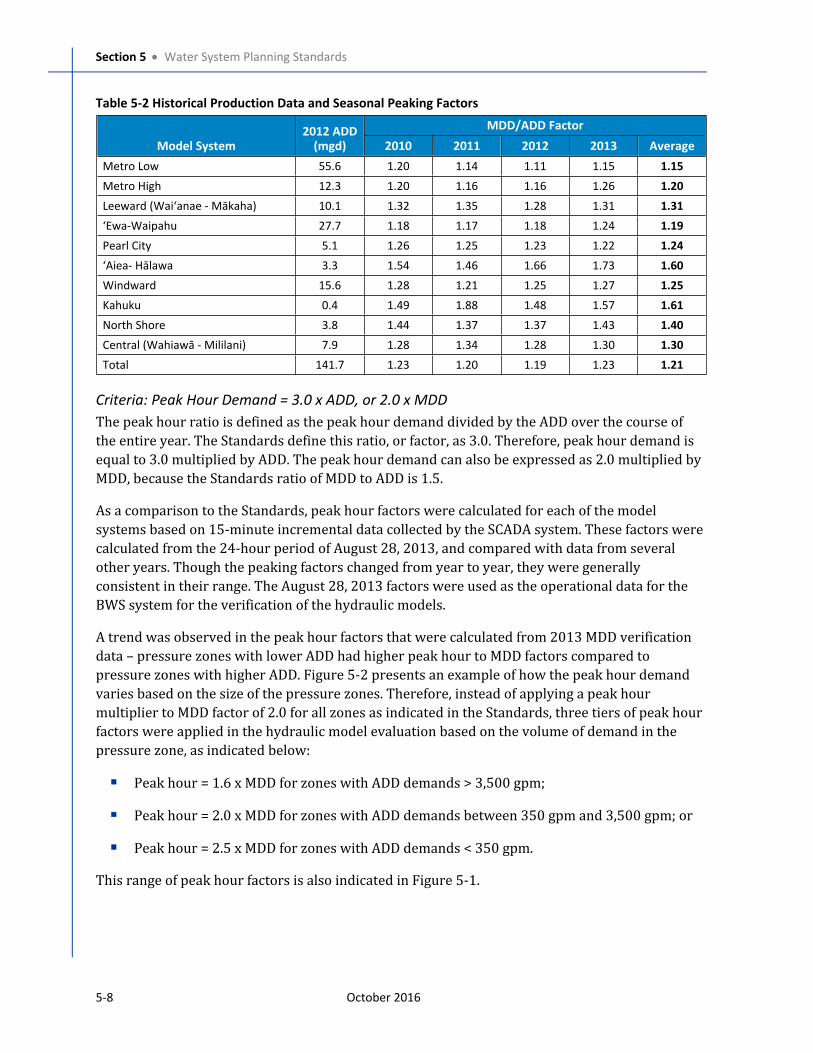
Section 5 Water System Planning Standards
5-8 October 2016
Table 5-2 Historical Production Data and Seasonal Peaking Factors
MDD/ADD Factor
Model System2012 ADD
(mgd) 2010 2011 2012 2013 Average
Metro Low 55.6 1.20 1.14 1.11 1.15 1.15
Metro High 12.3 1.20 1.16 1.16 1.26 1.20
Leeward (Waiʻanae - Mākaha) 10.1 1.32 1.35 1.28 1.31 1.31
‘Ewa-Waipahu 27.7 1.18 1.17 1.18 1.24 1.19
Pearl City 5.1 1.26 1.25 1.23 1.22 1.24
‘Aiea- Hālawa 3.3 1.54 1.46 1.66 1.73 1.60
Windward 15.6 1.28 1.21 1.25 1.27 1.25
Kahuku 0.4 1.49 1.88 1.48 1.57 1.61
North Shore 3.8 1.44 1.37 1.37 1.43 1.40
Central (Wahiawā - Mililani) 7.9 1.28 1.34 1.28 1.30 1.30
Total 141.7 1.23 1.20 1.19 1.23 1.21
Criteria: Peak Hour Demand = 3.0 x ADD, or 2.0 x MDD
The peak hour ratio is defined as the peak hour demand divided by the ADD over the course of
the entire year. The Standards define this ratio, or factor, as 3.0. Therefore, peak hour demand is
equal to 3.0 multiplied by ADD. The peak hour demand can also be expressed as 2.0 multiplied by
MDD, because the Standards ratio of MDD to ADD is 1.5.
As a comparison to the Standards, peak hour factors were calculated for each of the model
systems based on 15-minute incremental data collected by the SCADA system. These factors were
calculated from the 24-hour period of August 28, 2013, and compared with data from several
other years. Though the peaking factors changed from year to year, they were generally
consistent in their range. The August 28, 2013 factors were used as the operational data for the
BWS system for the verification of the hydraulic models.
A trend was observed in the peak hour factors that were calculated from 2013 MDD verification
data – pressure zones with lower ADD had higher peak hour to MDD factors compared to
pressure zones with higher ADD. Figure 5-2 presents an example of how the peak hour demand
varies based on the size of the pressure zones. Therefore, instead of applying a peak hour
multiplier to MDD factor of 2.0 for all zones as indicated in the Standards, three tiers of peak hour
factors were applied in the hydraulic model evaluation based on the volume of demand in the
pressure zone, as indicated below:
Peak hour = 1.6 x MDD for zones with ADD demands > 3,500 gpm;
Peak hour = 2.0 x MDD for zones with ADD demands between 350 gpm and 3,500 gpm; or
Peak hour = 2.5 x MDD for zones with ADD demands < 350 gpm.
This range of peak hour factors is also indicated in Figure 5-1.
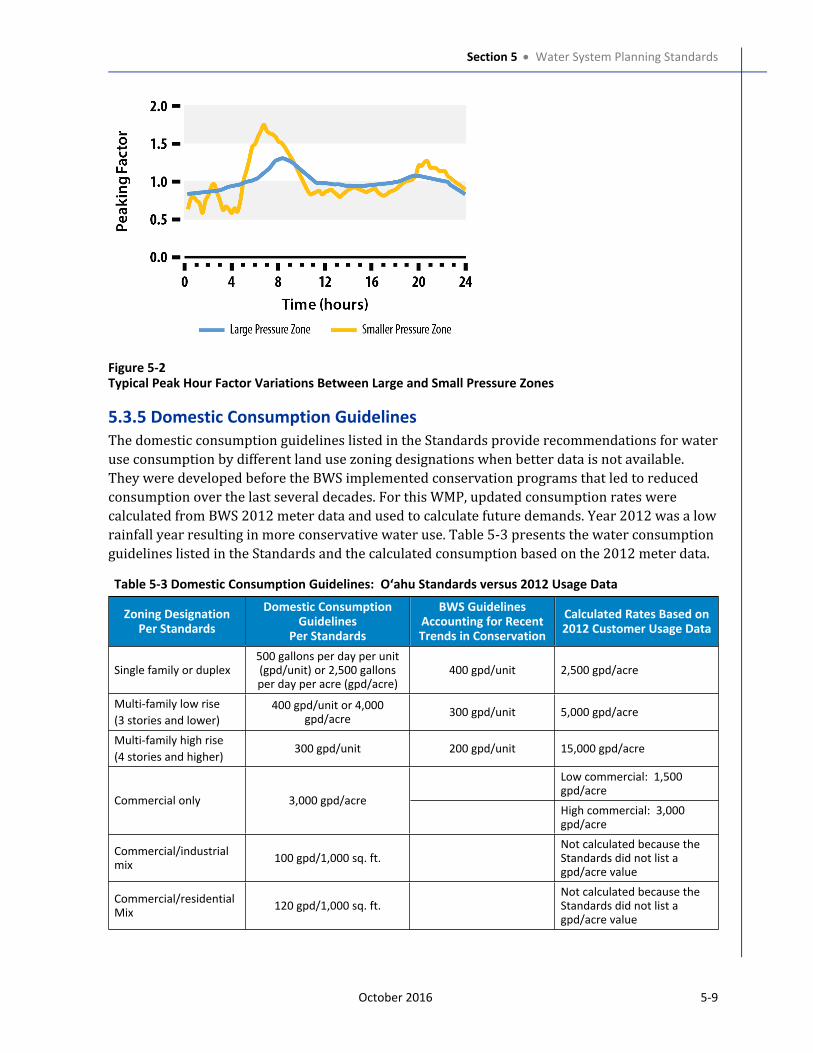
Section 5 Water System Planning Standards
October 2016 5-9
Figure 5-2Typical Peak Hour Factor Variations Between Large and Small Pressure Zones
5.3.5 Domestic Consumption Guidelines
The domestic consumption guidelines listed in the Standards provide recommendations for water
use consumption by different land use zoning designations when better data is not available.
They were developed before the BWS implemented conservation programs that led to reduced
consumption over the last several decades. For this WMP, updated consumption rates were
calculated from BWS 2012 meter data and used to calculate future demands. Year 2012 was a low
rainfall year resulting in more conservative water use. Table 5-3 presents the water consumption
guidelines listed in the Standards and the calculated consumption based on the 2012 meter data.
Table 5-3 Domestic Consumption Guidelines: Oʻahu Standards versus 2012 Usage Data
Zoning DesignationPer Standards
Domestic Consumption Guidelines
Per Standards
BWS Guidelines Accounting for Recent Trends in Conservation
Calculated Rates Based on 2012 Customer Usage Data
Single family or duplex500 gallons per day per unit (gpd/unit) or 2,500 gallons per day per acre (gpd/acre)
400 gpd/unit 2,500 gpd/acre
Multi-family low rise
(3 stories and lower)
400 gpd/unit or 4,000 gpd/acre
300 gpd/unit 5,000 gpd/acre
Multi-family high rise
(4 stories and higher)300 gpd/unit 200 gpd/unit 15,000 gpd/acre
Low commercial: 1,500 gpd/acre
Commercial only 3,000 gpd/acreHigh commercial: 3,000 gpd/acre
Commercial/industrial mix
100 gpd/1,000 sq. ft.Not calculated because the Standards did not list a gpd/acre value
Commercial/residential Mix
120 gpd/1,000 sq. ft.Not calculated because the Standards did not list a gpd/acre value
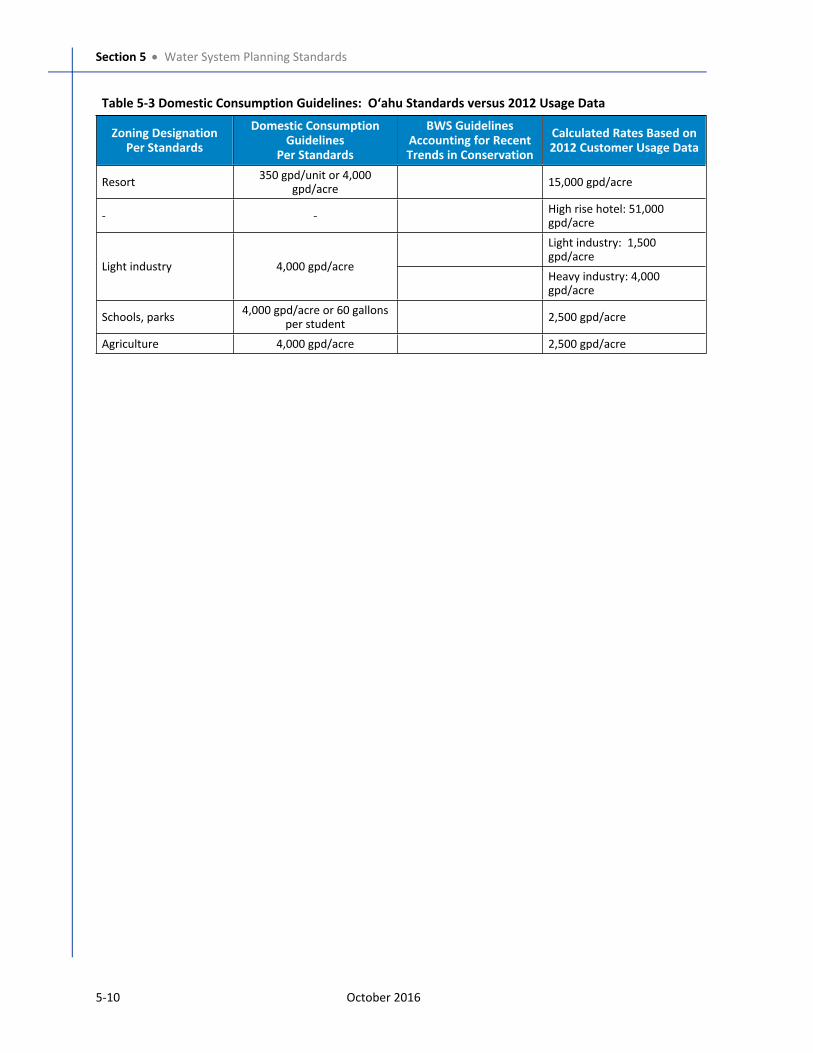
Section 5 Water System Planning Standards
5-10 October 2016
Table 5-3 Domestic Consumption Guidelines: Oʻahu Standards versus 2012 Usage Data
Zoning DesignationPer Standards
Domestic Consumption Guidelines
Per Standards
BWS Guidelines Accounting for Recent Trends in Conservation
Calculated Rates Based on 2012 Customer Usage Data
Resort350 gpd/unit or 4,000
gpd/acre15,000 gpd/acre
- -High rise hotel: 51,000 gpd/acre
Light industry: 1,500 gpd/acre
Light industry 4,000 gpd/acreHeavy industry: 4,000 gpd/acre
Schools, parks4,000 gpd/acre or 60 gallons
per student2,500 gpd/acre
Agriculture 4,000 gpd/acre 2,500 gpd/acre
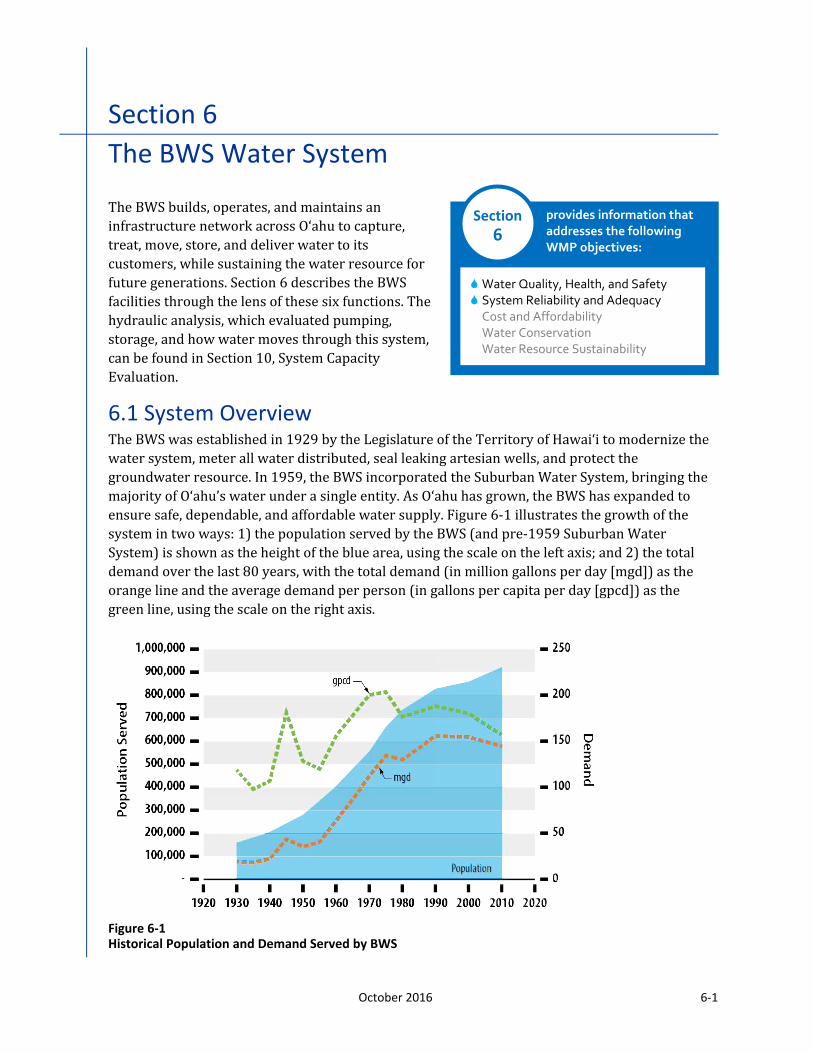
October 2016 6-1
Section 6
The BWS Water System
The BWS builds, operates, and maintains an
infrastructure network across O‘ahu to capture,
treat, move, store, and deliver water to its
customers, while sustaining the water resource for
future generations. Section 6 describes the BWS
facilities through the lens of these six functions. The
hydraulic analysis, which evaluated pumping,
storage, and how water moves through this system,
can be found in Section 10, System Capacity
Evaluation.
6.1 System Overview The BWS was established in 1929 by the Legislature of the Territory of Hawaiʻi to modernize the
water system, meter all water distributed, seal leaking artesian wells, and protect the
groundwater resource. In 1959, the BWS incorporated the Suburban Water System, bringing the
majority of O‘ahu’s water under a single entity. As O‘ahu has grown, the BWS has expanded to
ensure safe, dependable, and affordable water supply. Figure 6-1 illustrates the growth of the
system in two ways: 1) the population served by the BWS (and pre-1959 Suburban Water
System) is shown as the height of the blue area, using the scale on the left axis; and 2) the total
demand over the last 80 years, with the total demand (in million gallons per day [mgd]) as the
orange line and the average demand per person (in gallons per capita per day [gpcd]) as the
green line, using the scale on the right axis.
Figure 6-1
Historical Population and Demand Served by BWS
provides information that
addresses the following
WMP objectives:
Water Quality, Health, and Safety
System Reliability and Adequacy
Cost and Affordability
Water Conservation
Water Resource Sustainability
Section
6
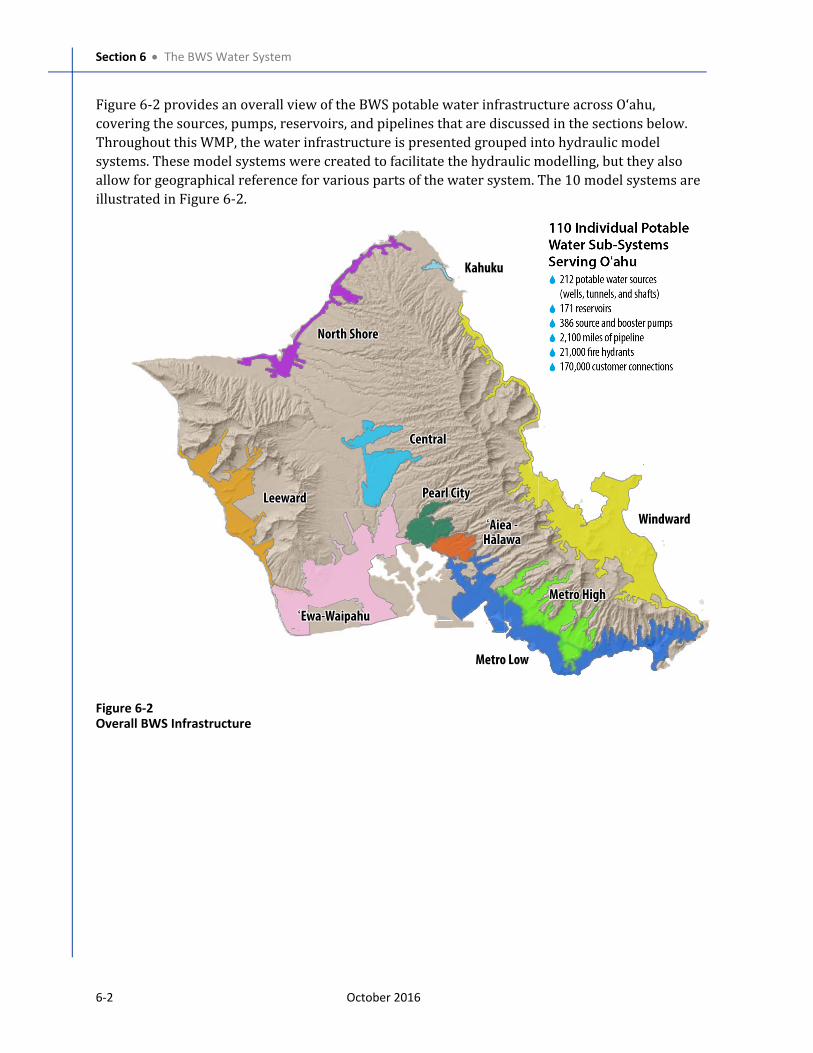
Section 6 The BWS Water System
6-2 October 2016
Figure 6-2 provides an overall view of the BWS potable water infrastructure across O‘ahu,
covering the sources, pumps, reservoirs, and pipelines that are discussed in the sections below.
Throughout this WMP, the water infrastructure is presented grouped into hydraulic model
systems. These model systems were created to facilitate the hydraulic modelling, but they also
allow for geographical reference for various parts of the water system. The 10 model systems are
illustrated in Figure 6-2.
Figure 6-2
Overall BWS Infrastructure
North ShoreNorth Shore
KahukuKahuku
LeewardLeeward
ʻEwa-WaipahuʻEwa-Waipahu
Pearl CityPearl City
Metro HighMetro High
WindwardWindward
Metro LowMetro Low
CentralCentral
ʻAiea -HālawaʻAiea -
Hālawa
Section 6 The BWS Water System
October 2016 6-3
6.2 SustainThe BWS manages thousands of acres of watershed area on O‘ahu to protect
and preserve 212 separate potable water sources, the combination of 194
individual groundwater wells, 13 active potable water tunnels, and 5 shafts.
The BWS’s proactive efforts to manage and protect the watersheds include
limiting access and development, combatting invasive animals and plants,
promoting healthy forests, and encouraging customer water conservation to
reduce the amount of water withdrawn from the environment. These BWS
efforts are discussed in more detail in Section 4, Water Supply Sustainability.
To ease the demand on the groundwater supplies, the BWS also operates brackish and recycled
water nonpotable water systems for irrigation and industrial use in ‘Ewa, Mākaha, and Hālawa-Airport. The BWS owns and maintains five dams or open reservoirs. Four reservoirs in Nuʻuanu
are now used solely for flood control, and the fifth, Mauna ʻOlu reservoir, stores nonpotable water
used for irrigation. The four Nuʻuanu reservoirs may be used for stormwater capture, infiltration,
or hydropower in the future.
6.3 CaptureThe BWS captures groundwater to serve the needs of O‘ahu’s people using
several different strategies. Groundwater wells on the coastal plains are the
largest number of sources, and the BWS currently operates 194 individual
wells located throughout the island. Wells penetrate the ground and tap
groundwater sometimes hundreds of feet below the surface. The majority of
the BWS groundwater supplies are located in the Honolulu and Pearl
Harbor aquifers.
The BWS uses five shafts to access the plains groundwater. Unlike a well that penetrates into the
groundwater aquifer with a small diameter hole, shafts are dug out of water-bearing rock near
the water table or the top of the saturated portion of the aquifer. As such, shafts are able to supply
significantly greater amounts of water than an individual well can.
Tunnels are another source of supply for O‘ahu. The BWS has 13 active, potable water tunnels in
the Wai‘anae and Ko‘olau mountains, dug horizontally into the mountain to penetrate the dike
layer and access stored water. A full discussion about sources can be found in Section 8, Current
and Future Water Supply Sources.
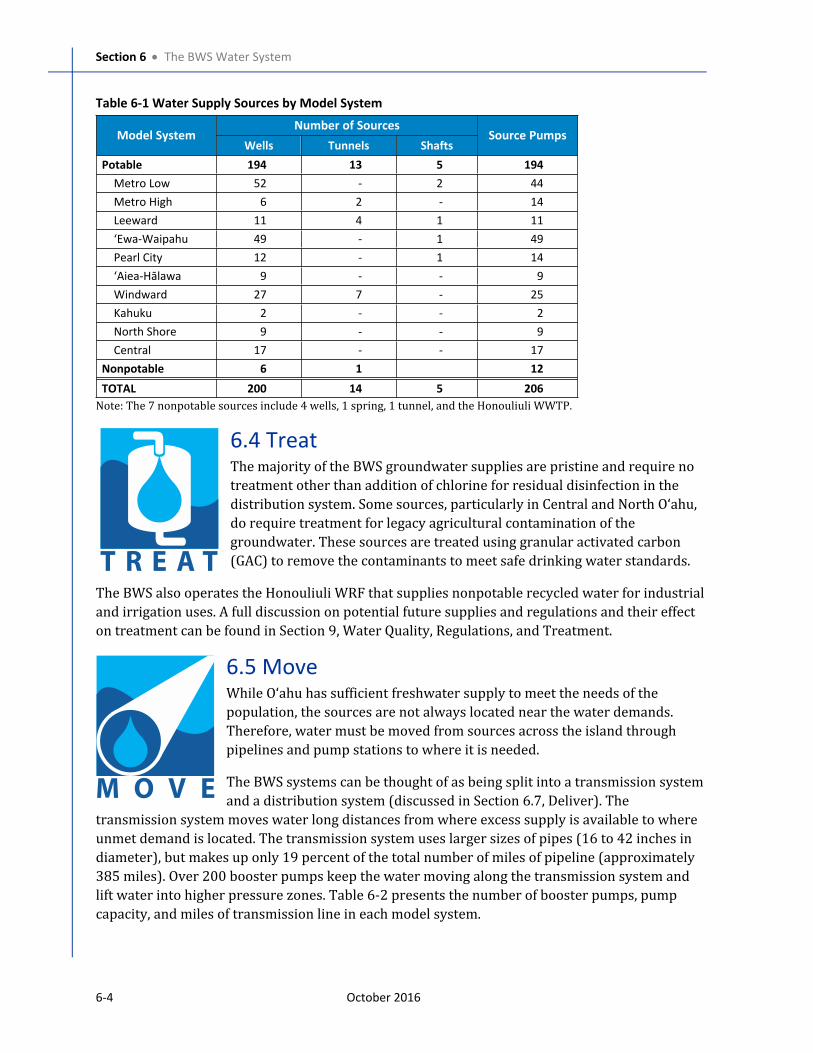
Section 6 The BWS Water System
6-4 October 2016
Table 6-1 Water Supply Sources by Model System
Number of SourcesModel System
Wells Tunnels ShaftsSource Pumps
Potable 194 13 5 194
Metro Low 52 - 2 44
Metro High 6 2 - 14
Leeward 11 4 1 11
‘Ewa-Waipahu 49 - 1 49
Pearl City 12 - 1 14
‘Aiea-Hālawa 9 - - 9
Windward 27 7 - 25
Kahuku 2 - - 2
North Shore 9 - - 9
Central 17 - - 17
Nonpotable 6 1 12
TOTAL 200 14 5 206
Note: The 7 nonpotable sources include 4 wells, 1 spring, 1 tunnel, and the Honouliuli WWTP.
6.4 TreatThe majority of the BWS groundwater supplies are pristine and require no
treatment other than addition of chlorine for residual disinfection in the
distribution system. Some sources, particularly in Central and North O‘ahu,
do require treatment for legacy agricultural contamination of the
groundwater. These sources are treated using granular activated carbon
(GAC) to remove the contaminants to meet safe drinking water standards.
The BWS also operates the Honouliuli WRF that supplies nonpotable recycled water for industrial
and irrigation uses. A full discussion on potential future supplies and regulations and their effect
on treatment can be found in Section 9, Water Quality, Regulations, and Treatment.
6.5 MoveWhile O‘ahu has sufficient freshwater supply to meet the needs of the
population, the sources are not always located near the water demands.
Therefore, water must be moved from sources across the island through
pipelines and pump stations to where it is needed.
The BWS systems can be thought of as being split into a transmission system
and a distribution system (discussed in Section 6.7, Deliver). The
transmission system moves water long distances from where excess supply is available to where
unmet demand is located. The transmission system uses larger sizes of pipes (16 to 42 inches in
diameter), but makes up only 19 percent of the total number of miles of pipeline (approximately
385 miles). Over 200 booster pumps keep the water moving along the transmission system and
lift water into higher pressure zones. Table 6-2 presents the number of booster pumps, pump
capacity, and miles of transmission line in each model system.
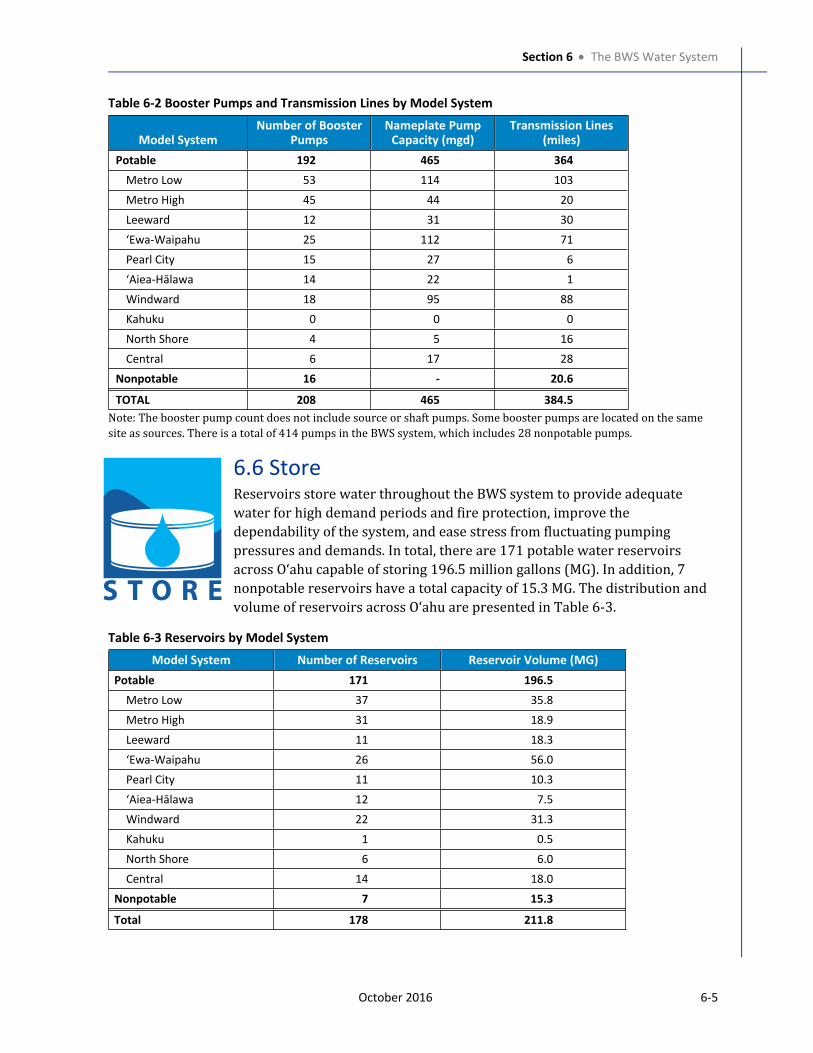
Section 6 The BWS Water System
October 2016 6-5
Table 6-2 Booster Pumps and Transmission Lines by Model System
Model System
Number of Booster
Pumps
Nameplate Pump
Capacity (mgd)
Transmission Lines
(miles)
Potable 192 465 364
Metro Low 53 114 103
Metro High 45 44 20
Leeward 12 31 30
‘Ewa-Waipahu 25 112 71
Pearl City 15 27 6
‘Aiea-Hālawa 14 22 1
Windward 18 95 88
Kahuku 0 0 0
North Shore 4 5 16
Central 6 17 28
Nonpotable 16 - 20.6
TOTAL 208 465 384.5
Note: The booster pump count does not include source or shaft pumps. Some booster pumps are located on the same
site as sources. There is a total of 414 pumps in the BWS system, which includes 28 nonpotable pumps.
6.6 StoreReservoirs store water throughout the BWS system to provide adequate
water for high demand periods and fire protection, improve the
dependability of the system, and ease stress from fluctuating pumping
pressures and demands. In total, there are 171 potable water reservoirs
across O‘ahu capable of storing 196.5 million gallons (MG). In addition, 7
nonpotable reservoirs have a total capacity of 15.3 MG. The distribution and
volume of reservoirs across O‘ahu are presented in Table 6-3.
Table 6-3 Reservoirs by Model System
Model System Number of Reservoirs Reservoir Volume (MG)
Potable 171 196.5
Metro Low 37 35.8
Metro High 31 18.9
Leeward 11 18.3
‘Ewa-Waipahu 26 56.0
Pearl City 11 10.3
‘Aiea-Hālawa 12 7.5
Windward 22 31.3
Kahuku 1 0.5
North Shore 6 6.0
Central 14 18.0
Nonpotable 7 15.3
Total 178 211.8
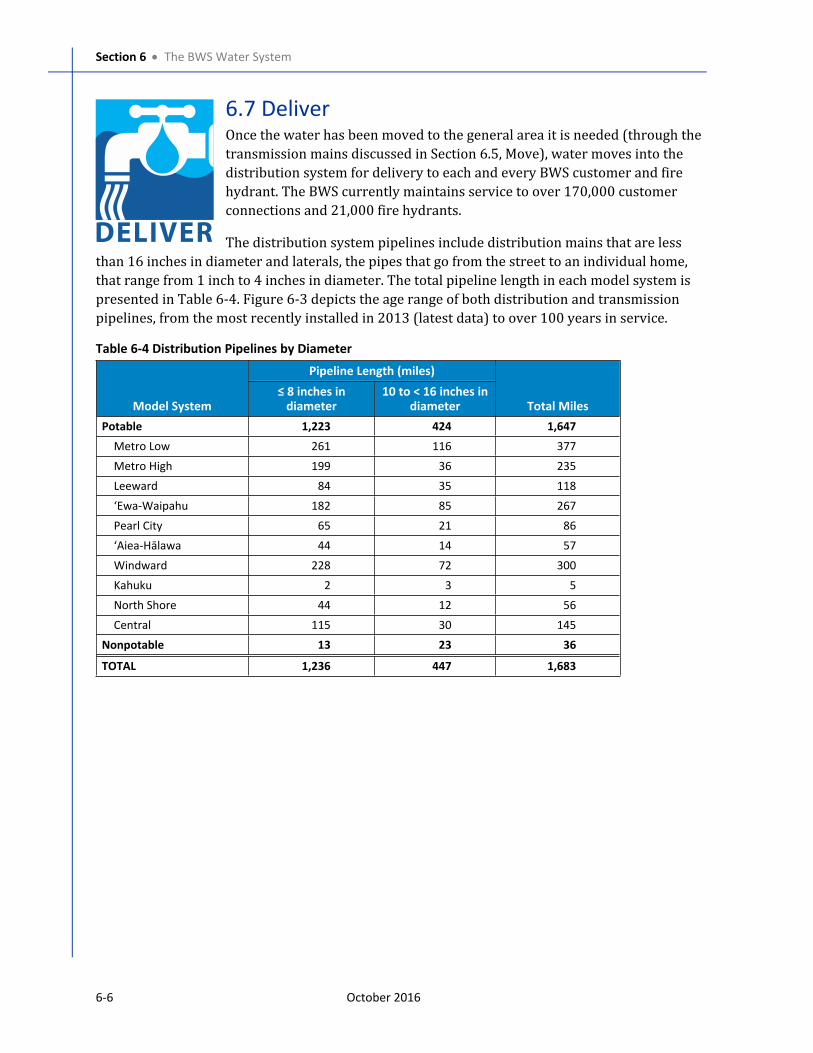
Section 6 The BWS Water System
6-6 October 2016
6.7 DeliverOnce the water has been moved to the general area it is needed (through the
transmission mains discussed in Section 6.5, Move), water moves into the
distribution system for delivery to each and every BWS customer and fire
hydrant. The BWS currently maintains service to over 170,000 customer
connections and 21,000 fire hydrants.
The distribution system pipelines include distribution mains that are less
than 16 inches in diameter and laterals, the pipes that go from the street to an individual home,
that range from 1 inch to 4 inches in diameter. The total pipeline length in each model system is
presented in Table 6-4. Figure 6-3 depicts the age range of both distribution and transmission
pipelines, from the most recently installed in 2013 (latest data) to over 100 years in service.
Table 6-4 Distribution Pipelines by Diameter
Pipeline Length (miles)
Model System
≤ 8 inches in
diameter
10 to < 16 inches in
diameter Total Miles
Potable 1,223 424 1,647
Metro Low 261 116 377
Metro High 199 36 235
Leeward 84 35 118
‘Ewa-Waipahu 182 85 267
Pearl City 65 21 86
‘Aiea-Hālawa 44 14 57
Windward 228 72 300
Kahuku 2 3 5
North Shore 44 12 56
Central 115 30 145
Nonpotable 13 23 36
TOTAL 1,236 447 1,683
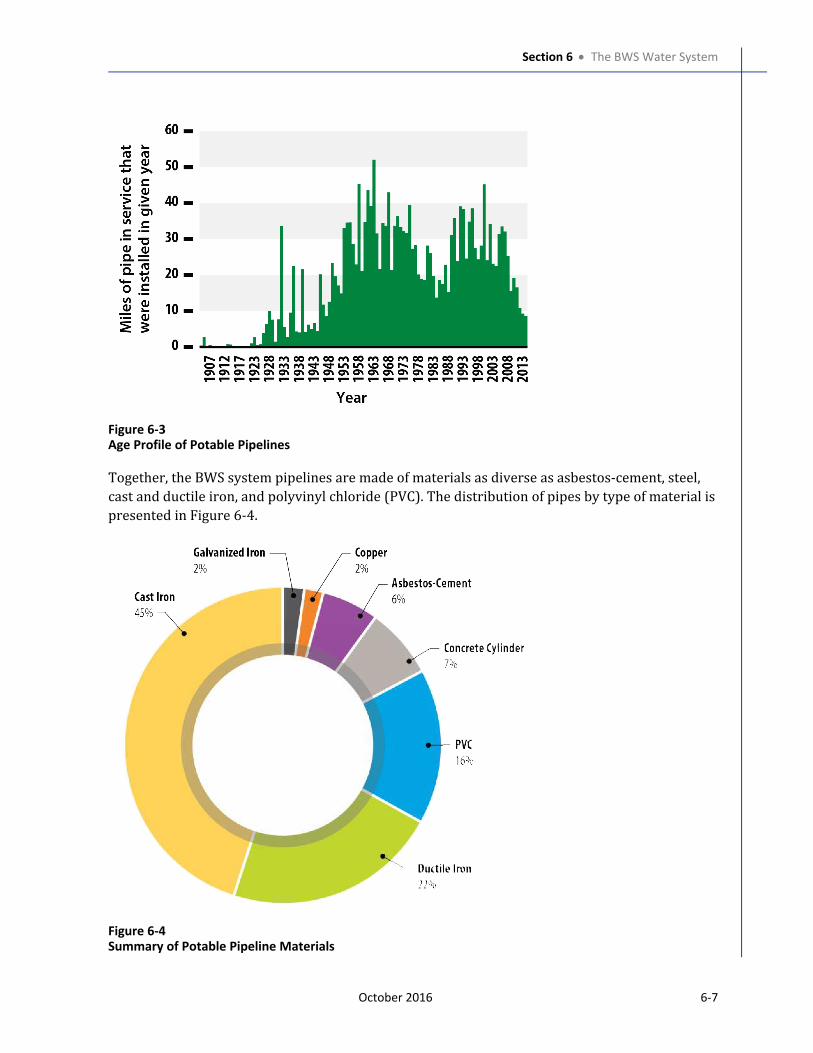
Section 6 The BWS Water System
October 2016 6-7
Figure 6-3
Age Profile of Potable Pipelines
Together, the BWS system pipelines are made of materials as diverse as asbestos-cement, steel,
cast and ductile iron, and polyvinyl chloride (PVC). The distribution of pipes by type of material is
presented in Figure 6-4.
Figure 6-4
Summary of Potable Pipeline Materials
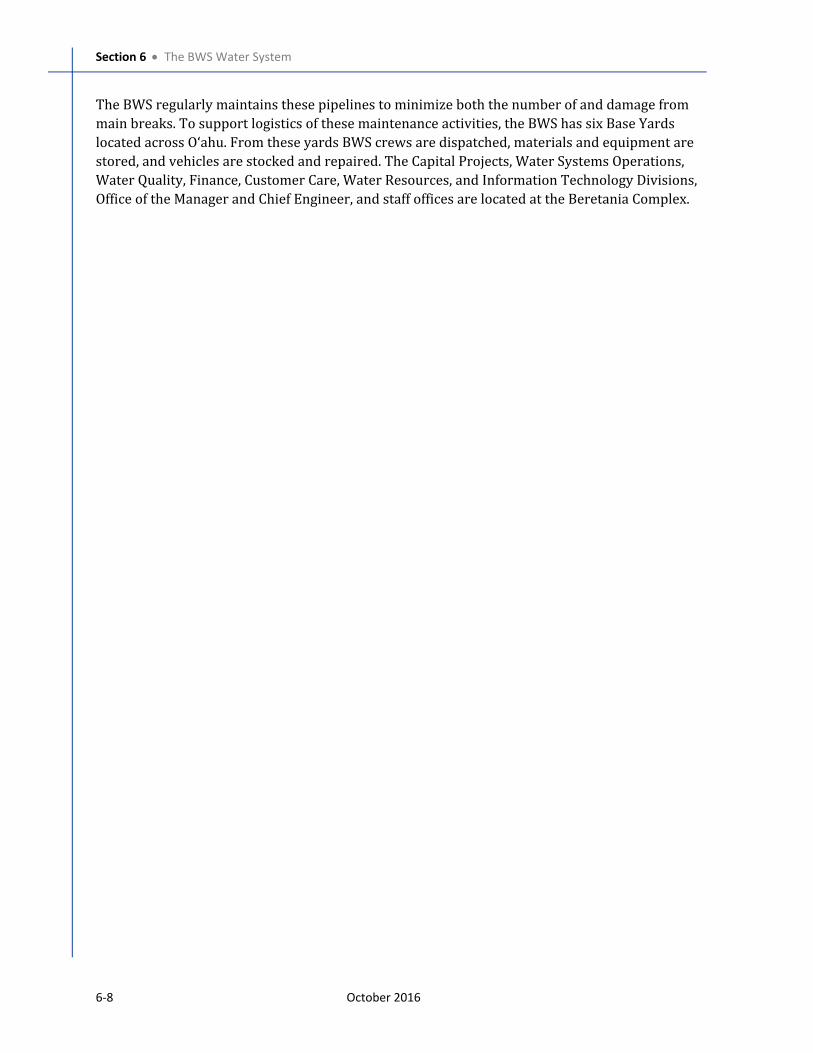
Section 6 The BWS Water System
6-8 October 2016
The BWS regularly maintains these pipelines to minimize both the number of and damage from
main breaks. To support logistics of these maintenance activities, the BWS has six Base Yards
located across O‘ahu. From these yards BWS crews are dispatched, materials and equipment are
stored, and vehicles are stocked and repaired. The Capital Projects, Water Systems Operations,
Water Quality, Finance, Customer Care, Water Resources, and Information Technology Divisions,
Office of the Manager and Chief Engineer, and staff offices are located at the Beretania Complex.

Part II
Technical Evaluation

October 2016 7-1
Section 7
Historical and Future Water
Demands
This section describes historical annual demands in
the BWS service area, the demand projection
approach, and estimated annual demands for the
future planning periods of 2025 and 2040 for two
growth scenarios. There are several areas, including
military installations, on Oʻahu that are not served
by the BWS; the population and demands in these
areas are not included in this WMP.
The water demands developed in this section were used to develop the hydraulic system models
and factor into the system analysis presented in Section 10, System Capacity Evaluation.
7.1 Key FindingsThe key findings of the WMP’s analysis of the BWS water demands are listed below. These
findings are identified with a code (an abbreviation for the section name) and number (for
example, DMND-1). These codes are repeated in Section 12, Findings and Recommendations, to
easily tie the findings in this section to the recommendations for BWS action listed in Section 12.
DMND-1 From 1980 to 2010, population served increased from 737,000 to 922,000. The BWS system is anticipated to see continued population growth reaching 1,055,000 by 2040 (about 0.5 percent per year). Population growth will be focused in transit-oriented development (TOD) areas in ‘Ewa, Central O‘ahu, and the Primary Urban Center, while other land use districts will experience stable populations or marginal decreases.
DMND-2 Although projections in the early 1990s predicted demand growth, Island-wide demand has decreased by 11 mgd in the last 25 years due to per capita demand decreasing by 31 gallons per capita per day (gpcd) freeing up existing capacity. Reduction in per capita demand was due to BWS conservation initiatives, changing land use that increased population density and reduced irrigation, and economic incentives from higher water and sewer rates. With additional conservation programs and further reductions in potable water irrigation, additional per capita demand reductions are possible. The BWS should continue investment in conservation with a goal of reducing per capita demand from 155 gpcd to 145 gpcd by 2040. These continued water conservation programs and declining per capita consumption are anticipated to moderate future system demand growth.
DMND-3 A range of demand projections was developed to address uncertainties in
planning assumptions. Water demand is projected to increase from 145 mgd in
provides information that
addresses the following
WMP objectives:
Water Quality, Health, and Safety
System Reliability and Adequacy
Cost and Affordability
Water Conservation
Water Resource Sustainability
Section
7
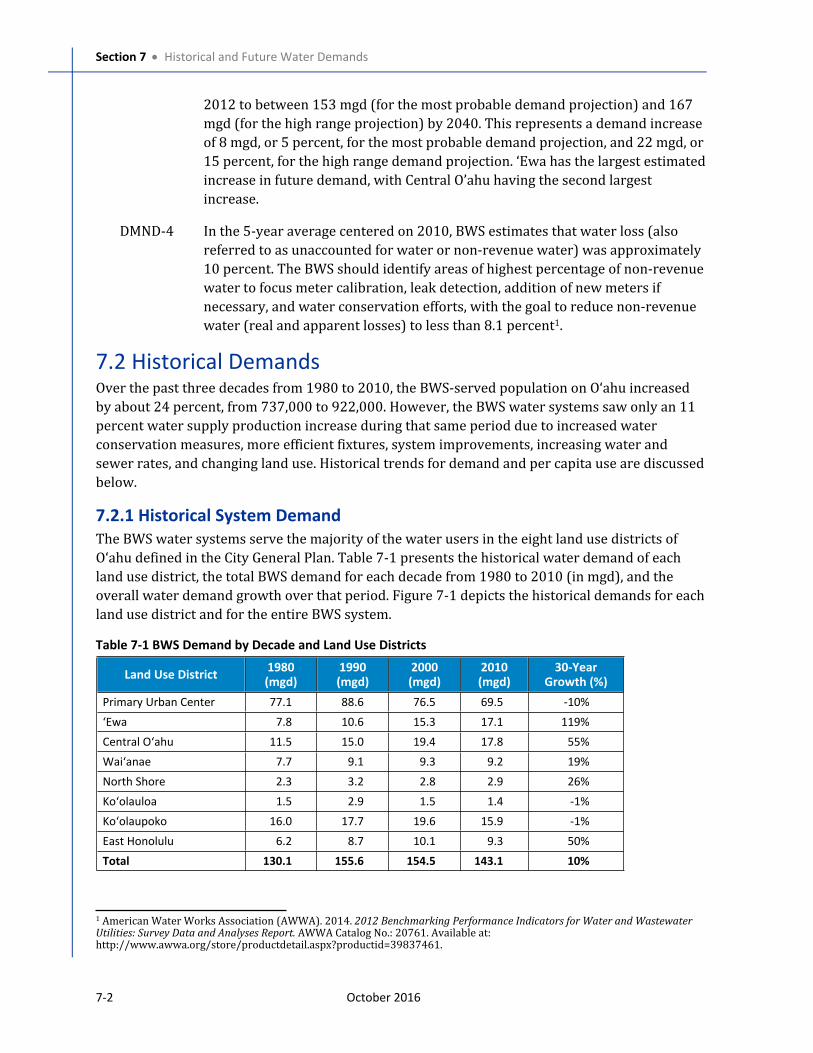
Section 7 Historical and Future Water Demands
7-2 October 2016
2012 to between 153 mgd (for the most probable demand projection) and 167
mgd (for the high range projection) by 2040. This represents a demand increase
of 8 mgd, or 5 percent, for the most probable demand projection, and 22 mgd, or
15 percent, for the high range demand projection. ‘Ewa has the largest estimated
increase in future demand, with Central O’ahu having the second largest
increase.
DMND-4 In the 5-year average centered on 2010, BWS estimates that water loss (also
referred to as unaccounted for water or non-revenue water) was approximately
10 percent. The BWS should identify areas of highest percentage of non-revenue
water to focus meter calibration, leak detection, addition of new meters if
necessary, and water conservation efforts, with the goal to reduce non-revenue
water (real and apparent losses) to less than 8.1 percent1.
7.2 Historical DemandsOver the past three decades from 1980 to 2010, the BWS-served population on Oʻahu increased
by about 24 percent, from 737,000 to 922,000. However, the BWS water systems saw only an 11
percent water supply production increase during that same period due to increased water
conservation measures, more efficient fixtures, system improvements, increasing water and
sewer rates, and changing land use. Historical trends for demand and per capita use are discussed
below.
7.2.1 Historical System Demand
The BWS water systems serve the majority of the water users in the eight land use districts of Oʻahu defined in the City General Plan. Table 7-1 presents the historical water demand of each
land use district, the total BWS demand for each decade from 1980 to 2010 (in mgd), and the
overall water demand growth over that period. Figure 7-1 depicts the historical demands for each
land use district and for the entire BWS system.
Table 7-1 BWS Demand by Decade and Land Use Districts
Land Use District1980
(mgd)
1990
(mgd)
2000
(mgd)
2010
(mgd)
30-Year
Growth (%)
Primary Urban Center 77.1 88.6 76.5 69.5 -10%
‘Ewa 7.8 10.6 15.3 17.1 119%
Central Oʻahu 11.5 15.0 19.4 17.8 55%
Waiʻanae 7.7 9.1 9.3 9.2 19%
North Shore 2.3 3.2 2.8 2.9 26%
Koʻolauloa 1.5 2.9 1.5 1.4 -1%
Koʻolaupoko 16.0 17.7 19.6 15.9 -1%
East Honolulu 6.2 8.7 10.1 9.3 50%
Total 130.1 155.6 154.5 143.1 10%
1 American Water Works Association (AWWA). 2014. 2012 Benchmarking Performance Indicators for Water and Wastewater Utilities: Survey Data and Analyses Report. AWWA Catalog No.: 20761. Available at: http://www.awwa.org/store/productdetail.aspx?productid=39837461.
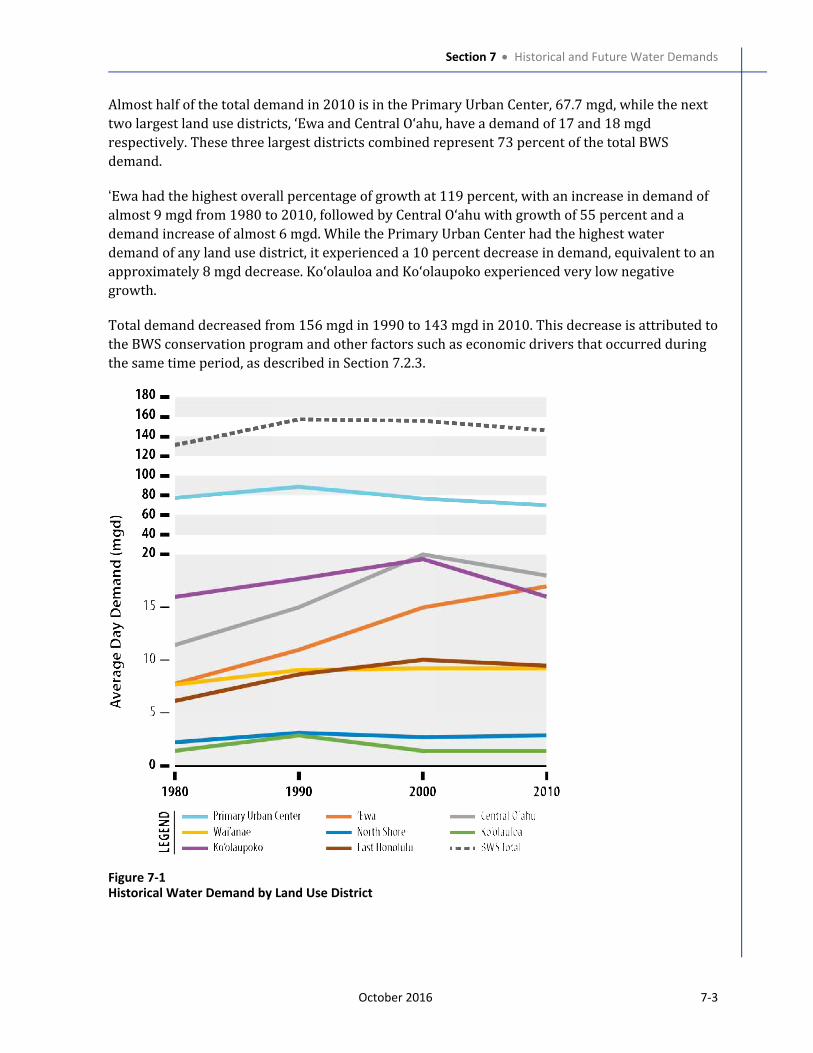
Section 7 Historical and Future Water Demands
October 2016 7-3
Almost half of the total demand in 2010 is in the Primary Urban Center, 67.7 mgd, while the next
two largest land use districts, ‘Ewa and Central Oʻahu, have a demand of 17 and 18 mgd
respectively. These three largest districts combined represent 73 percent of the total BWS
demand.
‘Ewa had the highest overall percentage of growth at 119 percent, with an increase in demand of
almost 9 mgd from 1980 to 2010, followed by Central Oʻahu with growth of 55 percent and a
demand increase of almost 6 mgd. While the Primary Urban Center had the highest water
demand of any land use district, it experienced a 10 percent decrease in demand, equivalent to an
approximately 8 mgd decrease. Koʻolauloa and Koʻolaupoko experienced very low negative
growth.
Total demand decreased from 156 mgd in 1990 to 143 mgd in 2010. This decrease is attributed to
the BWS conservation program and other factors such as economic drivers that occurred during
the same time period, as described in Section 7.2.3.
Figure 7-1
Historical Water Demand by Land Use District
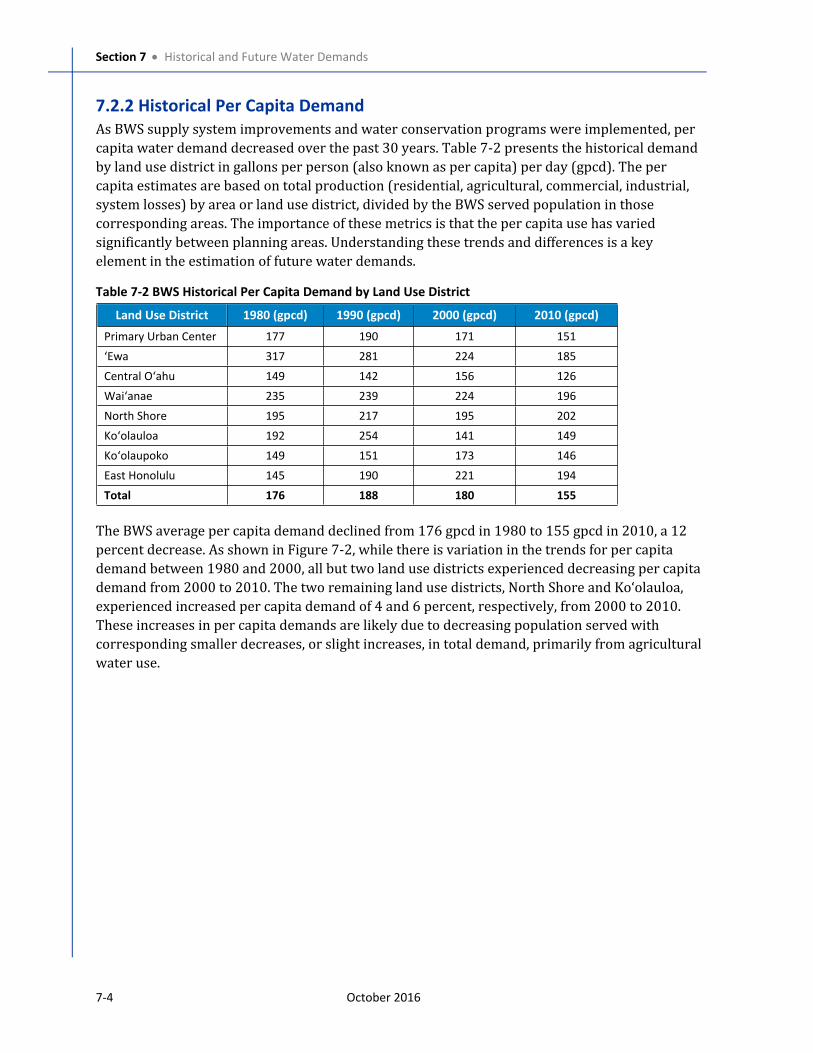
Section 7 Historical and Future Water Demands
7-4 October 2016
7.2.2 Historical Per Capita Demand
As BWS supply system improvements and water conservation programs were implemented, per
capita water demand decreased over the past 30 years. Table 7-2 presents the historical demand
by land use district in gallons per person (also known as per capita) per day (gpcd). The per
capita estimates are based on total production (residential, agricultural, commercial, industrial,
system losses) by area or land use district, divided by the BWS served population in those
corresponding areas. The importance of these metrics is that the per capita use has varied
significantly between planning areas. Understanding these trends and differences is a key
element in the estimation of future water demands.
Table 7-2 BWS Historical Per Capita Demand by Land Use District
Land Use District 1980 (gpcd) 1990 (gpcd) 2000 (gpcd) 2010 (gpcd)
Primary Urban Center 177 190 171 151
‘Ewa 317 281 224 185
Central Oʻahu 149 142 156 126
Waiʻanae 235 239 224 196
North Shore 195 217 195 202
Koʻolauloa 192 254 141 149
Koʻolaupoko 149 151 173 146
East Honolulu 145 190 221 194
Total 176 188 180 155
The BWS average per capita demand declined from 176 gpcd in 1980 to 155 gpcd in 2010, a 12
percent decrease. As shown in Figure 7-2, while there is variation in the trends for per capita
demand between 1980 and 2000, all but two land use districts experienced decreasing per capita
demand from 2000 to 2010. The two remaining land use districts, North Shore and Koʻolauloa, experienced increased per capita demand of 4 and 6 percent, respectively, from 2000 to 2010.
These increases in per capita demands are likely due to decreasing population served with
corresponding smaller decreases, or slight increases, in total demand, primarily from agricultural
water use.

Section 7 Historical and Future Water Demands
October 2016 7-5
Figure 7-2
BWS Historical Per Capita Demand Trends
The BWS average per capita demand tracks closely with that of the Primary Urban Center
because it has the highest demands and the largest population. The per capita daily demand for
‘Ewa was over 300 gpcd in 1980, but dropped to less than 200 gpcd by 2010. The per capita
demand in the district was high in 1980 because there was only a small population compared to
the industrial demand. From 1980 to 2010, residential population almost tripled, while
corresponding industrial demand continued to decline due to water conservation and increased
recycled water use that replaced potable water, thus reducing the per capita demand
significantly. The per capita daily demand for Ko‘olauloa fluctuates the most out of the land use
districts because this district has the smallest population and the smallest overall demand.
7.2.3 Effects of Water Conservation
In the late 1980s, Oʻahu’s water demand was reaching system capacity. This increasing demand
trend changed in the 1990s, fueled by the collapse of the Japanese real estate investment bubble,
leading to a local economic downturn. Also, the BWS’s Water Conservation Program started in
1990, and the Oʻahu Sugar Company, a large user of groundwater, closed in 1995 freeing up
agricultural supply for potable uses.
Section 7 Historical and Future Water Demands
7-6 October 2016
Although the population served by the BWS has steadily increased from 740,000 in 1980 to
922,000 in 2010 (25 percent increase), per capita demand decreased system-wide from 1990 to
2010 from 176 gpcd to 155 gpcd (12 percent decrease). It is anticipated that the downward trend
will continue, although at a slower rate (estimated additional 10 percent decrease by 2040). This
continued decrease will only occur with dedicated conservation programs going forward. See
Section 4, Water Supply Sustainability, for more information on future water conservation efforts.
As part of the conservation program, the City Council passed the low flow toilet ordinance in
1993 which mandated the immediate change out of all non-residential toilets from the 3 to 5
gallons per flush type to 1.6 gallons per flush type. The BWS and the City Department of
Environmental Services also created a $100 rebate for residential toilets to support the mandate.
This rebate program extended from 1994 to 2007 with just under 60,000 toilets in single-family
homes replaced. Conservation also helped to mitigate drought conditions caused by a strong El
Niño event and following drought from 1997 to 2003.
Starting in 2005, water rates increased for the first time in 11 years, and at the same time the City
sewer rates increased to address the U.S. Environmental Protection Agency (EPA) consent decree.
These water and sewer rate increases encouraged additional conservation.
7.2.4 Effects of Water Loss
The water demands for existing conditions were established based on the BWS customer meter
and water supply production data. The production data includes water loss, also referred to as
unaccounted for water or non-revenue water. Water loss is made up of two components – real
and apparent losses.
1. Real water loss is the water lost through leakage, main breaks, and tank overflows.
2. Apparent water loss is water not accounted for due to unauthorized consumption or
uncalibrated customer and/or source meters. In addition, some uses may not be metered
including irrigation in some areas, water used to fight fires, or use of fire hydrants for
construction.
For the BWS system, the total water loss including the two components is calculated as the
difference between the total water production (based on flow meters at sources) and the amount
of water billed to customers (metered consumption), and is estimated to be about 10 percent
island-wide as of 2010. The median water loss estimate from an American Water Works
Association (AWWA) survey in 2012 was 8.1 percent2.
In order to help reduce water loss. the BWS Leak Detection Team continues to survey water
pipelines and meter boxes for leaks, and repairs are conducted by the BWS Field Operations. The
CIP will include projects to reduce apparent water loss, such as adding additional meters in the
transmission system, performing maintenance on the retail meters and master meters to improve
meter accuracy, and investing in automatic meter reading upgrades. As that data is developed, it
will be used to modify future demand projections.
2 AWWA. 2014. 2012 Benchmarking Performance Indicators for Water and Wastewater Utilities: Survey Data and Analyses
Report. AWWA Catalog No.: 20761. Available at: http://www.awwa.org/store/productdetail.aspx?productid=39837461.
Section 7 Historical and Future Water Demands
October 2016 7-7
7.3 Demand Projection Approach7.3.1 O‘ahu Water Management Plan
A key element in the O‘ahu Water Management Plan (OWMP) is the development of island-wide
water demand estimates utilizing population forecasts provided by the Department of Planning
and Permitting (DPP), developer master plans, and subdivision development information. DPP
developed forecasts by transportation analysis zones and census tracts, providing discrete land
use coverages within the eight land use districts. For the OWMP, the BWS applied its water use
data to DPP’s population forecast data to derive BWS-served populations, per capita demands,
and water demand forecasts by land use district for long-range planning of source development
and water system infrastructure sizing.
As with all long-range forecasts, variation occurs due to uncertainties in changing economic
climate, jobs, tourism, zoning, development starts, population distribution, and water
conservation. To address these variations, the OWMP developed up to four water demand
scenarios up to year 2040 for each of the land use districts: low; most probable; high; and
ultimate scenarios. The low-growth scenario reflected slower growth in urban development. The
most probable was based on the most likely assumptions and grounded on City policies. The high
growth scenario reflected a faster rate of urban growth than the City and County policies. The
ultimate growth scenario identified demands where the land use districts are fully built-out.
7.3.2 WMP Annual Demand Projections
The OWMP demand projection scenarios were developed to determine the extent of water use
and source development. For the Water Master Plan, that level of broad BWS-wide water demand
projection was too coarse for the necessary water system analysis, especially for appropriately
sizing pipelines to accommodate growth in the TOD areas. More detailed demand projection
methods were utilized to provide a finer level of detail for the WMP. Some of the other
information used to develop the estimates of future BWS annual demand, included:
U.S. Census data for 2010;
Island-wide population projections from DPP;
The BWS served population3 projection from the BWS Long Range Planning (LRP) Branch;
Historical customer meter data and pumping production data from the BWS;
Year 2012 and 2013 operational data;
The BWS projected per capita demand projections for 2015 to 2040;
Neighborhood TOD Plans published in 2015;
Private development master plans, not approved by the BWS; and,
Land use information from the City’s geographical information system (GIS) zoning layer.
3 Served population is defined as those served by the BWS water system, which takes into account residential population and visitors.
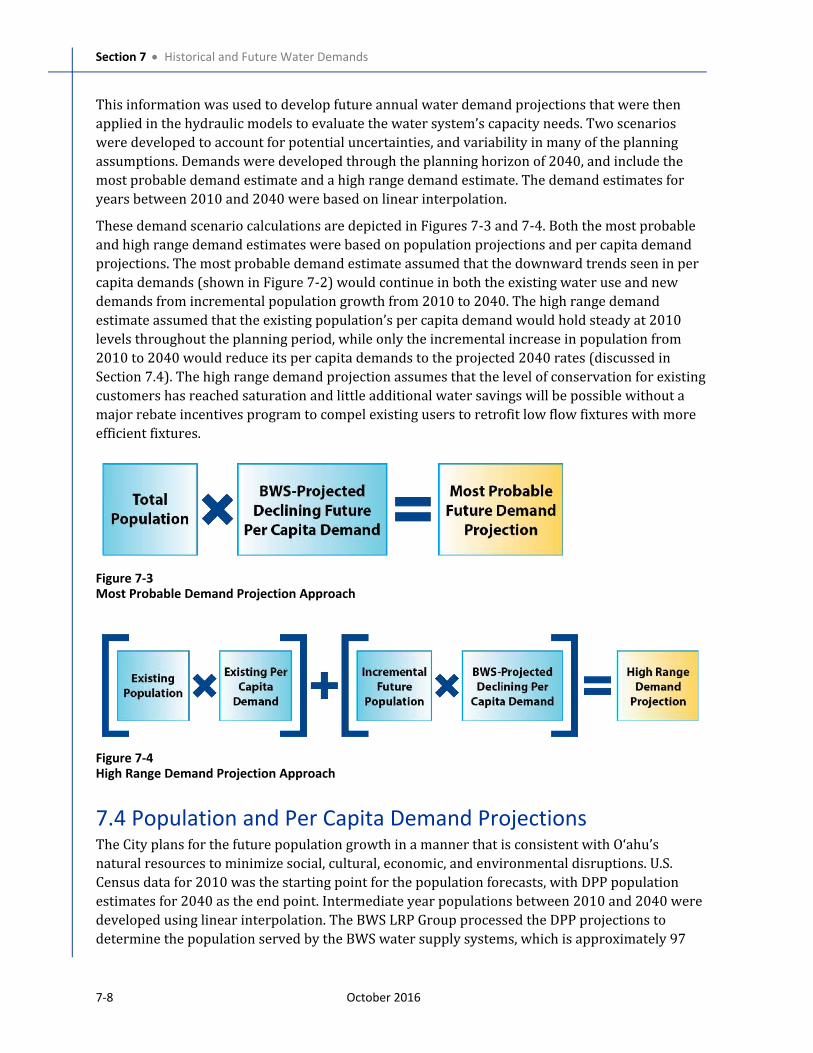
Section 7 Historical and Future Water Demands
7-8 October 2016
This information was used to develop future annual water demand projections that were then
applied in the hydraulic models to evaluate the water system’s capacity needs. Two scenarios
were developed to account for potential uncertainties, and variability in many of the planning
assumptions. Demands were developed through the planning horizon of 2040, and include the
most probable demand estimate and a high range demand estimate. The demand estimates for
years between 2010 and 2040 were based on linear interpolation.
These demand scenario calculations are depicted in Figures 7-3 and 7-4. Both the most probable
and high range demand estimates were based on population projections and per capita demand
projections. The most probable demand estimate assumed that the downward trends seen in per
capita demands (shown in Figure 7-2) would continue in both the existing water use and new
demands from incremental population growth from 2010 to 2040. The high range demand
estimate assumed that the existing population’s per capita demand would hold steady at 2010
levels throughout the planning period, while only the incremental increase in population from
2010 to 2040 would reduce its per capita demands to the projected 2040 rates (discussed in
Section 7.4). The high range demand projection assumes that the level of conservation for existing
customers has reached saturation and little additional water savings will be possible without a
major rebate incentives program to compel existing users to retrofit low flow fixtures with more
efficient fixtures.
Figure 7-3
Most Probable Demand Projection Approach
Figure 7-4
High Range Demand Projection Approach
7.4 Population and Per Capita Demand Projections The City plans for the future population growth in a manner that is consistent with Oʻahu’s natural resources to minimize social, cultural, economic, and environmental disruptions. U.S.
Census data for 2010 was the starting point for the population forecasts, with DPP population
estimates for 2040 as the end point. Intermediate year populations between 2010 and 2040 were
developed using linear interpolation. The BWS LRP Group processed the DPP projections to
determine the population served by the BWS water supply systems, which is approximately 97
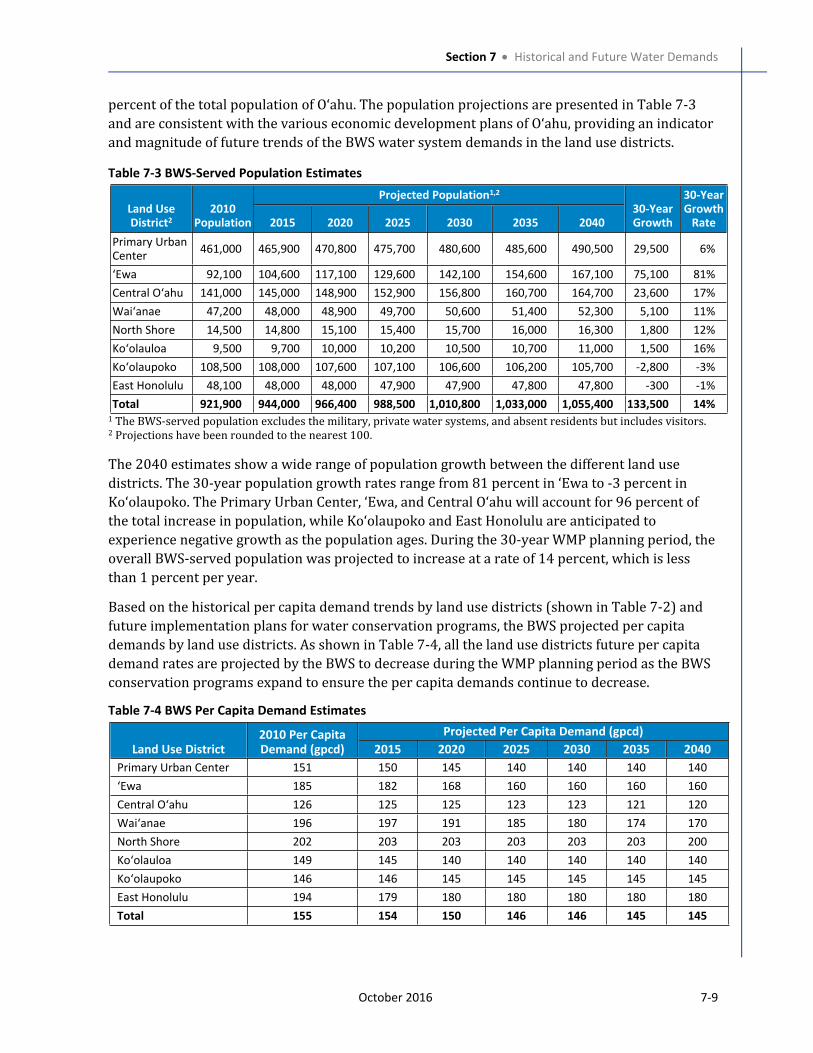
Section 7 Historical and Future Water Demands
October 2016 7-9
percent of the total population of Oʻahu. The population projections are presented in Table 7-3
and are consistent with the various economic development plans of Oʻahu, providing an indicator
and magnitude of future trends of the BWS water system demands in the land use districts.
Table 7-3 BWS-Served Population Estimates
Projected Population1,2
Land Use
District2
2010
Population 2015 2020 2025 2030 2035 2040
30-Year
Growth
30-Year
Growth
Rate
Primary Urban
Center461,000 465,900 470,800 475,700 480,600 485,600 490,500 29,500 6%
‘Ewa 92,100 104,600 117,100 129,600 142,100 154,600 167,100 75,100 81%
Central Oʻahu 141,000 145,000 148,900 152,900 156,800 160,700 164,700 23,600 17%
Waiʻanae 47,200 48,000 48,900 49,700 50,600 51,400 52,300 5,100 11%
North Shore 14,500 14,800 15,100 15,400 15,700 16,000 16,300 1,800 12%
Koʻolauloa 9,500 9,700 10,000 10,200 10,500 10,700 11,000 1,500 16%
Koʻolaupoko 108,500 108,000 107,600 107,100 106,600 106,200 105,700 -2,800 -3%
East Honolulu 48,100 48,000 48,000 47,900 47,900 47,800 47,800 -300 -1%
Total 921,900 944,000 966,400 988,500 1,010,800 1,033,000 1,055,400 133,500 14%1 The BWS-served population excludes the military, private water systems, and absent residents but includes visitors. 2 Projections have been rounded to the nearest 100.
The 2040 estimates show a wide range of population growth between the different land use
districts. The 30-year population growth rates range from 81 percent in ‘Ewa to -3 percent in Koʻolaupoko. The Primary Urban Center, ‘Ewa, and Central Oʻahu will account for 96 percent of
the total increase in population, while Koʻolaupoko and East Honolulu are anticipated to
experience negative growth as the population ages. During the 30-year WMP planning period, the
overall BWS-served population was projected to increase at a rate of 14 percent, which is less
than 1 percent per year.
Based on the historical per capita demand trends by land use districts (shown in Table 7-2) and
future implementation plans for water conservation programs, the BWS projected per capita
demands by land use districts. As shown in Table 7-4, all the land use districts future per capita
demand rates are projected by the BWS to decrease during the WMP planning period as the BWS
conservation programs expand to ensure the per capita demands continue to decrease.
Table 7-4 BWS Per Capita Demand Estimates
Projected Per Capita Demand (gpcd)
Land Use District
2010 Per Capita
Demand (gpcd) 2015 2020 2025 2030 2035 2040
Primary Urban Center 151 150 145 140 140 140 140
‘Ewa 185 182 168 160 160 160 160
Central Oʻahu 126 125 125 123 123 121 120
Waiʻanae 196 197 191 185 180 174 170
North Shore 202 203 203 203 203 203 200
Koʻolauloa 149 145 140 140 140 140 140
Koʻolaupoko 146 146 145 145 145 145 145
East Honolulu 194 179 180 180 180 180 180
Total 155 154 150 146 146 145 145
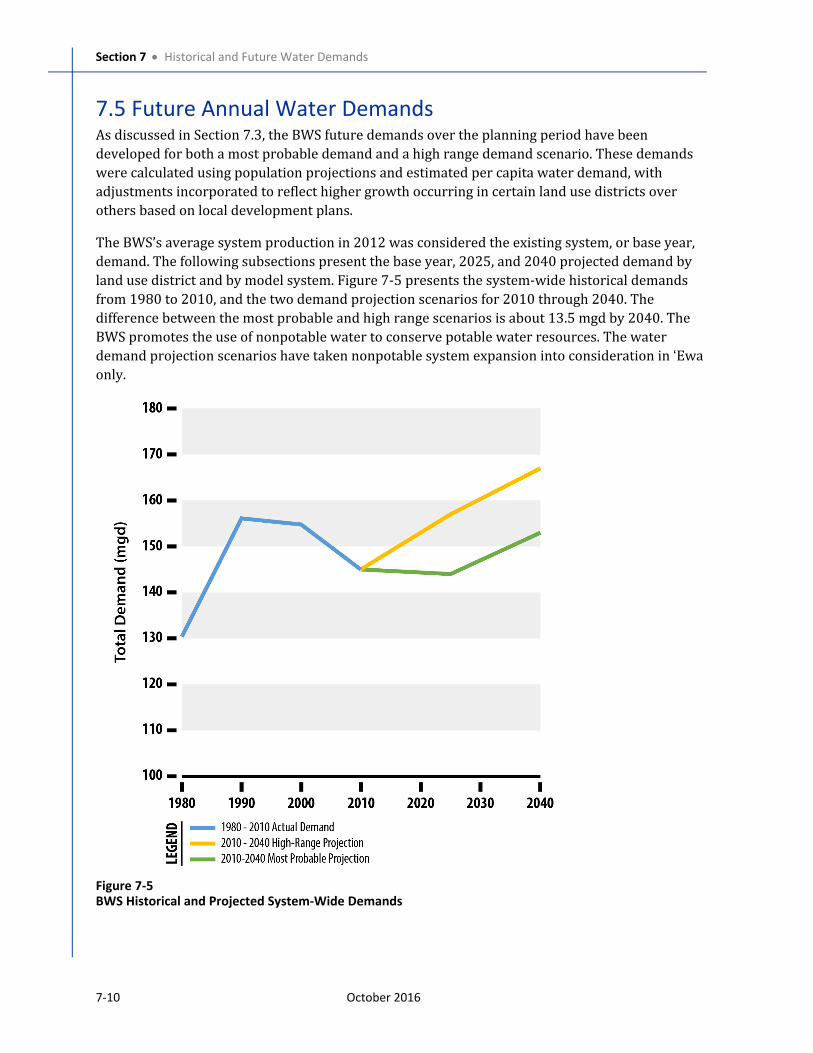
Section 7 Historical and Future Water Demands
7-10 October 2016
7.5 Future Annual Water DemandsAs discussed in Section 7.3, the BWS future demands over the planning period have been
developed for both a most probable demand and a high range demand scenario. These demands
were calculated using population projections and estimated per capita water demand, with
adjustments incorporated to reflect higher growth occurring in certain land use districts over
others based on local development plans.
The BWS’s average system production in 2012 was considered the existing system, or base year,
demand. The following subsections present the base year, 2025, and 2040 projected demand by
land use district and by model system. Figure 7-5 presents the system-wide historical demands
from 1980 to 2010, and the two demand projection scenarios for 2010 through 2040. The
difference between the most probable and high range scenarios is about 13.5 mgd by 2040. The
BWS promotes the use of nonpotable water to conserve potable water resources. The water
demand projection scenarios have taken nonpotable system expansion into consideration in ‘Ewa
only.
Figure 7-5
BWS Historical and Projected System-Wide Demands
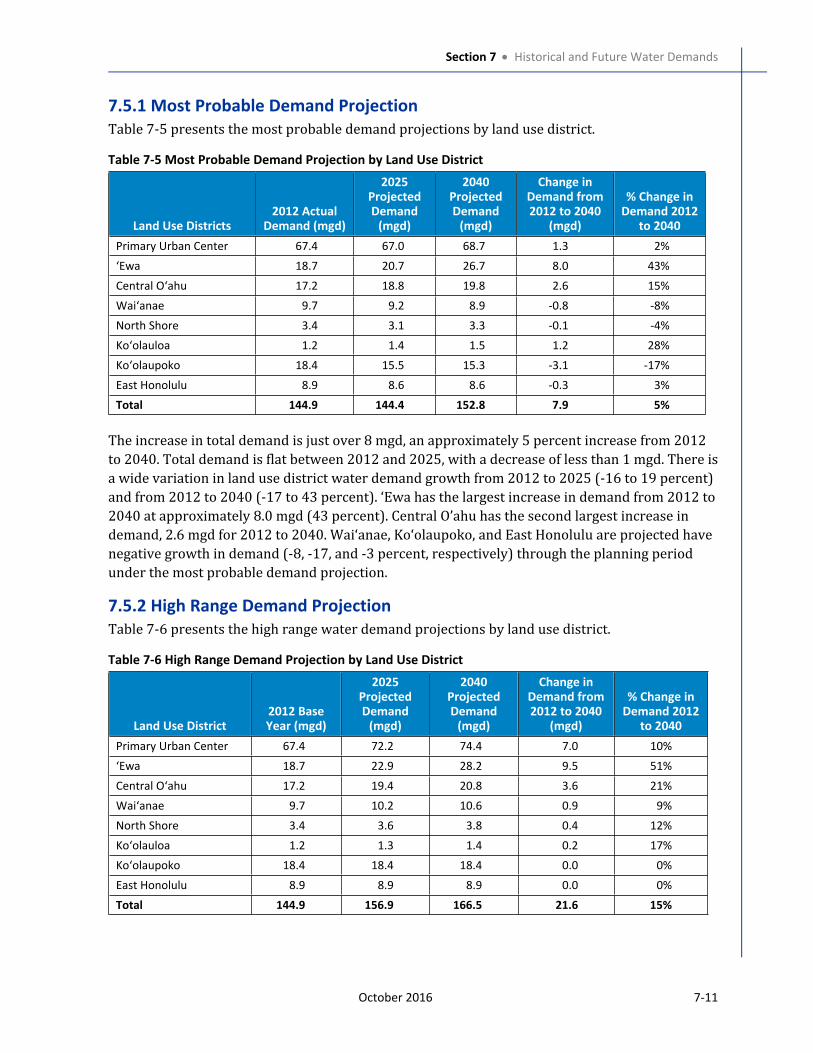
Section 7 Historical and Future Water Demands
October 2016 7-11
7.5.1 Most Probable Demand Projection
Table 7-5 presents the most probable demand projections by land use district.
Table 7-5 Most Probable Demand Projection by Land Use District
Land Use Districts
2012 Actual
Demand (mgd)
2025
Projected
Demand
(mgd)
2040
Projected
Demand
(mgd)
Change in
Demand from
2012 to 2040
(mgd)
% Change in
Demand 2012
to 2040
Primary Urban Center 67.4 67.0 68.7 1.3 2%
‘Ewa 18.7 20.7 26.7 8.0 43%
Central Oʻahu 17.2 18.8 19.8 2.6 15%
Waiʻanae 9.7 9.2 8.9 -0.8 -8%
North Shore 3.4 3.1 3.3 -0.1 -4%
Koʻolauloa 1.2 1.4 1.5 1.2 28%
Koʻolaupoko 18.4 15.5 15.3 -3.1 -17%
East Honolulu 8.9 8.6 8.6 -0.3 3%
Total 144.9 144.4 152.8 7.9 5%
The increase in total demand is just over 8 mgd, an approximately 5 percent increase from 2012
to 2040. Total demand is flat between 2012 and 2025, with a decrease of less than 1 mgd. There is
a wide variation in land use district water demand growth from 2012 to 2025 (-16 to 19 percent)
and from 2012 to 2040 (-17 to 43 percent). ‘Ewa has the largest increase in demand from 2012 to
2040 at approximately 8.0 mgd (43 percent). Central O’ahu has the second largest increase in
demand, 2.6 mgd for 2012 to 2040. Waiʻanae, Koʻolaupoko, and East Honolulu are projected have
negative growth in demand (-8, -17, and -3 percent, respectively) through the planning period
under the most probable demand projection.
7.5.2 High Range Demand Projection
Table 7-6 presents the high range water demand projections by land use district.
Table 7-6 High Range Demand Projection by Land Use District
Land Use District
2012 Base
Year (mgd)
2025
Projected
Demand
(mgd)
2040
Projected
Demand
(mgd)
Change in
Demand from
2012 to 2040
(mgd)
% Change in
Demand 2012
to 2040
Primary Urban Center 67.4 72.2 74.4 7.0 10%
‘Ewa 18.7 22.9 28.2 9.5 51%
Central Oʻahu 17.2 19.4 20.8 3.6 21%
Waiʻanae 9.7 10.2 10.6 0.9 9%
North Shore 3.4 3.6 3.8 0.4 12%
Koʻolauloa 1.2 1.3 1.4 0.2 17%
Koʻolaupoko 18.4 18.4 18.4 0.0 0%
East Honolulu 8.9 8.9 8.9 0.0 0%
Total 144.9 156.9 166.5 21.6 15%
Section 7 Historical and Future Water Demands
7-12 October 2016
The increase in total demand is just under 22 mgd, an approximately 15 percent increase from
2012 to 2040. There is a wide variation in the land use district demand growth from 2012 to
2025 (0 to 22 percent) and from 2012 to 2040 (0 to 51 percent). ‘Ewa has the largest increase in
demand from 2012 to 2040 at approximately 9.5 mgd (51 percent). The Primary Urban Center
has the second largest increase in demand, 4.8 mgd for 2012 to 2025 and 7 mgd for 2012 to 2040.
More than 75 percent of the total increase in demand occurs in ‘Ewa and the Primary Urban
Center. Both Koʻolaupoko and East Honolulu are projected to have no growth in demand through
the planning period.
7.6 Nonpotable DemandsThe BWS promotes the use of nonpotable water to conserve potable water resources. The BWS
water systems consist of four existing nonpotable (NP) water systems:
Barbers Point 215 NP (Brackish water wells);
Mauna ʻOlu 530 NP (Glover Tunnel);
Honouliuli WRF (tertiary disinfected R-1, and reverse osmosis demineralized recycled
water); and
Hālawa 245 NP (Brackish water springs).
The Barbers Point 215 NP and Honouliuli WRF water systems serve the nonpotable water users
in ‘Ewa land use district. Both systems are planned to expand their service capacities as shown in
Table 7-7. Glover Tunnel supplies nonpotable water to Mauna ‘Olu 530 NP Reservoir, which is
used for irrigation. The Hālawa 245 NP water system is located in the Primary Urban Center land
use district and is supplied by Kalauao Springs.
With increasing availability and accessibility, nonpotable water will be more commonly used by
future golf courses, parks, development landscaping, and industrial users. Some existing large
users on the potable water system may also be converted to nonpotable water use when
nonpotable water becomes available. As the nonpotable supplies are expanded and take the place
of potable supply with the applications above, the unit potable water demand of ‘Ewa land use
district will decrease.
The BWS has taken this NP system influence into consideration in the projection of the future per
capita water demands. Future nonpotable demands have been accounted for by offsetting the
increase in future demands of the potable water system.
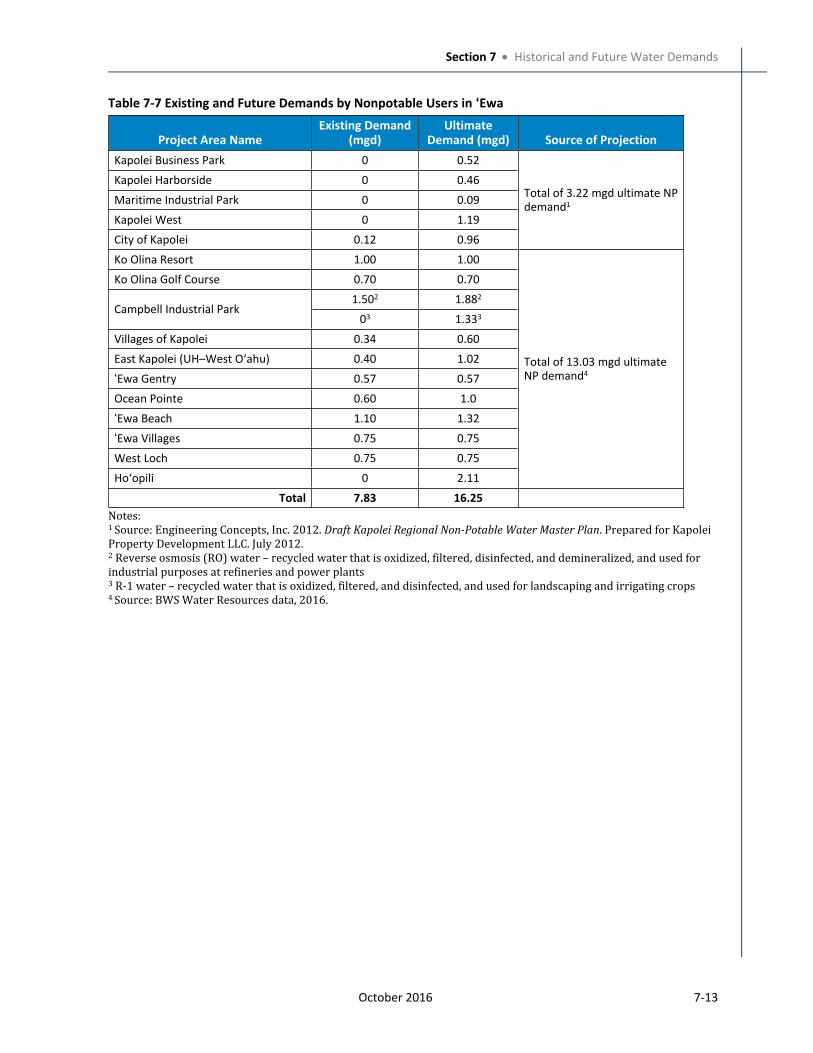
Section 7 Historical and Future Water Demands
October 2016 7-13
Table 7-7 Existing and Future Demands by Nonpotable Users in ‘Ewa
Project Area Name
Existing Demand
(mgd)
Ultimate
Demand (mgd) Source of Projection
Kapolei Business Park 0 0.52
Kapolei Harborside 0 0.46
Maritime Industrial Park 0 0.09
Kapolei West 0 1.19
City of Kapolei 0.12 0.96
Total of 3.22 mgd ultimate NP
demand1
Ko Olina Resort 1.00 1.00
Ko Olina Golf Course 0.70 0.70
1.502 1.882
Campbell Industrial Park03 1.333
Villages of Kapolei 0.34 0.60
East Kapolei (UH–West Oʻahu) 0.40 1.02
‘Ewa Gentry 0.57 0.57
Ocean Pointe 0.60 1.0
‘Ewa Beach 1.10 1.32
‘Ewa Villages 0.75 0.75
West Loch 0.75 0.75
Hoʻopili 0 2.11
Total of 13.03 mgd ultimate
NP demand4
Total 7.83 16.25
Notes: 1 Source: Engineering Concepts, Inc. 2012. Draft Kapolei Regional Non-Potable Water Master Plan. Prepared for Kapolei Property Development LLC. July 2012.2 Reverse osmosis (RO) water – recycled water that is oxidized, filtered, disinfected, and demineralized, and used for industrial purposes at refineries and power plants3 R-1 water – recycled water that is oxidized, filtered, and disinfected, and used for landscaping and irrigating crops4 Source: BWS Water Resources data, 2016.

Section 7 Historical and Future Water Demands
7-14 October 2016
This page intentionally left blank.
October 2016 8-1
Section 8
Current and Future Water
Supply Sources
This section addresses the existing water supply
sources for the BWS service area, trends and
uncertainties related to these supplies, and potential
future supply sources. Planning for, and sustainable
use of, Oʻahu’s water supplies are important
functions and responsibilities of the BWS. As the
largest user of the island’s water resources, the BWS
recognizes the importance of understanding the
interrelationship between the overall island resources and the other uses and users of water on Oʻahu.The information in Section 8 is used in conjunction with the data in Section 7, Historical and
Future Water Demands, to evaluate the BWS model systems, as presented in Section 10, System
Capacity Evaluation.
8.1 Key FindingsThe key findings of the WMP’s analysis of the BWS water supply sources are listed below. These
findings are identified with a code (an abbreviation for the section name) and number (for
example, SUPP-1). These codes are repeated in Section 12, Findings and Recommendations, to
easily tie the findings in this section to the recommendations for BWS action listed in Section 12.
SUPP-1 Water users on Oʻahu have access to multiple sources of water to meet their
needs. Domestic, industrial, and agricultural users may access a variety of
surface water, groundwater, recycled water, and brackish water supplies
depending on what is available to them.
SUPP-2 The sustainable yield from Oʻahu’s groundwater aquifers adopted by the
Commission on Water Resource Management (CWRM) is 407 mgd1. Of the
estimated sustainable yield of 407 mgd from O‘ahu’s aquifers, less than half was
used in 2010. However, demand is not always co-located with available supply
so supplies can be stressed in areas of high population density and high water
use.
1 State of Hawaiʻi Commission on Water Resource Management. 2008. Hawaiʻi Water Plan: Water Resource Protection Plan. Prepared by Wilson Okamoto Corporation. Available at: http://files.hawaii.gov/dlnr/cwrm/planning/wrpp2008update/FINAL_WRPP_20080828.pdf. June 2008.
provides information that
addresses the following
WMP objectives:
Water Quality, Health, and Safety
System Reliability and Adequacy
Cost and Affordability
Water Conservation
Water Resource Sustainability
Section
8
Section 8 Current and Future Water Supply Sources
8-2 October 2016
SUPP-3 The BWS customers form the largest user base on the island making the BWS is
the largest user of water. As of 2010, the BWS’s supply was comprised of
groundwater (93 percent), recycled water (5 percent), and brackish nonpotable
water (2 percent).
SUPP-4 The BWS has sufficient supply during normal and drought conditions to meet
the high range demands in 2040 for average day conditions.
SUPP-5 There are several issues that could potentially affect Oʻahu’s water supply
reliability, such as water quality concerns and climate change. The BWS is
actively addressing these concerns by continuously monitoring its system,
maintaining operation flexibility, investing in alternative supply sources, and
researching the implications of climate change adaptation (see Section 4, Water
Supply Sustainability, for more information).
SUPP-6 Well casings are aging, some approaching 100 years old, which could cause
water quality issues and reduced yield. Wells should have maintenance
completed every 25 years as pumps are replaced. Casings are expected to last at
least 100 years before needing replacement.
SUPP-7 The structural condition of source tunnels and shafts and sanitary seals need to
be periodically evaluated. Sanitary surveys are conducted periodically. Tunnel
condition should be reevaluated every 20 years (currently due), and tunnel and
shaft rehabilitation projects as identified should be implemented.
SUPP-8 Potable water sources are entirely drawn from groundwater. Climate change is
forecast to make dry areas drier, cause more frequent and severe droughts, and
increase chloride levels in ‘Ewa, Kunia, and Waiʻanae sources. Reliability could
be improved through diversification of sources. Invest in diversified
(nonpotable groundwater) sources working toward the FWI goal of doubling
such supply by 2040. Projects include increased reuse and Kalaeloa and Kapolei
desalination plants.
8.2 O‘ahu’s Water Resources In order to support the balance between the demands of its customers and the needs of the
island’s other water users in a sustainable way, the BWS adheres to the following planning
principles when operating its system and planning for future supply:
Operate groundwater sources within sustainable yields;
Move water from where it is to where it is needed, take only what is needed, without
causing harm, and do not waste it;
Develop new groundwater sources for growth and reliability;
Protect and maintain the quality of drinking water groundwater resources;
Plan for sufficient water for agricultural uses;
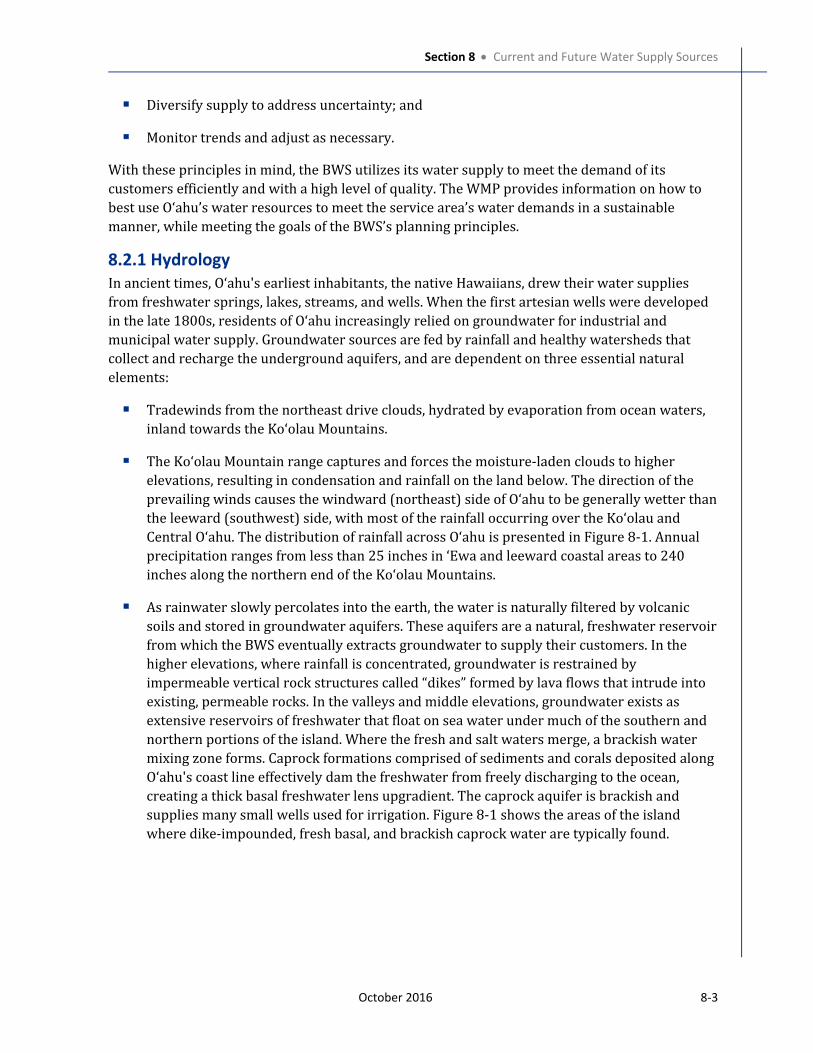
Section 8 Current and Future Water Supply Sources
October 2016 8-3
Diversify supply to address uncertainty; and
Monitor trends and adjust as necessary.
With these principles in mind, the BWS utilizes its water supply to meet the demand of its
customers efficiently and with a high level of quality. The WMP provides information on how to
best use Oʻahu’s water resources to meet the service area’s water demands in a sustainable
manner, while meeting the goals of the BWS’s planning principles.
8.2.1 Hydrology
In ancient times, Oʻahu's earliest inhabitants, the native Hawaiians, drew their water supplies
from freshwater springs, lakes, streams, and wells. When the first artesian wells were developed
in the late 1800s, residents of O‘ahu increasingly relied on groundwater for industrial and
municipal water supply. Groundwater sources are fed by rainfall and healthy watersheds that
collect and recharge the underground aquifers, and are dependent on three essential natural
elements:
Tradewinds from the northeast drive clouds, hydrated by evaporation from ocean waters,
inland towards the Koʻolau Mountains.
The Koʻolau Mountain range captures and forces the moisture-laden clouds to higher
elevations, resulting in condensation and rainfall on the land below. The direction of the
prevailing winds causes the windward (northeast) side of Oʻahu to be generally wetter than
the leeward (southwest) side, with most of the rainfall occurring over the Koʻolau and
Central Oʻahu. The distribution of rainfall across Oʻahu is presented in Figure 8-1. Annual
precipitation ranges from less than 25 inches in ʻEwa and leeward coastal areas to 240
inches along the northern end of the Koʻolau Mountains.
As rainwater slowly percolates into the earth, the water is naturally filtered by volcanic
soils and stored in groundwater aquifers. These aquifers are a natural, freshwater reservoir
from which the BWS eventually extracts groundwater to supply their customers. In the
higher elevations, where rainfall is concentrated, groundwater is restrained by
impermeable vertical rock structures called “dikes” formed by lava flows that intrude into
existing, permeable rocks. In the valleys and middle elevations, groundwater exists as
extensive reservoirs of freshwater that float on sea water under much of the southern and
northern portions of the island. Where the fresh and salt waters merge, a brackish water
mixing zone forms. Caprock formations comprised of sediments and corals deposited along Oʻahu's coast line effectively dam the freshwater from freely discharging to the ocean,
creating a thick basal freshwater lens upgradient. The caprock aquifer is brackish and
supplies many small wells used for irrigation. Figure 8-1 shows the areas of the island
where dike-impounded, fresh basal, and brackish caprock water are typically found.
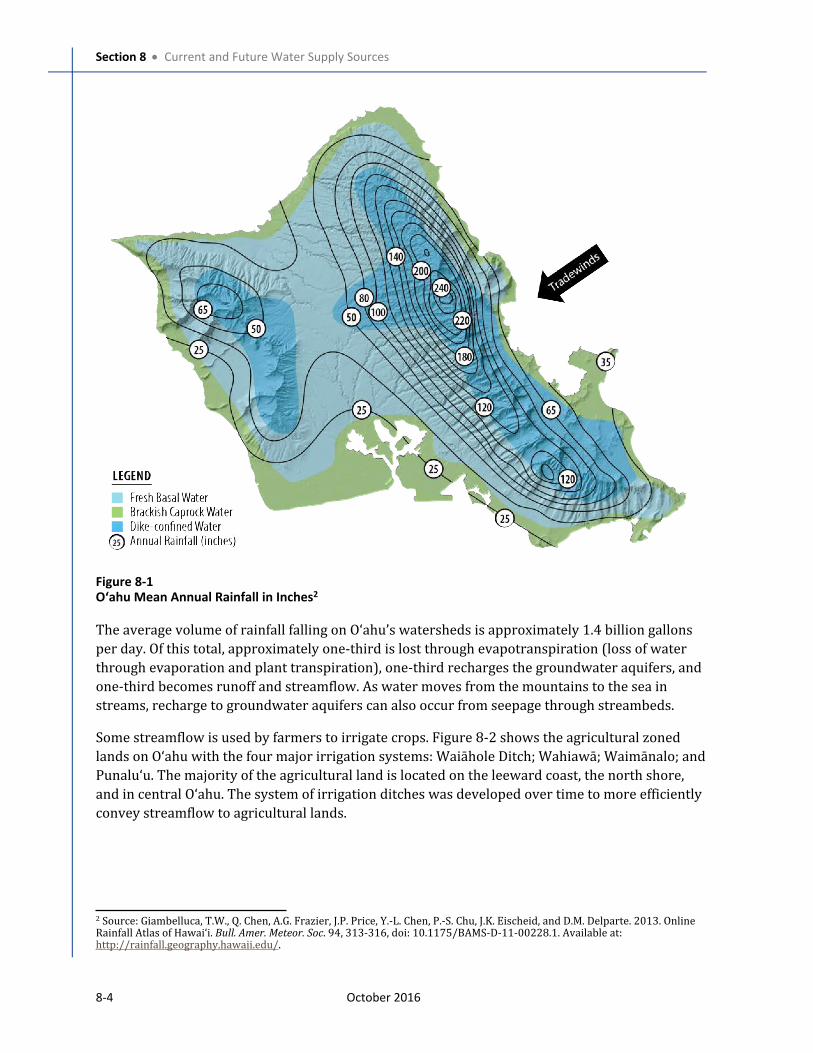
Section 8 Current and Future Water Supply Sources
8-4 October 2016
Figure 8-1
Oʻahu Mean Annual Rainfall in Inches2
The average volume of rainfall falling on Oʻahu’s watersheds is approximately 1.4 billion gallons
per day. Of this total, approximately one-third is lost through evapotranspiration (loss of water
through evaporation and plant transpiration), one-third recharges the groundwater aquifers, and
one-third becomes runoff and streamflow. As water moves from the mountains to the sea in
streams, recharge to groundwater aquifers can also occur from seepage through streambeds.
Some streamflow is used by farmers to irrigate crops. Figure 8-2 shows the agricultural zoned
lands on Oʻahu with the four major irrigation systems: Waiāhole Ditch; Wahiawā; Waimānalo; and Punaluʻu. The majority of the agricultural land is located on the leeward coast, the north shore,
and in central Oʻahu. The system of irrigation ditches was developed over time to more efficiently
convey streamflow to agricultural lands.
2 Source: Giambelluca, T.W., Q. Chen, A.G. Frazier, J.P. Price, Y.-L. Chen, P.-S. Chu, J.K. Eischeid, and D.M. Delparte. 2013. Online Rainfall Atlas of Hawai‘i. Bull. Amer. Meteor. Soc. 94, 313-316, doi: 10.1175/BAMS-D-11-00228.1. Available at: http://rainfall.geography.hawaii.edu/.
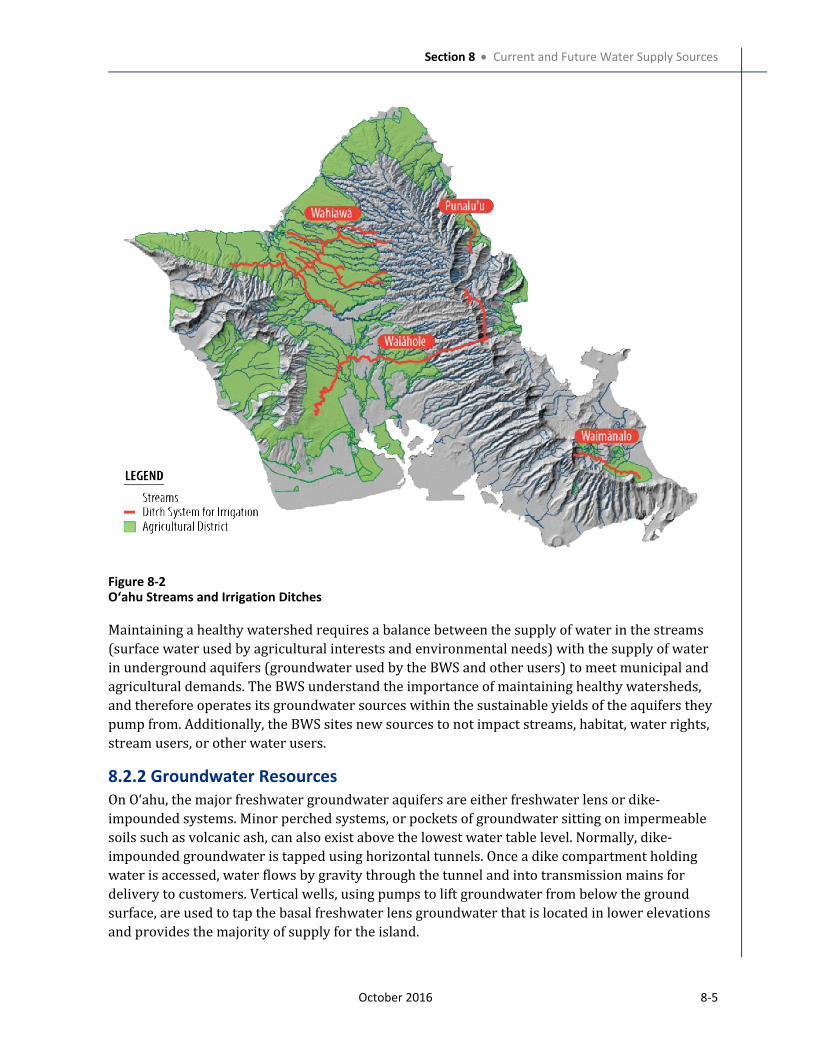
Section 8 Current and Future Water Supply Sources
October 2016 8-5
Figure 8-2
Oʻahu Streams and Irrigation Ditches
Maintaining a healthy watershed requires a balance between the supply of water in the streams
(surface water used by agricultural interests and environmental needs) with the supply of water
in underground aquifers (groundwater used by the BWS and other users) to meet municipal and
agricultural demands. The BWS understand the importance of maintaining healthy watersheds,
and therefore operates its groundwater sources within the sustainable yields of the aquifers they
pump from. Additionally, the BWS sites new sources to not impact streams, habitat, water rights,
stream users, or other water users.
8.2.2 Groundwater Resources
On Oʻahu, the major freshwater groundwater aquifers are either freshwater lens or dike-
impounded systems. Minor perched systems, or pockets of groundwater sitting on impermeable
soils such as volcanic ash, can also exist above the lowest water table level. Normally, dike-
impounded groundwater is tapped using horizontal tunnels. Once a dike compartment holding
water is accessed, water flows by gravity through the tunnel and into transmission mains for
delivery to customers. Vertical wells, using pumps to lift groundwater from below the ground
surface, are used to tap the basal freshwater lens groundwater that is located in lower elevations
and provides the majority of supply for the island.
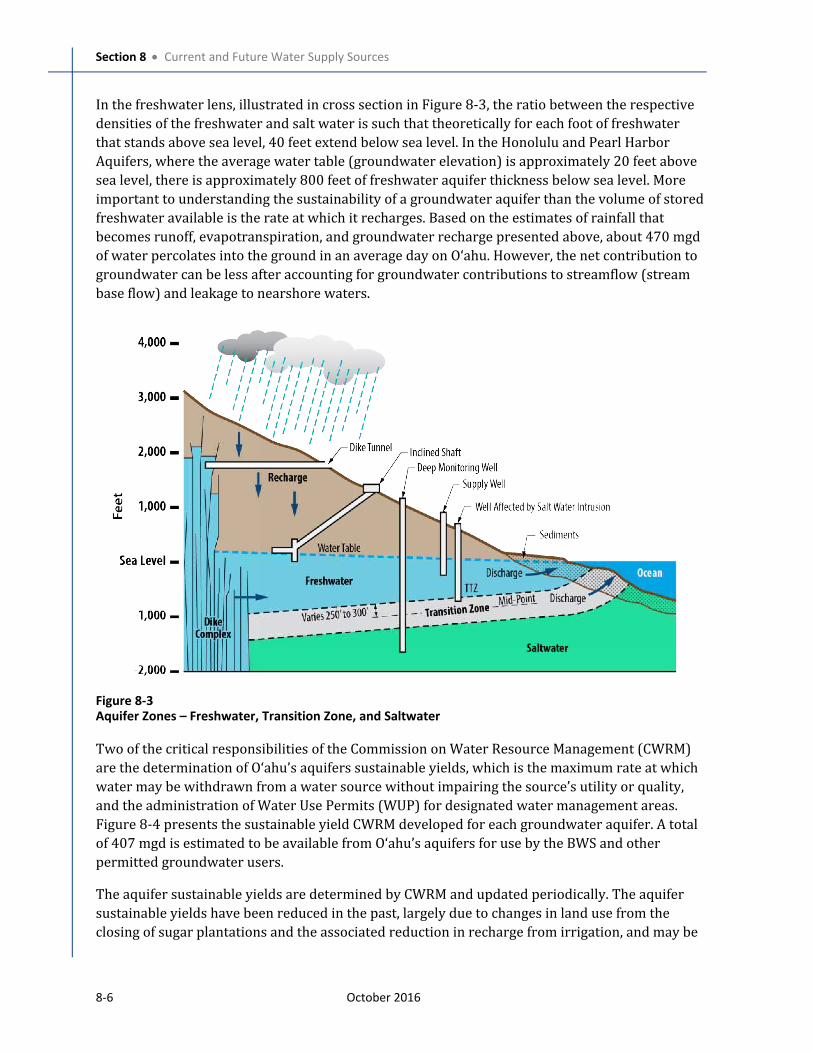
Section 8 Current and Future Water Supply Sources
8-6 October 2016
In the freshwater lens, illustrated in cross section in Figure 8-3, the ratio between the respective
densities of the freshwater and salt water is such that theoretically for each foot of freshwater
that stands above sea level, 40 feet extend below sea level. In the Honolulu and Pearl Harbor
Aquifers, where the average water table (groundwater elevation) is approximately 20 feet above
sea level, there is approximately 800 feet of freshwater aquifer thickness below sea level. More
important to understanding the sustainability of a groundwater aquifer than the volume of stored
freshwater available is the rate at which it recharges. Based on the estimates of rainfall that
becomes runoff, evapotranspiration, and groundwater recharge presented above, about 470 mgd
of water percolates into the ground in an average day on Oʻahu. However, the net contribution to
groundwater can be less after accounting for groundwater contributions to streamflow (stream
base flow) and leakage to nearshore waters.
Figure 8-3
Aquifer Zones – Freshwater, Transition Zone, and Saltwater
Two of the critical responsibilities of the Commission on Water Resource Management (CWRM)
are the determination of Oʻahu’s aquifers sustainable yields, which is the maximum rate at which
water may be withdrawn from a water source without impairing the source’s utility or quality,
and the administration of Water Use Permits (WUP) for designated water management areas.
Figure 8-4 presents the sustainable yield CWRM developed for each groundwater aquifer. A total
of 407 mgd is estimated to be available from Oʻahu’s aquifers for use by the BWS and other
permitted groundwater users.
The aquifer sustainable yields are determined by CWRM and updated periodically. The aquifer
sustainable yields have been reduced in the past, largely due to changes in land use from the
closing of sugar plantations and the associated reduction in recharge from irrigation, and may be
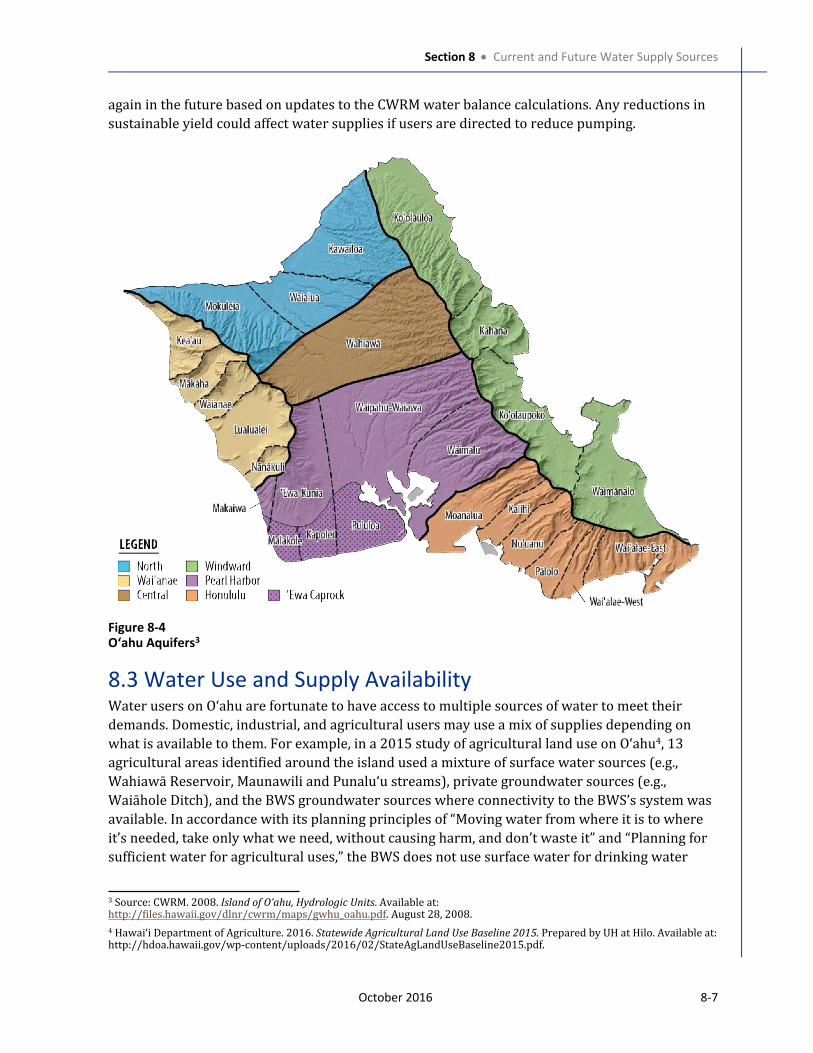
Section 8 Current and Future Water Supply Sources
October 2016 8-7
again in the future based on updates to the CWRM water balance calculations. Any reductions in
sustainable yield could affect water supplies if users are directed to reduce pumping.
Figure 8-4
Oʻahu Aquifers3
8.3 Water Use and Supply AvailabilityWater users on Oʻahu are fortunate to have access to multiple sources of water to meet their
demands. Domestic, industrial, and agricultural users may use a mix of supplies depending on
what is available to them. For example, in a 2015 study of agricultural land use on Oʻahu4, 13
agricultural areas identified around the island used a mixture of surface water sources (e.g., Wahiawā Reservoir, Maunawili and Punaluʻu streams), private groundwater sources (e.g., Waiāhole Ditch), and the BWS groundwater sources where connectivity to the BWS’s system was
available. In accordance with its planning principles of “Moving water from where it is to where
it’s needed, take only what we need, without causing harm, and don’t waste it” and “Planning for
sufficient water for agricultural uses,” the BWS does not use surface water for drinking water
3 Source: CWRM. 2008. Island of O‘ahu, Hydrologic Units. Available at: http://files.hawaii.gov/dlnr/cwrm/maps/gwhu_oahu.pdf. August 28, 2008.
4 Hawaiʻi Department of Agriculture. 2016. Statewide Agricultural Land Use Baseline 2015. Prepared by UH at Hilo. Available at: http://hdoa.hawaii.gov/wp-content/uploads/2016/02/StateAgLandUseBaseline2015.pdf.
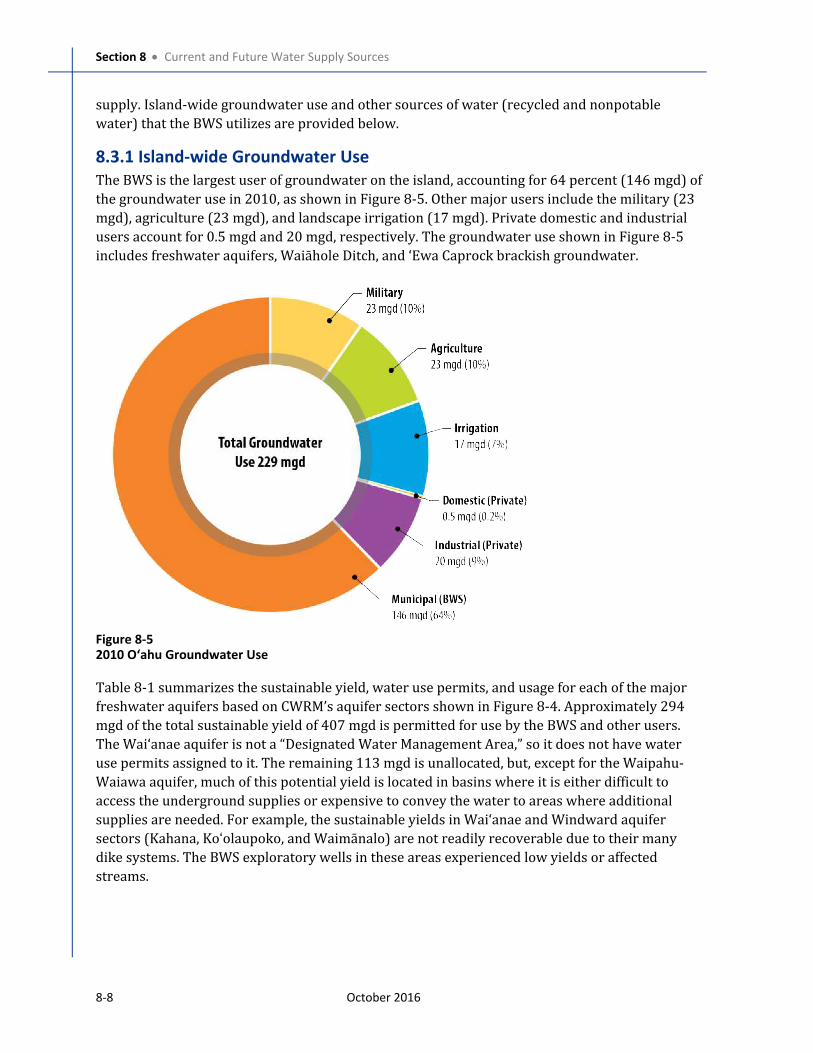
Section 8 Current and Future Water Supply Sources
8-8 October 2016
supply. Island-wide groundwater use and other sources of water (recycled and nonpotable
water) that the BWS utilizes are provided below.
8.3.1 Island-wide Groundwater Use
The BWS is the largest user of groundwater on the island, accounting for 64 percent (146 mgd) of
the groundwater use in 2010, as shown in Figure 8-5. Other major users include the military (23
mgd), agriculture (23 mgd), and landscape irrigation (17 mgd). Private domestic and industrial
users account for 0.5 mgd and 20 mgd, respectively. The groundwater use shown in Figure 8-5
includes freshwater aquifers, Waiāhole Ditch, and ʻEwa Caprock brackish groundwater.
Figure 8-5
2010 Oʻahu Groundwater Use
Table 8-1 summarizes the sustainable yield, water use permits, and usage for each of the major
freshwater aquifers based on CWRM’s aquifer sectors shown in Figure 8-4. Approximately 294
mgd of the total sustainable yield of 407 mgd is permitted for use by the BWS and other users.
The Waiʻanae aquifer is not a “Designated Water Management Area,” so it does not have water
use permits assigned to it. The remaining 113 mgd is unallocated, but, except for the Waipahu-
Waiawa aquifer, much of this potential yield is located in basins where it is either difficult to
access the underground supplies or expensive to convey the water to areas where additional
supplies are needed. For example, the sustainable yields in Waiʻanae and Windward aquifer
sectors (Kahana, Ko‘olaupoko, and Waimānalo) are not readily recoverable due to their many
dike systems. The BWS exploratory wells in these areas experienced low yields or affected
streams.
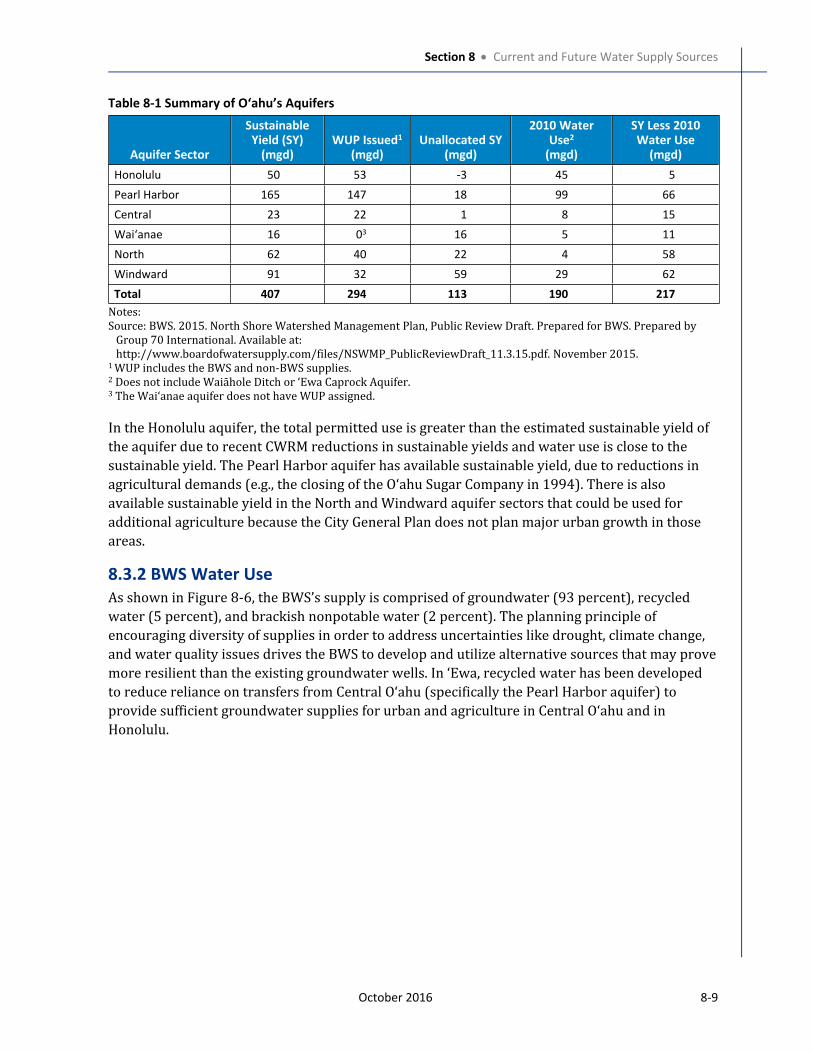
Section 8 Current and Future Water Supply Sources
October 2016 8-9
Table 8-1 Summary of Oʻahu’s Aquifers
Aquifer Sector
Sustainable
Yield (SY)
(mgd)
WUP Issued1
(mgd)
Unallocated SY
(mgd)
2010 Water
Use2
(mgd)
SY Less 2010
Water Use
(mgd)
Honolulu 50 53 -3 45 5
Pearl Harbor 165 147 18 99 66
Central 23 22 1 8 15
Waiʻanae 16 03 16 5 11
North 62 40 22 4 58
Windward 91 32 59 29 62
Total 407 294 113 190 217
Notes:
Source: BWS. 2015. North Shore Watershed Management Plan, Public Review Draft. Prepared for BWS. Prepared by
Group 70 International. Available at:
http://www.boardofwatersupply.com/files/NSWMP_PublicReviewDraft_11.3.15.pdf. November 2015.1 WUP includes the BWS and non-BWS supplies.2 Does not include Waiāhole Ditch or ʻEwa Caprock Aquifer.3 The Waiʻanae aquifer does not have WUP assigned.
In the Honolulu aquifer, the total permitted use is greater than the estimated sustainable yield of
the aquifer due to recent CWRM reductions in sustainable yields and water use is close to the
sustainable yield. The Pearl Harbor aquifer has available sustainable yield, due to reductions in
agricultural demands (e.g., the closing of the Oʻahu Sugar Company in 1994). There is also
available sustainable yield in the North and Windward aquifer sectors that could be used for
additional agriculture because the City General Plan does not plan major urban growth in those
areas.
8.3.2 BWS Water Use
As shown in Figure 8-6, the BWS’s supply is comprised of groundwater (93 percent), recycled
water (5 percent), and brackish nonpotable water (2 percent). The planning principle of
encouraging diversity of supplies in order to address uncertainties like drought, climate change,
and water quality issues drives the BWS to develop and utilize alternative sources that may prove
more resilient than the existing groundwater wells. In ʻEwa, recycled water has been developed
to reduce reliance on transfers from Central Oʻahu (specifically the Pearl Harbor aquifer) to
provide sufficient groundwater supplies for urban and agriculture in Central Oʻahu and in
Honolulu.
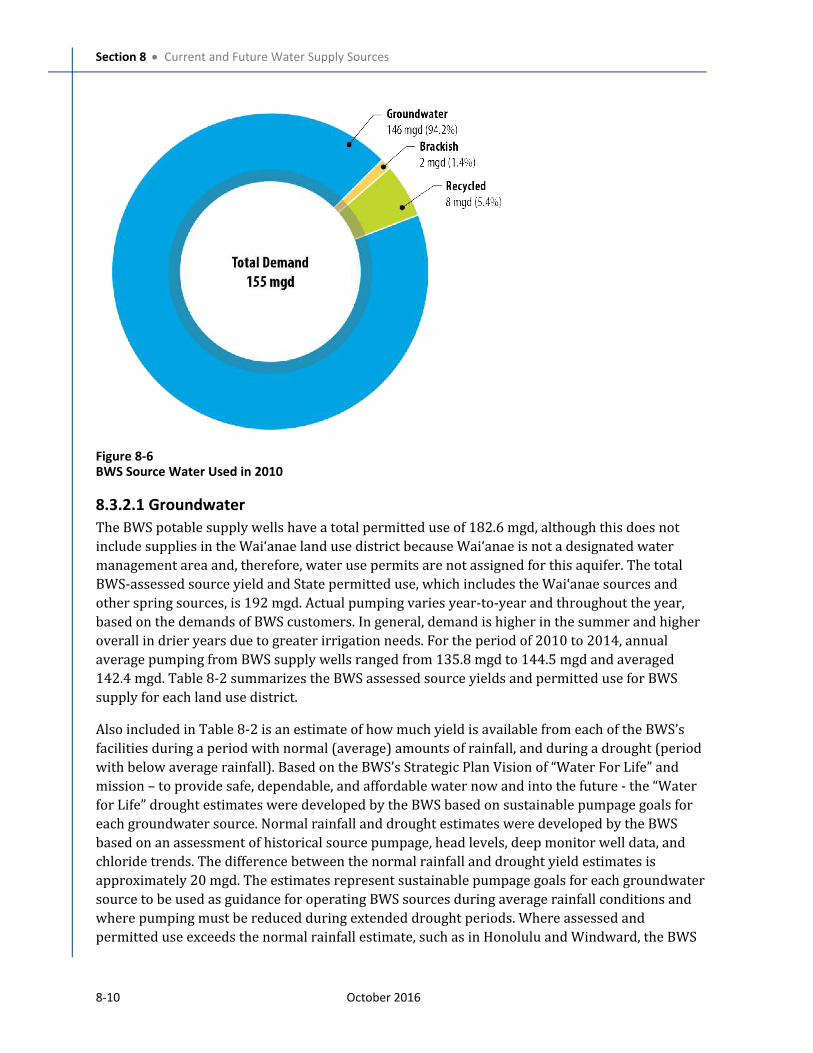
Section 8 Current and Future Water Supply Sources
8-10 October 2016
Figure 8-6
BWS Source Water Used in 2010
8.3.2.1 Groundwater
The BWS potable supply wells have a total permitted use of 182.6 mgd, although this does not
include supplies in the Waiʻanae land use district because Waiʻanae is not a designated water
management area and, therefore, water use permits are not assigned for this aquifer. The total
BWS-assessed source yield and State permitted use, which includes the Waiʻanae sources and
other spring sources, is 192 mgd. Actual pumping varies year-to-year and throughout the year,
based on the demands of BWS customers. In general, demand is higher in the summer and higher
overall in drier years due to greater irrigation needs. For the period of 2010 to 2014, annual
average pumping from BWS supply wells ranged from 135.8 mgd to 144.5 mgd and averaged
142.4 mgd. Table 8-2 summarizes the BWS assessed source yields and permitted use for BWS
supply for each land use district.
Also included in Table 8-2 is an estimate of how much yield is available from each of the BWS’s
facilities during a period with normal (average) amounts of rainfall, and during a drought (period
with below average rainfall). Based on the BWS’s Strategic Plan Vision of “Water For Life” and
mission – to provide safe, dependable, and affordable water now and into the future - the “Water
for Life” drought estimates were developed by the BWS based on sustainable pumpage goals for
each groundwater source. Normal rainfall and drought estimates were developed by the BWS
based on an assessment of historical source pumpage, head levels, deep monitor well data, and
chloride trends. The difference between the normal rainfall and drought yield estimates is
approximately 20 mgd. The estimates represent sustainable pumpage goals for each groundwater
source to be used as guidance for operating BWS sources during average rainfall conditions and
where pumping must be reduced during extended drought periods. Where assessed and
permitted use exceeds the normal rainfall estimate, such as in Honolulu and Windward, the BWS
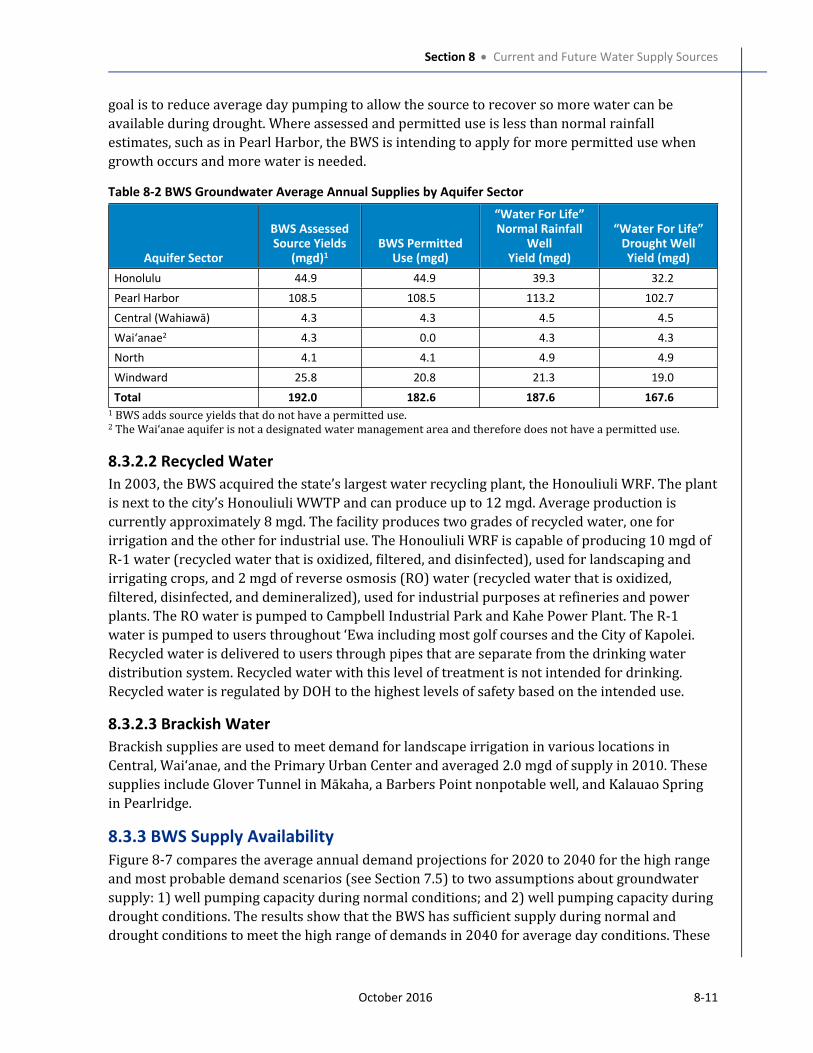
Section 8 Current and Future Water Supply Sources
October 2016 8-11
goal is to reduce average day pumping to allow the source to recover so more water can be
available during drought. Where assessed and permitted use is less than normal rainfall
estimates, such as in Pearl Harbor, the BWS is intending to apply for more permitted use when
growth occurs and more water is needed.
Table 8-2 BWS Groundwater Average Annual Supplies by Aquifer Sector
Aquifer Sector
BWS Assessed
Source Yields
(mgd)1
BWS Permitted
Use (mgd)
“Water For Life”
Normal Rainfall
Well
Yield (mgd)
“Water For Life”
Drought Well
Yield (mgd)
Honolulu 44.9 44.9 39.3 32.2
Pearl Harbor 108.5 108.5 113.2 102.7
Central (Wahiawā) 4.3 4.3 4.5 4.5
Waiʻanae2 4.3 0.0 4.3 4.3
North 4.1 4.1 4.9 4.9
Windward 25.8 20.8 21.3 19.0
Total 192.0 182.6 187.6 167.6
1 BWS adds source yields that do not have a permitted use.2 The Waiʻanae aquifer is not a designated water management area and therefore does not have a permitted use.
8.3.2.2 Recycled Water
In 2003, the BWS acquired the state’s largest water recycling plant, the Honouliuli WRF. The plant
is next to the city’s Honouliuli WWTP and can produce up to 12 mgd. Average production is
currently approximately 8 mgd. The facility produces two grades of recycled water, one for
irrigation and the other for industrial use. The Honouliuli WRF is capable of producing 10 mgd of
R-1 water (recycled water that is oxidized, filtered, and disinfected), used for landscaping and
irrigating crops, and 2 mgd of reverse osmosis (RO) water (recycled water that is oxidized,
filtered, disinfected, and demineralized), used for industrial purposes at refineries and power
plants. The RO water is pumped to Campbell Industrial Park and Kahe Power Plant. The R-1
water is pumped to users throughout ʻEwa including most golf courses and the City of Kapolei.
Recycled water is delivered to users through pipes that are separate from the drinking water
distribution system. Recycled water with this level of treatment is not intended for drinking.
Recycled water is regulated by DOH to the highest levels of safety based on the intended use.
8.3.2.3 Brackish Water
Brackish supplies are used to meet demand for landscape irrigation in various locations in
Central, Waiʻanae, and the Primary Urban Center and averaged 2.0 mgd of supply in 2010. These
supplies include Glover Tunnel in Mākaha, a Barbers Point nonpotable well, and Kalauao Spring
in Pearlridge.
8.3.3 BWS Supply Availability
Figure 8-7 compares the average annual demand projections for 2020 to 2040 for the high range
and most probable demand scenarios (see Section 7.5) to two assumptions about groundwater
supply: 1) well pumping capacity during normal conditions; and 2) well pumping capacity during
drought conditions. The results show that the BWS has sufficient supply during normal and
drought conditions to meet the high range of demands in 2040 for average day conditions. These
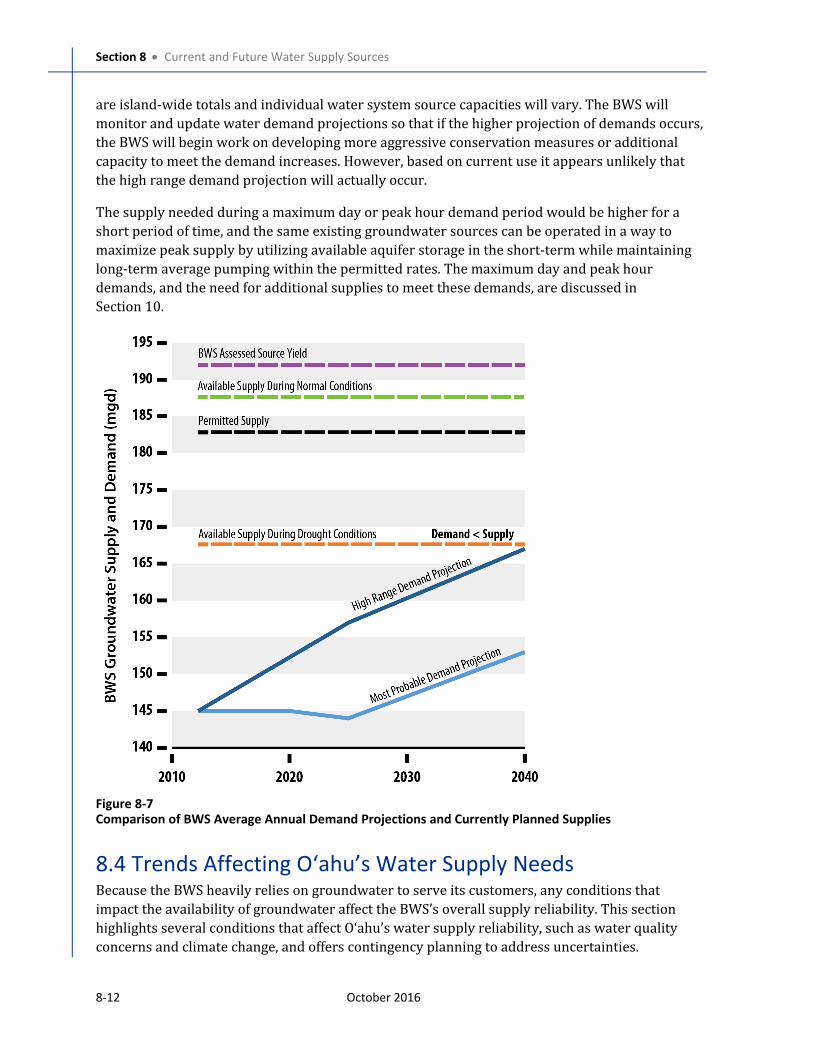
Section 8 Current and Future Water Supply Sources
8-12 October 2016
are island-wide totals and individual water system source capacities will vary. The BWS will
monitor and update water demand projections so that if the higher projection of demands occurs,
the BWS will begin work on developing more aggressive conservation measures or additional
capacity to meet the demand increases. However, based on current use it appears unlikely that
the high range demand projection will actually occur.
The supply needed during a maximum day or peak hour demand period would be higher for a
short period of time, and the same existing groundwater sources can be operated in a way to
maximize peak supply by utilizing available aquifer storage in the short-term while maintaining
long-term average pumping within the permitted rates. The maximum day and peak hour
demands, and the need for additional supplies to meet these demands, are discussed in
Section 10.
Figure 8-7
Comparison of BWS Average Annual Demand Projections and Currently Planned Supplies
8.4 Trends Affecting Oʻahu’s Water Supply NeedsBecause the BWS heavily relies on groundwater to serve its customers, any conditions that
impact the availability of groundwater affect the BWS’s overall supply reliability. This section
highlights several conditions that affect Oʻahu’s water supply reliability, such as water quality
concerns and climate change, and offers contingency planning to address uncertainties.
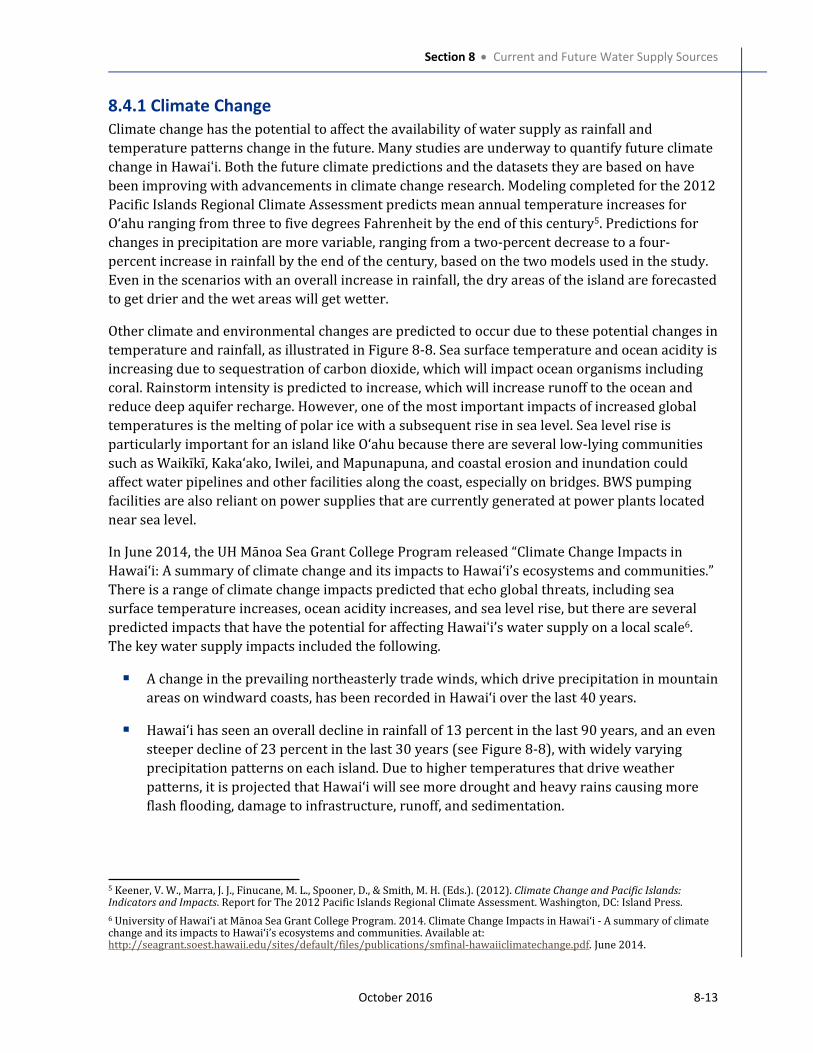
Section 8 Current and Future Water Supply Sources
October 2016 8-13
8.4.1 Climate Change
Climate change has the potential to affect the availability of water supply as rainfall and
temperature patterns change in the future. Many studies are underway to quantify future climate
change in Hawai‘i. Both the future climate predictions and the datasets they are based on have
been improving with advancements in climate change research. Modeling completed for the 2012
Pacific Islands Regional Climate Assessment predicts mean annual temperature increases for Oʻahu ranging from three to five degrees Fahrenheit by the end of this century5. Predictions for
changes in precipitation are more variable, ranging from a two-percent decrease to a four-
percent increase in rainfall by the end of the century, based on the two models used in the study.
Even in the scenarios with an overall increase in rainfall, the dry areas of the island are forecasted
to get drier and the wet areas will get wetter.
Other climate and environmental changes are predicted to occur due to these potential changes in
temperature and rainfall, as illustrated in Figure 8-8. Sea surface temperature and ocean acidity is
increasing due to sequestration of carbon dioxide, which will impact ocean organisms including
coral. Rainstorm intensity is predicted to increase, which will increase runoff to the ocean and
reduce deep aquifer recharge. However, one of the most important impacts of increased global
temperatures is the melting of polar ice with a subsequent rise in sea level. Sea level rise is
particularly important for an island like Oʻahu because there are several low-lying communities
such as Waikīkī, Kakaʻako, Iwilei, and Mapunapuna, and coastal erosion and inundation could
affect water pipelines and other facilities along the coast, especially on bridges. BWS pumping
facilities are also reliant on power supplies that are currently generated at power plants located
near sea level.
In June 2014, the UH Mānoa Sea Grant College Program released “Climate Change Impacts in Hawaiʻi: A summary of climate change and its impacts to Hawaiʻi’s ecosystems and communities.”
There is a range of climate change impacts predicted that echo global threats, including sea
surface temperature increases, ocean acidity increases, and sea level rise, but there are several
predicted impacts that have the potential for affecting Hawai‘i’s water supply on a local scale6.
The key water supply impacts included the following.
A change in the prevailing northeasterly trade winds, which drive precipitation in mountain
areas on windward coasts, has been recorded in Hawaiʻi over the last 40 years.
Hawaiʻi has seen an overall decline in rainfall of 13 percent in the last 90 years, and an even
steeper decline of 23 percent in the last 30 years (see Figure 8-8), with widely varying
precipitation patterns on each island. Due to higher temperatures that drive weather
patterns, it is projected that Hawaiʻi will see more drought and heavy rains causing more
flash flooding, damage to infrastructure, runoff, and sedimentation.
5 Keener, V. W., Marra, J. J., Finucane, M. L., Spooner, D., & Smith, M. H. (Eds.). (2012). Climate Change and Pacific Islands: Indicators and Impacts. Report for The 2012 Pacific Islands Regional Climate Assessment. Washington, DC: Island Press.
6 University of Hawai‘i at Mānoa Sea Grant College Program. 2014. Climate Change Impacts in Hawai‘i - A summary of climate change and its impacts to Hawai‘i’s ecosystems and communities. Available at: http://seagrant.soest.hawaii.edu/sites/default/files/publications/smfinal-hawaiiclimatechange.pdf. June 2014.
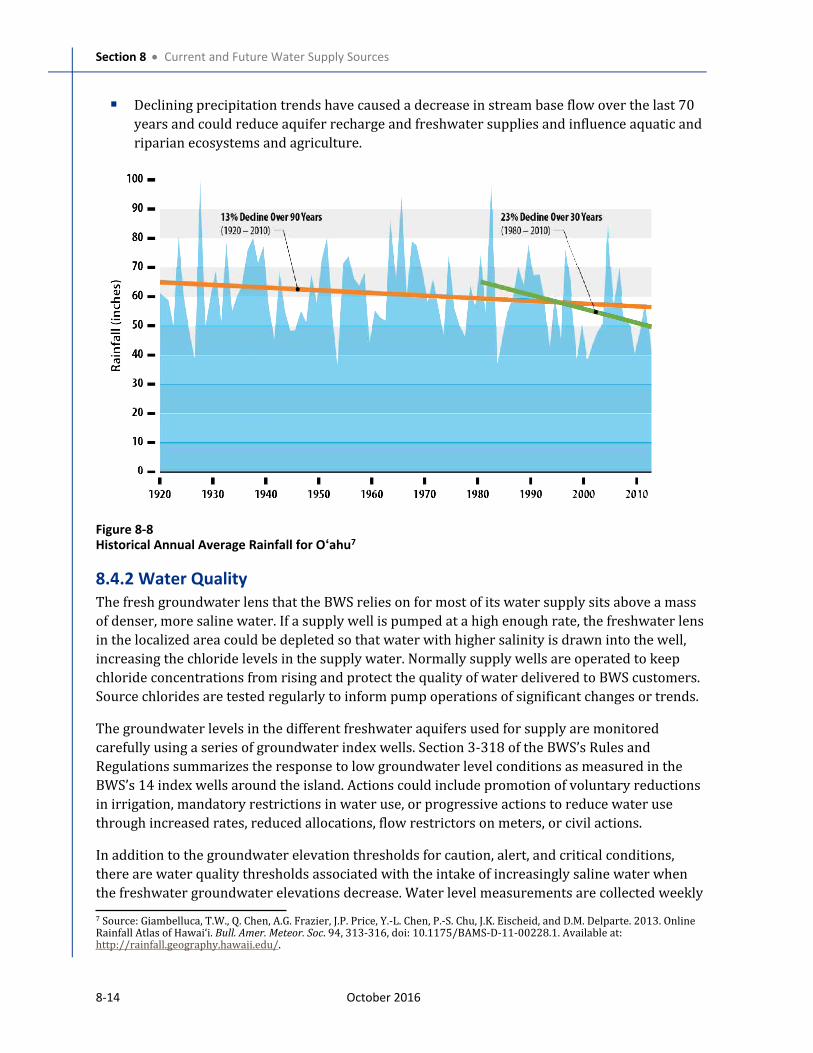
Section 8 Current and Future Water Supply Sources
8-14 October 2016
Declining precipitation trends have caused a decrease in stream base flow over the last 70
years and could reduce aquifer recharge and freshwater supplies and influence aquatic and
riparian ecosystems and agriculture.
Figure 8-8
Historical Annual Average Rainfall for O‘ahu7
8.4.2 Water Quality
The fresh groundwater lens that the BWS relies on for most of its water supply sits above a mass
of denser, more saline water. If a supply well is pumped at a high enough rate, the freshwater lens
in the localized area could be depleted so that water with higher salinity is drawn into the well,
increasing the chloride levels in the supply water. Normally supply wells are operated to keep
chloride concentrations from rising and protect the quality of water delivered to BWS customers.
Source chlorides are tested regularly to inform pump operations of significant changes or trends.
The groundwater levels in the different freshwater aquifers used for supply are monitored
carefully using a series of groundwater index wells. Section 3-318 of the BWS’s Rules and
Regulations summarizes the response to low groundwater level conditions as measured in the
BWS’s 14 index wells around the island. Actions could include promotion of voluntary reductions
in irrigation, mandatory restrictions in water use, or progressive actions to reduce water use
through increased rates, reduced allocations, flow restrictors on meters, or civil actions.
In addition to the groundwater elevation thresholds for caution, alert, and critical conditions,
there are water quality thresholds associated with the intake of increasingly saline water when
the freshwater groundwater elevations decrease. Water level measurements are collected weekly
7 Source: Giambelluca, T.W., Q. Chen, A.G. Frazier, J.P. Price, Y.-L. Chen, P.-S. Chu, J.K. Eischeid, and D.M. Delparte. 2013. Online Rainfall Atlas of Hawai‘i. Bull. Amer. Meteor. Soc. 94, 313-316, doi: 10.1175/BAMS-D-11-00228.1. Available at: http://rainfall.geography.hawaii.edu/.
Section 8 Current and Future Water Supply Sources
October 2016 8-15
at the index wells and if water levels fall into an alert or critical range, the BWS may respond by
reducing pumping rates at supply sources nearby to protect its viability. It is important during a
response to declining water levels at these index wells to carefully monitor water levels and
water quality at supply wells nearby.
Potential over-pumping is also controlled on a longer-term basis through the CWRM-defined
sustainable yield for the groundwater aquifers. In general, the current production from the
groundwater aquifers is significantly below the CWRM-defined yield. In some aquifers, recent
short-term production is greater than the sustainable yield, although chloride levels remain low
suggesting no long-term impacts to the aquifer as long as production is reduced. In evaluating
production versus yields, the permitted use is usually compared to a 12-month moving average of
production. In the case where there is a long-term overage, production may have to be reduced or
shifted to other aquifers that are not over the defined yield. Because the island’s distribution
system is designed to be flexible, where water can be moved from different parts of the island to
areas of need, production shifts are usually accomplished without interruptions in supply
delivery.
8.4.2.1 Agricultural and Industrial Activities
Some BWS groundwater supply may be affected by the activities of entities outside of the BWS’s
control, including government agencies and private sector customers. Monitoring the impact of
these external forces is critical to the protection of the BWS supplies.
Legacy Agricultural Chemicals
Due to past agricultural application of pesticides, trace (very low) concentrations of ethylene
dibromide, 1,2-dibromo-3-chloropropane, and 1,2,3-trichloropropane (TCP) have been observed
in groundwater beneath areas in South Oʻahu where these chemicals were historically used. The
BWS includes these chemicals in their regular monitoring effort and uses GAC treatment if
needed, to ensure that water is safe to drink and meets all Federal and State drinking water
requirements.
U.S. Navy Red Hill Fuel Storage
In January 2014, the U.S. Navy reported a 27,000-gallon leak of jet fuel from a storage tank at its
Red Hill Bulk Fuel Storage Facility in Hālawa. The Navy owns 20 fuel tanks, built during World
War II, in the Red Hill area each able to contain up to 12.5 MG of fuel. These tanks are located 100
feet above the underlying groundwater aquifer. This irreplaceable aquifer contains two water
sources that the BWS uses to provide 25 percent of the water to residents from Moanalua to
Hawai‘i Kai. The BWS is conducting regular testing of its wells in the area. To date, no petroleum
contaminants have been detected and the water is safe to drink. The BWS will continue to
encourage the Navy to retrofit the fuel tanks to double walls with state-of-the-art alarms and also
remediate the leaked fuel.
8.4.3 Future Changes in Agricultural Demand
The U.S. Food and Drug Administration’s Food Safety Modernization Act (FSMA) establishes, for
the first time, science-based minimum standards for the safe growing, harvesting, packing, and
holding of fruits and vegetables grown for human consumption. More stringent water quality
standards for water supply used to irrigate food crops may make existing surface water supplies
Section 8 Current and Future Water Supply Sources
8-16 October 2016
unusable for certain irrigation and related agricultural practices. The reduction in the use of
surface supplies would require more reliance on the BWS potable supplies. Because the FSMA
was only recently finalized, the impact on Hawaiʻi’s farmers is still uncertain. The BWS will
monitor the trends, including new meter requests for agricultural customers, and assess whether
new source capacity should be installed when more information is available,
8.5 Addressing Supply Uncertainties As described in Section 8.2, the BWS coordinates with other entities to plan for future water
supply and address future supply uncertainty. This coordination includes supporting research in
understanding and mitigating climate change impacts, monitoring the health of groundwater
aquifers, and adjusting operational strategies to ensure they meet customer demands in a
sustainable manner.
8.5.1 Research Efforts
Although the average atmospheric and land surface temperature trends in Hawaiʻi have risen and
are projected to continue rising, the rates will vary spatially depending on land uses, topography,
and trade wind and precipitation patterns.
The BWS is working with entities such as the U.S. Geological Survey (USGS) and UH to track the
changes in climate as technology evolves and more accurate predictions are formed. The impacts
of these changes will be factored into future capital investments and maintenance requirements.
UH is developing climate models to forecast rainfall trends out to 2061, including quantifying the
contribution of cold front-generated rainfall to dry areas of Oʻahu. This research will help
improve the understanding of how rainfall patterns will evolve and directly affect the amount of
surface water and groundwater supply available in Hawai‘i.
The BWS, CWRM, UH, and USGS are advancing research and modeling tools to increase
understanding of recharge, groundwater aquifers, and streams. The BWS and USGS are working
collaboratively to fund, construct, and utilize three-dimensional, solute transport groundwater
modeling calibrated with new deep monitor wells in basal aquifers to:
Evaluate individual source yields to prevent up-coning and salt water intrusion during
normal rainfall and drought events;
Optimize existing source pumping to meet water system demands and avoid detrimental
impacts to the aquifer’s utility (quality and quantity);
Ensure adequate aquifer recovery after long drought periods;
Evaluate aquifer sustainable yields as allocations and pumping approach sustainable yield
limits to ensure sources are sustainable; and
Site and size new wells to develop remaining groundwater and minimize impacts to
adjacent and down-gradient sources and surface waters.
8.5.2 Monitoring
Monitoring the health of groundwater sources is critical to ensuring sustainable water supply. In
addition to a network of shallow monitoring wells, the BWS also utilizes a number of deep
Section 8 Current and Future Water Supply Sources
October 2016 8-17
monitoring wells that provide information on the aquifer’s salinity profile ranging from the
shallow freshwater lens, through a transition zone, and into the deeper saline aquifer. The deep
monitoring well data is shared with CWRM.
8.5.3 Operational Flexibility
The BWS balances the operation of its systems to be able to provide high quality and reliable
service to its customers. As discussed in Section 8.3, supply sources can be affected by a number
of issues and future planning should account for potential loss of supply. The BWS water supply
system is designed to provide flexibility in how demands are met, whether by utilizing multiple
sources to serve a specific demand area or transferring water from a neighboring area during
high demand periods. The BWS will continue to enhance their supply system operational
flexibility in order to provide a reliable service to its customers.
8.5.4 Supply Diversification
Potential future supply sources are being considered to both increase supply in high demand
areas and to diversify types of supplies available to meet demands to provide alternative sources
where existing supplies face some degree of uncertainty. These alternative supplies include
additional potable groundwater sources where available, increased recycled water, and
desalination projects that are currently under development, as shown in Table 8-3. The BWS will
balance the need for development of new supplies with the cost of doing so to provide value to
their customers.
Increases in potable and nonpotable demand are offset by water conservation, released
agricultural groundwater from the close of the sugar plantations, seawater desalination, and the
development of brackish and recycled irrigation water systems.
Groundwater will be developed utilizing available sustainable yield. Groundwater supply
evaluations will be conducted to refine available groundwater estimates especially as permitted
use approaches sustainable yields. New sources of supply will be developed in locations that do
not impact streams or other sources.
Recycled water facilities in ‘Ewa and Central Oahu are planned for expansion to continue to offset
additional groundwater development.
BWS has been operating the 12 mgd Honouliuli Water Recycling Facility for over a decade
to supply irrigation and industrial process water for ‘Ewa. The recycled water distribution
system can be supplemented with brackish water.
In the mid-term, seawater and brackish water desalination plants will be constructed to provide
for future demand and offset additional groundwater development and provide a cost
competitive alternative to increasing inter-district transfers.
The Kalaeloa Seawater Desalination Plant is currently planned for construction in the early
2020 timeframe and will bring an additional 1.0 mgd minimum of potable water supply to
the ‘Ewa districts. The plant will be capable of further expansion as needed.
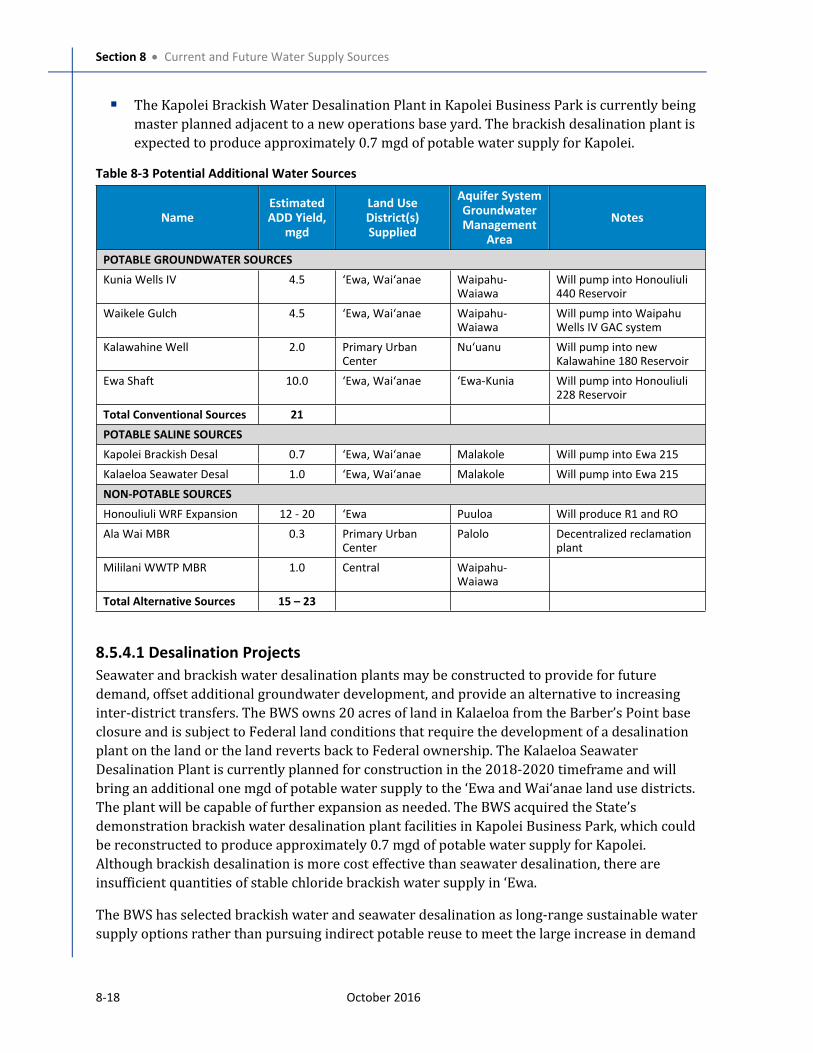
Section 8 Current and Future Water Supply Sources
8-18 October 2016
The Kapolei Brackish Water Desalination Plant in Kapolei Business Park is currently being
master planned adjacent to a new operations base yard. The brackish desalination plant is
expected to produce approximately 0.7 mgd of potable water supply for Kapolei.
Table 8-3 Potential Additional Water Sources
Name
Estimated
ADD Yield,
mgd
Land Use
District(s)
Supplied
Aquifer System
Groundwater
Management
Area
Notes
POTABLE GROUNDWATER SOURCES
Kunia Wells IV 4.5 ʻEwa, Waiʻanae Waipahu-
Waiawa
Will pump into Honouliuli
440 Reservoir
Waikele Gulch 4.5 ʻEwa, Waiʻanae Waipahu-
Waiawa
Will pump into Waipahu
Wells IV GAC system
Kalawahine Well 2.0 Primary Urban
Center
Nu‘uanu Will pump into new
Kalawahine 180 Reservoir
Ewa Shaft 10.0 ʻEwa, Waiʻanae ‘Ewa-Kunia Will pump into Honouliuli
228 Reservoir
Total Conventional Sources 21
POTABLE SALINE SOURCES
Kapolei Brackish Desal 0.7 ʻEwa, Waiʻanae Malakole Will pump into Ewa 215
Kalaeloa Seawater Desal 1.0 ʻEwa, Waiʻanae Malakole Will pump into Ewa 215
NON-POTABLE SOURCES
Honouliuli WRF Expansion 12 - 20 ʻEwa Puuloa Will produce R1 and RO
Ala Wai MBR 0.3 Primary Urban
Center
Palolo Decentralized reclamation
plant
Mililani WWTP MBR 1.0 Central Waipahu-
Waiawa
Total Alternative Sources 15 – 23
8.5.4.1 Desalination Projects
Seawater and brackish water desalination plants may be constructed to provide for future
demand, offset additional groundwater development, and provide an alternative to increasing
inter-district transfers. The BWS owns 20 acres of land in Kalaeloa from the Barber’s Point base
closure and is subject to Federal land conditions that require the development of a desalination
plant on the land or the land reverts back to Federal ownership. The Kalaeloa Seawater
Desalination Plant is currently planned for construction in the 2018-2020 timeframe and will
bring an additional one mgd of potable water supply to the ʻEwa and Waiʻanae land use districts.
The plant will be capable of further expansion as needed. The BWS acquired the State’s
demonstration brackish water desalination plant facilities in Kapolei Business Park, which could
be reconstructed to produce approximately 0.7 mgd of potable water supply for Kapolei.
Although brackish desalination is more cost effective than seawater desalination, there are
insufficient quantities of stable chloride brackish water supply in ʻEwa.The BWS has selected brackish water and seawater desalination as long-range sustainable water
supply options rather than pursuing indirect potable reuse to meet the large increase in demand
Section 8 Current and Future Water Supply Sources
October 2016 8-19
as the ʻEwa land use district approaches full build-out. Although the cost of indirect potable reuse
is likely less than seawater desalination, there is a community acceptance challenge to drinking
indirect potable water that would need to be addressed. Desalinated water can also be an
important drought mitigation strategy. The use of desalinated water during periods of drought
with a corresponding reduction in groundwater pumping would allow groundwater sources to
stabilize and be conserved.
8.5.4.2 Recycled Water Projects
The recycled water facilities in ʻEwa are planned for expansion to continue to offset the need for
additional potable groundwater development. In 2003, the BWS acquired and now operates the
12 mgd Honouliuli WRF supplying irrigation and industrial process water for ʻEwa. As shown in
Figure 8-9, there are a number of relatively new project areas that are planned to be added to this
recycled water system. As ʻEwa develops, there will be additional opportunities to design for
recycled water use. The Honouliuli WRF will need to be expanded as the demand for recycled
water increases in the ʻEwa land use district. The upcoming BWS and Veolia Disk Filter and Ultra
Violet project will increase the plant’s R-1 capacity to 14 mgd and increase its energy efficiency.
According to the terms of the “2010 Global Consent Decree” between EPA and the City, the
Honouliuli WWTP will be upgraded to full secondary treatment by 2024. The WWTP upgrade will
produce higher quality effluent that will increase the opportunity for expanded water reuse.
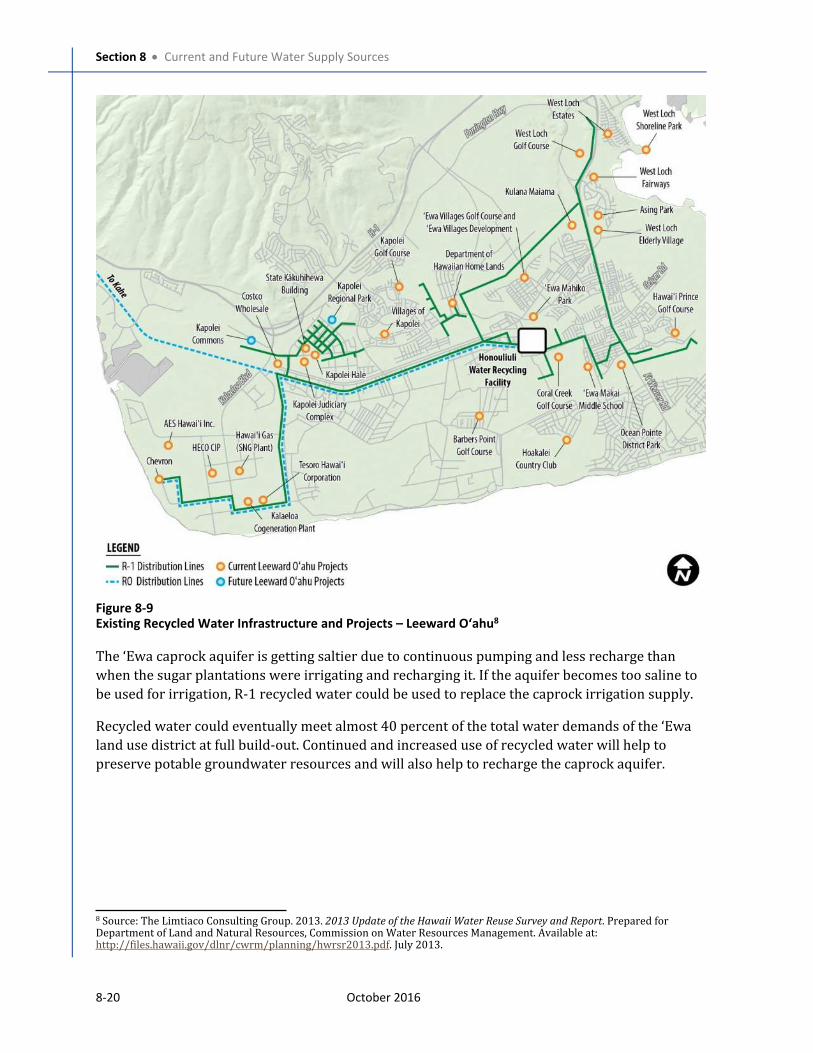
Section 8 Current and Future Water Supply Sources
8-20 October 2016
Figure 8-9
Existing Recycled Water Infrastructure and Projects – Leeward Oʻahu8
The ʻEwa caprock aquifer is getting saltier due to continuous pumping and less recharge than
when the sugar plantations were irrigating and recharging it. If the aquifer becomes too saline to
be used for irrigation, R-1 recycled water could be used to replace the caprock irrigation supply.
Recycled water could eventually meet almost 40 percent of the total water demands of the ʻEwa
land use district at full build-out. Continued and increased use of recycled water will help to
preserve potable groundwater resources and will also help to recharge the caprock aquifer.
8 Source: The Limtiaco Consulting Group. 2013. 2013 Update of the Hawaii Water Reuse Survey and Report. Prepared for Department of Land and Natural Resources, Commission on Water Resources Management. Available at: http://files.hawaii.gov/dlnr/cwrm/planning/hwrsr2013.pdf. July 2013.
October 2016 9-1
Section 9
Water Quality, Regulations,
and Treatment
The BWS provides high quality water to its
customers and is in full compliance with all
regulatory requirements. This section provides a
broad overview of current and future water quality
regulations and potential water quality issues that
may affect the BWS water system. No significant
current or future issues were identified.
The BWS demonstrates its compliance to customers through the Consumer Confidence Report.
This document, sent annually to all customers, documents pertinent regulatory requirements and
the corresponding BWS water quality values.
Information in Section 9 provides input to the risks discussed in Section 12, Findings and
Recommendations, including recommendations for future studies.
9.1 Key FindingsThe WMP’s key findings for issues of water quality and treatment are listed below. These findings
are identified with a code (an abbreviation for the section name) and number (for example,
WQTR-1). These codes are repeated in Section 12, Findings and Recommendations, to easily tie
the findings in this section to the recommendations for BWS action listed in Section 12.
WQTR-1 The water that the BWS delivers meets all federal and state requirements.
WQTR-2 Current and legacy activities and groundwater recharge can potentially affect
source water quality. The BWS identified several strategies to maintain
compliance for these water quality issues, and these projects are continually
monitored and reviewed by the BWS so that they can be implemented should
the need arise.
9.2 Current and Potential RegulationsThis section provides a brief overview of regulations and requirements. These include current
regulations, regulations under development, other water quality issues being considered by
regulators, and internal BWS water quality goals.
9.2.1 Current Regulations
The Hawaiʻi State Department of Health (DOH) received approval from EPA to administer the
federal water quality regulations under primacy. These federal regulations have primarily
focused on source monitoring and protection, treatment, and distribution system water quality
provides information that
addresses the following
WMP objectives:
Water Quality, Health, and Safety
System Reliability and Adequacy
Cost and Affordability
Water Conservation
Water Resource Sustainability
Section
9
Section 9 Water Quality, Regulations, and Treatment
9-2 October 2016
monitoring and protection. Specific risks that these regulations aim to minimize include:
microbiological (treatment techniques based on source water quality and maintenance of water
quality throughout the distribution system); chemical (disinfection byproducts, corrosion
byproducts, synthetic organic compounds, inorganic compounds, and other organic compounds);
and radiological. More recent regulations have focused on managing water quality throughout
distribution systems with respect to the control of microbial activity, and the formation of
disinfection byproducts (DBPs) and corrosion byproducts. The main regulations are summarized
below.
9.2.1.1 Ground Water Rule
The Ground Water Rule (GWR) was promulgated by EPA in 2006 to reduce the risk to potential
pathogens that may be present in public water systems using ground water. The GWR has four
major components.
1. Periodic sanitary surveys evaluating eight critical elements and identification of
significant deficiencies.
2. Source water monitoring to test for the presence of one of the following: E. coli;
enterococci; or coliphage in the sample. There are two monitoring provisions:
a. Triggered monitoring for systems that do not already provide treatment that achieves
at least 99.99 percent (4-log) inactivation or removal of viruses and that have a total
coliform-positive routine sample under the Total Coliform Rule sampling in the
distribution system.
b. Assessment monitoring – As a complement to triggered monitoring, a State has the
option to require systems, at any time, to conduct source water assessment
monitoring to help identify high risk systems.
3. Corrective actions required for any system with a significant deficiency or source water
fecal contamination.
4. Compliance monitoring to ensure that treatment technology installed to treat drinking
water reliably achieves at least 99.99 percent (4-log) inactivation or removal of viruses.
Currently, the BWS operates under the “Triggered Source Monitoring” provision that requires
testing the source waters for E. coli (a direct indicator of fecal contamination) any time a sample
in the distribution system tests positive for coliforms (the testing required for the Total Coliform
Rule). If the source tests positive for E. coli then corrective measures must be taken that might
include installing disinfection for 4-log inactivation of viruses. Implementing these corrective
measures is cost and time intensive, and could lead to a loss of use of certain supply sources while
the system is under repair.
9.2.1.2 Total Coliform Rule
The Total Coliform Rule (TCR) was promulgated by EPA in 1989 and updated with the Revised
Total Coliform Rule in 2013. These regulations govern microbiological water quality in the
distribution system based on the analysis for total coliform organisms, which serves as an
Section 9 Water Quality, Regulations, and Treatment
October 2016 9-3
indicator for the presence of potentially pathogenic organisms. Compliance with the maximum
contaminant limit (MCL) is based on the presence or absence of total coliforms in a sample, rather
than on an estimate of coliform density, and/or confirmation of the presence or absence of fecal
coliforms or E. coli which would indicate contamination by potentially pathogenic organisms in
the system. The MCL for water systems analyzing at least 40 samples per month is no more than 5
percent of the monthly samples may have a positive total coliform result. Samples are collected
from representative sites in the distribution system, including high, medium, and low water age
areas. Currently the BWS fully meets the TCR.
9.2.1.3 Disinfection Byproducts Rule
EPA promulgated a revised standard for total trihalomethanes (TTHMs) and a new standard for
other DBPs in 1998 in the Stage 1 Disinfectant/Disinfection Byproducts Rule (D/DBPR). This rule
applies to all water systems that use a disinfectant for water treatment. The Stage 1 D/DBPR
lowered the previous MCL for TTHMs to 0.08 milligrams per liter (mg/L) and established the MCL
for the five haloacetic acids at 0.06 mg/L. The Stage 2 D/DBPR modified how compliance is
calculated by changing from a system-wide running annual average of quarterly samples to a
location-specific running annual average. Currently the BWS fully meets the Stage 1 and Stage 2
D/DBPR.
9.2.1.4 Lead and Copper Rule
In 1991 EPA promulgated the Lead and Copper Rule (LCR) and established Action Levels (ALs)
for lead and copper at 0.015 mg/L and 1.3 mg/L, respectively, for water samples at locations
where consumers are most likely to be exposed to increased lead levels. If ALs are exceeded, then
the water provider must conduct corrosion control studies in the distribution system and
implement treatment programs and additional monitoring to assess continued corrosion control
performance. EPA published minor corrections and clarifications to the LCR in 2004 and short-
term revisions in 2007. The revisions were intended to enhance implementation in the areas of
monitoring, treatment, customer awareness, and lead service line replacement; enhance public
education requirements; and ensure drinking water consumers receive meaningful, timely and
useful information. Currently the BWS fully meets the LCR.
9.2.2 Future Regulations
There are revisions under way to several Federal water quality regulations that may or may not
affect the BWS system. If implemented, effects could include limitations on uses of some sources,
addition of treatment, or operational modifications:
Long-Term LCR revisions: These revisions may include elimination of partial lead service
line replacements, additional guidance on water quality targets, changes in sampling
protocols, and potential inclusion of new sampling locations that have distribution system
lead components, including lead gooseneck connections.
Perchlorate: EPA has been considering regulatory action for perchlorate, though this action
has been delayed. California has set its own MCL for perchlorate at 6 micrograms per liter (μg/L) and Massachusetts at 2 μg/L.
Section 9 Water Quality, Regulations, and Treatment
9-4 October 2016
Carcinogenic volatile organic compounds: EPA is considering aggregating a number of
contaminants for a single regulatory limit. Included in this set of compounds are: 1)
trichloroethylene (TCE); 2) tetrachloroethylene (PCE); 3) other currently regulated
compounds, such as benzene, carbon tetrachloride, 1,2-dichloroethane, 1,2-
dichloropropane (DCP), chloromethane, vinyl chloride; and 4) eight currently unregulated
compounds, including aniline, benzyl chloride, 1,3-butadiene, 1,1-dichloroethane,
nitrobenzene, oxirane methyl, TCP (currently regulated by DOH), and urethane. This rule is
important as it sets a direction for future regulations.
Hexavalent Chromium: Total chromium is currently regulated by EPA with an MCL of 100
µg/L; however, EPA has not yet established an MCL for hexavalent chromium (Cr6+).
Because Cr6+ is more toxic than trivalent chromium, a lower MCL is anticipated than for
total chromium. Hawaiʻi has established an AL of 13 µg/L. Future chromium regulations
could potentially be more stringent, as observed in California where a Cr6+ public health
goal of 0.02 µg/L in finished water and an MCL of 10 µg/L became effective July 1, 2014.
Distribution system reservoirs: EPA is considering developing a rule governing
distribution system water storage facility inspection and cleaning, and other risk
management approaches to help maintain facility integrity and finished water quality.
9.2.3 Issues on the Regulatory Horizon
EPA periodically evaluates additional constituents for potential regulation. EPA reviews these by
developing Contaminant Candidate Lists (CCLs) and collecting data for the Unregulated
Contaminant Monitoring program, which studies constituents that may be present in drinking
water but do not yet have standards under the Safe Drinking Water Act. Potential constituents for
future regulation that are not yet being developed include the following:
Microbiological quality in the distribution system: The water industry has increased its
attention on disease outbreaks that occur not due to source water quality or treatment
deficiencies, but due to breaches in the integrity of the distribution system. Large systems,
particularly those in warm climates, present unique challenges with respect to maintaining
disinfectant residuals, limiting water age, controlling microbial regrowth, and preventing
the proliferation of opportunistic pathogens when contamination occurs. EPA continues to
evaluate all aspects of distribution systems, and such efforts may lead to future regulations
that address more stringent water quality protection to the customers’ taps.
Emerging DBPs: Disinfectants react with naturally occurring material in water and other
treatment chemicals to produce DBPs. More than 600 separate DBPs have been identified,
with more DBPs being discovered as analytical methods improve. Some DBPs pose possible
human health risks and thus are a cause for concern, including nitrosamines, other
nitrogenous DBPs, and brominated and iodinated DBPs. The organic content of the BWS
water sources suggest there is low formation potential for these DBPs.
Strontium: Strontium’s human health risks are being evaluated by EPA and it is being
considered for the CCL.
Section 9 Water Quality, Regulations, and Treatment
October 2016 9-5
9.2.4 Internal Water Quality Goals
The BWS has several water quality considerations that are not strictly regulatory driven, but are
based on the operations of its specific water systems. Three examples include: 1) granular
activated carbon (GAC) facilities are operated to ensure that TCP levels remain comfortably
below the 0.6 µg/L limit; 2) efforts are made to manage chloride/salinity concentrations to avoid
customer complaints; and 3) changes to chlorine residual concentrations are minimized to limit
customer objections to chlorinous tastes and/or odors.
The BWS water system has been primarily designed to provide water supply reliability. The use
of different water sources to provide this reliability can lead to different water quality depending
on which sources are used. The current limitations on mixing in the system and the sensitivity of
customers to both chlorine and mineral content need to be considered in development of any
water system improvements. For example, a 10 to 1 ratio is required when mixing well water at
Makakilo and Honouliuli due to taste considerations. When water from the Kunia wells is
blended, customers notice the change in taste.
Customer sensitivity to distribution system water quality is also important when considering new
supply sources. If desalination is implemented, special attention would need to be paid to
stabilizing water corrosivity prior to its introduction in the distribution system. Red-colored
water incidents have been noted on the mainland when water of substantially different water
quality is introduced into pipes that had been balanced to a specific water chemistry.
9.3 Source Water QualityBoth changes to source water quality and new regulations could trigger the need for BWS actions
to maintain treated water quality, such as supplementary monitoring, source protection
measures, treatment optimization, or new water treatment.
9.3.1 Parameters that May Trigger Action and Potential Compliance Issues
A number of watershed and water system issues can potentially affect source water quality and
trigger changes in water treatment.
Legacy activities: Both agricultural and urban use of pesticides, herbicides, and solvents
may be related to the presence of TCP, heptachlor epoxide, ethylene dibromide, dieldrin,
DCP, dibromochloropropane, atrazine, chlordane, and simazine in soils and water sources.
Cesspools, while being phased out, can pose some risk to aquifers as noted by DOH.
Current activities: While agricultural practices have changed, the impacts of different
chemicals, application methods, and best management practices (to the extent
implemented) are unknown, as are the impacts of treatment and potential application of
genetically modified organism crops. Leaking underground storage tanks, whether small-
scale (e.g., gas stations) or large-scale (e.g., Red Hill1), also pose a risk to water quality.
Commercial activities can lead to the presence of PCE, TCE, methyl tert-butyl ether, carbon
1 Fuel leaks from the Red Hill Navy tanks could impact Hālawa Shaft, Hālawa Wells, ‘Aiea Wells, ‘Aiea Gulch Wells, and Moanalua Wells.
Section 9 Water Quality, Regulations, and Treatment
9-6 October 2016
tetrachloride, and chlorodifluoromethane. As noted above, cesspools do exist, and, while
the BWS has mitigated effects near drinking water sources, monitoring continues.
Aging infrastructure: The potential for microbial contamination increases for older
infrastructure such as tunnels, shafts, and pipes. Aging galvanized and cast iron pipes are
potentially susceptible to tuberculation which can affect turbidity, chlorine residuals, and
other water quality characteristics.
Degree of groundwater recharge: Groundwater recharge occurs through the natural
processes of rain water infiltration and percolation, though this could decrease during
drought conditions. Over pumping groundwater can also result in higher chloride levels,
which may be caused by lowering groundwater levels to depths with higher salinity levels
or causing increased refilling of the lower aquifer layers with saltier water. Changes in
rainfall patterns due to climate change may reduce or increase rainfall, groundwater
infiltration, and the transport of contaminants.
9.3.2 Potential Water Quality Compliance Strategies
Several strategies have been identified by the BWS to maintain compliance for the water quality
issues identified above. The principal issues for the BWS to consider are microbiological risks,
TCP, hexavalent chromium, and chlorides.
9.3.2.1 Microbiological Risks
Potential microbial risks have been identified for groundwater sources and treated waters (in the
distribution system). To avoid triggering a requirement for 4-log treatment for virus inactivation
of groundwaters at risk of microbial contamination (i.e., if E. coli is detected in the source), the
BWS should:
Renovate source water tunnels and shafts (as needed) to improve sanitary seals and
address drainage issues.
To enhance disinfection throughout the distribution system and reduce positive coliform
detections in monthly (TCR) samples, the BWS should:
Improve chlorine feed systems through process control:
Early detection of chlorine feed interruptions through remote chlorine residual
monitoring; and
Avoid unanticipated chlorine feed loss through the use of level sensors.
Repair/replace chlorine feed equipment as identified in the condition assessments.
Section 9 Water Quality, Regulations, and Treatment
October 2016 9-7
9.3.2.2 TCP
GAC treatment is currently in place for the BWS’s sources impaired by TCP. Potential
alternatives/modifications to the current treatment process are being evaluated and include:
Reconfigure plants to increase treatment efficiency: piping modifications to allow serial
rather than parallel treatment, as the existing system is configured for and operates as
single pass;
Implement activated carbon adsorbents (i.e., coconut shells); and
Plant improvements identified in the condition assessment.
Condition assessment of the GAC facilities has been completed, while the evaluation of alternative
GAC media are currently being performed, including pilot testing of different types of granular
activated carbon.
9.3.2.3 Hexavalent Chromium
Monitoring data has identified one source where Cr6+ levels are close to 10 μg/L, the current
California MCL, which EPA and the State of Hawaiʻi are considering as a future MCL. Options to
address Cr6+ include:
Ion exchange, coagulation-filtration, or RO;
Boosting water from an adjacent water system; or
Alternative supplies instead of treatment: The BWS could develop a replacement source,
assuming sufficient yield is available.
9.3.2.4 Chlorides
Chloride concentrations vary among the BWS aquifers, and the primary approach to management
has been controlling the amount of pumping and some blending. Potential changes to the current
sustainable yields and permitted pumping quantities are periodically reviewed by CWRM.
Three potential projects include:
1. Right-sizing pumping at each of the most affected wells consistent with its yield: It is
recommended that the evaluation of appropriate pump sizes be made as each well comes
up for replacement according to the condition assessment analysis.
2. Re-operation: This approach encompasses any needed modifications to existing
infrastructure to allow demands to be met when certain sources are off-line due to high
chloride levels. It also includes improvements required to facilitate blending of low
chloride water with higher chloride water to achieve water quality goals.
3. New source development: One proposed project is to drill a new well in the Koʻolau
formation (which would require GAC treatment) for blending with Honouliuli Wells
supply.
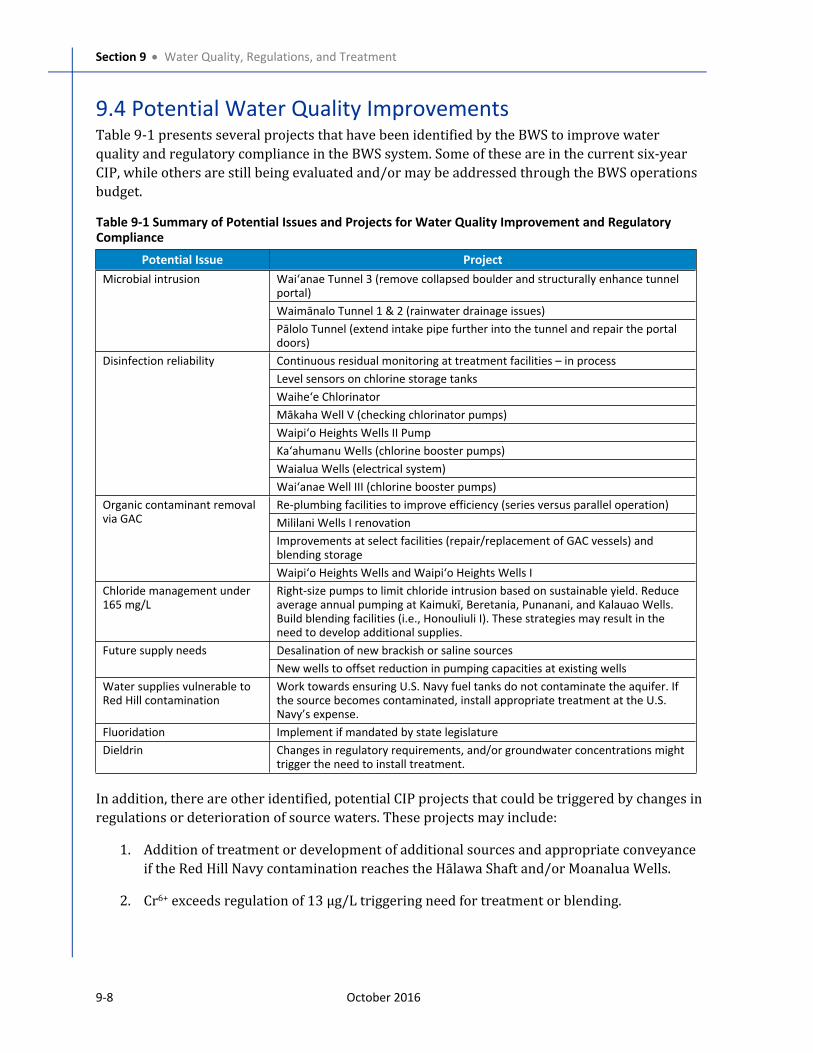
Section 9 Water Quality, Regulations, and Treatment
9-8 October 2016
9.4 Potential Water Quality ImprovementsTable 9-1 presents several projects that have been identified by the BWS to improve water
quality and regulatory compliance in the BWS system. Some of these are in the current six-year
CIP, while others are still being evaluated and/or may be addressed through the BWS operations
budget.
Table 9-1 Summary of Potential Issues and Projects for Water Quality Improvement and Regulatory
Compliance
Potential Issue Project
Waiʻanae Tunnel 3 (remove collapsed boulder and structurally enhance tunnel portal)
Waimānalo Tunnel 1 & 2 (rainwater drainage issues)
Microbial intrusion
Pālolo Tunnel (extend intake pipe further into the tunnel and repair the portal doors)
Continuous residual monitoring at treatment facilities – in process
Level sensors on chlorine storage tanks
Waiheʻe Chlorinator
Mākaha Well V (checking chlorinator pumps)
Waipiʻo Heights Wells II Pump
Kaʻahumanu Wells (chlorine booster pumps)
Waialua Wells (electrical system)
Disinfection reliability
Waiʻanae Well III (chlorine booster pumps)
Re-plumbing facilities to improve efficiency (series versus parallel operation)
Mililani Wells I renovation
Improvements at select facilities (repair/replacement of GAC vessels) and blending storage
Organic contaminant removal via GAC
Waipiʻo Heights Wells and Waipiʻo Heights Wells I
Chloride management under 165 mg/L
Right-size pumps to limit chloride intrusion based on sustainable yield. Reduce average annual pumping at Kaimukī, Beretania, Punanani, and Kalauao Wells. Build blending facilities (i.e., Honouliuli I). These strategies may result in the need to develop additional supplies.
Desalination of new brackish or saline sourcesFuture supply needs
New wells to offset reduction in pumping capacities at existing wells
Water supplies vulnerable to Red Hill contamination
Work towards ensuring U.S. Navy fuel tanks do not contaminate the aquifer. If the source becomes contaminated, install appropriate treatment at the U.S. Navy’s expense.
Fluoridation Implement if mandated by state legislature
Dieldrin Changes in regulatory requirements, and/or groundwater concentrations might trigger the need to install treatment.
In addition, there are other identified, potential CIP projects that could be triggered by changes in
regulations or deterioration of source waters. These projects may include:
1. Addition of treatment or development of additional sources and appropriate conveyance
if the Red Hill Navy contamination reaches the Hālawa Shaft and/or Moanalua Wells.
2. Cr6+ exceeds regulation of 13 μg/L triggering need for treatment or blending.
Section 9 Water Quality, Regulations, and Treatment
October 2016 9-9
3. A new chlorate regulation triggering need for changes in storage and/or supply of
hypochlorite.
4. E. coli positive detections triggering need for 4-log inactivation at various sources.
The need for the potential projects listed above are monitored by the BWS, and the need for
system modifications or additional treatment are reviewed as part of annual review and the
identification of potential CIP projects.

Section 9 Water Quality, Regulations, and Treatment
9-10 October 2016
This page intentionally left blank.
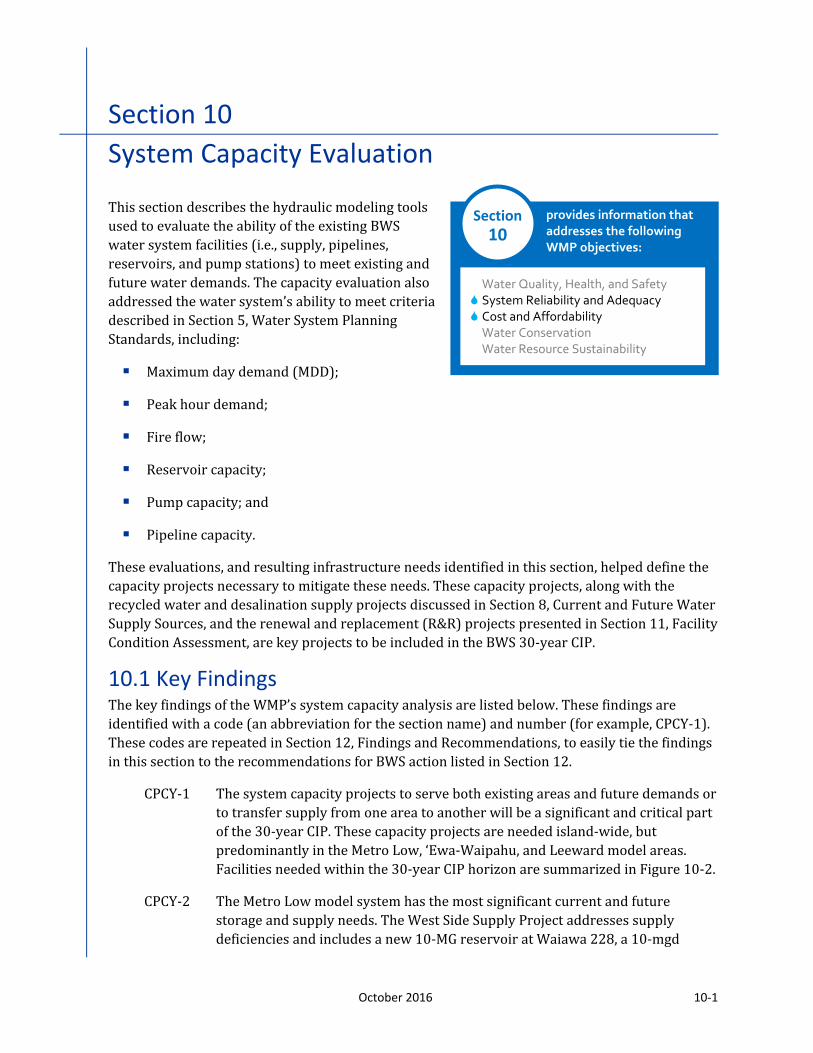
October 2016 10-1
Section 10
System Capacity Evaluation
This section describes the hydraulic modeling tools
used to evaluate the ability of the existing BWS
water system facilities (i.e., supply, pipelines,
reservoirs, and pump stations) to meet existing and
future water demands. The capacity evaluation also
addressed the water system’s ability to meet criteria
described in Section 5, Water System Planning
Standards, including:
Maximum day demand (MDD);
Peak hour demand;
Fire flow;
Reservoir capacity;
Pump capacity; and
Pipeline capacity.
These evaluations, and resulting infrastructure needs identified in this section, helped define the
capacity projects necessary to mitigate these needs. These capacity projects, along with the
recycled water and desalination supply projects discussed in Section 8, Current and Future Water
Supply Sources, and the renewal and replacement (R&R) projects presented in Section 11, Facility
Condition Assessment, are key projects to be included in the BWS 30-year CIP.
10.1 Key FindingsThe key findings of the WMP’s system capacity analysis are listed below. These findings are
identified with a code (an abbreviation for the section name) and number (for example, CPCY-1).
These codes are repeated in Section 12, Findings and Recommendations, to easily tie the findings
in this section to the recommendations for BWS action listed in Section 12.
CPCY-1 The system capacity projects to serve both existing areas and future demands or
to transfer supply from one area to another will be a significant and critical part
of the 30-year CIP. These capacity projects are needed island-wide, but
predominantly in the Metro Low, ‘Ewa-Waipahu, and Leeward model areas.
Facilities needed within the 30-year CIP horizon are summarized in Figure 10-2.
CPCY-2 The Metro Low model system has the most significant current and future
storage and supply needs. The West Side Supply Project addresses supply
deficiencies and includes a new 10-MG reservoir at Waiawa 228, a 10-mgd
provides information that
addresses the following
WMP objectives:
Water Quality, Health, and Safety
System Reliability and Adequacy
Cost and Affordability
Water Conservation
Water Resource Sustainability
Section
10
Section 10 System Capacity Evaluation
10-2 October 2016
booster pump station and a control valve downstream of the reservoir to flow
into the west side of Metro 180 West, and a 36-inch Stadium transmission main.
For storage deficiencies, an alternatives analysis incorporating feasibility and
life cycle cost is recommended to develop solutions to mitigate this issue.
Alternatives include:
New storage within Honolulu where demands are concentrated;
New peaking wells between downtown Honolulu and Kāhala could reduce
some of the anticipated transfers from west to east, improving local system
reliability, and may reduce some of the identified transmission capacity;
Due to limitations in siting new reservoirs and constructing new wells in
Metro Low, a large portion of the infrastructure could be located west of the
Metro 180 service area; or
A combination of the options above.
CPCY-3 Source yields in existing select large pumping stations need to be reduced to
stabilize rising chloride trends and allow the aquifer to recover after drought
periods. This will result in a reduction of pumping in large Metro Low sources
by 8 mgd during average day demand conditions to meet Water for Life
sustainable pumping goals. This reduction will be offset with transfers from
Waipahu and other sources.
CPCY-4 Some data weaknesses were found during hydraulic modeling. Prior to the next
round of data collection and verification for the hydraulic modeling, data
sources should be improved including: calibrating or repairing Supervisory
Control and Data Acquisition (SCADA) equipment where data was found to be
inaccurate or questionable; installing water level gauges at wells; installing flow
meters at major control valves; and installing flow meters and pressure gauges
at unequipped tunnels.
10.2 Water System AnalysisThis section presents the approach and results of the hydraulic analysis for the BWS water
distribution and transmission systems. The water system analysis assessed distribution and
transmission system performance, identified capacity needs, and developed capital
improvements for the BWS water system to provide reliable service for existing and future
customers. To perform this analysis, numerical hydraulic models were developed from the large
amount of system information residing in the BWS GIS database and verified using the best data
available from the SCADA system, historical water demands based on the BWS customer meters,
and pump production data. Future water demand projections were estimated from population
growth estimates by the City and historical water use in the BWS system (see Section 7, Historical
and Future Water Demands). The hydraulic performance criteria used in the hydraulic analysis
were based on the Standards, which are discussed in Section 5. Projects identified as part of the
hydraulic analysis are presented at the end of this section.
Section 10 System Capacity Evaluation
October 2016 10-3
10.2.1 Hydraulic Models
Due to the large geographic extent and complexity of the BWS water system, the hydraulic model
was developed as 10 different systems (model systems). These 10 systems include the 110
individual pressure zones. Figure 10-2 shows the distribution and transmission pipelines by
model system, and reservoirs, pump stations, and sources.
The hydraulic model systems were developed from the BWS pipeline database which included
2,100 miles of pipelines. The BWS desired to create the most accurate hydraulic models possible
and consequently, all transmission and distribution pipelines, as small as two inches in diameter,
were incorporated into the model. The additional data listed below were used to model water
distribution facilities including pump stations, reservoirs, pressure reducing valves (PRVs), and
sources (wells, tunnels, and shafts).
1. Manufacturers pump curves, or if available field data
2. Reservoir dimensions and locations
3. Well pump data including static and pumping water level, if available
4. Tunnel and shaft configurations
5. Honolulu Online Utilities GIS viewer which allowed access to as-built drawings for
pipelines and pump stations
6. Digital elevation model to obtain pipeline elevations
7. Historical customer billing records and customer meter locations
8. Pumping records to determine total amount pumped and to calculate unaccounted-for
water
9. Control valve elevations
10.2.2 Hydraulic Model Verification
After developing the 10 models from GIS and other data, the accuracy of the model was assessed
and then improved by comparing the modeled outputs to available system information. The key
modeling verification steps are listed below.
1. Models were verified using the best available SCADA data for two 24-hour periods, MDD,
and minimum day demand, which span the typical operating range of the system.
2. Model inputs included initial reservoir levels, estimated demand and diurnal demand
patterns, pump controls, and initial pump on/off settings.
3. Models were run over a 24-hour simulation period. Outputs such as reservoir levels,
pump station pressures and flows, and well pressures and flows were compared to
SCADA data.
Section 10 System Capacity Evaluation
10-4 October 2016
4. For areas where model outputs did not match SCADA data, further investigation was
performed. These investigations included confirming if pipeline intersections in GIS
crossed without connecting or whether gate valves were open or closed. On a case by case
basis, adjustments to factors such as pump curves, pump controls, or valve settings were
made to improve model results (e.g., modeled tank levels matched field data more
closely).
The validation procedure resulted in an overall high level of confidence in the models. Strengths
uncovered during verification included the following:
Detailed SCADA records for flow, pressure, tank levels, and pump on/off status for most
facilities;
User-friendly access terminal to find and plot SCADA records;
Sufficient data to calculate diurnal patterns by pressure zone; and
Determination of how pumps were performing relative to the manufacturers performance
curves.
Weaknesses found during the verification process included:
Inaccurate flow, pressure, or water level measurements;
Inconsistent information, such as a pump status being off, but flow data showing a positive
value;
Absence of water level measurement in wells;
Absence of flow meters or pressure gauges at certain tunnels; and
Absence of flow meters at certain control valves between pressure zones.
Consequently, the following actions are recommended prior to the next round of data collection
and model verification:
Calibrate or repair SCADA equipment where data was found to be inaccurate or
questionable;
Install water level gauges at wells;
Install flow meters at major control valves; and
Install flow meters and pressure gauges at unequipped tunnels.
10.2.3 Hydraulic Model Analysis
After verifying the models represented current operating conditions, the existing and future
scenarios were created to evaluate the system against capacity-related Standards, as described in
Section 5.
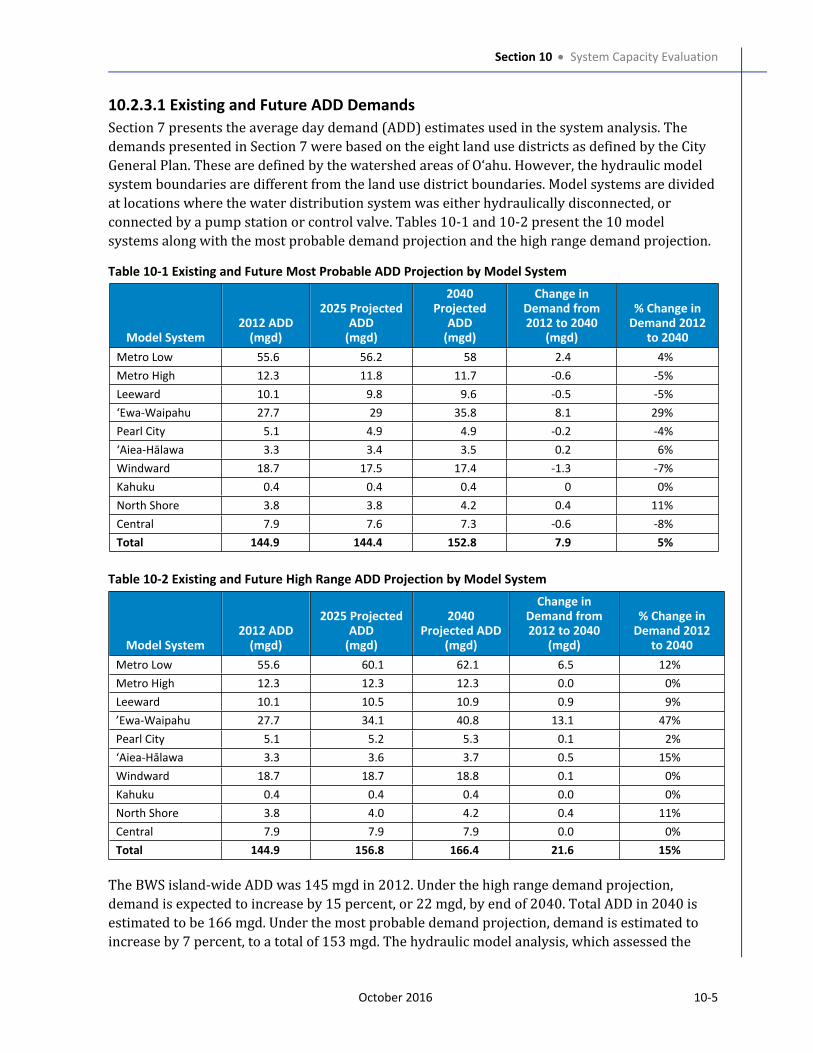
Section 10 System Capacity Evaluation
October 2016 10-5
10.2.3.1 Existing and Future ADD Demands
Section 7 presents the average day demand (ADD) estimates used in the system analysis. The
demands presented in Section 7 were based on the eight land use districts as defined by the City
General Plan. These are defined by the watershed areas of Oʻahu. However, the hydraulic model
system boundaries are different from the land use district boundaries. Model systems are divided
at locations where the water distribution system was either hydraulically disconnected, or
connected by a pump station or control valve. Tables 10-1 and 10-2 present the 10 model
systems along with the most probable demand projection and the high range demand projection.
Table 10-1 Existing and Future Most Probable ADD Projection by Model System
Model System2012 ADD
(mgd)
2025 Projected ADD
(mgd)
2040 Projected
ADD(mgd)
Change in Demand from 2012 to 2040
(mgd)
% Change in Demand 2012
to 2040
Metro Low 55.6 56.2 58 2.4 4%
Metro High 12.3 11.8 11.7 -0.6 -5%
Leeward 10.1 9.8 9.6 -0.5 -5%
‘Ewa-Waipahu 27.7 29 35.8 8.1 29%
Pearl City 5.1 4.9 4.9 -0.2 -4%
ʻAiea-Hālawa 3.3 3.4 3.5 0.2 6%
Windward 18.7 17.5 17.4 -1.3 -7%
Kahuku 0.4 0.4 0.4 0 0%
North Shore 3.8 3.8 4.2 0.4 11%
Central 7.9 7.6 7.3 -0.6 -8%
Total 144.9 144.4 152.8 7.9 5%
Table 10-2 Existing and Future High Range ADD Projection by Model System
Model System2012 ADD
(mgd)
2025 Projected ADD
(mgd)
2040 Projected ADD
(mgd)
Change in Demand from 2012 to 2040
(mgd)
% Change in Demand 2012
to 2040
Metro Low 55.6 60.1 62.1 6.5 12%
Metro High 12.3 12.3 12.3 0.0 0%
Leeward 10.1 10.5 10.9 0.9 9%
’Ewa-Waipahu 27.7 34.1 40.8 13.1 47%
Pearl City 5.1 5.2 5.3 0.1 2%
‘Aiea-Hālawa 3.3 3.6 3.7 0.5 15%
Windward 18.7 18.7 18.8 0.1 0%
Kahuku 0.4 0.4 0.4 0.0 0%
North Shore 3.8 4.0 4.2 0.4 11%
Central 7.9 7.9 7.9 0.0 0%
Total 144.9 156.8 166.4 21.6 15%
The BWS island-wide ADD was 145 mgd in 2012. Under the high range demand projection,
demand is expected to increase by 15 percent, or 22 mgd, by end of 2040. Total ADD in 2040 is
estimated to be 166 mgd. Under the most probable demand projection, demand is estimated to
increase by 7 percent, to a total of 153 mgd. The hydraulic model analysis, which assessed the
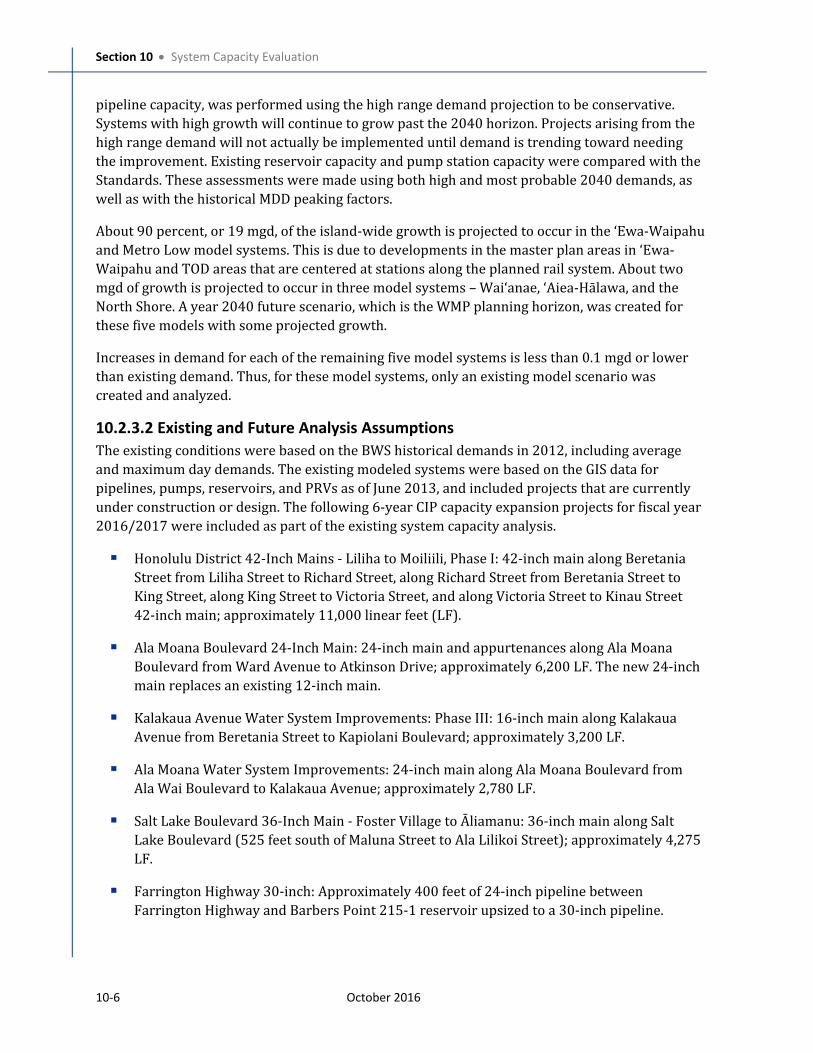
Section 10 System Capacity Evaluation
10-6 October 2016
pipeline capacity, was performed using the high range demand projection to be conservative.
Systems with high growth will continue to grow past the 2040 horizon. Projects arising from the
high range demand will not actually be implemented until demand is trending toward needing
the improvement. Existing reservoir capacity and pump station capacity were compared with the
Standards. These assessments were made using both high and most probable 2040 demands, as
well as with the historical MDD peaking factors.
About 90 percent, or 19 mgd, of the island-wide growth is projected to occur in the ‘Ewa-Waipahu
and Metro Low model systems. This is due to developments in the master plan areas in ‘Ewa-
Waipahu and TOD areas that are centered at stations along the planned rail system. About two
mgd of growth is projected to occur in three model systems – Waiʻanae, ‘Aiea-Hālawa, and the
North Shore. A year 2040 future scenario, which is the WMP planning horizon, was created for
these five models with some projected growth.
Increases in demand for each of the remaining five model systems is less than 0.1 mgd or lower
than existing demand. Thus, for these model systems, only an existing model scenario was
created and analyzed.
10.2.3.2 Existing and Future Analysis Assumptions
The existing conditions were based on the BWS historical demands in 2012, including average
and maximum day demands. The existing modeled systems were based on the GIS data for
pipelines, pumps, reservoirs, and PRVs as of June 2013, and included projects that are currently
under construction or design. The following 6-year CIP capacity expansion projects for fiscal year
2016/2017 were included as part of the existing system capacity analysis.
Honolulu District 42-Inch Mains - Liliha to Moiliili, Phase I: 42-inch main along Beretania
Street from Liliha Street to Richard Street, along Richard Street from Beretania Street to
King Street, along King Street to Victoria Street, and along Victoria Street to Kinau Street
42-inch main; approximately 11,000 linear feet (LF).
Ala Moana Boulevard 24-Inch Main: 24-inch main and appurtenances along Ala Moana
Boulevard from Ward Avenue to Atkinson Drive; approximately 6,200 LF. The new 24-inch
main replaces an existing 12-inch main.
Kalakaua Avenue Water System Improvements: Phase III: 16-inch main along Kalakaua
Avenue from Beretania Street to Kapiolani Boulevard; approximately 3,200 LF.
Ala Moana Water System Improvements: 24-inch main along Ala Moana Boulevard from
Ala Wai Boulevard to Kalakaua Avenue; approximately 2,780 LF.
Salt Lake Boulevard 36-Inch Main - Foster Village to Āliamanu: 36-inch main along Salt
Lake Boulevard (525 feet south of Maluna Street to Ala Lilikoi Street); approximately 4,275
LF.
Farrington Highway 30-inch: Approximately 400 feet of 24-inch pipeline between
Farrington Highway and Barbers Point 215-1 reservoir upsized to a 30-inch pipeline.
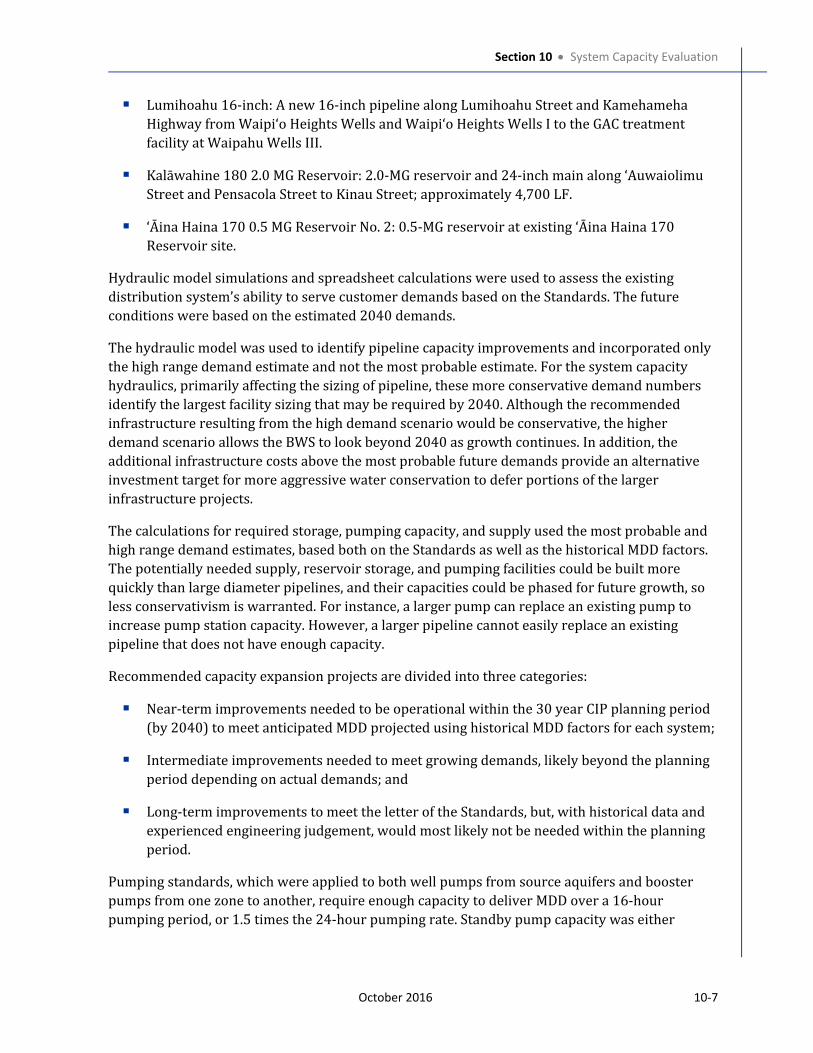
Section 10 System Capacity Evaluation
October 2016 10-7
Lumihoahu 16-inch: A new 16-inch pipeline along Lumihoahu Street and Kamehameha
Highway from Waipiʻo Heights Wells and Waipiʻo Heights Wells I to the GAC treatment
facility at Waipahu Wells III.
Kalāwahine 180 2.0 MG Reservoir: 2.0-MG reservoir and 24-inch main along ʻAuwaiolimu
Street and Pensacola Street to Kinau Street; approximately 4,700 LF.
ʻĀina Haina 170 0.5 MG Reservoir No. 2: 0.5-MG reservoir at existing ʻĀina Haina 170
Reservoir site.
Hydraulic model simulations and spreadsheet calculations were used to assess the existing
distribution system’s ability to serve customer demands based on the Standards. The future
conditions were based on the estimated 2040 demands.
The hydraulic model was used to identify pipeline capacity improvements and incorporated only
the high range demand estimate and not the most probable estimate. For the system capacity
hydraulics, primarily affecting the sizing of pipeline, these more conservative demand numbers
identify the largest facility sizing that may be required by 2040. Although the recommended
infrastructure resulting from the high demand scenario would be conservative, the higher
demand scenario allows the BWS to look beyond 2040 as growth continues. In addition, the
additional infrastructure costs above the most probable future demands provide an alternative
investment target for more aggressive water conservation to defer portions of the larger
infrastructure projects.
The calculations for required storage, pumping capacity, and supply used the most probable and
high range demand estimates, based both on the Standards as well as the historical MDD factors.
The potentially needed supply, reservoir storage, and pumping facilities could be built more
quickly than large diameter pipelines, and their capacities could be phased for future growth, so
less conservativism is warranted. For instance, a larger pump can replace an existing pump to
increase pump station capacity. However, a larger pipeline cannot easily replace an existing
pipeline that does not have enough capacity.
Recommended capacity expansion projects are divided into three categories:
Near-term improvements needed to be operational within the 30 year CIP planning period
(by 2040) to meet anticipated MDD projected using historical MDD factors for each system;
Intermediate improvements needed to meet growing demands, likely beyond the planning
period depending on actual demands; and
Long-term improvements to meet the letter of the Standards, but, with historical data and
experienced engineering judgement, would most likely not be needed within the planning
period.
Pumping standards, which were applied to both well pumps from source aquifers and booster
pumps from one zone to another, require enough capacity to deliver MDD over a 16-hour
pumping period, or 1.5 times the 24-hour pumping rate. Standby pump capacity was either
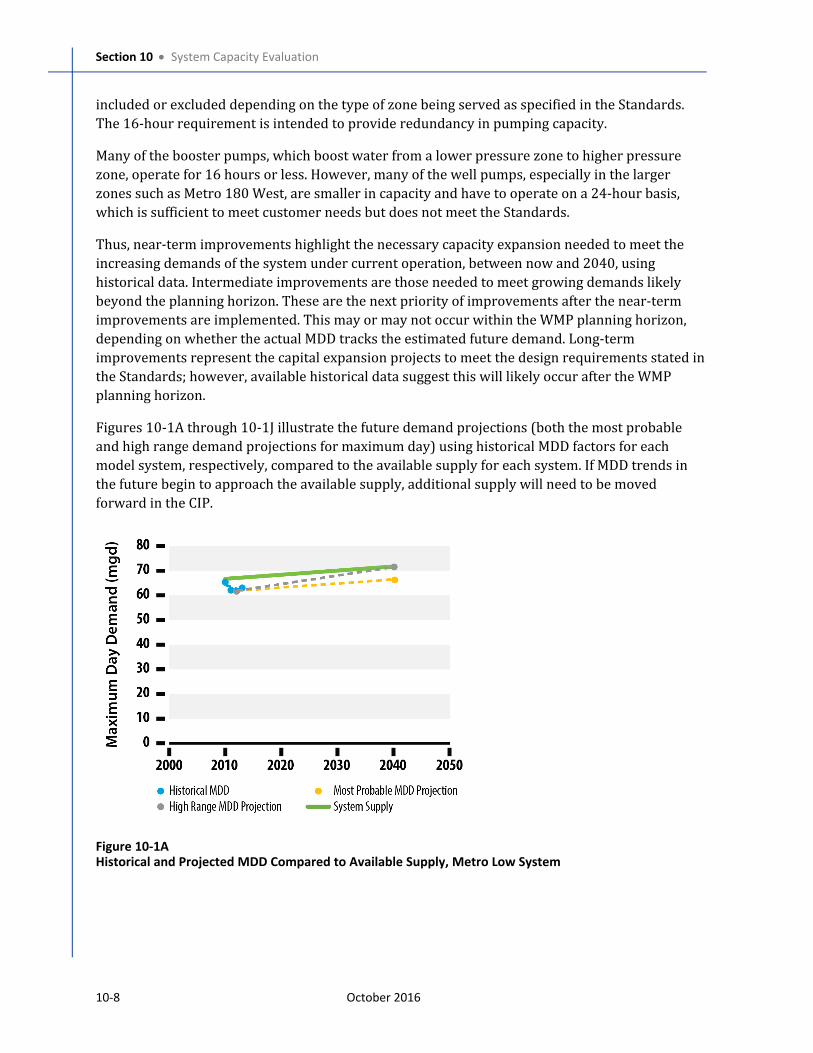
Section 10 System Capacity Evaluation
10-8 October 2016
included or excluded depending on the type of zone being served as specified in the Standards.
The 16-hour requirement is intended to provide redundancy in pumping capacity.
Many of the booster pumps, which boost water from a lower pressure zone to higher pressure
zone, operate for 16 hours or less. However, many of the well pumps, especially in the larger
zones such as Metro 180 West, are smaller in capacity and have to operate on a 24-hour basis,
which is sufficient to meet customer needs but does not meet the Standards.
Thus, near-term improvements highlight the necessary capacity expansion needed to meet the
increasing demands of the system under current operation, between now and 2040, using
historical data. Intermediate improvements are those needed to meet growing demands likely
beyond the planning horizon. These are the next priority of improvements after the near-term
improvements are implemented. This may or may not occur within the WMP planning horizon,
depending on whether the actual MDD tracks the estimated future demand. Long-term
improvements represent the capital expansion projects to meet the design requirements stated in
the Standards; however, available historical data suggest this will likely occur after the WMP
planning horizon.
Figures 10-1A through 10-1J illustrate the future demand projections (both the most probable
and high range demand projections for maximum day) using historical MDD factors for each
model system, respectively, compared to the available supply for each system. If MDD trends in
the future begin to approach the available supply, additional supply will need to be moved
forward in the CIP.
Figure 10-1AHistorical and Projected MDD Compared to Available Supply, Metro Low System
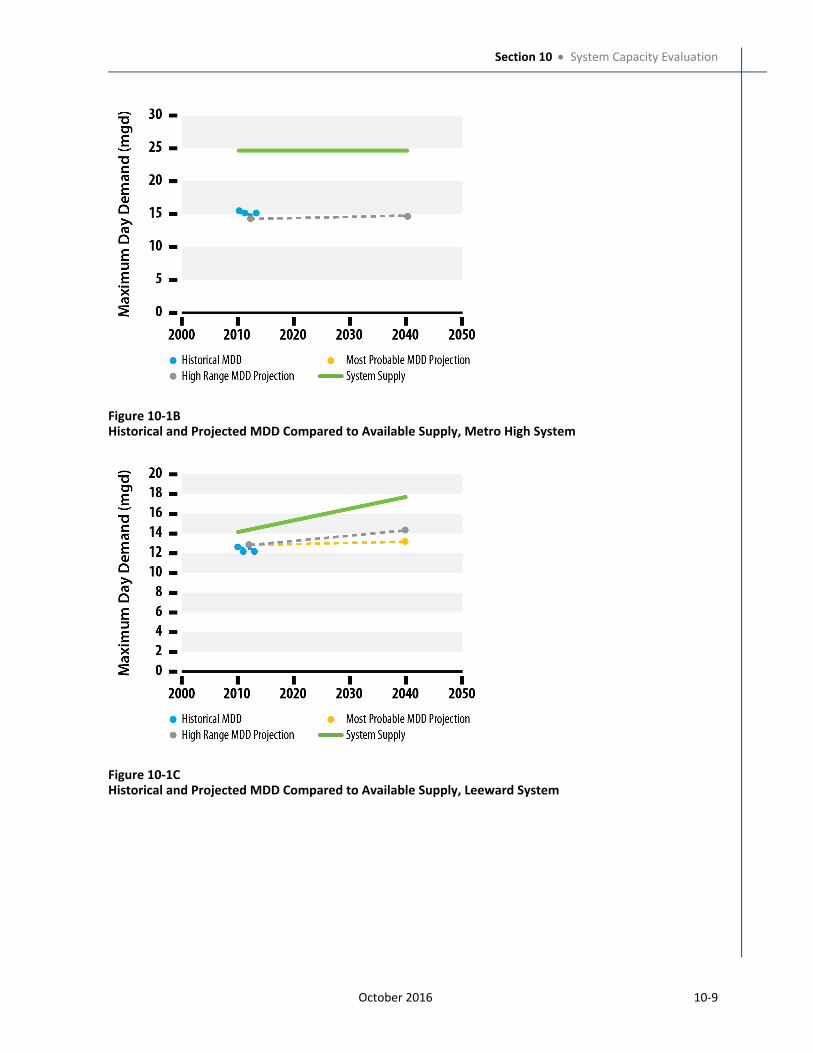
Section 10 System Capacity Evaluation
October 2016 10-9
Figure 10-1BHistorical and Projected MDD Compared to Available Supply, Metro High System
Figure 10-1CHistorical and Projected MDD Compared to Available Supply, Leeward System
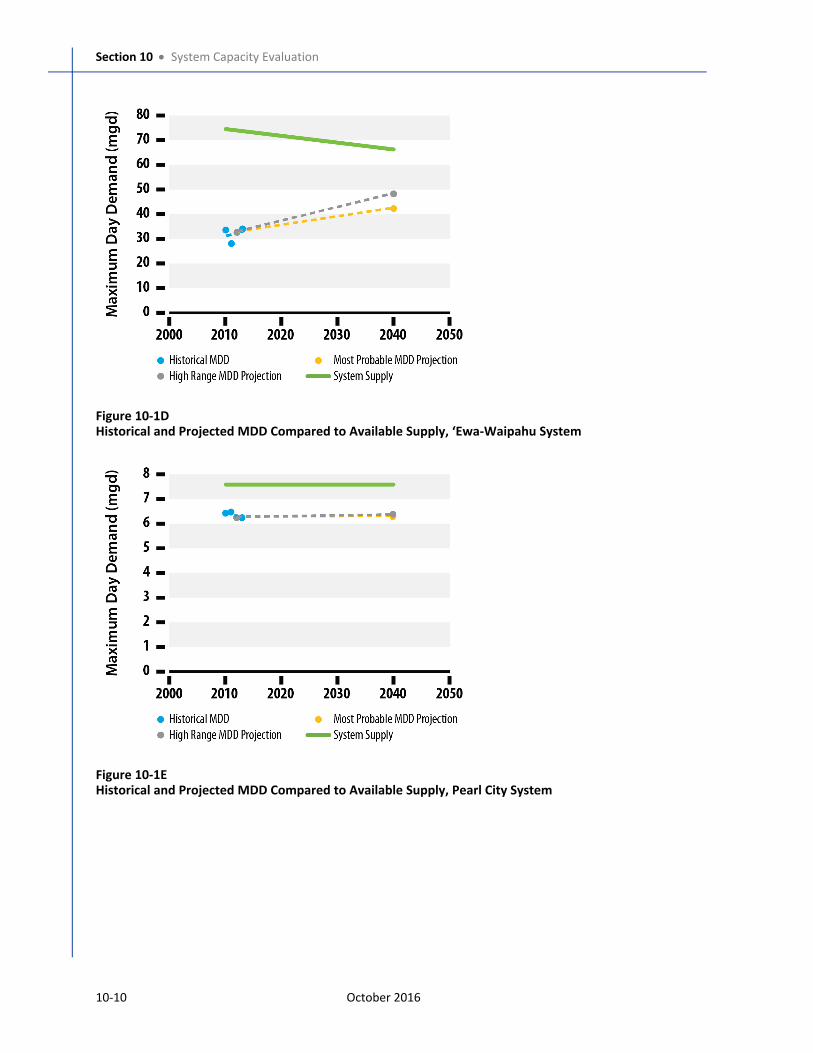
Section 10 System Capacity Evaluation
10-10 October 2016
Figure 10-1DHistorical and Projected MDD Compared to Available Supply, ʻEwa-Waipahu System
Figure 10-1EHistorical and Projected MDD Compared to Available Supply, Pearl City System
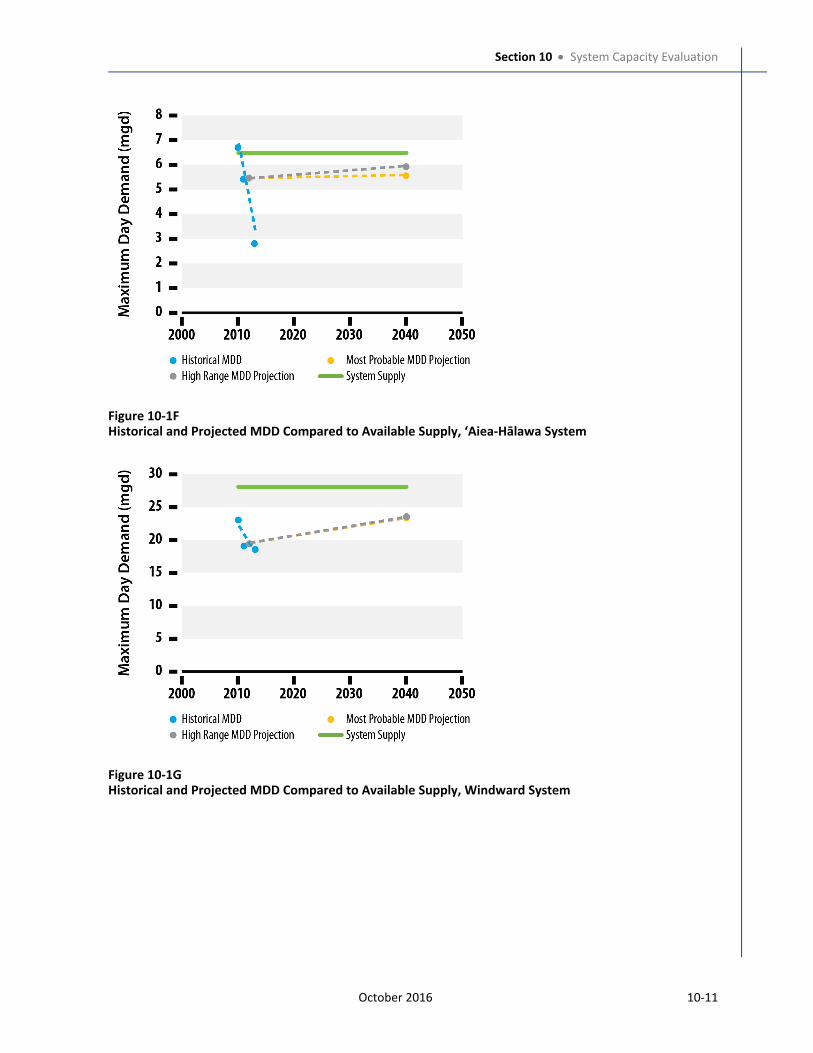
Section 10 System Capacity Evaluation
October 2016 10-11
Figure 10-1FHistorical and Projected MDD Compared to Available Supply, ‘Aiea-Hālawa System
Figure 10-1GHistorical and Projected MDD Compared to Available Supply, Windward System
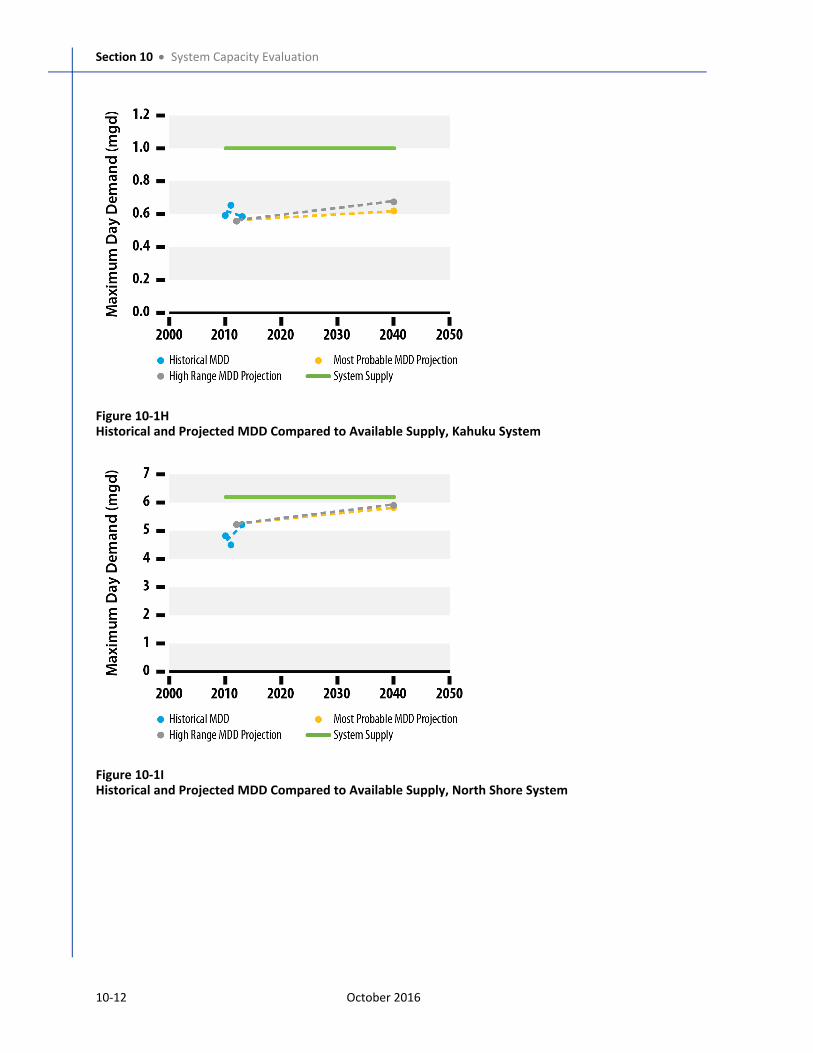
Section 10 System Capacity Evaluation
10-12 October 2016
Figure 10-1HHistorical and Projected MDD Compared to Available Supply, Kahuku System
Figure 10-1IHistorical and Projected MDD Compared to Available Supply, North Shore System
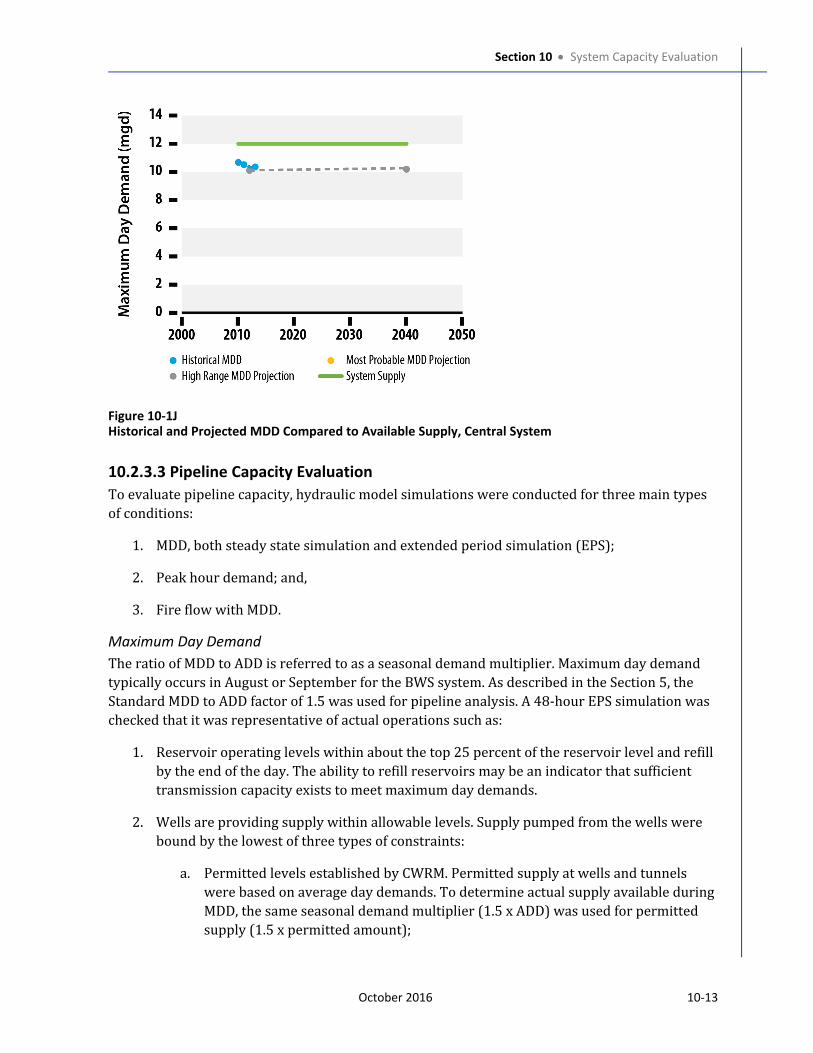
Section 10 System Capacity Evaluation
October 2016 10-13
Figure 10-1JHistorical and Projected MDD Compared to Available Supply, Central System
10.2.3.3 Pipeline Capacity Evaluation
To evaluate pipeline capacity, hydraulic model simulations were conducted for three main types
of conditions:
1. MDD, both steady state simulation and extended period simulation (EPS);
2. Peak hour demand; and,
3. Fire flow with MDD.
Maximum Day Demand
The ratio of MDD to ADD is referred to as a seasonal demand multiplier. Maximum day demand
typically occurs in August or September for the BWS system. As described in the Section 5, the
Standard MDD to ADD factor of 1.5 was used for pipeline analysis. A 48-hour EPS simulation was
checked that it was representative of actual operations such as:
1. Reservoir operating levels within about the top 25 percent of the reservoir level and refill
by the end of the day. The ability to refill reservoirs may be an indicator that sufficient
transmission capacity exists to meet maximum day demands.
2. Wells are providing supply within allowable levels. Supply pumped from the wells were
bound by the lowest of three types of constraints:
a. Permitted levels established by CWRM. Permitted supply at wells and tunnels
were based on average day demands. To determine actual supply available during
MDD, the same seasonal demand multiplier (1.5 x ADD) was used for permitted
supply (1.5 x permitted amount);
Section 10 System Capacity Evaluation
10-14 October 2016
b. Pumping restrictions established by the BWS operations staff based on electrical,
mechanical, hydraulic, or operational constraints; and
c. Pumping restrictions established by the BWS based on limiting long-term water
quality impacts in the wells.
Pipelines identified by the model analysis as having capacity constraints, indicated by high
velocities in the pipelines in the MDD EPS model simulation, were recommended for upsizing as
identified in Section 10.3.
Peak Hour Demand
The peak hour demands used in this analysis are described in Section 5. Rather than the Standard
factors, peak hour factors were calculated from the historical data to better represent the actual
systems. A steady state peak hour scenario was modeled to identify low pressure areas below 40
pounds per square inch (psi) and high headloss pipelines that may be undersized for the amount
of flow being conveyed. Where high headloss occurs, adding pipelines may be required to meet
the operational pressures within the system.
Pipes with a velocity greater than 6 feet per second (fps) and that resulted in downstream
pressure below 40 psi were recommended for a CIP project. Pipes with velocities greater than 10
fps were recommended for a CIP project, regardless of downstream pressure. Pipes with a
velocity between 6 and 10 fps that did not have downstream pressures below 40 psi were
recommended for upsizing during the R&R program priority, but not as a separate CIP project.
Areas that had low pressures (less than 40 psi) due to high headloss pipelines supplying the area
are an indication of inadequate pipeline capacity. There are no Standard limits for headloss, In the
evaluation, as a general guideline, pipelines with greater than 15 feet of headloss per 1,000 feet of
pipeline length were investigated further to determine if they should be recommended for
upsizing. Other areas had low pressures due to high ground elevations relative to the pressure
zone. In this case pipeline capacity was not deficient, but other improvements such as rezoning to
a higher pressure zone may mitigate the low pressure.
High pressure areas above 125 psi were also identified, which were mostly due to very low
ground elevations compared to the pressure zone grade line. These areas were considered for
either reconfiguring pipelines such that customers are serviced by an adjacent pressure zone
with a lower operating grade line or creating a new pressure zone with PRVs. Pressure
management using PRVs will reduce water loss and damage from leaks and main breaks over the
life of the pipeline. These results are summarized in Section 10.3.
Fire Flow
The BWS owns over 21,000 fire hydrants island-wide. The fire flow available at each hydrant was
calculated using the hydraulic model and compared to the required fire flow, which is based on
zoning designations such as Single Family, Multi-Family Low Rise, Commercial, or Light Industry.
Hydrants that did not meet the standard were evaluated further to identify possible pipeline or
other improvements needed to mitigate the fire flow shortfall. Available fire flow was calculated
by the model as the flow available at a hydrant while maintaining a minimum pressure of 20 psi
throughout the pressure zone, with MDD demands, and with the reservoirs at 50 percent full.
Section 10 System Capacity Evaluation
October 2016 10-15
Hydraulic modeling results were reviewed to identify pipelines leading up to the hydrants that
experienced high head losses, greater than 15 feet per 1,000 feet, during the fire flow simulation.
These pipelines were then upsized by two standard pipe sizes (i.e., 6 inches and 8 inches to 12
inches, 10 inches and 12 inches to 16 inches, 16 inches and 18 inches to 24 inches) to simulate
the increase in fire flow available at the particular hydrant and evaluate if that change adequately
addressed the low fire flow. This method offered a good basis for an initial estimate of
improvements that may be needed to meet fire flow. As a planning level estimate, these pipelines
became the recommended projects for fire flow related capacity improvements. These results are
summarized in Section 10.3.
10.2.3.4 Capacity Evaluations for Supply, Pumps and Reservoirs
Supply Capacity Evaluation
The supply need for each model system was calculated for both existing and 2040 demands. See
Section 8 for information on how supply capacity and the other capacity evaluations were applied
or modified. The supply needs are summarized in Section 10.3.
Reservoir Capacity Evaluation
The reservoir capacity in each pressure zone was compared against the Standards. The volume of
storage in each zone should be equivalent to the MDD of that zone. Storage should also have the
volume to meet a maximum day flow rate plus fire flow for the duration of a fire with the
reservoir three-quarters full at the start of the fire. As an example, Makakilo 1230 has an
estimated 2040 most probable ADD of 679 gallons per minute (gpm) and a 2040 MDD of 842 gpm
(or 1.24 multiplied by ADD), which is equivalent to 1.2 MG of storage needed. With an existing
storage of 2.0 MG, the pressure zone has a surplus storage of 0.8 MG (2.0 MG less 1.2 MG).
Storage shortages by pressure zone were identified for existing conditions and for future
conditions, using both most probable and high range demands. These results are summarized in
Section 10.3.
Pump Capacity Evaluation
Pumping capacity requirements are different depending on the type of pressure zone being
supplied. The three pressure zone types (zones with a single reservoir, multiple reservoirs, or
commercial and industrial demands) and their respective pumping requirements are described in
Section 5.3.3. As an example, Makakilo 1230 has a single reservoir with 2040 most probable MDD
of 842 gpm over a 24-hour pumping period. To deliver the same amount of supply over a 16-hour
pumping period, the pumping rate is 1.5 multiplied by the 24-hour rate, or 1.5 x 842 gpm = 1,263
gpm. The required highest fire flow in the zone is 1,500 gpm for townhouse and low rise
apartments. Thus, the pumping requirement is the sum of 1,263 gpm and 1,500 gpm, for a total of
2,763 gpm. The total capacity of Makakilo Booster 4 is 3,900 gpm per pump nameplate capacities.
Thus, there is a surplus pumping of 1,137 gpm (3,900 gpm less 2,763 gpm). A similar calculation
was performed for each pressure zone to identify the surplus or shortage. These results are
summarized in Section 10.3.
Section 10 System Capacity Evaluation
10-16 October 2016
10.3 Capacity Analysis ResultsThe purpose of the capacity analysis is to identify the existing and future capacity needs, and
develop projects to mitigate these needs. While the capacities for pipelines, reservoirs, and pump
stations were evaluated separately, they all make up the water delivery system for the BWS.
Limitations affecting the sizing and construction of specific types of facilities (for example, a lack
of usable land at the correct elevation or location for large reservoirs) can require increasing
supply needed to meet peak hour demands and pipeline capacity. In general, the supplies must be
able to meet the average day and maximum day demands. Normally the peak hour demands are
met from reservoir storage, with water being pumped into the reservoirs during the lower
demand periods of the day. In the existing BWS systems that may not have sufficient storage to
meet these peak hour demands, the peaking capacity comes from wells within that particular
system or from supply transferred through transmission mains from areas further away that
have either excess storage capacity or excess peaking wells to meet these shortfalls. This will also
be true for some of the future system improvements and operations.
10.3.1 System Wide Overview
10.3.1.1 Projects Planned Within the 30-Year CIP
The identification of capacity needs for reservoirs, pump stations, and sources, as well as the
hydraulic analysis determining distribution and transmission pipe capacity needs, result in a
series of recommended projects. These projects represent near-term improvements that are
needed to be operational within the 30 year CIP planning period (by 2040), intermediate
improvements that are needed to meet growing demands, likely beyond the CIP planning period,
and long-term improvements that are needed to meet Standards and would most likely not be
needed before 2040. Figure 10-2 provides an island-wide view of the major future improvements
identified for each model system. As indicated in Figure 10-2, there are major transmission
pipeline, pump station, well, and storage projects required across the island to meet the future
infrastructure capacity needs for the BWS.
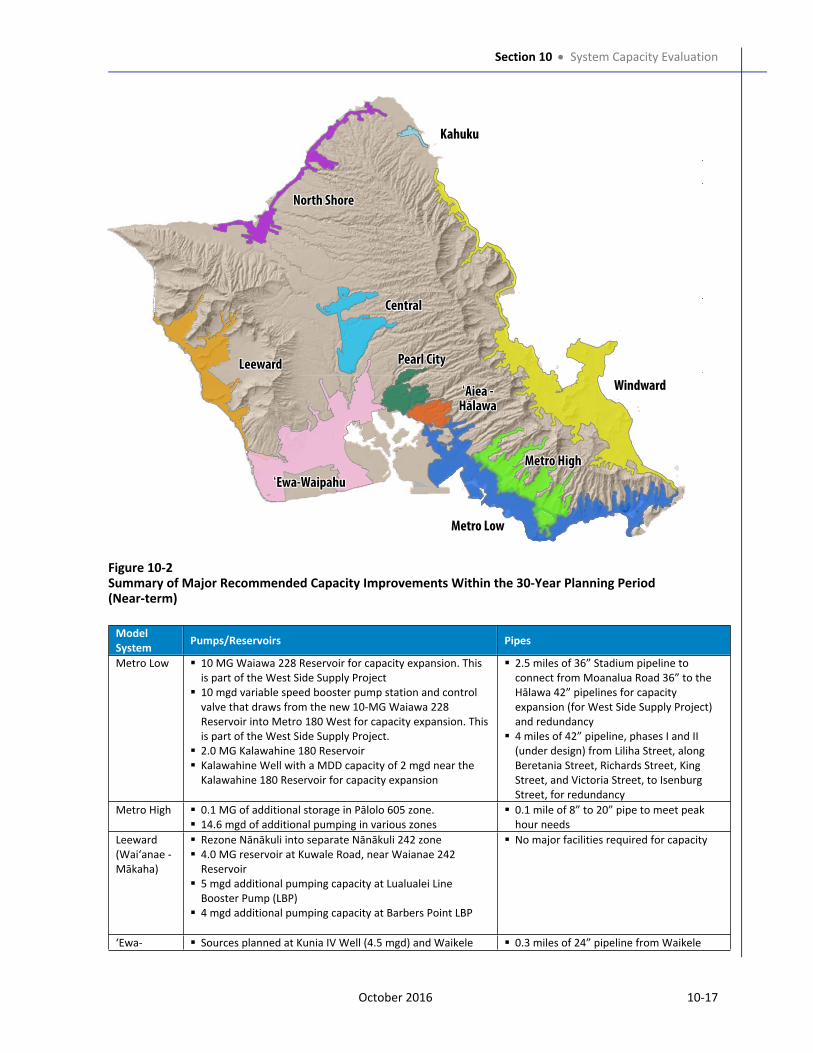
Section 10 System Capacity Evaluation
October 2016 10-17
Figure 10-2Summary of Major Recommended Capacity Improvements Within the 30-Year Planning Period(Near-term)
Model
SystemPumps/Reservoirs Pipes
Metro Low 10 MG Waiawa 228 Reservoir for capacity expansion. This
is part of the West Side Supply Project
10 mgd variable speed booster pump station and control
valve that draws from the new 10-MG Waiawa 228
Reservoir into Metro 180 West for capacity expansion. This
is part of the West Side Supply Project.
2.0 MG Kalawahine 180 Reservoir
Kalawahine Well with a MDD capacity of 2 mgd near the
Kalawahine 180 Reservoir for capacity expansion
2.5 miles of 36” Stadium pipeline to
connect from Moanalua Road 36” to the
Hālawa 42” pipelines for capacity
expansion (for West Side Supply Project)
and redundancy
4 miles of 42” pipeline, phases I and II
(under design) from Liliha Street, along
Beretania Street, Richards Street, King
Street, and Victoria Street, to Isenburg
Street, for redundancy
Metro High 0.1 MG of additional storage in Pālolo 605 zone.
14.6 mgd of additional pumping in various zones
0.1 mile of 8” to 20” pipe to meet peak
hour needs
Leeward
(Wai‘anae -
Mākaha)
Rezone Nānākuli into separate Nānākuli 242 zone
4.0 MG reservoir at Kuwale Road, near Waianae 242
Reservoir
5 mgd additional pumping capacity at Lualualei Line
Booster Pump (LBP)
4 mgd additional pumping capacity at Barbers Point LBP
No major facilities required for capacity
ʻEwa- Sources planned at Kunia IV Well (4.5 mgd) and Waikele 0.3 miles of 24” pipeline from Waikele
North ShoreNorth Shore
KahukuKahuku
LeewardLeeward
ʻEwa-WaipahuʻEwa-Waipahu
Pearl CityPearl City
Metro HighMetro High
WindwardWindward
Metro LowMetro Low
CentralCentral
ʻAiea -HālawaʻAiea -
Hālawa
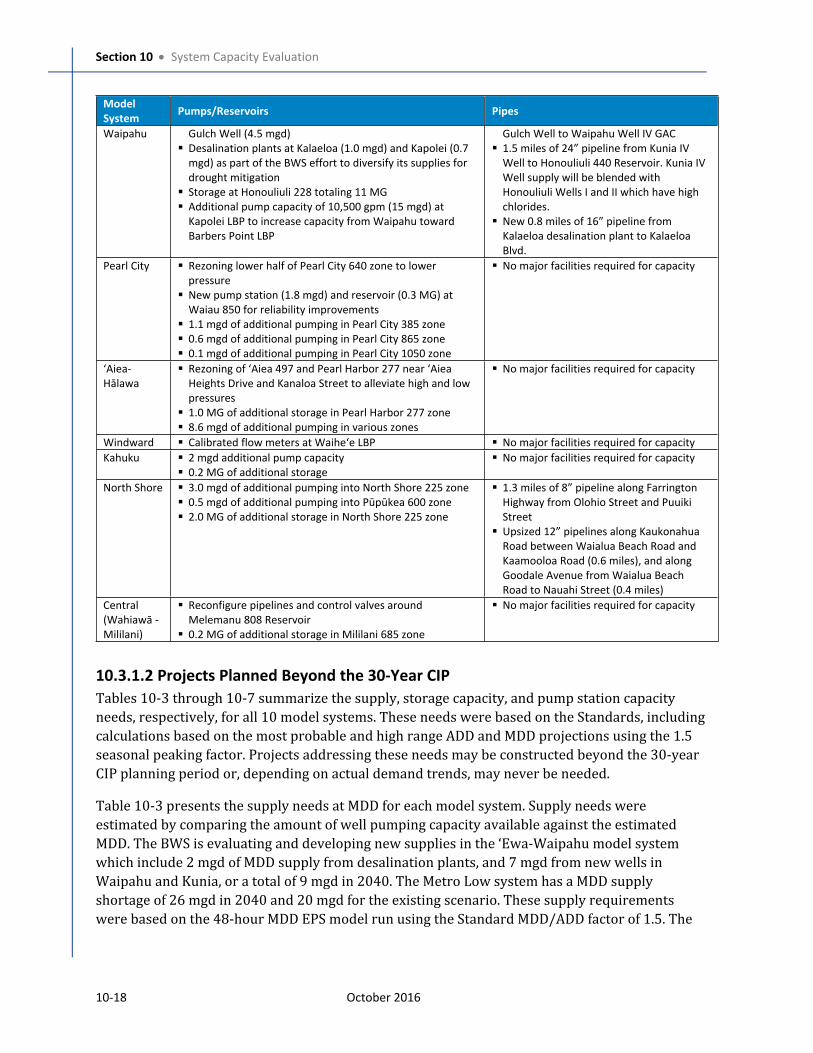
Section 10 System Capacity Evaluation
10-18 October 2016
Model
SystemPumps/Reservoirs Pipes
Waipahu Gulch Well (4.5 mgd)
Desalination plants at Kalaeloa (1.0 mgd) and Kapolei (0.7
mgd) as part of the BWS effort to diversify its supplies for
drought mitigation
Storage at Honouliuli 228 totaling 11 MG
Additional pump capacity of 10,500 gpm (15 mgd) at
Kapolei LBP to increase capacity from Waipahu toward
Barbers Point LBP
Gulch Well to Waipahu Well IV GAC
1.5 miles of 24” pipeline from Kunia IV
Well to Honouliuli 440 Reservoir. Kunia IV
Well supply will be blended with
Honouliuli Wells I and II which have high
chlorides.
New 0.8 miles of 16” pipeline from
Kalaeloa desalination plant to Kalaeloa
Blvd.
Pearl City Rezoning lower half of Pearl City 640 zone to lower
pressure
New pump station (1.8 mgd) and reservoir (0.3 MG) at
Waiau 850 for reliability improvements
1.1 mgd of additional pumping in Pearl City 385 zone
0.6 mgd of additional pumping in Pearl City 865 zone
0.1 mgd of additional pumping in Pearl City 1050 zone
No major facilities required for capacity
‘Aiea-
Hālawa Rezoning of ‘Aiea 497 and Pearl Harbor 277 near ‘Aiea
Heights Drive and Kanaloa Street to alleviate high and low
pressures
1.0 MG of additional storage in Pearl Harbor 277 zone
8.6 mgd of additional pumping in various zones
No major facilities required for capacity
Windward Calibrated flow meters at Waihe‘e LBP No major facilities required for capacity
Kahuku 2 mgd additional pump capacity
0.2 MG of additional storage
No major facilities required for capacity
North Shore 3.0 mgd of additional pumping into North Shore 225 zone
0.5 mgd of additional pumping into Pūpūkea 600 zone
2.0 MG of additional storage in North Shore 225 zone
1.3 miles of 8” pipeline along Farrington
Highway from Olohio Street and Puuiki
Street
Upsized 12” pipelines along Kaukonahua
Road between Waialua Beach Road and
Kaamooloa Road (0.6 miles), and along
Goodale Avenue from Waialua Beach
Road to Nauahi Street (0.4 miles)
Central
(Wahiawā -
Mililani)
Reconfigure pipelines and control valves around
Melemanu 808 Reservoir
0.2 MG of additional storage in Mililani 685 zone
No major facilities required for capacity
10.3.1.2 Projects Planned Beyond the 30-Year CIP
Tables 10-3 through 10-7 summarize the supply, storage capacity, and pump station capacity
needs, respectively, for all 10 model systems. These needs were based on the Standards, including
calculations based on the most probable and high range ADD and MDD projections using the 1.5
seasonal peaking factor. Projects addressing these needs may be constructed beyond the 30-year
CIP planning period or, depending on actual demand trends, may never be needed.
Table 10-3 presents the supply needs at MDD for each model system. Supply needs were
estimated by comparing the amount of well pumping capacity available against the estimated
MDD. The BWS is evaluating and developing new supplies in the ‘Ewa-Waipahu model system
which include 2 mgd of MDD supply from desalination plants, and 7 mgd from new wells in
Waipahu and Kunia, or a total of 9 mgd in 2040. The Metro Low system has a MDD supply
shortage of 26 mgd in 2040 and 20 mgd for the existing scenario. These supply requirements
were based on the 48-hour MDD EPS model run using the Standard MDD/ADD factor of 1.5. The
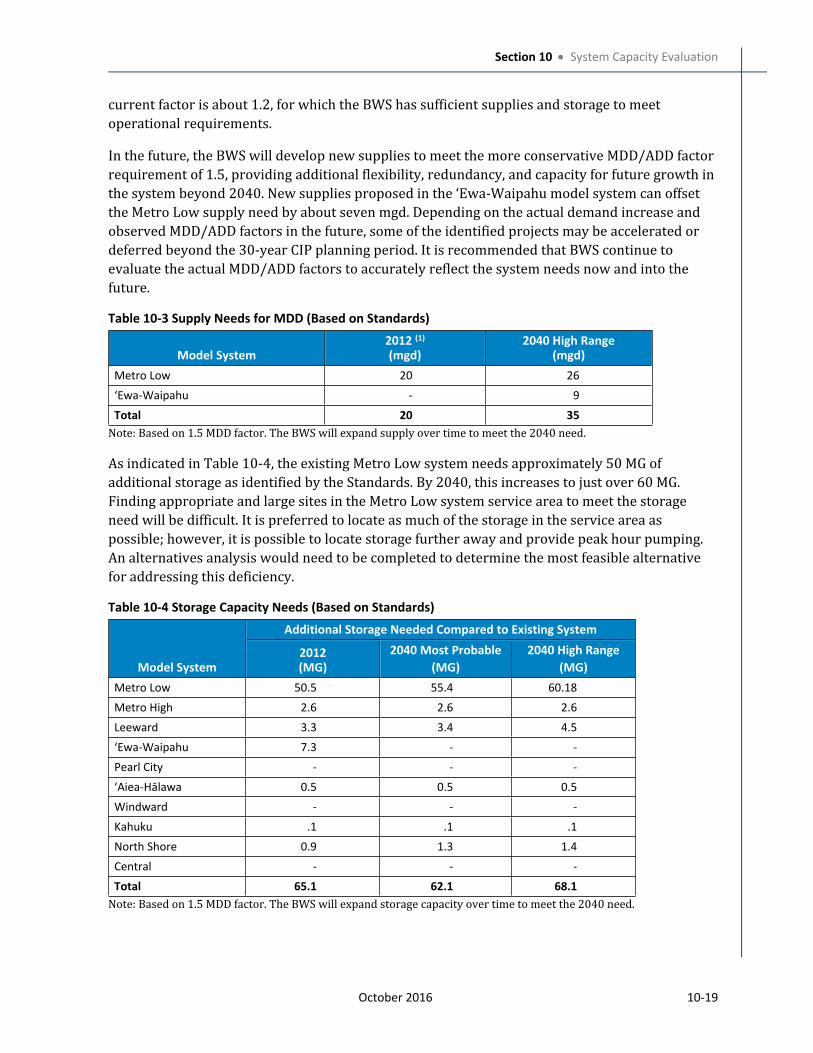
Section 10 System Capacity Evaluation
October 2016 10-19
current factor is about 1.2, for which the BWS has sufficient supplies and storage to meet
operational requirements.
In the future, the BWS will develop new supplies to meet the more conservative MDD/ADD factor
requirement of 1.5, providing additional flexibility, redundancy, and capacity for future growth in
the system beyond 2040. New supplies proposed in the ‘Ewa-Waipahu model system can offset
the Metro Low supply need by about seven mgd. Depending on the actual demand increase and
observed MDD/ADD factors in the future, some of the identified projects may be accelerated or
deferred beyond the 30-year CIP planning period. It is recommended that BWS continue to
evaluate the actual MDD/ADD factors to accurately reflect the system needs now and into the
future.
Table 10-3 Supply Needs for MDD (Based on Standards)
Model System2012 (1)
(mgd) 2040 High Range
(mgd)
Metro Low 20 26
‘Ewa-Waipahu - 9
Total 20 35
Note: Based on 1.5 MDD factor. The BWS will expand supply over time to meet the 2040 need.
As indicated in Table 10-4, the existing Metro Low system needs approximately 50 MG of
additional storage as identified by the Standards. By 2040, this increases to just over 60 MG.
Finding appropriate and large sites in the Metro Low system service area to meet the storage
need will be difficult. It is preferred to locate as much of the storage in the service area as
possible; however, it is possible to locate storage further away and provide peak hour pumping.
An alternatives analysis would need to be completed to determine the most feasible alternative
for addressing this deficiency.
Table 10-4 Storage Capacity Needs (Based on Standards)
Additional Storage Needed Compared to Existing System
Model System2012(MG)
2040 Most Probable
(MG)
2040 High Range
(MG)
Metro Low 50.5 55.4 60.18
Metro High 2.6 2.6 2.6
Leeward 3.3 3.4 4.5
‘Ewa-Waipahu 7.3 - -
Pearl City - - -
‘Aiea-Hālawa 0.5 0.5 0.5
Windward - - -
Kahuku .1 .1 .1
North Shore 0.9 1.3 1.4
Central - - -
Total 65.1 62.1 68.1
Note: Based on 1.5 MDD factor. The BWS will expand storage capacity over time to meet the 2040 need.
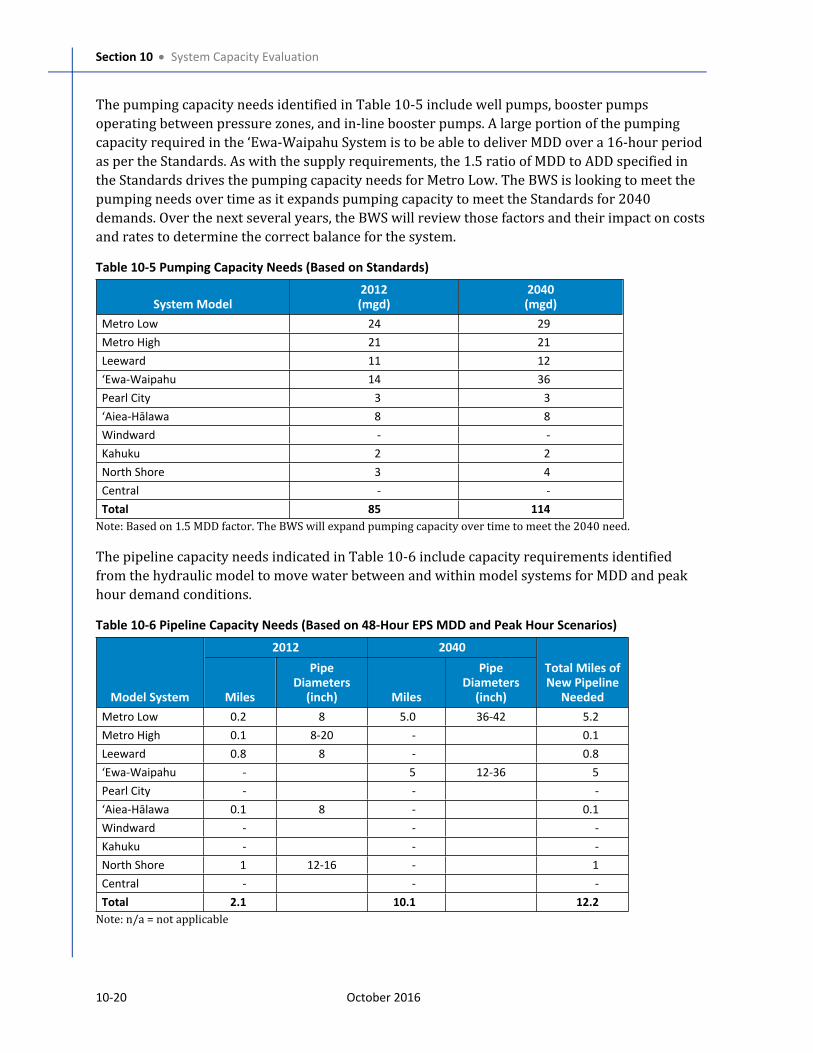
Section 10 System Capacity Evaluation
10-20 October 2016
The pumping capacity needs identified in Table 10-5 include well pumps, booster pumps
operating between pressure zones, and in-line booster pumps. A large portion of the pumping
capacity required in the ‘Ewa-Waipahu System is to be able to deliver MDD over a 16-hour period
as per the Standards. As with the supply requirements, the 1.5 ratio of MDD to ADD specified in
the Standards drives the pumping capacity needs for Metro Low. The BWS is looking to meet the
pumping needs over time as it expands pumping capacity to meet the Standards for 2040
demands. Over the next several years, the BWS will review those factors and their impact on costs
and rates to determine the correct balance for the system.
Table 10-5 Pumping Capacity Needs (Based on Standards)
System Model2012 (mgd)
2040 (mgd)
Metro Low 24 29
Metro High 21 21
Leeward 11 12
‘Ewa-Waipahu 14 36
Pearl City 3 3
‘Aiea-Hālawa 8 8
Windward - -
Kahuku 2 2
North Shore 3 4
Central - -
Total 85 114
Note: Based on 1.5 MDD factor. The BWS will expand pumping capacity over time to meet the 2040 need.
The pipeline capacity needs indicated in Table 10-6 include capacity requirements identified
from the hydraulic model to move water between and within model systems for MDD and peak
hour demand conditions.
Table 10-6 Pipeline Capacity Needs (Based on 48-Hour EPS MDD and Peak Hour Scenarios)
2012 2040
Model System Miles
Pipe Diameters
(inch) Miles
Pipe Diameters
(inch)
Total Miles of New Pipeline
Needed
Metro Low 0.2 8 5.0 36-42 5.2
Metro High 0.1 8-20 - 0.1
Leeward 0.8 8 - 0.8
‘Ewa-Waipahu - 5 12-36 5
Pearl City - - -
‘Aiea-Hālawa 0.1 8 - 0.1
Windward - - -
Kahuku - - -
North Shore 1 12-16 - 1
Central - - -
Total 2.1 10.1 12.2
Note: n/a = not applicable
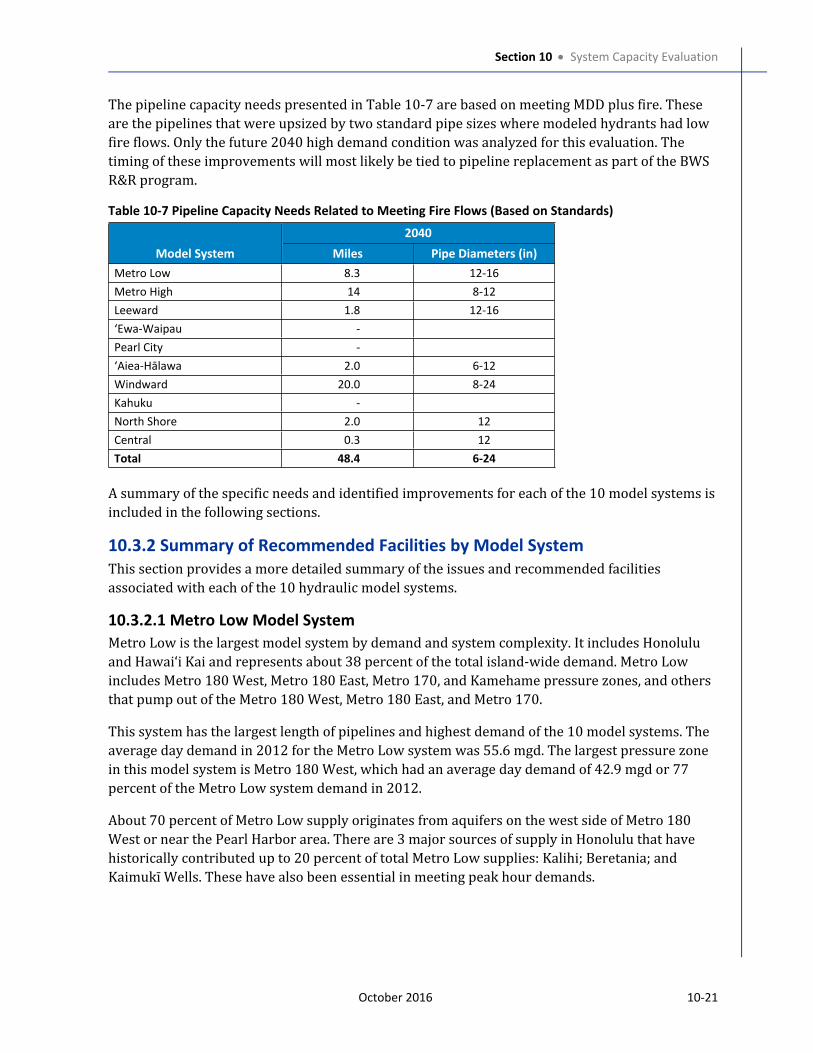
Section 10 System Capacity Evaluation
October 2016 10-21
The pipeline capacity needs presented in Table 10-7 are based on meeting MDD plus fire. These
are the pipelines that were upsized by two standard pipe sizes where modeled hydrants had low
fire flows. Only the future 2040 high demand condition was analyzed for this evaluation. The
timing of these improvements will most likely be tied to pipeline replacement as part of the BWS
R&R program.
Table 10-7 Pipeline Capacity Needs Related to Meeting Fire Flows (Based on Standards)
2040
Model System Miles Pipe Diameters (in)
Metro Low 8.3 12-16
Metro High 14 8-12
Leeward 1.8 12-16
‘Ewa-Waipau -
Pearl City -
‘Aiea-Hālawa 2.0 6-12
Windward 20.0 8-24
Kahuku -
North Shore 2.0 12
Central 0.3 12
Total 48.4 6-24
A summary of the specific needs and identified improvements for each of the 10 model systems is
included in the following sections.
10.3.2 Summary of Recommended Facilities by Model System
This section provides a more detailed summary of the issues and recommended facilities
associated with each of the 10 hydraulic model systems.
10.3.2.1 Metro Low Model System
Metro Low is the largest model system by demand and system complexity. It includes Honolulu
and Hawaiʻi Kai and represents about 38 percent of the total island-wide demand. Metro Low
includes Metro 180 West, Metro 180 East, Metro 170, and Kamehame pressure zones, and others
that pump out of the Metro 180 West, Metro 180 East, and Metro 170.
This system has the largest length of pipelines and highest demand of the 10 model systems. The
average day demand in 2012 for the Metro Low system was 55.6 mgd. The largest pressure zone
in this model system is Metro 180 West, which had an average day demand of 42.9 mgd or 77
percent of the Metro Low system demand in 2012.
About 70 percent of Metro Low supply originates from aquifers on the west side of Metro 180
West or near the Pearl Harbor area. There are 3 major sources of supply in Honolulu that have
historically contributed up to 20 percent of total Metro Low supplies: Kalihi; Beretania; and Kaimukī Wells. These have also been essential in meeting peak hour demands.
Section 10 System Capacity Evaluation
10-22 October 2016
A total of 38 MG of storage exists for the entire Metro Low system. Most of the storage is in the
upper zones. However, Metro 180 West, the largest zone in the Metro Low model system, has a
relatively small volume of storage, 13 MG, compared to the amount of demand served by the
zone. This has been adequate because of reliance on wells in the area to supply peak demands.
The subsections below summarize the issues associated with meeting the existing and future
needs for Metro Low, as well as the recommended projects to address these needs.
Existing System
The current system provides adequate and reliable water service to the customers.
Needs Based on Standards
To meet the Standards with the 2040 high range demand estimate, significant new facilities must
be added in Metro Low: 55 MG of additional storage; 29 mgd of additional pumping capacity; 26
mgd of additional supply sources; and 8.3 miles of upsized pipelines for fire flow.
The 26-mgd shortfall in supply was obtained from the 48-hour MDD EPS model run which was
based on the 2040 high range demand estimate with a MDD of 1.5 multiplied by the ADD. For
Metro Low, the high range estimate for 2040 is 62 mgd ADD and 93 mgd MDD. Source pumping
currently available per BWS Operations staff was 67 mgd, which also includes a reduction in
pumping from wells in Honolulu that potentially have increasing chloride levels. The BWS intends
to proactively restrict peak pumping of specific key wells in Honolulu to protect the freshwater
lens of the aquifers during droughts. Thus, the difference between 2040 MDD (93 mgd) and
source pumping available (67 mgd) is 26 mgd.
The drivers affecting the pumping need include:
1. Standards for pump capacity are based on a 16-hour pumping rate instead of a 24-hour
pumping rate;
2. Using the more conservative high range 2040 ADD, rather than the most probable 2040
ADD; and
3. The use of an MDD to ADD ratio of 1.5 as stated in the Standards as opposed to a 1.15
ratio as seen historically.
Near-Term Improvements
The need for these additional facilities is highly dependent on whether the actual demands reach
the projected demands. Thus, the recommended strategy is to monitor actual MDD relative to the
projected demands. If the actual demands are not on track to reach the projected demands, many
of the potential improvements can be postponed. Historical demand trends between 2010 and
2013 show that MDD has not been increasing quickly. Also, the MDD to ADD ratio has averaged
1.15 instead of the Standards ratio of 1.5. The MDD has remained below 65 mgd in the same time
period.
There is currently enough source pumping capacity to meet a MDD of up 67 mgd. Future supply
will not be needed until the actual MDD in Metro Low exceeds this level. When it does exceed 67
mgd, up to 7 mgd of surplus supply from ‘Ewa-Waipahu is expected to be available (as detailed in
Section 10 System Capacity Evaluation
October 2016 10-23
the Section 10.3.2.4), which can be transferred to Metro Low. An MDD demand of up to 74 mgd in
Metro Low (sum of 67 mgd and 7 mgd) can be met with the following recommended facilities:
1. West Side Supply Project, to bring additional MDD supply into the Metro Low service area
from ‘Ewa-Waipahu:
a. 10-MG reservoir in West Primary Urban Center (New Waiawa 228 Reservoir).
b. 10-mgd variable-speed pump station that draws from the New Waiawa 228 Reservoir
and pumps into Metro 180 West. The hydraulic grade line at the west end of Metro
180 currently reaches about 225 feet during MDD conditions. With higher future
demands, the HGL is expected to increase above the top of the reservoir level of 228
feet.
c. Control valve in parallel with the new variable speed pump to allow gravity flow from
the reservoir into Metro 180 West during lower demand conditions.
d. 12,700 feet of new 36-inch diameter pipeline near the Aloha Stadium to connect the
existing parallel 36-inch pipelines along Kamehameha Highway near Pali Momi Street
to the 42-inch transmission pipeline downstream of Hālawa Shaft. This adds
transmission capacity of the source well supply in the Pearl Harbor area by
connecting to the Hālawa 42-inch transmission pipeline.
2. 42-inch pipeline (11,000 feet) along Beretania Street from Liliha Street to Richard Street,
along Richard Street from Beretania Street to King Street, along King Street to Victoria Street,
and along Victoria Street to Kinau Street which is a planned Phase I of a project in design, and
also included in the existing evaluation scenario of the hydraulic model. Phase II identifies a
continuation of the new 42-inch pipeline (9,000 feet) along King Street from Victoria Street to
Isenberg Street. Phases I and II will add redundant capacity to an existing 42-inch pipeline.
Also note that the 42-inch pipelines near Liliha Street and Vineyard Boulevard should be
connected.
3. 2-MG Kalawahine 180 Reservoir, as listed in the BWS 6-year CIP.
4. Kalawahine Well with a MDD capacity of 2 mgd near the Kalawahine 180 Reservoir.
Intermediate Improvements
MDD demands should be monitored annually. If the trend shows that MDD demands in Metro
Low will exceed 74 mgd within 10 years, then the following additional facilities will be needed.
This level of demand is expected to occur beyond the master planning horizon of 2040 according
to current trends, and thus will not be incorporated into the CIP. If the trend begins to increase
later, the CIP can be revised.
1. Replace the existing pumps at Diamond Head LBP that have a total dynamic head (TDH)
of 33 feet with higher TDH pumps. A TDH of 85 feet is needed to pump to the suction side
of Kuli‘ou‘ou due to decommissioning of Wailupe LBP.
Section 10 System Capacity Evaluation
10-24 October 2016
2. Kuli‘ou‘ou LBP: one additional 4,000-gpm pump is needed (may be offset by the amount of
supply brought over from the Windward side).
Long-Term Improvements
Potential alternative solutions for mitigating the additional supply need include:
1. Developing new groundwater wells in Metro Low system. The site locations, hydraulic
capacity, and potential impact on staying within the current and potential pumping limits
will need to be evaluated.
2. Increasing supply transfers from other areas (i.e., Central Land Use District, Waipahu Wells,
and from the Windward area). This will require increases in transmission facilities.
3. Increasing conservation and reducing per capita usage. This may require implementing more
aggressive conservation measures and developing programs to incentivize the
implementation of these measures.
4. Capturing surface water for more direct recharge into the groundwater basins. The feasibility
of this alternative will need to be evaluated.
5. Diversifying supplies by adding brackish or seawater desalination projects in Honolulu.
Potential cost impacts of these alternatives will need to be evaluated.
If needed, the technical and financial feasibility of these alternatives will need to be evaluated.
Per the Standards, there is an existing storage need of about 51 MG, increasing in the future to
about 55 MG, in the Metro 180 West zone. This can be partially offset by the new 10-MG Waiawa
228 Reservoir recommended above and the 2-MG Kalawahine 180 Reservoir. A significant
amount of storage is still required by the Standards. The land required for this amount of
additional storage may be difficult to identify as the area is already highly developed. There is
very little vacant land at the correct elevations to build additional storage. The BWS initiated
studies in 2005 and 2006 to evaluate potential locations with a 180-foot overflow elevation. The
studies did not evaluate ground-level storage with pumping. In general, siting reservoirs in Metro
Low is very difficult and expensive. Makiki 180 Reservoir is adjacent to a park which may
accommodate an additional 2 MG of storage, but not nearly enough to meet the full storage need.
If eventually needed, there are other potential ways to address the impacts of lack of storage,
such as the following:
1. Additional storage near the recommended Waiawa 228 Reservoir could be developed,
which builds on the recommended 10-MG Waiawa Reservoir solution described above.
This alternative would require increased pumping and transmission from the west into
Honolulu.
2. Pumping from new wells can be used to meet peak hour demands. For reliability, wells
intended to offset the storage requirements are recommended to be equipped with standby
power.
Section 10 System Capacity Evaluation
October 2016 10-25
3. A reservoir that is below the operating elevation of 180 can be utilized with a pressure
sustaining valve that fills the reservoir and a pump that can draw water out of the reservoir
back into the system.
4. A combination of the approaches identified above.
One of the functions of a reservoir is to meet peak hour demands during the day. When hourly
demands are high, the reservoir drains to meet these demands. When demand decreases at night,
the pumps refill the tanks for the next day. Alternatively, well pumps can be used to meet peak
hour demands. This is how Metro 180 West currently operates and is expected to continue to do
so in the future. Pumping during peak hour can introduce pressure spikes that in turn can
contribute to main breaks.
It is important that all well pumps being used to meet peak hour demands are equipped with
standby power; just as an elevated reservoir can meet peak hour demands if power is not
available, a well pump with standby power can meet the same peak hour demands.
In case demands increase at a faster rate than predicted, additional alternatives to meet the 2040
high range MDD are possible. The following potential alternatives to meeting the 2040 high range
MDD conditions all meet the peak hour demand from facilities located within Metro 180 West
service area as opposed to from the west side of the service area.
1. Metro 180 Alternative Storage Project: Reservoirs near Diamond Head (possible locations
are buried inside Diamond Head Crater or on the outer circumference at ground level) at
the proper operating grade line of 180 feet or below the grade line with booster pumps.
A reservoir near Diamond Head might be situated at the operating grade line of 180 feet
or at a lower elevation with a booster pump that draws from the tank and pumps into the
Metro 180 West system. A reservoir at the operating grade line is easier to operate and
maintain. However, finding suitable (size and elevation) and available property may be
challenging. A possible location for additional storage is at the existing Makiki 180
Reservoir. If locations at 180 feet elevation are not available, a lower elevation location
with a pump could be used to boost the reservoir supply into the zone. The trade-off
between obtaining property and the cost and potential operational impacts of this type of
operation will need to be evaluated.
This reservoir will reduce the peak hour pumping of the existing well pumps located in
Metro 180 West. The west side sources will continue to provide MDD, but can reduce the
peak hour pumping load by the amount that the ground-level reservoirs can contribute to
the peak hour demands.
Peak hour demands will be met by pumping out of the ground-level storage reservoir
during the peak demand hours. It would be filled during the low demand hours of a 24-
hour period. A transmission pipeline from the reservoir or pump station discharge is
needed to connect to a large transmission main within the Metro 180 West network.
Benefits include increased reliability of having storage closer to the Metro 180 service
area and reducing peak pumping at the existing wells including Kaimukī and Beretania
pump stations.
Section 10 System Capacity Evaluation
10-26 October 2016
Peak flows from existing wells on the west side through the transmission lines will also be
reduced. Meeting peak demands from storage within the Metro 180 West service area will
also allow the pressure to be better balanced between the west and east side of Metro 180
West during high demands.
2. Aquifer Storage at Existing Wells Alternative: Aquifer storage and recovery at Beretania
or Kaimukī Wells (existing wells or new shallow injection wells).
Recharging wells, and constructing new peaking wells within the Metro 180 service area
may be an alternative to building additional reservoirs. Aquifers for Beretania Wells or Kaimukī Wells may possibly be recharged by transferring supply from aquifers near Pearl
Harbor during the low demand seasons and pumping the supply through the existing
Metro 180 West transmission system. Then during the high demand season, supply stored
in aquifers for Beretania Well and Kaimukī Well can be used for Metro Low and/or Metro
High. Benefits include: 1) during high demands, the supply is drawn from wells that are
located within the service area, reducing transmission capacity needed from the west
side; 2) peak demand hours during high demand days can be met from the wells; and 3)
transmission mains already exist to these wells.
Significant further study is needed to determine the feasibility of this alternative. Among
the uncertainties that need further study are: the rate of injection that is possible; the rate
of recovery of the injected supply; and the effect of injection on the water quality of the
aquifer.
3. Aquifer Storage at New Wells Alternative: Recharge at potential new wells up-gradient in
the aquifer to the wells within the service area.
This is similar to the Aquifer Storage at Existing Wells Alternative except that the injection
will occur at new wells up-gradient, but in the same aquifer as the wells that peaking
supply would be drawn from. For example, Palolo Well is in the same aquifer and up-
gradient of Kaimuki Wells. Similar benefits and unknowns apply. An additional cost is that
new transmission pipelines are needed to connect from the existing transmission
pipelines to the new wells.
Further evaluation and tracking of demands and peaking factors may result in modifying the
above projects, as may future studies addressing potential future reservoir siting and feasibility
constructing additional peaking wells.
Recommended Improvements for 30-Year CIP
1. West Side Supply Project:
a. 10-MG Waiawa 228 Reservoir for capacity expansion.
b. 10-mgd variable speed booster pump station and control valve that draws from
the new 10-MG Waiawa 228 Reservoir into Metro 180 West for capacity
expansion.
Section 10 System Capacity Evaluation
October 2016 10-27
c. 36-inch Stadium pipeline to connect from Punanani pipeline to Hālawa pipeline.
This pipeline also improves redundancy.
2. 42-inch pipeline, phases I and II as planned in the BWS 6-year CIP, along Beretania Street,
Richards Street, King Street, and Victoria Street, for redundancy
3. 2-MG Kalawahine 180 Reservoir as listed in the BWS 6-year CIP, for capacity expansion.
4. Kalawahine Well with a MDD capacity of 2 mgd near the Kalawahine 180 Reservoir, for
capacity expansion.
10.3.2.2 Metro High Model System
The Metro High model system, which includes Metro 405 and the upper zones that are supplied
by Metro 405, had an average day demand of 12.3 mgd in 2012. No growth is anticipated in this
system. The largest zone in this model system is Metro 405, which had an average day demand of
9.6 mgd, or 78 percent of the total for this system. ‘Āina Koa 1370 in Metro High system is the
highest elevation zone in the BWS system.
About 70 percent of the supply was pumped from three wells – Kalihi, Beretania, and Kaimukī Wells. Alternative supply options for this model system are limited. In addition to these three
wells, there are several smaller wells that supply the system.
Existing System
The current system provides adequate and reliable water service to customers.
Needs Based on Standards
Per the Standards, 21 mgd of additional pumping capacity is needed at various pressure zones.
However, for a 24-hour pumping schedule as modeled for MDD, the existing pumping capacity is
sufficient to serve the system.
Recommended Improvements for 30-Year CIP
1. 0.1 MG of additional storage in Pālolo 605.
2. 14.6 mgd of additional pumping in various zones.
3. 0.1 mile of 8-inch to 20-inch diameter pipe to meet peak hour needs.
4. 14 miles of 8-inch to 12-inch diameter pipe to meet MDD plus fire.
10.3.2.3 Leeward Model System
The Leeward system had an average day demand of 10.1 mgd in 2012. The largest zone in this
system is Waiʻanae 242 which had an average day demand of 8.7 mgd, or 86 percent of the
Leeward system demand. The Waiʻanae 242 pressure zone is hydraulically separated into two
areas by Lualualei LBP station. Storage on the suction side includes Nānākuli 242 and Lualualei
242 reservoirs. The discharge side of Lualualei LBP includes Waiʻanae 242 and Mākaha 242
reservoirs.
Section 10 System Capacity Evaluation
10-28 October 2016
Needs Based on Standards
Using the 2040 most probable demands, future needs include 3.5 MG of additional storage in the Waiʻanae 242 pressure zone, which is necessary to meet the Standards. Possible locations for a
reservoir include Kuwale Road, which has sufficient undeveloped area and is near the existing
Waianae 242 Reservoir, or near the existing Mākaha 242 Reservoirs. Because Kuwale Road is
more centrally located within the Waianae 242 zone, 2.5 MG of storage is recommended at
Kuwale Road, and 1.0 MG of new storage is recommended at the Mākaha site. Per the Standards,
11.6 mgd of additional pumping capacity is needed at various pressure zones.
Near-Term Improvements
For a 24-hour pumping schedule as modeled for 2040 high range demand estimate, a smaller
total additional pumping capacity is recommended: 4 mgd additional at Barbers Point LBP and 5
mgd additional at Lualualei LBP.
An additional 4.0 MG of storage is needed in the Wai‘anae 242 zone.
Also recommended is converting the Nānākuli neighborhood, which is currently in the Waiʻanae
242 pressure zone, into a separate zone such that the pressure is regulated by the Nānākuli 242
Reservoir only. This has multiple benefits including allowing Lualualei 242 Reservoir to be filled
by Barbers Point LBP and having better control of pressures at Nānākuli area.
Recommended Improvements for 30-Year CIP
1. Rezone Nānākuli into separate Nānākuli 242 zone.
2. 4.0 MG reservoir at Kuwale Road, near Waianae 242 Reservoir.
3. 5 mgd additional pumping capacity at Lualualei LBP.
4. 4 mgd additional pumping capacity at Barbers Point LBP.
10.3.2.4 ‘Ewa-Waipahu Model System
The ‘Ewa-Waipahu model system had a total average day demand in 2012 of 27.7 mgd. The
largest zone in this model system is Pearl Harbor 228 (Waipahu-Kunia-Honouliuli 228) which
had an average day demand of 11.9 mgd, or 43 percent of the total demand for this system. The
second largest zone is ‘Ewa 215 (Barber's Point-Kapolei 215) which had an average day demand
of 7.3 mgd, or 27 percent of the total demand for this system. The current facilities provide
sufficient and reliable water service to the existing customers.
Needs Based on Standards
To meet the Standards with the 2040 high demand estimate, 36 mgd of additional pumping
capacity, additional storage planned by the BWS, and additional sources planned by the BWS are
needed to supplement Leeward and Metro Low demands. The 36 mgd of additional pumping
capacity needed to meet the Standards is recommended as a long-term improvement project,
which is beyond the timeframe of the 30-year CIP.
Section 10 System Capacity Evaluation
October 2016 10-29
Near-Term Improvements
The ADD demand in the ‘Ewa-Waipahu system is projected to increase from 27.7 mgd in 2012 to
40.8 mgd ADD in 2040 high range projection, which is the highest demand increase out of the 10
model systems. Most of this growth will be due to new developments planned in the master plan
areas and also in the TODs, which are in the ‘Ewa-Waipahu system.
The MDD in the ‘Ewa-Waipahu system is expected to increase from 32.7 mgd in 2012 to 48.5 mgd
by 2040 under the high range projection. The total existing MDD supply is 82.7 mgd under MDD
conditions. This MDD supply assumes 10 mgd MDD supply is available from ʻEwa Shaft.
In order to meet its MDD demand by 2040, the Leeward system will need 11.5 mgd of MDD
supply transferred from the Waipahu area via Barbers Point LBP. Possible new sources are
already planned to be developed. The new sources, along with the estimated MDD supply, are
listed below.
1. Kunia IV – 4.5 mgd (4 new wells at 1.5 mgd each – 3 mgd for ADD, 4.5 mgd for MDD)
2. Waikele Gulch – 4.5 mgd (4 new wells at 1.5 mgd each – 3 mgd for ADD, 4.5 mgd for MDD)
3. Kalaeloa desalination plant – 1 mgd ADD and MDD
4. Kapolei desalination plant – 0.7 mgd ADD, 1 mgd MDD
Recommended Improvements for 30-Year CIP
1. Sources planned at Kunia IV Well, Waikele Gulch Well.
2. Desalination plants at Kalaeloa (1.0 mgd) and Kapolei (0.7 mgd) as part of the BWS effort to
diversify its supplies for drought mitigation.
3. 0.3 miles of 24–inch pipeline from Waikele Gulch Well to Waipahu Well IV GAC.
4. 1.5 miles of 24-inch pipeline from Kunia IV Well to Honouliuli 440 Reservoir. Kunia IV Well
supply will be blended with Honouliuli Wells I and II which have high chlorides.
5. 0.8 miles of 16-inch pipeline from recommended Kalaeloa desalination plant to existing 12-
inch pipeline on Kalaeloa Boulevard.
6. Storage at Honouliuli 228 totaling 11 MG, which has been identified in the BWS’s long-range
plans.
7. Additional pump capacity of 10,500 gpm (15 mgd) at Kapolei LBP to increase capacity from
Waipahu toward Barbers Point LBP.
10.3.2.5 Pearl City Model System
The Pearl City model system had a total average day demand of 5.1 mgd. The largest zone in this
model system is Pearl Harbor 285, which had an average day demand of 2.5 mgd, or 49 percent of
the total demand for this system. Four reservoirs in the Pearl City 285 zone are spread across the
zone. Pearl City 285 Reservoirs 1 and 2 are in an area where the majority of Pearl City 285
demands are located. Waiau 285 and Newtown 285 Reservoirs are in the central and east areas,
Section 10 System Capacity Evaluation
10-30 October 2016
respectively, which have smaller demands. Pearl City Wells I and Pearl City Shaft pump into the
pressure zone near Pearl City 285 Reservoir.
Needs Based on Standards
Based on the Standards, an additional 3 mgd of pumping is required at various pressure zones
within the Pearl City model system for existing and future conditions.
Near-Term Improvements
Capacity-related pipeline improvements are not needed. The lower elevation half of the Pearl City
640 pressure zone, including Hoona Street at a ground elevation of 290 feet, operates at
pressures higher than 125 psi, which is above recommended operating pressures. Historically
there have been numerous pipe breaks in this part of the pressure zone. Partitioning this area
with PRVs is recommended so that it will operate at a lower pressure, decreasing pipe breaks.
From the discharge of Pearl City Booster I, one pipeline feeds the northern half of Pearl City 640
via Komo Mai Drive. A branch off the discharge pipeline on Waimano Home Road feeds the
southern half of the zone. This is where a PRV can be installed to reduce the high pressure
experienced in the lower part of the zone.
The Waiau 850 zone serves residential neighborhoods spanning three ridges with a 16-inch
pipeline crossing a valley between the northern ridge (Waiau) and the center ridge (Newtown),
and a 12-inch pipeline crossing the valley between the center ridge and southern most ridge
(Royal Summit). Pipelines in both valley crossings are difficult to access and maintain due to the
wooded and steep terrain. Waiau Booster No. 2 is the only supply and Waiau 850 Reservoir is the
only storage in the zone. Both are on the Waiau ridge, so a break on either the 16-inch or the 12-
inch cross-country mains would cut off service to Royal Summit and possibly Newtown ridges.
To improve reliability, a new reservoir (0.3 MG) on Royal Summit and a new pump station (2
pumps at 625 gpm each) is recommended. The additional reservoir and pump station, provide
redundancy for the Royal Summit and Newtown Ridge 850 zones.
A total of 1.8 mgd of additional pumping is needed in various pressure zones using historical
MDD factors.
Recommended Improvements for 30-Year CIP
1. Rezoning lower half of Pearl City 640 zone to lower pressure.
2. 1.8 mgd pump station and 0.3 MG reservoir on Royal Summit in Waiau 850.
3. 1.1 mgd of additional pumping in Pearl City 385 zone.
4. 0.6 mgd of additional pumping in Pearl City 865 zone.
5. 0.1 mgd of additional pumping in Pearl City 1050 zone.
10.3.2.6 ‘Aiea-Hālawa Model System
The ‘Aiea-Hālawa model system had a total average day demand in 2012 of 3.3 mgd, with 60
percent of demand in Pearl Harbor 277 which serves the Pearl Ridge Center along Pearl Harbor.
Section 10 System Capacity Evaluation
October 2016 10-31
The incline along Kaonohi Street, ‘Aiea Heights, and the Hālawa neighborhood are included in this
distribution system.
Needs Based on Standards
About 0.5 mgd of future growth is expected, and there is sufficient storage and pump capacity to
meet existing demands with current operations. However, per the Standards, 0.5 MG of additional
storage is needed in Hālawa 418, and 8.1 mgd of additional pumping capacity is needed in various
zones within the model system.
Near-Term Improvements
A four-block square neighborhood in the ‘Aiea 497 zone experiences pressure above the standard
operating limit of 125 psi, while the adjacent streets served by the Pearl Harbor 277 zone
experiences pressures below the standard minimum of 40 psi. Partitioning this area with PRVs
such that pressures in this area are within the pressure range suggested in the Standard is
recommended.
Due to the historical MDD factor being greater than 1.5, recommended improvements are actually
greater than those suggested by Standards; 8.6 mgd of additional pumping is needed in various
zones. There is excess storage in ʻAiea 497 and Kaʻamilo 497 to offset the storage deficit in Pearl
Harbor 277 via an existing control valve at Aiea Booster No. 1, and an emergency connection
point at Kaʻamilo Booster
Recommended Improvements for 30-Year CIP
1. Rezoning of ‘Aiea 497 and Pearl Harbor 277 near ‘Aiea Heights Drive and Kanaloa Street
to alleviate high and low pressures.
2. 1.0 MG of additional storage in Pearl Harbor 277 zone.
3. 8.6 mgd of additional pumping in various zones.
10.3.2.7 Windward Model System
The Windward model system had a total average day demand in 2012 of 18.7 mgd. The largest
zone in this model system is Windward 272, which had an average day demand of 14.0 mgd or 74
percent of the total demand for this system. Primary supplies into this zone include the Waiheʻe
pump set which draws suction from the Waiheʻe Tunnel pipeline, the Punaluʻu pump set that
draws suction from the Kahana 315 zone, Maunawili PRV that drops supply from the Windward
500 zone, and the Kāneʻohe Bay PRV that drops supply from the Luluku 500 zone.
Existing System
The majority of the Windward model system demands are south of the Waiheʻe LBP, while the
majority of pumped supply is from wells north of the line booster. Because a significant amount of
flow passes through the Waiheʻe LBP, it is important to have accurate flow meters at this location.
This will allow more accurate calculation of supply into the system as well as more accurate
water loss calculations.
Section 10 System Capacity Evaluation
10-32 October 2016
The Windward 500 and Luluku 500 zones are hydraulically independent pressure zones. There is
a control valve between the two zones but it is not typically operated. The larger of the two,
Windward 500 zone, is supplied by two tunnels and their adjacent wells which include Kahaluʻu
Tunnel and Well and Haʻikū Tunnel and Well. Some of the Luluku Tunnel and Well supply feeds
the Luluku 500 zone while the majority of the supply is passed through the Kaneohe Bay PRV into
Windward 272.
The Windward system demand is not expected to increase between 2012 and 2040; therefore,
there are no storage or pump station capacity needs.
Historical production from the Haʻikū and Kahaluʻu Tunnels has been below the permitted
amount. Because the estimated maximum day demand of 1.5 times the ADD is greater than the
actual historical maximum day demand, the modeled Windward system utilized supplies greater
than what was historically needed. Modeled tunnel flows were increased to be within but not
exceed permitted level. For the 2013 scenarios, supply up to the permitted amount was assumed
to be available from the tunnels, though the ability to produce this amount has not been tested in
the past.
Recommended Improvements for 30-Year CIP
1. Calibrated flow meters at Waihe‘e LBP.
10.3.2.8 Kahuku Model System
The Kahuku model system consists of one pressure zone with one reservoir and one well station.
It is the smallest model system with an existing ADD of 0.38 mgd and is hydraulically separate
from other BWS systems. Demands are expected to remain the same in the future.
Existing system demands have been met under current operations. However, according to the
Standards, 0.08 MG of additional storage and 1.7 mgd of additional pumping capacity are needed.
However, due to the historical MDD factor being greater than 1.5, recommended improvements
are actually greater than those suggested by Standards; 1.8 mgd of additional pumping and 0.12
MG of additional storage is needed.
Recommended Improvements for 30-Year CIP
1. 2 mgd of additional pumping.
2. 0.2 MG of additional storage.
10.3.2.9 North Shore Model System
The North Shore model system has an existing ADD of 3.8 mgd. The largest pressure zone in this
model system is North Shore 225, which had an average day demand of 2.7 mgd or 70 percent of
the total demand for this system. Operating grade lines range from 170 feet near the coast to 892
feet up the Pupukea Highlands. Most of the distribution system is situated along the coastline.
Near-Term Improvements
Waialua 225 Reservoir and Haleʻiwa 225 Reservoir serve the areas to the west of the reservoirs.
About two miles of pipe improvements are recommended to improve fire flows in areas where
the ground elevation is high relative to the reservoir elevations. An 8-inch pipeline along
Section 10 System Capacity Evaluation
October 2016 10-33
Farrington Highway between Olohio Street and Puuiki Street is recommended for fire flow
improvement and also forms a looped pipeline network on the west side of North Shore 225.
About 0.4 miles of 8-inch pipeline on Goodale Avenue from Waialua Beach Road to Nauahi Street
and 0.6 miles of 6-inch and 8-inch pipeline on Kaukonahua Road between Waialua Beach Road
and Kaamooloa Road are recommended for upsizing to 12-inch pipelines to improve pressures
during peak hour demands.
North Shore 225 has a storage need of 1.0 MG in 2040 using the most probable demand estimate
and historical MDD factors. This assumes that a 0.6 MG storage surplus in Kawela 228 is able to
back feed into North Shore 225 via Pupukea LBP station. The North Shore model system has a
total pumping need of 3.4 mgd for the 2040 most probable demand scenario.
Recommended Improvements for 30-Year CIP
1. 3.0 mgd of additional pumping into North Shore 225 zone.
2. 0.5 mgd of additional pumping into Pūpūkea 600 zone.
3. 2.0 MG of additional storage in North Shore 225 zone.
4. 1.3 miles of 8-inch pipeline along Farrington Highway from Olohio Street and Puuiki
Street, for fire flow conditions and redundancy.
5. 0.4 miles of 8-inch pipeline on Goodale Avenue from Waialua Beach Road to Nauahi Street
and 0.6 miles of 6-inch and 8-inch pipeline on Kaukonahua Road between Waialua Beach
Road and Kaamooloa Road, for peak hour demands.
10.3.2.10 Central Model System
The Central model system had a total average day demand in 2012 of 7.9 mgd. The largest zone in
this model system is Mililani 865, which had an average day demand of 2.4 mgd or 30 percent of
the total demand for this system. Wahiawā 1361 is the second highest pressure zone in the BWS
system in terms of ground elevation of the customers served. Existing facilities meet the
Standards for pumping and storage requirements. A PRV from Mililani 994 to Mililani 865 is
needed to allow excess storage in Mililani 1150 to offset a deficit in Mililani 865 and Mililani 685
zones.
Currently, Melemanu 808 Reservoir is locked out and not used because the hydraulic grade line
near the reservoir would cause the reservoir to overflow. Reconfiguration of pipelines and
control valves near the reservoir are needed such that it can become fully functional and not be
susceptible to overflowing. About 0.3 miles of pipeline are recommended to improve fire flow in
the Wahiawā 1180 pressure zone.
Recommended Improvements for 30-Year CIP
1. Reconfigure pipelines and control valves around Melemanu 808 Reservoir.
2. 0.2 MG of additional storage in Mililani 685 zone.

Section 10 System Capacity Evaluation
10-34 October 2016
This page intentionally left blank.
October 2016 11-1
Section 11
Facility Condition
Assessment
Water utilities conduct condition assessments of
their facilities to identify areas of concern for further
analyses or action. If the facility being analyzed is
found to be in poor condition, actions may be taken
to rehabilitate or replace the facility before it fails.
This section details the condition assessments
conducted on the BWS’s pipelines, reservoirs,
SCADA system, pump stations, wells, water treatment facilities, and microfiltration/chlorination
facilities. Summaries of the results of the condition assessment and recommendations are
included in this section.
This assessment, the supply analysis discussed in Section 8, Current and Future Water Supply
Sources, and the capacity analysis described in Section 10, System Capacity Evaluation, help form
the basis for the near- and long-term improvements for the BWS, presented in Section 12,
Findings and Recommendations.
11.1 Key FindingsThe WMP’s key findings for the facility condition assessments are listed below. These findings are
identified with a code (an abbreviation for the section name) and number (for example, COND-1).
These codes are repeated in Section 12 to easily tie the findings in this section to the
recommendations for BWS action listed in Section 12.
11.1.1 Pipelines
COND-1 Main breaks have been on the decline for several years, and, at 312 per year
(equal to about 15.2 breaks per 100 miles of pipe), are about half of the national
average of 30 breaks and leaks per 100 miles of pipe as reported by the AWWA
2012 Benchmarking Report1. Although the average age of the piping system has
been increasing, existing BWS efforts at reducing main breaks have been
effective. These efforts include: replacement of failed pipes; operational changes
and pressure management; and leak detection and repair. These efforts should
be continued.
1 AWWA. 2014. 2012 Benchmarking Performance Indicators for Water and Wastewater Utilities: Survey Data and Analyses Report. AWWA Catalog No.: 20761. Available at: http://www.awwa.org/store/productdetail.aspx?productid=39837461.
provides information that
addresses the following
WMP objectives:
Water Quality, Health, and Safety
System Reliability and Adequacy
Cost and Affordability
Water Conservation
Water Resource Sustainability
Section
11
Section 11 Facility Condition Assessment
11-2 October 2016
COND-2 Large diameter main breaks (16 inches in diameter or greater) are relatively
few (averaging 11 per year), but trending upward. Prioritization of replacement
of pipelines on highest risk sections is recommended.
COND-3 Main breaks tend to cluster on specific sections of pipelines. This has been
observed on 10th Avenue in Pālolo, Haha‘ione Street in Hawai‘i Kai, McArthur
Street in Wai‘anae, and at other locations. Monitoring main break density
(breaks per mile) on pipelines and replacing pipeline if main breaks become
greater than what is considered a failed pipe (one break per 200 feet in the last
ten years) is recommended. A portion of the capital budget should be dedicated
to replacing these smaller pipelines with frequent breaks.
COND-4 Over the last 10 years, the BWS has awarded contracts to replace an average of
8.7 miles of pipeline per year. Pipeline break and risk metrics should be
monitored, and in the event of worsening metrics, replacement rate should
increase to 20 miles per year as determined by the lifespan assessment. Savings
from lower interest rate State Revolving Fund loans can be utilized to increase
risk-based pipe replacement miles when funding is available.
COND-5 Even at a replacement rate of 1 percent per year, it is projected that the main
break rate of 312 per year will eventually begin to increase and reach about 350
breaks per year by the year 2040 as the system ages and older pipes exceed
their design life. The BWS has implemented operational strategies to reduce
main breaks to close to 300 per year, and future operational changes may
include adding surge control at key pump stations, increasing reservoir storage
where deficient, and/or reducing pressure in high pressure areas.
COND-6 The Failure Factors Analysis showed that targeted pipe replacement (replacing
shorter segments of high likelihood of failure pipe, with a minimum replacement
of 1,000 feet) can significantly reduce break rates and increase pipe
replacement efficiency (by not unnecessarily replacing pipes with lower
likelihood of failure). High quality risk and assessment data will allow more
efficient and targeted pipeline replacement, reducing the break rate at any given
replacement rate. These efforts are critical to maintaining the low rate of main
breaks the BWS has achieved.
COND-7 Statistical evaluation of all existing BWS materials (cast iron, PVC, concrete
cylinder pipe, asbestos-cement pipe, galvanized steel, ductile iron, and other
materials) shows that ductile iron has the best performance considering
historical main breaks per mile. Ductile iron is a reliable pipe material for the
BWS and is the default standard pipe material for all new BWS pipe
installations.
COND-8 To allow future generations to eventually replace pipelines at a lower rate per
year, the BWS will seek to design new ductile iron pipelines for a service life of
greater than 100 years. This ambitious goal will require adoption and consistent
application of better-than-current industry “best practices” for design, material
Section 11 Facility Condition Assessment
October 2016 11-3
specifications, concurrent use of multiple methods of corrosion control, and a
long-term commitment to monitoring and testing of cathodic protection
systems.
COND-9 PVC pipe is the other pipe material used by the BWS in new installations.
Recently, the BWS has experienced PVC pipe failures (main breaks) in pipelines
that are less than 20 years old. The BWS has implemented an interim standard
requiring thicker wall PVC pipe, limiting installations to lower pressure areas,
restricting maximum PVC size to 16 inches in diameter, increasing trench
cushion requirements, and prohibiting pipe bending and joint deflection. This
interim standard will remain in place pending the results of an on-going (2016)
PVC pipe study.
COND-10 To efficiently prioritize and schedule pipeline replacement, ongoing condition
assessment can be helpful. Continued monitoring of condition assessment
technology for improved ease of use and pipeline condition assessment on
transmission pipelines as recommended by the pipeline decision framework
(CapPlan) is recommended. Additionally, all new ductile iron transmission
pipelines should have six-inch diameter access points installed at half mile
intervals to simplify future condition assessment testing. A standard detail
should be developed and adopted.
COND-11 Moanalua Tunnel may require strengthening to allow surface development. If
surface development is allowed, implement tunnel rehabilitation projects as
identified. Reevaluate condition of all pipeline tunnels every 10 years.
COND-12 BWS currently has a valve exercising program. Continue valve exercising
program and specifically address large (16 inches in diameter or greater) valves
that have not been exercised recently.
COND-13 Due to the public perception of water waste, the unidirectional flushing and
hydrant testing programs ramped down several years ago. The need to reinstate
unidirectional flushing and hydrant testing programs should be evaluated,
beginning with public outreach to explain the needs.
11.1.2 Reservoirs
COND-14 The majority of the reservoirs are conventionally reinforced, cast-in-place
concrete, and this type of structure has proven to be very durable. In larger
sizes, strand-wound concrete reservoirs originally constructed to AWWA D110
standards have also performed well. Eighty-nine percent, or 152 of the 171
reservoirs are in need of only minor or no work. Continued use for cast-in-place
concrete for small reservoirs, and AWWA D110 designs for reservoirs larger
than 1 to 2 MG is recommended. Continued proactive maintenance and
completion of needed repairs to reservoirs is recommended.
COND-15 Eighteen of the reservoirs (11 percent) have high priority projects that should
be performed. These projects are included in the CIP.
Section 11 Facility Condition Assessment
11-4 October 2016
COND-16 Although designed to then-current codes, one hundred twenty reservoirs (70
percent) do not meet the most current seismic code, although code level failures
of most would cause only minor damage. As structural work is performed on
any of these reservoirs in the future, upgrading the seismic restraint system to
meet the latest codes is recommended. There are no Federal, State, or local
requirements for most structures (including reservoirs) to be upgraded to meet
changing codes. These costs have been included as placeholders in the CIP.
COND-17 Two reservoirs are recommended for immediate replacement due to seismic
risk. One of these two reservoirs is also considered vulnerable to roof damage
from hurricane-related winds. Based on extrapolation of the evaluation of
representative BWS reservoirs designs, all other remaining BWS reservoirs
appear to be suitable to withstand hurricane-related winds.
COND-18 Reservoir condition assessment is important to identify and schedule needed
repairs. Re-inspecting the poorer condition reservoirs every 5 years and
updating the reservoir condition assessment every 10 years is recommended.
COND-19 Approximately 60 reservoirs have had internal inspections in the last 10 years,
and many need cleaning to remove natural sediment. A reservoir inspection and
cleaning program for all reservoirs is recommended.
11.1.3 Pump Stations
COND-20 Four hundred fourteen source and booster pumps have reliably supplied water
and maintained system pressure, currently meeting an average day demand of
145 mgd and a maximum day demand of 180 mgd.
COND-21 Eighteen percent of pumps are out of service and need repair, reducing
redundant capacity in the system. Although only about 60 percent of pumps are
needed to meet system demands, rehabilitating out of service pumps, with the
goal of more than 90 percent of pumps available for service, is recommended.
COND-22 Many pump stations are in need of repair, refurbishment, or upgrade. Refitting
pump stations to improve operation, reliability, and efficiency is recommended.
11.1.4 Water Treatment
COND-23 At some facilities, physical treatment equipment is in need of repair,
predominantly related to corrosion. Completion of repairs to treatment
equipment and an on-going painting program to extend useful lifespan are
recommended.
COND-24 Treatment at some facilities may be able to be made more efficient by process
modifications and new carbon filter media products, like coconut carbon.
Completing modifications to treatment processes to increase efficiency is
recommended.
Section 11 Facility Condition Assessment
October 2016 11-5
11.1.5 Facilities
COND-25 The BWS has a comprehensive and widely used GIS system. In addition, the
Water Master Plan has provided a risk-based pipeline prioritization tool called
CapPlan. These tools should be regularly updated to continue to provide a
benefit to BWS.
COND-26 The BWS is installing a dedicated and hardened microwave-based backbone
telemetering communication system that ties in all BWS facilities island-wide.
Existing remote telemetry units (RTUs) and SCADA system should be upgraded
to current technology and functionality improved. A multi-year phased
approach should be used to migrate SCADA data to the microwave system to
avoid disruption to existing operations.
COND-27 Office and base yard buildings and facilities are in need of various repairs and
functional modifications to meet their current uses. Completing high-priority
repairs is recommended, but an Office and Base Yard Master Plan should be
completed to coordinate with future needs.
COND-28 Office and base yard needs into the future were not evaluated in the WMP;
however, planning is being completed separately for the Kapolei Base Yard.
Completing an office and resource evaluation and developing a master plan for
new and/or modified spaces is recommended, along with a Base Yard Master
Plan for new and/or modified yard areas.
COND-29 The BWS has completed a Facility Security Study that identified a variety of
intruder or damage vulnerabilities. The recommendations of that study should
be implemented.
11.2 PipelinesThe pipes that carry water throughout Oʻahu were installed at different times and constructed of
varied materials and varied sizes, with some as large as 42 inches in diameter (see Section 6, The
BWS System). Like all constructed facilities, pipelines degrade over time due to corrosion, fatigue,
land movement, or other factors. Volcanic soil and saline groundwater, like that found in some
places on Oʻahu, can accelerate corrosion that externally breaks down the pipe material.
Because pipelines are buried, their condition cannot be easily assessed. Additionally, unlike sewer
pipelines in which cameras can be readily inserted because the pipes are non-pressurized,
assessing the condition of pressurized water pipelines poses complex challenges. The BWS used
advanced tools to assess the wall condition of selected transmission pipes, collected data on
breaks and leaks, conducted forensic analyses on representative pipes that have failed, and
gathered information on operations and maintenance practices. A number of analytical tools
were applied to relate these thousands of data points to one another, making it possible to
estimate which stretches of pipeline are most critical for service dependability and which are
potentially most likely to fail. The results helped determine where to invest first in repair,
rehabilitation, and replacement projects.
Section 11 Facility Condition Assessment
11-6 October 2016
After the analyses were complete, the entire inventory of pipelines was sorted in a decision
framework to determine the needed action for each segment. This decision framework grouped
pipelines into the following categories:
Replace pipeline (add project to the CIP and complete per prioritization presented in
Section 13, Implementation) – 16 percent;
High frequency monitoring (about 10 years) – 3 percent;
Low frequency monitoring (about 20 years) – 15 percent; and
Reevaluate in the future – 66 percent (no current action needed).
Large diameter pipelines (greater than or equal to 16 inches in diameter) were the focus of
pipeline inspections due to their critical nature and infrequent failure history (meaning little is
known of pipeline condition); however, the statistical evaluations included all pipelines.
11.2.1 Pipeline Condition Assessment Methodology
Pipeline replacement needs were estimated using a Lifespan Analysis, a Failure Factors Analysis,
and finally a Pipeline Risk Analysis to help prioritize the most critical pipelines to replace. In
addition to the statistical analyses, forensic analysis of selected main breaks and physical
condition assessment were completed on a subset. Each of these analyses is discussed below.
A Lifespan Analysis was completed to determine, on average, the length of pipe that should be
replaced each year. This analysis considers only assumed pipe lives applied to the current
inventory of pipelines in the system, and is a conservative first look at the potential replacement
needs over the long-term (100 years).
To determine the order that pipes should be replaced, data on previous main breaks was
reviewed, identifying and evaluating their characteristics to identify the mechanisms of pipe
failure. This Failure Factors Analysis used available GIS data to suggest which pipe and
environmental factors contribute the most to current failures. The Failure Factors Analysis tested
the statistical significance of various factors (for example, pipe material, soil type, brackish
groundwater, pressure, among others) to determine which factors are most affecting the
degradation of pipelines and materials within the system.
The Pipeline Risk Analysis then took the estimated likelihood of failure scores from the Failure
Factors Analysis along with a separately developed consequence of failure score to develop a risk
score for every pipe in the BWS system. This analysis helped to prioritize specific pipe assets to
rehabilitate or replace in order of overall risk.
Over the course of the pipeline condition assessment program a number of main breaks were
investigated to identify potential causes of the failure. Pipe material from several of these breaks
was analyzed by a lab to determine whether the pipe material itself was a potential cause.
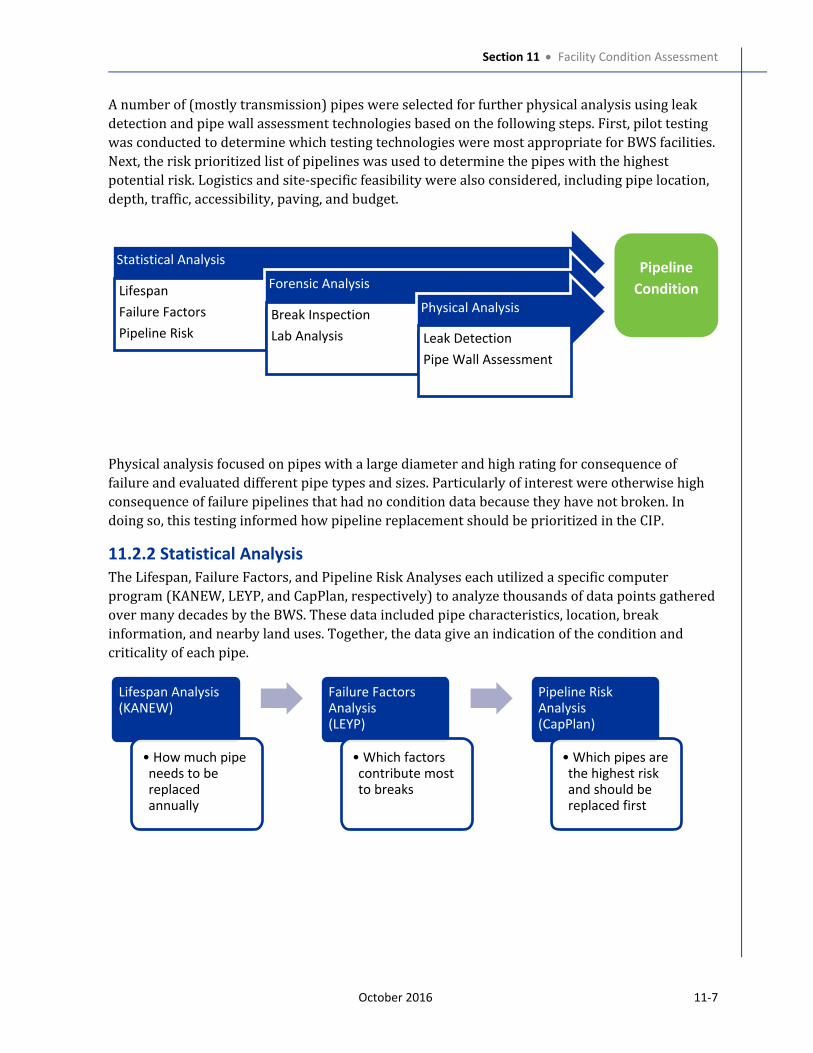
Section 11 Facility Condition Assessment
October 2016 11-7
A number of (mostly transmission) pipes were selected for further physical analysis using leak
detection and pipe wall assessment technologies based on the following steps. First, pilot testing
was conducted to determine which testing technologies were most appropriate for BWS facilities.
Next, the risk prioritized list of pipelines was used to determine the pipes with the highest
potential risk. Logistics and site-specific feasibility were also considered, including pipe location,
depth, traffic, accessibility, paving, and budget.
Statistical Analysis
Lifespan
Failure Factors
Pipeline Risk
Forensic Analysis
Break Inspection
Lab Analysis
Physical Analysis
Leak Detection
Pipe Wall Assessment
Physical analysis focused on pipes with a large diameter and high rating for consequence of
failure and evaluated different pipe types and sizes. Particularly of interest were otherwise high
consequence of failure pipelines that had no condition data because they have not broken. In
doing so, this testing informed how pipeline replacement should be prioritized in the CIP.
11.2.2 Statistical Analysis
The Lifespan, Failure Factors, and Pipeline Risk Analyses each utilized a specific computer
program (KANEW, LEYP, and CapPlan, respectively) to analyze thousands of data points gathered
over many decades by the BWS. These data included pipe characteristics, location, break
information, and nearby land uses. Together, the data give an indication of the condition and
criticality of each pipe.
Lifespan Analysis
(KANEW)
� How much pipe
needs to be
replaced
annually
Failure Factors
Analysis
(LEYP)
� Which factors
contribute most
to breaks
Pipeline Risk
Analysis
(CapPlan)
� Which pipes are
the highest risk
and should be
replaced first
Pipeline
Condition
Section 11 Facility Condition Assessment
11-8 October 2016
11.2.2.1 Lifespan Analysis (KANEW)
The BWS began by analyzing the current inventory of pipelines to estimate their expected service
lives, and then using the installation date to estimate when in the future these pipes will begin
reaching the end of their service lives. This Lifespan Analysis gives a broad indication of, on
average, the pipeline renewal rate.
The Lifespan Analysis, evaluated with the KANEW software program, used estimated pipeline
lifespans that were developed from industry standards2. The lifespan assumptions vary for each
type of pipe material, but generally range from 50 years, when the first pipes of the lowest life
material start failing, to over 100 years when a relatively small portion of long lived pipes remain
in service.
By applying these estimated lifespans to the pipelines currently installed in the BWS system, a
projection was created, depicted in Figure 11-1, showing the estimated miles of pipelines that will
reach the end of their expected lifespans decades into the future. For many utilities, this analysis
shows a large peak of pipe reaching the end of its expected lifespan in the future. Fortunately for
the BWS, this was not the case. The peak of pipe reaching the end of its expected lifespan in the
2070s is relatively small overall. Lifespan Analysis is a conservative first look at the needed level
of annual pipeline renewal. Better knowledge of and management of main break factors, such as
the other condition assessment efforts as part of the WMP as well as the on-going Quality
Infrastructure Conservation Initiative (also known as QUINCI3), can effectively increase the
service life of pipes and reduce the long-term renewal amounts.
2 AWWA. Buried No Longer: Confronting America’s Water Infrastructure Challenge. Available at: http://www.awwa.org/Portals/0/files/legreg/documents/BuriedNoLonger.pdf.
3 QUINCI was formed to determine the most prevalent pipeline failure mechanisms, identify mitigation and prevention measures to reduce catastrophic pipeline breaks, and conduct pipeline condition assessments.
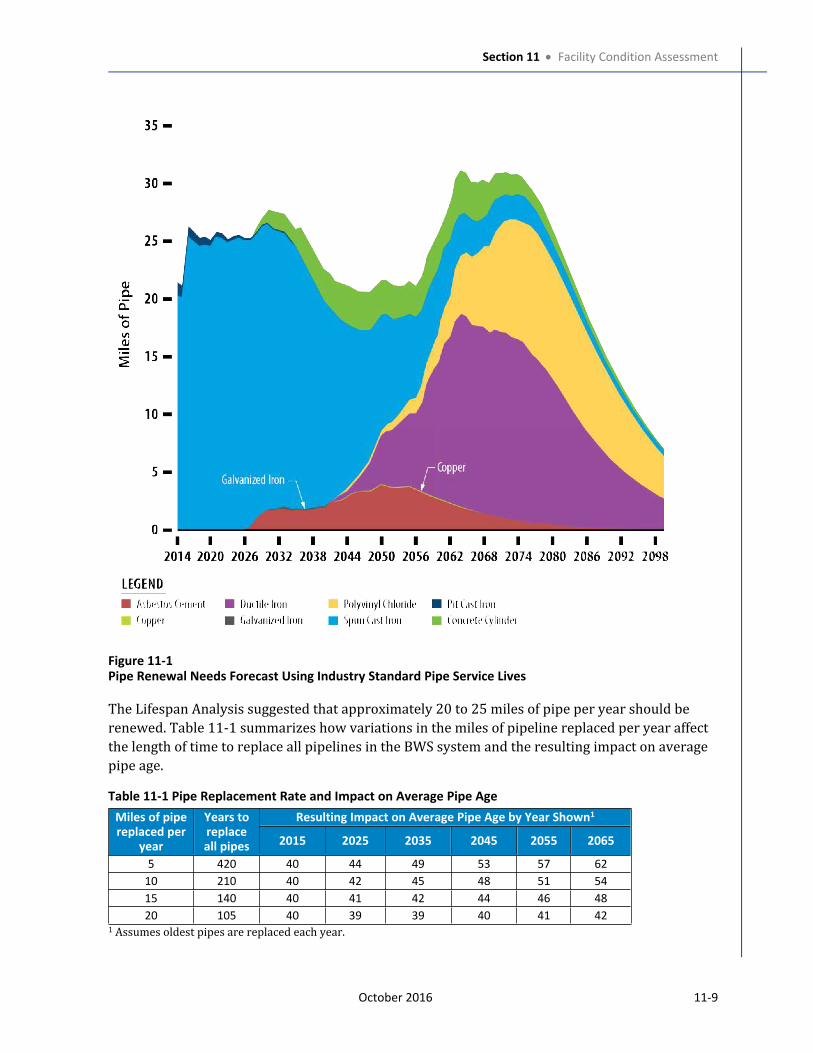
Section 11 Facility Condition Assessment
October 2016 11-9
Figure 11-1Pipe Renewal Needs Forecast Using Industry Standard Pipe Service Lives
The Lifespan Analysis suggested that approximately 20 to 25 miles of pipe per year should be
renewed. Table 11-1 summarizes how variations in the miles of pipeline replaced per year affect
the length of time to replace all pipelines in the BWS system and the resulting impact on average
pipe age.
Table 11-1 Pipe Replacement Rate and Impact on Average Pipe Age
Resulting Impact on Average Pipe Age by Year Shown1Miles of pipe replaced per
year
Years to replace all pipes 2015 2025 2035 2045 2055 2065
5 420 40 44 49 53 57 62
10 210 40 42 45 48 51 54
15 140 40 41 42 44 46 48
20 105 40 39 39 40 41 421 Assumes oldest pipes are replaced each year.
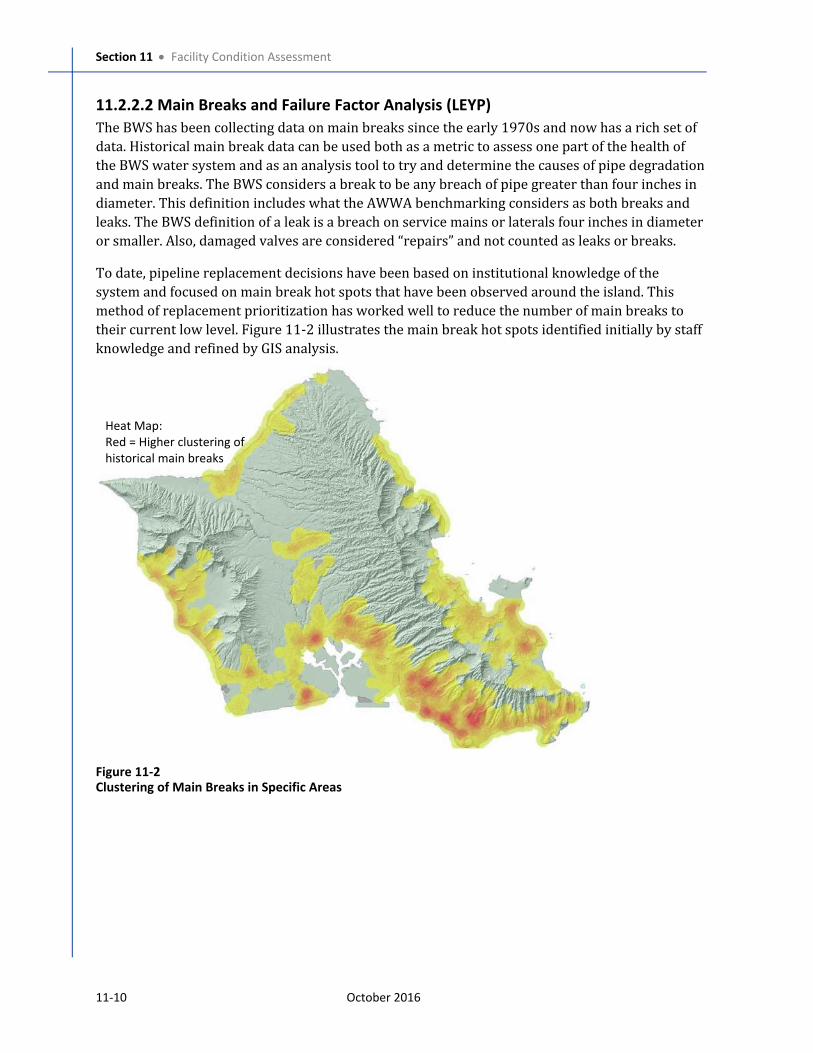
Section 11 Facility Condition Assessment
11-10 October 2016
11.2.2.2 Main Breaks and Failure Factor Analysis (LEYP)
The BWS has been collecting data on main breaks since the early 1970s and now has a rich set of
data. Historical main break data can be used both as a metric to assess one part of the health of
the BWS water system and as an analysis tool to try and determine the causes of pipe degradation
and main breaks. The BWS considers a break to be any breach of pipe greater than four inches in
diameter. This definition includes what the AWWA benchmarking considers as both breaks and
leaks. The BWS definition of a leak is a breach on service mains or laterals four inches in diameter
or smaller. Also, damaged valves are considered “repairs” and not counted as leaks or breaks.
To date, pipeline replacement decisions have been based on institutional knowledge of the
system and focused on main break hot spots that have been observed around the island. This
method of replacement prioritization has worked well to reduce the number of main breaks to
their current low level. Figure 11-2 illustrates the main break hot spots identified initially by staff
knowledge and refined by GIS analysis.
Figure 11-2Clustering of Main Breaks in Specific Areas
Heat Map:
Red = Higher clustering of
historical main breaks
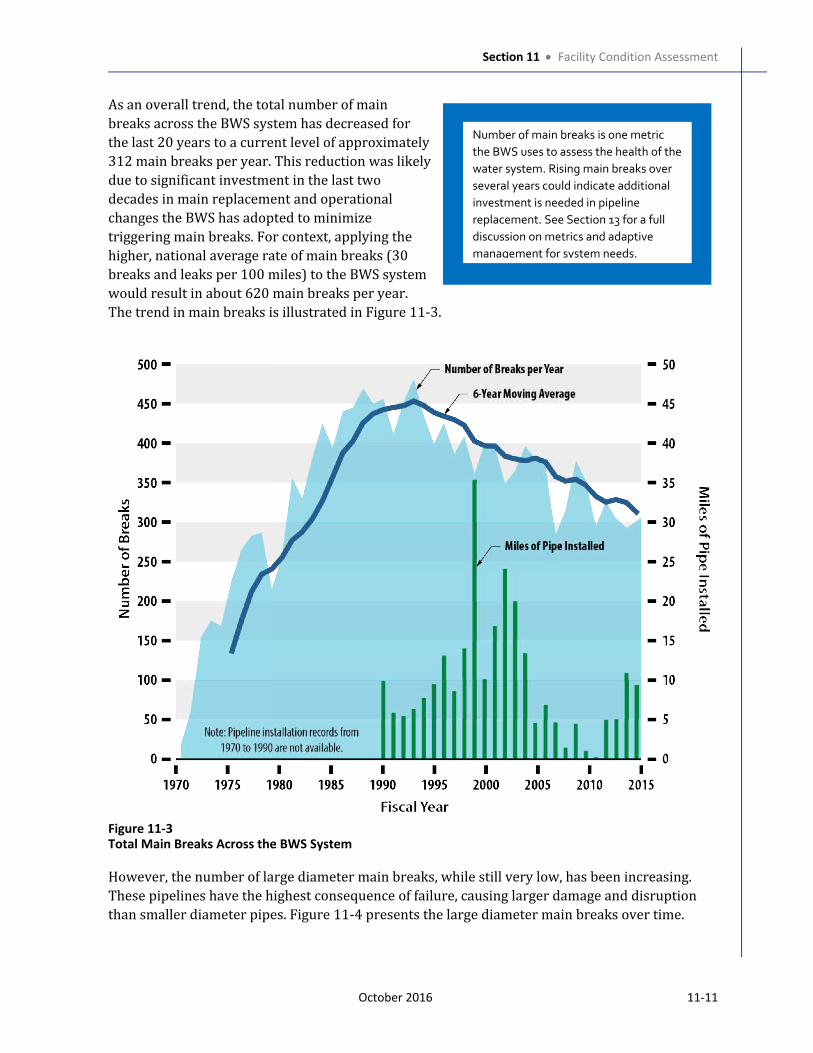
Section 11 Facility Condition Assessment
October 2016 11-11
As an overall trend, the total number of main
breaks across the BWS system has decreased for
the last 20 years to a current level of approximately
312 main breaks per year. This reduction was likely
due to significant investment in the last two
decades in main replacement and operational
changes the BWS has adopted to minimize
triggering main breaks. For context, applying the
higher, national average rate of main breaks (30
breaks and leaks per 100 miles) to the BWS system
would result in about 620 main breaks per year.
The trend in main breaks is illustrated in Figure 11-3.
Figure 11-3Total Main Breaks Across the BWS System
However, the number of large diameter main breaks, while still very low, has been increasing.
These pipelines have the highest consequence of failure, causing larger damage and disruption
than smaller diameter pipes. Figure 11-4 presents the large diameter main breaks over time.
Number of main breaks is one metric
the BWS uses to assess the health of the
water system. Rising main breaks over
several years could indicate additional
investment is needed in pipeline
replacement. See Section 13 for a full
discussion on metrics and adaptive
management for system needs.
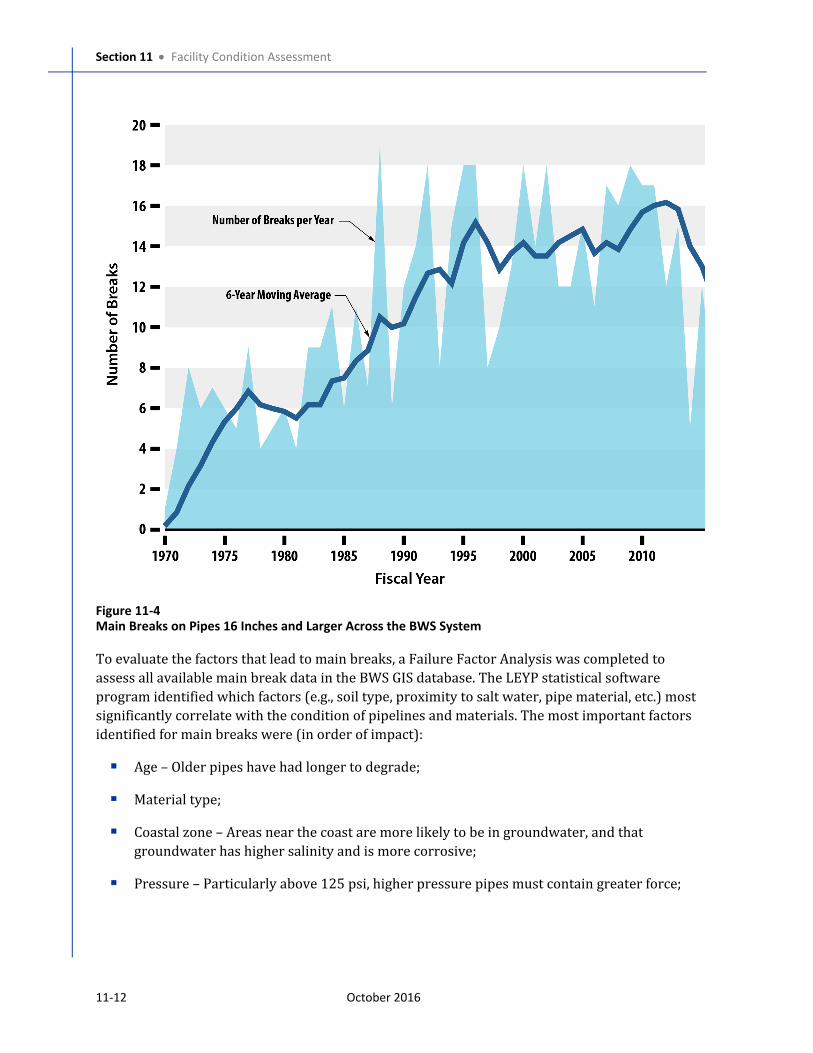
Section 11 Facility Condition Assessment
11-12 October 2016
Figure 11-4Main Breaks on Pipes 16 Inches and Larger Across the BWS System
To evaluate the factors that lead to main breaks, a Failure Factor Analysis was completed to
assess all available main break data in the BWS GIS database. The LEYP statistical software
program identified which factors (e.g., soil type, proximity to salt water, pipe material, etc.) most
significantly correlate with the condition of pipelines and materials. The most important factors
identified for main breaks were (in order of impact):
Age – Older pipes have had longer to degrade;
Material type;
Coastal zone – Areas near the coast are more likely to be in groundwater, and that
groundwater has higher salinity and is more corrosive;
Pressure – Particularly above 125 psi, higher pressure pipes must contain greater force;

Section 11 Facility Condition Assessment
October 2016 11-13
Soil – Some soils are more corrosive or prone to movement than others:
Higher likelihood of failure includes soils with high shrink/swell potential, high
plasticity, and/or high corrosivity. Also included were fill areas which can be variable,
and more corrosive.
Lower likelihood of failure includes soils with low shrink/swell potential, low plasticity,
and/or low corrosivity;
Diameter – Larger pipes have thicker walls to withstand pressure, which also provides
greater resistance to other degradation;
Other important factors not included in Failure Factor Analysis:
Construction Quality – Although construction quality is an important factor in the
lifespan of pipes, it is not a factor that can be evaluated using GIS data.
Damage Caused by Other Construction – Many breaks are caused by other contractors
working in the area of BWS pipelines.
The Failure Factors Analysis was validated by holding back the last three years of main break
data and assessing how well the analysis could predict where breaks would occur in those three
years. The validation ratio of predicted breaks to actual breaks was 1.25 (slight over prediction),
compared to a perfect model having a ratio of 1.0. Validation ratios seen from other utilities are
between 0.67 and 1.44, and the BWS analysis at 1.25 is at the median, considered a good, slightly
conservative model. The analysis showed that if the 10 percent of pipes with the highest
predicted break rates were replaced, approximately 47 percent of main breaks would be avoided.
While this level of pipe replacement would take many years and replacement of only the short
segments of pipe that have high predicted break rates is not the most efficient method of pipe
replacement, the analysis showed that targeted pipe replacement (shorter segments of high
likelihood of failure pipe) can have a significant effect on break rate.
The data that BWS has collected since the 1970s and organized in the GIS database is what allows
this analysis to be completed. The richer and longer the data set is, the better insights can be
drawn from it. As such, the ongoing pipe break data collection efforts lead by the QUINCI initiative
are important for future break analyses such as this and should be continued.
The information obtained from the Failure Factor Analysis provided input into the risk-based
Pipeline Risk Analysis below.
11.2.2.3 Pipeline Risk Analysis (CapPlan)
The CapPlan statistical software program was used to rank pipeline segments based on the risk
that each segment contributes within the entire pipeline system. For the purpose of this analysis,
risk was defined as the likelihood that a pipeline will fail, multiplied by the consequence of that
failure occurring.
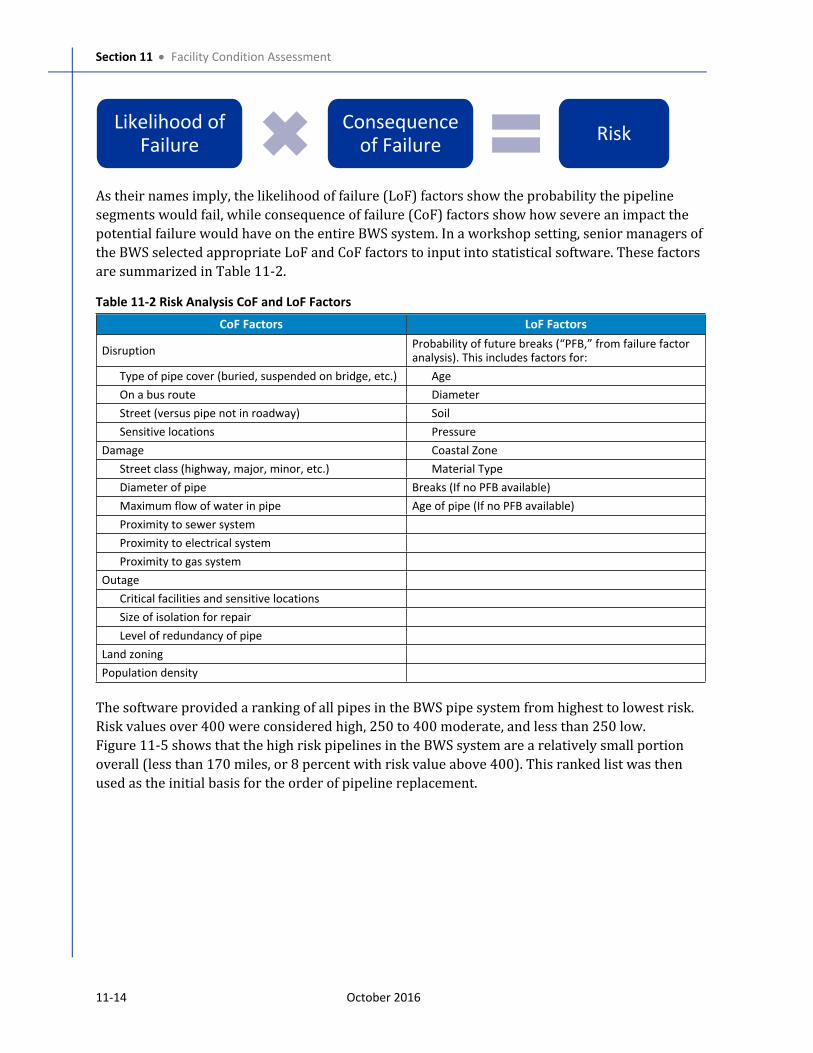
Section 11 Facility Condition Assessment
11-14 October 2016
Likelihood of
Failure
Consequence
of FailureRisk
As their names imply, the likelihood of failure (LoF) factors show the probability the pipeline
segments would fail, while consequence of failure (CoF) factors show how severe an impact the
potential failure would have on the entire BWS system. In a workshop setting, senior managers of
the BWS selected appropriate LoF and CoF factors to input into statistical software. These factors
are summarized in Table 11-2.
Table 11-2 Risk Analysis CoF and LoF Factors
CoF Factors LoF Factors
DisruptionProbability of future breaks (“PFB,” from failure factor
analysis). This includes factors for:
Type of pipe cover (buried, suspended on bridge, etc.) Age
On a bus route Diameter
Street (versus pipe not in roadway) Soil
Sensitive locations Pressure
Damage Coastal Zone
Street class (highway, major, minor, etc.) Material Type
Diameter of pipe Breaks (If no PFB available)
Maximum flow of water in pipe Age of pipe (If no PFB available)
Proximity to sewer system
Proximity to electrical system
Proximity to gas system
Outage
Critical facilities and sensitive locations
Size of isolation for repair
Level of redundancy of pipe
Land zoning
Population density
The software provided a ranking of all pipes in the BWS pipe system from highest to lowest risk.
Risk values over 400 were considered high, 250 to 400 moderate, and less than 250 low.
Figure 11-5 shows that the high risk pipelines in the BWS system are a relatively small portion
overall (less than 170 miles, or 8 percent with risk value above 400). This ranked list was then
used as the initial basis for the order of pipeline replacement.
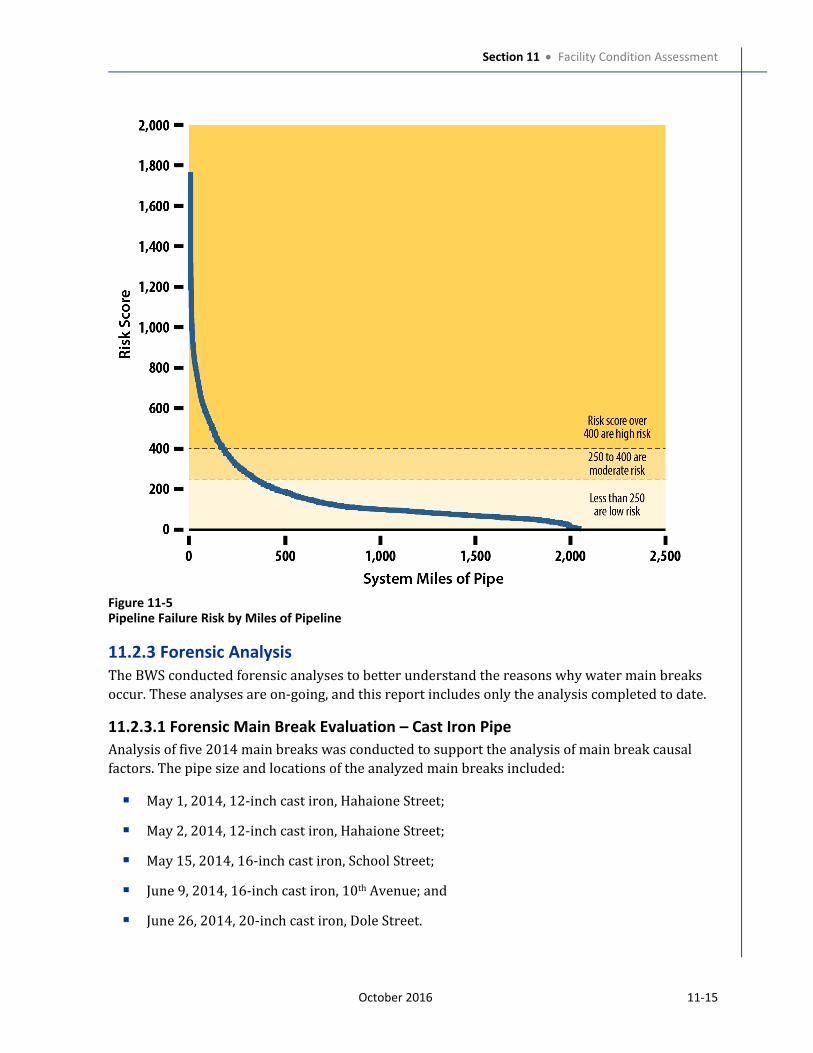
Section 11 Facility Condition Assessment
October 2016 11-15
Figure 11-5Pipeline Failure Risk by Miles of Pipeline
11.2.3 Forensic Analysis
The BWS conducted forensic analyses to better understand the reasons why water main breaks
occur. These analyses are on-going, and this report includes only the analysis completed to date.
11.2.3.1 Forensic Main Break Evaluation – Cast Iron Pipe
Analysis of five 2014 main breaks was conducted to support the analysis of main break causal
factors. The pipe size and locations of the analyzed main breaks included:
May 1, 2014, 12-inch cast iron, Hahaione Street;
May 2, 2014, 12-inch cast iron, Hahaione Street;
May 15, 2014, 16-inch cast iron, School Street;
June 9, 2014, 16-inch cast iron, 10th Avenue; and
June 26, 2014, 20-inch cast iron, Dole Street.
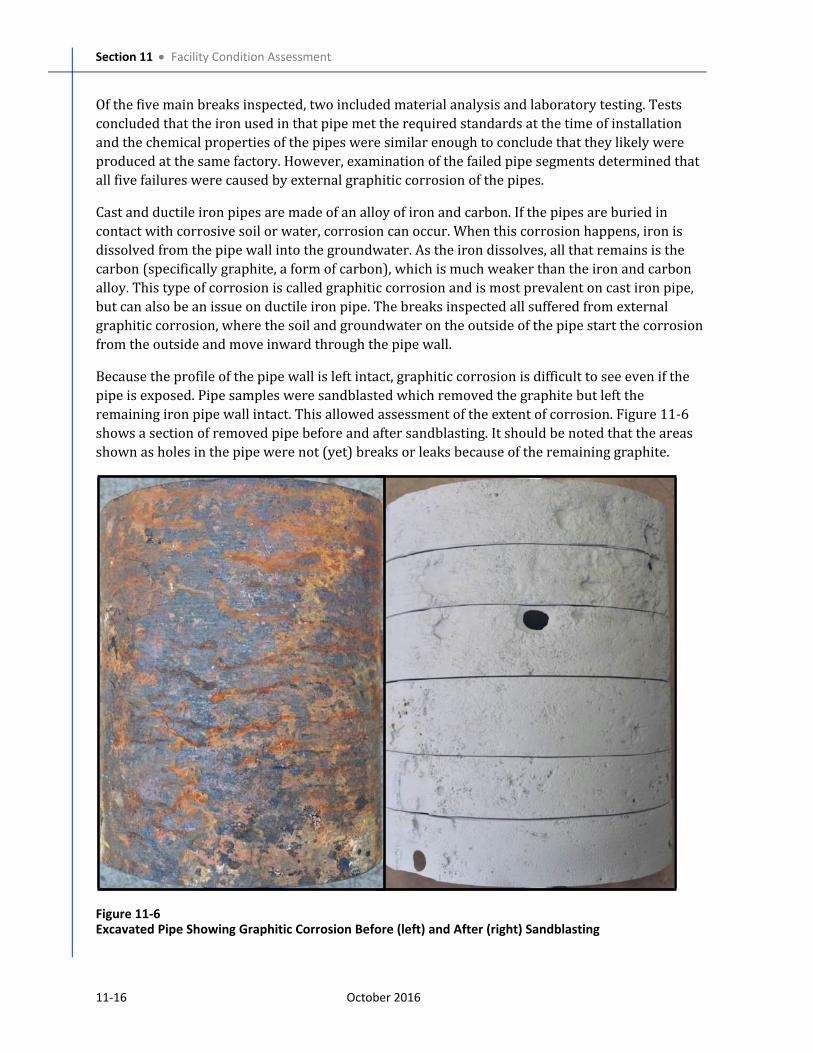
Section 11 Facility Condition Assessment
11-16 October 2016
Of the five main breaks inspected, two included material analysis and laboratory testing. Tests
concluded that the iron used in that pipe met the required standards at the time of installation
and the chemical properties of the pipes were similar enough to conclude that they likely were
produced at the same factory. However, examination of the failed pipe segments determined that
all five failures were caused by external graphitic corrosion of the pipes.
Cast and ductile iron pipes are made of an alloy of iron and carbon. If the pipes are buried in
contact with corrosive soil or water, corrosion can occur. When this corrosion happens, iron is
dissolved from the pipe wall into the groundwater. As the iron dissolves, all that remains is the
carbon (specifically graphite, a form of carbon), which is much weaker than the iron and carbon
alloy. This type of corrosion is called graphitic corrosion and is most prevalent on cast iron pipe,
but can also be an issue on ductile iron pipe. The breaks inspected all suffered from external
graphitic corrosion, where the soil and groundwater on the outside of the pipe start the corrosion
from the outside and move inward through the pipe wall.
Because the profile of the pipe wall is left intact, graphitic corrosion is difficult to see even if the
pipe is exposed. Pipe samples were sandblasted which removed the graphite but left the
remaining iron pipe wall intact. This allowed assessment of the extent of corrosion. Figure 11-6
shows a section of removed pipe before and after sandblasting. It should be noted that the areas
shown as holes in the pipe were not (yet) breaks or leaks because of the remaining graphite.
Figure 11-6Excavated Pipe Showing Graphitic Corrosion Before (left) and After (right) Sandblasting
Section 11 Facility Condition Assessment
October 2016 11-17
11.2.3.2 Forensic Main Break Evaluation – PVC Pipe
The BWS has commissioned a separate study to investigate PVC pipeline failures. As of 2016, that
work is on-going; however, draft results suggest several reasons for the premature PVC failures
that BWS has experienced recently. Material vintage, internal pressure, and the entity managing
construction all showed statistically significant effects. In addition, it was found that all of the PVC
breaks could be attributed to only 25 percent of the job numbers, suggesting that specific
contractors perform more poorly than others.
When final results are available from this study, it is anticipated that modifications to the BWS
Standard Specifications, Standard Details, locations and applications suitable for PVC, and
methods of design and construction of PVC pipelines will be recommended.
11.2.4 Pipeline Inspections
Using the methodology detailed in Section 11.2.1, the BWS performed pipe inspections using both
leak detection and pipe wall condition assessment. Pipeline leak detection is one screening
method that attempts to correlate the presence of leaks to pipe condition. The detection of small
leaks can be just as important as the detection of larger leaks. While the BWS has an existing leak
detection team, additional testing was conducted using state-of-the-art acoustic equipment on a
portion of the water system pipelines to detect and determine the location of leaks. Following the
main break and leak detection analyses, selected high-priority pipe segments were inspected,
about 17,000 feet of pipe, using sophisticated electromagnetic pipe wall assessment equipment.
11.2.4.1 Leak Detection
Pipeline leak detection is a non-intrusive (sensors are not inserted into the pipe) test method that
uses sensitive microphones and data recording devices to “listen” for the presence and location of
leaks in the pipeline. While recording, specifically designed software filters out ambient noise
signals to focus on the acoustic signature of leaks. In good conditions, this technology is able to
detect leaks less than 5 gallons per minute and pinpoint leak location within 5 to 10 feet. While
the BWS maintains a leak detection team doing continuous inspections, a specialty testing
company (Echologics) was used to determine if state-of-the-art technology could be useful to the
BWS on some of its largest pipelines.
The joint BWS/vendor leak testing successfully located several simulated leaks in the tested
mains. The vendor confirmed the location of a leak previously identified by the BWS leak
detection team using different leak detection equipment, on an air valve line connected to the 42-
inch cast iron transmission main on Miller Street near Queen’s Medical Center. The BWS leak
detection team has since procured updated equipment, allowing for even more precise detection
and location of leaks.
Leak detection provides useful information about the location and estimated size of leaks on
pipelines which can be used to repair the pipelines. The presence or absence of leaks also gives
information on the condition of the pipe; pipelines with several small leaks are likely to be in
generally poor condition, and pipelines with no leaks should provide several more years of
service before needing to be tested again. One limitation is that leak detection cannot estimate
whether a non-leaking pipe is in excellent condition, or may begin to leak in the near future.
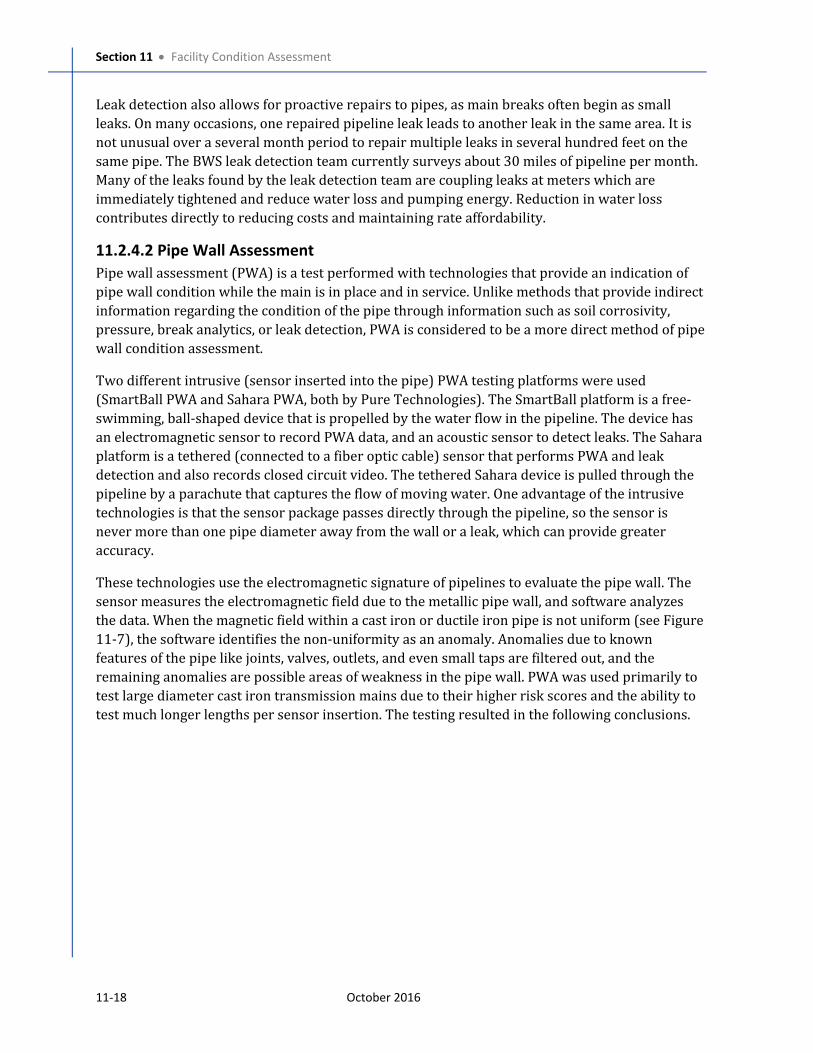
Section 11 Facility Condition Assessment
11-18 October 2016
Leak detection also allows for proactive repairs to pipes, as main breaks often begin as small
leaks. On many occasions, one repaired pipeline leak leads to another leak in the same area. It is
not unusual over a several month period to repair multiple leaks in several hundred feet on the
same pipe. The BWS leak detection team currently surveys about 30 miles of pipeline per month.
Many of the leaks found by the leak detection team are coupling leaks at meters which are
immediately tightened and reduce water loss and pumping energy. Reduction in water loss
contributes directly to reducing costs and maintaining rate affordability.
11.2.4.2 Pipe Wall Assessment
Pipe wall assessment (PWA) is a test performed with technologies that provide an indication of
pipe wall condition while the main is in place and in service. Unlike methods that provide indirect
information regarding the condition of the pipe through information such as soil corrosivity,
pressure, break analytics, or leak detection, PWA is considered to be a more direct method of pipe
wall condition assessment.
Two different intrusive (sensor inserted into the pipe) PWA testing platforms were used
(SmartBall PWA and Sahara PWA, both by Pure Technologies). The SmartBall platform is a free-
swimming, ball-shaped device that is propelled by the water flow in the pipeline. The device has
an electromagnetic sensor to record PWA data, and an acoustic sensor to detect leaks. The Sahara
platform is a tethered (connected to a fiber optic cable) sensor that performs PWA and leak
detection and also records closed circuit video. The tethered Sahara device is pulled through the
pipeline by a parachute that captures the flow of moving water. One advantage of the intrusive
technologies is that the sensor package passes directly through the pipeline, so the sensor is
never more than one pipe diameter away from the wall or a leak, which can provide greater
accuracy.
These technologies use the electromagnetic signature of pipelines to evaluate the pipe wall. The
sensor measures the electromagnetic field due to the metallic pipe wall, and software analyzes
the data. When the magnetic field within a cast iron or ductile iron pipe is not uniform (see Figure
11-7), the software identifies the non-uniformity as an anomaly. Anomalies due to known
features of the pipe like joints, valves, outlets, and even small taps are filtered out, and the
remaining anomalies are possible areas of weakness in the pipe wall. PWA was used primarily to
test large diameter cast iron transmission mains due to their higher risk scores and the ability to
test much longer lengths per sensor insertion. The testing resulted in the following conclusions.
Section 11 Facility Condition Assessment
October 2016 11-19
Figure 11-7Non-uniform Electromagnetic Field Caused by Area of Weakness in Pipe Wall
Free swimming PWA testing was conducted on a 16-inch diameter, cast iron cross-country
pipeline (installed circa 1952) near He‘eia State Park on Windward Oʻahu. The pipeline was
selected for testing due to long cross-country portions that are difficult to access for maintenance.
The inspection assessed 11,700 feet, identified 25 separate potential leaks, and determined that
more than 50 percent of the pipeline showed signs of medium to large electromagnetic anomalies
indicative of probable external corrosion. Based on these data, eventual abandonment or
replacement of this pipeline is needed.
Tethered PWA testing was conducted on two separate pipelines in the Metro area – a 30-inch
diameter (circa 1944) cast iron main along Date Street and a 24-inch diameter (circa 1952) cast
iron main along Kāhala Avenue and into Waiʻalae Golf Course. These mains were chosen to give
an indication of the effects of different soil types and groundwater conditions, and were sections
of the major metro transmission most accessible for testing. Inspections on these lines totaled
4,700 feet and showed no leaks. The Date Street pipe appeared to be in very good condition,
showing few anomalies. The Kāhala Avenue pipe showed to be in mostly good condition, with
some sections of concern that warrant further investigation and potential repair/replacement of
selected segments.
These tests provided useful and actionable information for the BWS, as well as provided a
baseline for possible future testing of the good condition pipes to determine the rate of
degradation. Intrusive testing is, however, more difficult due to the need for increased planning,
hydraulic modeling, system operational changes, and construction of pipe taps, all of which
increase the cost of testing.
11.2.5 Pipeline Materials and Corrosion Control
An evaluation was performed of pipe materials and corrosion control practices used by the BWS
for new installations. The work included:
Review of 2002 Standards and amendments for pipe material and corrosion control
specifications;
Section 11 Facility Condition Assessment
11-20 October 2016
Review of BWS corrosion control specifications and details;
Review of representative design documents;
Review of BWS break statistics (see Section 11.2.2);
Performed forensics on failed CIP pipe segments (Section 11.2.3.1);
Forensics and special study on PVC (Section 11.2.3.2); and
Review and input from corrosion specialists (by V&A Consulting Engineers).
No change in the current suite of pipe material alternatives is recommended. The BWS-allowed
pipe materials remain at the same two:
Principal pipe material is ductile iron. As of April 29, 2016, the Standards for Oʻahu only
were revised to increase the minimum thickness to Class 53 to provide better protection
from the corrosive soils of O‘ahu.
As of April 30, 2015, PVC pipe is allowed in selected cases, for lower pressure pipes. PVC
requires DR14 wall thickness and only installations of up to 16 inches in diameter. The
BWS anticipates revisiting its PVC specifications upon the conclusion of the PVC forensic
study in late 2016.
Concrete cylinder pipe is no longer approved for use by the BWS.
The BWS has indicated its desire for all new ductile iron pipe (DIP) installations to last greater
than 100 years, and as a result, the following observations and recommendations are made.
DIP has only about a 40-year history on O‘ahu. Typical life expectancy for DIP based on
various industry projections is on the order of 75 to 100 years for pipes in non- or low-
corrosivity soils.
The installed cost of pipeline is particularly high in Hawaiʻi and is approximately double the
cost of similar installations in the San Francisco or Los Angeles area. The disruption to
customers caused by main breaks and the high replacement cost are principal reasons for
achieving a long service life.
Some soils on O‘ahu are very corrosive, particularly in coastal areas.
Achieving a greater than 100-year life expectancy goal for DIP will require a conservative,
multi-prong approach that includes potential changes in design, construction, inspection,
maintenance/testing, and repairs.
Conservative design using robust materials and corrosion protection methods is
recommended for all soil types. This will result in uniformity of design and ease of
implementation and inspection.
Section 11 Facility Condition Assessment
October 2016 11-21
There is no downside in pipe lasting longer than targeted as this still benefits the BWS. If
conservative design and corrosion protection methods are applied on less corrosive soils
and the pipe there lasts more than 100 years, this is still good value for BWS.
The incremental cost for robust materials and potentially redundant corrosion protection
methods is relatively minor.
Increased service life for DIP will also require revised methods for repairs, regular
maintenance/testing program, and additional construction inspection resources.
11.2.6 Pipeline Renewal and Replacement Recommendations
An annual renewal need for pipelines in the BWS system includes information from each of the
above sources. The lifespan analysis suggests a conservative average annual pipeline
replacement. The failure factors analysis suggests potential main break causal factors and
pipeline risk analysis assists in prioritization of which pipelines should be replaced in which
order. PWA and leak detection are used to test selected high-value transmission pipeline
segments to confirm pipe condition and refine the scope and timeline for these repair or
replacement projects.
The total need for pipeline renewal is approximately 20 miles per year indefinitely based on the
lifespan analysis. There is potential that targeted replacement of high risk pipelines may allow for
sufficient system risk and main break management while replacing a lesser amount of pipeline,
reducing needed capital expenditures. Additionally, consideration of identified failure factors
during design of new pipelines will extend those pipes lifespan; however, these modifications will
not have an impact on pipe currently installed.
The rate of all main breaks is currently decreasing likely due to major investment in the last 20
years and operational changes that have been made in an effort to reduce main breaks. However,
the number of large diameter, high consequence of failure pipes is increasing. Therefore, it is
recommended that pipeline replacement shift to follow the risk based prioritization as
documented above, and metrics relating to pipeline system health (see Section 13) are monitored.
In the event of worsening metrics, annual pipeline replacement should be increased quickly to
respond before significant increases in system risks or main breaks are encountered.
The pipeline inspections showed that condition assessment is capable of providing actionable
information to refine and focus pipeline renewal to only pipelines that are in distress reducing
the total miles of pipeline that need to be replaced. Testing cost per mile is similar across pipe
diameters, and so is best targeted at the most critical and largest pipelines.
An assessment of Moanalua tunnel was also conducted to determine any potential impacts due to
overhead development. The report found that Moanalua Tunnel may require strengthening to
allow surface development. If surface development is allowed, implement tunnel rehabilitation
projects as identified. In addition, the condition of all pipeline tunnels should be reevaluated
every 10 years.
Section 11 Facility Condition Assessment
11-22 October 2016
The BWS also has an on-going valve exercising program which should be continued. Specifically,
large (16 inches in diameter or greater) valves that have not been exercised recently should be
addressed.
Due to the public perception of water waste, the unidirectional flushing and hydrant testing
programs ramped down several years ago. Unidirectional flushing of pipelines removes sediment
and improves water quality. While the BWS already has a hydrant maintenance program to
ensure hydrants are operable, hydrant testing allows hydraulic modeling assumptions to be
refined, as well as confirms whether hydrants that the model suggests are deficient actually are.
The need to reinstate unidirectional flushing and hydrant testing programs should be evaluated,
beginning with public outreach to explain the needs.
11.3 ReservoirsLarge drinking water storage tanks (or reservoirs) are located all around the island, some holding
as much as 6 million gallons, which is equivalent to a day’s supply for about 40,000 people on Oʻahu. These reservoirs, critical for reliable water supplies, are subject to weather, wear, and
corrosion.
11.3.1 Reservoir Condition Assessment Methodology
One hundred sixty-eight of the BWS’s 171 potable water reservoirs were inspected as part of the
reservoir condition assessment, with experts recording the condition of surfaces, connections,
walls, and roofs; condition of underlying concrete; and other attributes specific to individual
tanks. Three reservoirs were not inspected because they were either undergoing structural
rehabilitation or a design project was currently active to structurally rehabilitate the reservoir.
Data were reviewed on the physical site consequences of reservoir failure (e.g., downhill
neighbor, type of neighbor, potential impact to BWS facilities, etc.). During the condition
assessment, the following areas were examined:
Reservoir field examinations were conducted on 168 reservoirs and their exterior walls,
upper and lower seals, footings, and appurtenances.
Internal inspections were conducted on 30 reservoirs (a number similar to previous
assessments) more than 50 years old. Remote-operated vehicles inspected the interior
conditions underwater. Each unit had multiple high-resolution cameras, underwater and
above-water lighting, and electronic gauges that recorded the precise location of each
picture taken.
Numerical structural evaluation was conducted on 17 reservoirs. The different reservoir
design types were examined to determine potential damage in code-level seismic events
(earthquakes) or high-wind events (hurricanes). This representative cross section of
reservoirs in the BWS’s water system was used to gauge robustness of the entire reservoir
inventory.
Inlet and outlet piping connections to reservoirs were evaluated to determine susceptibility
to damage caused by seismic movements.
Section 11 Facility Condition Assessment
October 2016 11-23
Consequence of failure in regards to the physical site (e.g. downhill neighbor, type of
neighbor, potential impact to the BWS facility, etc.) was rated based on a scale developed
for the assessment.
These inspections provided the BWS with a detailed and accurate understanding of cracks, leaks,
and general physical condition of each reservoir and contributed to the prioritization of reservoir
rehabilitation or replacement.
11.3.2 Reservoir Condition Assessment
The reservoirs are composed of three major structural systems: cast in place concrete; AWWA
D110 strand wound post tensioned; and AWWA D115 tendon post tensioned reservoirs. The
condition assessment evaluated the current condition of the reservoirs, which allows the BWS to
monitor their long-term condition, provide insight to the potential lifespan of reservoir and
reservoir site components, and gauge the success of repairs. There were three major tasks to the
assessment: collecting and reviewing existing reservoir data; performing field inspections; and
updating the BWS’s database.
Collecting and reviewing the existing information on the reservoirs was critical in determining
how the reservoir inspection was to be performed. Knowing the structural system for the
reservoir provided direction to the inspectors as to what signs would indicate a structural
concern. All inspection scoring, observations, photographs, interior inspections, maintenance
recommendations, and repair or replacement tasks were recorded in the existing BWS database.
Additionally, the costs for repair or replacement tasks and their prioritization were documented.
The interior inspections allowed components to be viewed while the reservoirs remained in
service. The interior inspections evaluated the condition of the interior coating system,
foundation slab, inside face of wall, and underside of the roof slab.
11.3.3 Numerical Structural Evaluation
Wind and seismic numerical structural analyses were performed for 17 of the 171 circular
reservoirs in the BWS’s water system. The analyses were intended to inform the BWS of
performance differences in reservoirs based on type, age, and configuration, and identify those
that may be more susceptible to damage from hurricanes or earthquakes.
11.3.3.1 Reservoirs Selected for Evaluation
First, reservoirs were classified into 10 types, then 17 were selected for numerical analysis based
on construction type, age, and configuration to provide a representative collection of reservoirs.
11.3.3.2 Structural Evaluation Findings
The selected reservoirs were analyzed to determine structural strength using the codes,
standards, and seismic and wind criteria listed below.
International Code Council: 2012 International Building Code
American Society of Civil Engineers (ASCE):
ASCE 7-10, Minimum Design Loads for Buildings and Other Structures
Section 11 Facility Condition Assessment
11-24 October 2016
ASCE 41-13, Seismic Evaluation and Retrofit Rehabilitation of Existing Buildings
American Concrete Institute (ACI):
ACI 350-06, Code Requirements for Environmental Engineering Concrete Structures
and Commentary
ACI 350.3-06, Seismic Design of Liquid-Containing Concrete Structures and
Commentary
AWWA:
AWWA D100-11, Welded Carbon Steel Tanks for Water Storage
AWWA D110-13, Wire- and Strand-Wound, Circular, Prestressed Concrete Water Tanks
AWWA D115-06, Tendon-Prestressed Concrete Water Tanks
Using the current code level seismic and wind forces, the reservoirs were analyzed to determine
how effectively the existing reservoirs resist those forces. Different overstress conditions for each
reservoir were evaluated and a demand-capacity ratio (DCR) was determined for each of the 17
studied. DCRs are the code-level force divided by the component strength. The higher the DCR,
the more stressed the reservoir is; DCRs less than 1.0 indicate that the reservoir is strong enough
to resist the force while DCRs greater than 1.0 indicate that the reservoir may be overstressed.
The findings from the structural numerical analysis were extrapolated to the remaining
reservoirs in BWS’s water system based on reservoir age, type, configuration, and specific wall-
roof and wall-foundation details.
11.3.4 Reservoir Recommendations
The physical condition assessment showed the majority of the reservoirs were in good to
excellent condition. Seven reservoirs, or approximately five percent, were in need of highly
critical repairs or rehabilitation and will be programmed immediately into the CIP. The most
significant structural issues were observed in wire-wound tanks constructed in the 1950s and
1960s, and in the post tensioned reservoirs constructed in the 1990s.
Internal inspections similarly indicated that the vast majority of reservoir interiors inspected
have no major distresses. The interior inspections identified areas of spalled concrete with
exposed reinforcement, a distress that would not be observable unless the reservoir was taken
out of service or the failure became visible on the surface. Interior inspections also revealed that
some reservoirs required cleaning.
Numerical structural analysis shows that 138 (81 percent) reservoirs would benefit from some
sort of structural retrofit, however, only 11 reservoirs (in addition to the 7 above) were found to
need higher priority repairs. In total, 18 reservoirs (11 percent) are in need if higher priority
repair, and were added to the CIP.
An evaluation of the visible portions of reservoir pipe connections and the design drawings for
each type of reservoir piping connection was performed on all reservoirs in the BWS system.
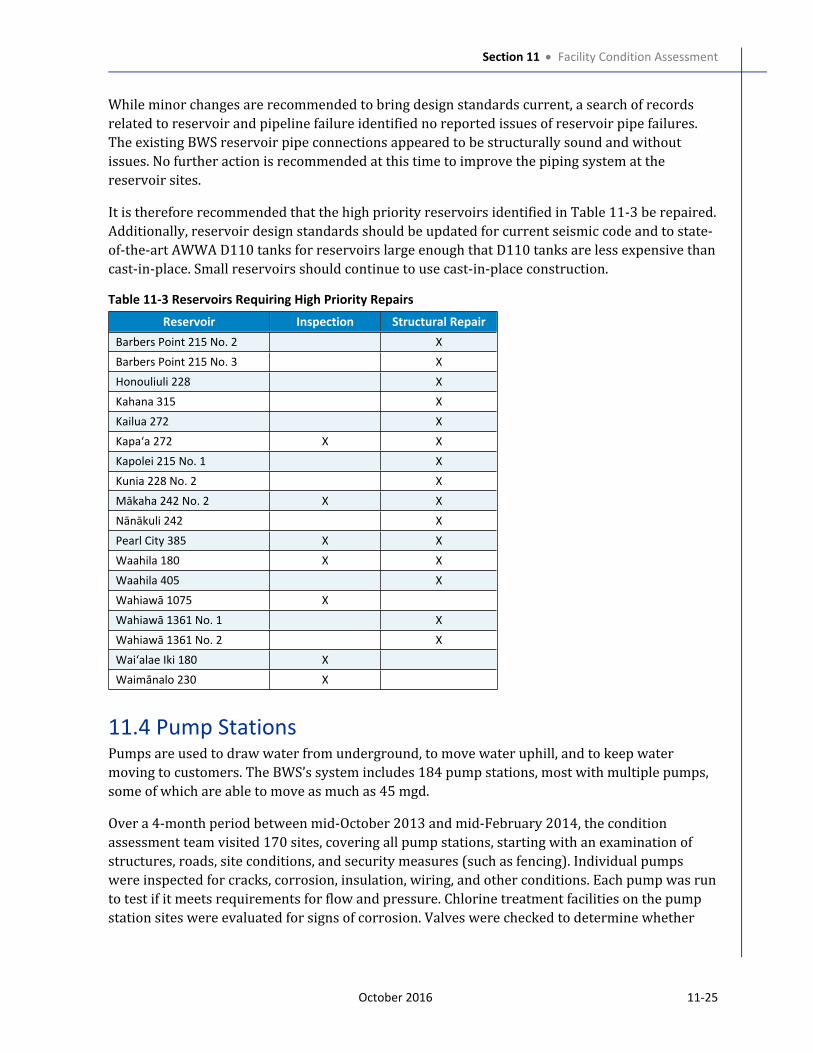
Section 11 Facility Condition Assessment
October 2016 11-25
While minor changes are recommended to bring design standards current, a search of records
related to reservoir and pipeline failure identified no reported issues of reservoir pipe failures.
The existing BWS reservoir pipe connections appeared to be structurally sound and without
issues. No further action is recommended at this time to improve the piping system at the
reservoir sites.
It is therefore recommended that the high priority reservoirs identified in Table 11-3 be repaired.
Additionally, reservoir design standards should be updated for current seismic code and to state-
of-the-art AWWA D110 tanks for reservoirs large enough that D110 tanks are less expensive than
cast-in-place. Small reservoirs should continue to use cast-in-place construction.
Table 11-3 Reservoirs Requiring High Priority Repairs
Reservoir Inspection Structural Repair
Barbers Point 215 No. 2 X
Barbers Point 215 No. 3 X
Honouliuli 228 X
Kahana 315 X
Kailua 272 X
Kapa‘a 272 X X
Kapolei 215 No. 1 X
Kunia 228 No. 2 X
Mākaha 242 No. 2 X X
Nānākuli 242 X
Pearl City 385 X X
Waahila 180 X X
Waahila 405 X
Wahiawā 1075 X
Wahiawā 1361 No. 1 X
Wahiawā 1361 No. 2 X
Wai‘alae Iki 180 X
Waimānalo 230 X
11.4 Pump Stations Pumps are used to draw water from underground, to move water uphill, and to keep water
moving to customers. The BWS’s system includes 184 pump stations, most with multiple pumps,
some of which are able to move as much as 45 mgd.
Over a 4-month period between mid-October 2013 and mid-February 2014, the condition
assessment team visited 170 sites, covering all pump stations, starting with an examination of
structures, roads, site conditions, and security measures (such as fencing). Individual pumps
were inspected for cracks, corrosion, insulation, wiring, and other conditions. Each pump was run
to test if it meets requirements for flow and pressure. Chlorine treatment facilities on the pump
station sites were evaluated for signs of corrosion. Valves were checked to determine whether
Section 11 Facility Condition Assessment
11-26 October 2016
they open and close fully and correctly, and control and instrumentation systems were tested to
verify they are operational and accurate.
Based on the condition assessment site visits and a desktop evaluation of each facility’s priority
relative to the entire system, critical assets at each well and booster pump station were
prioritized. Assets assessed included:
Wells;
Pumps;
Motors and motor starters;
Electrical distribution equipment;
Control and isolation valves;
Piping and appurtenances;
Disinfection systems;
Control and instrumentation; and
Site facilities.
Critical assets were defined as major components that are essential to the production and
distribution of water that are expensive or time consuming to repair or replace. Of the more than
400 pumping units at the 184 pump stations, 57 pump stations (31 percent) are in need of
routine work, 48 pump stations (26 percent) are in moderate need of rehabilitation work, and 22
pump stations (12 percent) are in need of critical repair. Each of these projects has been included
in the CIP.
In addition to the rehabilitation projects identified above, some pump stations are in need of
upgrade.
11.5 Water Treatment 11.5.1 GAC Treatment Facilities
Water treatment facilities are located across O‘ahu and were evaluated as part of the condition
assessment, inspected for general condition and efficiency. This assessment noted that the water
treatment facility conditions were variable, from well-maintained to needing significant
rehabilitation. The facilities are effectively removing contaminants below MCLs; however, some
may benefit from modification to increase efficiency, maximize carbon longevity, and increase
operational performance. Some sites also require high priority rehabilitation to prolong the
facility life. A list of suggested repairs and anticipated needs for treatment facility replacement
was compiled for inclusion in the CIP.
Section 11 Facility Condition Assessment
October 2016 11-27
11.5.2 Microfiltration/Chlorination
The membrane microfiltration system in Nu‘uanu was built in 1999, but has been off-line since
2003. The facility was assessed and inspected by a team including a Memcor (the membrane
equipment manufacturer) representative. The indoor equipment is likely able to be repaired, but
there is some outdoor equipment that is missing, and the new process requirements of the
current Memcor systems require some additional equipment.
It is possible to either have the existing system repaired, and additional process equipment
added, or to replace the entire system with a modern version, which requires similar space and
piping connections and may prove to be lower risk and cost. The BWS is currently formulating a
scope to have the treatment system repaired.
11.6 Facilities11.6.1 SCADA
The BWS, like many water municipalities, uses a SCADA system along with its RTUs. The SCADA
system is used primarily as a supervisory system to efficiently monitor the field information at
individual sites from more centralized BWS facilities.
11.6.1.1 Existing System Assessment
The BWS SCADA system was evaluated using the following steps:
1. Site visits: Site visits were conducted at approximately 20 BWS facilities including wells,
reservoirs, and booster pumping station facilities to evaluate the status of RTU/SCADA
hardware, software, and communication networks.
2. Review of existing documentation: A review of all available existing RTU/SCADA system
documentation was performed.
3. Staff interviews: Discussions were held with key BWS staff members to obtain their input
on the performance of the existing systems and their views on improvement needs.
4. Vendor discussions: Discussions were held with suppliers of the existing systems, the
MOSAIC SCADA supplier (CGI Logica) and the RTU supplier (Motorola).
5. Disaster recovery review: A review was performed to evaluate the existing system’s
ability to withstand disaster events and the BWS’s disaster recovery capabilities and
system integrity.
11.6.1.2 SCADA System Findings and Recommendations
The existing RTU/SCADA system assessment developed three key findings. First, the BWS has
enjoyed a long and successful operation of the existing RTU/SCADA system; however, due to the
system’s age, the manufacturer no longer provides maintenance support for the RTU system.
Therefore, in order for the BWS to continue to provide a secure, reliable, and efficient water
system operation, the BWS should continue replacing the RTUs in phases (currently 24 of 182
units have been replaced). Second, CGI Logica will need to develop and write a site-specific
communication protocol that allows the BWS to communicate with the field RTUs unless/until
Section 11 Facility Condition Assessment
11-28 October 2016
new SCADA software is implemented. Third, the SCADA communication system is potentially
susceptible to damage to overhead lines. It is recommended to complete transition to the existing
microwave communication system.
11.6.2 Offices and Base Yards
A broad overview assessment of the BWS offices and base yards was conducted by a team
including structural, architectural, building mechanical and plumbing, and electrical specialists.
The assessment found that office and base yard buildings and facilities are in need of various
repairs and functional modifications to meet current uses. Completion of high priority repairs are
recommended, but additional repairs should wait for completion of office and base yard master
plans to coordinate with future needs.
The office and base yard needs into the future were not evaluated in this master plan; however,
planning is being completed separately for Kapolei Base Yard. Completion of an office and
resource evaluation and development of a master plan for new and/or modified spaces is
recommended. Additionally, a base yard master plan for new and/or modified yard areas should
be completed.
11.6.3 Security
The BWS has over 300 facilities on the island of Oʻahu. Most of these facilities have chain link
perimeter fencing with barbed wire on the top. The BWS also has an island-wide camera system
with high resolution video cameras and motion detection systems. These systems are monitored
from a centralized security center. The BWS Security Office conducted a comprehensive study of
facility security and developed the findings below.
Many facilities have been tagged with graffiti.
Thieves have stolen wiring from a few locations.
Some equipment is outside of buildings and is vulnerable to damage from flying debris in a
hurricane or high winds.
Electrical transformers and electrical equipment are outside of buildings at some locations.
Building security must be maintained to protect electrical and control systems.
Extensive vegetation growth at the BWS facilities should be removed.
Additional security cameras will improve surveillance.
The Security Study recommends the following actions:
Install more robust fencing;
Remove vegetation and install weed barriers and gravel adjacent to fence lines;
Install hurricane and intruder resistant enclosures around pumps and electrical systems;
Add additional security camera systems;
Section 11 Facility Condition Assessment
October 2016 11-29
Prioritize projects based on consequence of a security incident (e.g., higher for large
source) and likelihood of incident (e.g., where no fencing, outside pumps, etc.); and
Based on priority, implement projects (approximately 20 sites per year) over a 15-year
period.

Section 11 Facility Condition Assessment
11-30 October 2016
This page intentionally left blank.
Part III
Findings and Implementation

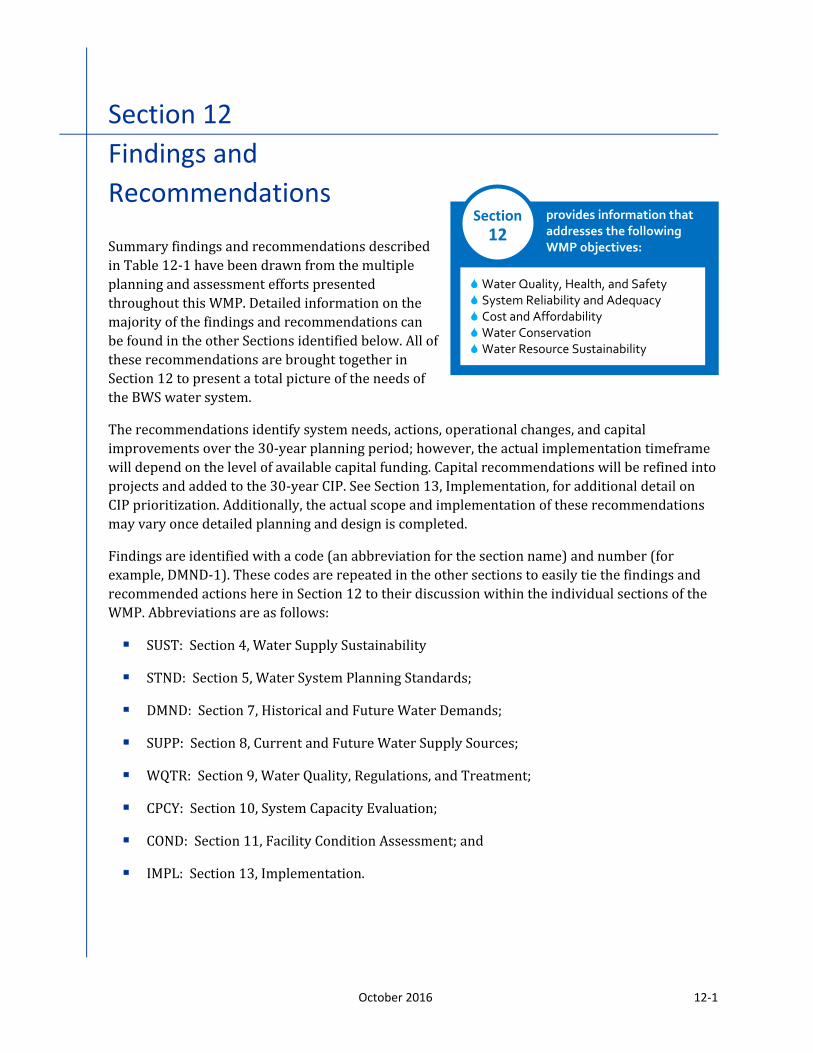
October 2016 12-1
Section 12
Findings and
Recommendations
Summary findings and recommendations described
in Table 12-1 have been drawn from the multiple
planning and assessment efforts presented
throughout this WMP. Detailed information on the
majority of the findings and recommendations can
be found in the other Sections identified below. All of
these recommendations are brought together in
Section 12 to present a total picture of the needs of
the BWS water system.
The recommendations identify system needs, actions, operational changes, and capital
improvements over the 30-year planning period; however, the actual implementation timeframe
will depend on the level of available capital funding. Capital recommendations will be refined into
projects and added to the 30-year CIP. See Section 13, Implementation, for additional detail on
CIP prioritization. Additionally, the actual scope and implementation of these recommendations
may vary once detailed planning and design is completed.
Findings are identified with a code (an abbreviation for the section name) and number (for
example, DMND-1). These codes are repeated in the other sections to easily tie the findings and
recommended actions here in Section 12 to their discussion within the individual sections of the
WMP. Abbreviations are as follows:
SUST: Section 4, Water Supply Sustainability
STND: Section 5, Water System Planning Standards;
DMND: Section 7, Historical and Future Water Demands;
SUPP: Section 8, Current and Future Water Supply Sources;
WQTR: Section 9, Water Quality, Regulations, and Treatment;
CPCY: Section 10, System Capacity Evaluation;
COND: Section 11, Facility Condition Assessment; and
IMPL: Section 13, Implementation.
provides information that
addresses the following
WMP objectives:
Water Quality, Health, and Safety
System Reliability and Adequacy
Cost and Affordability
Water Conservation
Water Resource Sustainability
Section
12
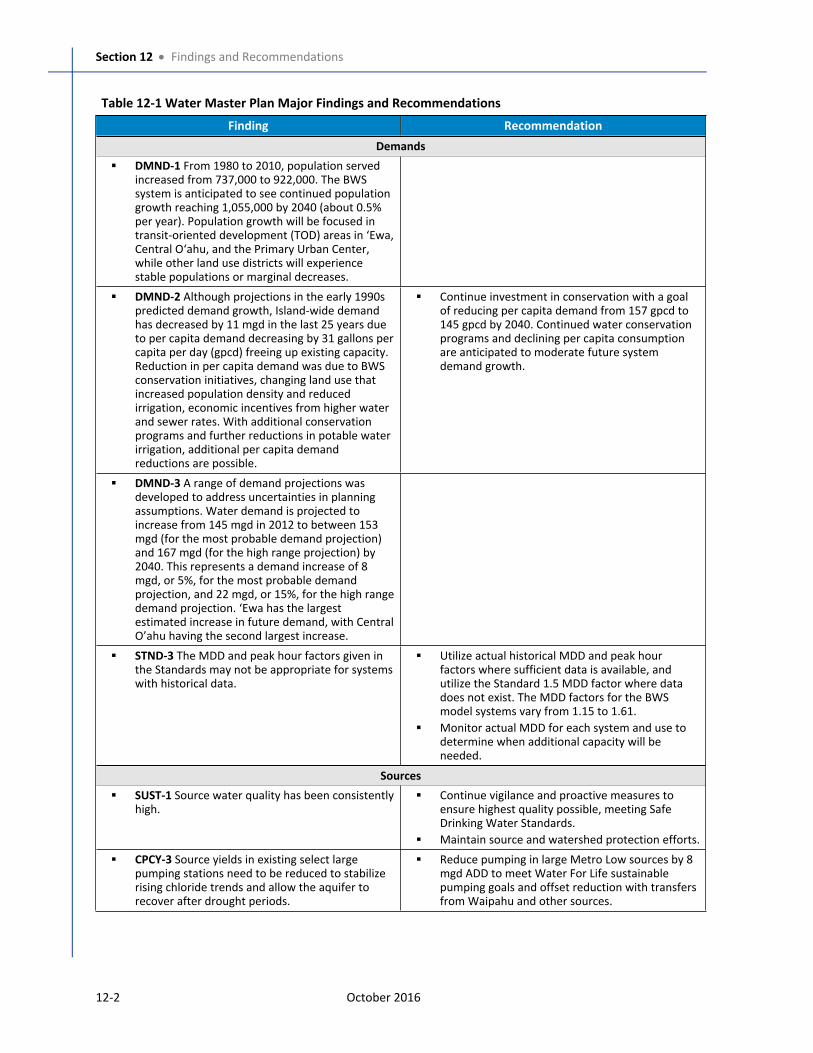
Section 12 Findings and Recommendations
12-2 October 2016
Table 12-1 Water Master Plan Major Findings and Recommendations
Finding Recommendation
Demands
DMND-1 From 1980 to 2010, population served increased from 737,000 to 922,000. The BWS system is anticipated to see continued population growth reaching 1,055,000 by 2040 (about 0.5% per year). Population growth will be focused in transit-oriented development (TOD) areas in ‘Ewa, Central O‘ahu, and the Primary Urban Center, while other land use districts will experience stable populations or marginal decreases.
DMND-2 Although projections in the early 1990s predicted demand growth, Island-wide demand has decreased by 11 mgd in the last 25 years due to per capita demand decreasing by 31 gallons per capita per day (gpcd) freeing up existing capacity. Reduction in per capita demand was due to BWS conservation initiatives, changing land use that increased population density and reduced irrigation, economic incentives from higher water and sewer rates. With additional conservation programs and further reductions in potable water irrigation, additional per capita demand reductions are possible.
Continue investment in conservation with a goal of reducing per capita demand from 157 gpcd to 145 gpcd by 2040. Continued water conservation programs and declining per capita consumption are anticipated to moderate future system demand growth.
DMND-3 A range of demand projections was developed to address uncertainties in planning assumptions. Water demand is projected to increase from 145 mgd in 2012 to between 153 mgd (for the most probable demand projection) and 167 mgd (for the high range projection) by 2040. This represents a demand increase of 8 mgd, or 5%, for the most probable demand projection, and 22 mgd, or 15%, for the high range demand projection. ‘Ewa has the largest estimated increase in future demand, with Central O’ahu having the second largest increase.
STND-3 The MDD and peak hour factors given in the Standards may not be appropriate for systems with historical data.
Utilize actual historical MDD and peak hour factors where sufficient data is available, and utilize the Standard 1.5 MDD factor where data does not exist. The MDD factors for the BWS model systems vary from 1.15 to 1.61.
Monitor actual MDD for each system and use to determine when additional capacity will be needed.
Sources
SUST-1 Source water quality has been consistently high.
Continue vigilance and proactive measures to ensure highest quality possible, meeting Safe Drinking Water Standards.
Maintain source and watershed protection efforts.
CPCY-3 Source yields in existing select large pumping stations need to be reduced to stabilize rising chloride trends and allow the aquifer to recover after drought periods.
Reduce pumping in large Metro Low sources by 8 mgd ADD to meet Water For Life sustainable pumping goals and offset reduction with transfers from Waipahu and other sources.
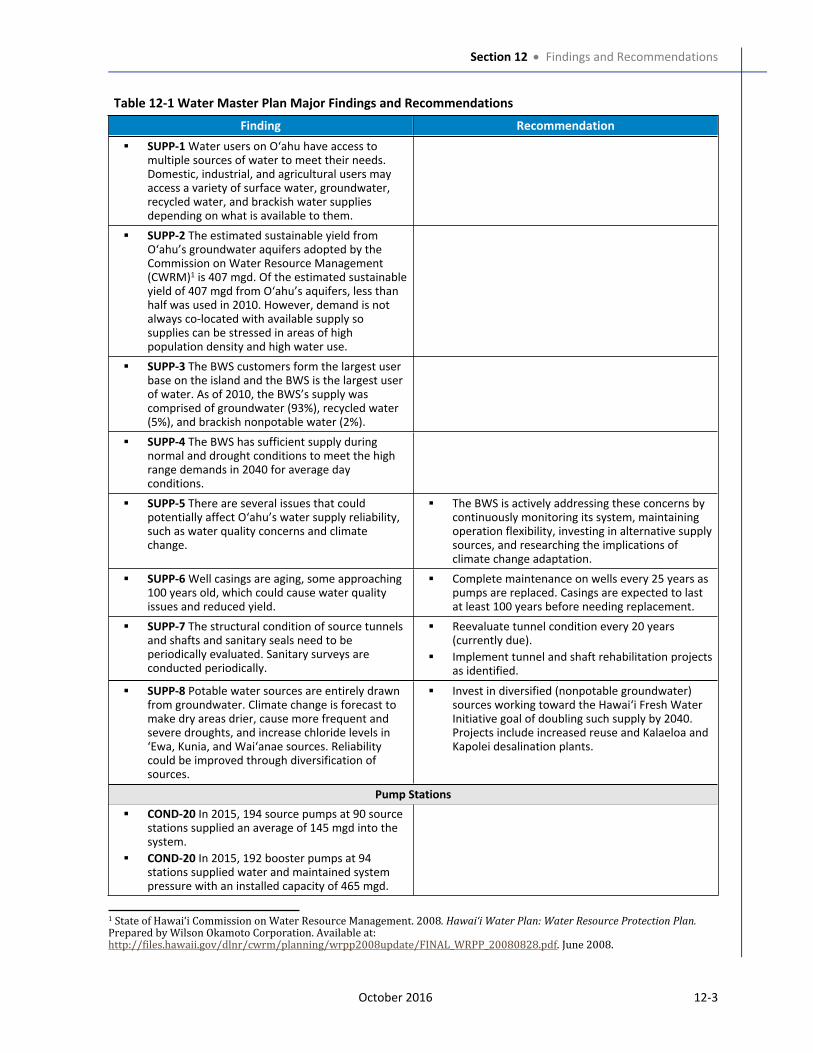
Section 12 Findings and Recommendations
October 2016 12-3
Table 12-1 Water Master Plan Major Findings and Recommendations
Finding Recommendation
SUPP-1 Water users on Oʻahu have access to multiple sources of water to meet their needs. Domestic, industrial, and agricultural users may access a variety of surface water, groundwater, recycled water, and brackish water supplies depending on what is available to them.
SUPP-2 The estimated sustainable yield from Oʻahu’s groundwater aquifers adopted by the Commission on Water Resource Management (CWRM)1 is 407 mgd. Of the estimated sustainable yield of 407 mgd from Oʻahu’s aquifers, less than half was used in 2010. However, demand is not always co-located with available supply so supplies can be stressed in areas of high population density and high water use.
SUPP-3 The BWS customers form the largest user base on the island and the BWS is the largest user of water. As of 2010, the BWS’s supply was comprised of groundwater (93%), recycled water (5%), and brackish nonpotable water (2%).
SUPP-4 The BWS has sufficient supply during normal and drought conditions to meet the high range demands in 2040 for average day conditions.
SUPP-5 There are several issues that could potentially affect Oʻahu’s water supply reliability, such as water quality concerns and climate change.
The BWS is actively addressing these concerns by continuously monitoring its system, maintaining operation flexibility, investing in alternative supply sources, and researching the implications of climate change adaptation.
SUPP-6 Well casings are aging, some approaching 100 years old, which could cause water quality issues and reduced yield.
Complete maintenance on wells every 25 years as pumps are replaced. Casings are expected to last at least 100 years before needing replacement.
SUPP-7 The structural condition of source tunnels and shafts and sanitary seals need to be periodically evaluated. Sanitary surveys are conducted periodically.
Reevaluate tunnel condition every 20 years (currently due).
Implement tunnel and shaft rehabilitation projects as identified.
SUPP-8 Potable water sources are entirely drawn from groundwater. Climate change is forecast to make dry areas drier, cause more frequent and severe droughts, and increase chloride levels in ‘Ewa, Kunia, and Wai‘anae sources. Reliability could be improved through diversification of sources.
Invest in diversified (nonpotable groundwater) sources working toward the Hawaiʻi Fresh Water Initiative goal of doubling such supply by 2040. Projects include increased reuse and Kalaeloa and Kapolei desalination plants.
Pump Stations
COND-20 In 2015, 194 source pumps at 90 source stations supplied an average of 145 mgd into the system.
COND-20 In 2015, 192 booster pumps at 94 stations supplied water and maintained system pressure with an installed capacity of 465 mgd.
1 State of Hawaiʻi Commission on Water Resource Management. 2008. Hawaiʻi Water Plan: Water Resource Protection Plan. Prepared by Wilson Okamoto Corporation. Available at: http://files.hawaii.gov/dlnr/cwrm/planning/wrpp2008update/FINAL_WRPP_20080828.pdf. June 2008.
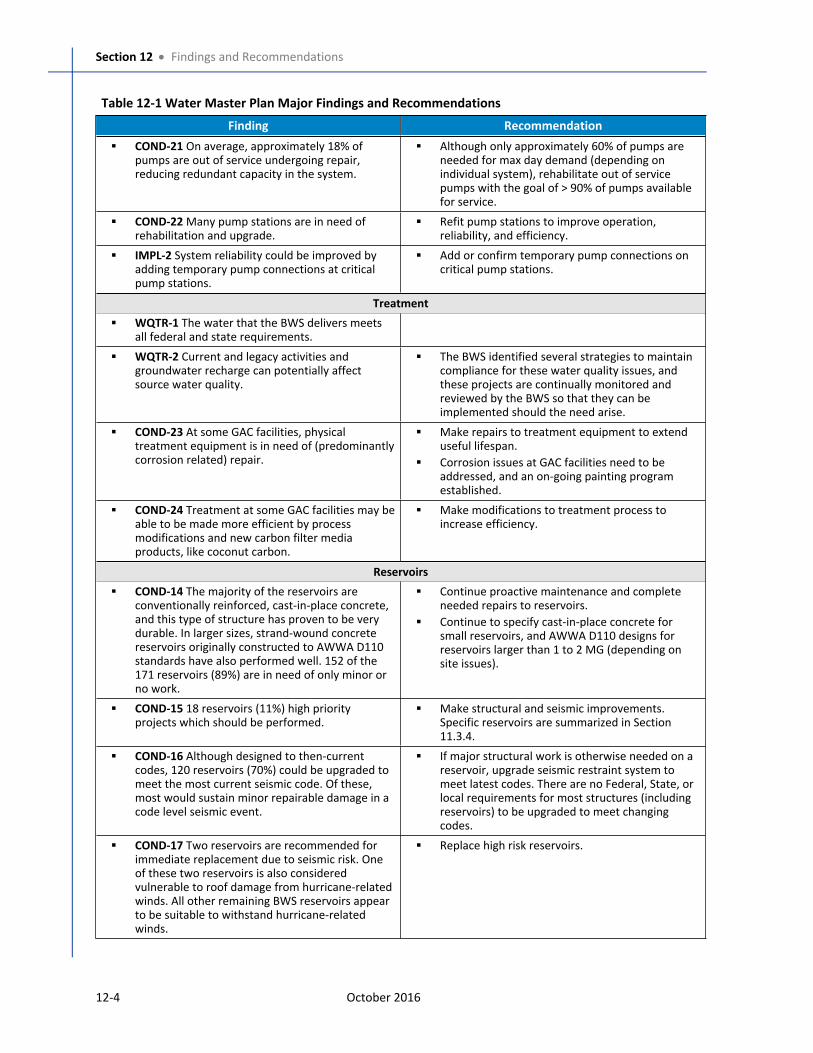
Section 12 Findings and Recommendations
12-4 October 2016
Table 12-1 Water Master Plan Major Findings and Recommendations
Finding Recommendation
COND-21 On average, approximately 18% of pumps are out of service undergoing repair, reducing redundant capacity in the system.
Although only approximately 60% of pumps are needed for max day demand (depending on individual system), rehabilitate out of service pumps with the goal of > 90% of pumps available for service.
COND-22 Many pump stations are in need of rehabilitation and upgrade.
Refit pump stations to improve operation, reliability, and efficiency.
IMPL-2 System reliability could be improved by adding temporary pump connections at critical pump stations.
Add or confirm temporary pump connections on critical pump stations.
Treatment
WQTR-1 The water that the BWS delivers meets all federal and state requirements.
WQTR-2 Current and legacy activities and groundwater recharge can potentially affect source water quality.
The BWS identified several strategies to maintain compliance for these water quality issues, and these projects are continually monitored and reviewed by the BWS so that they can be implemented should the need arise.
COND-23 At some GAC facilities, physical treatment equipment is in need of (predominantly corrosion related) repair.
Make repairs to treatment equipment to extend useful lifespan.
Corrosion issues at GAC facilities need to be addressed, and an on-going painting program established.
COND-24 Treatment at some GAC facilities may be able to be made more efficient by process modifications and new carbon filter media products, like coconut carbon.
Make modifications to treatment process to increase efficiency.
Reservoirs
COND-14 The majority of the reservoirs are conventionally reinforced, cast-in-place concrete, and this type of structure has proven to be very durable. In larger sizes, strand-wound concrete reservoirs originally constructed to AWWA D110 standards have also performed well. 152 of the 171 reservoirs (89%) are in need of only minor or no work.
Continue proactive maintenance and complete needed repairs to reservoirs.
Continue to specify cast-in-place concrete for small reservoirs, and AWWA D110 designs for reservoirs larger than 1 to 2 MG (depending on site issues).
COND-15 18 reservoirs (11%) high priority projects which should be performed.
Make structural and seismic improvements. Specific reservoirs are summarized in Section 11.3.4.
COND-16 Although designed to then-current codes, 120 reservoirs (70%) could be upgraded to meet the most current seismic code. Of these, most would sustain minor repairable damage in a code level seismic event.
If major structural work is otherwise needed on a reservoir, upgrade seismic restraint system to meet latest codes. There are no Federal, State, or local requirements for most structures (including reservoirs) to be upgraded to meet changing codes.
COND-17 Two reservoirs are recommended for immediate replacement due to seismic risk. One of these two reservoirs is also considered vulnerable to roof damage from hurricane-related winds. All other remaining BWS reservoirs appear to be suitable to withstand hurricane-related winds.
Replace high risk reservoirs.
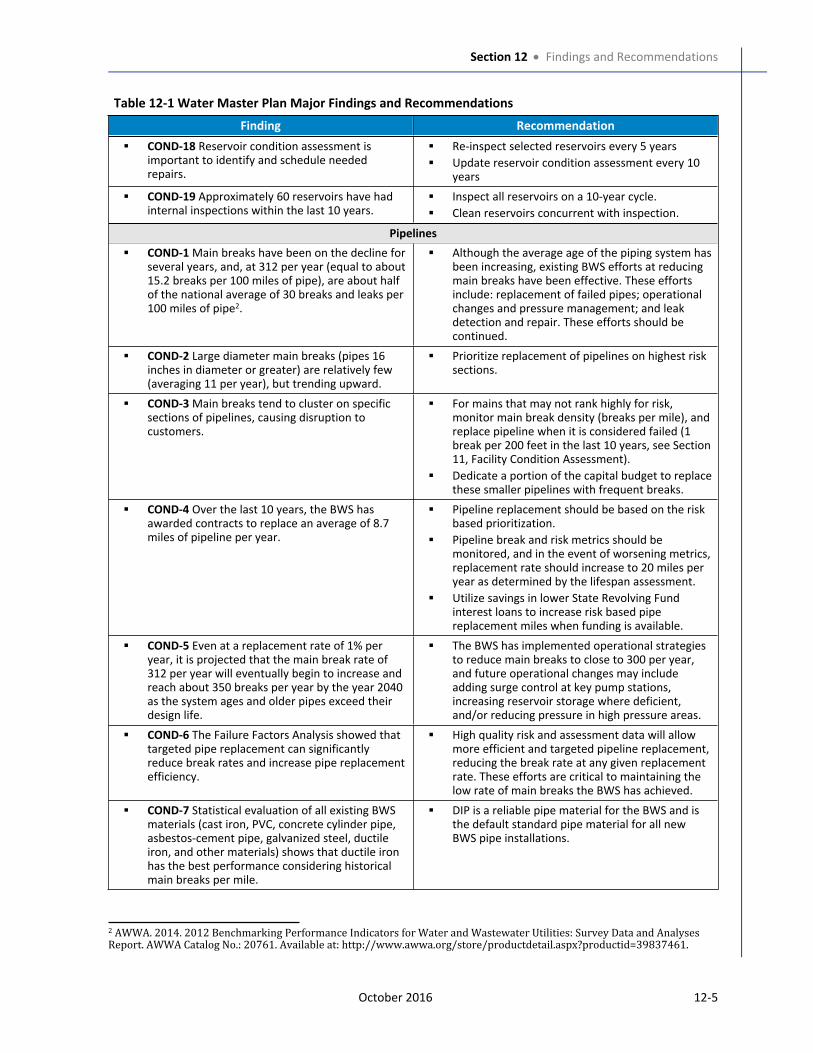
Section 12 Findings and Recommendations
October 2016 12-5
Table 12-1 Water Master Plan Major Findings and Recommendations
Finding Recommendation
COND-18 Reservoir condition assessment is important to identify and schedule needed repairs.
Re-inspect selected reservoirs every 5 years
Update reservoir condition assessment every 10 years
COND-19 Approximately 60 reservoirs have had internal inspections within the last 10 years.
Inspect all reservoirs on a 10-year cycle.
Clean reservoirs concurrent with inspection.
Pipelines
COND-1 Main breaks have been on the decline for several years, and, at 312 per year (equal to about 15.2 breaks per 100 miles of pipe), are about half of the national average of 30 breaks and leaks per 100 miles of pipe2.
Although the average age of the piping system has been increasing, existing BWS efforts at reducing main breaks have been effective. These efforts include: replacement of failed pipes; operational changes and pressure management; and leak detection and repair. These efforts should be continued.
COND-2 Large diameter main breaks (pipes 16 inches in diameter or greater) are relatively few (averaging 11 per year), but trending upward.
Prioritize replacement of pipelines on highest risk sections.
COND-3 Main breaks tend to cluster on specific sections of pipelines, causing disruption to customers.
For mains that may not rank highly for risk, monitor main break density (breaks per mile), and replace pipeline when it is considered failed (1 break per 200 feet in the last 10 years, see Section 11, Facility Condition Assessment).
Dedicate a portion of the capital budget to replace these smaller pipelines with frequent breaks.
COND-4 Over the last 10 years, the BWS has awarded contracts to replace an average of 8.7 miles of pipeline per year.
Pipeline replacement should be based on the risk based prioritization.
Pipeline break and risk metrics should be monitored, and in the event of worsening metrics, replacement rate should increase to 20 miles per year as determined by the lifespan assessment.
Utilize savings in lower State Revolving Fund interest loans to increase risk based pipe replacement miles when funding is available.
COND-5 Even at a replacement rate of 1% per year, it is projected that the main break rate of 312 per year will eventually begin to increase and reach about 350 breaks per year by the year 2040 as the system ages and older pipes exceed their design life.
The BWS has implemented operational strategies to reduce main breaks to close to 300 per year, and future operational changes may include adding surge control at key pump stations, increasing reservoir storage where deficient, and/or reducing pressure in high pressure areas.
COND-6 The Failure Factors Analysis showed that targeted pipe replacement can significantly reduce break rates and increase pipe replacement efficiency.
High quality risk and assessment data will allow more efficient and targeted pipeline replacement, reducing the break rate at any given replacement rate. These efforts are critical to maintaining the low rate of main breaks the BWS has achieved.
COND-7 Statistical evaluation of all existing BWS materials (cast iron, PVC, concrete cylinder pipe, asbestos-cement pipe, galvanized steel, ductile iron, and other materials) shows that ductile iron has the best performance considering historical main breaks per mile.
DIP is a reliable pipe material for the BWS and is the default standard pipe material for all new BWS pipe installations.
2 AWWA. 2014. 2012 Benchmarking Performance Indicators for Water and Wastewater Utilities: Survey Data and Analyses Report. AWWA Catalog No.: 20761. Available at: http://www.awwa.org/store/productdetail.aspx?productid=39837461.
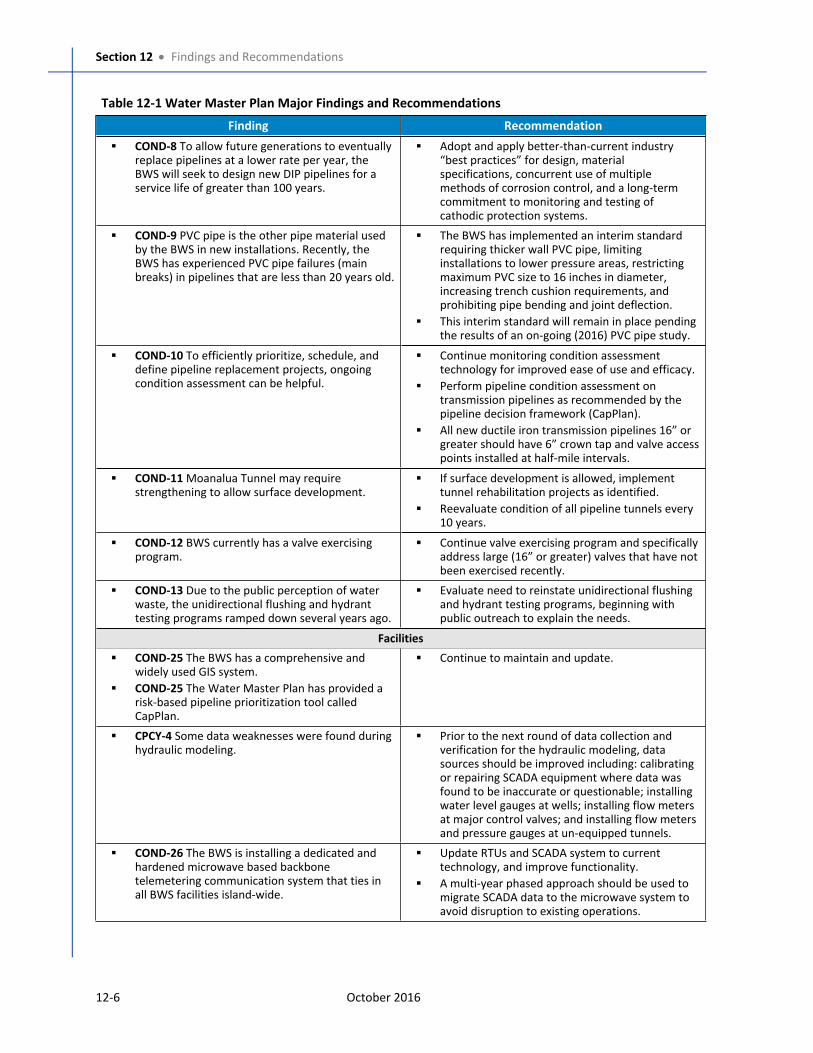
Section 12 Findings and Recommendations
12-6 October 2016
Table 12-1 Water Master Plan Major Findings and Recommendations
Finding Recommendation
COND-8 To allow future generations to eventually replace pipelines at a lower rate per year, the BWS will seek to design new DIP pipelines for a service life of greater than 100 years.
Adopt and apply better-than-current industry “best practices” for design, material specifications, concurrent use of multiple methods of corrosion control, and a long-term commitment to monitoring and testing of cathodic protection systems.
COND-9 PVC pipe is the other pipe material used by the BWS in new installations. Recently, the BWS has experienced PVC pipe failures (main breaks) in pipelines that are less than 20 years old.
The BWS has implemented an interim standard requiring thicker wall PVC pipe, limiting installations to lower pressure areas, restricting maximum PVC size to 16 inches in diameter, increasing trench cushion requirements, and prohibiting pipe bending and joint deflection.
This interim standard will remain in place pending the results of an on-going (2016) PVC pipe study.
COND-10 To efficiently prioritize, schedule, and define pipeline replacement projects, ongoing condition assessment can be helpful.
Continue monitoring condition assessment technology for improved ease of use and efficacy.
Perform pipeline condition assessment on transmission pipelines as recommended by the pipeline decision framework (CapPlan).
All new ductile iron transmission pipelines 16” or greater should have 6” crown tap and valve access points installed at half-mile intervals.
COND-11 Moanalua Tunnel may require strengthening to allow surface development.
If surface development is allowed, implement tunnel rehabilitation projects as identified.
Reevaluate condition of all pipeline tunnels every 10 years.
COND-12 BWS currently has a valve exercising program.
Continue valve exercising program and specifically address large (16” or greater) valves that have not been exercised recently.
COND-13 Due to the public perception of water waste, the unidirectional flushing and hydrant testing programs ramped down several years ago.
Evaluate need to reinstate unidirectional flushing and hydrant testing programs, beginning with public outreach to explain the needs.
Facilities
COND-25 The BWS has a comprehensive and widely used GIS system.
COND-25 The Water Master Plan has provided a risk-based pipeline prioritization tool called CapPlan.
Continue to maintain and update.
CPCY-4 Some data weaknesses were found during hydraulic modeling.
Prior to the next round of data collection and verification for the hydraulic modeling, data sources should be improved including: calibrating or repairing SCADA equipment where data was found to be inaccurate or questionable; installing water level gauges at wells; installing flow meters at major control valves; and installing flow meters and pressure gauges at un-equipped tunnels.
COND-26 The BWS is installing a dedicated and hardened microwave based backbone telemetering communication system that ties in all BWS facilities island-wide.
Update RTUs and SCADA system to current technology, and improve functionality.
A multi-year phased approach should be used to migrate SCADA data to the microwave system to avoid disruption to existing operations.
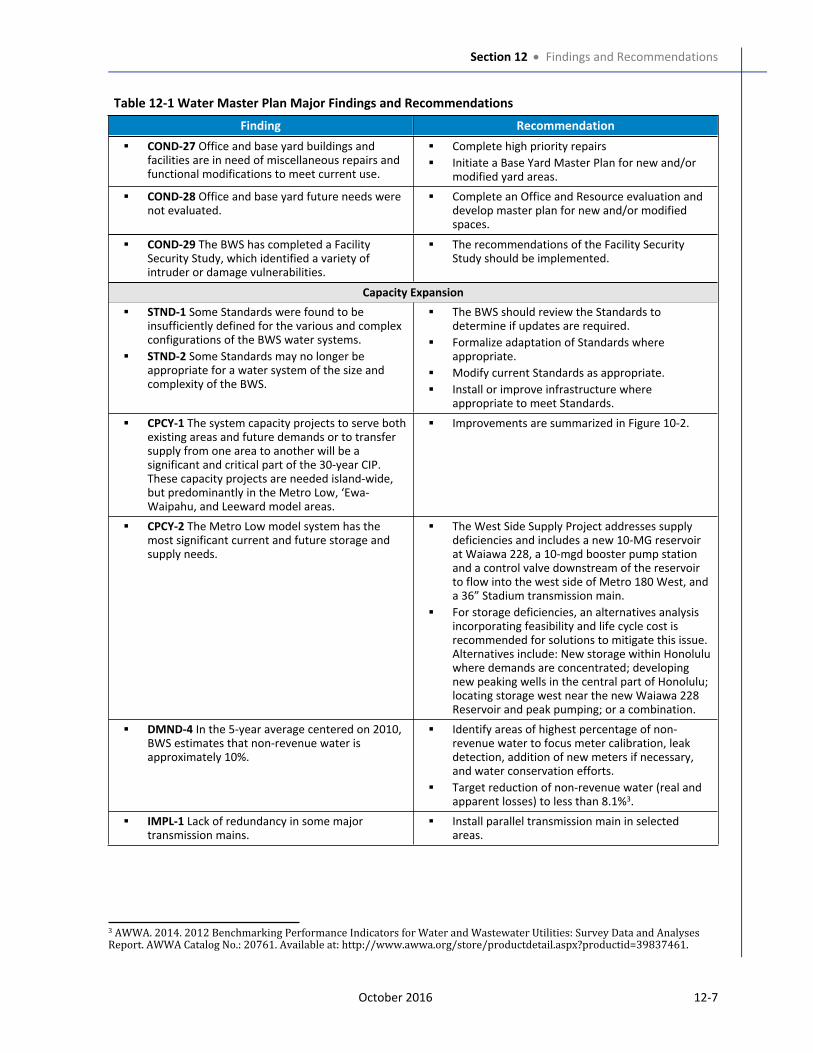
Section 12 Findings and Recommendations
October 2016 12-7
Table 12-1 Water Master Plan Major Findings and Recommendations
Finding Recommendation
COND-27 Office and base yard buildings and facilities are in need of miscellaneous repairs and functional modifications to meet current use.
Complete high priority repairs
Initiate a Base Yard Master Plan for new and/or modified yard areas.
COND-28 Office and base yard future needs were not evaluated.
Complete an Office and Resource evaluation and develop master plan for new and/or modified spaces.
COND-29 The BWS has completed a Facility Security Study, which identified a variety of intruder or damage vulnerabilities.
The recommendations of the Facility Security Study should be implemented.
Capacity Expansion
STND-1 Some Standards were found to be insufficiently defined for the various and complex configurations of the BWS water systems.
STND-2 Some Standards may no longer be appropriate for a water system of the size and complexity of the BWS.
The BWS should review the Standards to determine if updates are required.
Formalize adaptation of Standards where appropriate.
Modify current Standards as appropriate.
Install or improve infrastructure where appropriate to meet Standards.
CPCY-1 The system capacity projects to serve both existing areas and future demands or to transfer supply from one area to another will be a significant and critical part of the 30-year CIP. These capacity projects are needed island-wide, but predominantly in the Metro Low, ‘Ewa-Waipahu, and Leeward model areas.
Improvements are summarized in Figure 10-2.
CPCY-2 The Metro Low model system has the most significant current and future storage and supply needs.
The West Side Supply Project addresses supply deficiencies and includes a new 10-MG reservoir at Waiawa 228, a 10-mgd booster pump station and a control valve downstream of the reservoir to flow into the west side of Metro 180 West, and a 36” Stadium transmission main.
For storage deficiencies, an alternatives analysis incorporating feasibility and life cycle cost is recommended for solutions to mitigate this issue. Alternatives include: New storage within Honolulu where demands are concentrated; developing new peaking wells in the central part of Honolulu; locating storage west near the new Waiawa 228 Reservoir and peak pumping; or a combination.
DMND-4 In the 5-year average centered on 2010, BWS estimates that non-revenue water is approximately 10%.
Identify areas of highest percentage of non-revenue water to focus meter calibration, leak detection, addition of new meters if necessary, and water conservation efforts.
Target reduction of non-revenue water (real and apparent losses) to less than 8.1%3.
IMPL-1 Lack of redundancy in some major transmission mains.
Install parallel transmission main in selected areas.
3 AWWA. 2014. 2012 Benchmarking Performance Indicators for Water and Wastewater Utilities: Survey Data and Analyses Report. AWWA Catalog No.: 20761. Available at: http://www.awwa.org/store/productdetail.aspx?productid=39837461.
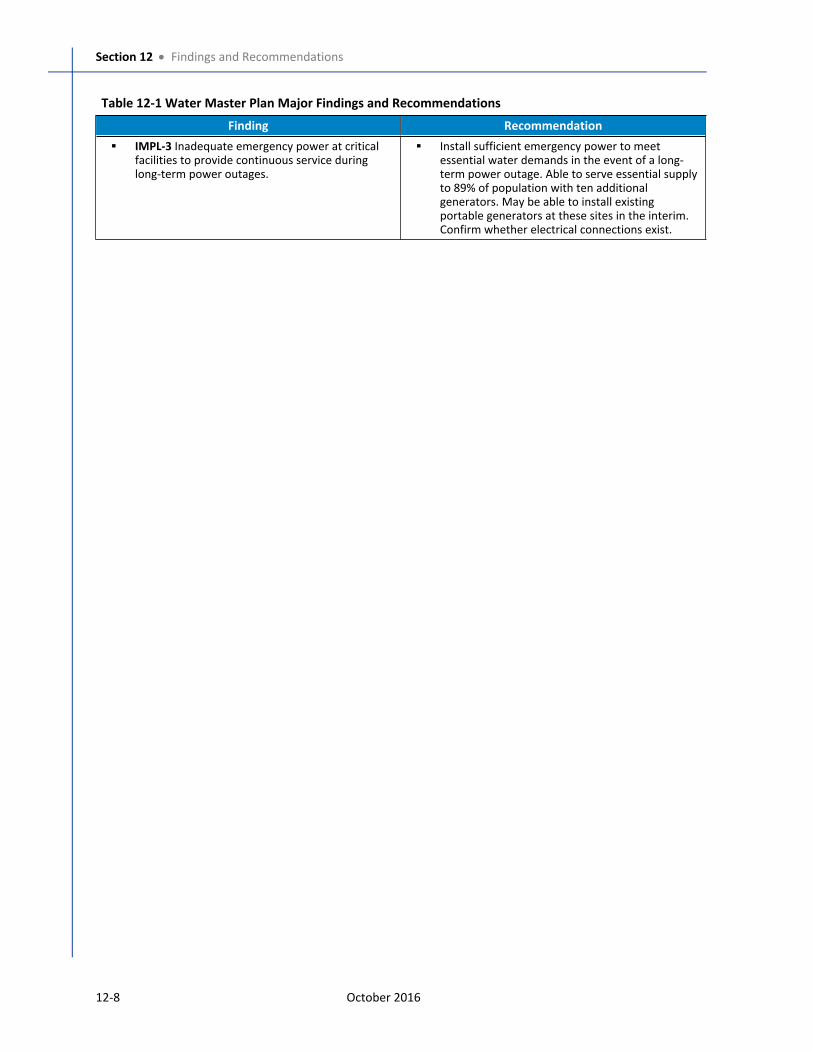
Section 12 Findings and Recommendations
12-8 October 2016
Table 12-1 Water Master Plan Major Findings and Recommendations
Finding Recommendation
IMPL-3 Inadequate emergency power at critical facilities to provide continuous service during long-term power outages.
Install sufficient emergency power to meet essential water demands in the event of a long-term power outage. Able to serve essential supply to 89% of population with ten additional generators. May be able to install existing portable generators at these sites in the interim. Confirm whether electrical connections exist.
October 2016 13-1
Section 13
Implementation
This section addresses the range of issues, beyond
infrastructure planning and prioritization as part of
the Capital Improvement Program (CIP)
development, necessary for successful
implementation of the WMP. These major areas
include funding, policies, organizational capacity,
monitoring and reporting progress, and updating of
the WMP.
The WMP’s key findings for implementation issues
are discussed in this section. These findings are identified with a code (an abbreviation for the
section name) and number (for example, IMPL-1). These codes are repeated in Section 12,
Findings and Recommendations, to easily tie the findings in this section to the recommendations
for BWS action listed in Section 12.
13.1 FundingThe BWS receives nearly all of its revenues from the sale of water to its customers. Water rates
are established by the BWS and vary by customer class. The BWS needs to establish a revenue
stream (through water rates) that is consistent with achieving the objectives of the WMP and the
mission of the BWS. Of the three elements of the BWS’s mission (safe, dependable, and
affordable), affordable is perhaps the most subjective. As a result, like almost all utility agencies,
the BWS will face the natural tension that exists in taking the actions necessary to provide safe
and dependable water at an affordable cost. And, while not explicitly part of its mission
statement, the concept of sustainability is fundamental to the BWS’s Strategic Plan, as its three
strategic goals are resource sustainability, operational sustainability, and financial sustainability.
Achieving these three goals involves more than the implementation of capital projects and
programs. It necessitates the dedication of resources to operational activities such as water
conservation, watershed management, and infrastructure operations and maintenance. Achieving
these goals also requires adequate funding to accomplish these activities in a manner that
supports achieving the BWS’s mission.
The BWS’s water rate structure has remained virtually unchanged since 1993. Like many other
water utilities, the BWS’s rates are predominantly volumetric, meaning that they are based on the
amount of water sold. However, the majority of an established water utility’s costs are fixed and
independent of the volume of water served in any given period of time. As a result, with the
success of conservation programs, many water utilities have had to raise their volumetric rates
and/or adjust their rate structure so that a larger portion of the charges are fixed and
independent of the volume of water consumed. This trend has been affecting water utilities
across the U.S., and particularly those agencies with successful water conservation programs like
the BWS.
provides information that
addresses the following
WMP objectives:
Water Quality, Health, and Safety
System Reliability and Adequacy
Cost and Affordability
Water Conservation
Water Resource Sustainability
Section
13
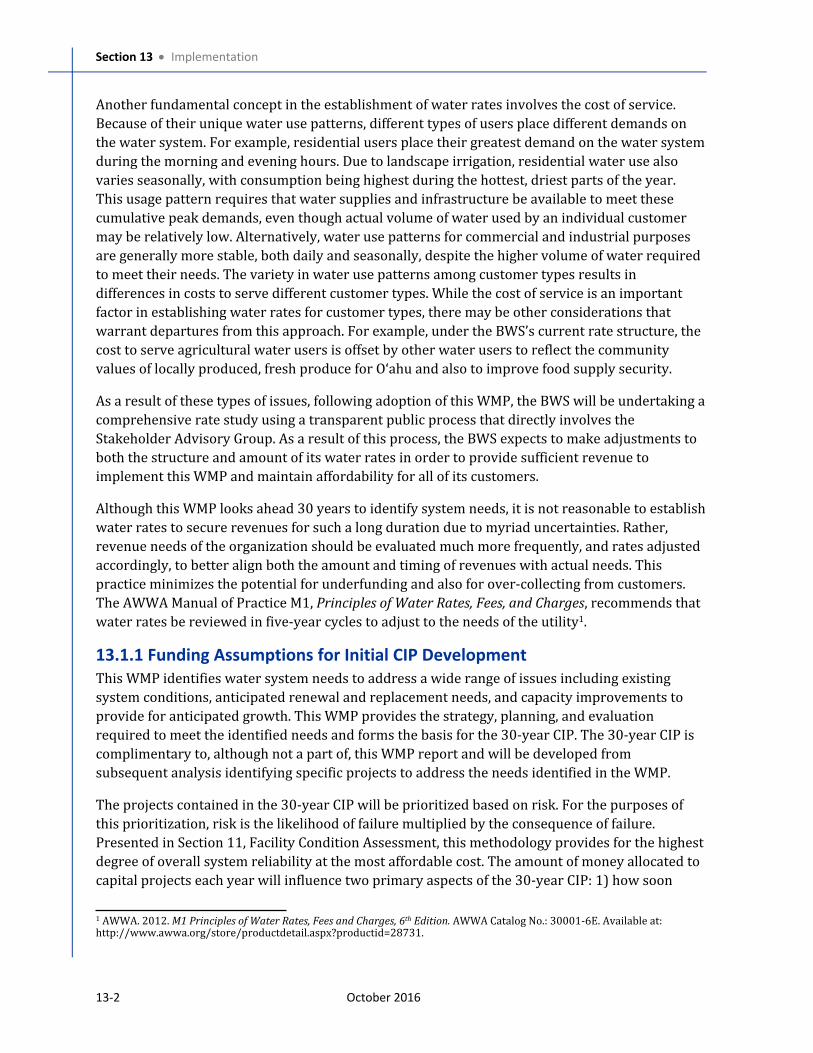
Section 13 Implementation
13-2 October 2016
Another fundamental concept in the establishment of water rates involves the cost of service.
Because of their unique water use patterns, different types of users place different demands on
the water system. For example, residential users place their greatest demand on the water system
during the morning and evening hours. Due to landscape irrigation, residential water use also
varies seasonally, with consumption being highest during the hottest, driest parts of the year.
This usage pattern requires that water supplies and infrastructure be available to meet these
cumulative peak demands, even though actual volume of water used by an individual customer
may be relatively low. Alternatively, water use patterns for commercial and industrial purposes
are generally more stable, both daily and seasonally, despite the higher volume of water required
to meet their needs. The variety in water use patterns among customer types results in
differences in costs to serve different customer types. While the cost of service is an important
factor in establishing water rates for customer types, there may be other considerations that
warrant departures from this approach. For example, under the BWS’s current rate structure, the
cost to serve agricultural water users is offset by other water users to reflect the community
values of locally produced, fresh produce for O‘ahu and also to improve food supply security.
As a result of these types of issues, following adoption of this WMP, the BWS will be undertaking a
comprehensive rate study using a transparent public process that directly involves the
Stakeholder Advisory Group. As a result of this process, the BWS expects to make adjustments to
both the structure and amount of its water rates in order to provide sufficient revenue to
implement this WMP and maintain affordability for all of its customers.
Although this WMP looks ahead 30 years to identify system needs, it is not reasonable to establish
water rates to secure revenues for such a long duration due to myriad uncertainties. Rather,
revenue needs of the organization should be evaluated much more frequently, and rates adjusted
accordingly, to better align both the amount and timing of revenues with actual needs. This
practice minimizes the potential for underfunding and also for over-collecting from customers.
The AWWA Manual of Practice M1, Principles of Water Rates, Fees, and Charges, recommends that
water rates be reviewed in five-year cycles to adjust to the needs of the utility1.
13.1.1 Funding Assumptions for Initial CIP Development
This WMP identifies water system needs to address a wide range of issues including existing
system conditions, anticipated renewal and replacement needs, and capacity improvements to
provide for anticipated growth. This WMP provides the strategy, planning, and evaluation
required to meet the identified needs and forms the basis for the 30-year CIP. The 30-year CIP is
complimentary to, although not a part of, this WMP report and will be developed from
subsequent analysis identifying specific projects to address the needs identified in the WMP.
The projects contained in the 30-year CIP will be prioritized based on risk. For the purposes of
this prioritization, risk is the likelihood of failure multiplied by the consequence of failure.
Presented in Section 11, Facility Condition Assessment, this methodology provides for the highest
degree of overall system reliability at the most affordable cost. The amount of money allocated to
capital projects each year will influence two primary aspects of the 30-year CIP: 1) how soon
1 AWWA. 2012. M1 Principles of Water Rates, Fees and Charges, 6th Edition. AWWA Catalog No.: 30001-6E. Available at: http://www.awwa.org/store/productdetail.aspx?productid=28731.
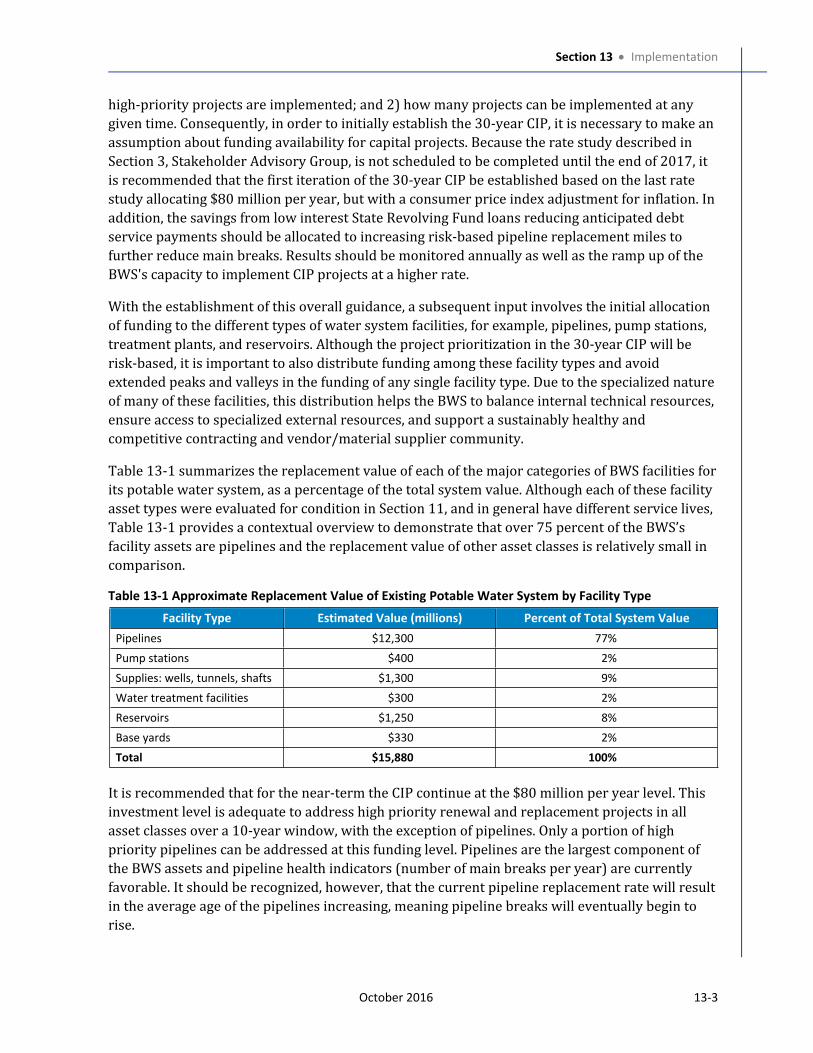
Section 13 Implementation
October 2016 13-3
high-priority projects are implemented; and 2) how many projects can be implemented at any
given time. Consequently, in order to initially establish the 30-year CIP, it is necessary to make an
assumption about funding availability for capital projects. Because the rate study described in
Section 3, Stakeholder Advisory Group, is not scheduled to be completed until the end of 2017, it
is recommended that the first iteration of the 30-year CIP be established based on the last rate
study allocating $80 million per year, but with a consumer price index adjustment for inflation. In
addition, the savings from low interest State Revolving Fund loans reducing anticipated debt
service payments should be allocated to increasing risk-based pipeline replacement miles to
further reduce main breaks. Results should be monitored annually as well as the ramp up of the
BWS's capacity to implement CIP projects at a higher rate.
With the establishment of this overall guidance, a subsequent input involves the initial allocation
of funding to the different types of water system facilities, for example, pipelines, pump stations,
treatment plants, and reservoirs. Although the project prioritization in the 30-year CIP will be
risk-based, it is important to also distribute funding among these facility types and avoid
extended peaks and valleys in the funding of any single facility type. Due to the specialized nature
of many of these facilities, this distribution helps the BWS to balance internal technical resources,
ensure access to specialized external resources, and support a sustainably healthy and
competitive contracting and vendor/material supplier community.
Table 13-1 summarizes the replacement value of each of the major categories of BWS facilities for
its potable water system, as a percentage of the total system value. Although each of these facility
asset types were evaluated for condition in Section 11, and in general have different service lives,
Table 13-1 provides a contextual overview to demonstrate that over 75 percent of the BWS’s
facility assets are pipelines and the replacement value of other asset classes is relatively small in
comparison.
Table 13-1 Approximate Replacement Value of Existing Potable Water System by Facility Type
Facility Type Estimated Value (millions) Percent of Total System Value
Pipelines $12,300 77%
Pump stations $400 2%
Supplies: wells, tunnels, shafts $1,300 9%
Water treatment facilities $300 2%
Reservoirs $1,250 8%
Base yards $330 2%
Total $15,880 100%
It is recommended that for the near-term the CIP continue at the $80 million per year level. This
investment level is adequate to address high priority renewal and replacement projects in all
asset classes over a 10-year window, with the exception of pipelines. Only a portion of high
priority pipelines can be addressed at this funding level. Pipelines are the largest component of
the BWS assets and pipeline health indicators (number of main breaks per year) are currently
favorable. It should be recognized, however, that the current pipeline replacement rate will result
in the average age of the pipelines increasing, meaning pipeline breaks will eventually begin to
rise.
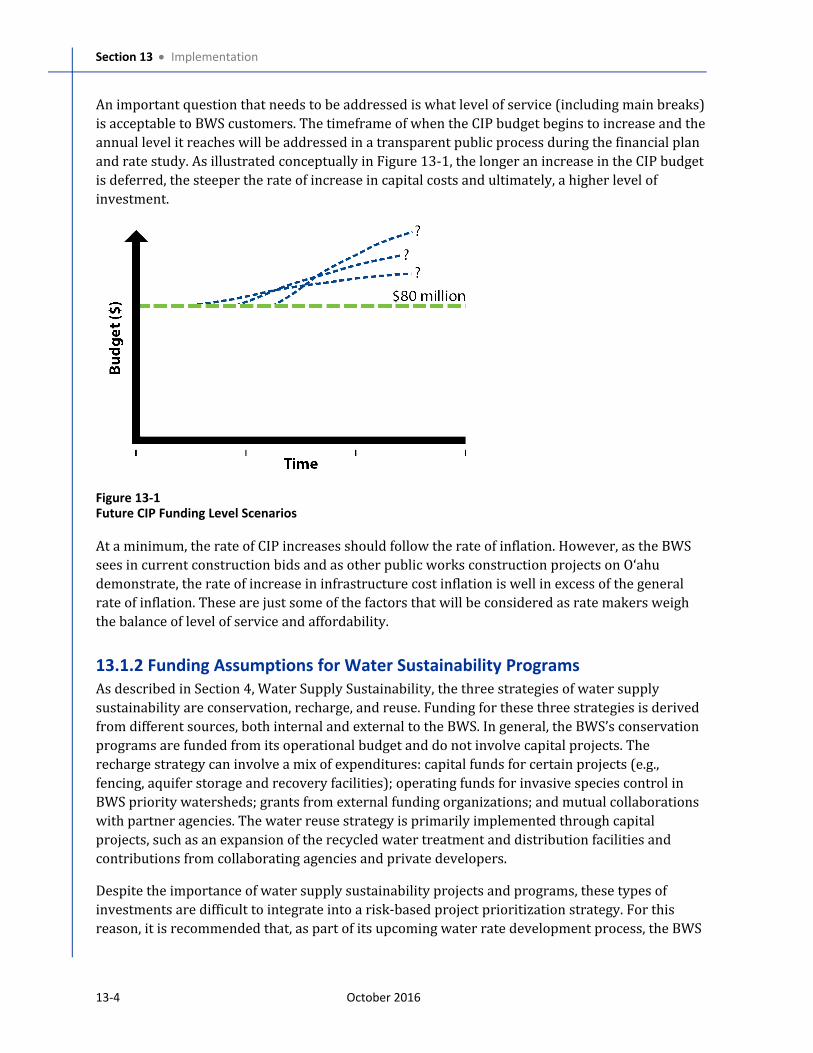
Section 13 Implementation
13-4 October 2016
An important question that needs to be addressed is what level of service (including main breaks)
is acceptable to BWS customers. The timeframe of when the CIP budget begins to increase and the
annual level it reaches will be addressed in a transparent public process during the financial plan
and rate study. As illustrated conceptually in Figure 13-1, the longer an increase in the CIP budget
is deferred, the steeper the rate of increase in capital costs and ultimately, a higher level of
investment.
Figure 13-1Future CIP Funding Level Scenarios
At a minimum, the rate of CIP increases should follow the rate of inflation. However, as the BWS
sees in current construction bids and as other public works construction projects on O‘ahu
demonstrate, the rate of increase in infrastructure cost inflation is well in excess of the general
rate of inflation. These are just some of the factors that will be considered as rate makers weigh
the balance of level of service and affordability.
13.1.2 Funding Assumptions for Water Sustainability Programs
As described in Section 4, Water Supply Sustainability, the three strategies of water supply
sustainability are conservation, recharge, and reuse. Funding for these three strategies is derived
from different sources, both internal and external to the BWS. In general, the BWS’s conservation
programs are funded from its operational budget and do not involve capital projects. The
recharge strategy can involve a mix of expenditures: capital funds for certain projects (e.g.,
fencing, aquifer storage and recovery facilities); operating funds for invasive species control in
BWS priority watersheds; grants from external funding organizations; and mutual collaborations
with partner agencies. The water reuse strategy is primarily implemented through capital
projects, such as an expansion of the recycled water treatment and distribution facilities and
contributions from collaborating agencies and private developers.
Despite the importance of water supply sustainability projects and programs, these types of
investments are difficult to integrate into a risk-based project prioritization strategy. For this
reason, it is recommended that, as part of its upcoming water rate development process, the BWS
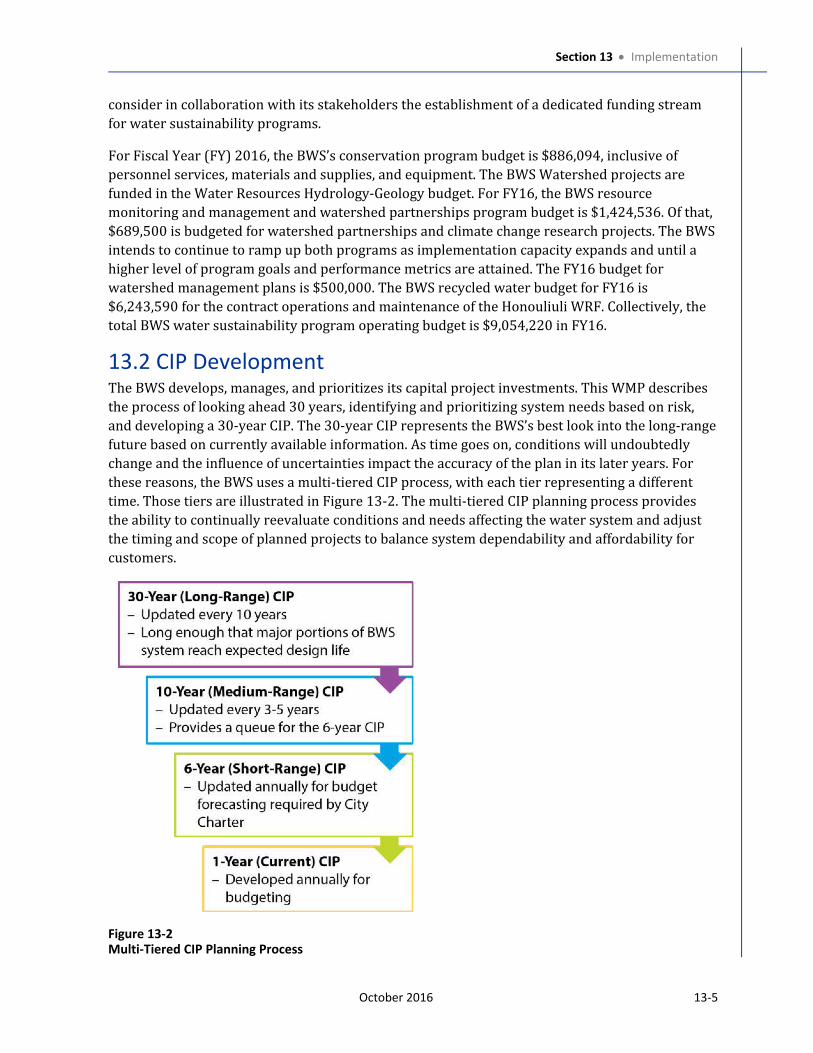
Section 13 Implementation
October 2016 13-5
consider in collaboration with its stakeholders the establishment of a dedicated funding stream
for water sustainability programs.
For Fiscal Year (FY) 2016, the BWS’s conservation program budget is $886,094, inclusive of
personnel services, materials and supplies, and equipment. The BWS Watershed projects are
funded in the Water Resources Hydrology-Geology budget. For FY16, the BWS resource
monitoring and management and watershed partnerships program budget is $1,424,536. Of that,
$689,500 is budgeted for watershed partnerships and climate change research projects. The BWS
intends to continue to ramp up both programs as implementation capacity expands and until a
higher level of program goals and performance metrics are attained. The FY16 budget for
watershed management plans is $500,000. The BWS recycled water budget for FY16 is
$6,243,590 for the contract operations and maintenance of the Honouliuli WRF. Collectively, the
total BWS water sustainability program operating budget is $9,054,220 in FY16.
13.2 CIP DevelopmentThe BWS develops, manages, and prioritizes its capital project investments. This WMP describes
the process of looking ahead 30 years, identifying and prioritizing system needs based on risk,
and developing a 30-year CIP. The 30-year CIP represents the BWS’s best look into the long-range
future based on currently available information. As time goes on, conditions will undoubtedly
change and the influence of uncertainties impact the accuracy of the plan in its later years. For
these reasons, the BWS uses a multi-tiered CIP process, with each tier representing a different
time. Those tiers are illustrated in Figure 13-2. The multi-tiered CIP planning process provides
the ability to continually reevaluate conditions and needs affecting the water system and adjust
the timing and scope of planned projects to balance system dependability and affordability for
customers.
Figure 13-2Multi-Tiered CIP Planning Process
Section 13 Implementation
13-6 October 2016
Each tier of the CIP process feeds into the tier below it. As major needs on the horizon are
identified, general placeholders are added into the 10- to 30-year time frame. As these needs
approach, increased definition is added to projects. When a project enters the 10-year CIP, a more
defined project description and cost estimates are developed and the project is scored for risk.
When a project enters the 6-year CIP, a complete scope and cost estimate for the project are
developed by the BWS and the project is prepared for planning and design. The 1-year CIP
contains the projects anticipated to be contracted in the upcoming fiscal year.
13.2.1 Project Types
The BWS categorizes capital projects in three general categories: capacity expansion projects;
renewal and replacement (R&R) projects; and research and development (R&D) projects. Each of
these is described further in this section.
13.2.1.1 Capacity Expansion Projects
Projects that are needed to meet growing water demand are considered capacity projects.
Capacity projects most commonly result from a projected increase in water demand related to
population growth or changing population distribution. Capacity projects are further described in
Section 10, System Capacity Evaluation. A benefit of some capacity projects is an increase in
system reliability due to the provision of redundant or parallel facilities.
Facilities associated with capacity projects can include wells, tunnels, treatment, pipelines, pump
stations, and reservoirs. Upsizing an existing facility (e.g., a pump station or pipeline) to meet
demands or fire flow requirements is also considered a capacity project, even though this need is
not necessarily due to population growth.
13.2.1.2 Renewal and Replacement Projects
Projects that are needed to renew or replace worn or aging infrastructure are R&R projects.
Examples of R&R projects are repairs of an existing well, improvements to existing pump stations,
structural repairs or upgrades to reservoirs and replacing aged pipelines.
13.2.1.3 Research and Development Projects
Examples of R&D projects include planning and engineering studies such as:
Feasibility studies;
Exploratory and/or monitoring wells;
Special monitoring;
Condition assessment (reservoirs, pipelines, pump stations, etc.), and;
Planning updates.
13.2.1.4 Other Projects
The BWS also has other types of projects that technically are not classified as CIP projects
because they are funded under Operations. These types of projects might include items such as
watershed management work and water conservation programs.
Section 13 Implementation
October 2016 13-7
13.2.2 Project Prioritization
This section outlines the process by which the CIP projects are prioritized. The discussion
includes capacity projects and R&R projects. R&D projects are normally prioritized based on
schedule (e.g., time elapsed since last plan update) or by a management decision.
Capacity projects are prioritized such that they can be planned, designed, constructed, tested, and
operational by the time they are needed to meet the associated demand. As such, they are placed
in the CIP based on when the system demands are anticipated to require the expansion. For this
reason, the date that capacity expansion projects are needed may be moved earlier or later, or if
demands grow much more slowly than anticipated they may never be needed.
R&R projects are prioritized in the following manner.
Pipeline projects are prioritized by total risk and the decision framework presented in
Section 11.2.
Reservoir projects are prioritized by condition assessment and associated risk.
Pump stations are prioritized by condition assessment and associated risk.
Water treatment facilities are prioritized by condition assessment.
Other facilities are prioritized based on risk, condition assessment, or management
decisions.
As discussed previously, the overall prioritization of projects within the CIP is risk based, which
considers the likelihood of failure of an asset and the consequence of that failure occurring. For
pipelines, a statistical model was used to determine the likelihood and consequence of failure as
presented in Section 11.2.2, Statistical Analysis of Pipelines. For reservoirs, pump stations, water
treatment facilities, and other assets, each project was assigned a risk score that was calculated
from metrics derived from industry standards and amended to meet the needs of the BWS.
An initial list of consequence of failure metrics was developed using AWWA M29: Water Utility
Capital Financing2. This initial list included 26 metrics within 6 criteria categories. The BWS
adopted 22 of these metrics that are appropriate for the O‘ahu water system and combined
several to reduce the total number to 15. The BWS then added several metrics, as well as a new
criterion (Water Resource Sustainability) suggested by the Stakeholder Advisory Group, to arrive
at 24 metrics within 7 criteria. A final criterion is the estimated likelihood of failure, which is
multiplied by the total of the consequence of failure criteria to produce a risk score. These metrics
help the BWS to assess risk and make clear how each project will help the BWS meet its mission
of provide safe, dependable, and affordable water now and into the future. The criteria and
metrics are summarized in Table 13-2.
2 AWWA. 2014. M29 Water Utility Capital Financing, Fourth Edition. AWWA Catalog No.: 30029-4E. Available at: http://www.awwa.org/store/productdetail.aspx?productid=43980747.
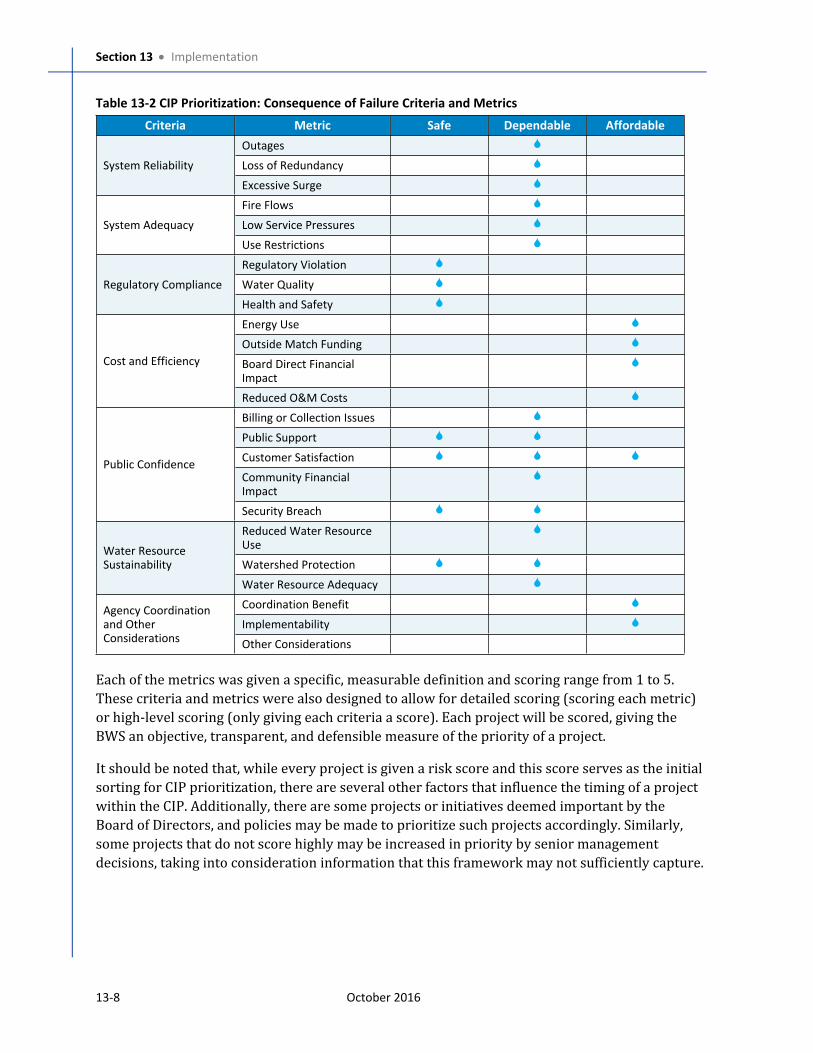
Section 13 Implementation
13-8 October 2016
Table 13-2 CIP Prioritization: Consequence of Failure Criteria and Metrics
Criteria Metric Safe Dependable Affordable
Outages
Loss of Redundancy System Reliability
Excessive Surge
Fire Flows
Low Service Pressures System Adequacy
Use Restrictions
Regulatory Violation
Water Quality Regulatory Compliance
Health and Safety
Energy Use
Outside Match Funding
Board Direct Financial Impact
Cost and Efficiency
Reduced O&M Costs
Billing or Collection Issues
Public Support
Customer Satisfaction
Community Financial Impact
Public Confidence
Security Breach
Reduced Water Resource Use
Watershed Protection Water Resource Sustainability
Water Resource Adequacy
Coordination Benefit
Implementability Agency Coordination and Other Considerations
Other Considerations
Each of the metrics was given a specific, measurable definition and scoring range from 1 to 5.
These criteria and metrics were also designed to allow for detailed scoring (scoring each metric)
or high-level scoring (only giving each criteria a score). Each project will be scored, giving the
BWS an objective, transparent, and defensible measure of the priority of a project.
It should be noted that, while every project is given a risk score and this score serves as the initial
sorting for CIP prioritization, there are several other factors that influence the timing of a project
within the CIP. Additionally, there are some projects or initiatives deemed important by the
Board of Directors, and policies may be made to prioritize such projects accordingly. Similarly,
some projects that do not score highly may be increased in priority by senior management
decisions, taking into consideration information that this framework may not sufficiently capture.
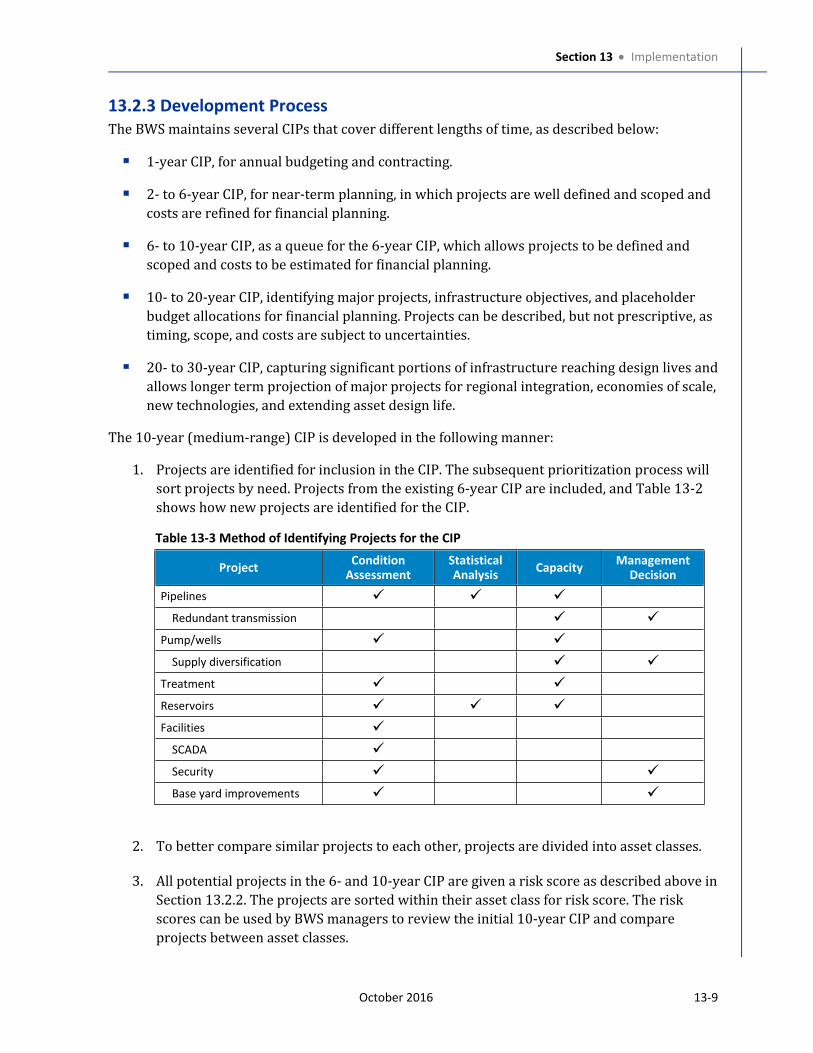
Section 13 Implementation
October 2016 13-9
13.2.3 Development Process
The BWS maintains several CIPs that cover different lengths of time, as described below:
1-year CIP, for annual budgeting and contracting.
2- to 6-year CIP, for near-term planning, in which projects are well defined and scoped and
costs are refined for financial planning.
6- to 10-year CIP, as a queue for the 6-year CIP, which allows projects to be defined and
scoped and costs to be estimated for financial planning.
10- to 20-year CIP, identifying major projects, infrastructure objectives, and placeholder
budget allocations for financial planning. Projects can be described, but not prescriptive, as
timing, scope, and costs are subject to uncertainties.
20- to 30-year CIP, capturing significant portions of infrastructure reaching design lives and
allows longer term projection of major projects for regional integration, economies of scale,
new technologies, and extending asset design life.
The 10-year (medium-range) CIP is developed in the following manner:
1. Projects are identified for inclusion in the CIP. The subsequent prioritization process will
sort projects by need. Projects from the existing 6-year CIP are included, and Table 13-2
shows how new projects are identified for the CIP.
Table 13-3 Method of Identifying Projects for the CIP
ProjectCondition
AssessmentStatistical Analysis
CapacityManagement
Decision
Pipelines Redundant transmission Pump/wells Supply diversification Treatment Reservoirs Facilities SCADA Security Base yard improvements
2. To better compare similar projects to each other, projects are divided into asset classes.
3. All potential projects in the 6- and 10-year CIP are given a risk score as described above in
Section 13.2.2. The projects are sorted within their asset class for risk score. The risk
scores can be used by BWS managers to review the initial 10-year CIP and compare
projects between asset classes.
Section 13 Implementation
13-10 October 2016
4. Projects are coordinated with the existing six-year CIP to smooth the transition from
longer-range planning. Projects that are already being implemented (e.g., under design or
construction) are listed in the six-year CIP as prior appropriations.
5. The various BWS consultants who conducted the condition assessment for pump stations,
wells, water treatment plants, reservoirs, and SCADA systems have provided
documentation and recommendations that the timelines for addressing the critical issues
should be within the next 5 to 10 years. Therefore, the asset classes related to these
functions, critical to continuing to provide safe and dependable water, will be populated
first. It is anticipated that the majority, if not all, of these associated improvements can be
accommodated within the 10-year CIP.
6. Other asset classes are then placed into the 10-year CIP. These projects will fill the
remainder of each year’s CIP budget ceiling (based on previous rate study allocating $80
million per year, as described in Section 13.1.1).
The CIP for years 11 through 30 builds on the 10-year CIP with the anticipation that there will be
more budget available for pipeline R&R projects as the initial group of pump station, well, water
treatment, reservoir, and SCADA projects are completed in years 1 through 10.
It is important to note that the budget allocated to each asset class is subject to additional factors:
Constructability of the number of facilities and their function must be considered. For
example, only a small percentage of BWS pump stations can be out of service at any given
time, thus limiting the scheduling of improvement projects.
The system control and monitoring improvements under a SCADA program must not
interfere with the ability of the BWS to operate and control its hundreds of facilities that
are connected to the existing SCADA system.
The number of reservoirs that can be taken out of service at any given time to perform
repairs or upgrades is limited, particularly if the reservoir being worked on is the only one
in that pressure zone.
Significant additional input from senior BWS managers and the Stakeholder Advisory
Group is expected and will be required as the 30-year CIP is further defined. Issues they
may consider could include:
What are the capabilities and capacity of the design and contractor community to
support the project work flow?
What level of consistency of project type (asset class) from year to year should be
considered to assure there is an able, available, and competitive construction
community?
What level of funding for projects should be provided that achieves BWS and
Stakeholder objectives such as diversification of supplies?
Engineering judgement and institutional knowledge.
Section 13 Implementation
October 2016 13-11
13.2.4 Reliability
As a responsible public water utility, the BWS must evaluate the risks to its water system and
how to maintain the reliability of its system if these risk events occur. Risk is one of the factors
considered when prioritizing projects in the CIP, discussed earlier.
Risk integrates the potential likelihood of a facility (i.e., supply, pump, etc.) to fail with potential
consequences associated with that failure. The specific method for CIP prioritization, based on
risk, is discussed in Section 13.2.2.
Reliability is a measure of the adequacy of the system(s). The Standards, discussed in Section 5,
Water System Planning Standards, are designed to improve the level of reliability in the design of
the water facilities. The planning standards also define the need for standby pumps in a pump
station in case a pump may be out of service. Redundant infrastructure is necessary to provide
system reliability. This redundancy allows individual facilities to be taken out of service for
maintenance and repair, or for longer-term challenges such as replacement or changes in
operating strategies.
Reliability was assessed for each infrastructure category as follows:
IMPL-1 Pipelines – Starting with a CapPlan score of the consequence of the pipeline being
out of service, look for areas where single pipeline failures could affect large portions of the
system. Seventeen areas were identified where significant reliability improvements can be
made. These areas should be evaluated and considered for parallel pipelines.
IMPL-2 Pump Stations – Check for pump stations where the firm capacity (total capacity
with the largest unit out of service) is less than needed for MDD, and check for zones that
only have one source of supply. These conditions were identified in 65 zones for a total of
16 mgd of demand. In zones with only one source of supply, determine if there are
provisions for installation of temporary pumps and install if not.
Reservoirs – Check for zones that only have one reservoir. These conditions were identified
in 78 zones for a total of 21 mgd of demand. Zones should be considered for additional
storage if there are other reasons for adding.
Treatment – Check for zones where failure of treatment would eliminate only source. Four
zones were identified, totaling 5 mgd of demand. This is a small proportion of the system,
and is not considered critical.
Facilities – Check for facilities that include a single point of failure for major disruption.
IMPL-3 Electrical Supply – Identify most effective locations for additional emergency
generator installation. The system is able to serve essential supply to 89 percent of
population with 10 additional generators. Additionally, it may be possible to install existing
portable generators at these sites in the interim. It is recommended to confirm whether
electrical connections exist.
The system needs for reliability improvement were prioritized based on greatest impact and
recommended projects will be included in the 30-year CIP.
Section 13 Implementation
13-12 October 2016
The BWS continually assesses its potential risks and maintains reliability through planning,
design, and developing operational responses to mitigate the impacts of these events to its
customers through:
Emergency response plans;
Water system master planning;
Operational plans;
Condition assessment and infrastructure improvements; and
Coordination with other agencies and entities at the local, State, and Federal level involved
in emergency response.
The following subsections provide additional information on specific risks, including natural
disasters, power outages, transmission interruption, and loss of supply.
13.2.4.1 Natural Disasters
The BWS system is susceptible to a wide range of potential natural disasters that may cause
significant damage and could affect the BWS’s ability to maintain service during and after events
such as hurricanes, floods, tsunamis, or earthquakes. Each of these naturally-occurring events can
have significant impacts on the BWS water infrastructure, as well as critical non-BWS facilities.
Potential impacts of climate change on water supply, water quality, and infrastructure are
discussed in Section 8, Current and Future Water Supply Sources.
Specific losses from natural disasters may include:
Damage to BWS structures or facilities;
Hawaiian Electric generation or transmission capacity;
Communication systems (e.g., telephone, data, cellular);
Road access;
Emergency response access; and
Limited or no access to BWS facilities.
Floods may be caused by intense rainfall events from hurricanes or other severe climate
conditions. Flooding can cause not only short-term inundation damage but also erosion,
damaging or limiting access to BWS facilities. In some areas (e.g., North Shore), flooding caused
by storms is affecting the stability and security of bridges that support pipelines crossings,
requiring relocation of those facilities.
The impact of seismic events on reservoirs was evaluated as part of the WMP reservoir condition
assessment. While BWS facilities were designed to the then-current building codes, specific
studies and recommendations on selected facilities are included in the CIP.
Section 13 Implementation
October 2016 13-13
13.2.4.2 Power Outages
The BWS operates several supply sources that flow by gravity, and do not require electricity for
pumping. Water storage reservoirs also provide some emergency storage of water in the case of
other infrastructure failures. However, all of the BWS’s 184 pump stations and well sites and 12
GAC treatment facilities are powered by electricity. An extended and wide-scale power failure
would have a significant impact on the operation of the BWS facilities, the ability to meet
demands, and emergency supply for fire protection.
The potential for loss of power to these pump stations, wells, and treatment facilities and the
duration of the outage fall into several scenarios:
Loss of power transmission to localized facilities (e.g., wind, flooding, or electrical system
failure) – Short duration (e.g. a few hours), localized impact, high likelihood;
Loss of power transmission to large portions of the island (e.g., hurricane, earthquake,
tsunami) – Medium duration (e.g. two to three days), intermediate area impact, moderate
likelihood; and
Loss of power generation and/or transmission island-wide (e.g., hurricane, earthquake,
tsunami) – Long duration (e.g. a week or more), wide-scale impact, low likelihood.
One of the approaches the BWS is applying to address risks due to power failure is to provide
emergency power generators at critical facilities. The BWS currently has eight portable
generators available for key pump stations. The BWS is installing fixed generators at key
locations (currently three sources and the Beretania Complex). As part of the 30-year CIP,
recommendations include siting additional generators in fixed locations.
Similarly, many of the BWS’s pump stations include provisions for installation of temporary
pumps that provide increased reliability in the case of a pump station-wide failure. The critical
pump stations identified above should be confirmed to include temporary pump connections.
13.2.4.3 Transmission Interruption
Transmission pipelines (pipelines greater than or equal to 16 inches in diameter) are critical to
moving supply from sources around the island to population and demand centers. For example, a
large portion of the demands in the Metropolitan area are being met by sources west of
downtown and conveyed several miles. The BWS has been working to construct a parallel
pipeline to the large diameter transmission pipeline into the downtown area. Portions of this
parallel transmission pipeline are complete, and the remaining sections are currently in planning,
including the 42-inch transmission main from Liliha Street to Isenberg Street, and the 36-inch
Stadium to Hālawa connection being recommended. This redundant transmission reduces the
consequence of a failure of the single transmission pipeline and subsequent potential loss of
supply to major portions of urban Honolulu. The increased capacity of a second pipeline also
relieves existing operational constraints and provides additional capacity to meet future demand
projections.
Section 13 Implementation
13-14 October 2016
The transmission pipeline review identified over a dozen areas across O‘ahu where reliability
could be improved with redundant pipelines. These recommendations will be carried forward
into the 30-year CIP.
13.2.4.4 Loss of Supply
Groundwater is currently the sole source of potable water supply for the BWS customers and is
captured through groundwater wells, shafts, and tunnels. These supply sources are susceptible to
a number of potential impacts that could affect their ability to provide water, including:
Temporary loss of supply due to mechanical, electrical, treatment, or other problems;
Temporary loss due to power outage;
Temporary or long-term concerns with potential water quality changes and impacts; and
Reduced pumping to allow groundwater recovery between periods of drought.
As discussed in Section 8, Current and Future Water Supply Sources, the BWS is actively seeking
to expand groundwater supplies to address the potential concerns listed above. In addition, the
BWS is diversifying its sources to mitigate potential future reduction of potable groundwater due
to climate change, including developing of desalination projects and expanding the recycled water
supply.
13.3 Organizational CapacityOrganizational capacity refers to the ability of an organization to fulfill its mission with given
resources. Specifically, does the BWS have an organization structure, adequate resources,
business processes, tools, and training to continue to provide safe, dependable, and affordable
water? To address this question, an organizational study was initiated for the agency as a whole,
as well as a focused evaluation of the agency’s project delivery function which is situated
primarily within the Capital Projects Division (CPD). The following sections summarize these
efforts and their findings.
13.3.1 Enterprise Organizational Study
The Enterprise Organizational Study supports the BWS’s Operational Sustainability goal by
analyzing the organizational structure and work processes, and recommending improvements to
increase operational and organizational efficiencies3. The study is also developing an
implementation plan to establish the appropriate organizational structure, work processes, span
of control, staffing levels, competencies, and training programs to carry out the BWS’s mission.
The study’s scope of work involved twelve primary tasks:
Task 1: Analyze current organization;
Task 2: Document information flow and use;
Task 3: Survey organizational structures of other similar utilities;
3 Matrix. 2015. Enterprise Organization Study.
Section 13 Implementation
October 2016 13-15
Task 4: Conduct an employee satisfaction survey;
Task 5: Perform an organization cultural survey;
Task 6: Develop an organization succession, recruitment, and retention planning
framework;
Task 7: Develop incorporation plan for ongoing organizational initiatives;
Task 8: Identify optimal organization structure;
Task 9: Identify training requirements;
Task 10: Recommend benchmarks and performance metrics;
Task 11: Develop implementation plans; and
Task 12: Develop an outreach and communication plan.
13.3.2 Capital Projects Division Study
The Capital Projects Division (CPD) supports the BWS mission of safe, dependable and affordable
water now and into the future as an essential component of a robust renewal, replacement, and
expansion strategy defined in the WMP’s 30-year CIP. The CPD’s capacity and capability to
predictably deliver design and construction projects will directly drive the utility’s future.
A Program Management effort to optimize the operation of the CPD was initiated in 2013. This
recognized the importance of the CPD in effectively and consistently executing an expanded
annual CIP. A growing CPD workload was first triggered by a two-fold increase in CPD’s project
delivery requirement in 2013 supported by the water rate increase in 2012. The delivery
requirement is anticipated to continue and increase following the WMP. The Program
Management effort can be summarized as a four-step process: assess; plan; implement; and
optimize.
The initial assessment phase involved interviews with all CPD staff and selected Division leaders
to evaluate current capacity, expectations, perceptions, and challenges. The needs assessment
confirmed the CPD remains a dedicated and talented organization with a number of opportunities
for improving efficiencies. While the CPD has been successful in meeting the requirements of an
increased workload in spite of a decline in staffing, the staffing level needs to be thoughtfully
increased to match the current and anticipated volumes of work and to prepare for future
attrition of an aging workforce. Staff engineers regularly perform an excess of para-professional
tasks. Project tracking, monitoring, and documentation are inconsistent and fragmented within
CPD. Finally, project scoping and justification is best performed earlier in the budgeting process
to better meet customer needs and improve schedule and budget predictability.
To chart the course for the future, Core Teams, representing a cross-section of CPD’s design and
construction experience and representing each CPD Branch, were formed. These teams crafted
work flow diagrams for the various processes in project development and execution. These, in
turn, formed the basis for Standard Operating Procedures (SOPs) and training programs for
current and future staff. A project initiation, development, and prioritization process was
Section 13 Implementation
13-16 October 2016
instituted utilizing a Project Definition Report (PDR) for each proposed capital project. The PDR
documents the project objectives, costs, and schedule. The PDR also confirms agreement on the
scope and scale of the project with the requesting Division.
Optimized staffing is critical to CPD’s future performance. Additional project administrative staff,
Engineering Support Technicians (EST), will consistently and regularly monitor project
performance and standardize recordkeeping and reporting. Providing EST support to the
engineers and construction inspectors to perform selected, required functions will allow the
engineers and inspectors to focus on higher value efforts that best utilize their experience,
expertise and training. SOPs and associated training programs will bring new hires up to speed
quickly. Introduction of a new entry-level class of Construction Inspector Aides in 2015 and
planned new engineering hires in the coming fiscal year will begin to address future staffing
needs.
A new Project Management Information System (PMIS) will consolidate all project information,
improve project tracking, and guide consistent adherence to SOPs and workflows. The system will
manage all project documents and facilitate project information sharing and tracking of
performance metrics.
Initial implementation of CPD’s strategy began in 2015 and will continue through early 2017. The
SOPs, PMIS, and improved contract terms and specifications are being rolled out to CPD staff
during spring 2016. All projects initiated within the CPD in FY17 will use these tools and
protocols. A four-month training program, which began in April 2016, will be administered to all
CPD staff to advance the changes and the best use of the new tools. During implementation, CPD
and other Division leaders are identifying reporting metrics and developing tracking tools
(dashboards) to monitor compliance with project execution requirements. The two consulting
engineering firms that guided the development process will assist in the implementation and
provide required staff support during the transition period to meet workload demands, allow for
staff recruitment and provide ongoing staff training.
The BWS CPD will continue optimization of the platforms, SOPs, and other tools following an
initial implementation period of approximately one year. This will include refinement of the
PMIS, creation of reporting dashboards, and addition of field reporting tools to enable staff to
continuously improve performance. The PMIS facilitates a more transparent view of project
status and execution performance. The CPD will receive timely feedback, improve collaboration
and communication, and best position itself to do its part in addressing the anticipated workload
demands of the WMP.
13.4 Water System Monitoring The WMP’s recommendations are based around a core objective of maintaining the health of the
water system infrastructure. In addition, timing of many of the recommendations are dependent
on the needs of the system as it ages. For planning purposes an assumption has been made that
existing levels of investment will be sufficient to maintain the current level of service that the
water system provides. To this end, indicators are needed to be able to distinguish changes in the
health of the water infrastructure.
Section 13 Implementation
October 2016 13-17
Table 13-3 provides a proposed scorecard with detailed indicators and the metrics to be used to
quantify results. The scores shown here provide for the current level of service. To the extent that
a goal is not being met, it means that the BWS would like to improve the level of service in that
area. Missing goals does not suggest imminent failure of the water system, but rather areas where
service can be improved. Where a goal has a reference other than BWS goals, the source is
referenced with the goal.
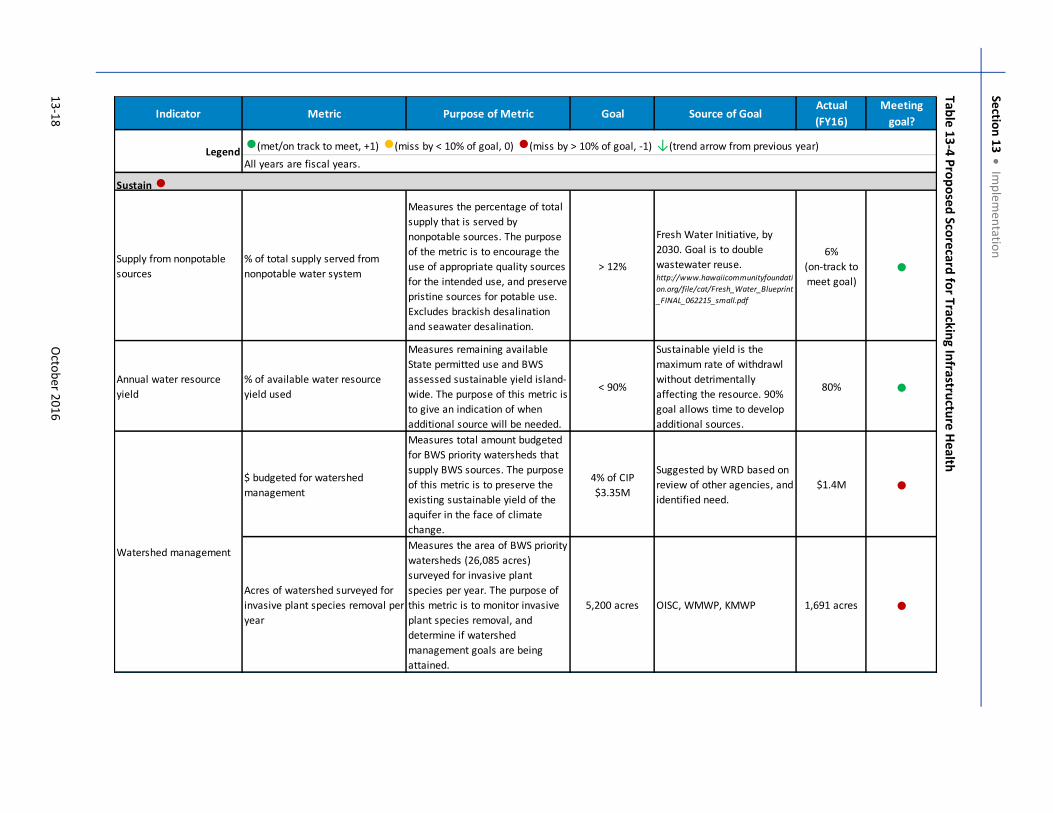
Se
ction
13
Im
ple
me
nta
tion
13
-18
Octo
be
r 20
16
Ta
ble
13
-4 P
rop
ose
d S
core
card
for T
rack
ing
Infra
structu
re H
ea
lthIndicator Metric Purpose of Metric Goal Source of Goal
Actual
(FY16)
Meeting
goal?
Supply from nonpotable
sources
% of total supply served from
nonpotable water system
Measures the percentage of total
supply that is served by
nonpotable sources. The purpose
of the metric is to encourage the
use of appropriate quality sources
for the intended use, and preserve
pristine sources for potable use.
Excludes brackish desalination
and seawater desalination.
> 12%
Fresh Water Initiative, by
2030. Goal is to double
wastewater reuse.http://www.hawaiicommunityfoundati
on.org/file/cat/Fresh_Water_Blueprint
_FINAL_062215_small.pdf
6%
(on-track to
meet goal)●
Annual water resource
yield
% of available water resource
yield used
Measures remaining available
State permitted use and BWS
assessed sustainable yield island-
wide. The purpose of this metric is
to give an indication of when
additional source will be needed.
< 90%
Sustainable yield is the
maximum rate of withdrawl
without detrimentally
affecting the resource. 90%
goal allows time to develop
additional sources.
80% ●
$ budgeted for watershed
management
Measures total amount budgeted
for BWS priority watersheds that
supply BWS sources. The purpose
of this metric is to preserve the
existing sustainable yield of the
aquifer in the face of climate
change.
4% of CIP
$3.35M
Suggested by WRD based on
review of other agencies, and
identified need.
$1.4M ●
Acres of watershed surveyed for
invasive plant species removal per
year
Measures the area of BWS priority
watersheds (26,085 acres)
surveyed for invasive plant
species per year. The purpose of
this metric is to monitor invasive
plant species removal, and
determine if watershed
management goals are being
attained.
5,200 acres OISC, WMWP, KMWP 1,691 acres ●
Watershed management
Legend●(met/on track to meet, +1) ●(miss by < 10% of goal, 0) ●(miss by > 10% of goal, -1) ↓(trend arrow from previous year)
All years are fiscal years.
Sustain ●
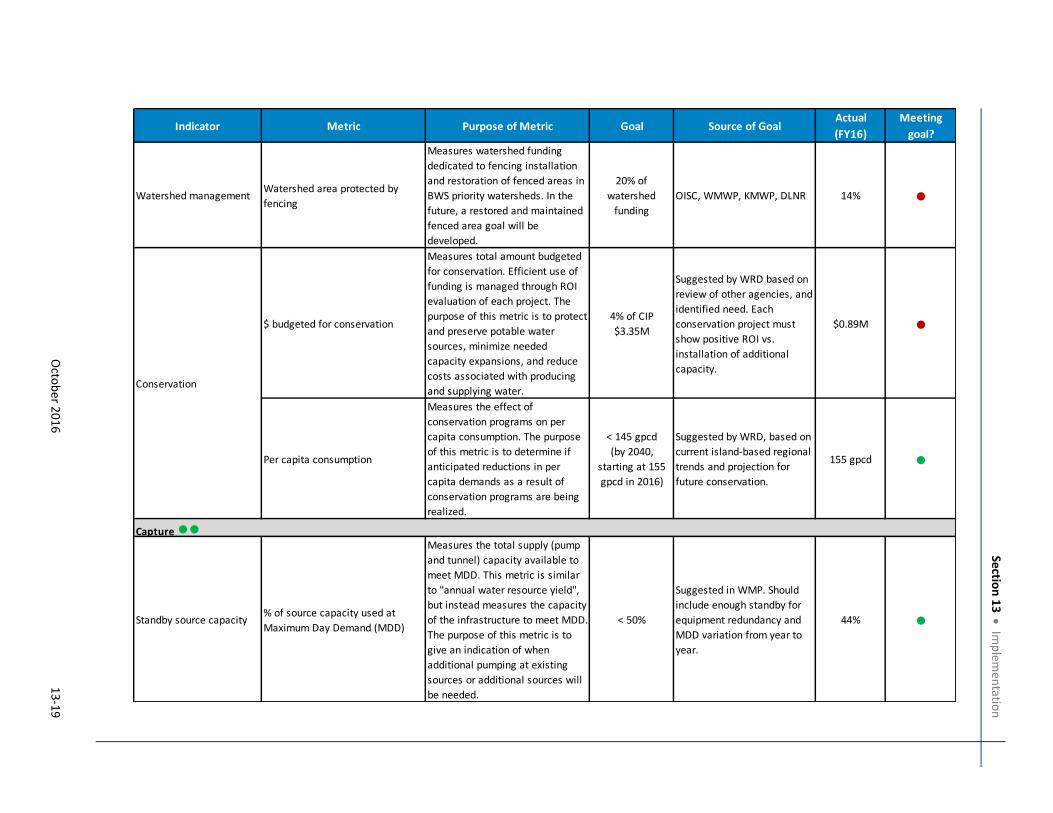
Se
ction
13
Imp
lem
en
tatio
n
Octo
be
r 20
16
13
-19
Indicator Metric Purpose of Metric Goal Source of GoalActual
(FY16)
Meeting
goal?
Watershed managementWatershed area protected by
fencing
Measures watershed funding
dedicated to fencing installation
and restoration of fenced areas in
BWS priority watersheds. In the
future, a restored and maintained
fenced area goal will be
developed.
20% of
watershed
funding
OISC, WMWP, KMWP, DLNR 14% ●
$ budgeted for conservation
Measures total amount budgeted
for conservation. Efficient use of
funding is managed through ROI
evaluation of each project. The
purpose of this metric is to protect
and preserve potable water
sources, minimize needed
capacity expansions, and reduce
costs associated with producing
and supplying water.
4% of CIP
$3.35M
Suggested by WRD based on
review of other agencies, and
identified need. Each
conservation project must
show positive ROI vs.
installation of additional
capacity.
$0.89M ●
Per capita consumption
Measures the effect of
conservation programs on per
capita consumption. The purpose
of this metric is to determine if
anticipated reductions in per
capita demands as a result of
conservation programs are being
realized.
< 145 gpcd
(by 2040,
starting at 155
gpcd in 2016)
Suggested by WRD, based on
current island-based regional
trends and projection for
future conservation.
155 gpcd ●
Standby source capacity% of source capacity used at
Maximum Day Demand (MDD)
Measures the total supply (pump
and tunnel) capacity available to
meet MDD. This metric is similar
to "annual water resource yield",
but instead measures the capacity
of the infrastructure to meet MDD.
The purpose of this metric is to
give an indication of when
additional pumping at existing
sources or additional sources will
be needed.
< 50%
Suggested in WMP. Should
include enough standby for
equipment redundancy and
MDD variation from year to
year.
44% ●
Capture ●●
Conservation
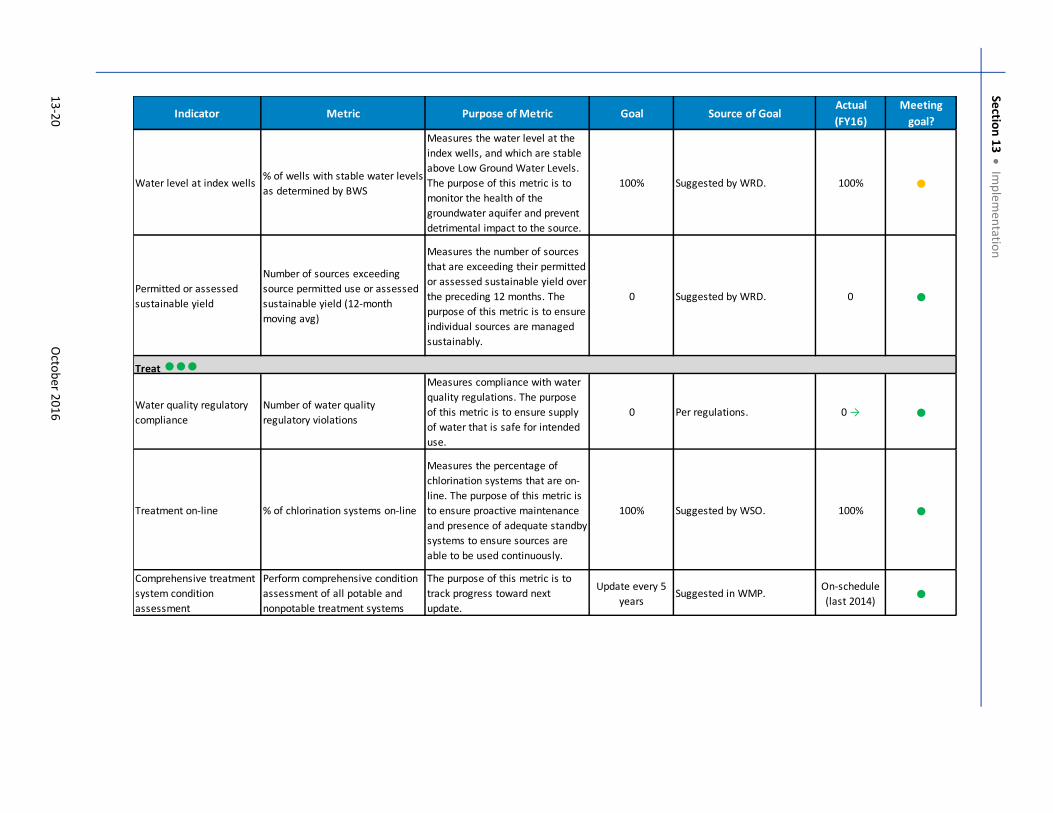
Se
ction
13
Im
ple
me
nta
tion
13
-20
Octo
be
r 20
16
Indicator Metric Purpose of Metric Goal Source of GoalActual
(FY16)
Meeting
goal?
Water level at index wells% of wells with stable water levels
as determined by BWS
Measures the water level at the
index wells, and which are stable
above Low Ground Water Levels.
The purpose of this metric is to
monitor the health of the
groundwater aquifer and prevent
detrimental impact to the source.
100% Suggested by WRD. 100% ●
Permitted or assessed
sustainable yield
Number of sources exceeding
source permitted use or assessed
sustainable yield (12-month
moving avg)
Measures the number of sources
that are exceeding their permitted
or assessed sustainable yield over
the preceding 12 months. The
purpose of this metric is to ensure
individual sources are managed
sustainably.
0 Suggested by WRD. 0 ●
Water quality regulatory
compliance
Number of water quality
regulatory violations
Measures compliance with water
quality regulations. The purpose
of this metric is to ensure supply
of water that is safe for intended
use.
0 Per regulations. 0 → ●
Treatment on-line % of chlorination systems on-line
Measures the percentage of
chlorination systems that are on-
line. The purpose of this metric is
to ensure proactive maintenance
and presence of adequate standby
systems to ensure sources are
able to be used continuously.
100% Suggested by WSO. 100% ●
Comprehensive treatment
system condition
assessment
Perform comprehensive condition
assessment of all potable and
nonpotable treatment systems
The purpose of this metric is to
track progress toward next
update.
Update every 5
yearsSuggested in WMP.
On-schedule
(last 2014)●
Treat ●●●
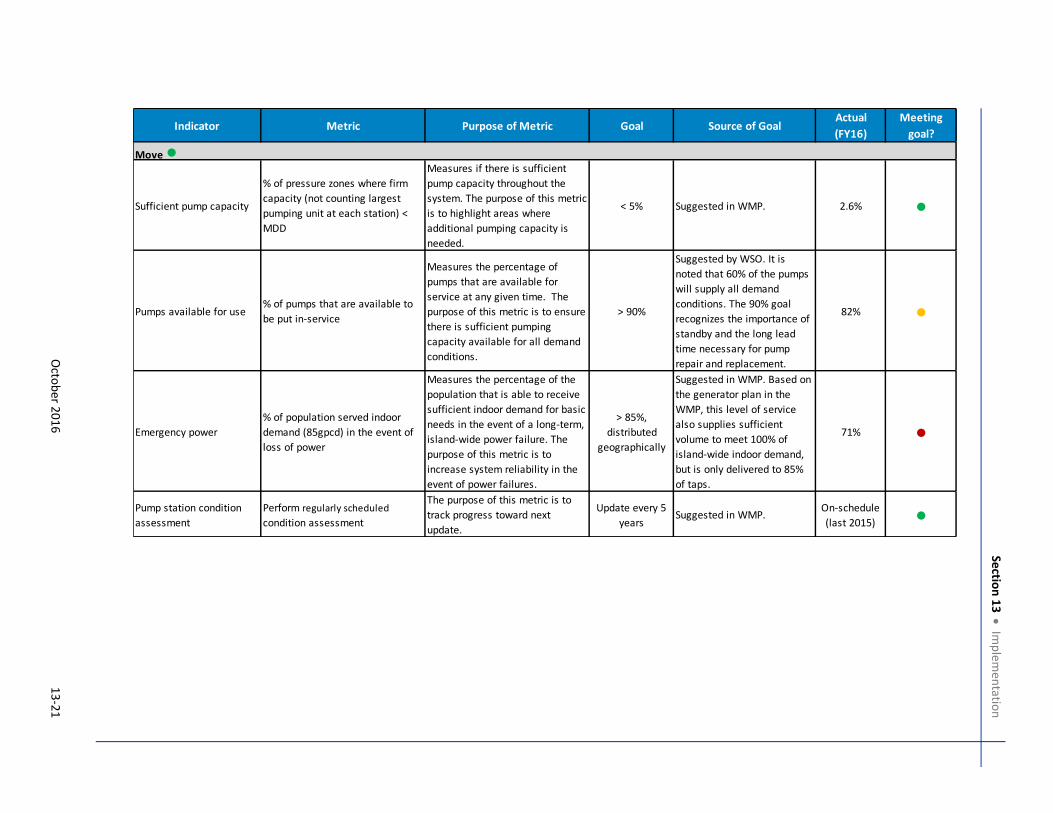
Se
ction
13
Imp
lem
en
tatio
n
Octo
be
r 20
16
13
-21
Indicator Metric Purpose of Metric Goal Source of GoalActual
(FY16)
Meeting
goal?
Sufficient pump capacity
% of pressure zones where firm
capacity (not counting largest
pumping unit at each station) <
MDD
Measures if there is sufficient
pump capacity throughout the
system. The purpose of this metric
is to highlight areas where
additional pumping capacity is
needed.
< 5% Suggested in WMP. 2.6% ●
Pumps available for use% of pumps that are available to
be put in-service
Measures the percentage of
pumps that are available for
service at any given time. The
purpose of this metric is to ensure
there is sufficient pumping
capacity available for all demand
conditions.
> 90%
Suggested by WSO. It is
noted that 60% of the pumps
will supply all demand
conditions. The 90% goal
recognizes the importance of
standby and the long lead
time necessary for pump
repair and replacement.
82% ●
Emergency power
% of population served indoor
demand (85gpcd) in the event of
loss of power
Measures the percentage of the
population that is able to receive
sufficient indoor demand for basic
needs in the event of a long-term,
island-wide power failure. The
purpose of this metric is to
increase system reliability in the
event of power failures.
> 85%,
distributed
geographically
Suggested in WMP. Based on
the generator plan in the
WMP, this level of service
also supplies sufficient
volume to meet 100% of
island-wide indoor demand,
but is only delivered to 85%
of taps.
71% ●
Pump station condition
assessment
Perform regularly scheduled
condition assessment
The purpose of this metric is to
track progress toward next
update.
Update every 5
yearsSuggested in WMP.
On-schedule
(last 2015)●
Move ●
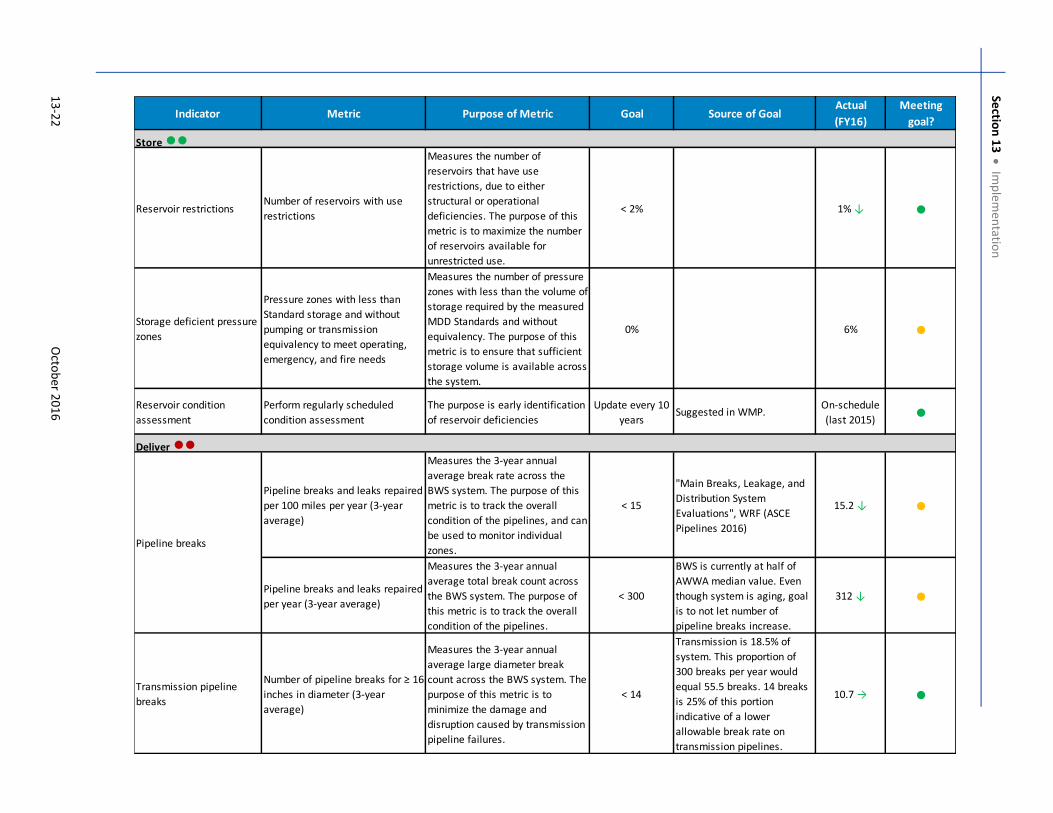
Se
ction
13
Im
ple
me
nta
tion
13
-22
Octo
be
r 20
16
Indicator Metric Purpose of Metric Goal Source of GoalActual
(FY16)
Meeting
goal?
Reservoir restrictionsNumber of reservoirs with use
restrictions
Measures the number of
reservoirs that have use
restrictions, due to either
structural or operational
deficiencies. The purpose of this
metric is to maximize the number
of reservoirs available for
unrestricted use.
< 2% 1% ↓ ●
Storage deficient pressure
zones
Pressure zones with less than
Standard storage and without
pumping or transmission
equivalency to meet operating,
emergency, and fire needs
Measures the number of pressure
zones with less than the volume of
storage required by the measured
MDD Standards and without
equivalency. The purpose of this
metric is to ensure that sufficient
storage volume is available across
the system.
0% 6% ●
Reservoir condition
assessment
Perform regularly scheduled
condition assessment
The purpose is early identification
of reservoir deficiencies
Update every 10
yearsSuggested in WMP.
On-schedule
(last 2015)●
Pipeline breaks and leaks repaired
per 100 miles per year (3-year
average)
Measures the 3-year annual
average break rate across the
BWS system. The purpose of this
metric is to track the overall
condition of the pipelines, and can
be used to monitor individual
zones.
< 15
"Main Breaks, Leakage, and
Distribution System
Evaluations", WRF (ASCE
Pipelines 2016)
15.2 ↓ ●
Pipeline breaks and leaks repaired
per year (3-year average)
Measures the 3-year annual
average total break count across
the BWS system. The purpose of
this metric is to track the overall
condition of the pipelines.
< 300
BWS is currently at half of
AWWA median value. Even
though system is aging, goal
is to not let number of
pipeline breaks increase.
312 ↓ ●
Transmission pipeline
breaks
Number of pipeline breaks for ≥ 16
inches in diameter (3-year
average)
Measures the 3-year annual
average large diameter break
count across the BWS system. The
purpose of this metric is to
minimize the damage and
disruption caused by transmission
pipeline failures.
< 14
Transmission is 18.5% of
system. This proportion of
300 breaks per year would
equal 55.5 breaks. 14 breaks
is 25% of this portion
indicative of a lower
allowable break rate on
transmission pipelines.
10.7 → ●
Store ●●
Deliver ●●
Pipeline breaks
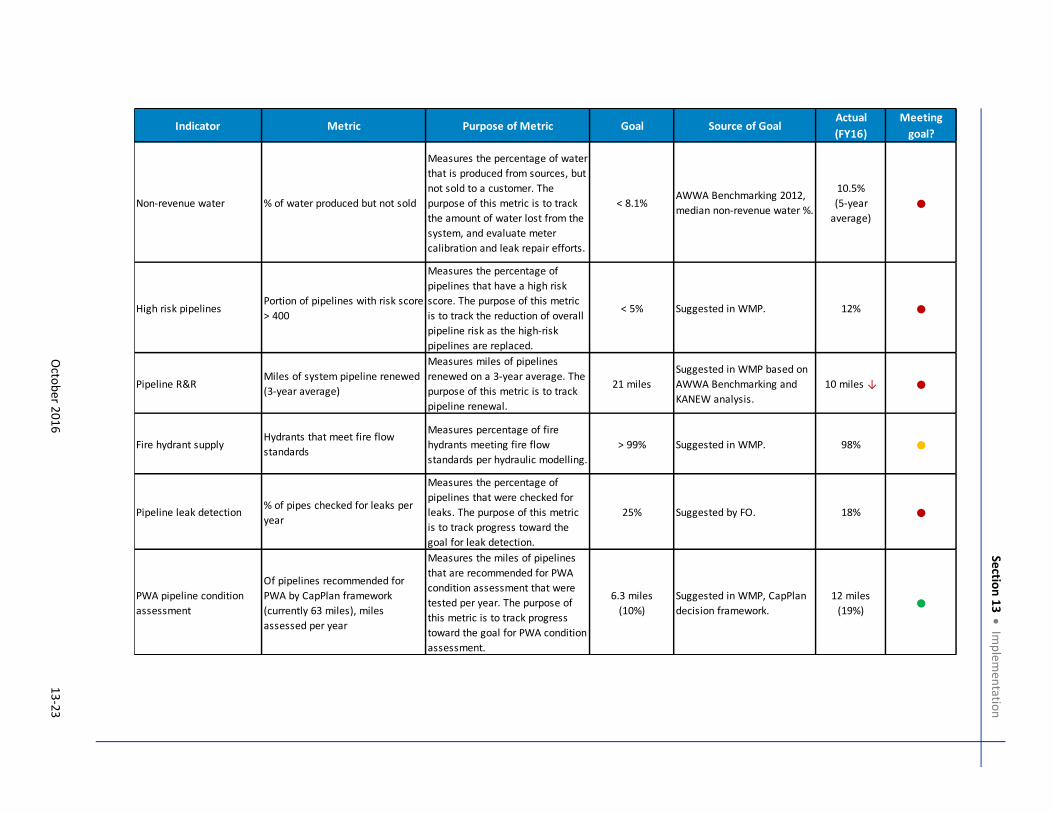
Se
ction
13
Imp
lem
en
tatio
n
Octo
be
r 20
16
13
-23
Indicator Metric Purpose of Metric Goal Source of GoalActual
(FY16)
Meeting
goal?
Non-revenue water % of water produced but not sold
Measures the percentage of water
that is produced from sources, but
not sold to a customer. The
purpose of this metric is to track
the amount of water lost from the
system, and evaluate meter
calibration and leak repair efforts.
< 8.1%AWWA Benchmarking 2012,
median non-revenue water %.
10.5%
(5-year
average)●
High risk pipelinesPortion of pipelines with risk score
> 400
Measures the percentage of
pipelines that have a high risk
score. The purpose of this metric
is to track the reduction of overall
pipeline risk as the high-risk
pipelines are replaced.
< 5% Suggested in WMP. 12% ●
Pipeline R&RMiles of system pipeline renewed
(3-year average)
Measures miles of pipelines
renewed on a 3-year average. The
purpose of this metric is to track
pipeline renewal.
21 miles
Suggested in WMP based on
AWWA Benchmarking and
KANEW analysis.
10 miles ↓ ●
Fire hydrant supplyHydrants that meet fire flow
standards
Measures percentage of fire
hydrants meeting fire flow
standards per hydraulic modelling.
> 99% Suggested in WMP. 98% ●
Pipeline leak detection% of pipes checked for leaks per
year
Measures the percentage of
pipelines that were checked for
leaks. The purpose of this metric
is to track progress toward the
goal for leak detection.
25% Suggested by FO. 18% ●
PWA pipeline condition
assessment
Of pipelines recommended for
PWA by CapPlan framework
(currently 63 miles), miles
assessed per year
Measures the miles of pipelines
that are recommended for PWA
condition assessment that were
tested per year. The purpose of
this metric is to track progress
toward the goal for PWA condition
assessment.
6.3 miles
(10%)
Suggested in WMP, CapPlan
decision framework.
12 miles
(19%)●
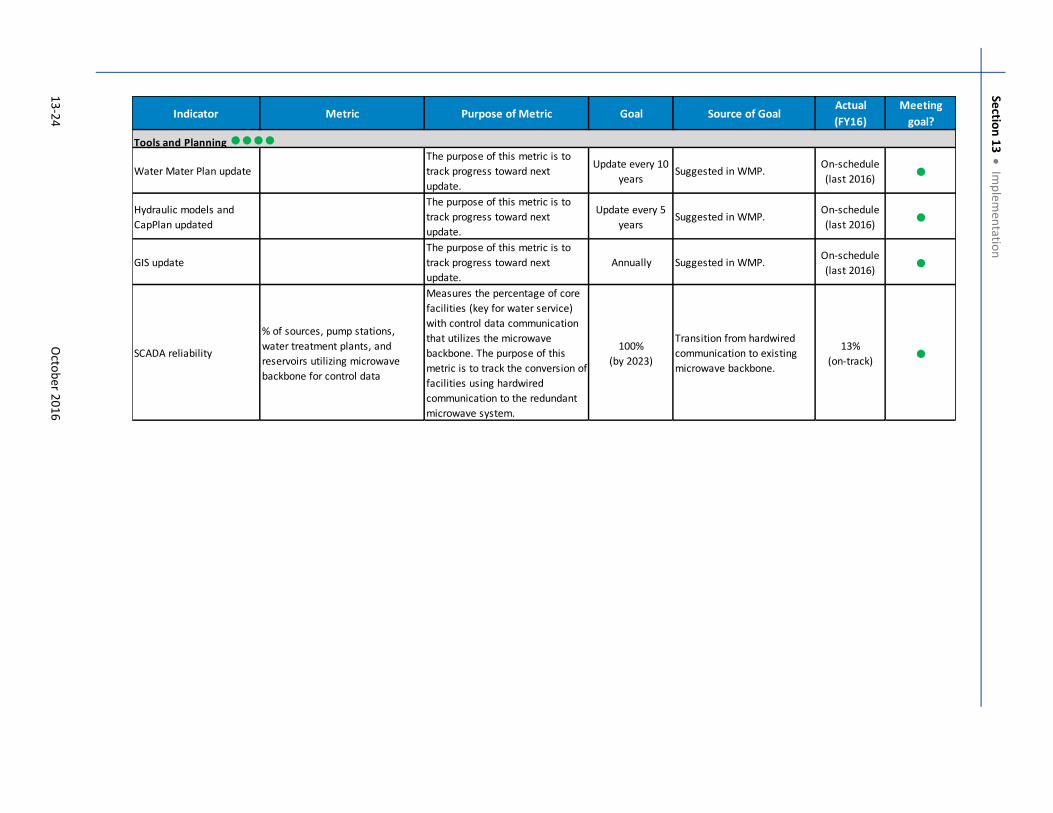
Se
ction
13
Im
ple
me
nta
tion
13
-24
Octo
be
r 20
16
Indicator Metric Purpose of Metric Goal Source of GoalActual
(FY16)
Meeting
goal?
Water Mater Plan update
The purpose of this metric is to
track progress toward next
update.
Update every 10
yearsSuggested in WMP.
On-schedule
(last 2016)●
Hydraulic models and
CapPlan updated
The purpose of this metric is to
track progress toward next
update.
Update every 5
yearsSuggested in WMP.
On-schedule
(last 2016)●
GIS update
The purpose of this metric is to
track progress toward next
update.
Annually Suggested in WMP.On-schedule
(last 2016)●
SCADA reliability
% of sources, pump stations,
water treatment plants, and
reservoirs utilizing microwave
backbone for control data
Measures the percentage of core
facilities (key for water service)
with control data communication
that utilizes the microwave
backbone. The purpose of this
metric is to track the conversion of
facilities using hardwired
communication to the redundant
microwave system.
100%
(by 2023)
Transition from hardwired
communication to existing
microwave backbone.
13%
(on-track)●
Tools and Planning ●●●●
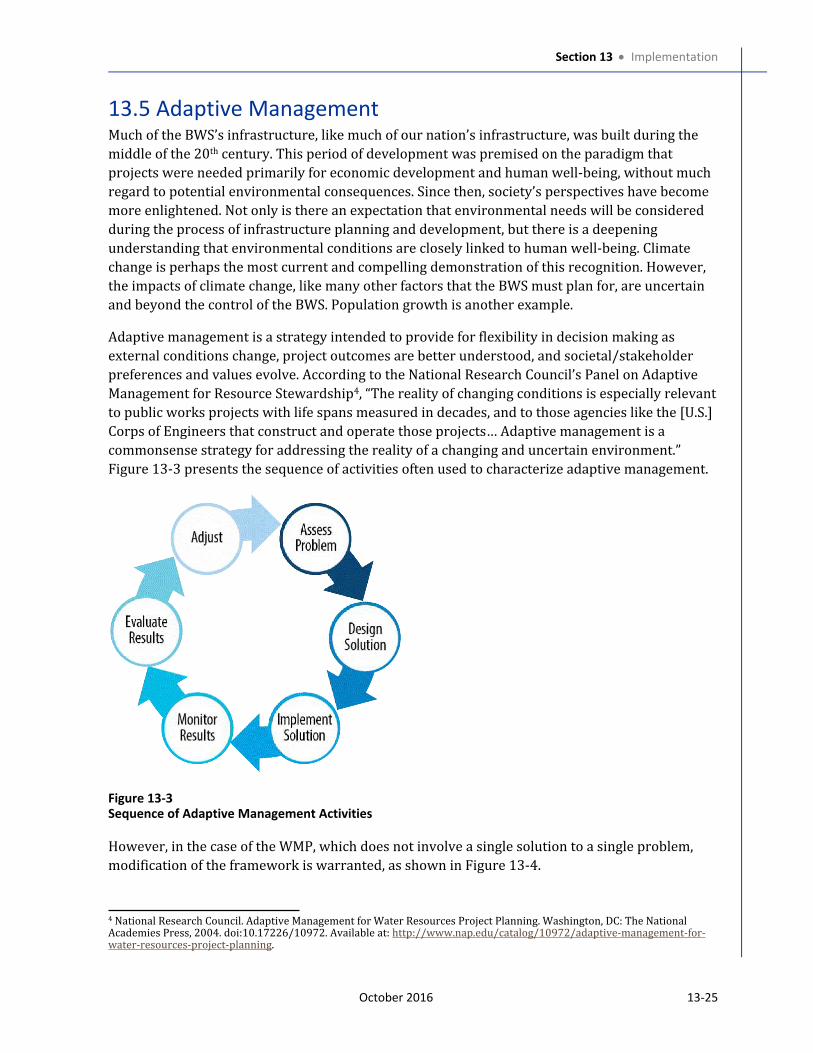
Section 13 Implementation
October 2016 13-25
13.5 Adaptive ManagementMuch of the BWS’s infrastructure, like much of our nation’s infrastructure, was built during the
middle of the 20th century. This period of development was premised on the paradigm that
projects were needed primarily for economic development and human well-being, without much
regard to potential environmental consequences. Since then, society’s perspectives have become
more enlightened. Not only is there an expectation that environmental needs will be considered
during the process of infrastructure planning and development, but there is a deepening
understanding that environmental conditions are closely linked to human well-being. Climate
change is perhaps the most current and compelling demonstration of this recognition. However,
the impacts of climate change, like many other factors that the BWS must plan for, are uncertain
and beyond the control of the BWS. Population growth is another example.
Adaptive management is a strategy intended to provide for flexibility in decision making as
external conditions change, project outcomes are better understood, and societal/stakeholder
preferences and values evolve. According to the National Research Council’s Panel on Adaptive
Management for Resource Stewardship4, “The reality of changing conditions is especially relevant
to public works projects with life spans measured in decades, and to those agencies like the [U.S.]
Corps of Engineers that construct and operate those projects… Adaptive management is a
commonsense strategy for addressing the reality of a changing and uncertain environment.”
Figure 13-3 presents the sequence of activities often used to characterize adaptive management.
Figure 13-3Sequence of Adaptive Management Activities
However, in the case of the WMP, which does not involve a single solution to a single problem,
modification of the framework is warranted, as shown in Figure 13-4.
4 National Research Council. Adaptive Management for Water Resources Project Planning. Washington, DC: The National Academies Press, 2004. doi:10.17226/10972. Available at: http://www.nap.edu/catalog/10972/adaptive-management-for-water-resources-project-planning.
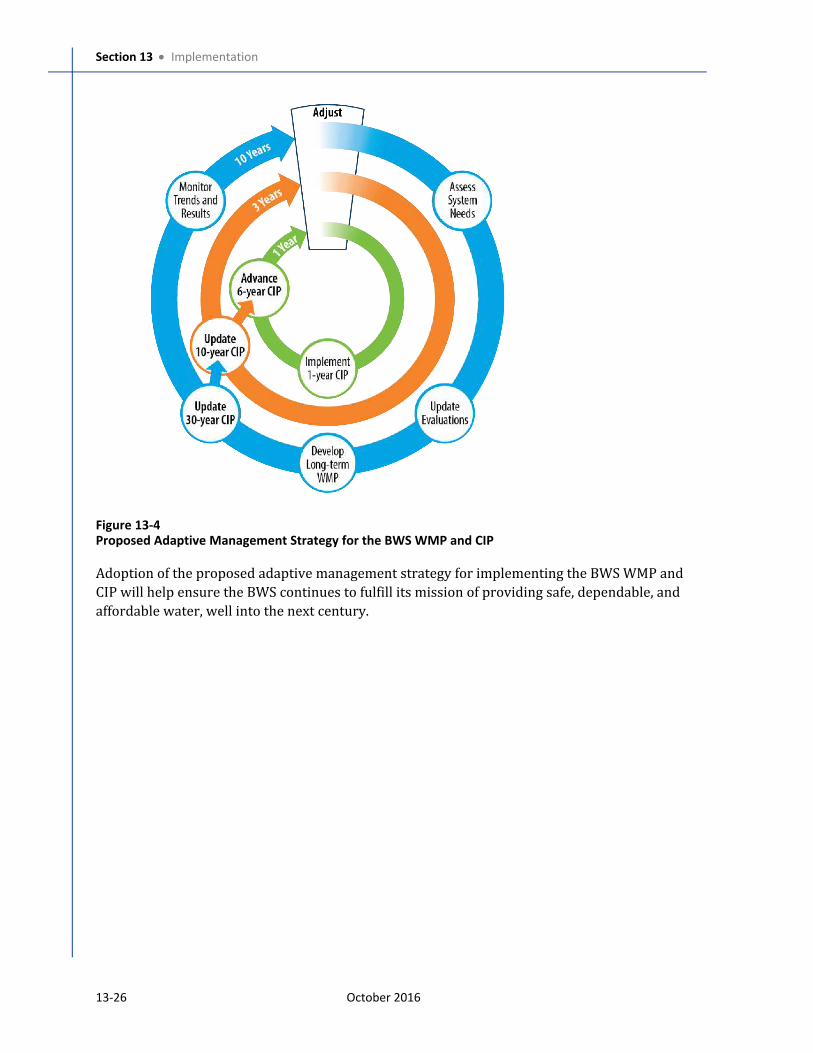
Section 13 Implementation
13-26 October 2016
Figure 13-4Proposed Adaptive Management Strategy for the BWS WMP and CIP
Adoption of the proposed adaptive management strategy for implementing the BWS WMP and
CIP will help ensure the BWS continues to fulfill its mission of providing safe, dependable, and
affordable water, well into the next century.