© 2016 technomic inc. sub-channel insights 36 limited service restaurants (incl. qsr, fast casual...
TRANSCRIPT

© 2016 Technomic Inc.

© 2016 Technomic Inc. 1

© 2016 Technomic Inc.
Report Organisation
2
Page No.
Introduction 4
Executive Summary 14
Market Sub-Channel Insights 36
Limited Service Restaurants (incl. QSR, Fast Casual & Food-to-Go) 38
Pubs 52
Hotels and Accommodation 58
Full Service Restaurants 64
Coffee Shops and Cafés 70
Other Commercial 76
Business & Industry 82
Healthcare 90
Education 96
Other Institutional 102
Product Insights 106
Global Insights 112
Conclusions & Recommendations 122
Macroeconomic Drivers 130

© 2016 Technomic Inc. 3

© 2016 Technomic Inc.
INTRODUCTION

© 2016 Technomic Inc.
About the Research
5
Technomic has partnered with Bord Bia to provide a broad assessment of the entire foodservice
market, along with insights on specific units and chains, similar to the Channel Insights report
created in 2014. Technomic has a large, experienced staff covering the foodservice industry and
actively conducts research in numerous international markets. The process undertaken in this
collaboration included a large range of in-depth interviews within the trade to reveal insights from
numerous perspectives.
Important Trends
Key Metrics
Sub-Channel Insights

© 2016 Technomic Inc.
Approach
6
As part of its dedicated Ireland Market Foodservice Programme, Bord Bia has operated a Market
Intelligence programme since 2009 - delivering resources to both client companies (Irish food and
drink manufacturers) and customers (domestic foodservice buyers) alike.
For the development of this study, Bord Bia collaborated closely with Technomic to deliver insights
necessary to develop detailed market strategies and to highlight potential opportunities.
Technomic used a robust, multi-step methodology to collect and synthesise information and to
develop new insights on the foodservice market in Ireland, including:
• One-on-one trade interviews
• Data collection from numerous secondary sources, Technomic industry studies and Knowledge
Center, Technomic international tracking and published materials.
The combination of these sources allowed the Technomic team to better obtain industry
performance metrics, understand the size and condition of the market in Ireland, detect issues and
challenges, and identify future trends, drivers and predicted growth rates.
© 2016 Technomic Inc.
In-Depth Interview Methodology
7
This research included robust primary research coupled with an extensive review of available
secondary information on the Irish foodservice industry and its players, as well as broader macro
trends in the ROI and NI markets. To complete market sizing, segmentation, trend identification and
forecasting, Technomic utilised numerous resources including:
• In-depth interviews with foodservice operators, including both profit sector and major cost
sector players
• In-depth interviews with foodservice wholesalers and distributors
• In-depth interviews with key Trade Associations
• In-depth interviews with major manufacturers and suppliers
• Technomic subject matter experts
• Various trade groups and available government data

© 2016 Technomic Inc.
Market Sizing Methodology
8
Trade interviews
Data Obtained
• Industry performance? • Areas of
growth/decline? • Usage change? • Business factors?
• Clean, tabulate, analyse data by segment
• Compare to previous report
Develop initial market estimate
• Confirm growth • Review additional data
Create market model Final Sizing
The illustration below outlines key steps in Technomic’s market sizing and forecasting process.
Importantly, Technomic’s review process of previous market sizing revealed certain market
segments that were undervalued, both in terms of consumer spending and in terms of
operator purchases. Several figures have been re-stated; as such, direct comparisons to
previous reports should be avoided.

© 2016 Technomic Inc.
About Technomic
9
Technomic is uniquely qualified to conduct this assignment. For over 50 years, Technomic has
been assisting clients with interests in the global food and beverage industries to obtain a better
understanding of the marketplace and potential opportunities.
Technomic is considered to be the leading research and consulting firm specialising in the
foodservice or Out of Home (OOH) industry, Technomic is active in numerous international OOH
markets. Technomic’s broad based expertise and second-to-none knowledge of the OOH channels
and categories positions us as an industry leader in this growing marketplace.
As part of Winsight, Technomic is positioned as a leader in multiple facets of the global foodservice
industry. Winsight provides customers and audiences access to the most credible source of
industry market intelligence with top industry print and digital media assets, world class events, and
Technomic’s channel-relevant strategic research and insights.
Beyond Technomic, Winsight provides global reach and insights through its media (including
Restaurant Business, CSP, Foodservice Director and others) and Events (including the Global
Restaurant Leadership Conference, FARE, Outlook Leadership, FSTEC and others).

© 2016 Technomic Inc.
Glossary of Terms
10
Term Definition
CAGR Compound Annual Growth Rate: The average sales increase over a specified number of years incorporating compound growth.
Cash and carry A large outlet where foodservice operators and small retailers can come to purchase supplies.
Commercial foodservice Channels where catering for profit is the prime motivation.
Consumer Spending Consumer spending accounts for spending by diners within all foodservice channels.
Contract The direct supply of products to trade customers that buy centrally. Also known as “wheels only” in view of wholesalers that provide logistic support (delivery) but do not buy or sell.
C Store Convenience store where hot food or food-on-the-go is sold to eat and take away.
Customer The person to whom the supplier sells, usually the wholesaler or the operator, although the ultimate customer is the consumer.
Delivered Wholesale Supply of product to outlets via wholesaler delivery vans, often on a daily basis.
Direct Where operators buy from markets, producers or farmers direct rather than through intermediaries such as wholesalers.

© 2016 Technomic Inc.
Glossary of Terms
11
Term Definition
Fast Food A subset of quick service, typically described as traditional quick service restaurants, often with value price orientation.
Fast Casual A subset of quick service restaurants; menus may feature prepared to order items; menu items are typically made with fresh, high-quality ingredients; price point is between quick service and full service venues.
Foodservice channel The acknowledged grouping of foodservice outlets by type (each of the main channels is defined separately).
Food-to-Go Includes premade, ready to eat menu items sold through various retail channels and consumed off premises.
Forecourt Convenience Captive Convenience store operations that are integrated with a fuel forecourt.
Institutional foodservice Often known as cost catering, channels where catering is a service provided for free or with a subsidy.
IOI Island of Ireland.
Occasion The meal reason for visiting a foodservice outlet, e.g. breakfast, lunch, dinner, coffee, snack etc. This can also be referred to as a “daypart”.

© 2016 Technomic Inc.
Glossary of Terms
12
Term Definition
Operator The company or business running the foodservice outlet or chain of outlets.
Operator Purchases Operator purchases represent the value of distributors’ sales to operators, including distributors’ margins.
Quick Service Restaurants Also referred to as QSR, this channel includes the combination of fast food and fast casual restaurants. In general, customers order or select items and pay before eating.
Route to Market How to get the product to the end consumer. Involves distribution and logistics.
Traffic The number of consumers visiting a foodservice outlet. Also known as footfall, it is a key operator metric.
Transaction spend per occasion
The average spend per person per foodservice visit.
White Table Cloth White table cloth restaurants, a sub segment of the full service restaurant channel representing the more traditional and premium restaurant outlets.

© 2016 Technomic Inc. 13

© 2016 Technomic Inc.
SECTION 1:
EXECUTIVE SUMMARY

© 2016 Technomic Inc. 15

© 2016 Technomic Inc. 16

© 2016 Technomic Inc.
Leading Market Factors Impacting Irish Foodservice Market in 2016
17
The following factors have had a significant influence on Irish foodservice market performance
in 2016.
1. Better than anticipated economic growth and overall GDP performance
Tourism continues to drive the economy upward and the economy is projected to continue growth at
4.2%. This projection is lower than the Department of Finance’s earlier prediction of 4.9% because of
the uncertainty associated with the long term effects of BREXIT on Ireland’s economy. GDP growth for
2017 is currently projected to be 3.5%.
2. Buoyant consumer confidence (relative to historic levels) which has encouraged greater
spending
Reflective of the recent assessment of the economy and employment status of Ireland, consumers
remain positive but uncertain. According to the Economic and Social Research Institute, compared to
past years, more consumers have confidence in their financial well-being than not. While events such
as BREXIT have left Irish consumers cautious and unsure of what lies ahead, there has been no
dramatic drop in confidence towards spending.

© 2016 Technomic Inc.
Leading Market Factors Impacting Irish Foodservice Market in 2016
18
3. Favourable employment environment
Compared to the second quarter of last year, Ireland’s employment rates continue to increase. In
particular, the accommodation and foodservice employment rates are steadily increasing with the
industry employing 205,000 people alone. Unemployment is expected to continue decreasing for the
remainder of the year but at a slower rate.
4. Major markets (particularly Dublin) showing exceptional strength
Major cities in Ireland attract more tourists than their rural counterparts as a result of the high
proliferation of pubs and restaurants. For the past few years, the focus for tourism in these major
markets has increased and has impacted operator profits positively. Belfast and Dublin especially have
received major attention with the Guinness Storehouse and Titanic Belfast attractions winning Top
Visitor Attraction in 2015 and 2016. A push for tourism towards rural areas may increase in the year
ahead.
5. Investment in Ireland for restaurant chains is strengthening
With Ireland’s food tourism growing and quickly becoming a scene for global foodies to visit,
international and domestic restaurant chains are expanding with more locations in Ireland as well as
investing in their menu offerings and interior of their operations. Additionally, investments are being
made to address the shortage of trained chefs to further meet the needs of the growing restaurant
industry.

© 2016 Technomic Inc.
Leading Market Factors Impacting Irish Foodservice Market in 2016
19
6. Tourism and business travel are both up and encouraging inbound visitor counts
Both overseas and domestic tourism has increased, with a 13% increase in overseas tourism alone.
However, given the fall in Sterling value, there are concerns for future rates of inbound visitors from
the UK. The UK is currently Ireland’s primary source of tourism, accounting for over 40% of overseas
visitors. The rising level of business travel has led to the majority of hoteliers that cater for meeting
and events for business to report an increase in this area.
7. Favourable VAT has boosted foodservice
Since its introduction in 2011, the 9% VAT rate for the food and accommodations channel has been
viewed as a driver for inbound tourism to Ireland as well as increased spending within the foodservice
channel. The ROI foodservice industry has welcomed the Government’s recent decision to continue
the 9% VAT, announced in the 2017 Budget.
© 2016 Technomic Inc.
Overall Assessment of the Foodservice Industry 2016
20
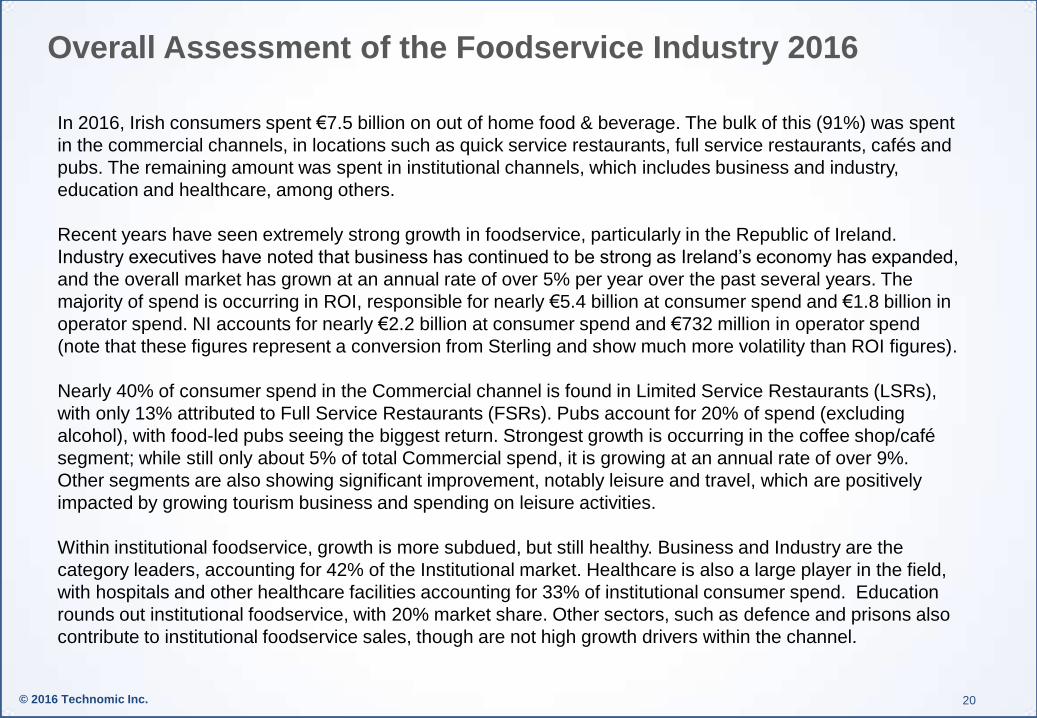
In 2016, Irish consumers spent €7.5 billion on out of home food & beverage. The bulk of this (91%) was spent
in the commercial channels, in locations such as quick service restaurants, full service restaurants, cafés and
pubs. The remaining amount was spent in institutional channels, which includes business and industry,
education and healthcare, among others.
Recent years have seen extremely strong growth in foodservice, particularly in the Republic of Ireland.
Industry executives have noted that business has continued to be strong as Ireland’s economy has expanded,
and the overall market has grown at an annual rate of over 5% per year over the past several years. The
majority of spend is occurring in ROI, responsible for nearly €5.4 billion at consumer spend and €1.8 billion in
operator spend. NI accounts for nearly €2.2 billion at consumer spend and €732 million in operator spend
(note that these figures represent a conversion from Sterling and show much more volatility than ROI figures).
Nearly 40% of consumer spend in the Commercial channel is found in Limited Service Restaurants (LSRs),
with only 13% attributed to Full Service Restaurants (FSRs). Pubs account for 20% of spend (excluding
alcohol), with food-led pubs seeing the biggest return. Strongest growth is occurring in the coffee shop/café
segment; while still only about 5% of total Commercial spend, it is growing at an annual rate of over 9%.
Other segments are also showing significant improvement, notably leisure and travel, which are positively
impacted by growing tourism business and spending on leisure activities.
Within institutional foodservice, growth is more subdued, but still healthy. Business and Industry are the
category leaders, accounting for 42% of the Institutional market. Healthcare is also a large player in the field,
with hospitals and other healthcare facilities accounting for 33% of institutional consumer spend. Education
rounds out institutional foodservice, with 20% market share. Other sectors, such as defence and prisons also
contribute to institutional foodservice sales, though are not high growth drivers within the channel.

© 2016 Technomic Inc.
Overarching Trends in the Commercial Channel
21
The following are overarching key trends throughout the commercial restaurant space:
Focus on value
Operators view value as being more than about price only. Many operators feel that consumers are willing to
spend more money on higher quality food and beverage items and speak of “fair” prices as opposed to lowest
price. Value creation tends to focus on maximising the experience that consumers have within the restaurant
or hotel.
Greater culinary expression
There has been a strong focus on hiring chefs and others with culinary experience. This is true across most
channels – particularly among hotels and full service restaurants. In some cases, even QSRs are elevating
the culinary role to create a better offer to the consumer.
Emphasis on provenance
Provenance continues to be viewed as a critical determinant of the quality of the item. Consumers want to
know who they’re supporting, and “food with a story” is something that operators increasingly market to their
customers.
Health & authenticity
While foodservice remains a segment that consumers crave indulgence, increasingly operators are focused
on “healthy” offerings, broadly defined. Operators are moving away from lower fat or lower calorie positioning
and instead focusing on including specific types of ingredients. Other methods include increasing
transparency of the menu and going beyond menu item descriptions such as “natural” to include more details
about sourcing. Operators also indicate that menu items that have authentic positioning also correlate with
consumer perceptions that the items are healthier.

© 2016 Technomic Inc.
Key Trends - Commercial Channel
22
Quick Service
• Economic growth and rising rates of employment encourage consumers to spend more, but carefully. This
increase of consumers with on-the-go lives and a need for value and speed fuels the growth of this market.
• Operators are re-investing in their operations - their food and beverage offerings, interiors, and technology.
Lines between segments are blurring as a result of this upscaling activity.
• Irish consumers continue to prefer Irish origin products and foods, however the Irish interest in ethnic foods
is also emerging.
• Delivery continues to be a central driver for this market.
• Consumers are responding to the national focus on obesity with growing demand for the ability to choose
from more health-conscious menu items.
Pubs
• Urban markets continue to find success from tourism, however the need for innovation is ongoing in efforts
to differentiate from competitors.
• Operators indicate that they are burdened and struggling under Ireland’s heavy alcohol tax, increased
minimum wage, cost of insurance, and increased operating costs.
• Consumers are less likely to go for “beverage only occasions,” and as a result food-led pubs continue to
gain share within the marketplace.
• Pub customers today are not as loyal to brands and are exploring new drinks. This in turn has helped fuel
the growth of the craft beer market which has seen the number of microbreweries in Ireland quadruple in the
last few years.

© 2016 Technomic Inc.
Key Trends - Commercial Channel
23
Hotels and Accommodation
• Both overseas and domestic tourism have increased, with a notable increase in business travel.
• Restaurant meals offered at hotels are often seen more as convenience rather than a destination. Food and
beverage programmes are especially a ‘pain point’ for operators as a result of finding culinary talent and
managing labour costs.
• Hotels are continuing to invest in staffing, interiors and new properties to meet the growing needs for
accommodation in Ireland’s top cities.
• The zero rate travel tax and the 9% tourism VAT rate in ROI continues to support the industry’s growth.
• The majority of hotels and guesthouses have seen an increase in business. However, conditions remain
challenging for many rural areas.
Full Service
• The shortage of qualified chefs in Ireland continues, however, there has been an increase in the number of
programmes and investments to address the issue.
• The Irish restaurant marketplace is becoming more attractive to outside investors and tourists.
• Operators are meeting the demands of an increasing number of health-centric diners with heartier veggie
entrees and innovative preparation techniques.
• Similar to other segments, full service restaurants in urban and tourist-centered areas are seeing the most
success in comparison to rural restaurants.
• Investments in bar and beverage programmes continue.

© 2016 Technomic Inc.
Key Trends - Commercial Channel
24
Coffee Shops and Cafés
• The coffee shop and cafés subchannel is in the middle of the “third wave” of coffee. Interest and awareness
in premium products is gaining traction among consumers, and the number of specialty independent cafés
and coffee shops is rising as a result.
• Large coffee chains still hold the majority of the market and are improving their food and drink offerings to
compete with high street cafes.
• Fair trade and ethical sourcing are taken as “givens” in the coffee market. Additionally, explaining the story
and origin of the coffee has helped connect brands to the consumer.
• More and more operators are looking to expand their lunch and later daypart menus alongside their coffee
offerings. However, this remains a relatively low share of revenue, as grab-and-go breakfast and coffee
items remain the strongest performers within the subchannel.
Other Commercial Locations
• Major international foodservice management firms dominate the market, however, smaller catering groups
are growing.
• Investments are being made to meet the evolving needs of the consumers. This includes payment
technology and the development of high-quality and ethnic-centric meal offerings.

© 2016 Technomic Inc.
Overarching Trends in the Institutional Channel
25
The following are overarching key trends observed throughout the instiutional restaurant space:
Flat participation rates
Most institutional operators report flat participation rates (i.e. number of captive patrons that utilise the
foodservice area). As such, a big focus has been on driving higher average spend to achieve growth.
Differentiation through food and beverage offerings
In a competitive market, particularly in major urban areas such as Dublin, Cork and Galway, institutional
foodservice operators look to provide offerings on par with high street operators and create a differentiated
experience on site. Many operators continue to try to recruit and invest in culinary talent to create unique
offerings for their customers, and beverage has become an area of focus as well.
Maintain cost parameter while focusing on food quality
Cost remains the critical factor for many institutional operators, as they need to provide high quality meals at
rates lower than their commercial counterparts.
More grab-n-go
Fewer diners have time to sit down for meals, and institutional operators are bringing more grab-n-go options
in for both meals and snack occasions in an effort to meet the demands on these consumers.
More brands
To boost the overall quality perception of some programmes, institutional operators are bringing in brands that
are known to the consumer (this is especially true for coffee and beverage programmes.)

© 2016 Technomic Inc.
Key Trends - Institutional Channel
26
Business and Industry
• The increasing demand for better ingredients and higher quality food presents storage, preparation and cost
issues.
• The need for more experienced culinary talent is growing as consumers demand innovation and non-
traditional items infused with ethnic and seasonal flavors.
• The industry is seeing an increase in business as employment and the economy bounces back.
• This sub-segment is heavily dominated by foodservice facilities management and is very competitive for
contract foodservice, given the high saturation of firms in this space.
Healthcare
• While some improvements have been made to programmes among healthcare operators, overall, the quality
and freshness of patient food remains a concern in many facilities.
• As the majority of healthcare institutions are self-operated, some of the largest barriers to providing high-
quality food relate to the associated costs.
• Visitor dining preferences are expanding to meet the demands for higher quality foods that serve multiple
dayparts at different price points.

© 2016 Technomic Inc.
Key Trends - Institutional Channel
27
Education
• Secondary school and college students are increasingly demanding higher quality, balanced meals and food-
to-go offerings.
• While employment numbers continue to rise in Ireland and more parents are able to give their children lunch
money, the vast majority of primary and secondary school children in Ireland still bring food to school in
lunchboxes. Some students in NI qualify and participate in the UK catering system.
• Ireland's focus on obesity is leading operators to get more involved in class, in the cafeteria and with after
school programmes to encourage healthy eating practices in school and at home.
• Food offerings continue to improve with a focus on including as much local and seasonal items as possible,
when feasible.
• Budgetary constraints continue to be a major concern among operators.
Other Institutional Locations
• Procurement and menu options are limited, however some changes have recently been made to provide
variety and nutrition, meeting an assortment of dietary needs and preferences.
© 2016 Technomic Inc.
Total Market - Consumer, Operator and Distributor Spend
28
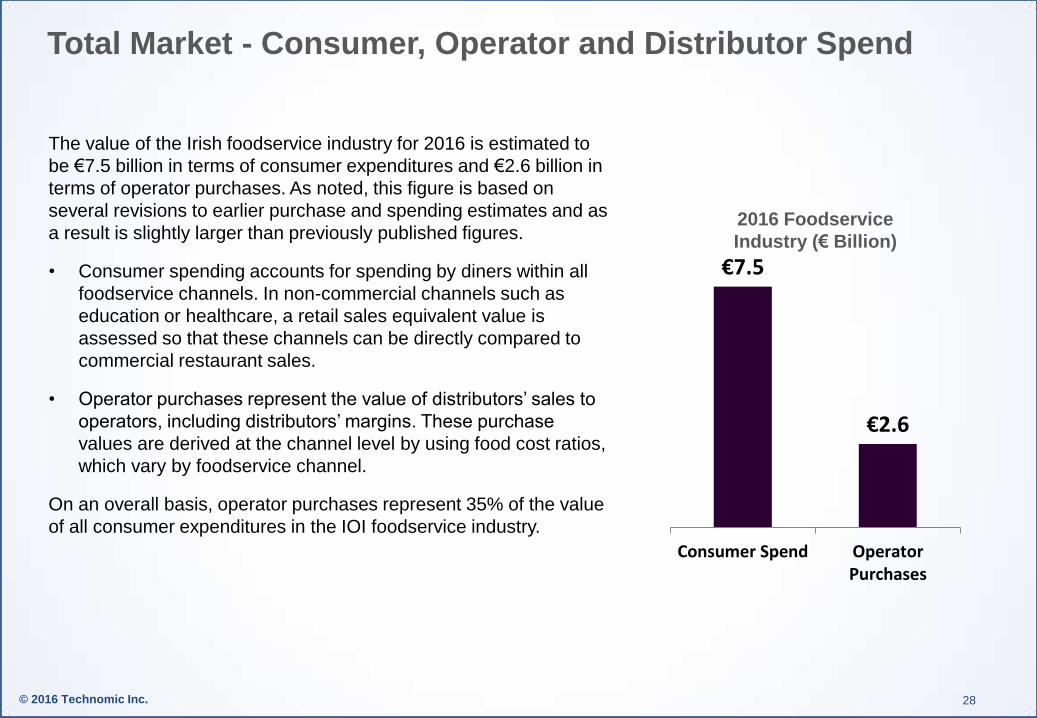
The value of the Irish foodservice industry for 2016 is estimated to
be €7.5 billion in terms of consumer expenditures and €2.6 billion in
terms of operator purchases. As noted, this figure is based on
several revisions to earlier purchase and spending estimates and as
a result is slightly larger than previously published figures.
• Consumer spending accounts for spending by diners within all
foodservice channels. In non-commercial channels such as
education or healthcare, a retail sales equivalent value is
assessed so that these channels can be directly compared to
commercial restaurant sales.
• Operator purchases represent the value of distributors’ sales to
operators, including distributors’ margins. These purchase
values are derived at the channel level by using food cost ratios,
which vary by foodservice channel.
On an overall basis, operator purchases represent 35% of the value
of all consumer expenditures in the IOI foodservice industry.
€7.5
€2.6
Consumer Spend OperatorPurchases
2016 Foodservice
Industry (€ Billion)
© 2016 Technomic Inc.
Commercial and Institutional Channels
29
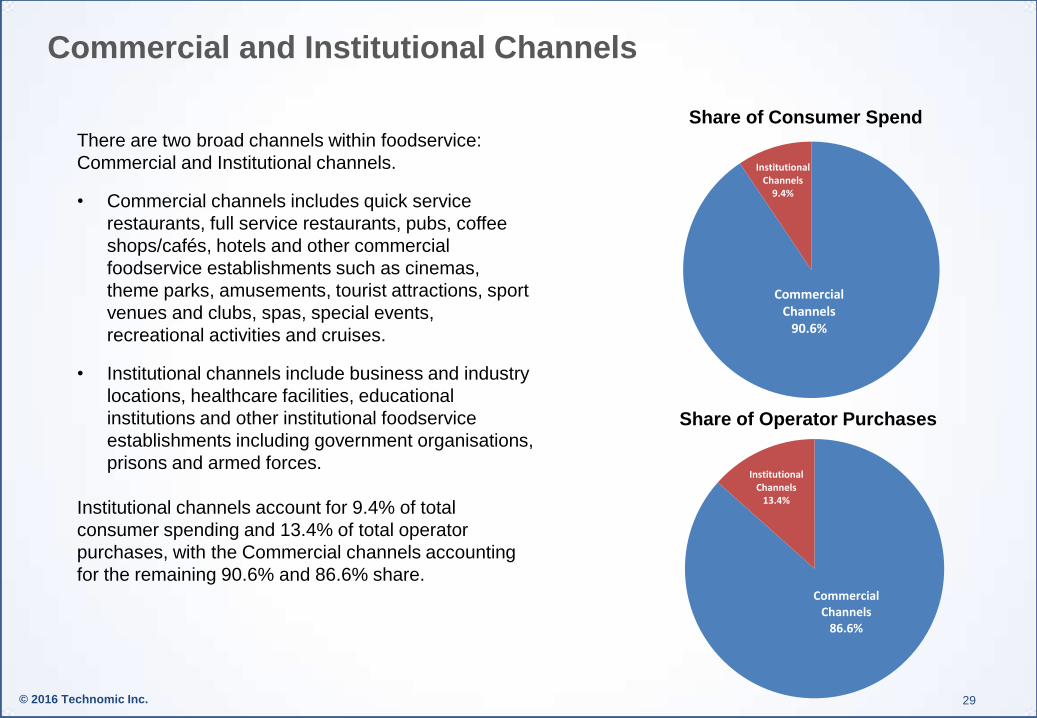
There are two broad channels within foodservice:
Commercial and Institutional channels.
• Commercial channels includes quick service
restaurants, full service restaurants, pubs, coffee
shops/cafés, hotels and other commercial
foodservice establishments such as cinemas,
theme parks, amusements, tourist attractions, sport
venues and clubs, spas, special events,
recreational activities and cruises.
• Institutional channels include business and industry
locations, healthcare facilities, educational
institutions and other institutional foodservice
establishments including government organisations,
prisons and armed forces.
Institutional channels account for 9.4% of total
consumer spending and 13.4% of total operator
purchases, with the Commercial channels accounting
for the remaining 90.6% and 86.6% share.
Commercial Channels
86.6%
Institutional Channels
13.4%
Share of Operator Purchases
Commercial Channels
90.6%
Institutional Channels
9.4%
Share of Consumer Spend

© 2016 Technomic Inc.
Commercial Channels
30
Traditional Quick Service Restaurants (QSRs), pubs and hotels account for the greatest share of
consumer spend in IOI. Collectively, these three channels represent 73% of the total Commercial
channel.
Traditional QSR 34%
Fast Casual 2%
Food to go 2%
Full Service 13%
Pubs 20%
Coffee Shops/ cafes 5%
Hotels 19%
Other Commercial
4%
Commercial Channel
Share of Consumer Spend

© 2016 Technomic Inc.
Institutional Channels
31
Business and Industry is the largest institutional channel, representing over 40% of consumer spending.
This is followed by Healthcare, which represents approximately 33% of total consumer spend within the
institutional channel.
Business & Industry
42%
Healthcare 33%
Education 20%
Other Institutional
5%
Institutional Channel
Share of Consumer Spend

© 2016 Technomic Inc.
Route to Market
32
Delivered Wholesale
67%
Direct 10%
Cash & Carry
9%
Contract "wheels
only" 13%
Retail 1%
Share of Operator Purchases
2014
Share of Operator Purchases
2016
The most prevalent route to market in Irish foodservice is wholesale delivery, which accounts for 67%
of operator purchases – up one percentage point from 2014. The contract “wheels only” channel also
grew by one percentage point over the review period. This is driven by growth in the chain market.
Delivered Wholesale
66%
Direct 11%
Cash & Carry 10%
Contract "wheels
only" 12%
Retail 1%

© 2016 Technomic Inc.
2016 Irish Foodservice Market Snapshot
33
2016 Irish Foodservice Market 2016 Consumer Spending (€M)
2016 Operator Purchases (€M)
2014-16
CAGR Total Outlet
Count
Limited Service (QSR, fast casual, food to go) € 2,624 € 874 5.5% 8,850
Pubs 1,344 390 2.7% 8,400
Hotels & Accommodation 1,271 432 7.5% 1,255
Full Service 913 301 5.6% 3,100
Coffee Shops and Cafes 397 115 9.5% 2,150
Other Commercial 276 97 12.0% 1,050
Total Commercial € 6,825 € 2,209 5.7% 24,805
Business and Industry 297 143 3.4% 2,000
Healthcare 232 118 2.5% 1,140
Education 143 62 2.3% 4,940
Other Institutional 39 20 3.1% 200
Total Institutional € 712 € 343 2.9% 8,280
Total IOI € 7,536 € 2,552 5.5% 33,085
Republic of Ireland € 5,374 € 1,820 6.7% 26,600
Northern Ireland € 2,162 € 732 2.5% 6,485
© 2016 Technomic Inc.
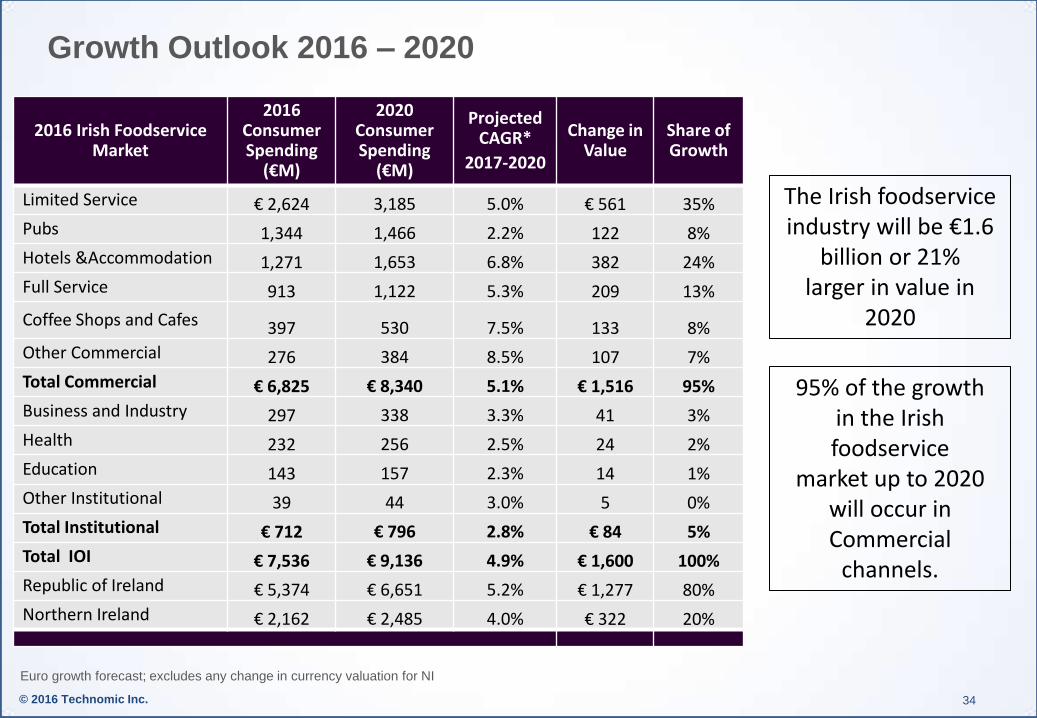
Growth Outlook 2016 – 2020
34
Euro growth forecast; excludes any change in currency valuation for NI
2016 Irish Foodservice Market
2016 Consumer Spending
(€M)
2020 Consumer Spending
(€M)
Projected CAGR*
2017-2020
Change in Value
Share of Growth
Limited Service € 2,624 3,185 5.0% € 561 35%
Pubs 1,344 1,466 2.2% 122 8%
Hotels &Accommodation 1,271 1,653 6.8% 382 24%
Full Service 913 1,122 5.3% 209 13%
Coffee Shops and Cafes 397 530 7.5% 133 8%
Other Commercial 276 384 8.5% 107 7%
Total Commercial € 6,825 € 8,340 5.1% € 1,516 95%
Business and Industry 297 338 3.3% 41 3%
Health 232 256 2.5% 24 2%
Education 143 157 2.3% 14 1%
Other Institutional 39 44 3.0% 5 0%
Total Institutional € 712 € 796 2.8% € 84 5%
Total IOI € 7,536 € 9,136 4.9% € 1,600 100%
Republic of Ireland € 5,374 € 6,651 5.2% € 1,277 80%
Northern Ireland € 2,162 € 2,485 4.0% € 322 20%
95% of the growth in the Irish foodservice
market up to 2020 will occur in Commercial
channels.
The Irish foodservice industry will be €1.6
billion or 21% larger in value in
2020

© 2016 Technomic Inc. 35

© 2016 Technomic Inc.
Section 2:
MARKET SUB-CHANNEL
DYNAMICS

© 2016 Technomic Inc. 37

© 2016 Technomic Inc.
Limited Service Segment
Trends and Market Drivers

© 2016 Technomic Inc. 39
Limited Service Restaurants The limited service restaurant segment incorporates a number of sub-segments, including
traditional quick service restaurants (QSR), fast casual restaurants, and food on the go, which
encompasses convenience-driven items for takeaway in forecourt/convenience operators and
other grab-n-go found in retail operations.
The total Limited Service segment is €2.6 billion in consumer spending, with a value of €874 in
operator purchases. The following pages explore this segment in more detail.
Traditional QSR 89%
Fast Casual 6%
Food to go 5%
Limited Service Restaurants
Share of Consumer Spend

© 2016 Technomic Inc.
Traditional QSR/Fast Food Restaurants
Traditional Fast Food restaurants are limited service and are primarily characterized by quick
service. The segment typically refers to food sold in a restaurant or store with preheated or
precooked ingredients. Limited service sub-segments are distinguished in the foodservice market
by counter service, limited menus sold in large quantities, lower price points against other channels,
systematised operation requiring low skill levels and culinary expertise on the part of staff, and
aggressive marketing strategies.
40
The total size for the Traditional Fast Food segment in IOI for 2016 is €2.3 billion in terms of
consumer spending and €780 million for operator purchases (the value of distributors’ sales to
operators).
• Consumer spending within ROI for the Traditional Fast Food segment is €1,703 million.
• In NI, the value of consumer spending is €630 million in value.
QSR/Fast Food Restaurants 2016
Consumer Spending
(€M)
Operator Purchases
(€M)
Outlets 2016
Projected CAGR*
2017-2020
Total 2,333 780 6,200 4.9%
Republic of Ireland 1,703 569 4,800 5.2%
Northern Ireland 630 211 1,400 4.5%
Euro growth forecast; excludes any change in currency valuation for NI
© 2016 Technomic Inc.
Quick Service Restaurants - Trend and Market Drivers in 2016
41
The following operational trends have been pivotal in terms of impact on the Quick Service sub-
channel in 2016.
1. Quick Service restaurants are the obvious targets for criticism regarding the national focus on
obesity and health concerns. The potential mandatory inclusion of calorie counts on menus as
well as a tax on sugar sweetened drinks coming into effect in 2018 puts pressure on operators
to consider healthier menu items that are cohesive with their concept.
2. Quick and easy payment solutions are welcome in QSRs, and we see more and more
restaurants implementing this technology as well ordering technology to further enhance the
efficiency and customisation of their operation offers.
3. Economic growth and rising rates of employment encourage consumers to spend more, but
carefully. Irish consumers’ willingness to eat out for everyday meals is a valuable opportunity for
QSRs to grow. Convenience and price remain the main purchase drivers in this sub-segment.
While value is still enjoyed at these operations, the ambiance boosts consumers perception of
upscale.
4. Ethnic food operations continue to proliferate the market, matching the consumer taste for non-
domestic menu offerings. Operators are implementing these trends when possible.
5. In response to the increasing growth of fast casual operations, many fast food chains are
investing in interior upgrades as well as improvements towards the freshness and quality of
their food to.

© 2016 Technomic Inc. 42
The following consumer trends have been pivotal in terms of impact on the Quick Service sub-
channel in 2016.
1. Irish labelled and marketed foods attract Irish customers. “Local” and “homemade” menu items
continue to be a strong trend in this market. McDonalds has benefitted from this with their
McMór sandwich, with a focus on Irish ingredients. Customer demand encouraged McDonalds
to bring the sandwich back on their menu for further Limited Time Offer.
2. Consumers that visit these operations desire easy on-the-go food items that travel well.
Portability and hand-held qualities are important aspects to consider while creating an on-the-
go menu and its packaging.
3. Delivery continues to be a central driver for this market. This is in-line with the Irish consumer’s
appetite for online and mobile technology and the increasing number of on-the-go consumers.
Delivery services such as Deliveroo and Just Eat continue to add more venues to their growing
lists of restaurants they deliver. Similarly, new improvements and online ordering applications
have been developed for the manufacturing community as well.
4. Consumers want more health-conscious items. This includes beverage options outside of soft
drinks as well as lower-calorie items and vegetable and fruit entrees and sides.
Quick Service Restaurants - Trend and Market Drivers in 2016

© 2016 Technomic Inc.
Quick Service Restaurants Spotlight - Investing in Technology
43
Traditional Fast Food operators are focused on
innovation to keep up with the tech-savvy, on-the-go
Irish consumer.
Domino’s continues to expand across the UK and
Ireland and experience growth in sales. Nearly half
of Domino’s sales result from their delivery app.
Additionally, Domino’s furthers their focus on easy,
fast ordering with “The Easy Order” Button and
Facebook messenger.
For the Fast Food channel, this translates into:
• Operators partnering with delivery services such
as Deliveroo and Just Eat.
• Increasing operational efficiency and simplifying
the process for consumers to order.
• Investing in online ordering capabilities.
© 2016 Technomic Inc.
Quick Service Restaurants Spotlight - Staying relevant to
the Consumer
44
“Our main challenge is to remain relevant to the consumer. Ensuring our menu is on-trend, our quality is consistent and the experience is the best it can be have all been our focus this year.” - QSR operator

© 2016 Technomic Inc.
Fast Casual Restaurants
Fast Casual restaurants are also limited service but are generally more upscale, investing more in
the design and ambiance of the operation. Similar to QSRs, Fast Casual restaurants are often
systemized with limited, focused menus. However, meals are prepared with higher quality
ingredients and so customers pay more. This sub-segment includes operations that sell premade,
ready to eat items sold through various retail channels and consumed off premises.
45
Euro growth forecast; excludes any change in currency valuation for NI
The total size for the Upscale/Fast Casual segment in IOI for 2016 is €164 million in terms
of consumer spending and €54 million for operator purchases (the value of distributors’ sales
to operators).
• Consumer spending within ROI for the Upscale/Fast Casual segment is €120 million.
• In NI, the value of consumer spending is €44 million in value.
Fast Casual Restaurants 2016
Consumer Spending
(€M)
Operator Purchases
(€M)
Outlets 2016
Projected CAGR*
2017-2020
Total 164 54 400 7.5%
Republic of Ireland 120 40 300 7.8%
Northern Ireland 44 14 100 7.2%

© 2016 Technomic Inc.
Fast Casual Spotlight - Focus on Healthy Menu Additions
46
Fast casual operators are adding healthier
options to their menus in response to the
national interest in combatting obesity.
Chopped, a popular Dublin-based salad bar, is
capitalising on this trend.
For the Fast Casual channel, this translates into:
• Operators considering healthy menu
additions and sides, and evaluating whether
these will benefit the existing menu.
• Conducting consumer research and utilising
manufacturer and distributor trend
information to adjust offerings.
• Collecting guest feedback on potential menu
changes.
© 2016 Technomic Inc.
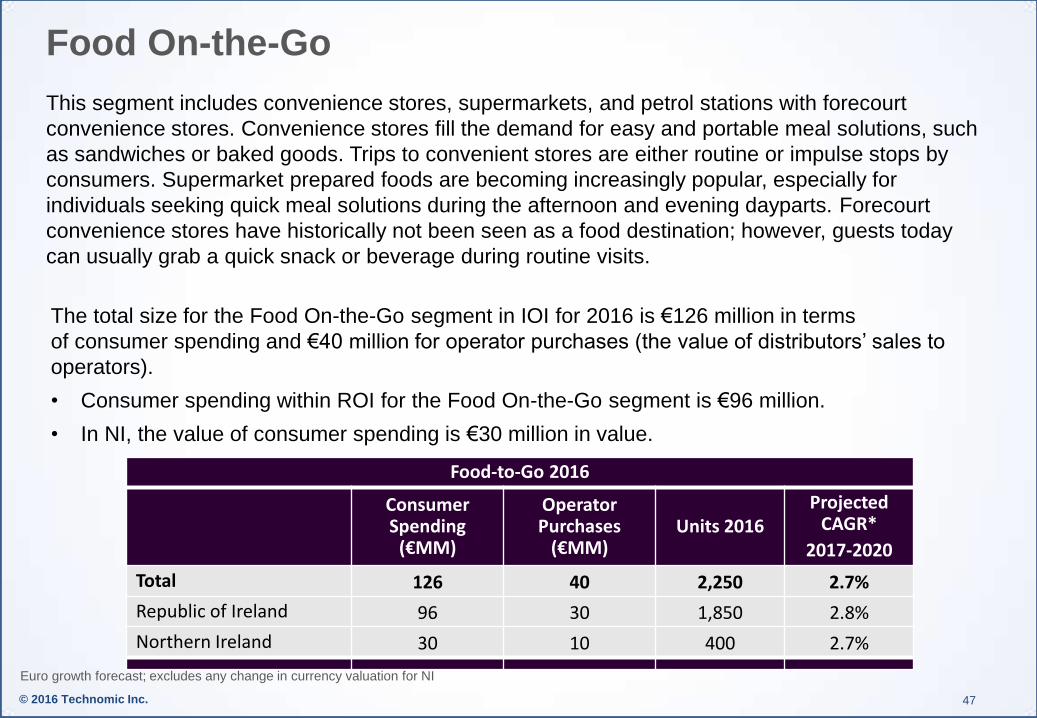
Food On-the-Go
This segment includes convenience stores, supermarkets, and petrol stations with forecourt
convenience stores. Convenience stores fill the demand for easy and portable meal solutions, such
as sandwiches or baked goods. Trips to convenient stores are either routine or impulse stops by
consumers. Supermarket prepared foods are becoming increasingly popular, especially for
individuals seeking quick meal solutions during the afternoon and evening dayparts. Forecourt
convenience stores have historically not been seen as a food destination; however, guests today
can usually grab a quick snack or beverage during routine visits.
47
The total size for the Food On-the-Go segment in IOI for 2016 is €126 million in terms
of consumer spending and €40 million for operator purchases (the value of distributors’ sales to
operators).
• Consumer spending within ROI for the Food On-the-Go segment is €96 million.
• In NI, the value of consumer spending is €30 million in value.
Food-to-Go 2016
Consumer Spending
(€MM)
Operator Purchases
(€MM) Units 2016
Projected CAGR*
2017-2020
Total 126 40 2,250 2.7%
Republic of Ireland 96 30 1,850 2.8%
Northern Ireland 30 10 400 2.7%
Euro growth forecast; excludes any change in currency valuation for NI
© 2016 Technomic Inc.
Food On-the-Go - Trend and Market Drivers in 2016
48
The following operational trends have been pivotal in terms of impact on food on-the-go in 2016.
1. Customers continue to choose high-quality healthy options and visit health-centric restaurants.
The consumer’s search for high-quality foods on-the-go continues. Freshii and Applegreen
have partnered to meet this demand for convenient, fast, good-for-you foods.
2. Forecourts are modernising. Speed, cleanliness, and efficient technology are the focus in
recent investments.
3. Continued efforts are being made to provide innovative, high-quality product selections. This
can include fresh bakery goods, a broader selections of spirits, or barista-style coffee.
Operators can fine-tune their selections based on local consumer preferences.
4. Margins on petrol and diesel continue to be small, and operators are choosing to focus more on
their retail food-to-go offerings. Maxol, Ireland's leading family-owned oil and forecourt
convenience company, offers their own food brand Moreish as well as different franchises.
5. International operators are expanding into the Irish market. Canadian brand, Alimentation
Couche-Tard Inc., has just acquired CST in the US, making it the largest convenience store
operator in the country. Couche-Tard recently acquired Topaz in Ireland, with reported plans to
rebrand the convenience stores into Circle Ks at a future stage.

© 2016 Technomic Inc. 49
The following consumer trends have been pivotal in terms of impact on the Food-On- sub-channel
in 2016.
1. The number of those working with on-the-go lives continues to increase and fuel the expansion
of forecourts. Applegreen reports growth, and Supermac plans to open new locations on
motorways.
2. Traditionally popular non-food items are declining in sales, creating an opportunity for
forecourts and c-stores to invest in their food items. For example, less and less people are
buying cigarettes for health and cost reasons. Additionally, the majority of lottery and
newspaper sales have gone online.
3. Irish consumers continue to prefer Irish origin products and foods. Kantar Worldpanel’s Brand
Footprint study for 2016 found that half of Ireland’s top 50 brands are Irish. These are brands
that are bought most frequently. Operators should weigh these brands more heavily while
working with suppliers to choose their food and drink selection.
Food On-the-Go - Trend and Market Drivers in 2016

© 2016 Technomic Inc.
Food On-the-Go Spotlight - Race for Modernity
50
Topaz, a top rated forecourt in Ireland, continues to
build and open state of the art locations. Its most
recent investment of €6.5m towards sites in
Ballysimon, Co. Limerick and Citywest, Co. Dublin
financed a range of barista coffees as well as
enhanced fresh and local food and beverage
offerings.
Modernity translates into quality in the forecourt
space. Cleanliness and efficiency are top factors
customers are looking for when choosing to shop at
a forecourt or c-store. As for food-on-the go items,
this translates into:
• Operators considering higher-quality retail and
pre-ready food items.
• Investing in hot or cold-holding equipment that
maintain food freshness, or more appealing
display boxes.
• Expanding hot and cold beverage offerings.
© 2016 Technomic Inc.
Food On-the-Go Spotlight - Snacking occasions on the rise
51
“Snacking is up while soft drinks are down. The customer is changing what they want when they eat away from home.” - Foodservice Distributor

© 2016 Technomic Inc.
Pubs
Trends and Market Drivers

© 2016 Technomic Inc.
Pubs
Licensed pubs includes drinking establishments that are outlets built specifically for (and largely
dependent on) the sale of alcohol for on premise consumption. Traditionally they would have had a
limited food offering, and in many pubs the food offering still remains basic. Pubs are characterised
by a bar service and are often seen as social meeting places, rather than a place of pure
consumption.
53
Euro growth forecast; excludes any change in currency valuation for NI
The total size for the Pubs segment in IOI for 2016 is €1,344 million in terms of consumer
spending and €390 million for operator purchases (the value of distributors’ sales to
operators).
• Consumer spending within ROI for the Pubs segment is €954 million.
• In NI, the value of consumer spending is €390 million in value.
Pubs 2016
Consumer Spending (€M)
Operator Purchases
(€M)
Outlets 2016
Projected CAGR*
2017-2020
Total 1,344 390 8,400 2.2%
Republic of Ireland 954 277 7,200 2.3%
Northern Ireland 390 113 1,200 1.9%

© 2016 Technomic Inc.
Pubs - Trends and Market Drivers in 2016
54
The following operational trends have been pivotal in terms of impact on the pub sub-channel in
2016.
1. The rising number of tourism has helped Ireland’s well-known bars in tourist-prone areas and
cities to enjoy increased sales.
2. As the major cities of Ireland become more saturated with new restaurants and bars, bars and
restaurants providing multiple concepts under one roof are increasingly finding success. These
venues benefit from their ability to attract multiple groups of people who are looking for different
scenes. Concepts include cafes, nightclubs, and gastropubs.
3. Operators are burdened by Ireland’s heavy alcohol tax, increased minimum wage, cost of
insurance, and increased operating costs. According to research conducted by Begbies
Traynor, nearly one quarter of bars in Northern Ireland state they are under significant financial
distress.
4. The popularity of craft beer continues to rise. The number of microbreweries in Ireland has
more than quadrupled since 2012 to 90, with 2/3 of these producing beer on their own premises
and the remainder marketing and selling products beer produced by outside breweries.
Revenue of €40 million was recorded for 2015, with a projected €59 million for 2016. Of the
total amount of beer consumed in 2015, 2.5% of it was craft beer and this is predicted to
increase to 3.4% in 2016.

© 2016 Technomic Inc. 55
The following consumer trends have been pivotal in terms of impact on the pub sub-channel in
2016.
1. Drinkers today are not as loyal to brands and are exploring new drinks. More pubs are seeing
sales increase with broader menus with different types of whiskey, craft beers, and gins.
2. Consumers continue to look for better quality food offerings at gastropubs.
3. Unemployment levels are decreasing in Ireland, allowing a higher frequency in visits to pubs.
4. Consumers are less likely to go for “beverage only occasions,” and as a result food-led pubs
continue to open. Food led pubs have performed very well as a result of the value the food
menus offer these establishments, encouraging consumers to stay longer and spend more.
These types of establishments create a “blurring of lines” between full service restaurants (that
are increasingly focused on building a bar business) and pubs.
5. Consumers respond more positively to outlets with a strong ambiance and design, whether that
be a genuine Irish pub or a modern gastropub.
Pubs - Trends and Market Drivers in 2016

© 2016 Technomic Inc.
Pubs Spotlight - Expanding Drink and Food Menus
56
Venues that offer strong food and drink menus continue to find success.
L. Mulligan. Grocer., based in Dublin, offers its guests a bar serving multiple types of whiskey
and craft beers, as well as a restaurant serving up local and seasonal ingredients.
For the Pub channel, this translates into:
• Considering different menus and drinks for each daypart or as monthly deals.
• Addressing the consumers’ shift towards a food-focused environment.
• Working with local breweries and distilleries to bring new drinks onto the menu.

© 2016 Technomic Inc.
Pubs Spotlight - Consumer trends
57
“The younger consumers are drinking differently – they start at home and don’t go to the pub like they used to. More and more competition from other types of operators are also creating challenges.” - Pub operator

© 2016 Technomic Inc.
Hotels and
Accommodation
Trends and Market Drivers

© 2016 Technomic Inc.
Hotels and Accommodation
Foodservice in the hotel and accommodation channel is heavily focused on the hotel channel,
which accounts for 95% of the market. Other accommodation forms, such as guest houses, are
included but only where they are large enough (10 rooms or more) and these are few in number.
Meetings, banquets and conferences that take place in hotels are also accounted as part of the
broader hotel channel. B&Bs are not covered, as their foodservice needs are usually only breakfast
items that they obtain through cash and carry or direct from retail.
59
Euro growth forecast; excludes any change in currency valuation for NI
The total size for the Hotels and Accommodation segment in IOI for 2016 is €1,271 million in
terms of consumer spending and €432 million for operator purchases (the value of distributors’
sales to operators).
• Consumer spending within ROI for the Hotels and Accommodation segment is €928 million.
• In NI, the value of consumer spending is €343 million in value.
Hotels and Accommodation 2016
Consumer Spending
(€M)
Operator Purchases
(€M)
Outlets 2016
Projected CAGR*
2017-2020
Total 1,271 432 1,255 6.8%
Republic of Ireland 928 315 1,030 7.0%
Northern Ireland 343 117 225 6.2%

© 2016 Technomic Inc.
Hotel and Accommodation - Trends and Market Drivers in 2016
60
The following operational trends have been pivotal in terms of impact on the hotel and lodging sub-
channel in 2016.
1. The Irish Hotels Federation (IHF) reports 90% of hotels and guesthouses have seen an increase in
business. However, conditions remain challenging for many rural areas, and 30% of hoteliers are still
concerned about their ability to continue profits into 2017 due to local authority rates, labour costs,
and utility costs.
2. Both overseas and domestic tourism have increased. Overseas tourism has seen a 13% increase
overall in all major target markets so far this year. However, according to IHF, 95% of hoteliers are
concerned how BREXIT will affect visitor numbers from the UK.
3. Hotels are continuing to invest. IHF reports that many have increased staffing levels this year and
73% are planning to hire more in the months ahead, compared to 57% last year. Additionally, many
properties are being refurbished or rebranded, and many new properties are in the pipeline.
4. Challenges for operators include labour costs - finding experienced chefs and paying higher wages.
Many are coping by cost cutting with “speed scratch,” or combining value added ingredients with
already prepared ingredients together on site.
5. Dublin and other tourism hotspot cities are reportedly seeing room rates at and above 90%, however
occupancy levels outside of traditional tourism hotspots continue to be much lower.
6. Fáilte Ireland warns that there will continue to be an accommodation shortage in Dublin while the city
races to invest and build over the next two years to meet the growing needs.

© 2016 Technomic Inc. 61
The following consumer market drivers have been pivotal in terms of impact on the hotels and
lodging sub-channel in 2016.
1. Businesses are still holding more meetings and events at hotels with catering. IHF reports a
60% increase in this area.
2. The number of business travelers to Ireland is continually rising. However, there is a particular
shortage of serviced apartments in Dublin. Many aparthotels are in the pipeline to meet this
increasing demand.
3. With travel interest from overseas markets increasing, hotel restaurants need to cater to
international tastes.
4. The zero rate travel tax and the 9% tourism VAT rate in ROI continues to support the industry’s
growth.
5. Breakfast is a key day part to sell consumers and hotels are continuing to focus on providing
healthier and better quality breakfast options. Restaurant meals offered at hotels are often seen
more as convenience rather than a destination.
6. Irish consumer sentiment is improving alongside the economic recovery. According to IHF, 66%
of hoteliers in IOI report an increase in domestic business. This business is most important to
properties outside of tourist-prone cities.
Hotel and Accommodation - Trends and Market Drivers in 2016
© 2016 Technomic Inc.
Hotel and Accommodation Spotlight - Servicing Business
Travelers
62
There is a high demand for aparthotels that can
service the increasing levels of business travel and
its accompanying needs.
Staycity is an award-winning aparthotel business
based in Dublin, with 1,400 units across the UK and
other European countries. Staycity has 200 units in
Ireland alone. The company has stated it is on target
to expand to 15,000 units by 2020.
For the Hotel and Accommodation sub-channel, this
translates into:
• Incorporating high quality food retail into
operations if travelers book rooms with kitchens.
• Expanding on catering services to meet the
demands for large and small meetings and
business events.
• Considering international menus to help guests
feel “at home.”

© 2016 Technomic Inc.
Hotel and Lodging Spotlight - Greater Emphasis on Food
Quality and Variety
63
“Managing margins remains critical, but there is strengthening interest to increase the quality of food that is served in hotels.” - Hotelier
© 2016 Technomic Inc.
Full Service Restaurants
Trends and Market Drivers

© 2016 Technomic Inc.
Full Service Restaurants
Full service restaurants focus on serving lunch or dinner. Sub-channels include both casual dining
and white table cloth restaurants. Menus offer a complete range of items often using fresh
ingredients – appetisers, soups, main courses and desserts are accompanied by a wine or
beverage list. Casual restaurants are defined as: a restaurant that serves moderately-priced food in
a casual atmosphere. Except for buffet-style restaurants, casual dining restaurants typically provide
table service. Pop-up restaurants are a recent addition to the restaurant channel - restaurants that
occupy premises for a finite time period only.
65
Euro growth forecast; excludes any change in currency valuation for NI
The total size for the Full Service Restaurant segment in IOI for 2016 is €913 million in terms
of consumer spending and €301 million for operator purchases (the value of distributors’ sales
to operators).
• Consumer spending within ROI for the Full Service Restaurants segment is €616 million.
• In NI, the value of consumer spending is €297 million in value.
Full Service Restaurants 2016
Consumer Spending
(€M)
Operator Purchases
(€M)
Outlets 2016
Projected CAGR*
2017-2020
Total 913 301 3,100 5.3%
Republic of Ireland 616 203 2,400 5.5%
Northern Ireland 297 98 700 5.0%

© 2016 Technomic Inc.
Full Service Restaurants - Trends and Market Drivers in 2016
66
The following operational market drivers have been pivotal in terms of impact on the full service
sub-channel in 2016.
1. The Restaurant Association of Ireland has previously highlighted that the shortage of qualified
chefs in Ireland had reached a crisis level. In response, there has been an increase in the
number of programmes and investments made in chef training and professional development,
such as the Chef Network, to help meet the immediate need for 5,000 chef trainees each year.
2. The segment is growing, with an increase in new locations from both international and national
brands. The Irish restaurant scene is becoming more attractive to outside investors.
3. The possible calorie count mandate could increase the need for innovation and creativity, as
well as cost management if implemented. This may require assistance from suppliers to re-
build menus.
4. Full service restaurants in urban and tourist-centered areas have benefitted from higher growth
rates. Rural restaurants have not benefitted as much and remain more challenged from a sales
and profitability perspective.
5. Full service restaurants are investing more in bar and beverage programs. “Craft” beer and
cocktail programmes are being emphasised as a driver for incremental growth in average
spend and to offer a more unique, differentiated experience.

© 2016 Technomic Inc.
Full Service Restaurants – Trends and Market Drivers in 2016
67
The following consumer trends have been pivotal in terms of impact on the full service sub-
channel in 2016.
1. There is stronger consumer interest in ethnic menu items. Several new Italian restaurant
concepts have opened in the last year, and interest in Mexican foods grows considerably with
restaurant chains.
2. Special events and food-focused tourism are encouraging growth in this sub-channel. NI’s Year
of Food and Drink is celebrating locally produced foods and allows local businesses to promote
themselves throughout the year-long event.
3. Alongside special events, overseas tourism to Ireland continues to grow. The first quarter of
2016 saw an increase of 17% alone, and the first half of 2016 finished with a growth of 13%,
with the increase of 500,000 visitors compared to the same period last year.
4. Health and wellness continue to drive consumer tastes. More and more vegetarian and health-
focused restaurants are emerging with heartier veggie entrees. More meat-eating customers
are curious to explore and try these new concepts.

© 2016 Technomic Inc.
Full Service Restaurants Trend Spotlight - FSR Growth Driven
by Tourism
68
Northern Ireland is quickly becoming a center for
food-tourism. Belfast’s food scene thrives off of
Ireland’s home-grown ingredients, and the global
eater is taking notice.
Northern Ireland has set the stage for a year-
long celebration of all things local. Monthly
themes and associated events will be hosted to
highlight the virtues of eating and cooking in
Ireland.
What does this mean for full service
restaurants?
• Consider ingredients from local suppliers and
highlight these ingredients and their locality.
• Take advantage of opportunities to connect
with tourists, create partnerships with hotel
concierges.

© 2016 Technomic Inc.
Full Service Restaurants Spotlight - Focus on Drinks
69
“As pubs increasingly get into food, restaurants are going more into the drinks business. Local craft breweries and distilleries are increasingly finding customers among local restaurant groups. - Full service restaurant operator

© 2016 Technomic Inc.
Coffee Shops and Cafés
Trends and
Market Drivers

© 2016 Technomic Inc.
Coffee Shops and Cafés
Coffee shops are casual restaurants without table service that emphasise coffee and other hot
beverages. Typically there is a limited selection of cold and hot foods such as pastries,
sandwiches, and breakfast items on offer. Their distinguishing feature is that they allow customers
to relax, work and socialise on their premises for long periods of time, without the pressure to leave
promptly after eating.
71
Euro growth forecast; excludes any change in currency valuation for NI
The total size for the Coffee Shops and Cafes segment in IOI for 2016 is €397 million in terms
of consumer spending and €115 million for operator purchases (the value of distributors’ sales
to operators).
• Consumer spending within ROI for the Coffee Shops and Cafes segment is €286 million.
• In NI, the value of consumer spending is €111 million in value.
Coffee Shops 2016
Consumer Spending
(€MM)
Operator Purchases
Outlets 2016
Projected CAGR*
2017-2020
Total 397 115 2,150 7.5%
Republic of Ireland 286 83 1,850 7.7%
Northern Ireland 111 32 300 6.8%

© 2016 Technomic Inc.
Coffee Shops and Cafés - Trends and Market Drivers in 2016
72
The following operational market drivers have been pivotal in terms of impact on the coffee shops
and café sub-channel in 2016.
1. More and more operators are looking to expand their lunch and later daypart menus alongside
their coffee offerings. However, this remains a relatively low share of revenue.
2. The number of specialty independent cafés and coffee shops is rising. At the same time, coffee
chains such as Starbucks and Insomnia still hold the majority of the market, and are improving
their food and drink offerings to compete with high street cafes.
3. Within major urban locations, growth has been strong and there is some concern that a
“saturation” point will be reached soon as units expand and other non-cafes continue to expand
their coffee offerings.
4. Interest and awareness in premium products is gaining traction among consumers. More and
more consumers are searching out education and café experiences that allow them to indulge
in this interest.
5. Trained baristas are important to make recommendations and drive revenue within the coffee
shops and cafés. Expertise fuels sales and consumers’ perception of the product and
experience they are receiving.
6. This sub-segment is in the middle of the “third wave” of coffee, driving the demand for
independent shops that cater to consumers who consider coffee an artisanal product, like wine,
and expect premium quality.

© 2016 Technomic Inc.
Coffee Shops and Cafés - Trends and Market Drivers in 2016
73
The following consumer market drivers have been pivotal in terms of impact on the coffee shops
and café sub-channel in 2016.
1. Consumers are increasingly interested in higher quality coffee. More and more specialty coffee
shops such as 3FE are emerging. However, there is still a general lack of consumer knowledge
on specialty coffees.
2. New forms of coffee, including nitro coffee and cold brew coffee, are just beginning to gain
awareness among customers. Many expect these to see strong growth going forward as more
consumers experience and demand these “on trend” types of coffee.
3. Fair trade and ethical sourcing are taken as “givens” in the coffee market, but explaining the
story and provenance of the coffee has helped connect brands to the consumer.
4. Ireland is emerging as a major player in the global coffee market. The World of Coffee
conference took place in Dublin this year with thousands of people from over 100 countries in
attendance.
5. Coffee drinkers are more likely to buy sweet baked goods or breakfast items with their coffee
than any other food items.
6. While ambiance is very important, more Irish are working with on-the-go lives, so grab-and-go
coffee offerings will still remain a strong product to sell.

© 2016 Technomic Inc.
Coffee Shops and Cafés Spotlight - Local Expertise
74
Roasters in Ireland are evolving and gaining
attention in the market.
Bailies is a roaster in Northern Ireland offering
their coffee beans wholesale, in addition to
barista equipment and training.
For the Coffee Shop and Café channel, this
translates into:
• Considering subscriptions to smaller roasters
and offering these seasonal blends as LTOs.
• Expanding on coffee and barista education
for consumers and operators alike.
• Working with coffee experts to design food
menus that pair well with the coffees offered.
© 2016 Technomic Inc.
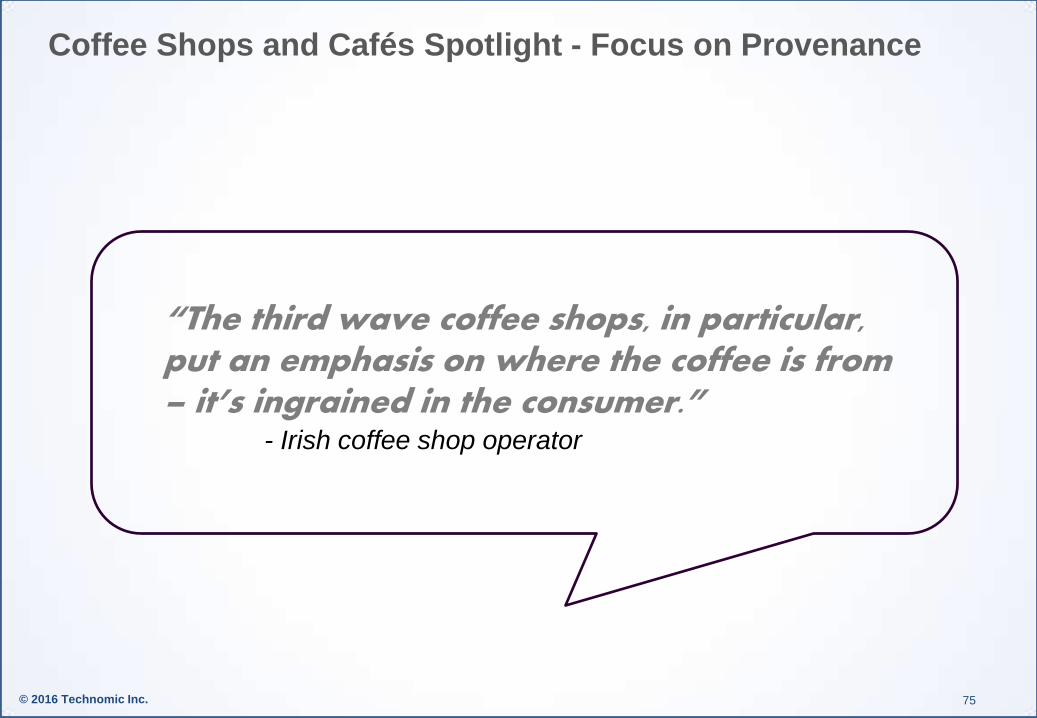
Coffee Shops and Cafés Spotlight - Focus on Provenance
75
“The third wave coffee shops, in particular, put an emphasis on where the coffee is from – it’s ingrained in the consumer.” - Irish coffee shop operator

© 2016 Technomic Inc.
Other Commercial
Trends and Market Drivers

© 2016 Technomic Inc.
Other Commercial
This channel contains two dynamic channels which, while still small in terms of sales value, hold
opportunities for suppliers to both the leisure and travel channels. The leisure channel is diverse
and comprises cinemas, theme parks, amusements, tourist attractions, sport venues and clubs,
spas, special events, recreational activities and cruises. The largest sub channels are sporting
events. The travel channel includes on board and terminus catering for flights, trains, ferries and
buses.
77
Euro growth forecast; excludes any change in currency valuation for NI
The total size for the Other Commercial segment in IOI for 2016 is €276 million in terms of
consumer spending and €97 million for operator purchases (the value of distributors’ sales to
operators).
• Consumer spending within ROI for the Other Commercial segment is €210 million.
• In NI, the value of consumer spending is €66 million in value.
Other Commercial 2016
Consumer Spending (€M)
Operator Purchases
(€M)
Outlets 2016
Projected CAGR*
2017-2020
Total 276 97 1050 8.5%
Republic of Ireland 210 74 750 8.6%
Northern Ireland 66 23 300 7.0%

© 2016 Technomic Inc. 78
The following operational trends have been pivotal in terms of impact in the transportation and
leisure food sub-channels in 2016.
1. Many of the major international catering brands, such as Aramark and Compass, continue to
win contracts with larger sports arenas. However, smaller catering groups are also growing.
2. Dublin has risen 6 places among the Internal Congresses and Conventions Association (ICCA)
rankings and is now in the global top 20, based on meetings held in 2015. Other regional
venues in Galway, Limerick, and Cork were featured in lower ranking.
3. Investments are being made to install payment technology and online ordering at venues and
as part of catering services.
4. Investments in the chef community extend into the commercial catering segment. Examples
include Sodexo Ireland’s annual Salon Culinaire featuring a number of competitions,
demonstrations, and supplier exhibitions to further train and reward the culinary community in
this segment.
The following consumer trend has been pivotal in terms of impact in the transportation and leisure
food sub-channels in 2016.
1. Consumers continue to demand better inflight and events foodservice. In response, airline,
event, and venue caterers are offering domestic and international menu offerings designed by
professional chefs.
Other Commercial - Trends and Market Drivers in 2016

© 2016 Technomic Inc.
Other Commercial Spotlight - Food Pairs Well with Leisure &
Travel
79
Food and drink is just as important to consumers as the
sports games they’re attending, the movies they’re
watching, and the tourist attractions they’re exploring.
Prioritising food alongside a venue’s entertainment has
helped both the Guinness Storehouse and Titanic
Belfast to be recognised as Europe's Leading Tourist
Attractions in 2015 and 2016 respectively.
The Guinness Storehouse offers its visitors two bars
and three café/restaurants to choose from.
For the Travel and Leisure sub-channel, this translates
into:
• Expanding on foodservice to meet interests of
domestic and international visitors.
• Working with suppliers or expert chefs to design
menu and retail offerings that fit your concept and
customers’ preferences.

© 2016 Technomic Inc.
Other Commercial Spotlight - Consumer Spending
80
“Business is very good in our arena and race course business. It’s driven by attendance and tourism, but there’s also a willingness to spend at these events that we don’t see in other areas.” - Foodservice operator

© 2016 Technomic Inc. 81

© 2016 Technomic Inc.
Business & Industry
Trends and Market Drivers

© 2016 Technomic Inc.
Business and Industry
Business and Industry (B&I) is defined as catering to the workforce. Offices, factories and remote
sites are in the key location segment. Menus are generally offered in three formats: fixed menus
(mostly in factories), self-service menus offering choice (mainly in office catering units and
canteens/cafeterias), and grab-and-go or vending operations offering predominantly beverages
adjacent to their place of work.
83
Euro growth forecast; excludes any change in currency valuation for NI
The total size for the Business and Industry segment in IOI for 2016 is €297 million in
terms of consumer spending and €143 million for operator purchases (the value of
distributors’ sales to operators).
• Consumer spending within ROI for the Business and Industry segment is €205 million.
• In NI, the value of consumer spending is €92 million in value.
Business and Industry 2016
Consumer Spending
(€M)
Operator Purchases
(€M)
Outlets 2016
Projected CAGR
2017-2020
Total 297 143 2,000 3.3%
Republic of Ireland 205 99 1,500 3.8%
Northern Ireland 92 44 500 2.5%

© 2016 Technomic Inc.
Business and Industry - Trends and Market Drivers in 2016
84
The following operational market drivers have been pivotal in terms of impact on the Business and
Industry sub-channel in 2016.
1. Storage and sourcing challenges continue to present issues for caterers carrying and preparing
fresh items.
2. The industry is seeing an increase in business. Dublin is quickly becoming a hub for new tech
startups as well as established companies, all with needs for innovative and fresh food
solutions for their canteens and corporate events.
3. The business and Industry sub-segment is heavily dominated by foodservice facilities
management (FSM). Majority of businesses rely on these catering companies to supply their
needs rather than operate their own services. There is also limited interest in third party brands
such Insomnia and Starbucks.
4. This segment is very competitive for contract food service, given the high saturation of FSM in
this space. Because of this, many caterers have lower margins to stay competitive.
5. Many FSMs in this segment struggle to retain staff and hire good staff, especially chefs. These
issues can stunt in-house abilities.

© 2016 Technomic Inc. 85
The following consumer market drivers have been pivotal in terms of impact on the Business and
Industry sub-channel in 2016.
1. Demand for better ingredients and higher quality food continues to encourage corporate
caterers to innovate. While sandwiches and salad bars have long been a standard offering in
corporate catering, consumers want spreads that include non-traditional items infused with
ethnic and seasonal flavors.
2. Caterers and businesses are collaborating more to offer unique meals for every event with
impressive customer service and presentation.
3. Meeting and conference business is doing very well with the continual increase in employment
and economic bounce back.
4. Participation from employees has remained consistent, however consumers are spending more
on average.
Business and Industry - Trends and Market Drivers in 2016
© 2016 Technomic Inc.
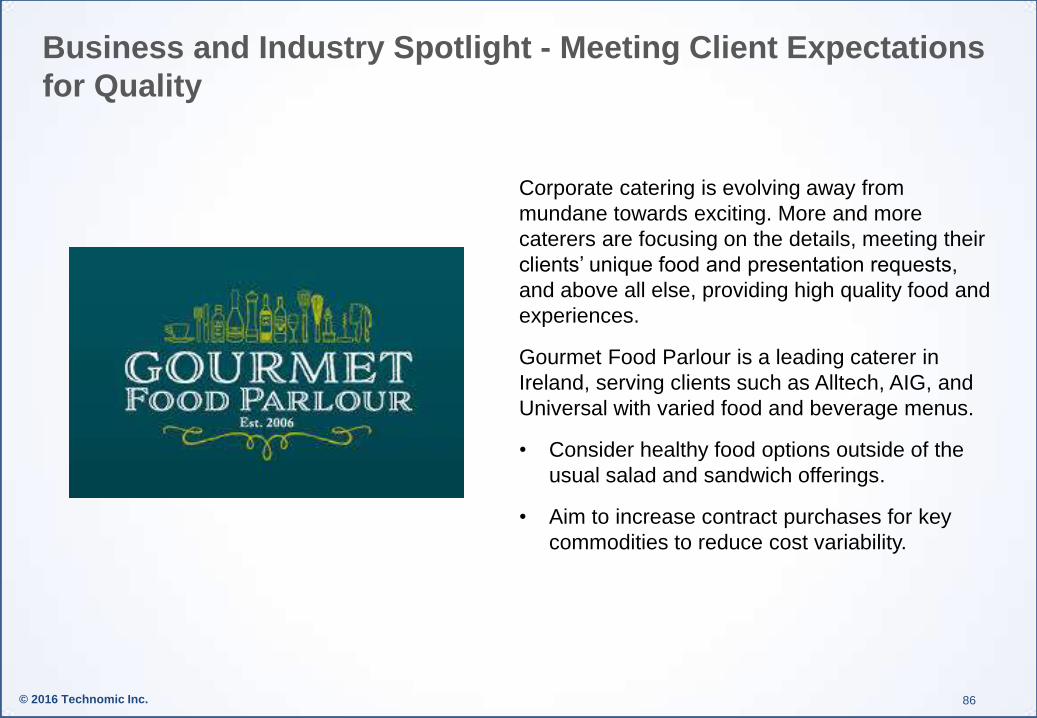
Business and Industry Spotlight - Meeting Client Expectations
for Quality
86
Corporate catering is evolving away from
mundane towards exciting. More and more
caterers are focusing on the details, meeting their
clients’ unique food and presentation requests,
and above all else, providing high quality food and
experiences.
Gourmet Food Parlour is a leading caterer in
Ireland, serving clients such as Alltech, AIG, and
Universal with varied food and beverage menus.
• Consider healthy food options outside of the
usual salad and sandwich offerings.
• Aim to increase contract purchases for key
commodities to reduce cost variability.

© 2016 Technomic Inc.
Business and Industry Spotlight - Role of Nutrition Growing
87
“We are dedicated to serving our customers’ needs, but we’ve had more influence now from dieticians compared to in the past.” - B&I Operator

© 2016 Technomic Inc.
Business and Industry Spotlight - Catering to More Localised
Needs
88
“We’re focused much more on adapting to the local market. This means that we serve more variety.” - B&I Operator

© 2016 Technomic Inc. 89

© 2016 Technomic Inc.
Healthcare
Trends and Market Drivers
● 1

© 2016 Technomic Inc.
Healthcare Hospitals are institutions that serve and feed patients undergoing some sort of medical care, their
guests, and the staff. This segment includes hospitals, rehab clinics, and retirement homes. It is
classified into private or public hospitals which, depending on the rating will offer different culinary
experiences ranging from a single set meal in their patient‘s room/ward, to a white table cloth
restaurant experience. Additionally, they offer customised menu alternatives for specific diets.
91
Euro growth forecast; excludes any change in currency valuation for NI
The total size for the Healthcare segment in IOI for 2016 is €232 million in terms of consumer
spending and €118 million for operator purchases (the value of distributors’ sales to operators).
• Consumer spending within ROI for the Healthcare segment is €139 million.
• In NI, the value of consumer spending is €93 million in value.
Health 2016
Consumer Spending
(€M)
Operator Purchases
(€M)
Outlets 2016
Projected CAGR
2017-2020
Total 232 118 1,140 2.5%
Republic of Ireland 139 71 655 2.7%
Northern Ireland 93 47 485 2.4%

© 2016 Technomic Inc. 92
The following operational market drivers have been pivotal in terms of impact on the Healthcare
sub-channel in 2016.
1. Patient food remains a concern for many patients and visitors. An ongoing nationwide study by
the Health Information and Quality Authority found that 86% of patients surveyed were happy
with the food served, but still wanted improvements.
2. One of the largest barriers to providing high-quality food is food costs. Working with suppliers to
offer the right variety of offerings at a viable cost is important. Many operators utilise buying
groups and have switched to private label offerings in order to save on costs and focus on
quality.
3. Another barrier is the frequency and number of meals that need to be made – often with
unique dietary restrictions – around the clock. Keeping food fresh, that it not overcooked (to
ensure nutrients and vitamins remain) is a concern increased by the financial burden it entails,
with staff and operational costs.
4. Many healthcare facilities have improved their ordering process and menus with health
information, detailed dish descriptions, and images to help patients choose what they want and
when they want.
5. Much of this segment is self-operated and generally, healthcare facilities struggle with retention
of staff and finding culinary talent.
Healthcare - Trend and Market Drivers in 2016
© 2016 Technomic Inc.
Healthcare - Trend and Market Drivers in 2016
The following consumer market drivers have been pivotal in terms of impact on the Healthcare
sub-channel in 2016.
1. Many visitors bring food into facilities while visiting, sometimes for the patients too. While
consumers are willing to pay for higher quality offerings when desired the most, a demand for
budget-friendly prices still exist.
2. Coffee and grab-and-go food items remain the focus at many facilities.
3. A lack of ethnic-focused meals, drinks, and snacks still remains in the majority of healthcare
facilities. Along with this, different cultures present different dietary restrictions.
4. Patients and non-patient customers continue to be concerned over the temperature of their
food and how fresh it is when served.
5. Visitors to healthcare facilities sometimes visit often or for long periods of time. Foodservice
and vending machines need to offer a variety of higher quality foods that serve multiple
dayparts and at different price points.
93

© 2016 Technomic Inc.
Healthcare Spotlight - Innovative Offerings Taking Center
Stage
94
“While some hospital foodservice operations are dealing with overcrowding issues, others are more innovative and are trying to bring in high street brands and expand what’s on offer for grab-and-go, coffee and other beverages.” - Healthcare Operator

© 2016 Technomic Inc.
Healthcare Spotlight - Seeking Outside Ideas/Concepts
95
“In healthcare, managing menu rotations is a challenge. We want to incorporate what’s trending. We’ve seen a lot more along the lines of pop-up shops in other operations and wonder if they would work in a hospital environment.” - Contract Management
Firm

© 2016 Technomic Inc.
Education
Trends and Market Drivers

© 2016 Technomic Inc.
Education
Primary schools, secondary schools and universities make up the three key operator segments.
They are in the business of providing food and beverage services to students in their place of
learning. Menus are generally offered in two main formats: fixed menus or cafeteria/self-service.
The channel covers state, religious and privately funded and owned institutions.
97
Euro growth forecast; excludes any change in currency valuation for NI
The total size for the Education segment in IOI for 2016 is €143 million in terms of consumer
spending and €62 million for operator purchases (the value of distributors’ sales to
operators).
• Consumer spending within ROI for the Education segment is €87 million.
• In NI, the value of consumer spending is €56 million in value.
Education 2016
Consumer Spending
(€M)
Operator Purchases
(€M)
Outlets 2016
Projected CAGR
2017-2020
Total 143 62 4,940 2.3%
Republic of Ireland 87 37 4,140 2.4%
Northern Ireland 56 25 800 2.3%
© 2016 Technomic Inc.
Education - Trend and Market Drivers in 2016
98
The following operational market drivers have been pivotal in terms of impact on the Education
sub-channel in 2016.
1. With the intense national focus on Ireland's obesity crisis, many universities and schools are
being pushed into doing more for the students they service. Operators are going beyond the
enforced health regulations and mandates, and setting personal health standards for their
facilities. Additionally, as part of the national obesity policy and action plan, schools continue to
get more involved in class, in the cafeteria, and with after school programmes to encourage
healthy eating practices in school and at home.
2. Dinner, lunch, and food-to-go offerings continue to improve with a focus on including as much
local and seasonal goods as possible. Budgetary constraints continue to be a major concern
among operators.
3. Competition off-campus is encouraging contract caterers to improve hiring, customer service,
ambiance, and overall experience of the facilities they manage.
4. QSR and coffee chains continue to gain contracts in colleges and university. While students are
generally brand loyal, we see larger catering companies partnering with smaller chains in favor
of their artisan or healthy food and drink offerings.
5. With students spending less time in bars and more time in the libraries, high-end coffee shops
and cafés remain a major focus for university catering partners.
© 2016 Technomic Inc. 99
The following consumer market drivers have been pivotal in terms of impact on the education sub-
channel in 2016.
1. Parents are not the only ones demanding healthy foods for their children anymore. Educational
programmes directed at students are coming to fruition with secondary school and college
students demanding higher quality, balanced meals and food-to-go offerings.
2. While employment numbers continue to rise in Ireland and more parents are able to give their
children lunch money, the vast majority of primary and secondary school children in Ireland still
bring food to school in lunchboxes, and some students in NI qualify and participate in the UK
catering system.
3. Lifestyle survey results report college students are taking their studies more seriously than past
generations, and consequently they are drinking less alcohol and eating healthier, to further
ensure their focus on the things that are important to them.
4. Consumer preference for health ‘halo’ food and drink offerings, as well as an interest in trying
new ethnic foods continues. This trend is especially strong with Mmillennials who want to try the
latest products.
5. Consumers in this segment, along with their Guardians, expect any and all allergies and food-
preferences to be catered to.
Education - Trend and Market Drivers in 2016

© 2016 Technomic Inc.
Education Spotlight - College Catering Utilising Resources
for On-Campus Farming
100
With competition coming from all angles, college
foodservice management firms need to innovate. Part of
that innovation can include working with clients to take
advantage of resources already available to them.
Kylemore Services Group (KSG) recently partnered with
University College Cork for a farm to fork initiative. KSG
helped UCC utilise its extra land to build a farm and grow
fresh produce to be used in the college’s canteen.
Reportedly, 300kg of fresh produce is taken every week
from the farm to be used at the university.
For the Education channel, this translates into:
• Offering additional services to students to remain a
relevant resource for health and nutrition.
• Considering self-sustainable practices such as
farming and gardening on campus.
• Working with local suppliers to use local, fresh,
seasonal products as much as financially possible.
© 2016 Technomic Inc.
Education Spotlight - Leveraging Innovative Brands to
Keep Students on Campus
101
“The goal is to keep them on campus. We’re doing this by focusing on keeping concepts fresh, including chains like Freshii and Chopped.” - College/University
Operator

© 2016 Technomic Inc.
Other Institutional
Trends and Market Drivers

© 2016 Technomic Inc.
Other Institutional
This channel includes Government organisations and in particular prisons and armed forces
(military messes, in-field canteens and soup kitchens). Both prisons and the armed forces have
large manpower at their disposal and view catering as an efficient use of it.
103
Euro growth forecast; excludes any change in currency valuation for NI
The total size for the Other Institutional segment in IOI for 2016 is €39 million in terms of
consumer spending and €20 million for operator purchases (the value of distributors’
sales to operators).
• Consumer spending within ROI for the Other Institutional segment is €30 million.
• In NI, the value of consumer spending is €9 million in value.
Other Institutional 2016
Consumer Spending
(€M)
Operator Purchases
(€M)
Outlets 2016
Projected CAGR
2017-2020
Total 39 20 200 3.0%
Republic of Ireland 30 15 125 3.2%
Northern Ireland 9 5 75 2.9%

© 2016 Technomic Inc.
Other Institutional - Trend and Market Drivers in 2016
104
The following operational market drivers have been pivotal in terms of impact on the Government
sub-channel in 2016.
1. Menus have been recently updated by the Prison Service to provide variety and nutrition.
2. These changes maintain the budget laid out in these facilities where all food costs are covered
by subsidy. According to numbers released under the Freedom of Information Act, the food
spend has fallen from €8.7 million in 2014 to €7.6 million in 2015.
3. Procurement and menu options are limited, however creativity and innovation are welcome in
this channel from nutrition and diet consultants.
The following consumer market drivers have been pivotal in terms of impact on the Government
sub-channel in 2016.
1. To meet institutional consumer demands and needs, vegetarian, halal, and diabetic-friendly
meals are now being offered.

© 2016 Technomic Inc. 105

© 2016 Technomic Inc.
Section 3:
PRODUCT INSIGHTS

© 2016 Technomic Inc.
Overarching Foodservice Product Trends
107
Overarching foodservice product trends identified in the research include:
• Operators are more highly focused on product quality compared to the past and many
indicate that they are willing to pay more to achieve a positive quality differential.
• There is a movement towards “selectively sourcing” local Irish products. In terms of
managing costs, operators are more focused on identifying which products are most
important to source from Ireland (with respect to their consumers).
• Growth of food-to-go items continues to outpace growth of other foodservice products,
driven by broadening availability and increased consumer demand.
• Greater emphasis is being placed on expanding the range of “authentic ethnic”
foodservice products and ingredients. This is a result, in part, of higher degrees of
consumer awareness about more food types.
• Non-commercial purchasing of foodservice products is becoming more complex as
many non-commercial operators work to compete against commercial operators.
• BREXIT could negatively impact sourcing of select products from ROI/UK given the
current currency swings.
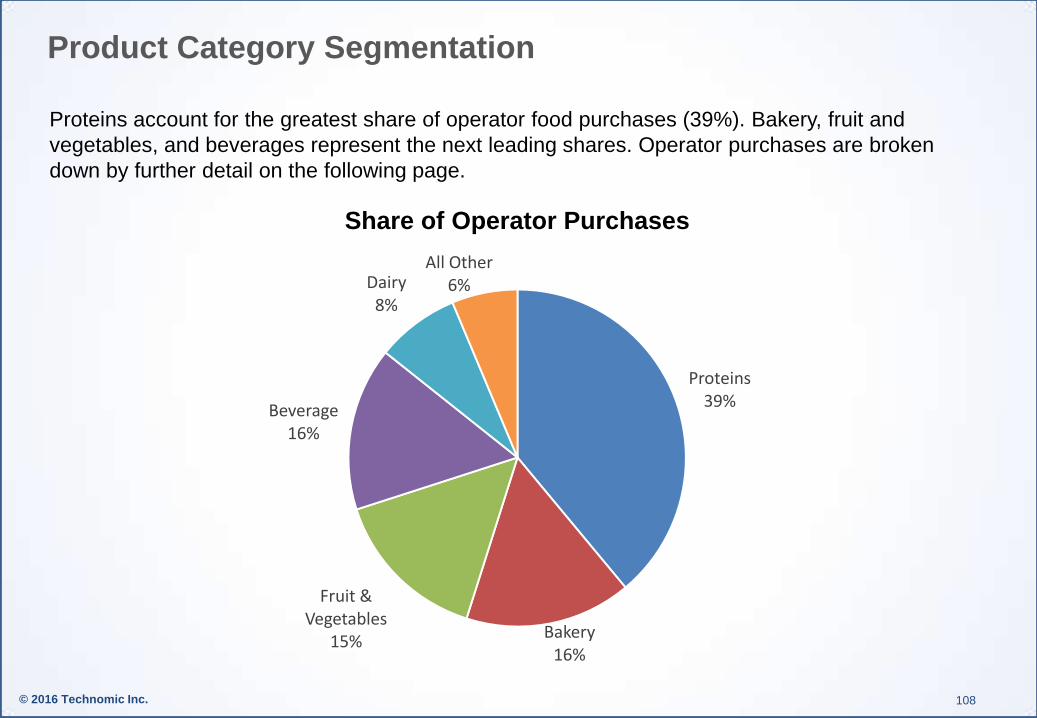
© 2016 Technomic Inc.
Product Category Segmentation
108
Proteins account for the greatest share of operator food purchases (39%). Bakery, fruit and
vegetables, and beverages represent the next leading shares. Operator purchases are broken
down by further detail on the following page.
Share of Operator Purchases
Proteins 39%
Bakery 16%
Fruit & Vegetables
15%
Beverage 16%
Dairy 8%
All Other 6%

© 2016 Technomic Inc.
Foodservice Product by Value
109
Source: Trade Interviews/Central Statistics Office
Product Category 2016 Operator
Purchases (€ millions) Share of total (%)
Fruit & Vegetables € 387 15% Poultry 298 12% Beef 279 11% Bread/Bakery Savoury 269 11% Bacon 209 8% Dairy 202 8% Sweet Bakery 140 5% Pork 102 4% Seafood 82 3% Grocery 42 2% Confectionery 30 1% Desserts 31 1% Lamb 21 1% Beverage 400 16% All Other 58 2%
TOTAL € 2,551 100%
Fruit, vegetables, poultry, beef and bread/bakery (non-sweet) account for nearly half of operator
purchases.

© 2016 Technomic Inc.
Product Growth Dynamics
110
Poultry continues to outpace the growth of other proteins by a significant margin, due to increased
menuing by operators and growing demand among consumers.
Overall, the majority of product categories are growing at a rate faster than 5%.
8.4%
6.2% 6.0% 5.6% 5.6% 5.5% 5.4% 5.3%
4.9%
4.1% 4.0% 3.8% 3.6%
2.7% 2.0%
Annual Growth in Purchases
2014-16
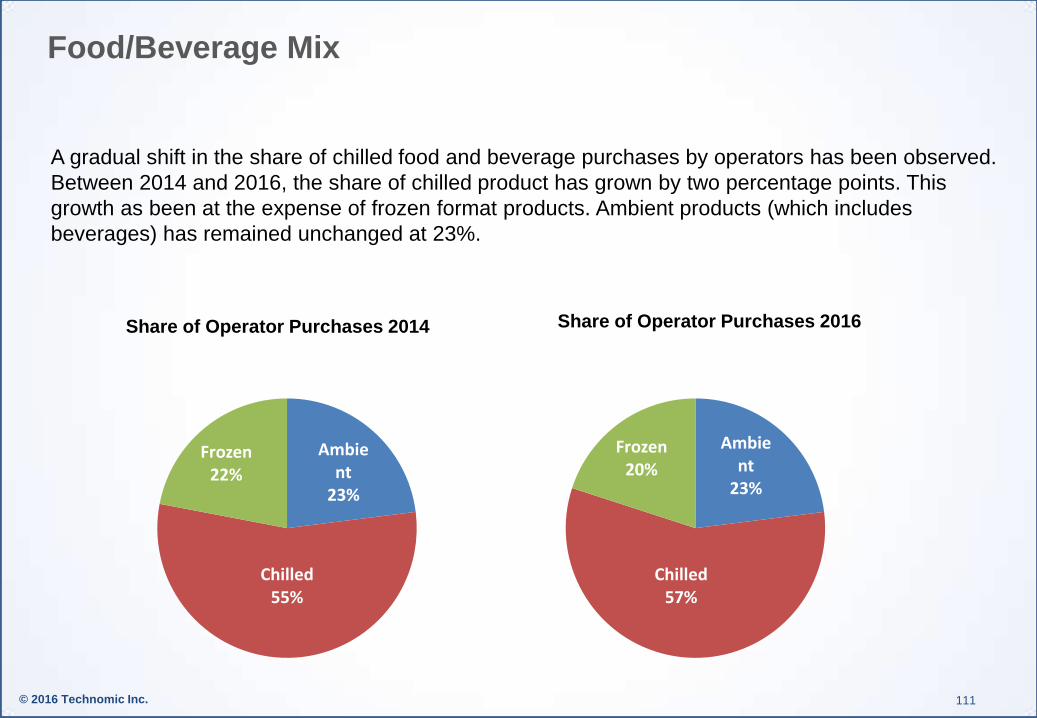
© 2016 Technomic Inc.
Food/Beverage Mix
111
Ambient
23%
Chilled 57%
Frozen 20%
Share of Operator Purchases 2016
A gradual shift in the share of chilled food and beverage purchases by operators has been observed.
Between 2014 and 2016, the share of chilled product has grown by two percentage points. This
growth as been at the expense of frozen format products. Ambient products (which includes
beverages) has remained unchanged at 23%.
Ambient
23%
Chilled 55%
Frozen 22%
Share of Operator Purchases 2014

© 2016 Technomic Inc.
Section 4:
GLOBAL INSIGHTS

© 2016 Technomic Inc.
Global Foodservice Industry
113
In 2015, the global foodservice industry was valued at USD $2.9 trillion (€2.64 trillion) in consumer
spending. Europe represents approximately one quarter of total spending, with Asia accounting for
one-third and North America accounting for just under 30%.
Much of the future growth in the global industry will come from areas that are currently
underpenetrated: Africa/Middle East and Latin America. Much of the foodservice in North America
and Europe is fairly mature and is unlikely to grow at levels outpacing GDP growth.
United States & Canada
29%
Latin America
10%
Europe
24%
Africa & Middle East
2%
Asia — Pacific
33%
Oceania
2%
Global commercial
foodservice value
$2.9T

© 2016 Technomic Inc.
Away-From-Home Occasions
114
Based on Technomic’s global consumer research, the Middle East has the largest incidence of high
frequency dining away from home—this is due in part to the high degree of economic development
in the region, as well as availability of fresh prepared meals and meal components from
marketplace vendors. Similar dynamics are evident in the Asian and South American markets.
EUROPE
48%
NORTH AMERICA
70%
SOUTH AMERICA
72%
ASIA
74%
AUSTRALIA
62%
MIDDLE EAST 90%
Share Dining Out Once a
Week or More Often
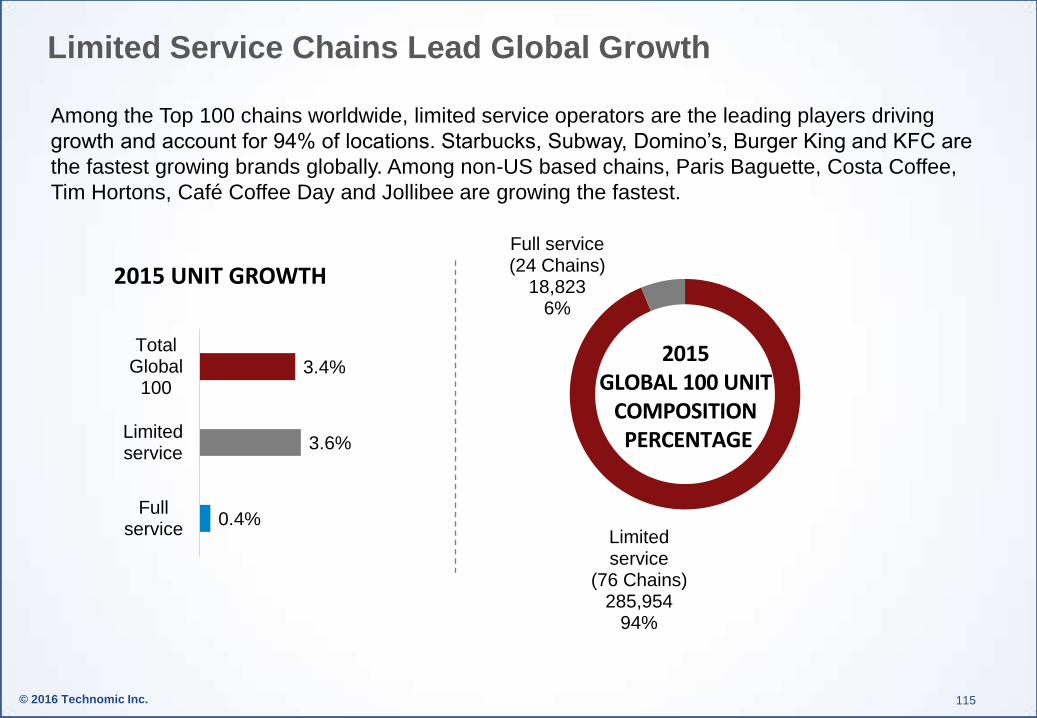
© 2016 Technomic Inc.
Limited Service Chains Lead Global Growth
115
Among the Top 100 chains worldwide, limited service operators are the leading players driving
growth and account for 94% of locations. Starbucks, Subway, Domino’s, Burger King and KFC are
the fastest growing brands globally. Among non-US based chains, Paris Baguette, Costa Coffee,
Tim Hortons, Café Coffee Day and Jollibee are growing the fastest.
3.4%
3.6%
0.4%
TotalGlobal
100
Limitedservice
Fullservice
2015 UNIT GROWTH
Limited service
(76 Chains) 285,954
94%
Full service (24 Chains)
18,823 6%
2015 GLOBAL 100 UNIT
COMPOSITION PERCENTAGE

© 2016 Technomic Inc.
Global Megatrend #1 - Eye on Ingredients
116
Authentic, locally sourced and organic items are positioned as premium ingredients worldwide.
However, the degree to which global foodservice consumers are willing to pay more for these
premium items varies by global region, as indicated below. Consumers are increasingly concerned
about transparency as it relates to ingredients, with growing interest around the inclusion of artificial
additives and ingredient origin.
Q: How do the following attributes included in menu descriptions affect your food and beverage purchases at restaurants or other foodservice locations?
26% 23% 24%
33% 29%
22% 27%
61%
18% 26%
21%
34%
18% 24%
16%
28%
43%
21%
49% 48%
34%
23%
40%
30%
Authentic Locally Sourced Organic Premium
North America South America Europe Australia Asia Middle East

© 2016 Technomic Inc.
Global Megatrend #2 - Value Beyond Price
117
Consumers view customisation as means for adding value beyond price within restaurant
operations. Overall, 62% of global foodservice customers expect restaurants to accommodate
requests for customisation. However, the share of meals that are actually customised is lower and
varies by global region .
Australia 23% Europe 26%
North America 33% Asia 33%
Middle East 37%
32% of meals are customized

© 2016 Technomic Inc.
Global Megatrend #2 - Value Beyond Price
118
What consumers value most in each market is not universal, as shown in the table below. The tick
marks indicate that the attribute is of leading importance (relative to other factors) to consumers
within each market.
North America
South America
Europe Australia Asia Middle East
Quality √ √
Health √ √
Variety √ √ √ √
Quiet & relaxing √ √ √
Family friendly √ √
Variety of seats √
Unit design √ √
Freshness √ √ √ √ √ √

© 2016 Technomic Inc.
Global Megatrend #3 - Healthy Evolution
119
Across all global regions, consumers indicate that they use several strategies to accomplish
healthy eating objectives.
• 46% order an item described as healthy
• 44% consider an item’s nutritional content
• Roughly two-fifth cut back on desserts (41%), drinks (41%) or apps (39%)
• 36% substitute a healthier side
• Three-tenths eat less by splitting meals (31%)
The overall incidence of ordering “healthy” meals from restaurants is lowest in North America and
highest in Asian countries. The chart below details the average number of meals of the last 10
purchased by consumers that they consider to be healthy.
6.3 5.5 5.3 5.3
4.8 4.7
Asia Middle East Australia Europe South America North America

© 2016 Technomic Inc.
Global Megatrend #4 - Tech-Enabled Experiences
120
Asia is the leading market in terms of demand for tech-integrated ordering. This region tends to be
the earliest adopters of new mobile technologies—which are increasingly a part of the consumers’
ordering process.
EUROPE
41%
AUSTRALIA
43%
NORTH AMERICA
45%
MIDDLE EAST 64%
ASIA
68%
SOUTH AMERICA
60%
“I would like more restaurants to integrate tech into the ordering process”

© 2016 Technomic Inc.
Overarching Global Takeaways
121
1. The “west” stresses menu and dining variety, while the “east” places importance on health and
natural ingredients.
2. Restaurants should be more transparent about the types of ingredients they use and where
those ingredients come from.
3. Organic ingredients are expected to grow in terms of their presence in foodservice, although at
different levels across global markets.
4. South American and Asian consumers are most likely to pay more for premium offerings.
5. The Middle East and Asia consider technology to be of the utmost importance, but is growing
emphasis globally.
6. Strong opportunity exists for global chain growth in less mature markets.
7. Freshness resonates across global markets.

© 2016 Technomic Inc.
Section 5:
CONCLUSIONS AND
RECOMMENDATIONS

© 2016 Technomic Inc.
Overarching Conclusions
123
The following conclusions draw from the entirety of the research programme:
• Economic recovery has opened up new opportunities for innovation within the foodservice
sector.
• Commercial and non-commercial operators are making investments in both back-of-house and
front-of-house, leading to an upgrading effect across the industry.
• Fast casual is emerging and is impacting consumer expectations and, as a result, demand.
• Technology continues to be a driver within the sector.
• Quality remains at the forefront and is seeing enhancements across all areas of the trade.
• With much anticipation still looming around the impact of BREXIT, foodservice channel
representatives (both in ROI and NI) are still waiting to more clearly understand how the
change will impact their business and profitability overall.

© 2016 Technomic Inc.
Industry Specific Conclusions
124
The following conclusions apply to manufacturers & suppliers active in the Irish foodservice market.
1. While the market is accelerating, the Irish foodservice market is also maturing
Foodservice remains a strong growth industry, but there are concerns that many parts of the
business are saturating. Growth pockets do remain in a number of segments. It will be increasingly
important that suppliers understand drivers for growth and where the trends are moving the
marketplace, as it is likely that there will be uneven growth as the market continues to mature.
2. Consolidation remains a concern
The industry is rapidly consolidating leading to fears that the market will be controlled by a small
number of large operator groups and serviced by a smaller group of distributors and suppliers. This
may in turn lead to less competition and higher prices.
3. Global trends reaching Ireland
While Irish produced food and beverages remain popular, there are increasing signs that Ireland is
responding to global trends. New ethnic food trends and global brands are increasingly found in
Ireland, and consumers (particularly in major urban areas) are much more globally cosmopolitan
that they were 5-10 years ago. Manufacturers can develop closer ties with operators by working
closely to understand and respond to these emerging needs.
4. Provenance remains a key driver within IOI foodservice market.
While global trends are being seen more frequently, it’s still true that many decision makers in IOI
seek opportunities to source domestically – though profitability is often the ultimate driver in the long
run. Where possible, manufacturers can seek to strengthen the bond that operators have with
domestically sourced foodservice products.
© 2016 Technomic Inc.
Conclusions (continued)
125
5. Understanding BREXIT impact.
Throughout IOI and in Dublin and other metro areas, the impact of tourism continues to drive much
of the growth. There is some concern that tourism could be negatively impacted by BREXIT given
the large share of tourism that comes from the UK. BREXIT could also have an impact on sourcing
and purchasing practices. Manufacturers must monitor this situation and work with customers to
develop cost effective, on-trend items that will provide operators with differentiation in an
increasingly global marketplace.
6. Responding to new product opportunities.
As indicated in the Product Insights section of this report, several product opportunities exist for
manufacturers in IOI. Some examples include:
Renewed emphasis on quality, with natural ingredients and clean labels.
“Selective sourcing” of local Irish products.
Growth of food-to-go items, including sandwiches and other handheld items.
“Authentic ethnic” foodservice products and ingredients.
Specialty coffee beverages and filter coffee (as well as Impulse items to accompany order).
Chicken and pork, especially in a refrigerated/non-frozen format.

© 2016 Technomic Inc.
Recommendation #1 - Invest in Growth Areas
126
The Irish foodservice industry is healthy, and growth is expected to remain fairly robust. However,
there are certain areas that are expected to outperform the market, and these numerous growth
areas can be found in both commercial and non-commercial operations.
1. Emerging fast casual chains.
2. Concepts that emphasise fresh ingredients.
3. Culinary-driven institutional facilities, particularly in Education and B&I.
4. More nutritious options for employee feeding.
5. New platforms in food-to-go/grab-n-go foodservice operations.

© 2016 Technomic Inc.
Recommendation #2 - Manage Innovation with the End User in
Mind
127
Examples of innovation are evident across all channels in the Ireland foodservice market. Those
with the greatest efficiency appear to be innovations that exhibit:
• A clear understanding of the customer;
• Specific objectives for growth;
• Clarity on what positioning is most important to the customer;
• Long-term vision about future product line/item extensions and variations.
Increasingly, there are fewer “one size fits all” solutions and the importance of maintaining a
competitive edge is on the rise. Operators require menu items and ideas that fit with their specific
concepts. Thus, it is important to be proactive and work directly with operator customers on new
ideas and to understand the operator’s positon and operational needs.

© 2016 Technomic Inc.
Recommendation #3 - Exercise Prudence in Expansion
128
During times of accelerated growth, it is common to see overbuilding within chains and across
commercial sub-segments. However, many interviewed for this programme are also concerned that
the economy may not sustain its strength, particularly in light of BREXIT and some of the broader
global challenges that remain. As a result, growth plans should be tempered with the reality of a
possible slowdown.
Some important considerations include the following:
• Monitoring the expansion plans of competitors is essential to avoid direct duplication within
markets.
• Understanding “post-honeymoon” phase demand is critical to gauging long-term demand.
• Establishing checks and ongoing review are key steps to ensure that expansion plans are
executed optimally in light of ongoing changes.
• Target specific opportunities (versus more generalised opportunities) in strategic planning and
account for subtle differences between markets.

© 2016 Technomic Inc. 129
© 2016 Technomic Inc.
Section 6:
MACRO ECONOMIC
INDICATORS

© 2016 Technomic Inc.
Macroeconomic Factors
131
The following macroeconomic factors are important indicators for foodservice market performance
and are discussed in this section.
• Gross Domestic Product (GDP). The monetary value of all the finished goods and services produced within
a country's borders in a specific time period, though GDP is usually calculated on an annual basis. It includes
all of private and public consumption, government outlays, investments and exports less imports that occur
within a defined territory. GDP is commonly used as an indicator of the economic health of a country, as well
as to gauge a country's standard of living.
• Employment – All Industries. Represents the share of the labour force that is employed. The employment
rate is one of the economic indicators that economists examine to help understand the state of the economy.
• Employment – Accommodation and Foodservice. Represents the share of the labour force that is
employed within the accommodation and foodservice channels.
• Consumer Price Index (CPI) – All Items. An index of the variation in prices paid by typical consumers for
retail goods and other items.
• Consumer Price Index (CPI) – Food and Non-alcoholic Beverages. An index of the variation in prices paid
by typical consumers for food and non-alcoholic beverages.
• Consumer Price Index (CPI) – Restaurants and Hotels. An index of the variation in prices paid by typical
consumers for foodservice items purchased at restaurants and hotels. .
• Industrial Price Index – Food. An indicator that measures the variation in prices paid by food manufacturers
for inputs and resources.

© 2016 Technomic Inc.
GDP
132
Source: Central Statistics Office
GDP at Constant Factor Costs (Chain linked annually ref to 2013)
Euro (€MM)
Q2'16 € 62,304
€25,000
€30,000
€35,000
€40,000
€45,000
€50,000
€55,000
€60,000
€65,000
€70,000

© 2016 Technomic Inc.
Employment – All Industries
133
Source: Central Statistics Office
Percent Change v Prior Year
Q2'16 2.9%
-10%
-8%
-6%
-4%
-2%
0%
2%
4%
6%

© 2016 Technomic Inc.
Employment – Accommodation & Foodservices
134
Source: Central Statistics Office
Percent Change v Prior Year
Q2'16 6.7%
-20%
-15%
-10%
-5%
0%
5%
10%
15%
20%
Q1
'03
Q3
'03
Q1
'04
Q3
'04
Q1
'05
Q3
'05
Q1
'06
Q3
'06
Q1
'07
Q3
'07
Q1
'08
Q3
'08
Q1
'09
Q3
'09
Q1
'10
Q3
'10
Q1
'11
Q3
'11
Q1
'12
Q3
'12
Q1
'13
Q3
'13
Q1
'14
Q3
'14
Q1
'15
Q3
'15
Q1
'16

© 2016 Technomic Inc.
CPI – All Items
135
Base: 100 = 1996 Source: Central Statistics Office
Percent Change v Prior Year
Aug '16 -0.1%
-8%
-6%
-4%
-2%
0%
2%
4%
6%Ja
n '0
3
Sep
'03
May
'04
Jan
'05
Sep
'05
May
'06
Jan
'07
Sep
'07
May
'08
Jan
'09
Sep
'09
May
'10
Jan
'11
Sep
'11
May
'12
Jan
'13
Sep
'13
May
'14
Jan
'15
Sep
'15
May
'16

© 2016 Technomic Inc.
CPI – Food and non-alcoholic beverages
136
Base: 100 = 1996 Source: Central Statistics Office
Percent Change v Prior Year
Aug '16 -0.9%
-10%
-8%
-6%
-4%
-2%
0%
2%
4%
6%
8%
10%
12%
Jan
'03
Sep
'03
May
'04
Jan
'05
Sep
'05
May
'06
Jan
'07
Sep
'07
May
'08
Jan
'09
Sep
'09
May
'10
Jan
'11
Sep
'11
May
'12
Jan
'13
Sep
'13
May
'14
Jan
'15
Sep
'15
May
'16
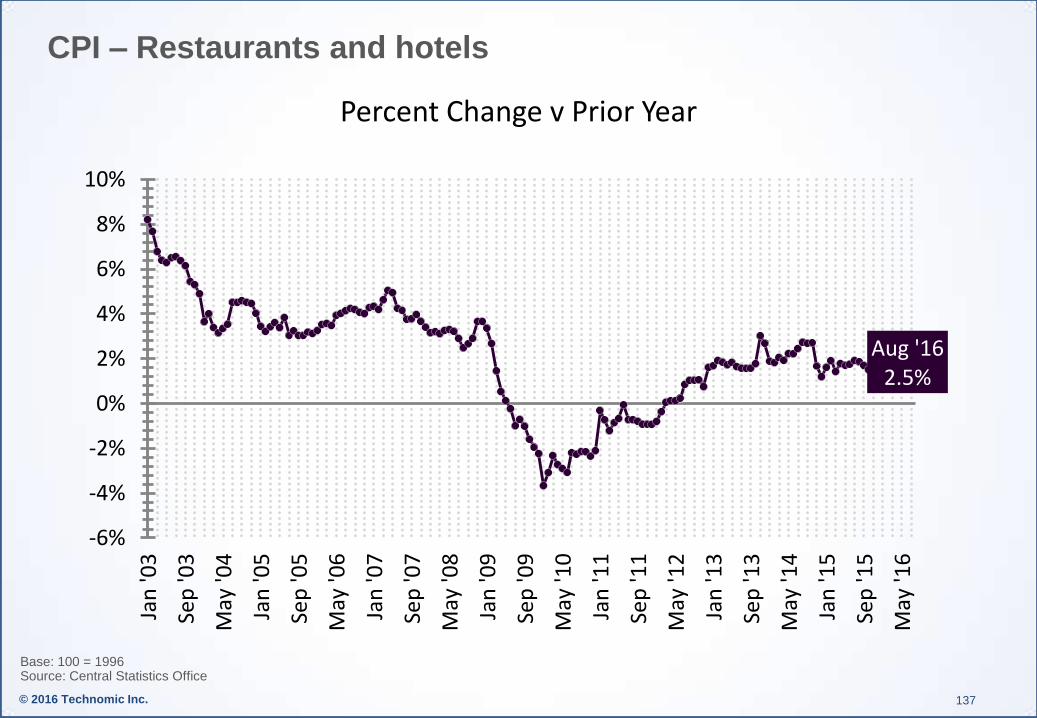
© 2016 Technomic Inc.
CPI – Restaurants and hotels
137
Base: 100 = 1996 Source: Central Statistics Office
Percent Change v Prior Year
Aug '16 2.5%
-6%
-4%
-2%
0%
2%
4%
6%
8%
10%
Jan
'03
Sep
'03
May
'04
Jan
'05
Sep
'05
May
'06
Jan
'07
Sep
'07
May
'08
Jan
'09
Sep
'09
May
'10
Jan
'11
Sep
'11
May
'12
Jan
'13
Sep
'13
May
'14
Jan
'15
Sep
'15
May
'16

© 2016 Technomic Inc.
Industrial Price Index – Food
138
Base: 100 = 2010 Source: Central Statistics Office
Percent Change v Prior Year
Aug '16 -1.4%
-4%
-2%
0%
2%
4%
6%
8%
Jan
'11
May
'11
Sep
'11
Jan
'12
May
'12
Sep
'12
Jan
'13
May
'13
Sep
'13
Jan
'14
May
'14
Sep
'14
Jan
'15
May
'15
Sep
'15
Jan
'16
May
'16

© 2016 Technomic Inc. 139

© 2016 Technomic Inc.
CONTACT INFORMATION FOR
TECHNOMIC
David Henkes Senior Principal
Erik Thoresen Principal