2016-2017 transmission planning process unified planning ... · pdf file2016-2017 transmission...
TRANSCRIPT
ISO Market and Infrastructure Development Division March 31, 2016
2016-2017 Transmission Planning Process Unified Planning Assumptions
and Study Plan
March 31, 2016
Final

Intentionally left blank
Study Plan 2016-2017 Transmission Planning Process
California ISO/MID i March 31, 2016
Table of Contents 1. Introduction ............................................................................................................ 1
2. Overview of 2016-2017 Stakeholder Process Activities and Communications ....... 2
2.1 Stakeholder Meetings and Market Notices ............................................................. 2
2.2 Interregional Coordination ...................................................................................... 5
2.3 Stakeholder Comments ......................................................................................... 5
2.4 Availability of Information ....................................................................................... 5
3. Conceptual Statewide Transmission Plan .............................................................. 6
4. Reliability Assessments ......................................................................................... 7
4.1 Reliability Standards and Criteria ........................................................................... 7
4.1.1 NERC Reliability Standards ................................................................................... 7
4.1.2 WECC Regional Business Practice ........................................................................ 7
4.1.3 California ISO Planning Standards ......................................................................... 7
4.2 Frequency of the study .......................................................................................... 8
4.3 Study Horizon and Years ....................................................................................... 8
4.4 Study Areas ........................................................................................................... 8
4.5 Transmission Assumptions ...................................................................................10
4.5.1 Transmission Projects ...........................................................................................10
4.5.2 Reactive Resources ..............................................................................................10
4.5.3 Protection System .................................................................................................10
4.5.4 Control Devices ....................................................................................................10
4.6 Load Forecast Assumptions ..................................................................................10
4.6.1 Energy and Demand Forecast ..............................................................................10
4.6.2 Methodologies to Derive Bus Level Forecast ........................................................11
4.6.2.1 Pacific Gas and Electric Service Area ............................................................ 11
4.6.2.2 Southern California Edison Service Area ....................................................... 12
4.6.2.3 San Diego Gas and Electric Service Area ...................................................... 13
4.6.2.4 Valley Electric Association Service Area ........................................................ 14
4.6.3 Power Factor Assumptions ...................................................................................14
4.6.4 Self-Generation .....................................................................................................15
4.7 Generation Assumptions .......................................................................................17
4.7.1 Generation Projects ..............................................................................................17
4.7.2 Renewable Generation .........................................................................................17
4.7.2.1 Renewable generation dispatch ..................................................................... 18
4.7.3 Thermal generation ...............................................................................................19
4.7.4 Hydroelectric Generation ......................................................................................19
Study Plan 2016-2017 Transmission Planning Process
California ISO/MID ii March 31, 2016
4.7.5 Generation Retirements ........................................................................................19
4.7.6 OTC Generation ...................................................................................................20
4.7.7 LTPP Authorization Procurement ..........................................................................24
4.8 Preferred Resources .............................................................................................26
4.8.1 Methodology .........................................................................................................26
4.8.2 Demand Response ...............................................................................................27
4.8.3 Energy Storage .....................................................................................................28
4.9 Major Path Flows and Interchange ........................................................................32
4.10 Operating Procedures ...........................................................................................33
4.11 Study Scenarios ....................................................................................................34
4.11.1 Base Scenarios .....................................................................................................34
4.11.2 Sensitivity Studies .................................................................................................36
4.12 Study Base Cases ................................................................................................38
4.13 Contingencies: ......................................................................................................39
4.14 Study Tools ...........................................................................................................41
4.15 Technical Studies .................................................................................................41
4.15.1 Power Flow Contingency Analysis ........................................................................41
4.15.2 Post Transient Analyses .......................................................................................41
4.15.3 Post Transient Voltage Stability Analyses .............................................................42
4.15.4 Post Transient Voltage Deviation Analyses ...........................................................42
4.15.5 Voltage Stability and Reactive Power Margin Analyses ........................................42
4.15.6 Transient Stability Analyses ..................................................................................42
4.16 Corrective Action Plans .........................................................................................42
5. Local Capacity Requirement Assessment .............................................................43
5.1 Near-Term Local Capacity Requirement (LCR).....................................................43
5.2 Long-Term Local Capacity Requirement Assessment ...........................................44
6. Policy Driven 33% RPS Transmission Plan Analysis ............................................45
6.1 Public Policy Objectives ........................................................................................45
6.1.1 Achieving 33% renewable energy on an annual basis ..........................................46
6.1.2 Supporting RA deliverability status for needed renewable resources outside the ISO balancing authority area ...........................................................................46
6.2 Study methodology ...............................................................................................47
6.3 Study scope ..........................................................................................................48
6.4 Coordination with Phase II of GIP .........................................................................48
7. Special Studies .....................................................................................................50
7.1 50% Renewable Energy Goal for 2030 .................................................................50
7.2 Frequency Response Assessment ........................................................................50
Study Plan 2016-2017 Transmission Planning Process
California ISO/MID iii March 31, 2016
7.3 Gas-Electric Reliability ..........................................................................................51
7.4 Economic Early Retirement of Gas Generation Assessment .................................51
7.5 Characteristics of Slow Response Local Capacity Resources ...............................51
8. Economic Planning Study .....................................................................................52
9. Long-Term Congestion Revenue Rights (LT CRR) ...............................................53
10. Interregional Transmission Projects ......................................................................54
11. Contact Information ..............................................................................................55
12. Stakeholder Comments and ISO Responses ........................................................56
APPENDIX A: System Data ............................................................................................... A-1
A1 Existing Generation ............................................................................................ A-2
A2 Planned Generation .......................................................................................... A-27
A3 Retired Generation ........................................................................................... A-28
A4 Reactive Resources .......................................................................................... A-30
A5 Special Protection Schemes ............................................................................. A-31
Study Plan 2016-2017 Transmission Planning Process
California ISO/MID 1 March 31, 2016
1. Introduction
As set forth in Section 24 of the California ISO tariff on the Transmission Planning Process and in the Transmission Planning Process (TPP) Business Practice Manual (BPM), the TPP is conducted in three phases. This document is being developed as part of the first phase of the TPP, which entails the development of the unified planning assumptions and the technical studies to be conducted as part of the current planning cycle. In accordance with revisions to the TPP that were approved by FERC in December 2010, this first phase also includes specification of the public policy objectives the ISO will adopt as the basis for identifying policy-driven transmission elements in Phase 2 of the TPP, as well as initiation of the development of a conceptual statewide transmission plan that will be an input to the comprehensive planning studies and transmission plan developed during Phase 2. Phase 3 will take place after the approval of the plan by the ISO Board if projects eligible for competitive solicitation were approved by the Board at the end of Phase 2. If you would like to learn more about the ISO’s TPP, please go to:
Section 24 of the California ISO tariff located at: http://www.caiso.com/rules/Pages/Regulatory/Default.aspx
Transmission Planning Process BPM at: http://www.caiso.com/rules/Pages/BusinessPracticeManuals/Default.aspx .
The objectives of the unified planning assumptions and study plan are to clearly articulate the goals and assumptions for the various public policy and technical studies to be performed as part of Phase 2 of the TPP cycle. These goals and assumptions will in turn form the basis for ISO approval of specific transmission elements and projects identified in the 2016-2017 comprehensive transmission plan at the end of Phase 2. ISO intends to continue updating the High Voltage TAC model for inclusion in the final draft transmission plan, as it has in the past. An opportunity to review the previous year’s model for comments will provided during the year, and has not been scheduled at this time.
The ISO has collaboratively worked with the California Public Utilities Commission (CPUC) and the California Energy Commission (CEC) to align the planning assumptions between the ISO’s TPP and the CPUC’s Long-term Procurement Process (LTPP), as well as the demand forecast assumptions embodied in the 2015 IEPR (approved in January 2016). With this draft study plan, the base planning assumptions for the 2016-2017 TPP are effectively aligned for the 2017-2026 planning horizon with those of the LTPP proposed to be used transmission and procurement requirements.
Study Plan 2016-2017 Transmission Planning Process
California ISO/MID 2 March 31, 2016
2. Overview of 2016-2017 Stakeholder Process Activities and Communications
Section 2 of this document presents general information regarding stakeholder activities and communications that will occur during this planning cycle.
2.1 Stakeholder Meetings and Market Notices During each planning cycle, the ISO will conduct at least four stakeholder meetings to present and acquire stakeholder input on the current planning effort. These stakeholder meetings are scheduled and designed around major activities in Phase 1 and Phase 2 of the TPP. Additional meetings for each stage may be scheduled as needed. These meetings provide an opportunity for the ISO to have a dialogue with the stakeholders regarding planning activities and to establish the foundation upon which stakeholders may comment and provide other necessary input at each stage of the TPP.
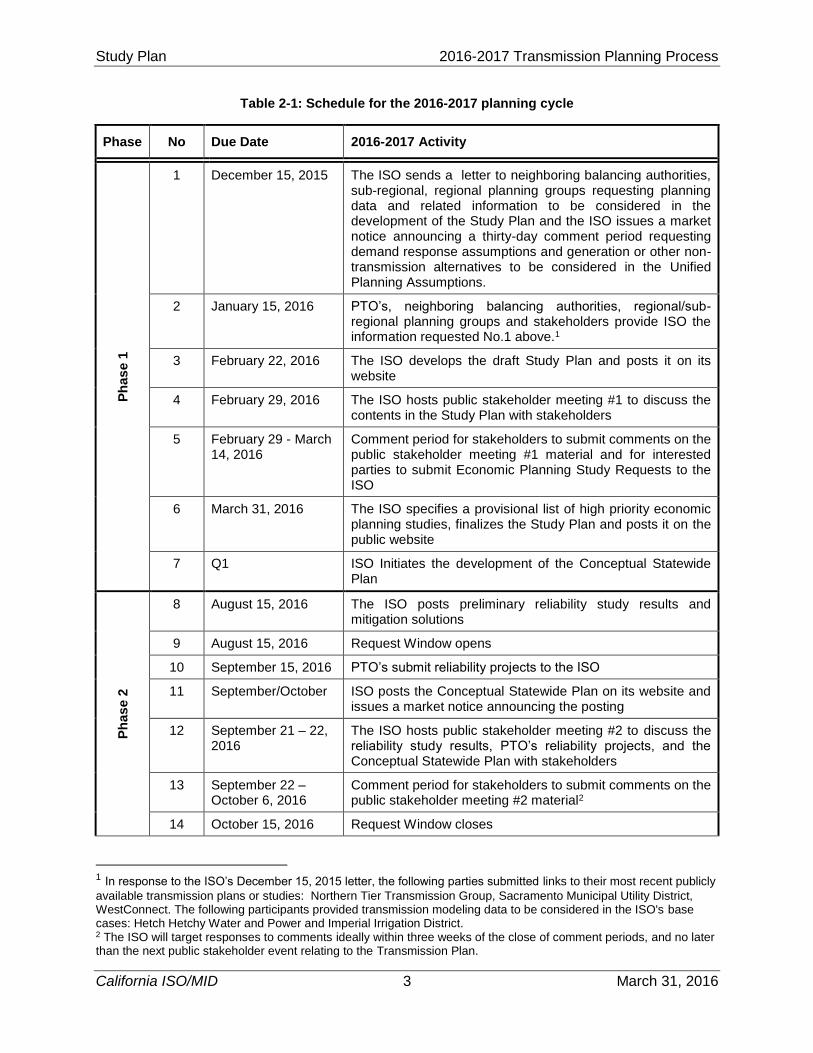
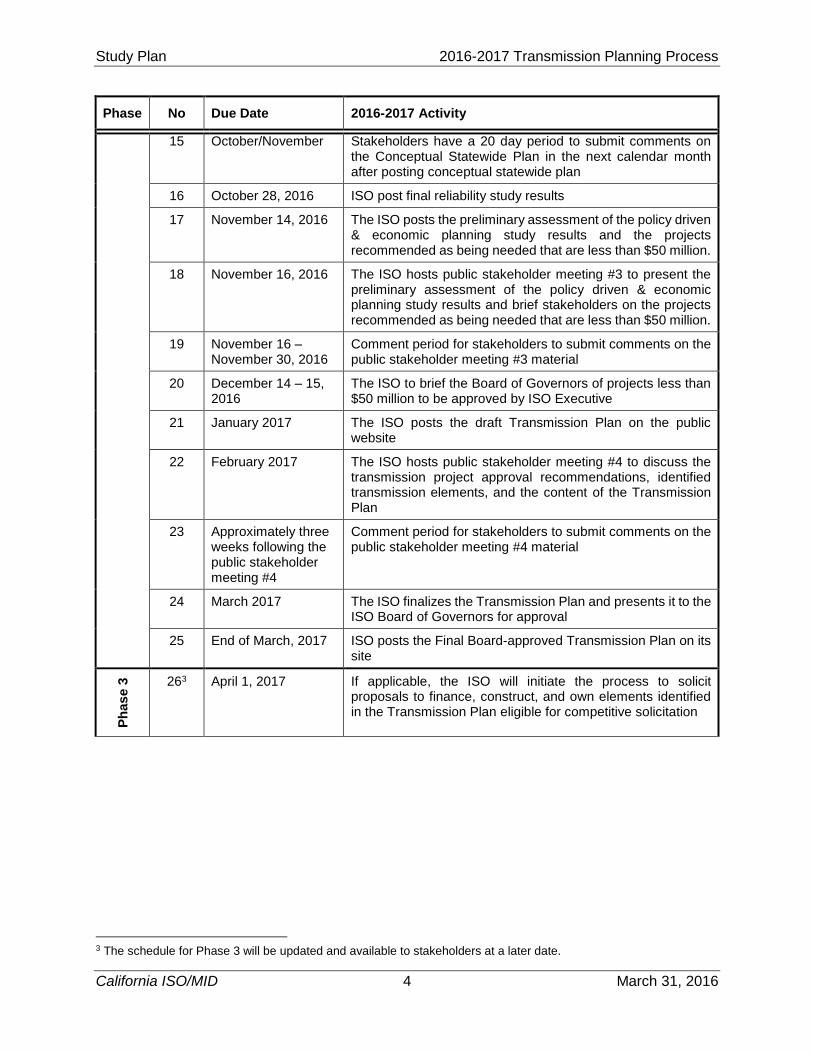
The current schedule for all three phases of the 2016-2017 transmission planning cycle is provided in Table 2-1. Should this schedule change or other aspects of the 2016-2017 transmission planning cycle require revision; the ISO will notify stakeholders through an ISO market notice which will provide stakeholders information about revisions that have been made. As such, the ISO encourages interested entities to register to receive transmission planning related market notices. To do so, go to: http://www.caiso.com/informed/Pages/Notifications/MarketNotices/MarketNoticesSubscriptionForm.aspx and submit the Market Notice Subscription Form.
Study Plan 2016-2017 Transmission Planning Process
California ISO/MID 3 March 31, 2016
Table 2-1: Schedule for the 2016-2017 planning cycle
Phase No Due Date 2016-2017 Activity
Ph
as
e 1
1 December 15, 2015 The ISO sends a letter to neighboring balancing authorities, sub-regional, regional planning groups requesting planning data and related information to be considered in the development of the Study Plan and the ISO issues a market notice announcing a thirty-day comment period requesting demand response assumptions and generation or other non-transmission alternatives to be considered in the Unified Planning Assumptions.
2 January 15, 2016 PTO’s, neighboring balancing authorities, regional/sub-regional planning groups and stakeholders provide ISO the information requested No.1 above.1
3 February 22, 2016 The ISO develops the draft Study Plan and posts it on its website
4 February 29, 2016 The ISO hosts public stakeholder meeting #1 to discuss the contents in the Study Plan with stakeholders
5 February 29 - March 14, 2016
Comment period for stakeholders to submit comments on the public stakeholder meeting #1 material and for interested parties to submit Economic Planning Study Requests to the ISO
6 March 31, 2016 The ISO specifies a provisional list of high priority economic planning studies, finalizes the Study Plan and posts it on the public website
7 Q1 ISO Initiates the development of the Conceptual Statewide Plan
Ph
as
e 2
8 August 15, 2016 The ISO posts preliminary reliability study results and mitigation solutions
9 August 15, 2016 Request Window opens
10 September 15, 2016 PTO’s submit reliability projects to the ISO
11 September/October ISO posts the Conceptual Statewide Plan on its website and issues a market notice announcing the posting
12 September 21 – 22, 2016
The ISO hosts public stakeholder meeting #2 to discuss the reliability study results, PTO’s reliability projects, and the Conceptual Statewide Plan with stakeholders
13 September 22 – October 6, 2016
Comment period for stakeholders to submit comments on the public stakeholder meeting #2 material2
14 October 15, 2016 Request Window closes
1 In response to the ISO’s December 15, 2015 letter, the following parties submitted links to their most recent publicly
available transmission plans or studies: Northern Tier Transmission Group, Sacramento Municipal Utility District, WestConnect. The following participants provided transmission modeling data to be considered in the ISO's base cases: Hetch Hetchy Water and Power and Imperial Irrigation District. 2 The ISO will target responses to comments ideally within three weeks of the close of comment periods, and no later than the next public stakeholder event relating to the Transmission Plan.
Study Plan 2016-2017 Transmission Planning Process
California ISO/MID 4 March 31, 2016
Phase No Due Date 2016-2017 Activity
15 October/November Stakeholders have a 20 day period to submit comments on the Conceptual Statewide Plan in the next calendar month after posting conceptual statewide plan
16 October 28, 2016 ISO post final reliability study results
17 November 14, 2016 The ISO posts the preliminary assessment of the policy driven & economic planning study results and the projects recommended as being needed that are less than $50 million.
18 November 16, 2016 The ISO hosts public stakeholder meeting #3 to present the preliminary assessment of the policy driven & economic planning study results and brief stakeholders on the projects recommended as being needed that are less than $50 million.
19 November 16 – November 30, 2016
Comment period for stakeholders to submit comments on the public stakeholder meeting #3 material
20 December 14 – 15, 2016
The ISO to brief the Board of Governors of projects less than $50 million to be approved by ISO Executive
21 January 2017 The ISO posts the draft Transmission Plan on the public website
22 February 2017 The ISO hosts public stakeholder meeting #4 to discuss the transmission project approval recommendations, identified transmission elements, and the content of the Transmission Plan
23 Approximately three weeks following the public stakeholder meeting #4
Comment period for stakeholders to submit comments on the public stakeholder meeting #4 material
24 March 2017 The ISO finalizes the Transmission Plan and presents it to the ISO Board of Governors for approval
25 End of March, 2017 ISO posts the Final Board-approved Transmission Plan on its site
Ph
as
e 3
263 April 1, 2017 If applicable, the ISO will initiate the process to solicit proposals to finance, construct, and own elements identified in the Transmission Plan eligible for competitive solicitation
3 The schedule for Phase 3 will be updated and available to stakeholders at a later date.
Study Plan 2016-2017 Transmission Planning Process
California ISO/MID 5 March 31, 2016
2.2 Interregional Coordination The ISO received FERC’s final order on interregional transmission coordination on June 1, 2015. The ISO was compliant with this final order on October 1, 2015. Commensurate with its obligations, the ISO and the other western planning regions initiated their 2016-2017 interregional coordination cycle on January 1, 2016. The specific details of how the ISO will engage in interregional coordination are provided in the ISO’s Transmission Planning Business Practice Manual. The ISO will keep stakeholders informed about its interregional activities through the stakeholder meetings identified in Table 2 1: Schedule for the 2016-2017 planning cycle. The interregional transmission coordination webpage is located at the following link:
http://www.caiso.com/planning/Pages/InterregionalTransmissionCoordination/default.aspx.
2.3 Stakeholder Comments The ISO will provide stakeholders with an opportunity to comment on all meetings and posted materials. Stakeholders are requested to submit comments in writing to [email protected] within two weeks after the stakeholder meetings. The ISO will post these comments on the ISO Website. The ISO will target responses to comments ideally within three weeks of the close of comment periods, and no later than the next public stakeholder event relating to the Transmission Plan.
2.4 Availability of Information The ISO website is the central place for public and non-public information. For public information, the main page for documents related to 2016-2017 transmission planning cycle is the “Transmission Planning” section located at http://www.caiso.com/planning/Pages/TransmissionPlanning/Default.aspx on the ISO website.
Confidential or otherwise restricted data, such as Critical Energy Infrastructure Information (CEII) is stored on the ISO secure transmission planning webpage located on the market participant portal at https://portal.caiso.com/tp/Pages/default.aspx. In order to gain access to this secured website, each individual must have a Non-Disclosure Agreement (NDA) executed with the ISO.
The procedures governing access to different classes of protected information is set forth in Section 9.2 of the Transmission Planning BPM (BPM). As indicated in that section, access to specified information depends on whether a requesting entity meets certain criteria set forth in the ISO tariff. The NDA application and instructions are available on the ISO website at http://www.caiso.com/planning/Pages/TransmissionPlanning/Default.aspx under the Accessing transmission data heading.
Study Plan 2016-2017 Transmission Planning Process
California ISO/MID 6 March 31, 2016
3. Conceptual Statewide Transmission Plan With FERC’s approval of the ISO’s revised TPP in December 2010, the development of a conceptual statewide plan as an input for consideration in developing the ISO’s comprehensive transmission plan was incorporated into phase 1 of the TPP.
Per the ISO tariff section 24.2, during Phase 1 the ISO will initiate the development of a conceptual statewide transmission plan. The plan will typically be completed during Phase 2 of the TPP, at which time it will become an input to the study process whereby the ISO evaluates the need for policy-driven transmission elements. Based on the opportunity to provide a broad geographic view of needed transmission development to meet California’s 33%, and more recently, 50% renewable goals, the ISO incorporated an annual conceptual statewide transmission plan into its transmission planning process. Included in the ISO’s transmission plan for the past five years, the conceptual statewide plan remains as an open framework to provide a “California centric” backdrop upon which possible collaboration with other California transmission providers could lead to development of new infrastructure to support California’s renewable goals. Although the conceptual statewide plan could be useful in providing a broad geographic view of needed transmission development, the plan, as entitled, must be “conceptual” in the sense that it would be for informational purposes only and not binding on any of the California transmission providers as to which projects to approve.
Study Plan 2016-2017 Transmission Planning Process
California ISO/MID 7 March 31, 2016
4. Reliability Assessments The ISO will analyze the need for transmission upgrades and additions in accordance with NERC Standards and WECC/ISO reliability criteria. Reliability assessments are conducted annually to ensure that performance of the system under the ISO controlled grid will meet or exceed the applicable reliability standards. The term “Reliability Assessments” encompasses several technical studies such as power flow, transient stability, and voltage stability studies. The basic assumptions that will be used in the reliability assessments are described in sections 4.1.1-4.1.15. Generally, these include the scenarios being studied, assumptions on the modeling of major components in power systems (such as demand, generation, transmission network topology, and imports), contingencies to be evaluated, reliability standards to be used to measure system performance, and software or analytical tools.
4.1 Reliability Standards and Criteria
The 2016-2017 transmission plan will span a 10-year planning horizon and will be conducted to ensure the ISO-controlled grid is in compliance with the North American Electric Reliability Corporation (NERC) standards, WECC regional criteria, and ISO planning standards across the 2017-2026 planning horizon.
4.1.1 NERC Reliability Standards
The ISO will analyze the need for transmission upgrades and additions in accordance with NERC reliability standards, which set forth criteria for system performance requirements that must be met under a varied but specific set of operating conditions. The following NERC reliability standards are applicable to the ISO as a registered NERC planning authority and are the primary driver of the need for reliability upgrades:4
TPL-001-4: Transmission System Planning Performance Requirements5; and
NUC-001-2.1 Nuclear Plant Interface Coordination.7
4.1.2 WECC Regional Criteria
The WECC System Performance TPL-001-WECC-CRT-2.26 Regional Criteria are applicable to the ISO as a planning authority and set forth additional requirements that must be met under a varied but specific set of operating conditions.7
4.1.3 California ISO Planning Standards
The California ISO Planning Standards specify the grid planning criteria to be used in the planning of ISO transmission facilities.8 These standards cover the following:
address specifics not covered in the NERC reliability standards and WECC regional criteria;
provide interpretations of the NERC reliability standards and WECC regional criteria specific to the ISO-controlled grid; and
identify whether specific criteria should be adopted that are more stringent than the NERC standards or WECC regional criteria.
4 http://www.nerc.com/page.php?cid=2%7C20 5 Analysis of Extreme Events or NUC-001 are not included within the Transmission Plan unless these requirements drive the need for mitigation plans to be developed. 6 https://www.wecc.biz/Reliability/TPL-001-WECC-CRT-2.2.pdf 7 http://compliance.wecc.biz/application/ContentPageView.aspx?ContentId=71 8 http://www.caiso.com/Documents/FinalISOPlanningStandards-April12015_v2.pdf
Study Plan 2016-2017 Transmission Planning Process
California ISO/MID 8 March 31, 2016
4.2 Frequency of the study The reliability assessments are performed annually as part of the ISO’s TPP.
4.3 Study Horizon and Years The studies that comply with TPL-001-4 will be conducted for both the near-term9 (2017-2021) and longer-term10 (2022-2026) per the requirements of the reliability standards.
Within the identified near and longer term study horizons the ISO will be conducting detailed analysis on years 2018, 2021 and 2026. If in the analysis it is determined that additional years are required to be assessed the ISO will consider conducting studies on these years or utilize past studies11 in the areas as appropriate.
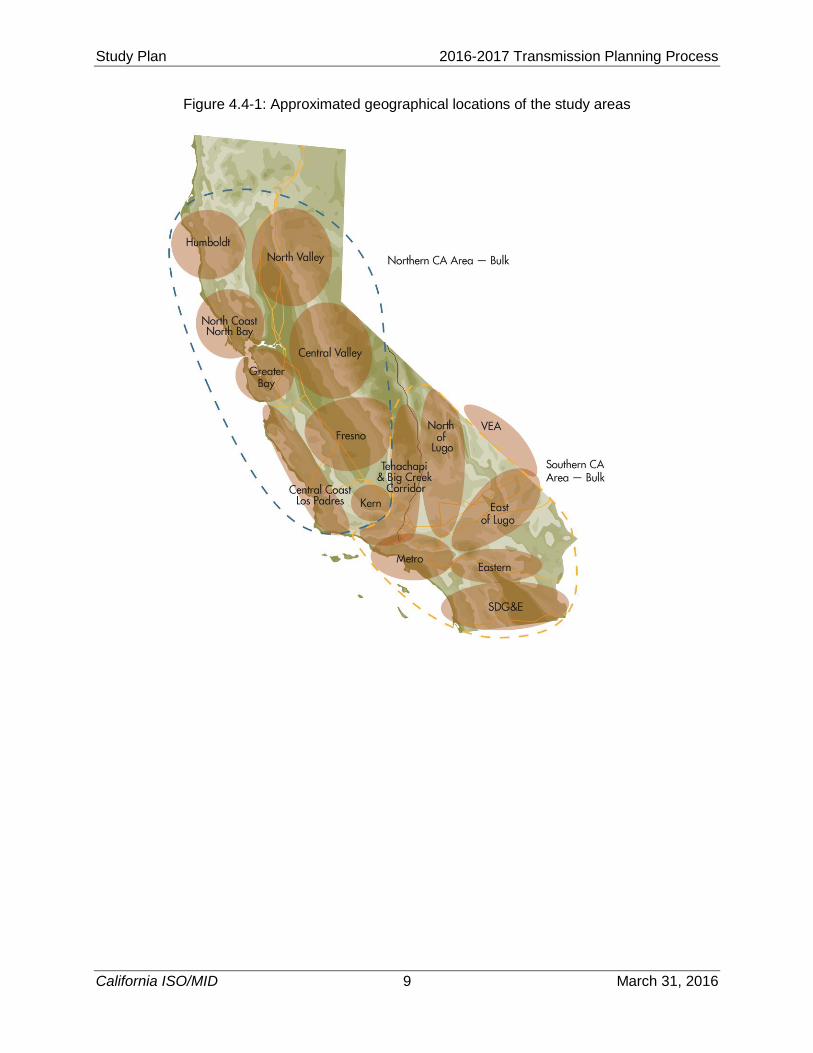
4.4 Study Areas The reliability assessments will be performed on the bulk system (north and south) as well as the local areas under the ISO controlled grid. Figure 4.4-1 shows the approximate geographical locations of these study areas. The full-loop power flow base cases that model the entire WECC interconnection will be used in all cases. These 16 study areas are shown below.
Northern California (bulk) system – 500 kV facilities and selected 230 kV facilities in the PG&E system
PG&E Local Areas: o Humboldt area; o North Coast and North Bay areas; o North Valley area; o Central Valley area; o Greater Bay area; o Greater Fresno area; o Kern Area; and o Central Coast and Los Padres areas.
Southern California (bulk) system – 500 kV facilities in the SCE and SDG&E areas and the 230 kV facilities that interconnect the two areas.
SCE local areas: o Tehachapi and Big Creek Corridor; o North of Lugo area; o East of Lugo area; o Eastern area; and o Metro area.
San Diego Gas Electric (SDG&E) bulk transmission
San Diego Gas Electric (SDG&E) sub-transmission
Valley Electric Association (VEA) area
9 System peak load for either year one or year two, and for year five as well as system off-peak load for one of the five years. 10 System peak load conditions for one of the years and the rationale for why that year was selected. 11 Past studies may be used to support the Planning Assessment if they meet the following requirements: 1. For steady state, short circuit, or stability analysis: the study shall be five calendar years old or less, unless a technical rationale can be provided to demonstrate that the results of an older study are still valid. 2. For steady state, short circuit, or stability analysis: no material changes have occurred to the System represented in the study. Documentation to support the technical rationale for determining material changes shall be included.
Study Plan 2016-2017 Transmission Planning Process
California ISO/MID 9 March 31, 2016
Figure 4.4-1: Approximated geographical locations of the study areas
Study Plan 2016-2017 Transmission Planning Process
California ISO/MID 10 March 31, 2016
4.5 Transmission Assumptions
4.5.1 Transmission Projects
The transmission projects that the ISO has approved will be modeled in the study. This includes existing transmission projects that have been in service and future transmission projects that have received ISO approval in the 2015-2016 or earlier ISO transmission plans. Currently, the ISO anticipates the 2015-2016 transmission plan will be presented to the ISO board of governors for approval in March 2016.
4.5.2 Reactive Resources
The study models the existing and new reactive power resources in the base cases to ensure that realistic reactive support capability will be included in the study. These include generators, capacitors, static var compensators (SVCs) and other devices. In addition, Table A4-1 of Appendix A provides a list of key existing reactive power resources that will be modeled in the studies. For the complete list of these resources, please refer to the base cases which are available through the ISO secured website.
4.5.3 Protection System
To help ensure reliable operations, many special protection systems (SPS), safety nets, UVLS and UFLS schemes have been installed in some areas. Typically, these systems trip load and/or generation by strategically tripping circuit breakers under select contingencies or system conditions after detecting overloads, low voltages or low frequency. The major new and existing SPS, safety nets, and UVLS that will be included in the study are listed in section A5 of Appendix A.
4.5.4 Control Devices
Several control devices were modeled in the studies. These control devices are:
All shunt capacitors in SCE and other areas
Static var compensators and synchronous condensers at several locations such as Potrero, Newark, Rector, Devers, and Talega substations
DC transmission line such as PDCI, IPPDC, and Trans Bay Cable Projects
Imperial Valley flow controller; (e.g., phase shifting transformer).
4.6 Load Forecast Assumptions
4.6.1 Energy and Demand Forecast
The assessment will utilize the California Energy Demand Forecast 2016-2026, Revised Electricity Forecast adopted by California Energy Commission (CEC) on January 27, 2016 using the Mid Case LSE and Balancing Authority Forecast spreadsheet of January 27, 2016.
During 2015, the CEC, CPUC and ISO engaged in collaborative discussion on how to consistently account for reduced energy demand from energy efficiency in the planning and procurement processes. To that end, the 2015 IEPR final report, adopted on February 10, 2016, based on the IEPR record and in consultation with the CPUC and the ISO, recommends using the Mid Additional Achievable Energy Efficiency (AAEE) scenario for system‐wide and flexibility studies for the CPUC LTPP and ISO TPP cycles. Because of the local nature of reliability needs and the difficulty of forecasting load and AAEE at specific locations and estimating their daily load‐shape impacts, using the Low-Mid AAEE scenario for local studies is more prudent at this time.
Study Plan 2016-2017 Transmission Planning Process
California ISO/MID 11 March 31, 2016
The CEC forecast information is available on the CEC website at:
http://www.energy.ca.gov/2015_energypolicy/documents/index.html#adoptedforecast
In general, the following are guidelines on how load forecasts are used for each study area.
The 1-in-10 load forecasts will be used in PG&E, SCE, SDG&E, and VEA local area
studies including the studies for the LA Basin/San Diego local capacity area.
The 1-in-5 load forecast will be used for system studies
The CEC Energy and Demand Forecast states the following with respect to the impact of PV at the time of the forecast peak load:
“At some point, continued growth in PV adoption will likely reduce demand for utility-generated power at traditional peak hours to the point where the hour of peak utility demand is pushed back to later in the day. This means that future PV peak impacts could decline significantly as system performance drops in the later hours. This possibility has not been incorporated into the demand forecast through CED 2015, since staff has not yet developed models to forecast hourly loads in the long term. Staff expects to develop this capability for the 2017 Integrated Energy Policy Report (2017 IEPR), and such an adjustment to PV peak impacts could significantly affect future peak forecasts.”12
In the 2016-2017 TPP, the ISO will use the CEC energy and demand forecast for the base scenario analysis identified in section 4.11.1. As the ISO conducts sensitivities on a case by case basis and to comply with the NERC TPL-001-4 mandatory reliability standard, these and other forecasting uncertainties will be taken into account in the sensitivity studies identified in section 4.11.2 as needed. The ISO will continue to work with the CEC on the hourly load forecast issue during the development of 2017 IEPR.
4.6.2 Methodologies to Derive Bus Level Forecast
Since load forecasts from the CEC are generally provided for a larger area, these load forecasts may not contain bus-level load forecasts which are necessary for reliability assessment. Consequently, the augmented local area load forecasts developed by the participating transmission owners (PTOs) will also be used where the forecast from the CEC does not provide detailed load forecasts. Descriptions of the methodologies used by each of the PTOs to derive bus-level load forecasts using CEC data as a starting point are described below.
4.6.2.1 Pacific Gas and Electric Service Area
The method used to develop the PG&E base case loads is an integrative process that extracts, adjusts and modifies the information from the transmission and distribution systems and municipal utility forecasts. The melding process consists of two parts. Part 1 deals with the PG&E load. Part 2 deals with the municipal utility loads.
12 CEC California Energy Demand 2016-2026, Revised Electricity Forecast Volume1: Statewide Electricity Demand
and Energy Efficiency, January 2016, http://docketpublic.energy.ca.gov/PublicDocuments/15-IEPR-03/TN207439_20160115T152221_California_Energy_Demand_20162026_Revised_Electricity_Forecast.pdf, Page 37.
Study Plan 2016-2017 Transmission Planning Process
California ISO/MID 12 March 31, 2016
PG&E Loads in Base Case
The method used to determine the PG&E loads is similar to the one used in the previous year’s studies. The method consists of determining the division loads for the required 1-in-5 system or 1-in-10 area base cases as well as the allocation of the division load to the transmission buses.
Determination of Division Loads The annual division load is determined by summing the previous year division load and the current division load growth. The initial year for the base case development method is based heavily on the most recent recorded data. The division load growth in the system base case is determined in two steps. First, the total PG&E load growth for the year is determined. Then this total PG&E load growth is allocated to the division, based on the relative magnitude of the load growths projected for the divisions by PG&E’s distribution planners. For the 1-in-10 area base case, the division load growth determined for the system base case is adjusted to the 1-in-10 temperature using the load temperature relation determined from the most recent load and temperature data of the division.
Allocation of Division Load to Transmission Bus Level Since the base case loads are modeled at the various transmission buses, the division loads developed need to be allocated to those buses. The allocation process is different depending on the load types. PG&E classifies its loads into four types: conforming, non-conforming, self-generation and generation-plant loads. The conforming, non-conforming and self-generation loads are included in the division load. Because of their variability, the generation-plant loads are not included in the division load. Since the non-conforming and self-generation loads are assumed to not vary with temperature, their magnitude would be the same in the 1-in-2 system, 1-in-5 system or the 1-in-10 area base cases of the same year. The remaining load (the total division load developed above, less the quantity of non-conforming and self-generation load) is the conforming load, which is then allocated to the transmission buses based on the relative magnitude of the distribution level forecast.
Muni Loads in Base Case
Municipalities provide PG&E their load forecast information. If no information is provided, PG&E supplements such forecast. For example, if a municipal utility provided only the 1-in-5 loads, PG&E would determine the 1-in-2 and 1-in-10 loads by adjusting the 1-in-5 loads for temperature in the same way that PG&E would for its load in that area.
For the 1-in-5 system base cases, the 1-in-5 loads are used. For the 1-in-10 area base cases, the 1-in-10 loads are used if the municipal loads are in the area of the area base case, otherwise, the 1-in-2 loads would be used.
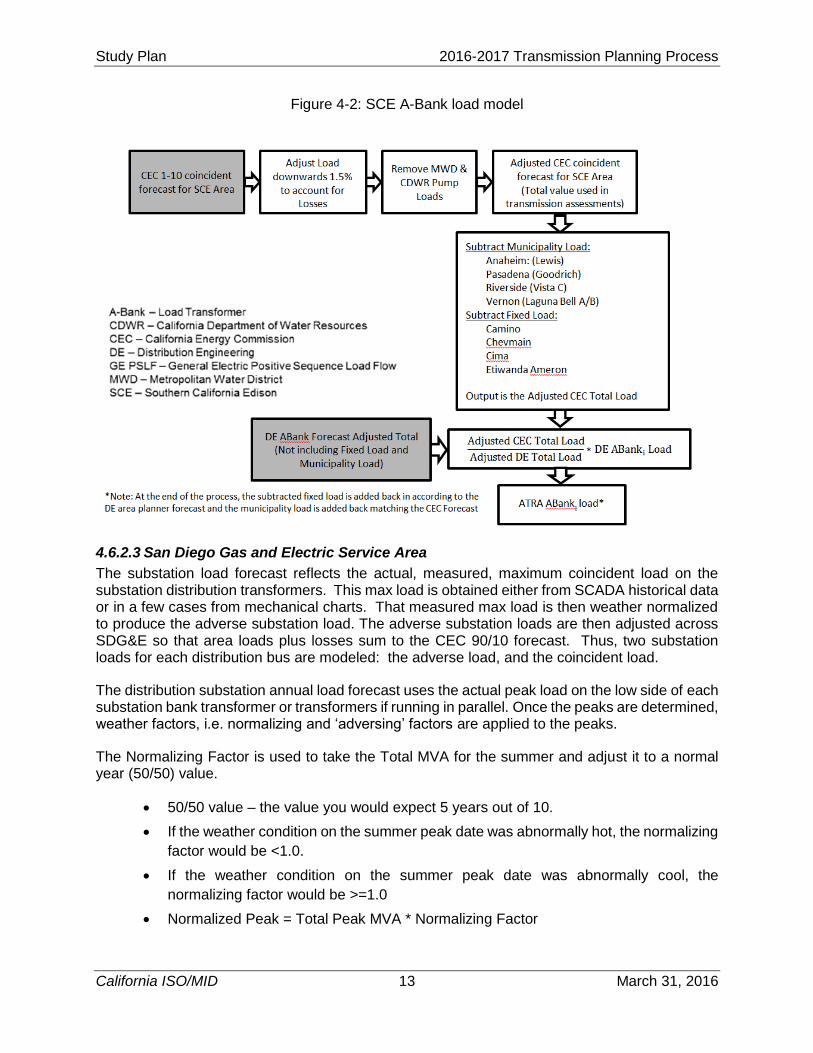
4.6.2.2 Southern California Edison Service Area
The following figure identifies the steps in developing SCE’s A-Bank load model.
Study Plan 2016-2017 Transmission Planning Process
California ISO/MID 13 March 31, 2016
Figure 4-2: SCE A-Bank load model
4.6.2.3 San Diego Gas and Electric Service Area
The substation load forecast reflects the actual, measured, maximum coincident load on the substation distribution transformers. This max load is obtained either from SCADA historical data or in a few cases from mechanical charts. That measured max load is then weather normalized to produce the adverse substation load. The adverse substation loads are then adjusted across SDG&E so that area loads plus losses sum to the CEC 90/10 forecast. Thus, two substation loads for each distribution bus are modeled: the adverse load, and the coincident load.
The distribution substation annual load forecast uses the actual peak load on the low side of each substation bank transformer or transformers if running in parallel. Once the peaks are determined, weather factors, i.e. normalizing and ‘adversing’ factors are applied to the peaks.
The Normalizing Factor is used to take the Total MVA for the summer and adjust it to a normal year (50/50) value.
50/50 value – the value you would expect 5 years out of 10.
If the weather condition on the summer peak date was abnormally hot, the normalizing
factor would be <1.0.
If the weather condition on the summer peak date was abnormally cool, the
normalizing factor would be >=1.0
Normalized Peak = Total Peak MVA * Normalizing Factor
Study Plan 2016-2017 Transmission Planning Process
California ISO/MID 14 March 31, 2016
The Adverse Factor takes the normalized peak value and ‘adverses’ it up to what the load would be if the peak occurred in an adverse year.
The adverse peak is the adjusted peak that would be expected 1 out of 10 years.
Adverse Peak = Normalized Peak * Adverse Factor
The distribution substation annual forecast submitted to transmission planning is an Adverse Peak forecast. The distribution substation forecast will always be higher than the system forecast which is a coincident forecast that is ‘adversed’. The distribution circuits are de-coupled from the substation banks and buses, and are therefore not used to complete the substation forecast.
4.6.2.4 Valley Electric Association Service Area
The VEA substation load forecast is obtained from historical SCADA data and VEA long range study and load plans. The historical SCADA data reflects the actual, measured load on the substation distribution transformers. Both sets of data are compared against the CEC forecast and adjusted as needed.
4.6.3 Power Factor Assumptions
In the SCE area assessment, an active to reactive power (watt/var) ratio of 25-to-1 (or power factor of 0.999) measured at the high side of the A-Bank (230/115 kV or 230/66 kV) will be assumed for the SCE transmission substation loads. The value of this ratio recorded has ranged between 35 to 1 in 2006 to a leading power factor from 2008 through 2010.
The increase in the watt/var ratio is a result of SCE commitment to its program to optimize reactive power planning and capacitor bank availability during heavy summer peak load periods in its distribution and sub-transmission systems. The objective of the SCE’s reactive power program was to ensure a watt/var ratio of 25 to 1.
Recent Historical System watt/var Ratio:
The watt/var ratio recorded for SCE transmission substation loads during the annual peak load for the following years:
2006 – 35
2007 – 52
2008 – leading power factor
2009 – leading power factor
2010 – leading power factor
In the SDG&E area, power factors at all substations will be modeled using the most recent historical values obtained at peak loads. Bus load power factor for the year 2017 and 2018 will be modeled based on the actual peak load data recorded in the EMS system. For the subsequent study years a power factor of 0.992 will be used.
In the PG&E area assessment, the reactive load forecast is based on the following power factor assumptions: 0.99 lagging for summer peak cases, unity power factor for spring off-peak cases, and 0.99 leading for minimum load case. These assumptions are based on historical representative data from the PI data historian which is then used to develop an average power factor at the high side of the distribution banks.
Study Plan 2016-2017 Transmission Planning Process
California ISO/MID 15 March 31, 2016
4.6.4 Self-Generation
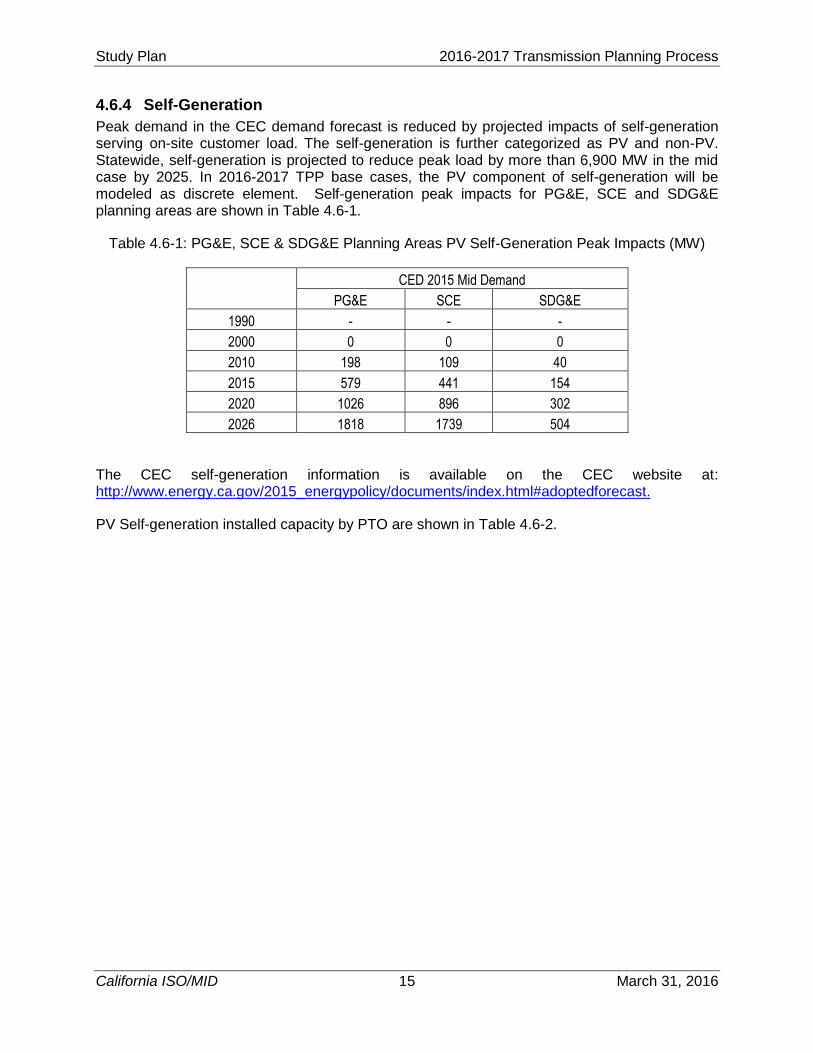
Peak demand in the CEC demand forecast is reduced by projected impacts of self-generation serving on-site customer load. The self-generation is further categorized as PV and non-PV. Statewide, self-generation is projected to reduce peak load by more than 6,900 MW in the mid case by 2025. In 2016-2017 TPP base cases, the PV component of self-generation will be modeled as discrete element. Self-generation peak impacts for PG&E, SCE and SDG&E planning areas are shown in Table 4.6-1.
Table 4.6-1: PG&E, SCE & SDG&E Planning Areas PV Self-Generation Peak Impacts (MW)
CED 2015 Mid Demand
PG&E SCE SDG&E
1990 - - -
2000 0 0 0
2010 198 109 40
2015 579 441 154
2020 1026 896 302
2026 1818 1739 504
The CEC self-generation information is available on the CEC website at: http://www.energy.ca.gov/2015_energypolicy/documents/index.html#adoptedforecast.
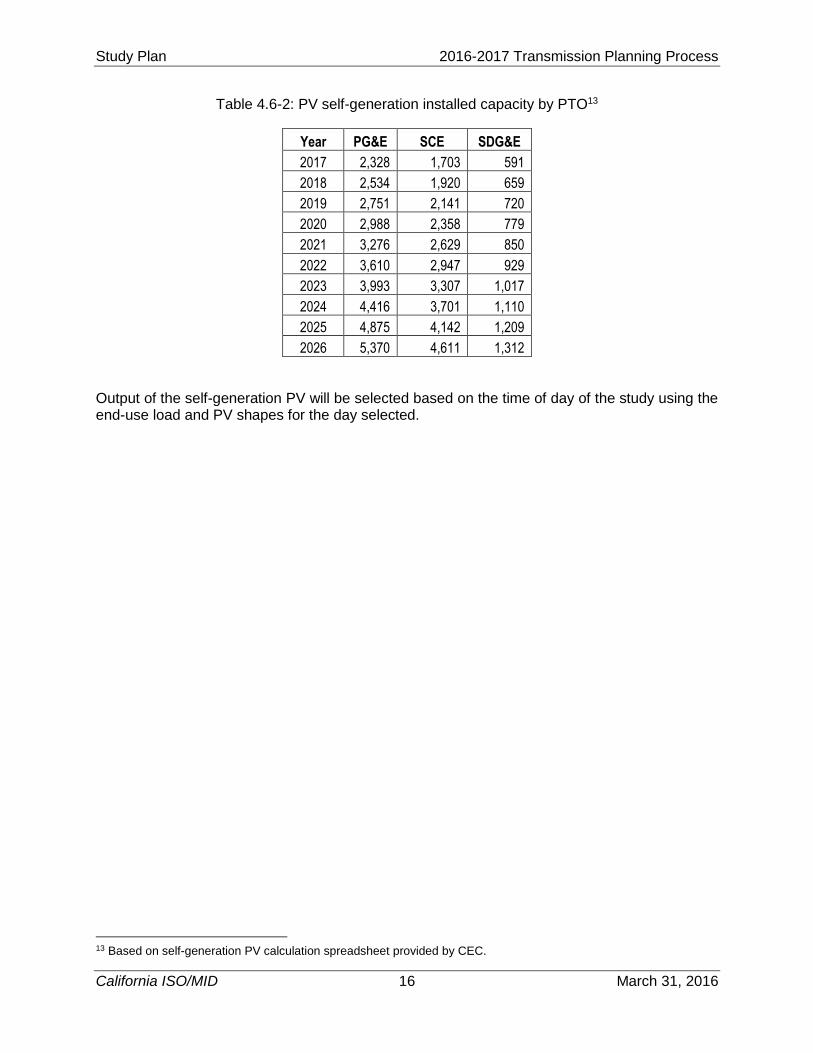
PV Self-generation installed capacity by PTO are shown in Table 4.6-2.
Study Plan 2016-2017 Transmission Planning Process
California ISO/MID 16 March 31, 2016
Table 4.6-2: PV self-generation installed capacity by PTO13
Year PG&E SCE SDG&E
2017 2,328 1,703 591
2018 2,534 1,920 659
2019 2,751 2,141 720
2020 2,988 2,358 779
2021 3,276 2,629 850
2022 3,610 2,947 929
2023 3,993 3,307 1,017
2024 4,416 3,701 1,110
2025 4,875 4,142 1,209
2026 5,370 4,611 1,312
Output of the self-generation PV will be selected based on the time of day of the study using the end-use load and PV shapes for the day selected.
13 Based on self-generation PV calculation spreadsheet provided by CEC.
Study Plan 2016-2017 Transmission Planning Process
California ISO/MID 17 March 31, 2016
4.7 Generation Assumptions
4.7.1 Generation Projects
In addition to generators that are already in-service, new generators will be modeled in the studies as generally described below. Depending on the status of each project, new generators will be assigned to one of the five levels below:
Level 1: Under construction
Level 2: Regulatory approval received
Level 3: Application under review
Level 4: Starting application process
Level 5: Press release only
Based on this classification, the following guidelines will be used to model new generators in the base cases for each study.
Up to 1-year Operating Cases: Only generation that is under construction (Level 1) and has a planned in-service date within the time frame of the study will be modeled in the initial power flow case.
2-5-year Planning Cases: Generation that is under construction (Level 1) and has a planned in-service date within the time frame of the study will be modeled in the initial power flow case.
Conventional generation in pre-construction phase with executed LGIA and progressing forward will be modeled off-line but will be available as a non-wire mitigation option.
OTC repowering projects will be modeled in lieu of existing resources as long as they have power purchase approval from the CPUC or other Local Regulatory Agency (LRA).
Renewable generation with all permitting and necessary transmission approved and expected to be in-service within 5-years may also be modeled in the relevant cases. The CPUC’s discounted core and ISO’s interconnection agreement status will be utilized as criteria for modeling specific generation. For 2021, generation from the CPUC and CEC provided portfolios described below will be used, as necessary, to ensure generation needed to be in-service to meet the 33% RPS requirement is represented. Given the data availability, generic dynamic data may be used for this future generation.
6-10-year Planning Cases: Only generation that is under construction or has received regulatory approval (Levels 1 and 2) will be modeled in the area of interest of the initial power flow case. If additional generation is required to achieve an acceptable initial power flow case, then generation from Levels 3, 4, and 5 may be used. However, generally Level 3, 4, and 5 generation should only be used when they are outside the area of study, so that the generation’s impact on the facility addition requirements will be minimized.
4.7.2 Renewable Generation
The CPUC and CEC will provide the ISO with the RPS portfolios to be used in the 2016-2017 transmission planning process in February, 2016. The RPS portfolio submission letter will be posted on the ISO website on the 2016-2017 Transmission Planning Process page. For the reliability assessment the commercial interest portfolio will be used.
Study Plan 2016-2017 Transmission Planning Process
California ISO/MID 18 March 31, 2016
Generation included in this year’s baseline scenario described in Section 24.4.6.6 of the ISO Tariff will also be included in the 10-year Planning Cases. Given the data availability, generic dynamic data may be used for the future generation.
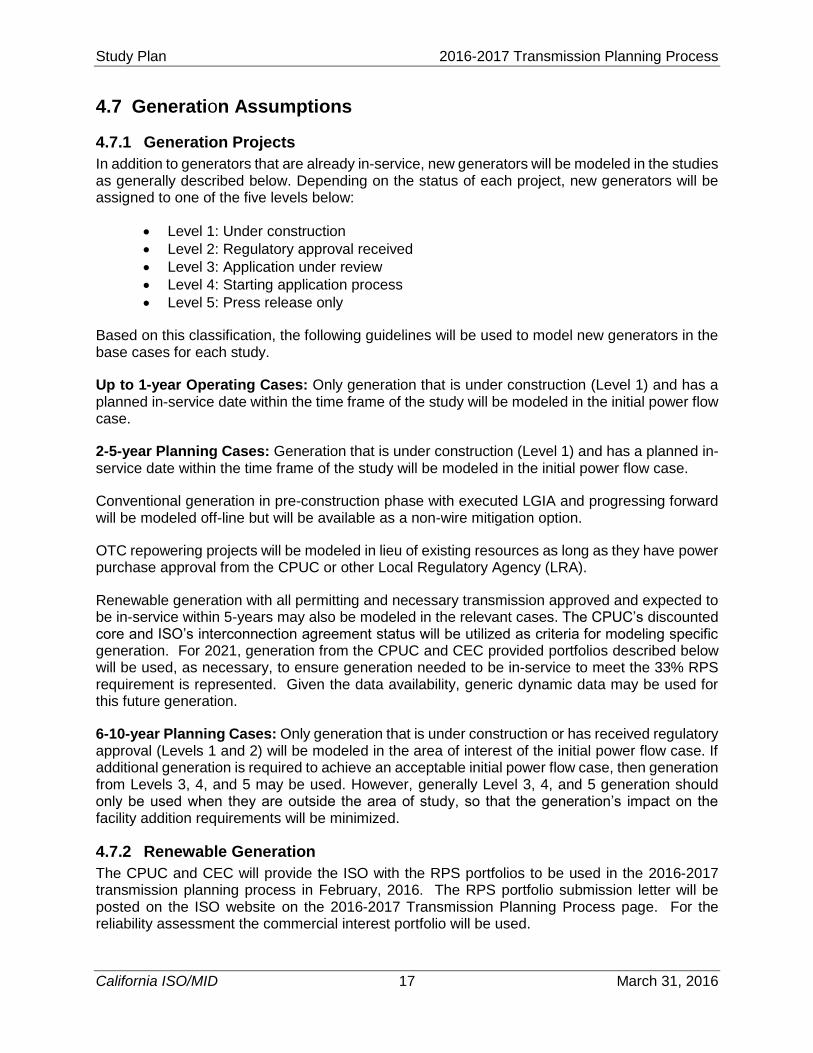
4.7.2.1 Renewable generation dispatch
The ISO has done a qualitative and quantitative assessment of hourly Grid View renewable output for stressed conditions during hours and seasons of interest. Available data of pertinent hours was catalogued by renewable technology and location on the grid. The results of active power output differ somewhat between locations and seasons as follows. Reactive limits of renewable generation will be as specified by Qmax and Qmin, which rely upon technology of the generation and may change as a function of active power output and power factor specified.
Table 4.7-1: Summary of renewable output in PG&E
All years Biomass/Biogas/Ge
othermal Solar PV, ST Wind Stressed case
Sum Min Load NQC~=P Max 0 3xNQC~=Pmax High Output
Sum Off-Peak NQC~=P Max NQC~=Pmax 3xNQC~=Pmax High Output
Sum Partial-Peak NQC~=P Max 0 0 Low Output
Sum Peak NQC~=P Max 25%xNQC~=25
%xPmax NQC~=33%xPmax Low Output
Winter Peak NQC~=P Max 0 50%xNQC~= 16.6%xPmax
Low Output
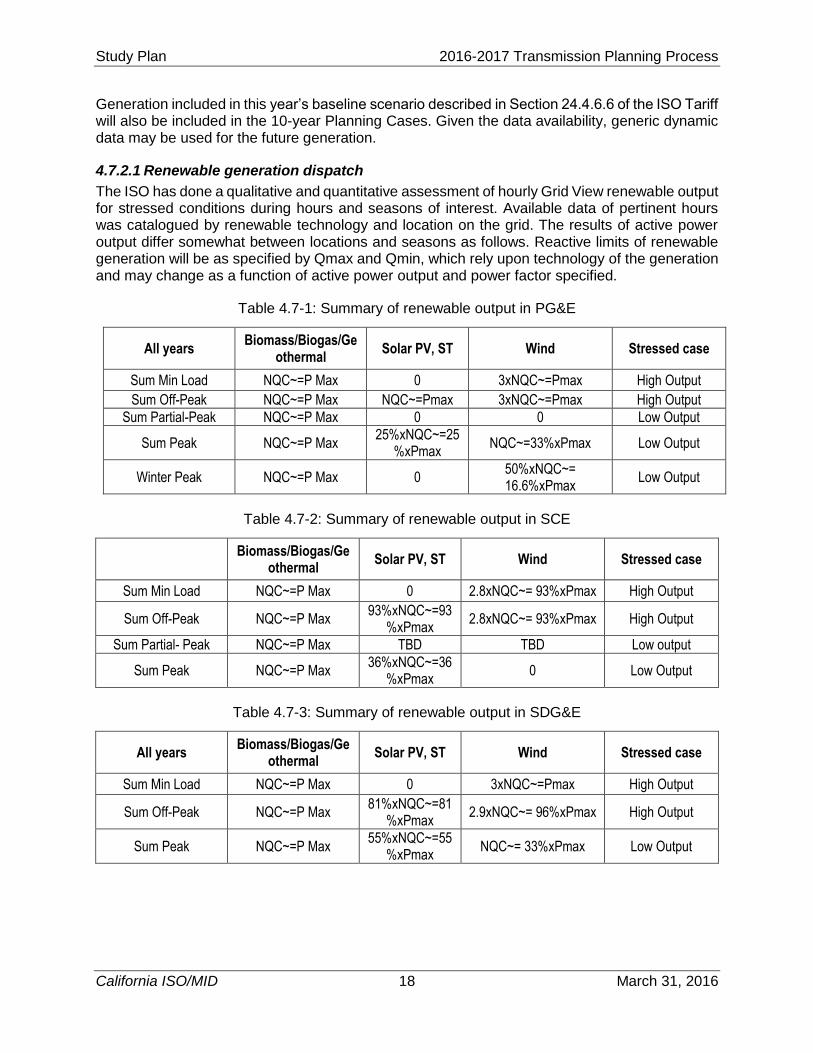
Table 4.7-2: Summary of renewable output in SCE
Biomass/Biogas/Ge
othermal Solar PV, ST Wind Stressed case
Sum Min Load NQC~=P Max 0 2.8xNQC~= 93%xPmax High Output
Sum Off-Peak NQC~=P Max 93%xNQC~=93
%xPmax 2.8xNQC~= 93%xPmax High Output
Sum Partial- Peak NQC~=P Max TBD TBD Low output
Sum Peak NQC~=P Max 36%xNQC~=36
%xPmax 0 Low Output
Table 4.7-3: Summary of renewable output in SDG&E
All years Biomass/Biogas/Ge
othermal Solar PV, ST Wind Stressed case
Sum Min Load NQC~=P Max 0 3xNQC~=Pmax High Output
Sum Off-Peak NQC~=P Max 81%xNQC~=81
%xPmax 2.9xNQC~= 96%xPmax High Output
Sum Peak NQC~=P Max 55%xNQC~=55
%xPmax NQC~= 33%xPmax Low Output
Study Plan 2016-2017 Transmission Planning Process
California ISO/MID 19 March 31, 2016
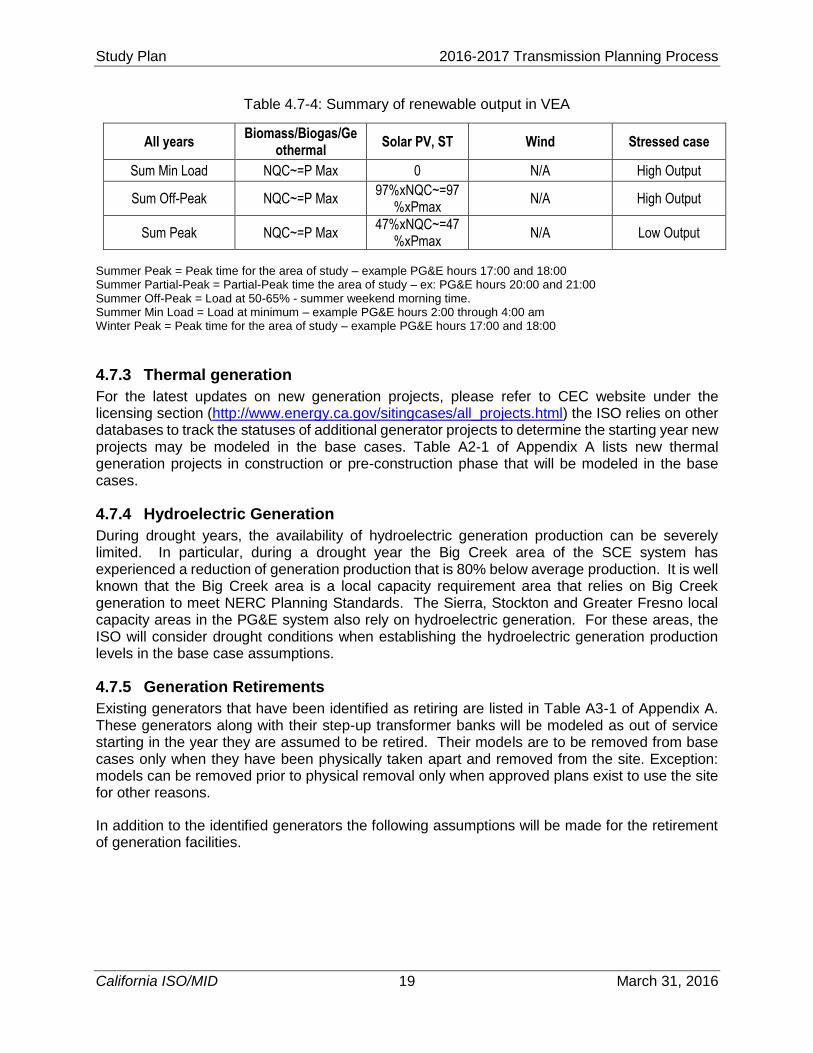
Table 4.7-4: Summary of renewable output in VEA
All years Biomass/Biogas/Ge
othermal Solar PV, ST Wind Stressed case
Sum Min Load NQC~=P Max 0 N/A High Output
Sum Off-Peak NQC~=P Max 97%xNQC~=97
%xPmax N/A High Output
Sum Peak NQC~=P Max 47%xNQC~=47
%xPmax N/A Low Output
Summer Peak = Peak time for the area of study – example PG&E hours 17:00 and 18:00 Summer Partial-Peak = Partial-Peak time the area of study – ex: PG&E hours 20:00 and 21:00 Summer Off-Peak = Load at 50-65% - summer weekend morning time. Summer Min Load = Load at minimum – example PG&E hours 2:00 through 4:00 am Winter Peak = Peak time for the area of study – example PG&E hours 17:00 and 18:00
4.7.3 Thermal generation
For the latest updates on new generation projects, please refer to CEC website under the licensing section (http://www.energy.ca.gov/sitingcases/all_projects.html) the ISO relies on other databases to track the statuses of additional generator projects to determine the starting year new projects may be modeled in the base cases. Table A2-1 of Appendix A lists new thermal generation projects in construction or pre-construction phase that will be modeled in the base cases.
4.7.4 Hydroelectric Generation
During drought years, the availability of hydroelectric generation production can be severely limited. In particular, during a drought year the Big Creek area of the SCE system has experienced a reduction of generation production that is 80% below average production. It is well known that the Big Creek area is a local capacity requirement area that relies on Big Creek generation to meet NERC Planning Standards. The Sierra, Stockton and Greater Fresno local capacity areas in the PG&E system also rely on hydroelectric generation. For these areas, the ISO will consider drought conditions when establishing the hydroelectric generation production levels in the base case assumptions.
4.7.5 Generation Retirements
Existing generators that have been identified as retiring are listed in Table A3-1 of Appendix A. These generators along with their step-up transformer banks will be modeled as out of service starting in the year they are assumed to be retired. Their models are to be removed from base cases only when they have been physically taken apart and removed from the site. Exception: models can be removed prior to physical removal only when approved plans exist to use the site for other reasons.
In addition to the identified generators the following assumptions will be made for the retirement of generation facilities.
Study Plan 2016-2017 Transmission Planning Process
California ISO/MID 20 March 31, 2016
Nuclear Retirements –Diablo Canyon will be modeled off-line based on the OTC
compliance dates14,
Once Through Cooled Retirements – As identified in section 4.7.6.
Renewable and Hydro Retirements – Assumes these resource types stay online
unless there is an announced retirement date.
Other Retirements – Unless otherwise noted, assumes retirement based resource age
of 40 years or more15.
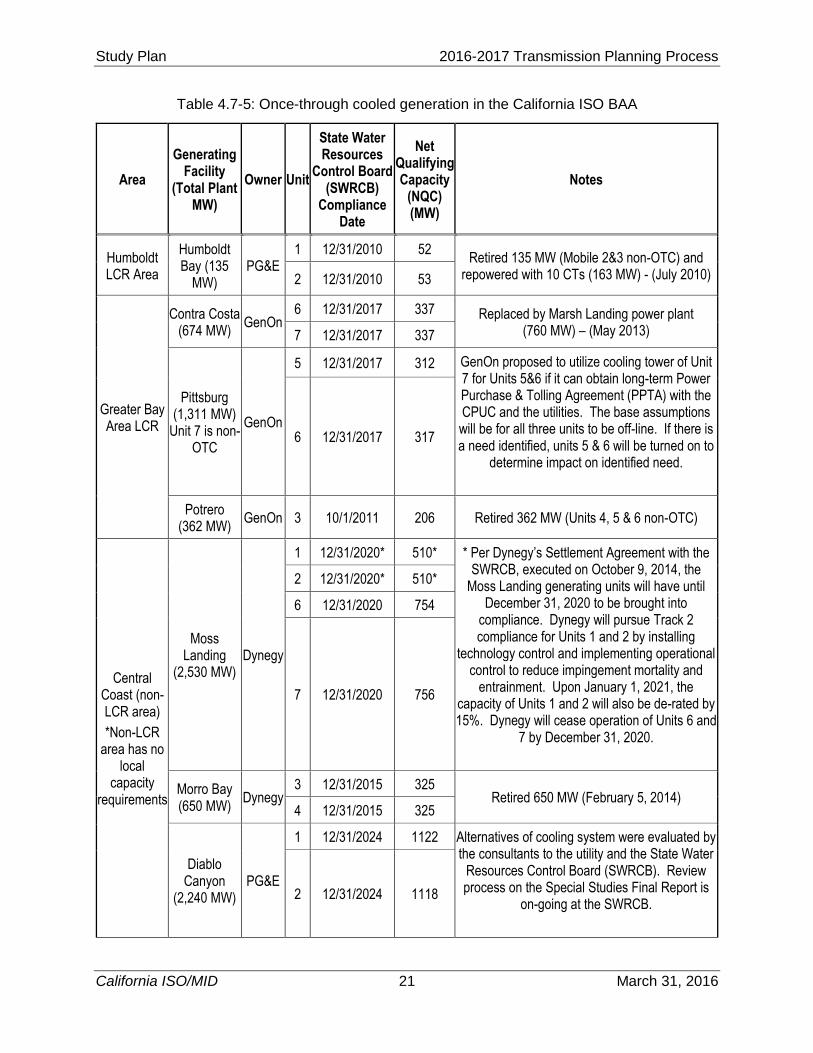
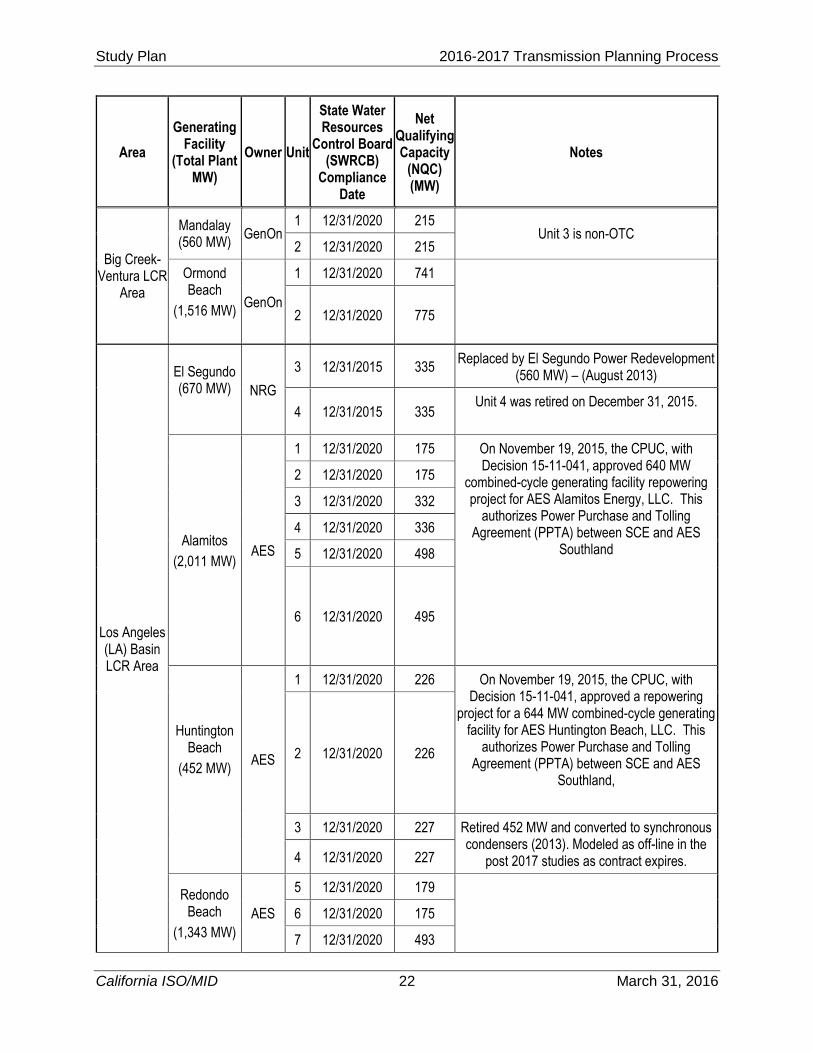
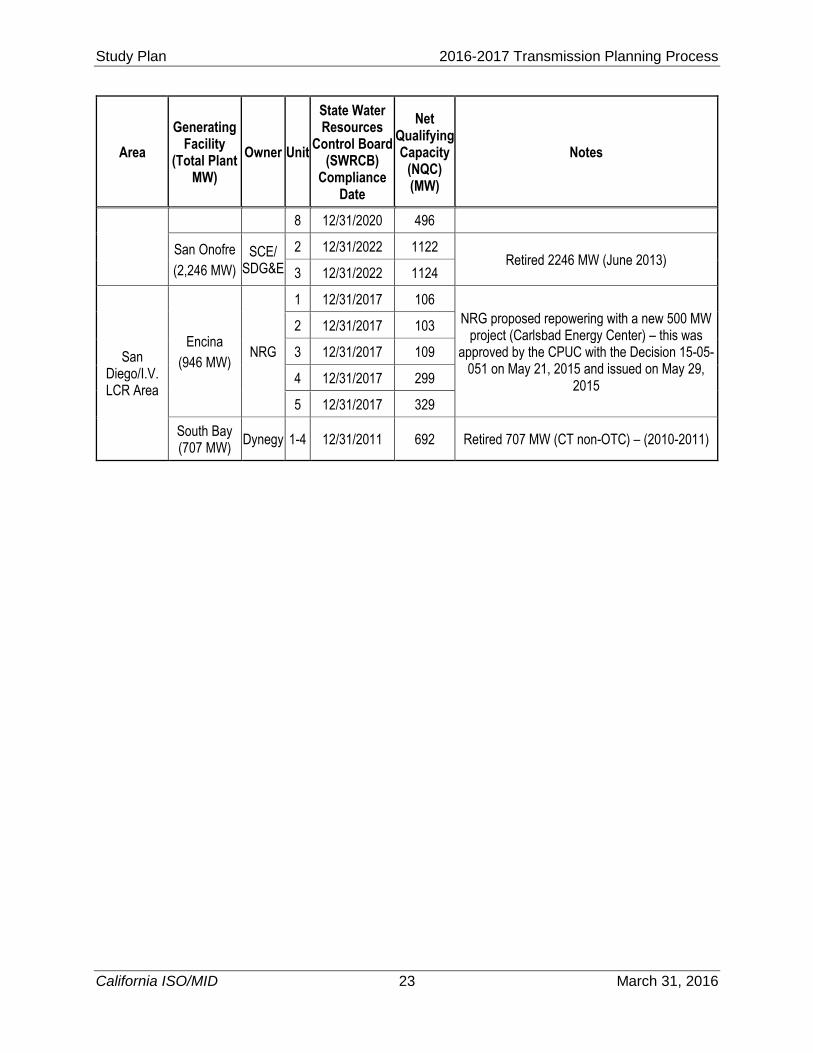
4.7.6 OTC Generation
Modeling of the once-through cooled (OTC) generating units follows the compliance schedule from the SWRCB’s Policy on OTC plants with the following exception:
Generating units that are repowered, replaced or having firm plans to connect to
acceptable cooling technology, as illustrated in Table 4.7-5;
All other OTC generating units will be modeled off-line beyond their compliance dates;
Potential early retirements of some OTC generating units to accommodate repowering projects, which have the CPUC approval for PPTAs and environmental review well under way at the CEC, are listed in Table A3-2 of Appendix A.
14 The CPUC draft Planning Assumptions & Scenarios update for the 2016 Long Term Procurement Plan Proceeding
which is relied upon in the ISO 2016-2017 Transmission Planning Process document identifies the Diablo generation to be assumed off in the Infrastructure Investment scenario. As the ISO has not received owner notification and there has not been any public announcement of retirement for the Diablo Canyon Power Plant (DCPP), the ISO will conduct a sensitivity study with the Diablo Canyon Power Plant on-line. http://docs.cpuc.ca.gov/SearchRes.aspx?docformat=ALL&docid=158117030 15 Table A3-1 reflects retirement of generation based upon announcements from the generators. The ISO will document generators assumed to be retired as a result of assumptions identified in Section 4.9 as a part of the base case development with the reliability results.
Study Plan 2016-2017 Transmission Planning Process
California ISO/MID 21 March 31, 2016
Table 4.7-5: Once-through cooled generation in the California ISO BAA
Area
Generating Facility
(Total Plant MW)
Owner Unit
State Water Resources
Control Board (SWRCB)
Compliance Date
Net Qualifying Capacity
(NQC) (MW)
Notes
Humboldt LCR Area
Humboldt Bay (135
MW) PG&E
1 12/31/2010 52 Retired 135 MW (Mobile 2&3 non-OTC) and
repowered with 10 CTs (163 MW) - (July 2010) 2 12/31/2010 53
Greater Bay Area LCR
Contra Costa (674 MW)
GenOn 6 12/31/2017 337 Replaced by Marsh Landing power plant
(760 MW) – (May 2013) 7 12/31/2017 337
Pittsburg (1,311 MW)
Unit 7 is non-OTC
GenOn
5 12/31/2017 312 GenOn proposed to utilize cooling tower of Unit 7 for Units 5&6 if it can obtain long-term Power Purchase & Tolling Agreement (PPTA) with the CPUC and the utilities. The base assumptions will be for all three units to be off-line. If there is a need identified, units 5 & 6 will be turned on to
determine impact on identified need.
6 12/31/2017 317
Potrero (362 MW)
GenOn 3 10/1/2011 206 Retired 362 MW (Units 4, 5 & 6 non-OTC)
Central Coast (non-LCR area)
*Non-LCR area has no
local capacity
requirements
Moss Landing
(2,530 MW) Dynegy
1 12/31/2020* 510* * Per Dynegy’s Settlement Agreement with the SWRCB, executed on October 9, 2014, the
Moss Landing generating units will have until December 31, 2020 to be brought into
compliance. Dynegy will pursue Track 2 compliance for Units 1 and 2 by installing
technology control and implementing operational control to reduce impingement mortality and
entrainment. Upon January 1, 2021, the capacity of Units 1 and 2 will also be de-rated by 15%. Dynegy will cease operation of Units 6 and
7 by December 31, 2020.
2 12/31/2020* 510*
6 12/31/2020 754
7 12/31/2020 756
Morro Bay (650 MW)
Dynegy 3 12/31/2015 325
Retired 650 MW (February 5, 2014) 4 12/31/2015 325
Diablo Canyon
(2,240 MW) PG&E
1 12/31/2024 1122 Alternatives of cooling system were evaluated by the consultants to the utility and the State Water
Resources Control Board (SWRCB). Review process on the Special Studies Final Report is
on-going at the SWRCB.
2 12/31/2024 1118
Study Plan 2016-2017 Transmission Planning Process
California ISO/MID 22 March 31, 2016
Area
Generating Facility
(Total Plant MW)
Owner Unit
State Water Resources
Control Board (SWRCB)
Compliance Date
Net Qualifying Capacity
(NQC) (MW)
Notes
Big Creek-Ventura LCR
Area
Mandalay (560 MW)
GenOn 1 12/31/2020 215
Unit 3 is non-OTC 2 12/31/2020 215
Ormond Beach
(1,516 MW)
GenOn
1 12/31/2020 741
2 12/31/2020 775
Los Angeles (LA) Basin LCR Area
El Segundo (670 MW)
NRG
3 12/31/2015 335 Replaced by El Segundo Power Redevelopment
(560 MW) – (August 2013)
4 12/31/2015 335 Unit 4 was retired on December 31, 2015.
Alamitos
(2,011 MW) AES
1 12/31/2020 175 On November 19, 2015, the CPUC, with Decision 15-11-041, approved 640 MW
combined-cycle generating facility repowering project for AES Alamitos Energy, LLC. This
authorizes Power Purchase and Tolling Agreement (PPTA) between SCE and AES
Southland
2 12/31/2020 175
3 12/31/2020 332
4 12/31/2020 336
5 12/31/2020 498
6 12/31/2020 495
Huntington Beach
(452 MW)
AES
1 12/31/2020 226 On November 19, 2015, the CPUC, with Decision 15-11-041, approved a repowering
project for a 644 MW combined-cycle generating facility for AES Huntington Beach, LLC. This
authorizes Power Purchase and Tolling Agreement (PPTA) between SCE and AES
Southland,
2 12/31/2020 226
3 12/31/2020 227 Retired 452 MW and converted to synchronous condensers (2013). Modeled as off-line in the
post 2017 studies as contract expires. 4 12/31/2020 227
Redondo Beach
(1,343 MW)
AES
5 12/31/2020 179
6 12/31/2020 175
7 12/31/2020 493
Study Plan 2016-2017 Transmission Planning Process
California ISO/MID 23 March 31, 2016
Area
Generating Facility
(Total Plant MW)
Owner Unit
State Water Resources
Control Board (SWRCB)
Compliance Date
Net Qualifying Capacity
(NQC) (MW)
Notes
8 12/31/2020 496
San Onofre
(2,246 MW)
SCE/ SDG&E
2 12/31/2022 1122 Retired 2246 MW (June 2013)
3 12/31/2022 1124
San Diego/I.V. LCR Area
Encina
(946 MW) NRG
1 12/31/2017 106
NRG proposed repowering with a new 500 MW project (Carlsbad Energy Center) – this was
approved by the CPUC with the Decision 15-05-051 on May 21, 2015 and issued on May 29,
2015
2 12/31/2017 103
3 12/31/2017 109
4 12/31/2017 299
5 12/31/2017 329
South Bay (707 MW)
Dynegy 1-4 12/31/2011 692 Retired 707 MW (CT non-OTC) – (2010-2011)
Study Plan 2016-2017 Transmission Planning Process
California ISO/MID 24 March 31, 2016
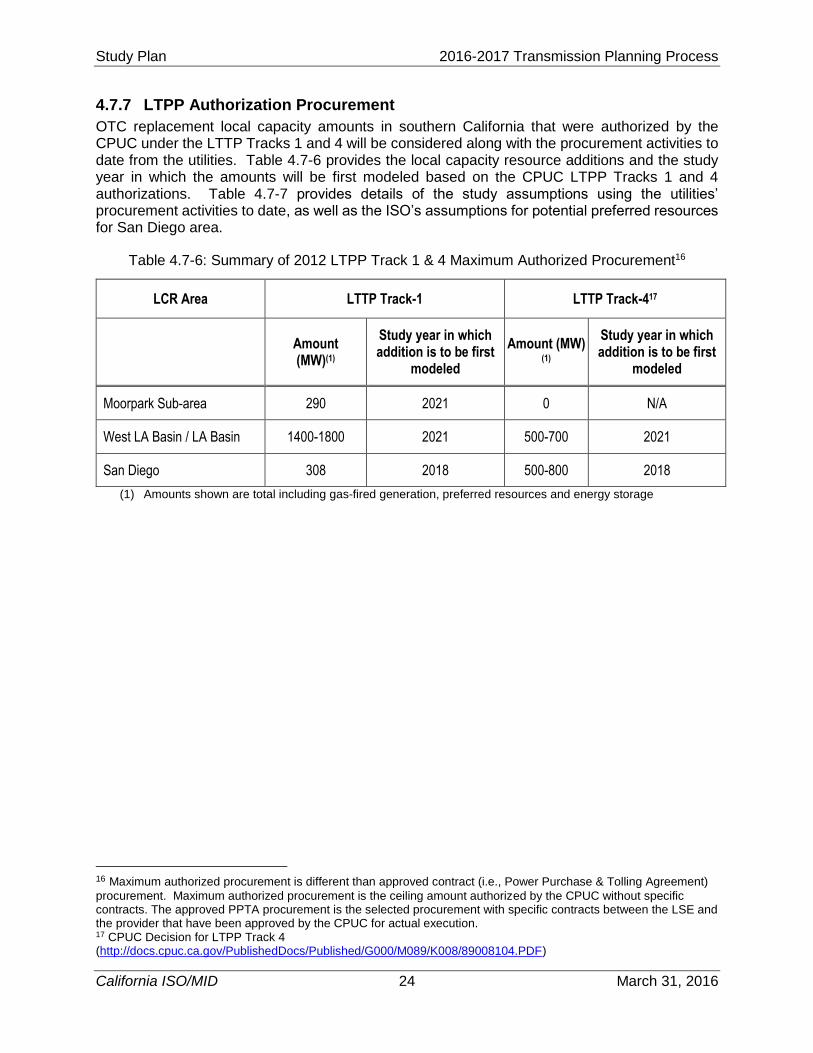
4.7.7 LTPP Authorization Procurement
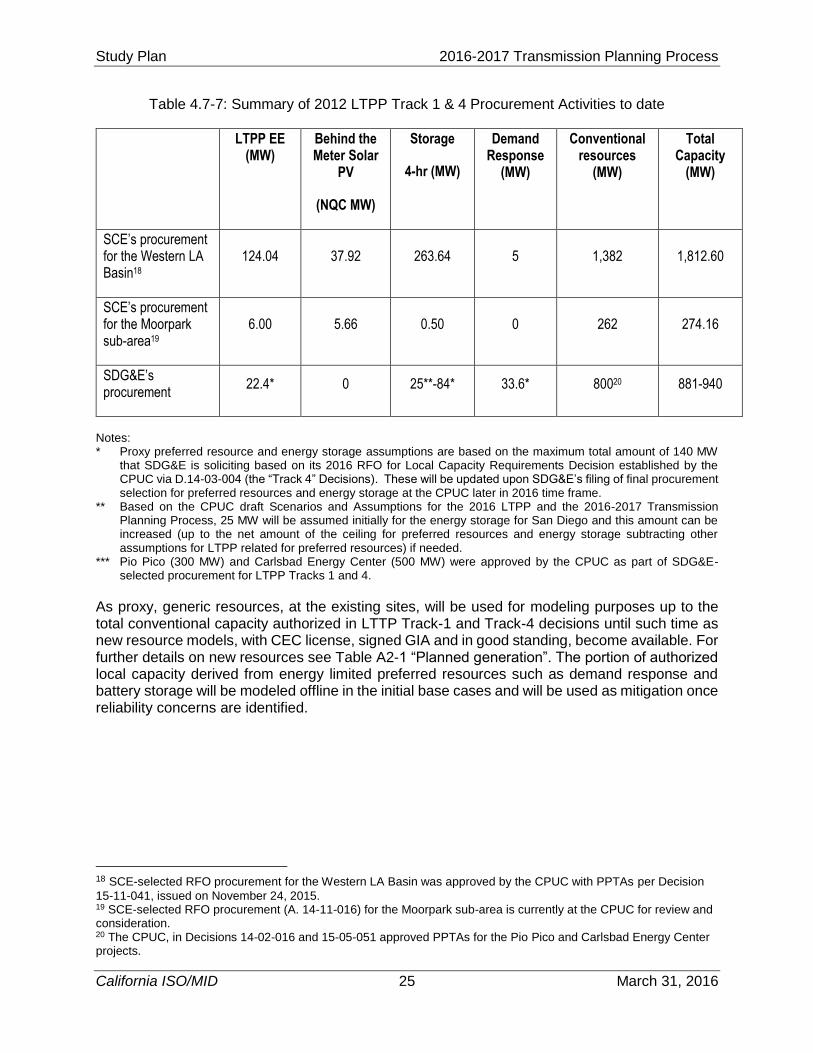
OTC replacement local capacity amounts in southern California that were authorized by the CPUC under the LTTP Tracks 1 and 4 will be considered along with the procurement activities to date from the utilities. Table 4.7-6 provides the local capacity resource additions and the study year in which the amounts will be first modeled based on the CPUC LTPP Tracks 1 and 4 authorizations. Table 4.7-7 provides details of the study assumptions using the utilities’ procurement activities to date, as well as the ISO’s assumptions for potential preferred resources for San Diego area.
Table 4.7-6: Summary of 2012 LTPP Track 1 & 4 Maximum Authorized Procurement16
LCR Area LTTP Track-1 LTTP Track-417
Amount (MW)(1)
Study year in which addition is to be first
modeled
Amount (MW)
(1)
Study year in which addition is to be first
modeled
Moorpark Sub-area 290 2021 0 N/A
West LA Basin / LA Basin 1400-1800 2021 500-700 2021
San Diego 308 2018 500-800 2018
(1) Amounts shown are total including gas-fired generation, preferred resources and energy storage
16 Maximum authorized procurement is different than approved contract (i.e., Power Purchase & Tolling Agreement)
procurement. Maximum authorized procurement is the ceiling amount authorized by the CPUC without specific contracts. The approved PPTA procurement is the selected procurement with specific contracts between the LSE and the provider that have been approved by the CPUC for actual execution. 17 CPUC Decision for LTPP Track 4 (http://docs.cpuc.ca.gov/PublishedDocs/Published/G000/M089/K008/89008104.PDF)
Study Plan 2016-2017 Transmission Planning Process
California ISO/MID 25 March 31, 2016
Table 4.7-7: Summary of 2012 LTPP Track 1 & 4 Procurement Activities to date
LTPP EE (MW)
Behind the Meter Solar
PV
(NQC MW)
Storage
4-hr (MW)
Demand Response
(MW)
Conventional resources
(MW)
Total Capacity
(MW)
SCE’s procurement for the Western LA Basin18
124.04 37.92 263.64 5 1,382 1,812.60
SCE’s procurement for the Moorpark sub-area19
6.00 5.66 0.50 0 262 274.16
SDG&E’s procurement
22.4* 0 25**-84* 33.6* 80020 881-940
Notes: * Proxy preferred resource and energy storage assumptions are based on the maximum total amount of 140 MW
that SDG&E is soliciting based on its 2016 RFO for Local Capacity Requirements Decision established by the CPUC via D.14-03-004 (the “Track 4” Decisions). These will be updated upon SDG&E’s filing of final procurement selection for preferred resources and energy storage at the CPUC later in 2016 time frame.
** Based on the CPUC draft Scenarios and Assumptions for the 2016 LTPP and the 2016-2017 Transmission Planning Process, 25 MW will be assumed initially for the energy storage for San Diego and this amount can be increased (up to the net amount of the ceiling for preferred resources and energy storage subtracting other assumptions for LTPP related for preferred resources) if needed.
*** Pio Pico (300 MW) and Carlsbad Energy Center (500 MW) were approved by the CPUC as part of SDG&E-selected procurement for LTPP Tracks 1 and 4.
As proxy, generic resources, at the existing sites, will be used for modeling purposes up to the total conventional capacity authorized in LTTP Track-1 and Track-4 decisions until such time as new resource models, with CEC license, signed GIA and in good standing, become available. For further details on new resources see Table A2-1 “Planned generation”. The portion of authorized local capacity derived from energy limited preferred resources such as demand response and battery storage will be modeled offline in the initial base cases and will be used as mitigation once reliability concerns are identified.
18 SCE-selected RFO procurement for the Western LA Basin was approved by the CPUC with PPTAs per Decision
15-11-041, issued on November 24, 2015. 19 SCE-selected RFO procurement (A. 14-11-016) for the Moorpark sub-area is currently at the CPUC for review and consideration. 20 The CPUC, in Decisions 14-02-016 and 15-05-051 approved PPTAs for the Pio Pico and Carlsbad Energy Center projects.
Study Plan 2016-2017 Transmission Planning Process
California ISO/MID 26 March 31, 2016
4.8 Preferred Resources According to tariff Section 24.3.3(a), the ISO sent a market notice to interested parties seeking suggestions about demand response programs and generation or non-transmission alternatives that should be included as assumptions in the study plan. In response, the ISO received demand response and energy storage information for consideration in planning studies from the following:
California Public Utilities Commission (CPUC)
Pacific Gas & Electric (PG&E)
CPUC staff made the following recommendations with regard to demand response (DR) assumptions appropriate for use in the 2016-17 TPP studies.
1. Demand response assumptions used in the TPP should reflect the guidelines described
in the CPUC’s ruling on standardized planning assumptions and scenarios.
2. The TPP studies should use the allocations of demand response capacity to busbar
provided by the IOUs.
3. The TPP studies should count any new demand response capacity specifically
contracted by the IOUs, and approved by the CPUC, to fulfill local capacity needs and
other demand response procurement mechanisms.
4. The CAISO should continue to participate in the CPUC’s Demand Response rulemaking
to better inform program development and future policy direction.
PG&E provided a bus-level model of PG&E’s demand response (DR) programs for the inclusion in the Unified Planning Assumptions and 2016-2017 study plan.
4.8.1 Methodology
The ISO issued a paper21 on September 4, 2013, in which it presented a methodology to support California’s policy emphasis on the use of preferred resources – specifically energy efficiency, demand response, renewable generating resources and energy storage – by considering how such resources can constitute non-conventional solutions to meet local area needs that otherwise would require new transmission or conventional generation infrastructure. The general application for this methodology is in grid area situations where a non-conventional alternative such as demand response or some mix of preferred resources could be selected as the preferred solution in the ISO’s transmission plan as an alternative to the conventional transmission or generation solution.
In previous planning cycles, the ISO applied a variation of this new approach in the LA Basin and San Diego areas to evaluate the effectiveness of preferred resource scenarios developed by SCE as part of the procurement process to fill the authorized local capacity for the LA Basin and Moor Park areas. In addition to these efforts focused on the overall LA Basin and San Diego needs, the ISO also made further progress in integrating preferred resources into its reliability analysis focusing on other areas where reliability issues were identified.
As in the 2015-2016 planning cycle, reliability assessments in the current planning cycle will consider a range of existing demand response amounts as potential mitigations to transmission constraints. The reliability studies will also incorporate the incremental uncommitted energy efficiency amounts as projected by the CEC, distributed generation based on the CPUC
21 http://www.caiso.com/Documents/Paper-Non-ConventionalAlternatives-2013-2014TransmissionPlanningProcess.pdf
Study Plan 2016-2017 Transmission Planning Process
California ISO/MID 27 March 31, 2016
Commercial-Interest RPS Portfolio and a mix of proxy preferred resources including energy storage based on the CPUC LTPP 2012 local capacity authorization. These incremental preferred resource amounts are in addition to the base amounts of energy efficiency, demand response and “behind the meter” distributed or self-generation that is embedded in the CEC load forecast.
For each planning area, reliability assessments will be initially performed using preferred resources other than DR to identify reliability concerns in the area. If reliability concerns are identified in the initial assessment, additional rounds of assessments will be performed using potentially available demand response and energy storage to determine whether these resources are a potential solution. If preferred resources are identified as a potential mitigation, a second step - a preferred resource analysis as described in September 4, 2013 ISO paper - may then be performed, if considered necessary given the mix of resources in the particular area, to account for the specific characteristic of each resource including diurnal variation in the case of solar DG and use or energy limitation in the case of demand response and energy storage.
4.8.2 Demand Response
In reliability studies, only capacity from DR programs that can be relied upon to mitigate “first contingencies”, as described in the 2012 LTPP Track 4 planning assumptions, are counted. DR that can be relied upon to mitigate post first contingencies in local reliability studies participates in, and is dispatched from, the ISO market in sufficiently less time than 30 minutes22 from when it is called upon.
There is uncertainty as to what amount of DR can be projected to meet this criteria within the TPP planning horizon given that few current programs meet this criteria and the current DR Rulemaking R.13-09-011 expects to restructure DR programs to better meet ISO operational needs and has already produced one major policy decision towards that goal.23 The rulemaking is expected to issue additional decisions that enable demand response to be more useful for grid needs, but ISO has several tasks it must complete in order to make integration of DR possible. The 2012 LTPP Track 4 planning assumptions estimated that approximately 200 MW of DR would be available to mitigate first contingencies within the combined LA Basin and San Diego local reliability areas by 2022. The 2016 LTPP planning assumptions, however, estimates that approximately 953 MW would be available to mitigate post first contingencies within the combined LA Basin and San Diego local reliability areas by 2024. The CPUC staff developed this latter estimated projections for 2026 time frame by screening DR projections in the Load Impact reports for programs that deliver load reductions in 30 minutes or less from customer notification. The table below identifies for each IOU the programs and capacities that meet this criteria. Currently, SCE has indicated that 475 MW of DR in SCE’s service territory meets the 20-minute response time for mitigating contingency reliability concerns.
22 The 30 minute requirement is based on meeting NERC Standard TOP-004-02. Meeting this requirement implies that programs may need to respond in 20 minutes, from customer notification to load reduction, in order to allow for other transmission operator activities in dealing with a contingency event. 23 Commission Decision 14-03-026 approved the bifurcation of DR programs into two categories: Supply DR (DR that is integrated into ISO markets and dispatched when and where needed) and Load-Modifying DR (DR that is not integrated into ISO markets. This decision determined that bifurcation will occur by 2017.
Study Plan 2016-2017 Transmission Planning Process
California ISO/MID 28 March 31, 2016
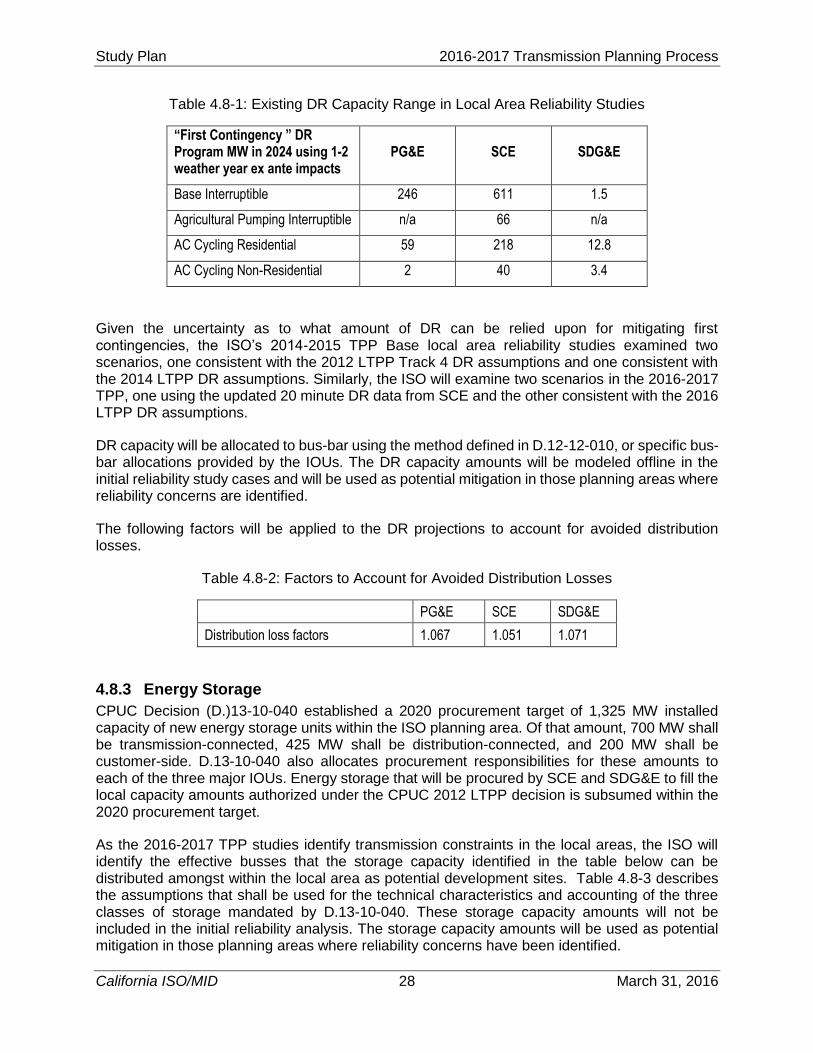
Table 4.8-1: Existing DR Capacity Range in Local Area Reliability Studies
“First Contingency ” DR Program MW in 2024 using 1-2 weather year ex ante impacts
PG&E SCE SDG&E
Base Interruptible 246 611 1.5
Agricultural Pumping Interruptible n/a 66 n/a
AC Cycling Residential 59 218 12.8
AC Cycling Non-Residential 2 40 3.4
Given the uncertainty as to what amount of DR can be relied upon for mitigating first contingencies, the ISO’s 2014-2015 TPP Base local area reliability studies examined two scenarios, one consistent with the 2012 LTPP Track 4 DR assumptions and one consistent with the 2014 LTPP DR assumptions. Similarly, the ISO will examine two scenarios in the 2016-2017 TPP, one using the updated 20 minute DR data from SCE and the other consistent with the 2016 LTPP DR assumptions.
DR capacity will be allocated to bus-bar using the method defined in D.12-12-010, or specific bus-bar allocations provided by the IOUs. The DR capacity amounts will be modeled offline in the initial reliability study cases and will be used as potential mitigation in those planning areas where reliability concerns are identified.
The following factors will be applied to the DR projections to account for avoided distribution losses.
Table 4.8-2: Factors to Account for Avoided Distribution Losses
PG&E SCE SDG&E
Distribution loss factors 1.067 1.051 1.071
4.8.3 Energy Storage
CPUC Decision (D.)13-10-040 established a 2020 procurement target of 1,325 MW installed capacity of new energy storage units within the ISO planning area. Of that amount, 700 MW shall be transmission-connected, 425 MW shall be distribution-connected, and 200 MW shall be customer-side. D.13-10-040 also allocates procurement responsibilities for these amounts to each of the three major IOUs. Energy storage that will be procured by SCE and SDG&E to fill the local capacity amounts authorized under the CPUC 2012 LTPP decision is subsumed within the 2020 procurement target.
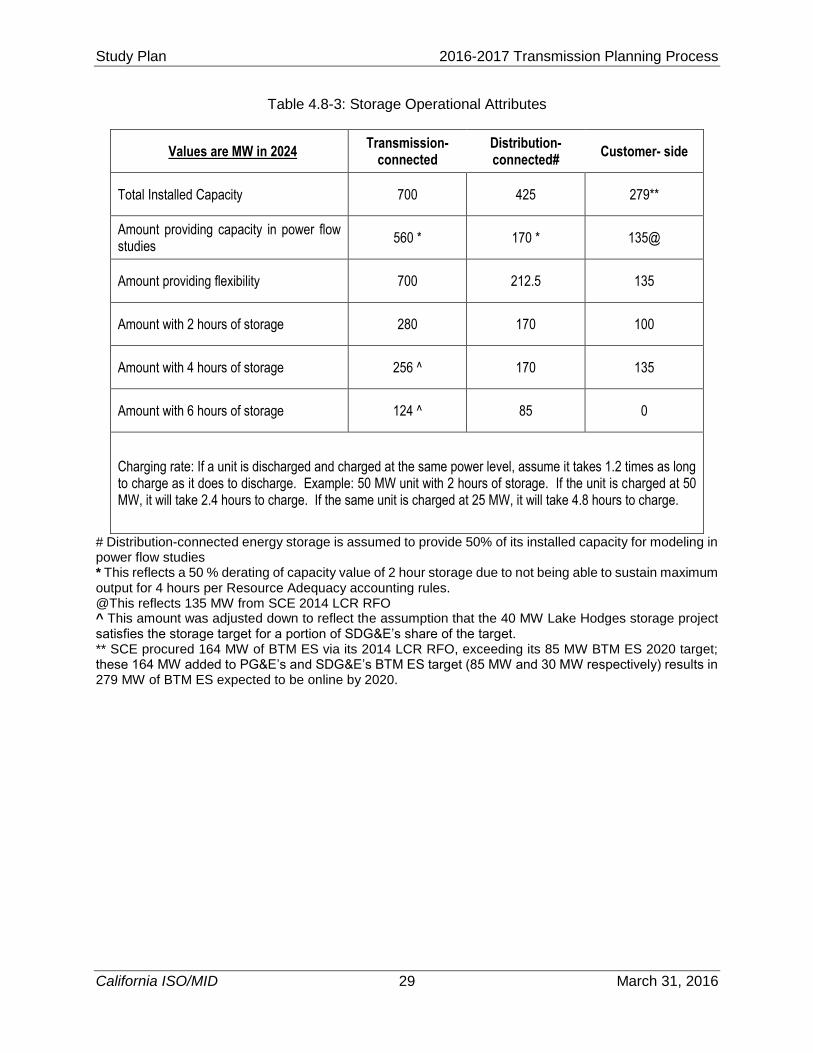
As the 2016-2017 TPP studies identify transmission constraints in the local areas, the ISO will identify the effective busses that the storage capacity identified in the table below can be distributed amongst within the local area as potential development sites. Table 4.8-3 describes the assumptions that shall be used for the technical characteristics and accounting of the three classes of storage mandated by D.13-10-040. These storage capacity amounts will not be included in the initial reliability analysis. The storage capacity amounts will be used as potential mitigation in those planning areas where reliability concerns have been identified.
Study Plan 2016-2017 Transmission Planning Process
California ISO/MID 29 March 31, 2016
Table 4.8-3: Storage Operational Attributes
Values are MW in 2024 Transmission-
connected Distribution- connected#
Customer- side
Total Installed Capacity 700 425 279**
Amount providing capacity in power flow studies
560 * 170 * 135@
Amount providing flexibility 700 212.5 135
Amount with 2 hours of storage 280 170 100
Amount with 4 hours of storage 256 ^ 170 135
Amount with 6 hours of storage 124 ^ 85 0
Charging rate: If a unit is discharged and charged at the same power level, assume it takes 1.2 times as long to charge as it does to discharge. Example: 50 MW unit with 2 hours of storage. If the unit is charged at 50 MW, it will take 2.4 hours to charge. If the same unit is charged at 25 MW, it will take 4.8 hours to charge.
# Distribution-connected energy storage is assumed to provide 50% of its installed capacity for modeling in power flow studies * This reflects a 50 % derating of capacity value of 2 hour storage due to not being able to sustain maximum output for 4 hours per Resource Adequacy accounting rules. @This reflects 135 MW from SCE 2014 LCR RFO ^ This amount was adjusted down to reflect the assumption that the 40 MW Lake Hodges storage project satisfies the storage target for a portion of SDG&E’s share of the target. ** SCE procured 164 MW of BTM ES via its 2014 LCR RFO, exceeding its 85 MW BTM ES 2020 target; these 164 MW added to PG&E’s and SDG&E’s BTM ES target (85 MW and 30 MW respectively) results in 279 MW of BTM ES expected to be online by 2020.
Study Plan 2016-2017 Transmission Planning Process
California ISO/MID 30 March 31, 2016
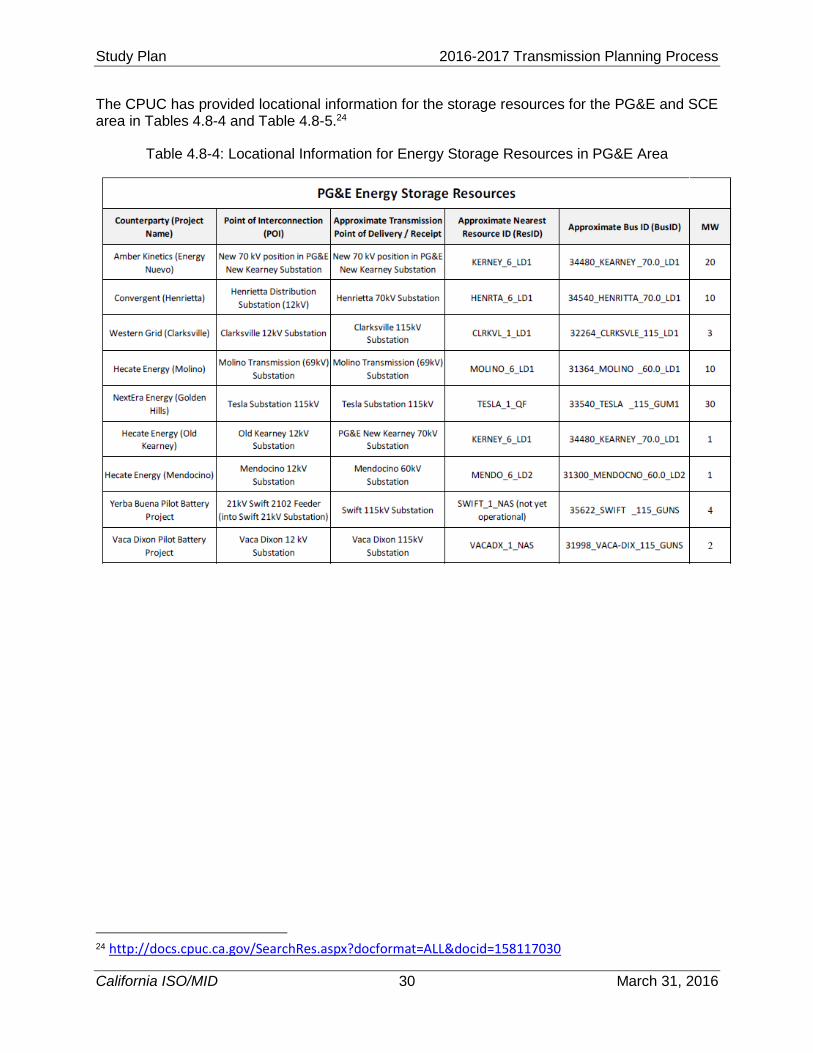
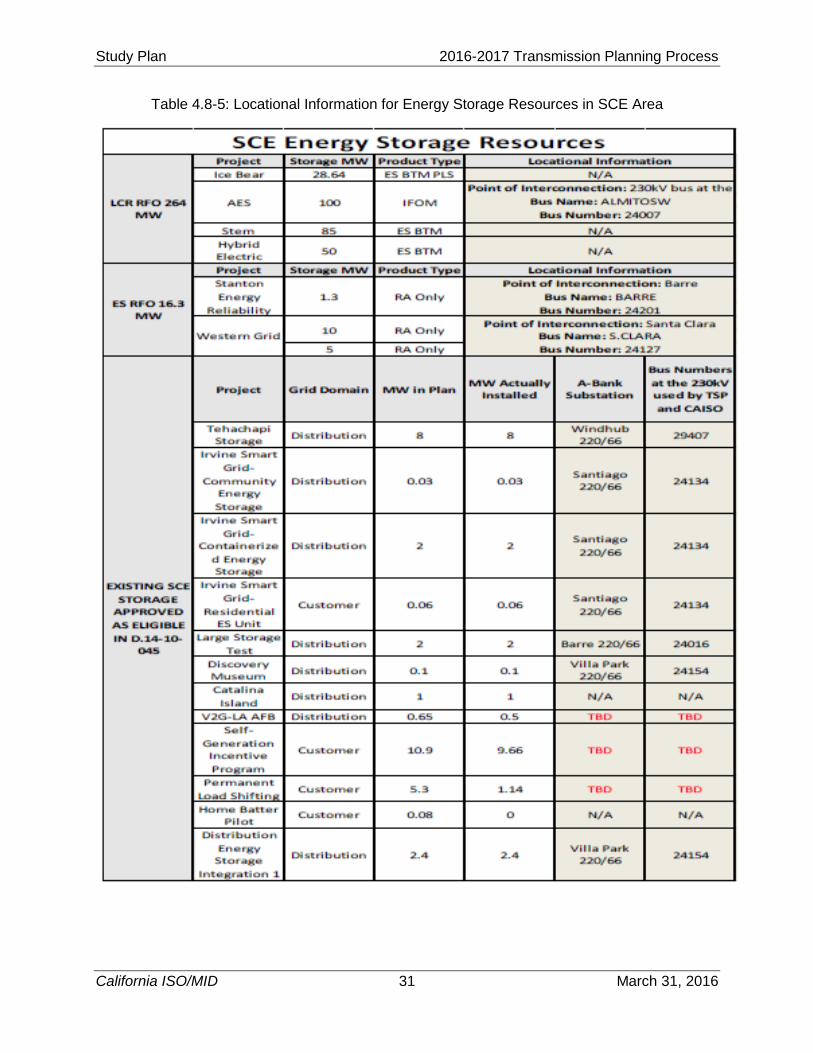
The CPUC has provided locational information for the storage resources for the PG&E and SCE area in Tables 4.8-4 and Table 4.8-5.24
Table 4.8-4: Locational Information for Energy Storage Resources in PG&E Area
24 http://docs.cpuc.ca.gov/SearchRes.aspx?docformat=ALL&docid=158117030
Study Plan 2016-2017 Transmission Planning Process
California ISO/MID 31 March 31, 2016
Table 4.8-5: Locational Information for Energy Storage Resources in SCE Area
Study Plan 2016-2017 Transmission Planning Process
California ISO/MID 32 March 31, 2016
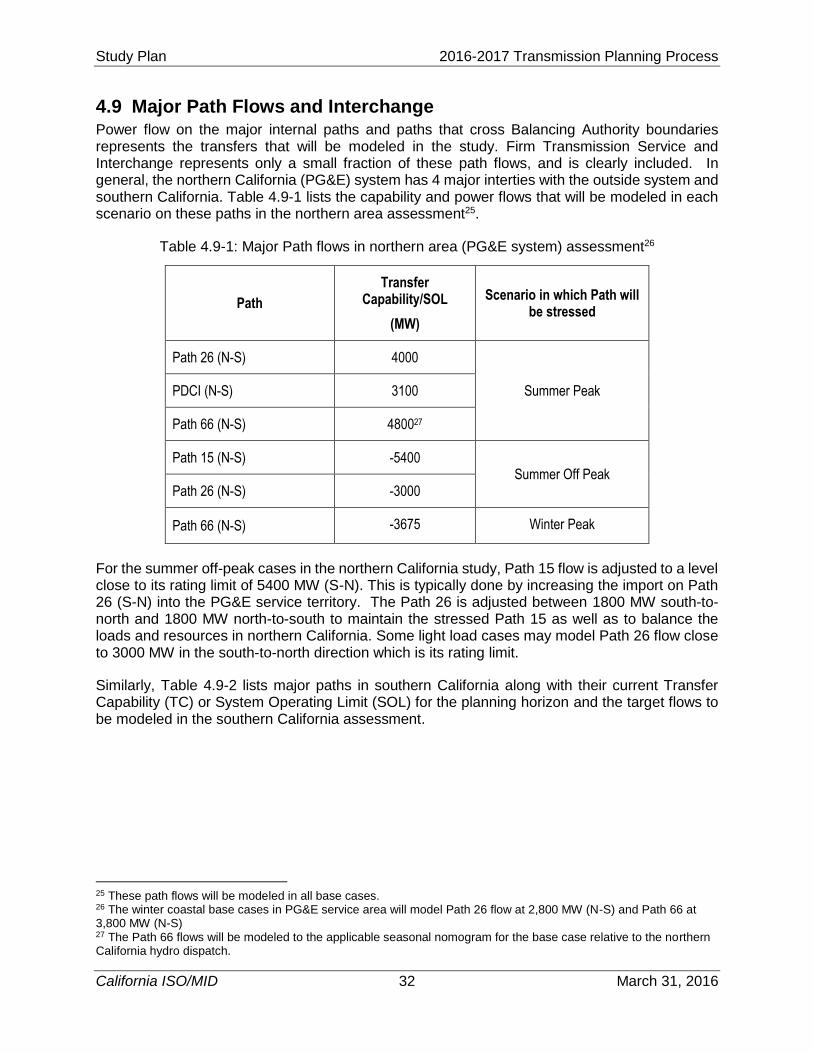
4.9 Major Path Flows and Interchange Power flow on the major internal paths and paths that cross Balancing Authority boundaries represents the transfers that will be modeled in the study. Firm Transmission Service and Interchange represents only a small fraction of these path flows, and is clearly included. In general, the northern California (PG&E) system has 4 major interties with the outside system and southern California. Table 4.9-1 lists the capability and power flows that will be modeled in each scenario on these paths in the northern area assessment25.
Table 4.9-1: Major Path flows in northern area (PG&E system) assessment26
Path
Transfer Capability/SOL
(MW)
Scenario in which Path will be stressed
Path 26 (N-S) 4000
Summer Peak PDCI (N-S) 3100
Path 66 (N-S) 480027
Path 15 (N-S) -5400 Summer Off Peak
Path 26 (N-S) -3000
Path 66 (N-S) -3675 Winter Peak
For the summer off-peak cases in the northern California study, Path 15 flow is adjusted to a level close to its rating limit of 5400 MW (S-N). This is typically done by increasing the import on Path 26 (S-N) into the PG&E service territory. The Path 26 is adjusted between 1800 MW south-to-north and 1800 MW north-to-south to maintain the stressed Path 15 as well as to balance the loads and resources in northern California. Some light load cases may model Path 26 flow close to 3000 MW in the south-to-north direction which is its rating limit.
Similarly, Table 4.9-2 lists major paths in southern California along with their current Transfer Capability (TC) or System Operating Limit (SOL) for the planning horizon and the target flows to be modeled in the southern California assessment.
25 These path flows will be modeled in all base cases. 26 The winter coastal base cases in PG&E service area will model Path 26 flow at 2,800 MW (N-S) and Path 66 at 3,800 MW (N-S) 27 The Path 66 flows will be modeled to the applicable seasonal nomogram for the base case relative to the northern California hydro dispatch.
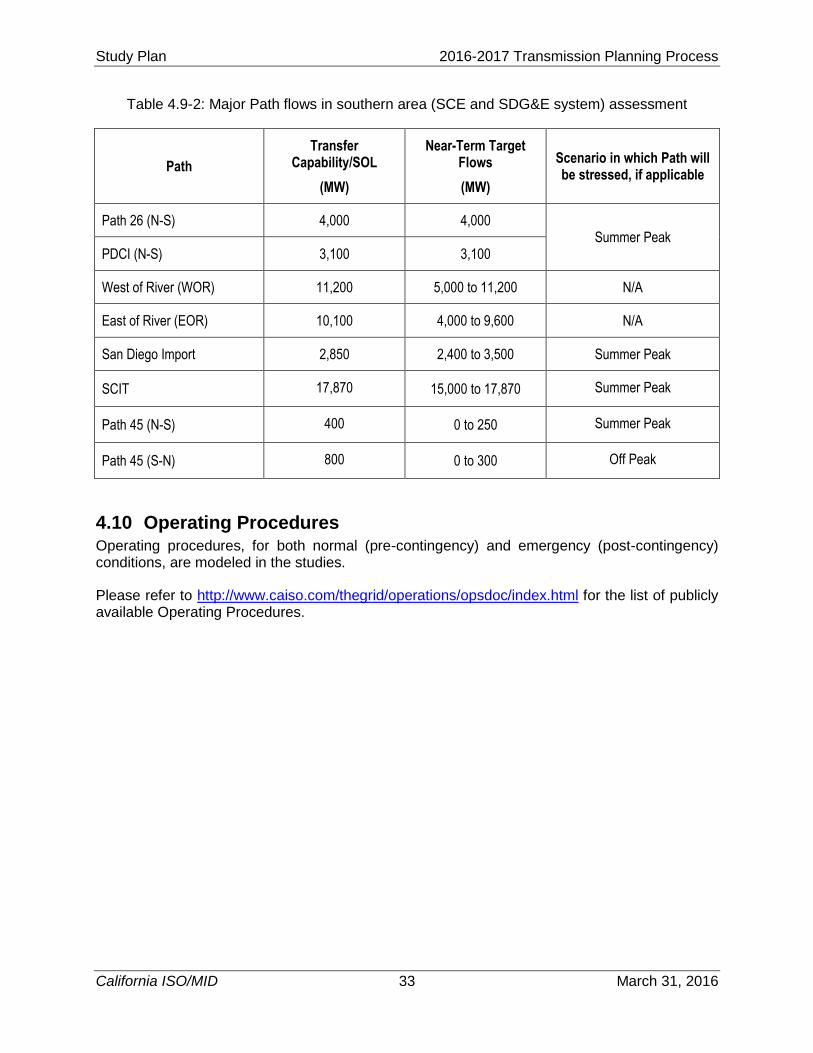
Study Plan 2016-2017 Transmission Planning Process
California ISO/MID 33 March 31, 2016
Table 4.9-2: Major Path flows in southern area (SCE and SDG&E system) assessment
Path
Transfer Capability/SOL
(MW)
Near-Term Target Flows
(MW)
Scenario in which Path will be stressed, if applicable
Path 26 (N-S) 4,000 4,000 Summer Peak
PDCI (N-S) 3,100 3,100
West of River (WOR) 11,200 5,000 to 11,200 N/A
East of River (EOR) 10,100 4,000 to 9,600 N/A
San Diego Import 2,850 2,400 to 3,500 Summer Peak
SCIT 17,870 15,000 to 17,870 Summer Peak
Path 45 (N-S) 400 0 to 250 Summer Peak
Path 45 (S-N) 800 0 to 300 Off Peak
4.10 Operating Procedures Operating procedures, for both normal (pre-contingency) and emergency (post-contingency) conditions, are modeled in the studies.
Please refer to http://www.caiso.com/thegrid/operations/opsdoc/index.html for the list of publicly available Operating Procedures.
Study Plan 2016-2017 Transmission Planning Process
California ISO/MID 34 March 31, 2016
4.11 Study Scenarios
4.11.1 Base Scenarios
The main study scenarios cover critical system conditions driven by several factors such as:
Generation:
Existing and future generation resources are modeled and dispatched to reliably operate the system under stressed system conditions. More details regarding generation modeling is provided in section 4.7.
Demand Level:
Since most of the ISO footprint is a summer peaking area, summer peak conditions will be evaluated in all study areas. However, winter peak, spring off-peak, summer off-peak or summer partial-peak will also be studied for areas in where such scenarios may result in more stress on system conditions. Examples of these areas are the coastal sub-transmission systems in the PG&E service area (e.g. Humboldt, North Coast/North Bay, San Francisco, Peninsula and Central Coast), which will be studied for both the summer and winter peak conditions. Table 4.11-1 lists the scenarios that will be conducted in this planning cycle.
Path flows:
For local area studies, transfers on import and monitored internal paths will be modeled as required to serve load in conjunction with internal generation resources. For bulk system studies, major import and internal transfer paths will be stressed as described in Section 4.9 to assess their FAC-013-2 Transfer Capability or FAC-014-2 System Operating Limits (SOL) for the planning horizon, as applicable.
The base scenarios for the reliability analysis are provided in Table 4.11-1
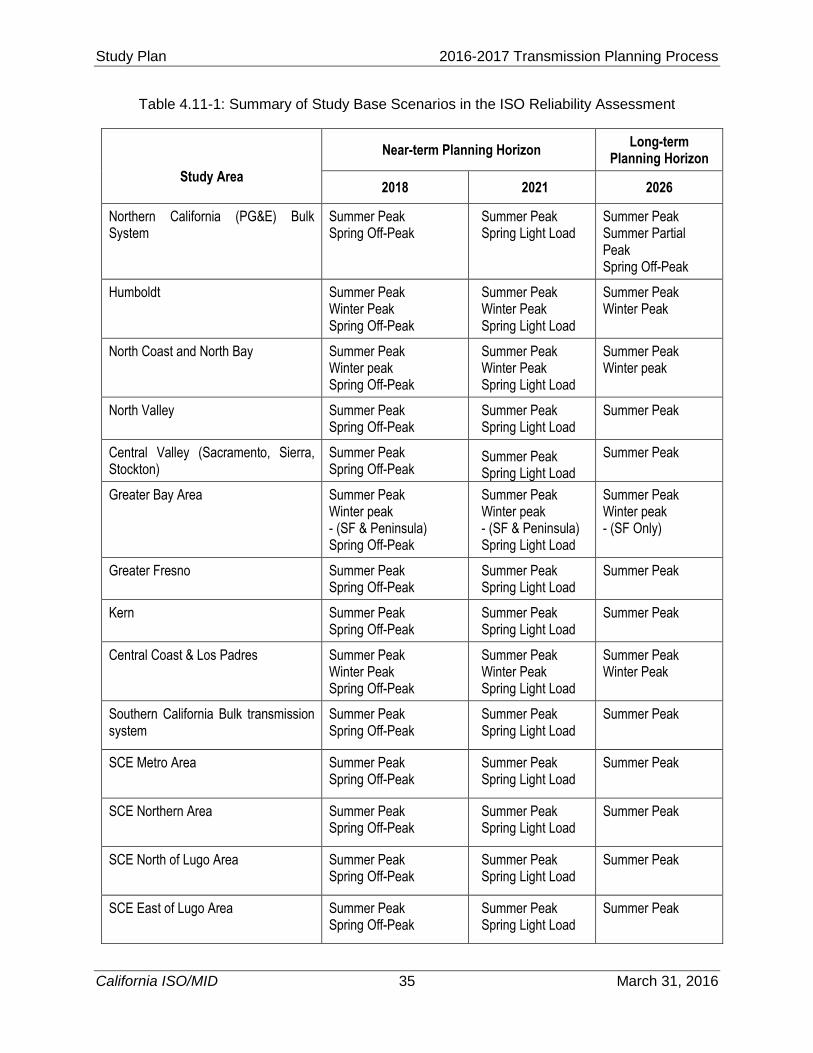
Study Plan 2016-2017 Transmission Planning Process
California ISO/MID 35 March 31, 2016
Table 4.11-1: Summary of Study Base Scenarios in the ISO Reliability Assessment
Study Area
Near-term Planning Horizon Long-term
Planning Horizon
2018 2021 2026
Northern California (PG&E) Bulk System
Summer Peak Spring Off-Peak
Summer Peak Spring Light Load
Summer Peak Summer Partial Peak Spring Off-Peak
Humboldt Summer Peak Winter Peak Spring Off-Peak
Summer Peak Winter Peak Spring Light Load
Summer Peak Winter Peak
North Coast and North Bay Summer Peak Winter peak Spring Off-Peak
Summer Peak Winter Peak Spring Light Load
Summer Peak Winter peak
North Valley Summer Peak Spring Off-Peak
Summer Peak Spring Light Load
Summer Peak
Central Valley (Sacramento, Sierra, Stockton)
Summer Peak Spring Off-Peak
Summer Peak Spring Light Load
Summer Peak
Greater Bay Area Summer Peak Winter peak - (SF & Peninsula) Spring Off-Peak
Summer Peak Winter peak - (SF & Peninsula) Spring Light Load
Summer Peak Winter peak - (SF Only)
Greater Fresno Summer Peak Spring Off-Peak
Summer Peak Spring Light Load
Summer Peak
Kern Summer Peak Spring Off-Peak
Summer Peak Spring Light Load
Summer Peak
Central Coast & Los Padres Summer Peak Winter Peak Spring Off-Peak
Summer Peak Winter Peak Spring Light Load
Summer Peak Winter Peak
Southern California Bulk transmission system
Summer Peak Spring Off-Peak
Summer Peak Spring Light Load
Summer Peak
SCE Metro Area Summer Peak Spring Off-Peak
Summer Peak Spring Light Load
Summer Peak
SCE Northern Area Summer Peak Spring Off-Peak
Summer Peak Spring Light Load
Summer Peak
SCE North of Lugo Area Summer Peak Spring Off-Peak
Summer Peak Spring Light Load
Summer Peak
SCE East of Lugo Area Summer Peak Spring Off-Peak
Summer Peak Spring Light Load
Summer Peak
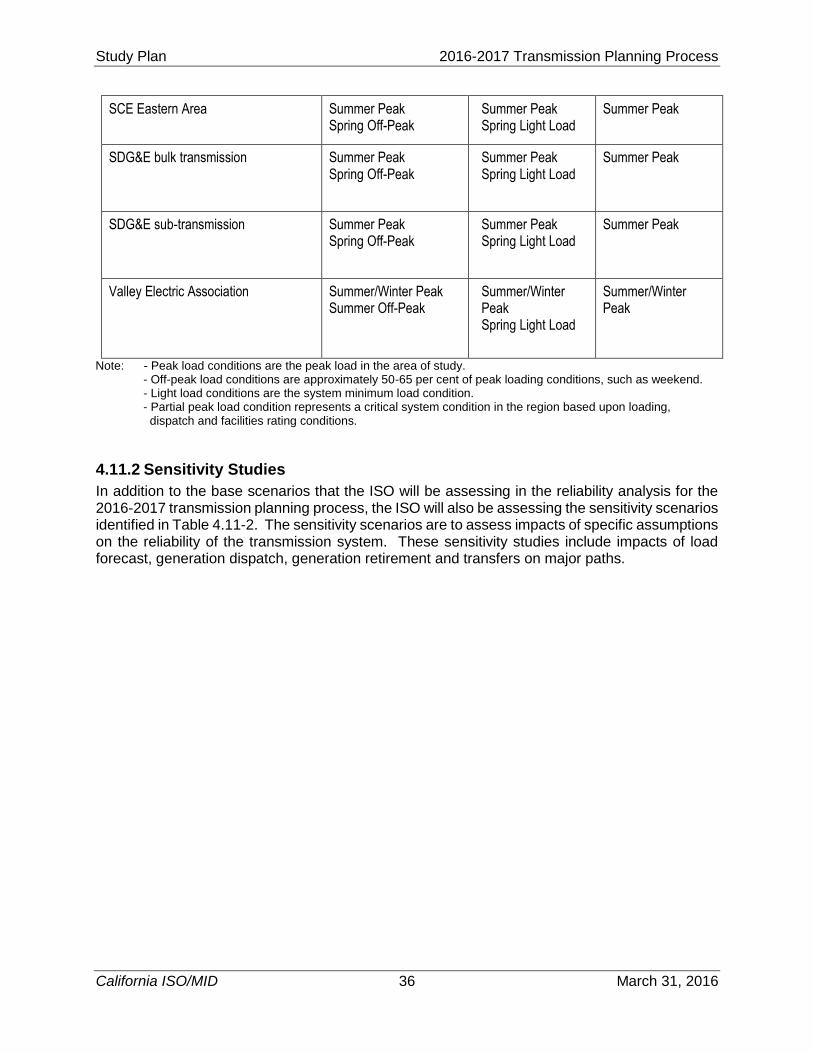
Study Plan 2016-2017 Transmission Planning Process
California ISO/MID 36 March 31, 2016
SCE Eastern Area Summer Peak Spring Off-Peak
Summer Peak Spring Light Load
Summer Peak
SDG&E bulk transmission Summer Peak Spring Off-Peak
Summer Peak Spring Light Load
Summer Peak
SDG&E sub-transmission Summer Peak Spring Off-Peak
Summer Peak Spring Light Load
Summer Peak
Valley Electric Association Summer/Winter Peak Summer Off-Peak
Summer/Winter Peak Spring Light Load
Summer/Winter Peak
Note: - Peak load conditions are the peak load in the area of study. - Off-peak load conditions are approximately 50-65 per cent of peak loading conditions, such as weekend. - Light load conditions are the system minimum load condition. - Partial peak load condition represents a critical system condition in the region based upon loading, dispatch and facilities rating conditions.
4.11.2 Sensitivity Studies
In addition to the base scenarios that the ISO will be assessing in the reliability analysis for the 2016-2017 transmission planning process, the ISO will also be assessing the sensitivity scenarios identified in Table 4.11-2. The sensitivity scenarios are to assess impacts of specific assumptions on the reliability of the transmission system. These sensitivity studies include impacts of load forecast, generation dispatch, generation retirement and transfers on major paths.
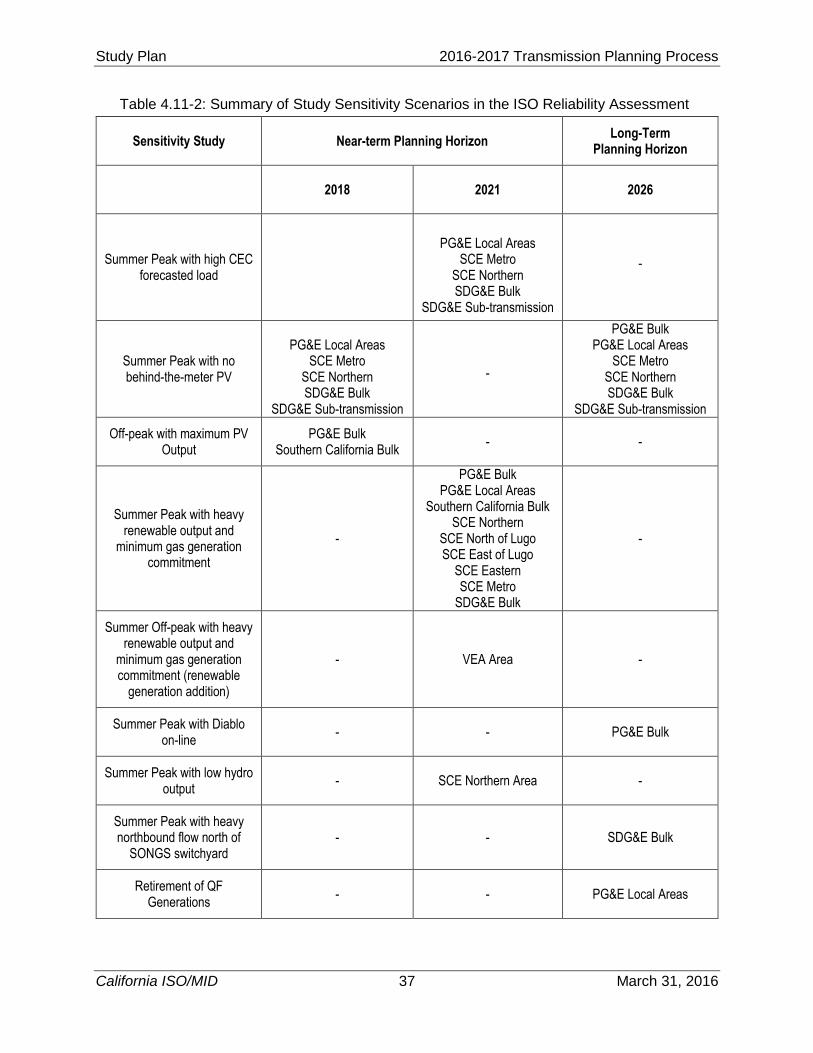
Study Plan 2016-2017 Transmission Planning Process
California ISO/MID 37 March 31, 2016
Table 4.11-2: Summary of Study Sensitivity Scenarios in the ISO Reliability Assessment
Sensitivity Study Near-term Planning Horizon Long-Term
Planning Horizon
2018 2021 2026
Summer Peak with high CEC forecasted load
PG&E Local Areas
SCE Metro SCE Northern SDG&E Bulk
SDG&E Sub-transmission
-
Summer Peak with no behind-the-meter PV
PG&E Local Areas
SCE Metro SCE Northern SDG&E Bulk
SDG&E Sub-transmission
-
PG&E Bulk PG&E Local Areas
SCE Metro SCE Northern SDG&E Bulk
SDG&E Sub-transmission
Off-peak with maximum PV Output
PG&E Bulk Southern California Bulk
- -
Summer Peak with heavy renewable output and
minimum gas generation commitment
-
PG&E Bulk PG&E Local Areas
Southern California Bulk SCE Northern
SCE North of Lugo SCE East of Lugo
SCE Eastern SCE Metro
SDG&E Bulk
-
Summer Off-peak with heavy renewable output and
minimum gas generation commitment (renewable
generation addition)
- VEA Area -
Summer Peak with Diablo on-line
- - PG&E Bulk
Summer Peak with low hydro output
- SCE Northern Area -
Summer Peak with heavy northbound flow north of
SONGS switchyard - - SDG&E Bulk
Retirement of QF Generations
- - PG&E Local Areas
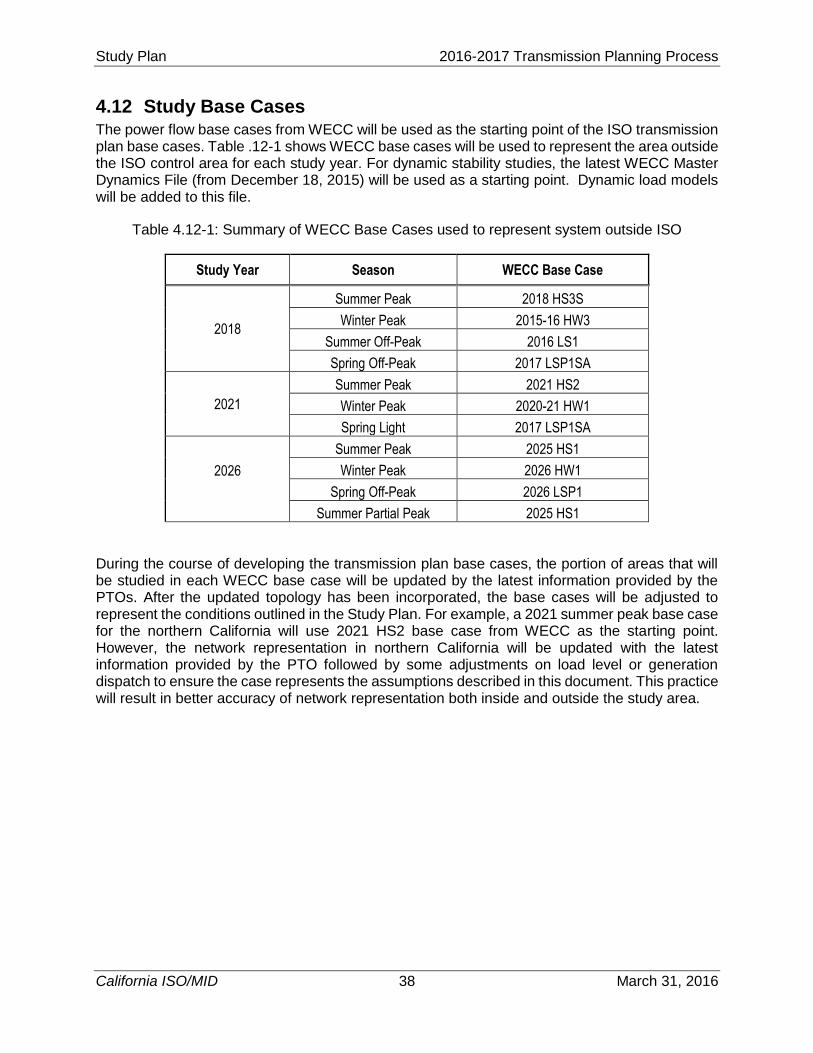
Study Plan 2016-2017 Transmission Planning Process
California ISO/MID 38 March 31, 2016
4.12 Study Base Cases The power flow base cases from WECC will be used as the starting point of the ISO transmission plan base cases. Table .12-1 shows WECC base cases will be used to represent the area outside the ISO control area for each study year. For dynamic stability studies, the latest WECC Master Dynamics File (from December 18, 2015) will be used as a starting point. Dynamic load models will be added to this file.
Table 4.12-1: Summary of WECC Base Cases used to represent system outside ISO
Study Year Season WECC Base Case
2018
Summer Peak 2018 HS3S
Winter Peak 2015-16 HW3
Summer Off-Peak 2016 LS1
Spring Off-Peak 2017 LSP1SA
2021
Summer Peak 2021 HS2
Winter Peak 2020-21 HW1
Spring Light 2017 LSP1SA
2026
Summer Peak 2025 HS1
Winter Peak 2026 HW1
Spring Off-Peak 2026 LSP1
Summer Partial Peak 2025 HS1
During the course of developing the transmission plan base cases, the portion of areas that will be studied in each WECC base case will be updated by the latest information provided by the PTOs. After the updated topology has been incorporated, the base cases will be adjusted to represent the conditions outlined in the Study Plan. For example, a 2021 summer peak base case for the northern California will use 2021 HS2 base case from WECC as the starting point. However, the network representation in northern California will be updated with the latest information provided by the PTO followed by some adjustments on load level or generation dispatch to ensure the case represents the assumptions described in this document. This practice will result in better accuracy of network representation both inside and outside the study area.
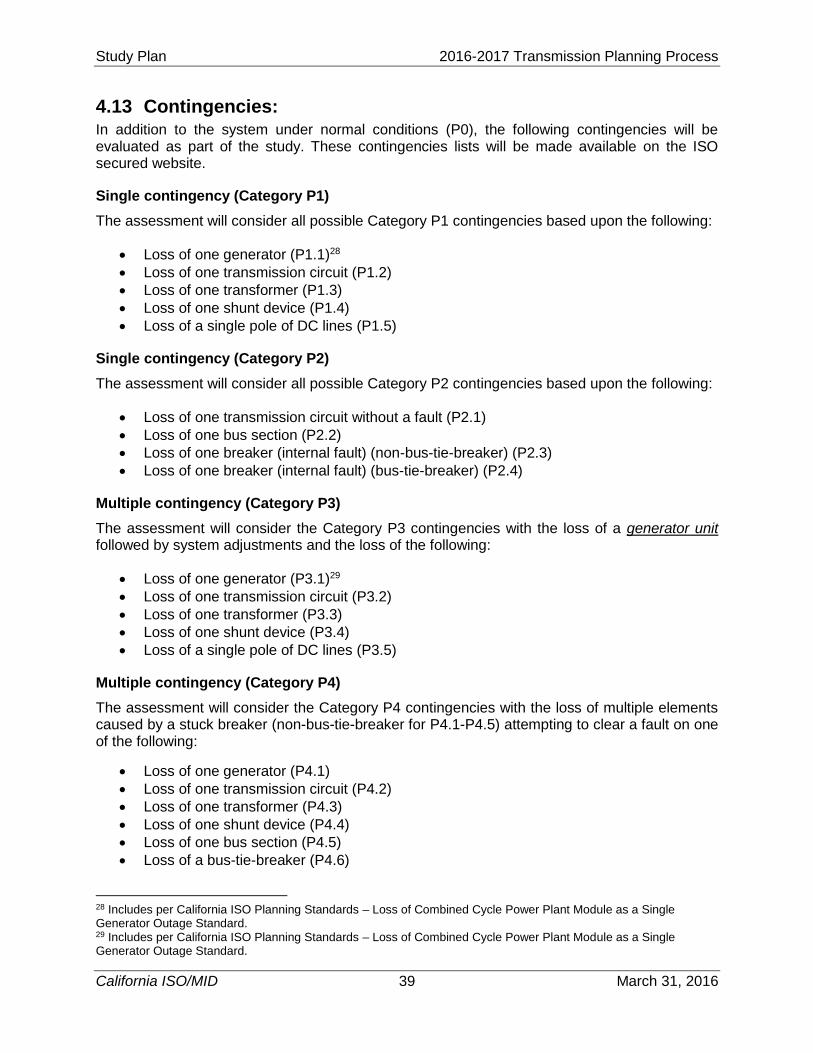
Study Plan 2016-2017 Transmission Planning Process
California ISO/MID 39 March 31, 2016
4.13 Contingencies: In addition to the system under normal conditions (P0), the following contingencies will be evaluated as part of the study. These contingencies lists will be made available on the ISO secured website.
Single contingency (Category P1)
The assessment will consider all possible Category P1 contingencies based upon the following:
Loss of one generator (P1.1)28
Loss of one transmission circuit (P1.2)
Loss of one transformer (P1.3)
Loss of one shunt device (P1.4)
Loss of a single pole of DC lines (P1.5)
Single contingency (Category P2)
The assessment will consider all possible Category P2 contingencies based upon the following:
Loss of one transmission circuit without a fault (P2.1)
Loss of one bus section (P2.2)
Loss of one breaker (internal fault) (non-bus-tie-breaker) (P2.3)
Loss of one breaker (internal fault) (bus-tie-breaker) (P2.4)
Multiple contingency (Category P3)
The assessment will consider the Category P3 contingencies with the loss of a generator unit followed by system adjustments and the loss of the following:
Loss of one generator (P3.1)29
Loss of one transmission circuit (P3.2)
Loss of one transformer (P3.3)
Loss of one shunt device (P3.4)
Loss of a single pole of DC lines (P3.5)
Multiple contingency (Category P4)
The assessment will consider the Category P4 contingencies with the loss of multiple elements caused by a stuck breaker (non-bus-tie-breaker for P4.1-P4.5) attempting to clear a fault on one of the following:
Loss of one generator (P4.1)
Loss of one transmission circuit (P4.2)
Loss of one transformer (P4.3)
Loss of one shunt device (P4.4)
Loss of one bus section (P4.5)
Loss of a bus-tie-breaker (P4.6)
28 Includes per California ISO Planning Standards – Loss of Combined Cycle Power Plant Module as a Single Generator Outage Standard. 29 Includes per California ISO Planning Standards – Loss of Combined Cycle Power Plant Module as a Single Generator Outage Standard.
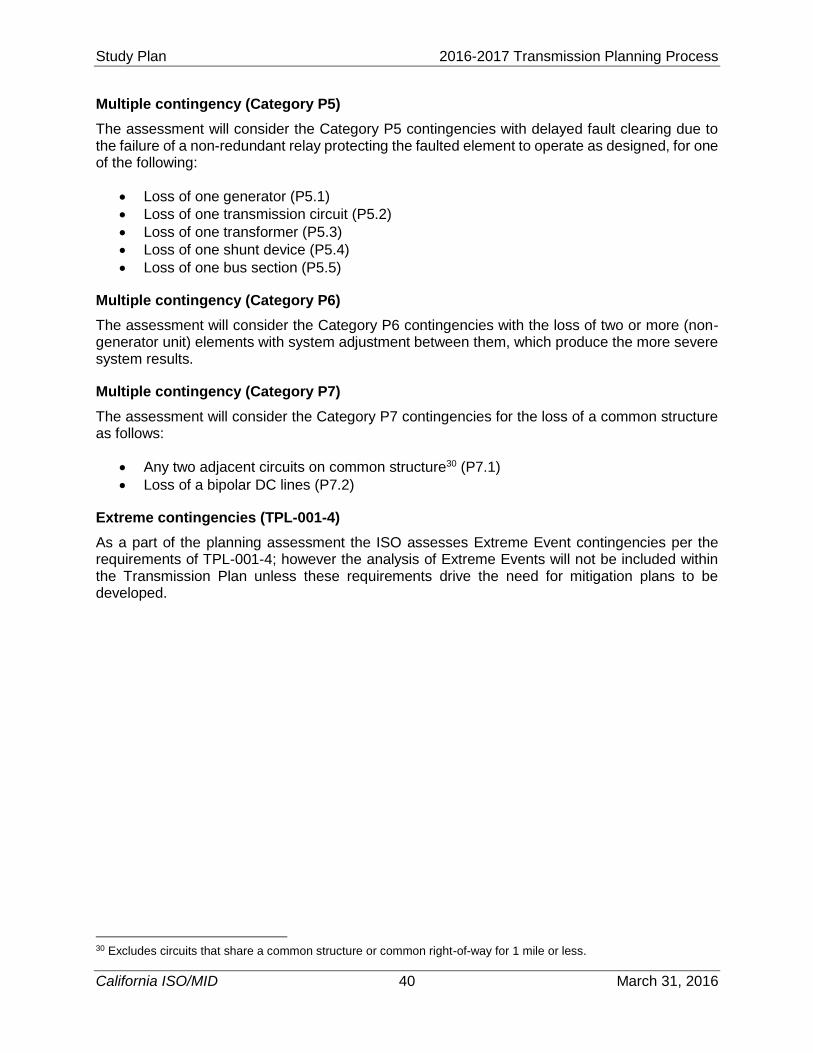
Study Plan 2016-2017 Transmission Planning Process
California ISO/MID 40 March 31, 2016
Multiple contingency (Category P5)
The assessment will consider the Category P5 contingencies with delayed fault clearing due to the failure of a non-redundant relay protecting the faulted element to operate as designed, for one of the following:
Loss of one generator (P5.1)
Loss of one transmission circuit (P5.2)
Loss of one transformer (P5.3)
Loss of one shunt device (P5.4)
Loss of one bus section (P5.5)
Multiple contingency (Category P6)
The assessment will consider the Category P6 contingencies with the loss of two or more (non-generator unit) elements with system adjustment between them, which produce the more severe system results.
Multiple contingency (Category P7)
The assessment will consider the Category P7 contingencies for the loss of a common structure as follows:
Any two adjacent circuits on common structure30 (P7.1)
Loss of a bipolar DC lines (P7.2)
Extreme contingencies (TPL-001-4)
As a part of the planning assessment the ISO assesses Extreme Event contingencies per the requirements of TPL-001-4; however the analysis of Extreme Events will not be included within the Transmission Plan unless these requirements drive the need for mitigation plans to be developed.
30 Excludes circuits that share a common structure or common right-of-way for 1 mile or less.
Study Plan 2016-2017 Transmission Planning Process
California ISO/MID 41 March 31, 2016
4.14 Study Tools The GE PSLF is the main study tool for evaluating system performance under normal conditions and following the outages (contingencies) of transmission system components for post-transient and transient stability studies. PowerGem TARA is used for steady state contingency analysis. However, other tools such as DSA tools software may be used in other studies such as voltage stability, small signal stability analyses and transient stability studies. The studies in the local areas focus on the impact from the grid under system normal conditions and following the Categories P1-P7 outages of equipment at the voltage level 60 through 230 kV. In the bulk system assessments, governor power flow will be used to evaluate system performance following the contingencies of equipment at voltage level 230 kV and higher.
4.15 Technical Studies The section explains the methodology that will be used in the study:
4.15.1 Power Flow Contingency Analysis
The ISO will perform power flow contingency analyses based on the ISO Planning Standards31 which are based on the NERC reliability standards and WECC regional criteria for all local areas studied in the ISO controlled grid and with select contingencies outside of the ISO controlled grid. The transmission system will be evaluated under normal system conditions NERC Category P0 (TPL 001-4), against normal ratings and normal voltage ranges, as well as emergency conditions NERC Category P1-P7 (TPL 001-4) contingencies against emergency ratings and emergency voltage range as identified in Section 4.1.6.
Depending on the type and technology of a power plant, several G-1 contingencies represent an outage of the whole power plant (multiple units)32. Examples of these outages are combined cycle power plants such as Delta Energy Center and Otay Mesa power plant. Such outages are studied as G-1 contingencies.
Line and transformer bank ratings in the power flow cases will be updated to reflect the rating of the most limiting component. This includes substation circuit breakers, disconnect switches, bus position related conductors, and wave traps.
Power flow studies will be performed in accordance with PRC-023 to determine which of the facilities (transmission lines operated below 200 kV and transformers with low voltage terminals connected below 200 kV) in the Planning Coordinator Area are critical to the reliability of the Bulk Electric System to identify the facilities below 200 kV that must meet PRC-023 to prevent potential cascade tripping that may occur when protective relay settings limit transmission load ability.
4.15.2 Post Transient Analyses
Post Transient analyses will be conducted to determine if the system is in compliance with the WECC Post Transient Voltage Deviation Standard in the bulk system assessments and if there are thermal overloads on the bulk system.
31 California ISO Planning Standards are posted on the ISO website at http://www.caiso.com/Documents/FinalISOPlanningStandards-April12015_v2.pdf 32 Per California ISO Planning standards Loss of Combined Cycle Power Plant Module as a Single Generator Outage Standard
Study Plan 2016-2017 Transmission Planning Process
California ISO/MID 42 March 31, 2016
4.15.3 Post Transient Voltage Stability Analyses
Post Transient Voltage stability analyses will be conducted as part of bulk system assessment for the outages for which the power flow analyses indicated significant voltage drops, using two methodologies: Post Transient Voltage Deviation Analyses and Reactive Power Margin analyses.
4.15.4 Post Transient Voltage Deviation Analyses
Contingencies that showed significant voltage deviations in the power flow studies will be selected for further analysis using WECC standards of 5% voltage deviation for “N-1” contingencies and 10% voltage deviation for “N-2” contingencies.
4.15.5 Voltage Stability and Reactive Power Margin Analyses
As per WECC regional criterion, voltage stability is required for the area modeled at a minimum of 105% of the reference load level or path flow for system normal conditions (Category P0) and for single contingencies (Category P1). For other contingencies (Category P2-P7), post-transient voltage stability is required at a minimum of 102.5% of the reference load level or path flow. The approved guide for voltage support and reactive power, by WECC TSS on March 30, 2006, will be utilized for the analyses in the ISO controlled grid. According to the guideline, load will be increased by 5% for Category P1 and 2.5% for other contingencies Category P2-P7 and will be studied to determine if the system has sufficient reactive margin. This study will be conducted in the areas that have voltage and reactive concerns throughout the system.
4.15.6 Transient Stability Analyses
Transient stability analyses will also be conducted as part of bulk area system assessment for critical contingencies to determine if the system is stable and exhibits positive damping of oscillations and if transient stability criteria are met as per ISO Planning Standards.
4.16 Corrective Action Plans Corrective action plans will be developed to address reliability concerns identified through the technical studies mentioned in the previous section. The ISO will consider both transmission and non-transmission alternatives in developing the required corrective action plans. Within the non-transmission alternative, consideration will be given to both conventional generation and in particular, preferred resources such as energy efficiency, demand response, renewable generating resources and energy storage programs. In making this determination, the ISO, in coordination with each Participating TO with a PTO Service Territory and other Market Participants, shall consider lower cost alternatives to the construction of transmission additions or upgrades, such as acceleration or expansion of existing projects, demand-side management, special protection systems, generation curtailment, interruptible loads, storage facilities or reactive support.
Study Plan 2016-2017 Transmission Planning Process
California ISO/MID 43 March 31, 2016
5. Local Capacity Requirement Assessment
5.1 Near-Term Local Capacity Requirement (LCR) The local capacity studies focus on determining the minimum MW capacity requirement within each of local areas inside the ISO Balancing Authority Area. The Local Capacity Area Technical Study determines capacity requirements used as the basis for procurement of resource adequacy capacity by load-serving entities for the following resource adequacy compliance year and also provides the basis for determining the need for any ISO “backstop” capacity procurement that may be needed once the load-serving entity procurement is submitted and evaluated.
Scenarios: The near-term local capacity studies will be performed for at least 2 years:
2017 – Local Capacity Area Technical Study
2021 – Mid-Term Local Capacity Requirements
Please note that in order to meet the CPUC deadline for capacity procurement by CPUC-jurisdictional load serving entities, the ISO will complete the LCR studies approximately by May 1, 2016.
Load Forecast: The latest available CEC load forecast, at the time of base case development, will be used as the primary source of future demand modeled in the base cases. The 1-in-10 load forecast for each local area is used.
Transmission Projects: ISO-approved transmission projects will be modeled in the base case. These are the same transmission project assumptions that are used in the reliability assessments and discussed in the previous section.
Imports: The LCR study models historical imports in the base case; the same as those used in the RA Import Allocation process
Methodology: A study methodology documented in the LCR manual will be used in the study. This document is posted on ISO website at:
http://www.caiso.com/Documents/Local%20capacity%20requirements%20process%20-%20studies%20and%20papers
Tools: GE PSLF version 19 will be used in the LCR study.
Since LCR is part of the overall ISO Transmission Plan, the Near-Term LCR reports will be posted on the 2016-2017 ISO Transmission Planning Process webpage.
Study Plan 2016-2017 Transmission Planning Process
California ISO/MID 44 March 31, 2016
5.2 Long-Term Local Capacity Requirement Assessment In the 2014-2015 Transmission Plan, the ISO evaluated long-term local capacity requirements (LCR) for all ten LCR areas. Based on the alignment33 of the ISO transmission planning process with the CEC Integrated Energy Policy Report (IEPR) demand forecast and the CPUC Long-Term Procurement Plan (LTPP) proceeding, the long-term LCR assessment is to take place every two years. Based on the alignment of the CPUC LTPP and ISO TPP processes, the next official long-term LCR assessment for all ISO LCR areas will be performed in the 2016-2017 transmission planning process.
Scenarios: The local capacity studies will be performed:
2026 – Long-Term Local Capacity Requirements for all LCR areas
Methodology: The study methodology used in the Near-Term LCR Assessment is documented in the LCR manual and will also be used in the study. This document is posted on ISO website at:
http://www.caiso.com/Documents/Local%20capacity%20requirements%20process%20-%20studies%20and%20papers
33 http://www.caiso.com/Documents/TPP-LTPP-IEPR_AlignmentDiagram.pdf
Study Plan 2016-2017 Transmission Planning Process
California ISO/MID 45 March 31, 2016
6. Policy Driven 33% RPS Transmission Plan Analysis
With FERC’s approval of the ISO’s revised TPP in December 2010, the specification of public policy objectives for transmission planning was incorporated into phase 1 of the TPP.
6.1 Public Policy Objectives The revised TPP created a category of transmission additions and upgrades to enable the ISO to plan for and approve new transmission needed to support state or federal public policy requirements and directives. The impetus for the “policy-driven” category was the recognition that California’s renewable energy goal would drive the development of substantial amounts of new renewable supply resources over the next decade, which in turn would drive the majority of new transmission needed in the same time frame. It was also recognized that new transmission needed to support the state’s renewable energy goal would most likely not meet the criteria for the two predominant transmission categories of reliability and economic projects.
Evaluating the need for policy-driven transmission elements begins in Phase 1 with the ISO’s specification, in the context of the unified planning assumptions and study plan, of the public policy objectives it proposes to adopt for transmission planning purposes in the current cycle. For the 2016-2017 planning cycle, the overarching public policy objective is the state’s mandate for 33% renewable energy by 2020. For purposes of the TPP study process, this high-level objective is comprised of two sub-objectives: first, to support the delivery of 33% renewable energy over the course of all hours of the year, and second, to support Resource Adequacy (RA) deliverability status for the renewable resources outside the ISO balancing authority area that are needed to achieve the 33% energy goal. Either of these sub-objectives could lead to the identification and approval of policy-driven transmission elements in the ISO’s 2016-2017 transmission plan.
The ISO and the CPUC have a memorandum of understanding under which the CPUC provides a renewable resource portfolio for ISO to analyze in the ISO’s annual TPP. As specified in the draft "Planning Assumption and Scenario Update For The 2016 Long Term Procurement Plans Proceeding And The CAISO 2016-2017 Transmission Planning Process”34, the renewable portfolio assumptions to be provided to the ISO by the CPUC to be used in the 2016-2017 TPP
will be the same RPS portfolio that was supplied by Commission staff for the 2015‐16 TPP. Because this portfolio is not expected to be significantly different from the 33% portfolio studies as part of the 2015-2016 TPP, these resources will be studied as part of the long-term reliability assessment base cases only.
50% RPS and the Renewable Energy Transmission Initiative (RETI) 2.0
On October 7, 2015 Governor Jerry Brown signed into law SB 350, the Clean Energy and Pollution Reduction Act of 2015. The bill established, among other goals, a 50 percent renewables portfolio standard (RPS) by 2030.
As noted in the CPUC’s process for developing assumptions for the CPUC’s 2016 LTPP and the ISO’s 2016-2017 TPP, the development of renewable generation portfolios is underway but results will not be available for the 2016-2017 TPP planning cycle.
One step taken to advance development of future policy direction in achieving the 50% RPS objectives set out in SB 350 was the formation of the Renewable Energy Transmission Initiative
34 http://docs.cpuc.ca.gov/PublishedDocs/Efile/G000/M158/K117/158117030.PDF
Study Plan 2016-2017 Transmission Planning Process
California ISO/MID 46 March 31, 2016
(RETI) 2.0). To achieve its renewable energy goals, SB 350 necessarily compels California to consider new investments in the state’s electric transmission system that will likely be required to access viable renewable generation resources in California and throughout the West. During 2016 RETI 2.0 will provide an open and transparent process to explore the viability of renewable generation resources in California and throughout the West while also identifying potential transmission opportunities that could access and integrate renewable energy outside of California to meet its renewables need.
While the predominate focus of RETI 2.0 is renewable resource opportunities, in partnership with the RETI 2.0 process, the ISO’s TPP will provide the framework to assess the transmission infrastructure to access renewable resources that meet RETI 2.0’s need. The ISO is uniquely positioned through its established Order 1000 interregional coordination obligations to proactively work with the other planning regions in the West to help link California’s renewable resource needs with needs of other transmission providers within the other planning regions. During the 2016 TPP the ISO intends to work through the interregional coordination process to engage the other planning regions and interested third party transmission developers to seek common interests with California and to subsequently develop transmission infrastructure requirements necessary to support the state’s renewable generation goals. The ISO will utilize its existing TPP to engage and inform its stakeholders on all transmission activities associated with RETI 2.0.
6.1.1 Achieving 33% renewable energy on an annual basis
The state’s mandate for 33% renewable energy by 2020 refers to the share of total electricity consumed by California consumers over the course of a year that is provided by renewable resources. In the context of the transmission planning studies, the question to be investigated is whether a specified portfolio of renewable supply resources, in conjunction with the conventional resource fleet expected to be operating, will deliver a mix of energy over all 8760 hours of the year that is at least 33% supplied by the renewable portfolio on an annual basis. Through the studies the ISO performs to address this question, the ISO could identify policy-driven transmission additions or upgrades that are necessary in order to achieve the 33% renewable share of annual consumption by 2020.
6.1.2 Supporting RA deliverability status for needed renewable resources outside the ISO balancing authority area
Deliverability for the purpose of a resource providing RA capacity is a distinct requirement and is integral to achieving the 33% RPS policy goal. Resources that are connected directly to the ISO grid can establish deliverability through the ISO’s annual process to determine Net Qualifying Capacity (NQC) for each resource for the upcoming RA compliance year (i.e., calendar year). A new resource seeking to interconnect to the ISO grid can elect Full Capacity deliverability status in its interconnection request, and this election triggers a study process to identify any network upgrades needed for deliverability and ultimately leads to the construction of the needed network upgrades by the relevant PTO whose system needs to be upgraded.
For resources outside the ISO, however, there is no way under the current rules for the resource to obtain RA deliverability status. Rather, in conjunction with the annual NQC process the ISO assesses the Maximum Import Capability (MIC) at each intertie, and then conducts a multi-step process whereby load-serving entities inside the ISO can utilize shares of the MIC to procure external capacity to meet their RA requirements. Moreover, the determination of the intertie MIC values is based not on an assessment of maximum physical import capability in each area, but only on historic energy schedules under high-load system conditions. This approach has resulted in extremely small values for certain interties. As a result, areas outside the ISO that are rich in
Study Plan 2016-2017 Transmission Planning Process
California ISO/MID 47 March 31, 2016
renewable energy potential and have been included in the ISO’s 33% supply portfolios, have raised concerns that they will be unable to develop their projects if they are unable to offer RA capacity to their potential LSE buyers. The ISO therefore also includes, in each TPP cycle, the policy objective of expanding RA import capability in those areas outside the ISO BAA where (a) renewable resources are needed in the 33% RPS base case portfolio to meet the state’s 33% RPS target, and (b) the RA import capability is not sufficient to enable these resources to provide RA capacity.
The fundamental concept behind RA is that the ISO should be able to utilize all the designated RA capacity simultaneously to provide energy and reserve capacity when needed to meet peak system demand. Pursuant to this concept, the assessment of deliverability focuses on the simultaneous operation of available internal RA capacity and import of external RA energy by designated RA capacity during system peak hours. Depending on the generation amounts and locations in the 33% supply portfolios, the RA deliverability assessment could result in the ISO identifying policy-driven transmission elements to support MIC needed for that renewable generation.
6.2 Study methodology As noted above, analysis of policy-driven transmission in the 2016-2017 planning cycle will continue to focus on achieving the state’s 33% renewables portfolio standard energy by 2020 and thereafter. The goal of the 33% renewable resource analysis is to identify the transmission needed to meet the 33% renewable resource target in the study year which, for this cycle, is 2026. The first step in this analysis is to establish renewable portfolios to be considered that are aligned closely with the portfolios developed by CPUC and used by the ISO in its renewable integration studies. In accordance with ISO Tariff Section 24.4.6.6, the renewable portfolios reflect such considerations as environmental impact, commercial interest and available transmission capacity, among other criteria.
In the 2015-2016 TPP, the ISO performed the 33% renewable resource analysis for the year 2025 for those renewable zones in which the resource composition changed significantly compared to the 2014-2015 TPP portfolios. Because the base portfolio was modeled in the reliability studies, the results of that study were also considered to be part of the 33% renewable resource analysis. To supplement those study results, additional studies were performed as described below:
1) Conduct production simulation of the developed portfolios using the ISO unified economic assessment database with renewable portfolios modeled.
2) Conduct additional power flow and stability assessments including o Contingency analysis using regular power flow (GE PSLF) o Voltage stability assessment using governor power flow (post-transient) o Transient stability using GE PSLF o Deliverability assessment
3) Categorize any identified transmission upgrade or addition elements based on the ISO Tariff Section 24.4.6.6 requirements.
In the 2016-2017 planning cycle, similar methodology will be used to identify the transmission needs to meet 33% RPS in 2026.
The CPUC and CEC will be providing RPS portfolios as described in Section 6.1. That RPS portfolio submission letter will be posted on the ISO website on the 2016-2017 Transmission Planning Process page.
Study Plan 2016-2017 Transmission Planning Process
California ISO/MID 48 March 31, 2016
6.3 Study scope The study scope will depend on the composition of the RPS portfolios provided by the CPUC. In general, the study scope of the 33% renewable resource analysis in this planning cycle includes the following items:
Model base portfolio in the 2026 reliability assessment. Off-peak base cases will include a stressed renewable dispatch, so these results identify transmission needs associated with the 33% RPS base portfolio.
Develop ISO supplemental 2026 power flow base cases starting from 2026 reliability base cases to model different load conditions based on the study methodology and assumptions.
Establish portfolios and areas to be studied.
Model those portfolios in production, power flow, and stability models
Analyze stressed power flow models for peak, off-peak and other scenarios if needed. These should capture conditions for the ISO’s controlled grid and the entire Western Interconnection that show stressed patterns including cases possibly in different seasons. The peak load scenario uses CEC 1-in-5 coincident peak load with the Mid AAEE.
Update 33% RPS transmission plan based on findings.
Several sensitivity cases may be created to evaluate different scenarios as part of the comprehensive plan analysis
6.4 Coordination with Phase II of GIP According to tariff Section 24.4.6.5 and in order to better coordinate the development of potential infrastructure from transmission planning and generation interconnection processes the ISO may coordinate the TPP with generator interconnection studies. In general, Network Upgrades and associated generation identified during the Interconnection Studies will be evaluated and possibly included as part of the TPP. The details of this process are described below.
Generator Interconnection Network Upgrade Criteria for TPP Assessment
Beginning with the 2012-2013 planning cycle, generator interconnection Network Upgrades may be considered for potential modification in the TPP if the Network Upgrade:
Consists of new transmission lines 200 kV or above and have capital costs of $100 million or more;
Is a new 500 kV substation that has capital costs of $100 million or more; or Has a capital cost of $200 million or more.
Notification of Network Upgrades being assessed in the TPP
In approximately October 2015, the ISO will publish the list of generator interconnection Network Upgrades that meet at least one of these criteria and have been selected for consideration in TPP Phase 2. The comprehensive Transmission Plan will contain the results of the ISO’s evaluation of the identified Network Upgrades. Network Upgrades evaluated by the ISO but not modified as part of the comprehensive Transmission Plan will proceed to Generator Interconnection Agreements (GIAs) through the Generator Interconnection and Deliverability Allocation Procedure (GIDAP) and will not be further addressed in the TPP. Similarly, GIP Network Upgrades that meet the tariff criteria but were not evaluated in the TPP will proceed to GIAs through the GIDAP.
Study Plan 2016-2017 Transmission Planning Process
California ISO/MID 49 March 31, 2016
All generation projects in the Phase II cluster study have the potential to create a need for Network Upgrades. As a result, the ISO may need to model some or all of these generation projects and their associated transmission upgrades in the TPP base cases for the purpose of evaluating alternative transmission upgrades. However, these base cases will be considered sensitivity base cases in addition to the base cases developed under the Unified Planning Assumptions. These base cases will be posted on the ISO protected web-site for stakeholder review. Study results and recommendations from these cases will be incorporated in the comprehensive transmission plan.
Transmission Planning Deliverability
Section 8.9 of the GIDAP specifies that an estimate of the generation deliverability supported by the existing system and approved transmission upgrades will be determined from the most recent Transmission Plan. Transmission plan deliverability (TPD) is estimated based on the area deliverability constraints identified in recent generation interconnection studies without considering local deliverability constraints. For some study areas, the TPD is greater than the MW amount of generation in the ISO interconnection queue, and for those areas TPD is not quantified.
Study Plan 2016-2017 Transmission Planning Process
California ISO/MID 50 March 31, 2016
7. Special Studies
7.1 50% Renewable Energy Goal for 2030 During the current planning cycle the ISO will perform a special study to provide information regarding the potential need for public policy-driven transmission additions or upgrades to support a state 50% renewable energy goal. The ISO is performing this study for information purposes only; its results will not be used to support a need for policy-driven transmission in the 2016-2017 planning cycle.
The target date associated with the 50% renewable energy goal is 2030, which is beyond the 10-year horizon of the TPP. At the same time, the ISO and the CPUC believe there would be great value in performing this study to anticipate potential transmission needs to meet the 50% renewable energy goal, as this will help inform the state’s procurement processes about the cost impacts of achieving 50% renewable energy goal largely through the addition of new ISO grid-connected generating facilities. The CPUC has expressed interest in assessing the transmission requirements that would result if the incremental new renewable generation – i.e., the generation required to go from 33% RPS to 50% renewable energy goal– is procured as energy-only capacity.
To date, in identifying needed transmission for 33% RPS the ISO has sought to provide full capacity deliverability status to the renewable resources, based on the CPUC’s and the load-serving entities’ desire to obtain resource adequacy capacity from the same resources that provide renewable energy. For going beyond 33%, the ISO will continue to study the transmission needed to provide full capacity deliverability status. However, we will also study the incremental renewable generation to be energy-only, and on that basis will estimate the expected amount of congestion-related curtailment of renewables. Although there is no formal link between a resource’s deliverability status and the amount of curtailment it might experience, the fact is that providing deliverability status to generating resources generally requires deliverability network upgrades which have the effect of reducing the likelihood of congestion-related curtailment of generation. Thus one of the main objectives of the special study will be to assess how energy-only status for the incremental renewable generation could lead to curtailment and thereby compromise the higher RPS target.
The ISO will also focus on evaluating the impact of out-of-state renewable resources on the reliability performance and curtailment of renewables. This will also provide a framework for considering interregional transmission proposals emerging through the interregional coordination processes developed in compliance with FERC Order No. 1000, which is being initiated in the first quarter of 2016. At this time, the bulk of interregional proposals that have been brought to the ISO’s attention for possible future consideration focused on accessing out of state resources.
The ISO intends to perform the special study starting about the end of August, after the completion of the reliability planning studies, and during the period when the TPP typically assesses the need for public policy-driven transmission. The ISO therefore expects to present preliminary results of the special study for discussion with stakeholders in November 2016.
7.2 Frequency Response Assessment In the 2014-2015 and 2015-2016 transmission planning process the ISO conducted initial studies into frequency response and headroom requirements for potential over-supply conditions. The study results indicated acceptable frequency performance within WECC; however the ISO’s frequency response may fall below the ISO frequency response obligation specified in NERC
Study Plan 2016-2017 Transmission Planning Process
California ISO/MID 51 March 31, 2016
reliability standard BAL-003-1. Compared to the ISO’s actual system performance during disturbances, the study results seem optimistic because actual frequency responses for some contingencies were lower than the dynamic model indicated. Further model validation is needed to ensure that governor response in the simulations aligns with the actual response on the system. In the 2016-2017 TPP the ISO will assess the validation of models based on real-time contingencies and work with the facility owners to update the models as required. The ISO will provide updates on the progress of this assessment through the 2016-2017 transmission planning process.
7.3 Gas-Electric Reliability The potential impacts of the changing role of gas-fired generation in providing local capacity support and flexible generation needs has been raised as a concern regarding both physical capacity and gas contracting requirements that should be examined in the planning framework. In the 2015-2016 Transmission Planning Process, the ISO explored and performed preliminary transmission planning related studies for the LA Basin and San Diego areas for the scenarios involving gas curtailments under adverse winter conditions as well as examining conditions involving a major gas transmission line extended outage. However, this study was scoped and much of the analysis completed before the circumstances and the potential impacts became apparent regarding the leak detected in October 2015 at one of the natural gas storage wells at the Aliso Canyon storage field in the Santa Susana Mountains. The storage field is the largest of SoCalGas’s four storage facilities and the most strategically located for serving the LA Basin and San Diego generation. The potential loss of the use of the field across a season was far beyond the outage scenarios contemplated for this preliminary analysis. Current efforts are focusing on the more immediate operational situation, and as the implications are better understood, they will be incorporated into an expanded scope of long term planning analysis in the 2016-2017 planning cycle. The ISO is considering expanding the scope of the study to include other local areas.
7.4 Economic Early Retirement of Gas Generation Assessment There is a potential for the economic early retirement of gas generation as a result of the increasing levels of renewable generation interconnecting to the electrical grid. The special study will develop a methodology for developing potential early retirement scenarios and assess the early retirement scenarios to identify if there are any reliability impacts associated with the early retirement of gas generation on the ISO controlled grid.
7.5 Characteristics of Slow Response Local Capacity Resources In order to be effective, local capacity resources either need to be capable of assisting the system in preparing for a second contingency within 30 minutes of an initial contingency, or being sufficiently unconstrained that the resources may be dispatched whenever certain loading conditions exist and in anticipation of the first contingency actually occurring – allowing a “slower” response time in responding to a dispatch. The number of dispatches in the latter case is anticipated to be orders of magnitude higher than in the former case.
The ISO has studied on a case by case basis other “fast” resources and their necessary characteristics, and has a foundational methodology35 for those studies. This special study is to identify the characteristics of the “slower” response that are to be considered for local capacity resources.
35 http://www.caiso.com/Documents/Paper-Non-ConventionalAlternatives-2013-2014TransmissionPlanningProcess.pdf
Study Plan 2016-2017 Transmission Planning Process
California ISO/MID 52 March 31, 2016
8. Economic Planning Study The ISO will perform an Economic Planning Study as part of the current planning cycle to identify potential congestion and propose mitigation plans. The study will quantify the economic benefits for the ISO ratepayers based on Transmission Economic Assessment Methodology (TEAM). Production simulation is the main tool for this study.
The Economic Planning Study will be based on the same assumptions as the Reliability Assessment and 33% RPS Transmission Plan Analysis with the following exception:
The 1-in-2 demand forecast will be used in the assessment.
The Economic Planning Study will conduct hourly analysis for year 2021 (the 5th planning year) and 2026 (the 10th planning year) respectively through production simulation.
As part of the requirements under the ISO tariff and Business Practice Manual, Economic Planning Study Requests are to be submitted to the ISO during the comment period following the stakeholder meeting to discuss this Study Plan. The ISO will consider the Economic Planning Study Requests as identified in section 24.3.4.1 of the ISO Tariff. Table 8-1 includes the Economic Planning Study Requests that were submitted for this planning cycle.
Table 8-1 Economic Planning Study Requests
No. Study Request Submitted By Location
1 SWIP-North, COI and Path 26 congestions LS Power ID/NV
2 Blythe's Loop-in Project Blythe Energy Southern CA
3 Eagle Mountain Pumped Storage Project Eagle Crest Energy Southern CA
4 COI congestion OCOA Northern CA
5 Path 15 study PG&E Northern CA
6 Path 26 study PG&E Northern CA/Southern CA
In evaluation of the congestion and review of the study requests, the ISO will determine the high priority studies to be conducted during the 2016-2017 transmission planning cycle.
Study Plan 2016-2017 Transmission Planning Process
California ISO/MID 53 March 31, 2016
9. Long-Term Congestion Revenue Rights (LT CRR) The ISO is obligated to ensure the continuing feasibility of Long Term CRRs (LT-CRRs) that are allocated by the ISO over the length of their terms. As such, the ISO, as part of its annual TPP cycle, shall test and evaluate the simultaneous feasibility of allocated LT-CRRs, including, but not limited to, when acting on the following types of projects: (a) planned or proposed transmission projects; (b) Generating Unit or transmission retirements; (c) Generating Unit interconnections; and (d) the interconnection of new Load. While the ISO expects that released LT-CRRs will remain feasible during their full term, changes to the interconnected network will occur through new infrastructure additions and/or modifications to existing infrastructure. To ensure that these infrastructure changes to the transmission system do not cause infeasibility in certain LT-CRRs, the ISO shall perform an annual Simultaneous Feasibility Test (SFT) analysis to demonstrate that all released CRRs remain feasible. In assessing the need for transmission additions or upgrades to maintain the feasibility of allocated LT- CRRs, the ISO, in coordination with the PTOs and other Market Participants, shall consider lower cost alternatives to the construction of transmission additions or upgrades, such as acceleration or expansion of existing projects, demand-side management, Remedial Action Schemes, constrained-on Generation, interruptible loads, reactive support, or in cases where the infeasible LT- CRRs involve a small magnitude of megawatts, ensuring against the risk of any potential revenue shortfall using the CRR Balancing Account and uplift mechanism in Section 11.2.4 of the ISO tariff.
Study Plan 2016-2017 Transmission Planning Process
California ISO/MID 54 March 31, 2016
10. Interregional Transmission Projects At the beginning of the 2016-2017 planning cycle the ISO will initiate a submission period in which proponents may request the ISO and at least one other planning region to evaluate an interregional transmission project (ITP). The submission period will begin January 1 and close March 31st of every even-numbered year. Following a screening process, the ISO will post an addendum to the transmission planning process final study plan outlining the projects that will be assessed for that planning cycle and the projects that were submitted but deemed as not meeting the screening criteria. The ISO along with the relevant planning region(s) will develop and post an ITP evaluation process plan, including agreed to common study assumptions, data, methodologies, cost assumptions and a schedule for determining the selection of an ITP. There will be ongoing coordination between the relevant planning regions on the planning data and assumptions, including the potential ITP benefits up until the final determination of whether or not an ITP should be included in the ISO’s transmission plan.
Throughout the coordination process with the other relevant planning regions, The ISO will seek to resolve any differences it has with the other relevant planning regions relating to the ITP or to information specific to other relevant planning regions that may affect the ISO’s evaluation of the ITP. Using the ISO’s established economic assessment methodology, an estimate of the benefits and ISO share of the costs of the ITP to consider and compare the benefits and costs of the regional transmission solution and the estimated ISO benefits and ISO costs of the interregional transmission project which eliminates or defers a regional need. If the interregional transmission project could potentially meet a regional need more cost-effectively and efficiently than a regional transmission solution. Based on the ISO’s initial assessment of ITP benefits, the ISO will determine whether to further evaluate the project during the next planning cycle. If at any time during an ITP evaluation process the ISO determines that the interregional transmission project will not meet any of its regional transmission needs, the ISO will notify the other relevant planning regions(s) and ISO stakeholders at one of the regularly scheduled stakeholder meetings shown in Table 2-1. After and ITP is determined to not be needed, the ISO has no further obligation to participate in the joint evaluation of the interregional transmission project.
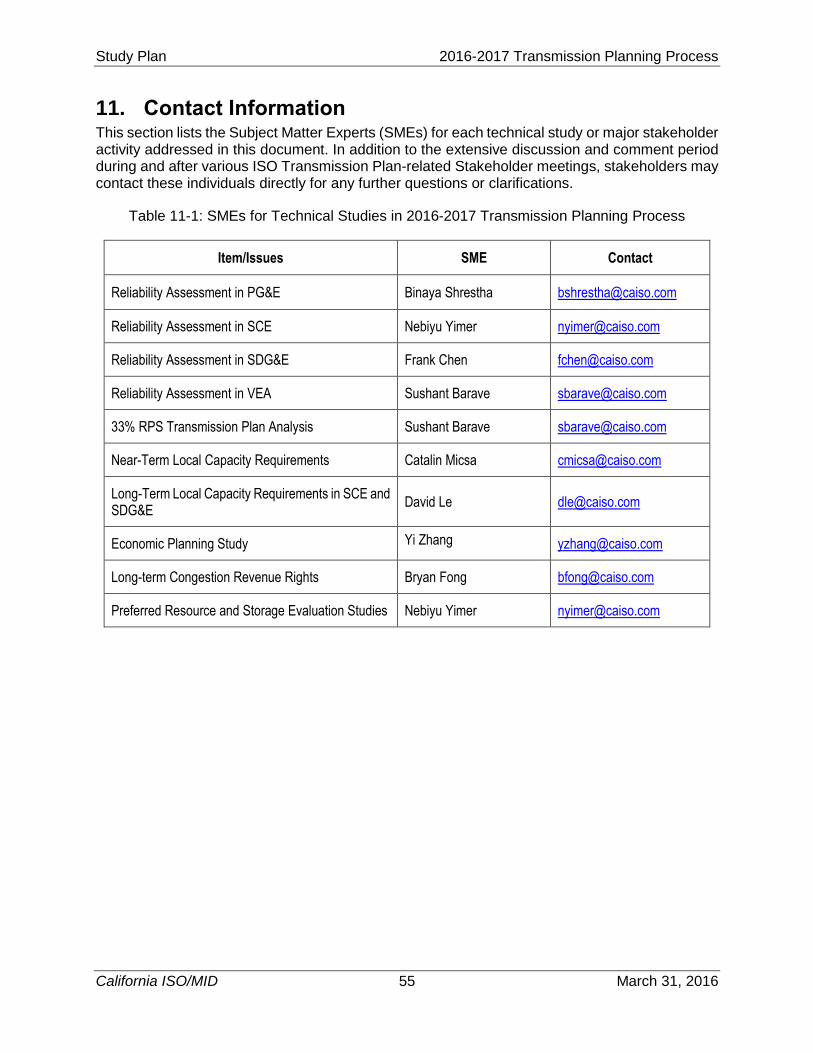
Study Plan 2016-2017 Transmission Planning Process
California ISO/MID 55 March 31, 2016
11. Contact Information This section lists the Subject Matter Experts (SMEs) for each technical study or major stakeholder activity addressed in this document. In addition to the extensive discussion and comment period during and after various ISO Transmission Plan-related Stakeholder meetings, stakeholders may contact these individuals directly for any further questions or clarifications.
Table 11-1: SMEs for Technical Studies in 2016-2017 Transmission Planning Process
Item/Issues SME Contact
Reliability Assessment in PG&E Binaya Shrestha [email protected]
Reliability Assessment in SCE Nebiyu Yimer [email protected]
Reliability Assessment in SDG&E Frank Chen [email protected]
Reliability Assessment in VEA Sushant Barave [email protected]
33% RPS Transmission Plan Analysis Sushant Barave [email protected]
Near-Term Local Capacity Requirements Catalin Micsa [email protected]
Long-Term Local Capacity Requirements in SCE and SDG&E
David Le [email protected]
Economic Planning Study Yi Zhang [email protected]
Long-term Congestion Revenue Rights Bryan Fong [email protected]
Preferred Resource and Storage Evaluation Studies Nebiyu Yimer [email protected]
Study Plan 2016-2017 Transmission Planning Process
California ISO/MID 56 March 31, 2016
12. Stakeholder Comments and ISO Responses Stakeholders are hereby requested to submit their comments to:
All the comments the ISO receives from stakeholders on this 2016-2017 draft study plan and ISO’s responses will be posted to the following link:
http://www.caiso.com/planning/Pages/TransmissionPlanning/2016-2017TransmissionPlanningProcess.aspx
Study Plan 2016-2017 Transmission Planning Process
California ISO/MID A-1
APPENDIX A: System Data
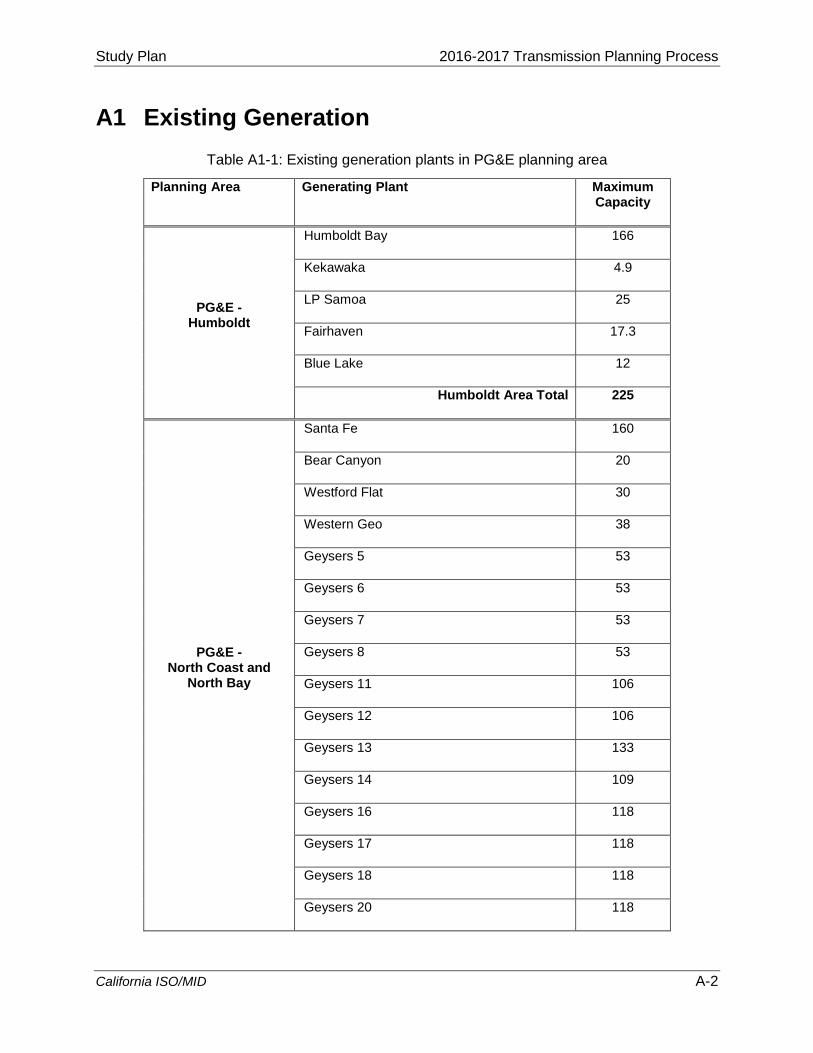
Study Plan 2016-2017 Transmission Planning Process
California ISO/MID A-2
A1 Existing Generation
Table A1-1: Existing generation plants in PG&E planning area
Planning Area Generating Plant Maximum Capacity
PG&E - Humboldt
Humboldt Bay 166
Kekawaka 4.9
LP Samoa 25
Fairhaven 17.3
Blue Lake 12
Humboldt Area Total 225
PG&E - North Coast and
North Bay
Santa Fe 160
Bear Canyon 20
Westford Flat 30
Western Geo 38
Geysers 5 53
Geysers 6 53
Geysers 7 53
Geysers 8 53
Geysers 11 106
Geysers 12 106
Geysers 13 133
Geysers 14 109
Geysers 16 118
Geysers 17 118
Geysers 18 118
Geysers 20 118
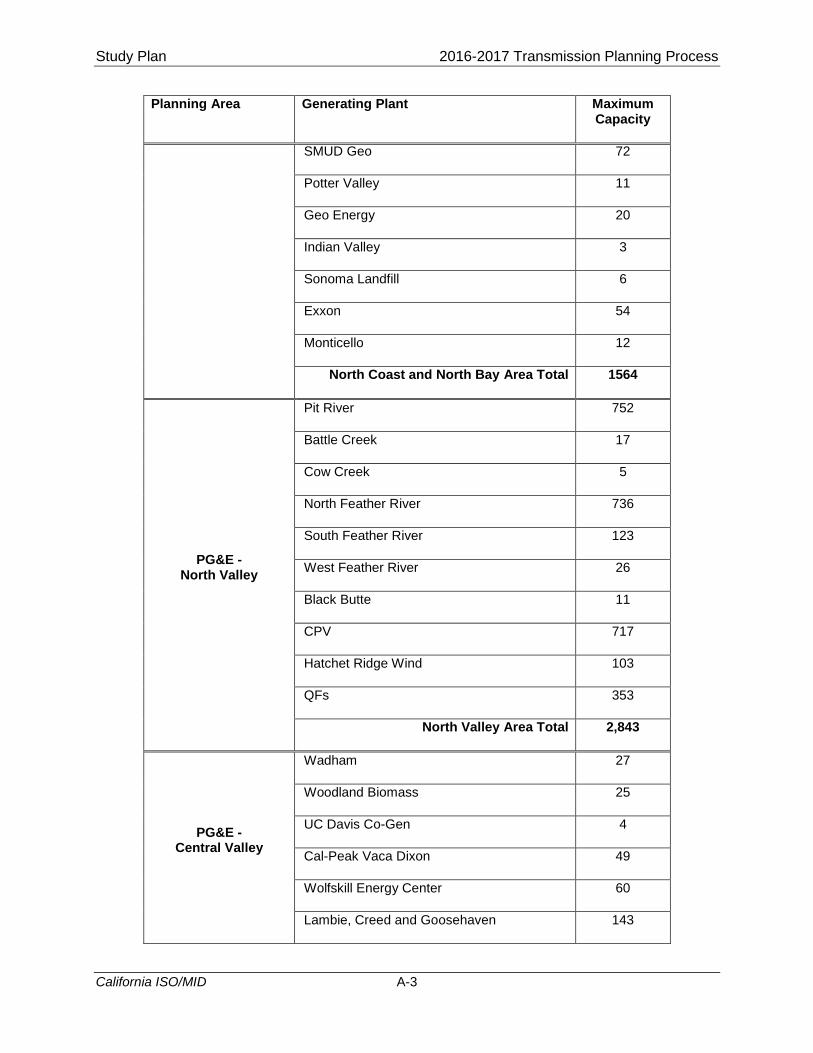
Study Plan 2016-2017 Transmission Planning Process
California ISO/MID A-3
Planning Area Generating Plant Maximum Capacity
SMUD Geo 72
Potter Valley 11
Geo Energy 20
Indian Valley 3
Sonoma Landfill 6
Exxon 54
Monticello 12
North Coast and North Bay Area Total 1564
PG&E - North Valley
Pit River 752
Battle Creek 17
Cow Creek 5
North Feather River 736
South Feather River 123
West Feather River 26
Black Butte 11
CPV 717
Hatchet Ridge Wind 103
QFs 353
North Valley Area Total 2,843
PG&E - Central Valley
Wadham 27
Woodland Biomass 25
UC Davis Co-Gen 4
Cal-Peak Vaca Dixon 49
Wolfskill Energy Center 60
Lambie, Creed and Goosehaven 143
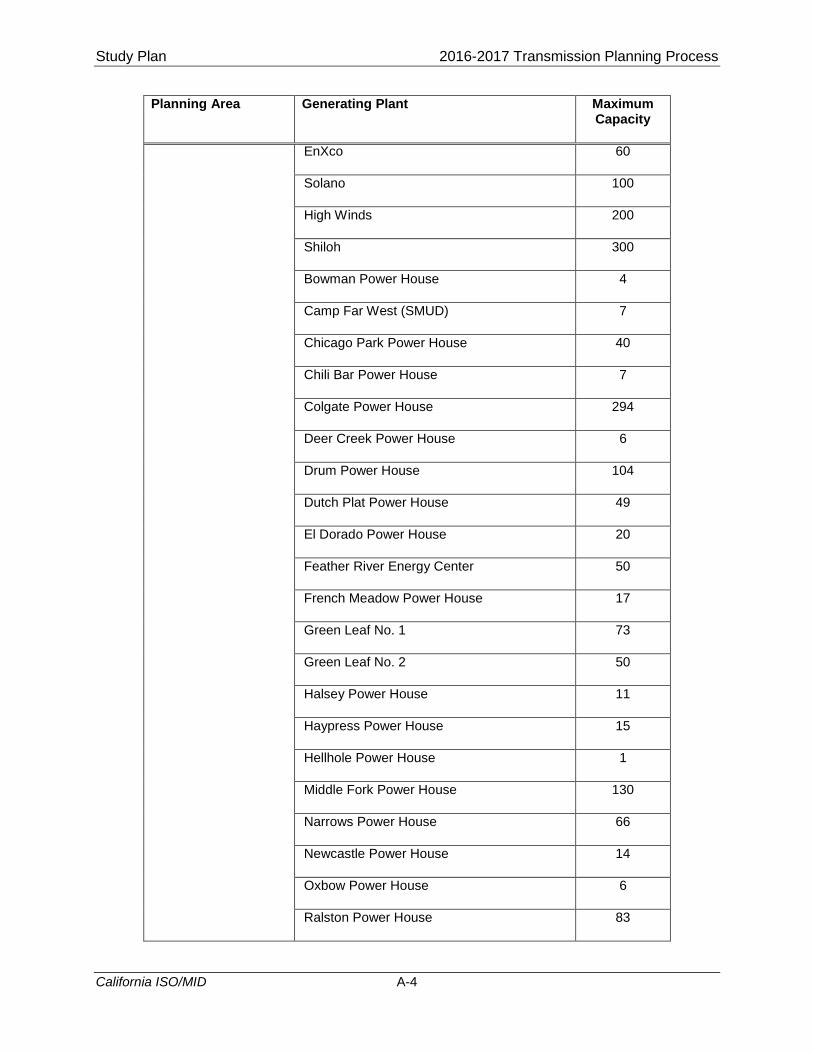
Study Plan 2016-2017 Transmission Planning Process
California ISO/MID A-4
Planning Area Generating Plant Maximum Capacity
EnXco 60
Solano 100
High Winds 200
Shiloh 300
Bowman Power House 4
Camp Far West (SMUD) 7
Chicago Park Power House 40
Chili Bar Power House 7
Colgate Power House 294
Deer Creek Power House 6
Drum Power House 104
Dutch Plat Power House 49
El Dorado Power House 20
Feather River Energy Center 50
French Meadow Power House 17
Green Leaf No. 1 73
Green Leaf No. 2 50
Halsey Power House 11
Haypress Power House 15
Hellhole Power House 1
Middle Fork Power House 130
Narrows Power House 66
Newcastle Power House 14
Oxbow Power House 6
Ralston Power House 83
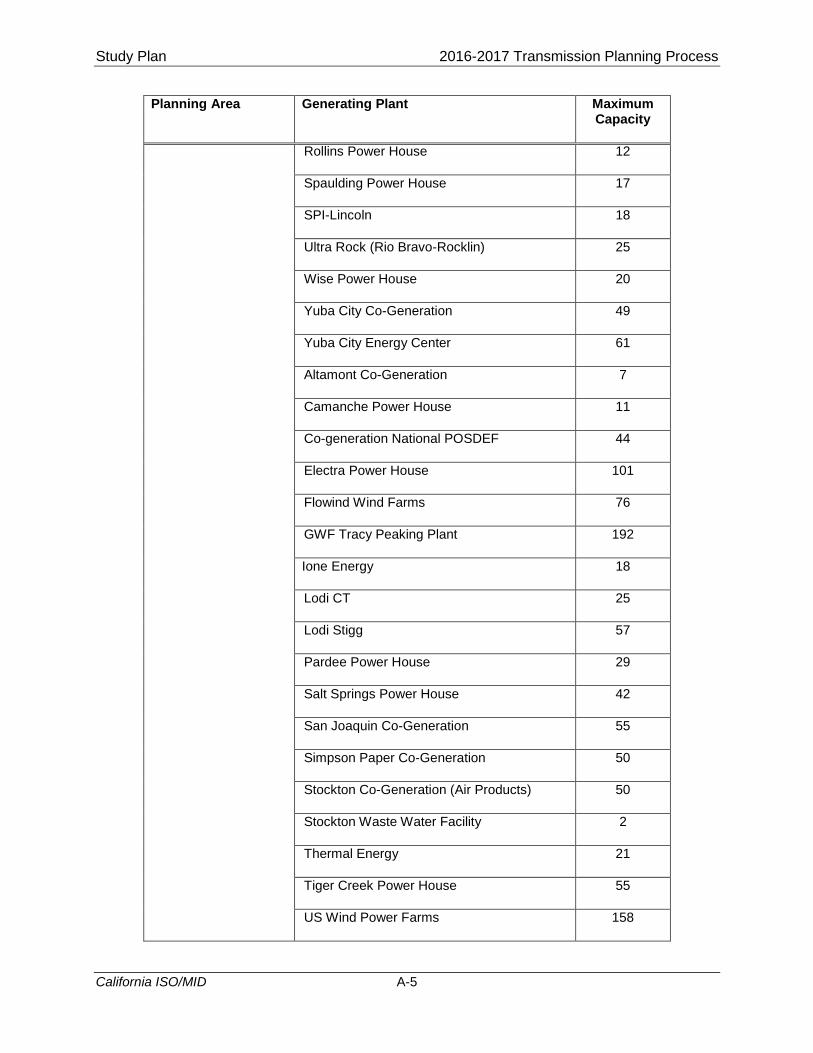
Study Plan 2016-2017 Transmission Planning Process
California ISO/MID A-5
Planning Area Generating Plant Maximum Capacity
Rollins Power House 12
Spaulding Power House 17
SPI-Lincoln 18
Ultra Rock (Rio Bravo-Rocklin) 25
Wise Power House 20
Yuba City Co-Generation 49
Yuba City Energy Center 61
Altamont Co-Generation 7
Camanche Power House 11
Co-generation National POSDEF 44
Electra Power House 101
Flowind Wind Farms 76
GWF Tracy Peaking Plant 192
Ione Energy 18
Lodi CT 25
Lodi Stigg 57
Pardee Power House 29
Salt Springs Power House 42
San Joaquin Co-Generation 55
Simpson Paper Co-Generation 50
Stockton Co-Generation (Air Products) 50
Stockton Waste Water Facility 2
Thermal Energy 21
Tiger Creek Power House 55
US Wind Power Farms 158
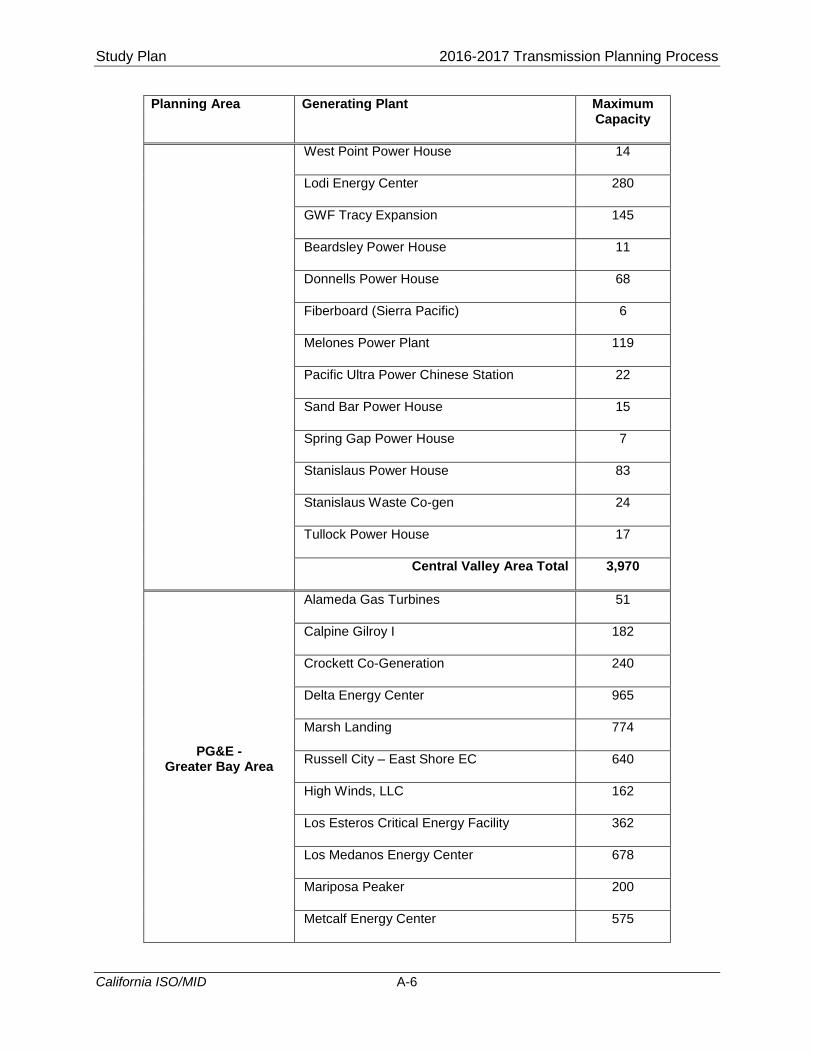
Study Plan 2016-2017 Transmission Planning Process
California ISO/MID A-6
Planning Area Generating Plant Maximum Capacity
West Point Power House 14
Lodi Energy Center 280
GWF Tracy Expansion 145
Beardsley Power House 11
Donnells Power House 68
Fiberboard (Sierra Pacific) 6
Melones Power Plant 119
Pacific Ultra Power Chinese Station 22
Sand Bar Power House 15
Spring Gap Power House 7
Stanislaus Power House 83
Stanislaus Waste Co-gen 24
Tullock Power House 17
Central Valley Area Total 3,970
PG&E - Greater Bay Area
Alameda Gas Turbines 51
Calpine Gilroy I 182
Crockett Co-Generation 240
Delta Energy Center 965
Marsh Landing 774
Russell City – East Shore EC 640
High Winds, LLC 162
Los Esteros Critical Energy Facility 362
Los Medanos Energy Center 678
Mariposa Peaker 200
Metcalf Energy Center 575
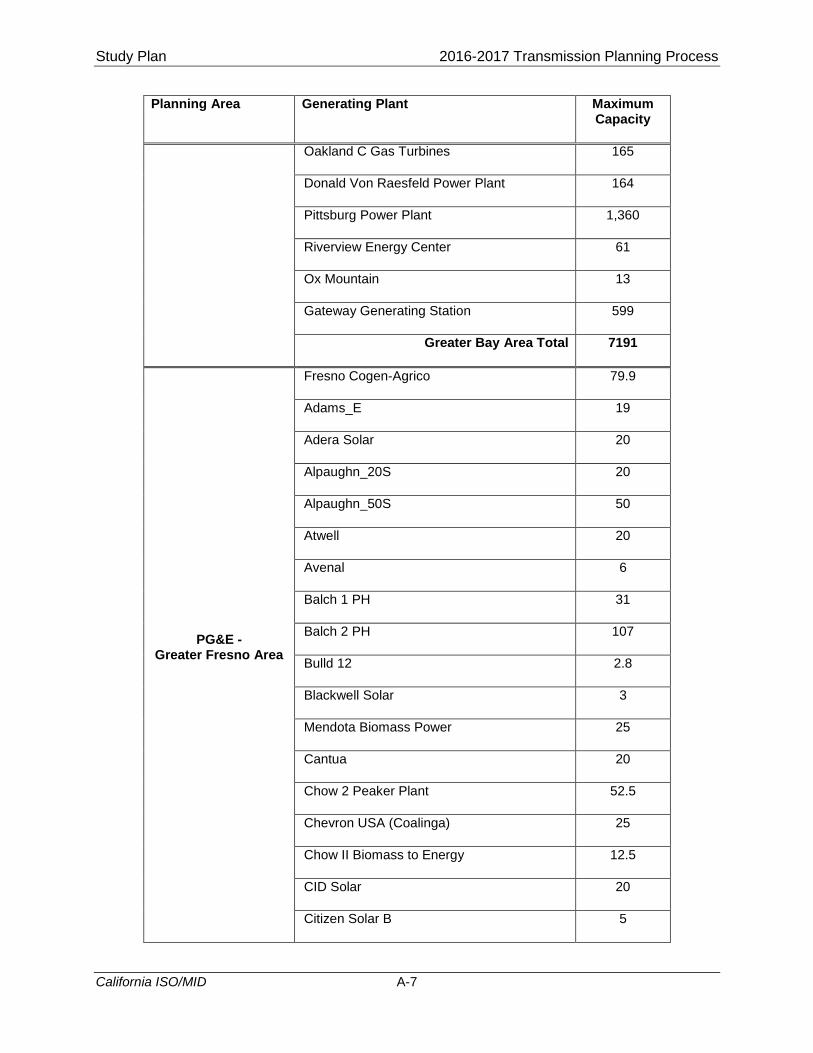
Study Plan 2016-2017 Transmission Planning Process
California ISO/MID A-7
Planning Area Generating Plant Maximum Capacity
Oakland C Gas Turbines 165
Donald Von Raesfeld Power Plant 164
Pittsburg Power Plant 1,360
Riverview Energy Center 61
Ox Mountain 13
Gateway Generating Station 599
Greater Bay Area Total 7191
PG&E - Greater Fresno Area
Fresno Cogen-Agrico 79.9
Adams_E 19
Adera Solar 20
Alpaughn_20S 20
Alpaughn_50S 50
Atwell 20
Avenal 6
Balch 1 PH 31
Balch 2 PH 107
Bulld 12 2.8
Blackwell Solar 3
Mendota Biomass Power 25
Cantua 20
Chow 2 Peaker Plant 52.5
Chevron USA (Coalinga) 25
Chow II Biomass to Energy 12.5
CID Solar 20
Citizen Solar B 5
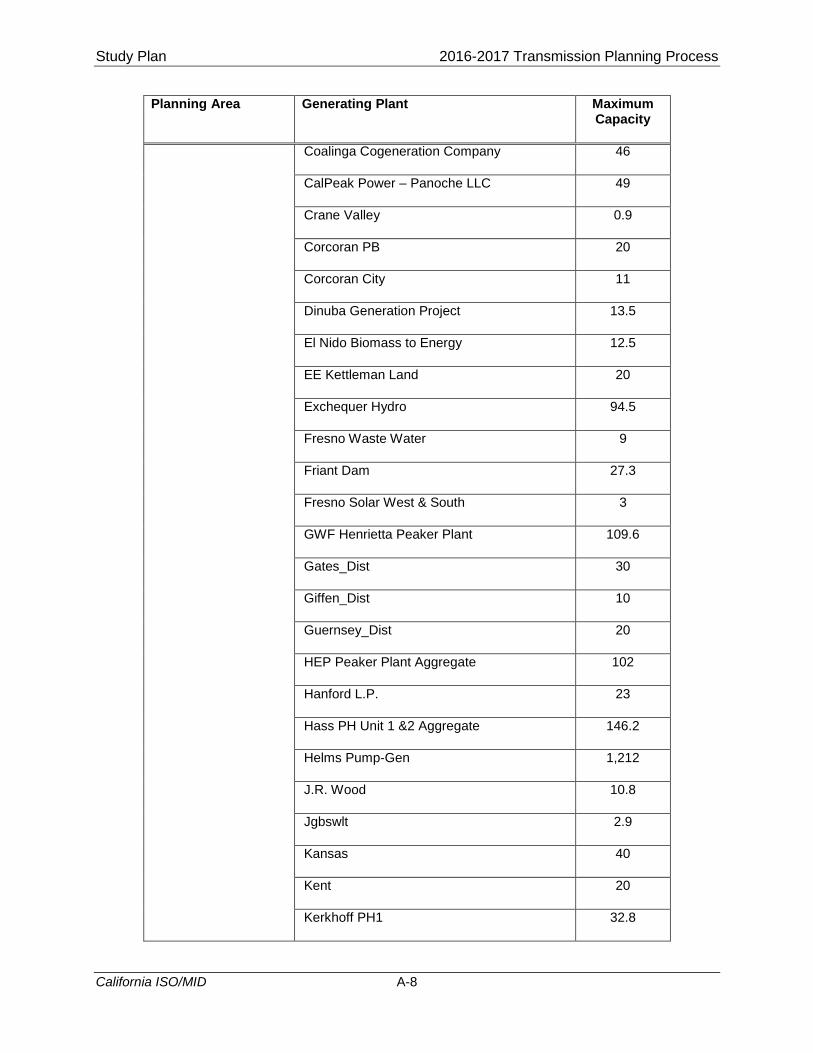
Study Plan 2016-2017 Transmission Planning Process
California ISO/MID A-8
Planning Area Generating Plant Maximum Capacity
Coalinga Cogeneration Company 46
CalPeak Power – Panoche LLC 49
Crane Valley 0.9
Corcoran PB 20
Corcoran City 11
Dinuba Generation Project 13.5
El Nido Biomass to Energy 12.5
EE Kettleman Land 20
Exchequer Hydro 94.5
Fresno Waste Water 9
Friant Dam 27.3
Fresno Solar West & South 3
GWF Henrietta Peaker Plant 109.6
Gates_Dist 30
Giffen_Dist 10
Guernsey_Dist 20
HEP Peaker Plant Aggregate 102
Hanford L.P. 23
Hass PH Unit 1 &2 Aggregate 146.2
Helms Pump-Gen 1,212
J.R. Wood 10.8
Jgbswlt 2.9
Kansas 40
Kent 20
Kerkhoff PH1 32.8
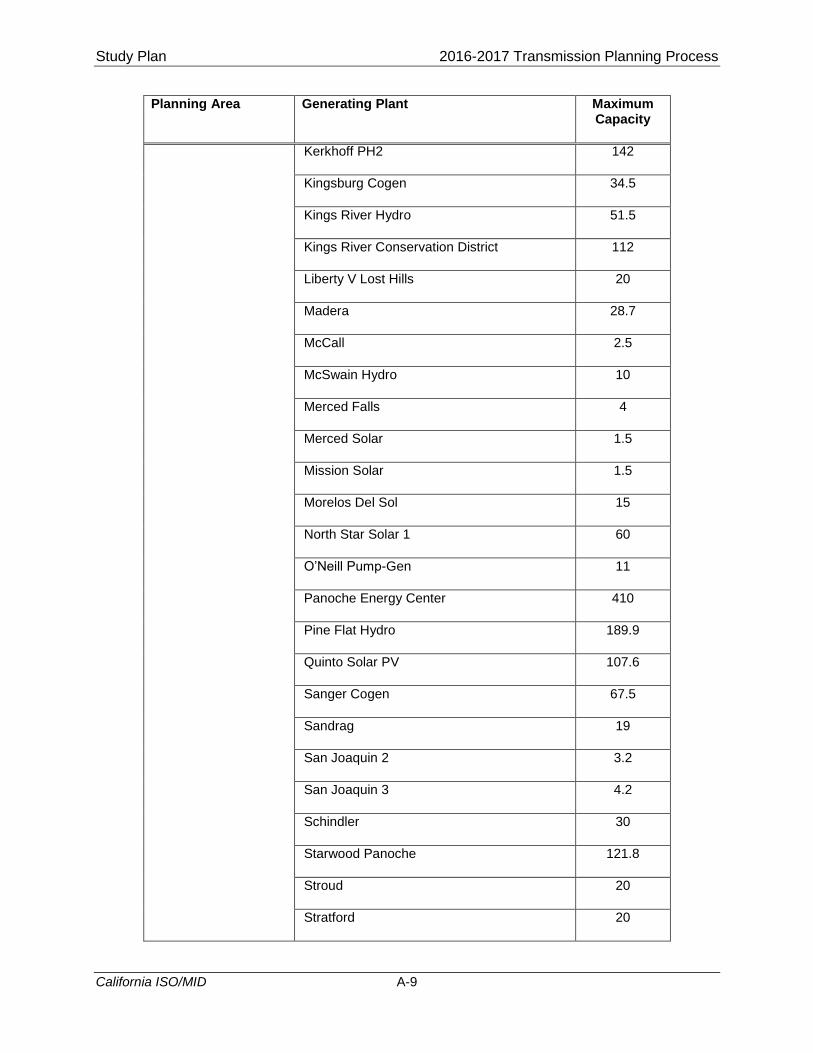
Study Plan 2016-2017 Transmission Planning Process
California ISO/MID A-9
Planning Area Generating Plant Maximum Capacity
Kerkhoff PH2 142
Kingsburg Cogen 34.5
Kings River Hydro 51.5
Kings River Conservation District 112
Liberty V Lost Hills 20
Madera 28.7
McCall 2.5
McSwain Hydro 10
Merced Falls 4
Merced Solar 1.5
Mission Solar 1.5
Morelos Del Sol 15
North Star Solar 1 60
O’Neill Pump-Gen 11
Panoche Energy Center 410
Pine Flat Hydro 189.9
Quinto Solar PV 107.6
Sanger Cogen 67.5
Sandrag 19
San Joaquin 2 3.2
San Joaquin 3 4.2
Schindler 30
Starwood Panoche 121.8
Stroud 20
Stratford 20
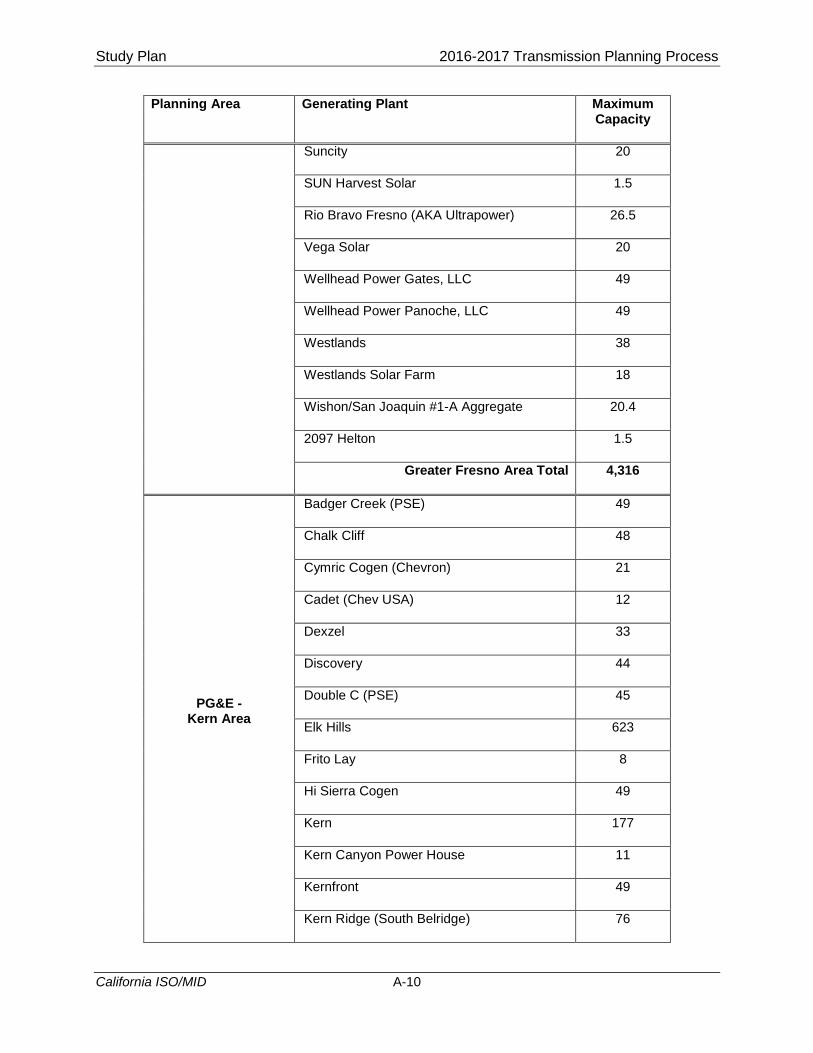
Study Plan 2016-2017 Transmission Planning Process
California ISO/MID A-10
Planning Area Generating Plant Maximum Capacity
Suncity 20
SUN Harvest Solar 1.5
Rio Bravo Fresno (AKA Ultrapower) 26.5
Vega Solar 20
Wellhead Power Gates, LLC 49
Wellhead Power Panoche, LLC 49
Westlands 38
Westlands Solar Farm 18
Wishon/San Joaquin #1-A Aggregate 20.4
2097 Helton 1.5
Greater Fresno Area Total 4,316
PG&E - Kern Area
Badger Creek (PSE) 49
Chalk Cliff 48
Cymric Cogen (Chevron) 21
Cadet (Chev USA) 12
Dexzel 33
Discovery 44
Double C (PSE) 45
Elk Hills 623
Frito Lay 8
Hi Sierra Cogen 49
Kern 177
Kern Canyon Power House 11
Kernfront 49
Kern Ridge (South Belridge) 76
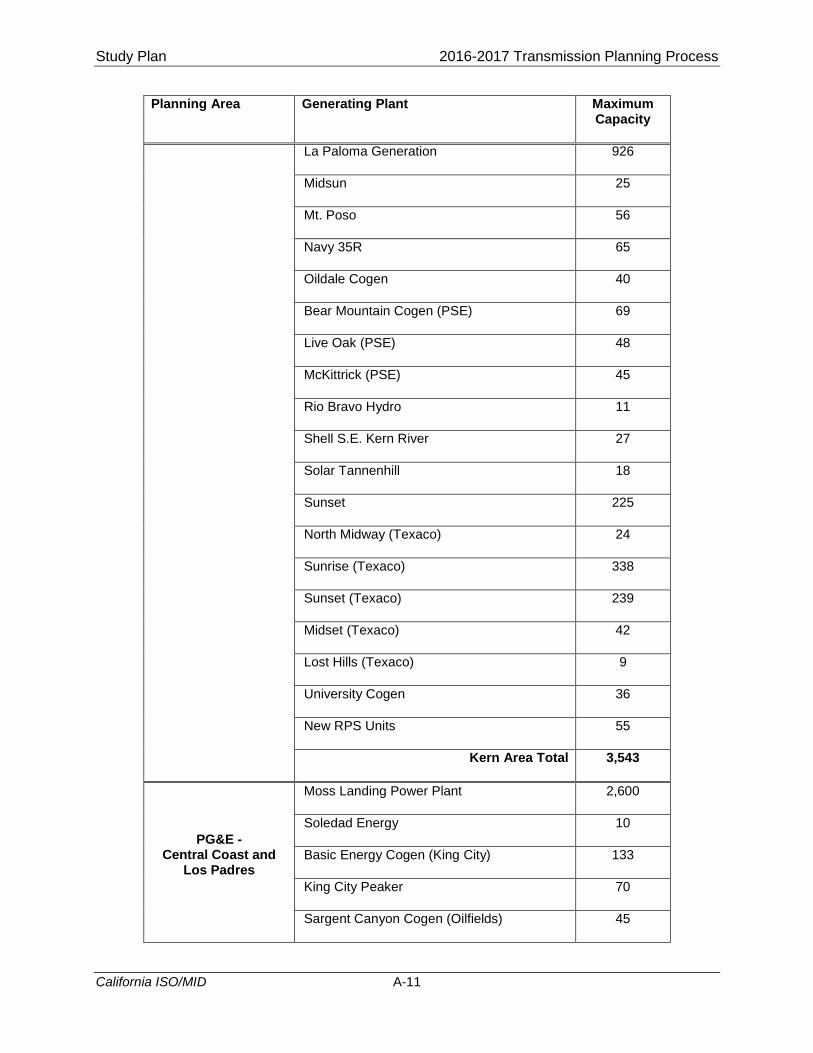
Study Plan 2016-2017 Transmission Planning Process
California ISO/MID A-11
Planning Area Generating Plant Maximum Capacity
La Paloma Generation 926
Midsun 25
Mt. Poso 56
Navy 35R 65
Oildale Cogen 40
Bear Mountain Cogen (PSE) 69
Live Oak (PSE) 48
McKittrick (PSE) 45
Rio Bravo Hydro 11
Shell S.E. Kern River 27
Solar Tannenhill 18
Sunset 225
North Midway (Texaco) 24
Sunrise (Texaco) 338
Sunset (Texaco) 239
Midset (Texaco) 42
Lost Hills (Texaco) 9
University Cogen 36
New RPS Units 55
Kern Area Total 3,543
PG&E - Central Coast and
Los Padres
Moss Landing Power Plant 2,600
Soledad Energy 10
Basic Energy Cogen (King City) 133
King City Peaker 70
Sargent Canyon Cogen (Oilfields) 45
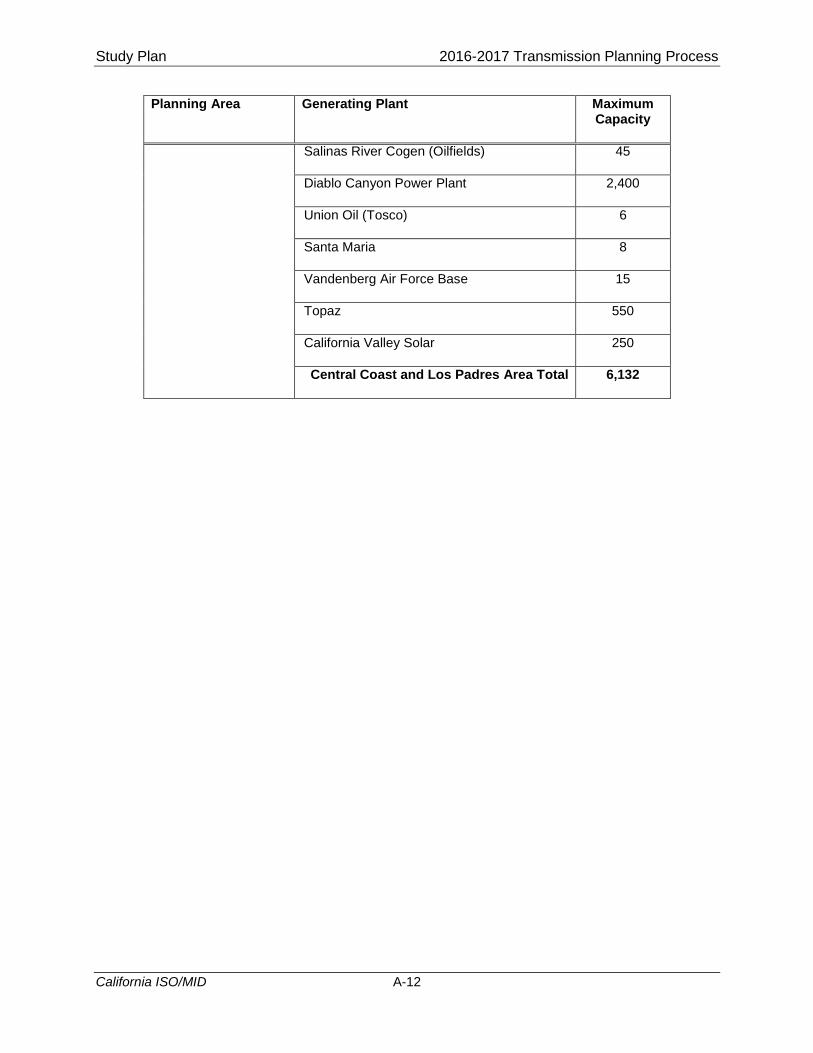
Study Plan 2016-2017 Transmission Planning Process
California ISO/MID A-12
Planning Area Generating Plant Maximum Capacity
Salinas River Cogen (Oilfields) 45
Diablo Canyon Power Plant 2,400
Union Oil (Tosco) 6
Santa Maria 8
Vandenberg Air Force Base 15
Topaz 550
California Valley Solar 250
Central Coast and Los Padres Area Total 6,132
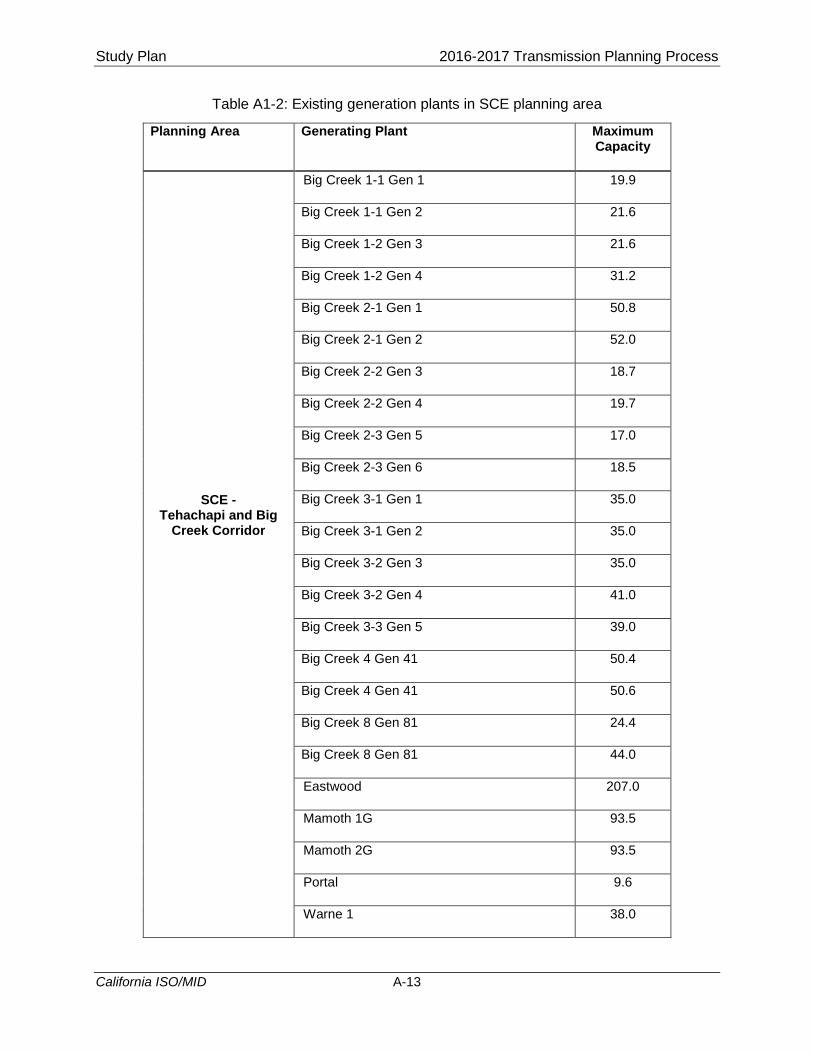
Study Plan 2016-2017 Transmission Planning Process
California ISO/MID A-13
Table A1-2: Existing generation plants in SCE planning area
Planning Area Generating Plant Maximum Capacity
SCE - Tehachapi and Big
Creek Corridor
Big Creek 1-1 Gen 1 19.9
Big Creek 1-1 Gen 2 21.6
Big Creek 1-2 Gen 3 21.6
Big Creek 1-2 Gen 4 31.2
Big Creek 2-1 Gen 1 50.8
Big Creek 2-1 Gen 2 52.0
Big Creek 2-2 Gen 3 18.7
Big Creek 2-2 Gen 4 19.7
Big Creek 2-3 Gen 5 17.0
Big Creek 2-3 Gen 6 18.5
Big Creek 3-1 Gen 1 35.0
Big Creek 3-1 Gen 2 35.0
Big Creek 3-2 Gen 3 35.0
Big Creek 3-2 Gen 4 41.0
Big Creek 3-3 Gen 5 39.0
Big Creek 4 Gen 41 50.4
Big Creek 4 Gen 41 50.6
Big Creek 8 Gen 81 24.4
Big Creek 8 Gen 81 44.0
Eastwood 207.0
Mamoth 1G 93.5
Mamoth 2G 93.5
Portal 9.6
Warne 1 38.0
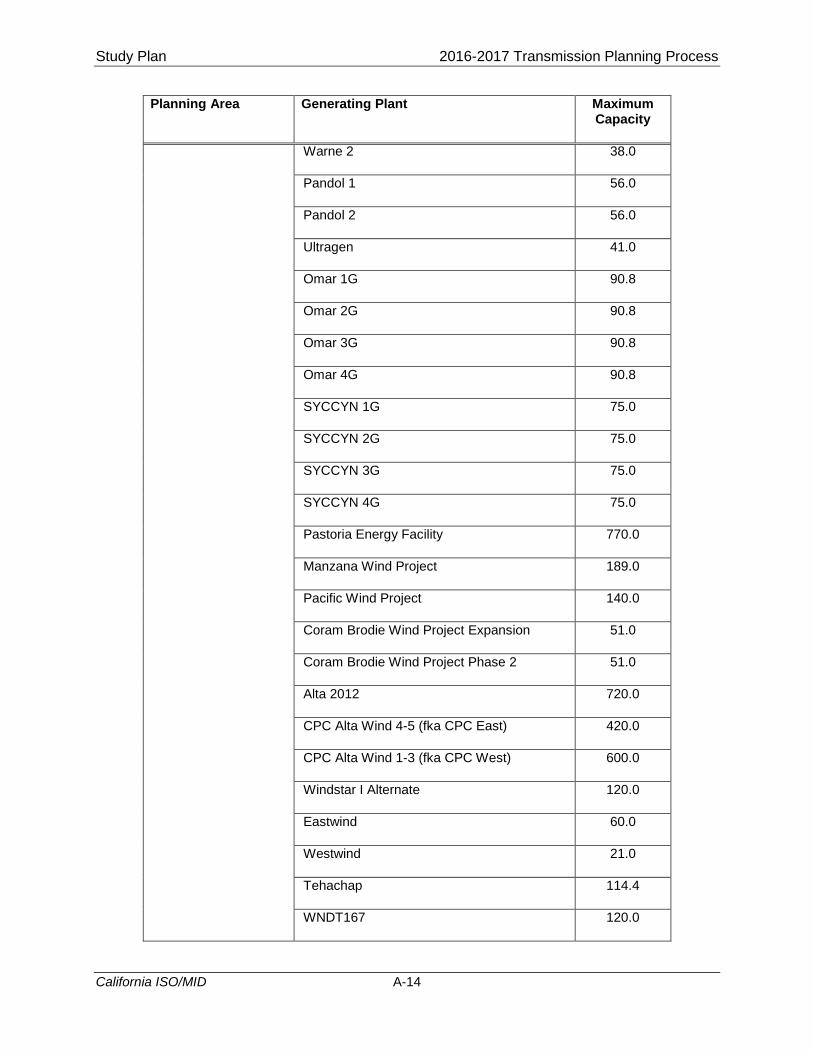
Study Plan 2016-2017 Transmission Planning Process
California ISO/MID A-14
Planning Area Generating Plant Maximum Capacity
Warne 2 38.0
Pandol 1 56.0
Pandol 2 56.0
Ultragen 41.0
Omar 1G 90.8
Omar 2G 90.8
Omar 3G 90.8
Omar 4G 90.8
SYCCYN 1G 75.0
SYCCYN 2G 75.0
SYCCYN 3G 75.0
SYCCYN 4G 75.0
Pastoria Energy Facility 770.0
Manzana Wind Project 189.0
Pacific Wind Project 140.0
Coram Brodie Wind Project Expansion 51.0
Coram Brodie Wind Project Phase 2 51.0
Alta 2012 720.0
CPC Alta Wind 4-5 (fka CPC East) 420.0
CPC Alta Wind 1-3 (fka CPC West) 600.0
Windstar I Alternate 120.0
Eastwind 60.0
Westwind 21.0
Tehachap 114.4
WNDT167 120.0
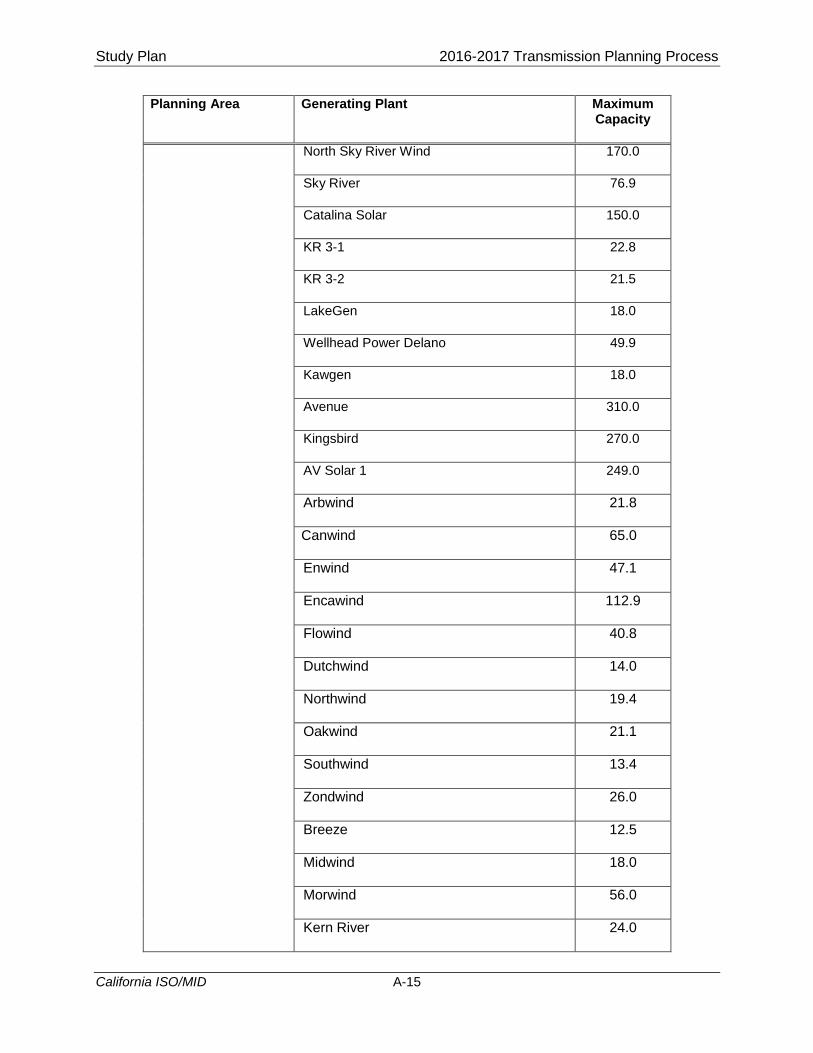
Study Plan 2016-2017 Transmission Planning Process
California ISO/MID A-15
Planning Area Generating Plant Maximum Capacity
North Sky River Wind 170.0
Sky River 76.9
Catalina Solar 150.0
KR 3-1 22.8
KR 3-2 21.5
LakeGen 18.0
Wellhead Power Delano 49.9
Kawgen 18.0
Avenue 310.0
Kingsbird 270.0
AV Solar 1 249.0
Arbwind 21.8
Canwind 65.0
Enwind 47.1
Encawind 112.9
Flowind 40.8
Dutchwind 14.0
Northwind 19.4
Oakwind 21.1
Southwind 13.4
Zondwind 26.0
Breeze 12.5
Midwind 18.0
Morwind 56.0
Kern River 24.0
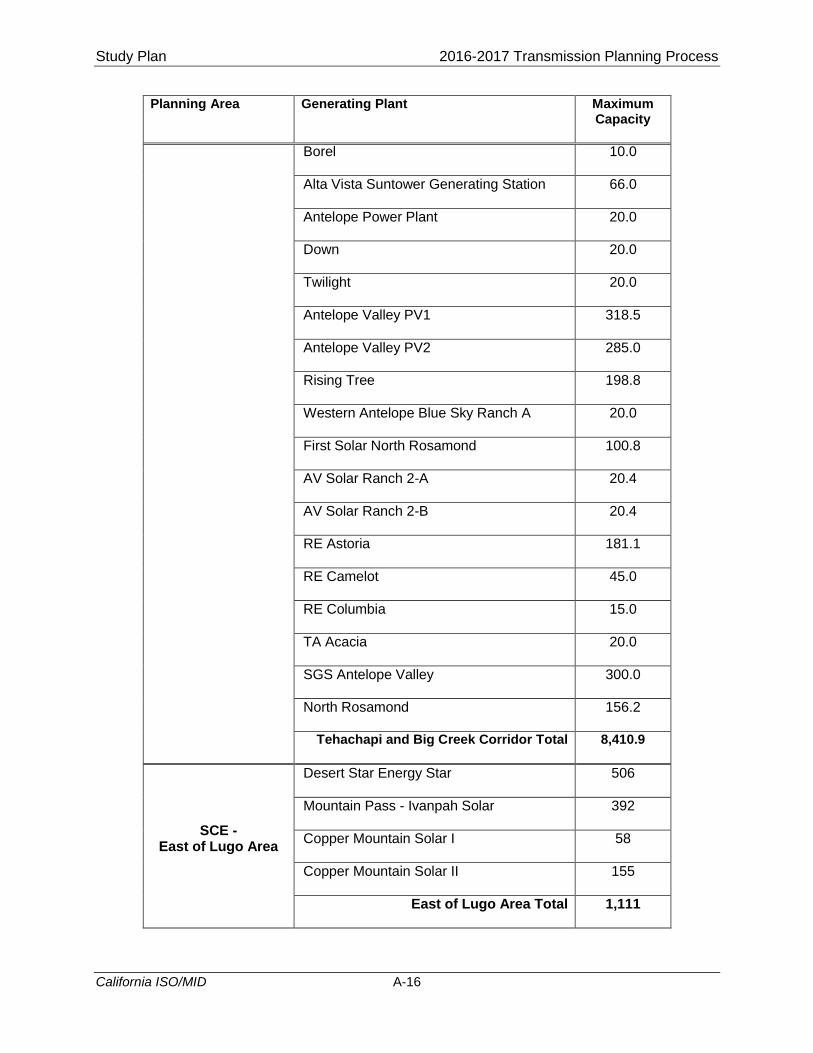
Study Plan 2016-2017 Transmission Planning Process
California ISO/MID A-16
Planning Area Generating Plant Maximum Capacity
Borel 10.0
Alta Vista Suntower Generating Station 66.0
Antelope Power Plant 20.0
Down 20.0
Twilight 20.0
Antelope Valley PV1 318.5
Antelope Valley PV2 285.0
Rising Tree 198.8
Western Antelope Blue Sky Ranch A 20.0
First Solar North Rosamond 100.8
AV Solar Ranch 2-A 20.4
AV Solar Ranch 2-B 20.4
RE Astoria 181.1
RE Camelot 45.0
RE Columbia 15.0
TA Acacia 20.0
SGS Antelope Valley 300.0
North Rosamond 156.2
Tehachapi and Big Creek Corridor Total 8,410.9
SCE - East of Lugo Area
Desert Star Energy Star 506
Mountain Pass - Ivanpah Solar 392
Copper Mountain Solar I 58
Copper Mountain Solar II 155
East of Lugo Area Total 1,111
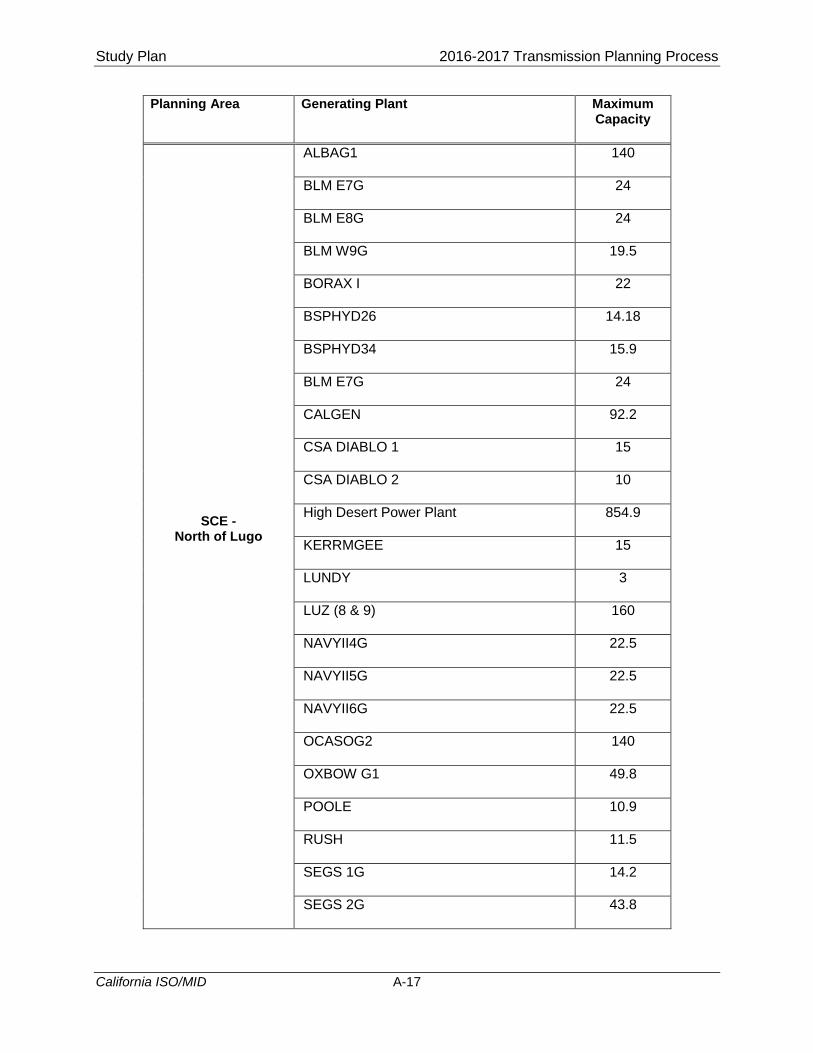
Study Plan 2016-2017 Transmission Planning Process
California ISO/MID A-17
Planning Area Generating Plant Maximum Capacity
SCE - North of Lugo
ALBAG1 140
BLM E7G 24
BLM E8G 24
BLM W9G 19.5
BORAX I 22
BSPHYD26 14.18
BSPHYD34 15.9
BLM E7G 24
CALGEN 92.2
CSA DIABLO 1 15
CSA DIABLO 2 10
High Desert Power Plant 854.9
KERRMGEE 15
LUNDY 3
LUZ (8 & 9) 160
NAVYII4G 22.5
NAVYII5G 22.5
NAVYII6G 22.5
OCASOG2 140
OXBOW G1 49.8
POOLE 10.9
RUSH 11.5
SEGS 1G 14.2
SEGS 2G 43.8
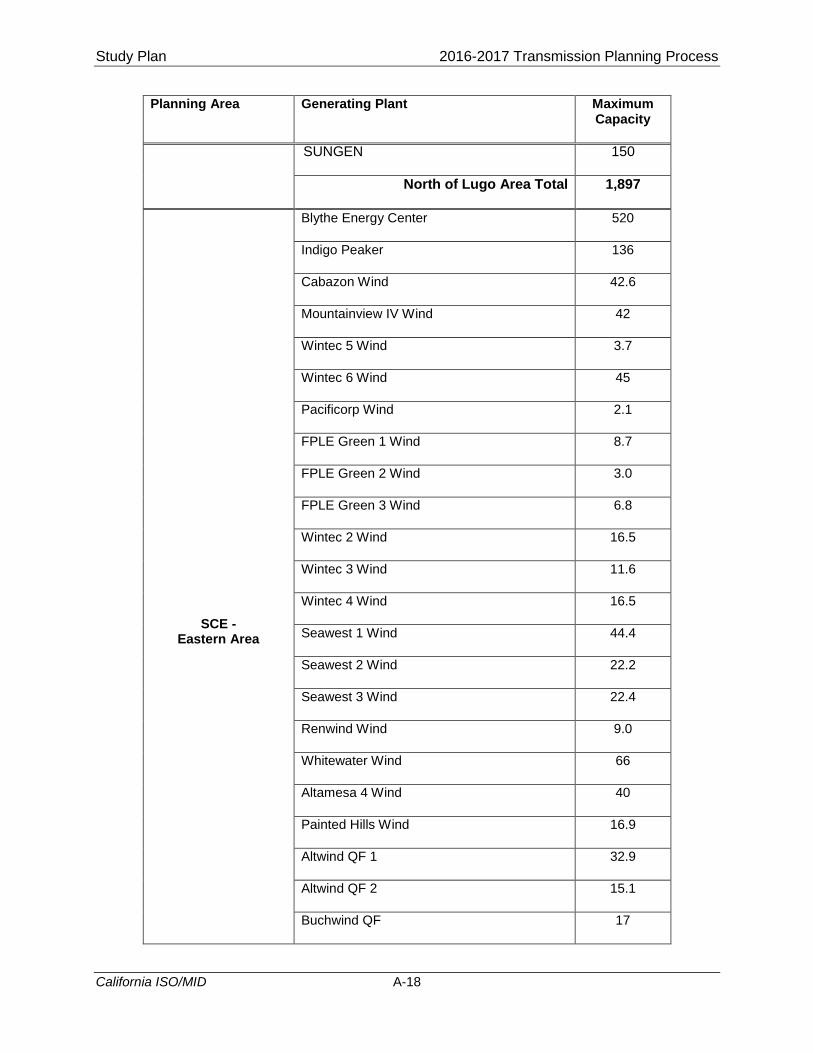
Study Plan 2016-2017 Transmission Planning Process
California ISO/MID A-18
Planning Area Generating Plant Maximum Capacity
SUNGEN 150
North of Lugo Area Total 1,897
SCE - Eastern Area
Blythe Energy Center 520
Indigo Peaker 136
Cabazon Wind 42.6
Mountainview IV Wind 42
Wintec 5 Wind 3.7
Wintec 6 Wind 45
Pacificorp Wind 2.1
FPLE Green 1 Wind 8.7
FPLE Green 2 Wind 3.0
FPLE Green 3 Wind 6.8
Wintec 2 Wind 16.5
Wintec 3 Wind 11.6
Wintec 4 Wind 16.5
Seawest 1 Wind 44.4
Seawest 2 Wind 22.2
Seawest 3 Wind 22.4
Renwind Wind 9.0
Whitewater Wind 66
Altamesa 4 Wind 40
Painted Hills Wind 16.9
Altwind QF 1 32.9
Altwind QF 2 15.1
Buchwind QF 17
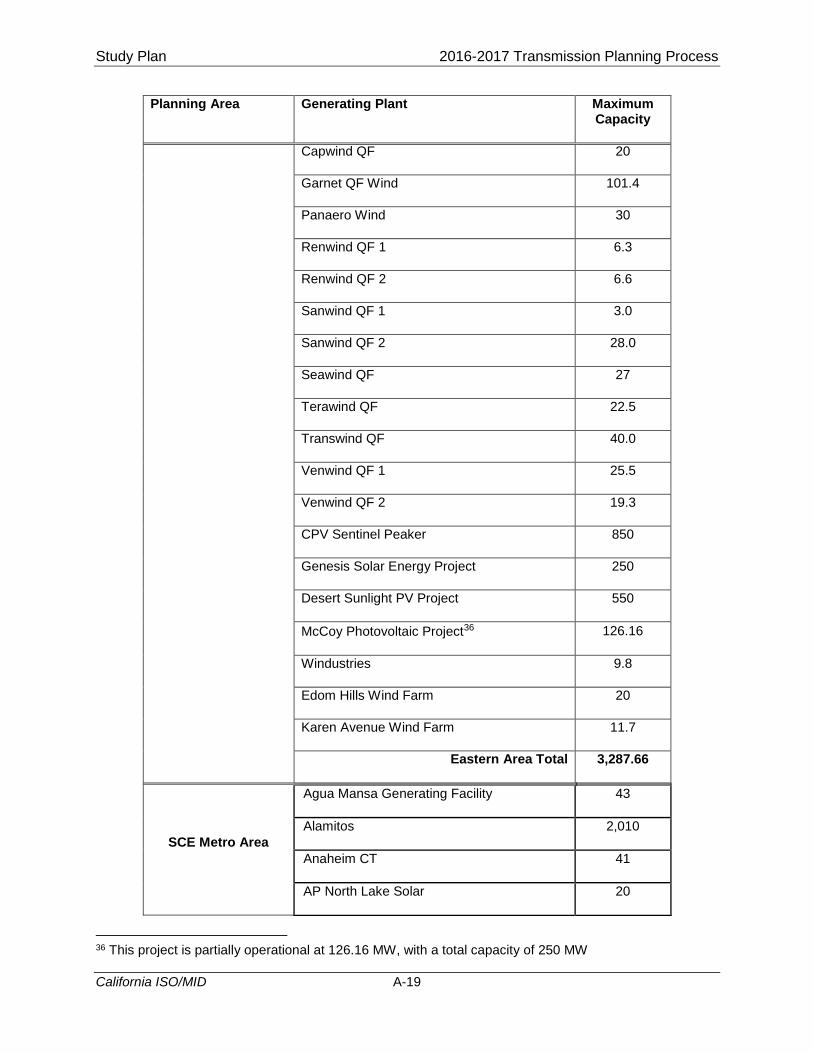
Study Plan 2016-2017 Transmission Planning Process
California ISO/MID A-19
Planning Area Generating Plant Maximum Capacity
Capwind QF 20
Garnet QF Wind 101.4
Panaero Wind 30
Renwind QF 1 6.3
Renwind QF 2 6.6
Sanwind QF 1 3.0
Sanwind QF 2 28.0
Seawind QF 27
Terawind QF 22.5
Transwind QF 40.0
Venwind QF 1 25.5
Venwind QF 2 19.3
CPV Sentinel Peaker 850
Genesis Solar Energy Project 250
Desert Sunlight PV Project 550
McCoy Photovoltaic Project36 126.16
Windustries 9.8
Edom Hills Wind Farm 20
Karen Avenue Wind Farm 11.7
Eastern Area Total 3,287.66
SCE Metro Area
Agua Mansa Generating Facility 43
Alamitos 2,010
Anaheim CT 41
AP North Lake Solar 20
36 This project is partially operational at 126.16 MW, with a total capacity of 250 MW
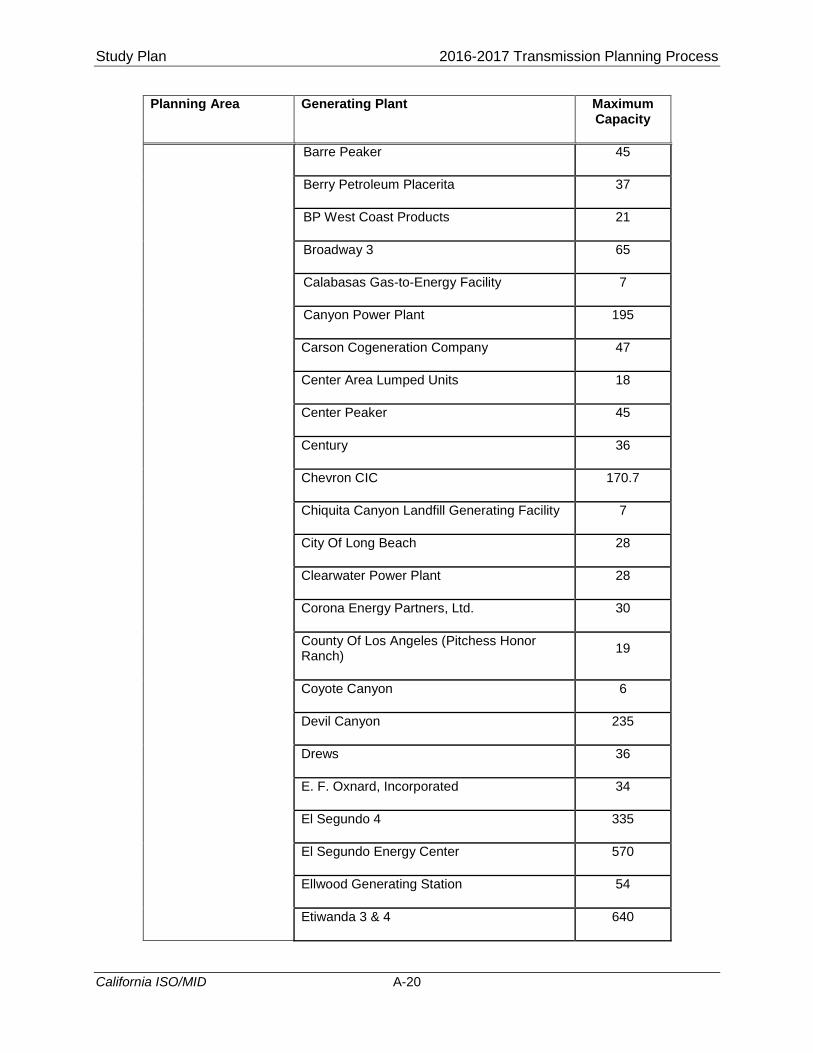
Study Plan 2016-2017 Transmission Planning Process
California ISO/MID A-20
Planning Area Generating Plant Maximum Capacity
Barre Peaker 45
Berry Petroleum Placerita 37
BP West Coast Products 21
Broadway 3 65
Calabasas Gas-to-Energy Facility 7
Canyon Power Plant 195
Carson Cogeneration Company 47
Center Area Lumped Units 18
Center Peaker 45
Century 36
Chevron CIC 170.7
Chiquita Canyon Landfill Generating Facility 7
City Of Long Beach 28
Clearwater Power Plant 28
Corona Energy Partners, Ltd. 30
County Of Los Angeles (Pitchess Honor Ranch)
19
Coyote Canyon 6
Devil Canyon 235
Drews 36
E. F. Oxnard, Incorporated 34
El Segundo 4 335
El Segundo Energy Center 570
Ellwood Generating Station 54
Etiwanda 3 & 4 640
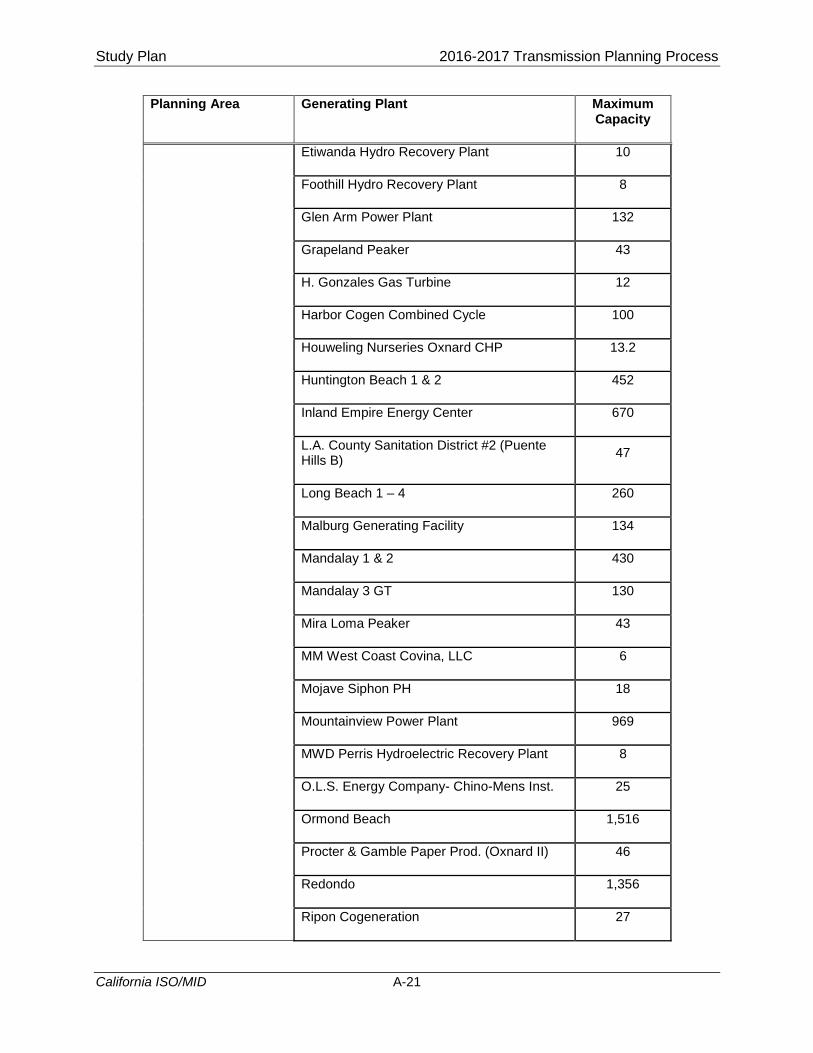
Study Plan 2016-2017 Transmission Planning Process
California ISO/MID A-21
Planning Area Generating Plant Maximum Capacity
Etiwanda Hydro Recovery Plant 10
Foothill Hydro Recovery Plant 8
Glen Arm Power Plant 132
Grapeland Peaker 43
H. Gonzales Gas Turbine 12
Harbor Cogen Combined Cycle 100
Houweling Nurseries Oxnard CHP 13.2
Huntington Beach 1 & 2 452
Inland Empire Energy Center 670
L.A. County Sanitation District #2 (Puente Hills B)
47
Long Beach 1 – 4 260
Malburg Generating Facility 134
Mandalay 1 & 2 430
Mandalay 3 GT 130
Mira Loma Peaker 43
MM West Coast Covina, LLC 6
Mojave Siphon PH 18
Mountainview Power Plant 969
MWD Perris Hydroelectric Recovery Plant 8
O.L.S. Energy Company- Chino-Mens Inst. 25
Ormond Beach 1,516
Procter & Gamble Paper Prod. (Oxnard II) 46
Redondo 1,356
Ripon Cogeneration 27
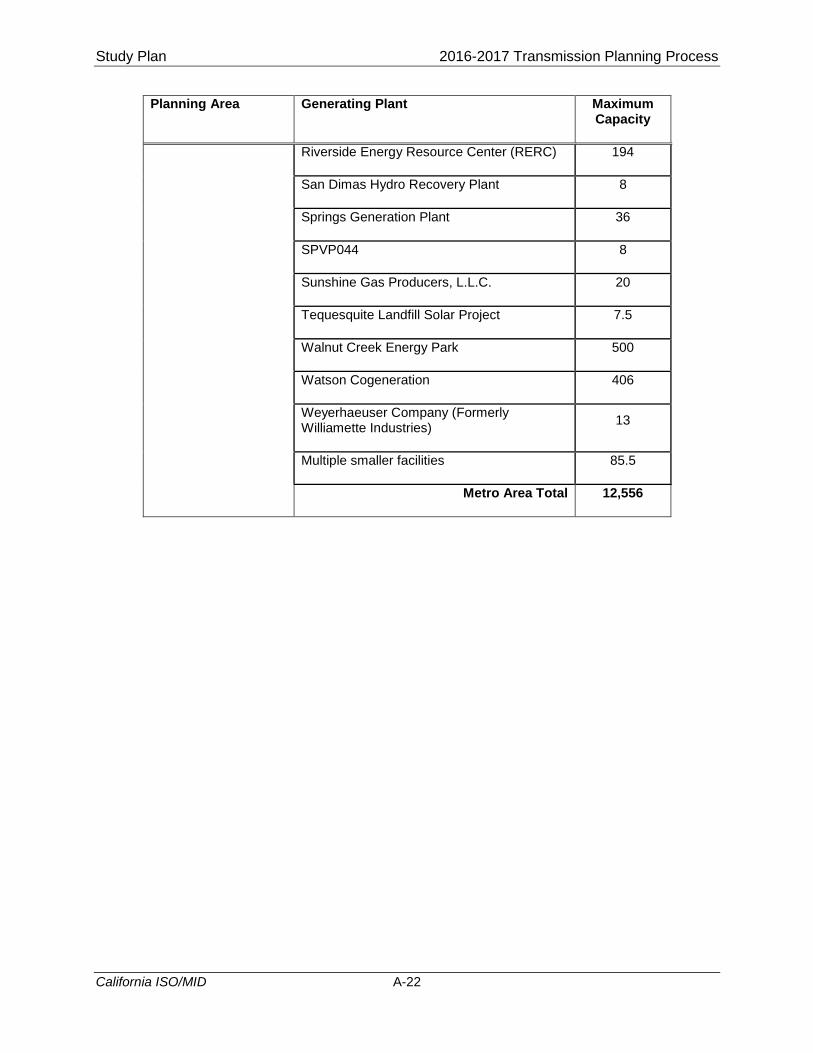
Study Plan 2016-2017 Transmission Planning Process
California ISO/MID A-22
Planning Area Generating Plant Maximum Capacity
Riverside Energy Resource Center (RERC) 194
San Dimas Hydro Recovery Plant 8
Springs Generation Plant 36
SPVP044 8
Sunshine Gas Producers, L.L.C. 20
Tequesquite Landfill Solar Project 7.5
Walnut Creek Energy Park 500
Watson Cogeneration 406
Weyerhaeuser Company (Formerly Williamette Industries)
13
Multiple smaller facilities 85.5
Metro Area Total 12,556
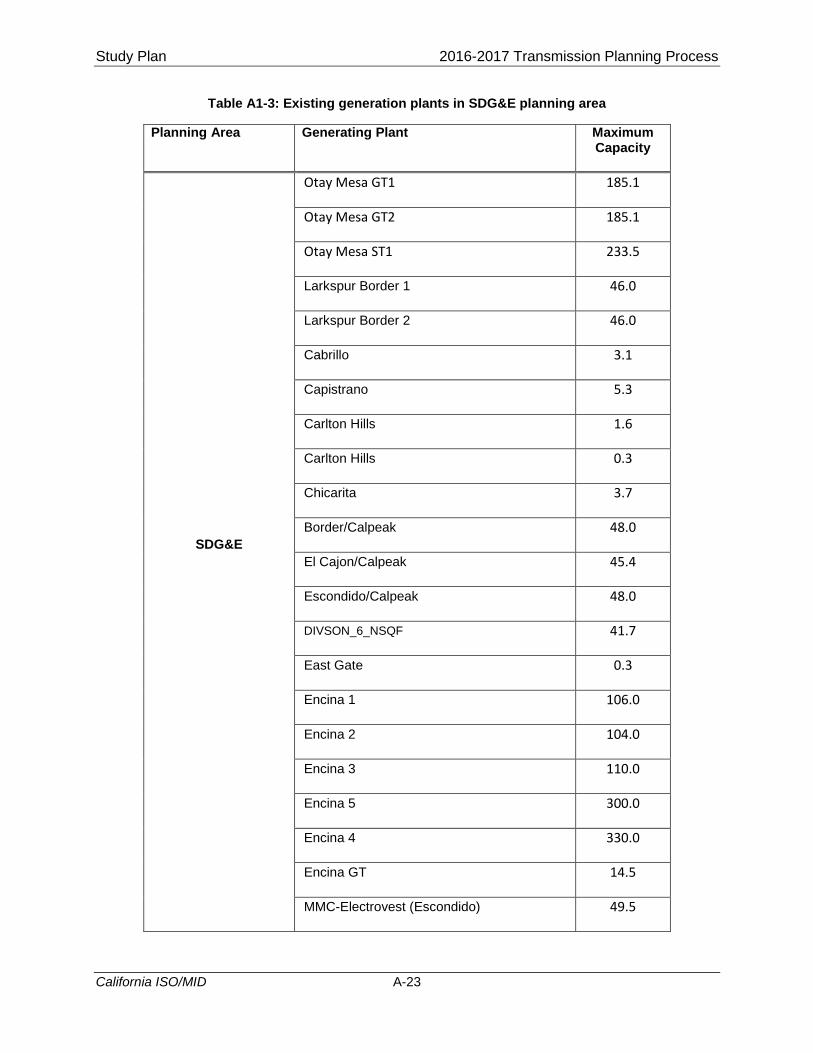
Study Plan 2016-2017 Transmission Planning Process
California ISO/MID A-23
Table A1-3: Existing generation plants in SDG&E planning area
Planning Area Generating Plant Maximum Capacity
SDG&E
Otay Mesa GT1 185.1
Otay Mesa GT2 185.1
Otay Mesa ST1 233.5
Larkspur Border 1 46.0
Larkspur Border 2 46.0
Cabrillo 3.1
Capistrano 5.3
Carlton Hills 1.6
Carlton Hills 0.3
Chicarita 3.7
Border/Calpeak 48.0
El Cajon/Calpeak 45.4
Escondido/Calpeak 48.0
DIVSON_6_NSQF 41.7
East Gate 0.3
Encina 1 106.0
Encina 2 104.0
Encina 3 110.0
Encina 5 300.0
Encina 4 330.0
Encina GT 14.5
MMC-Electrovest (Escondido) 49.5
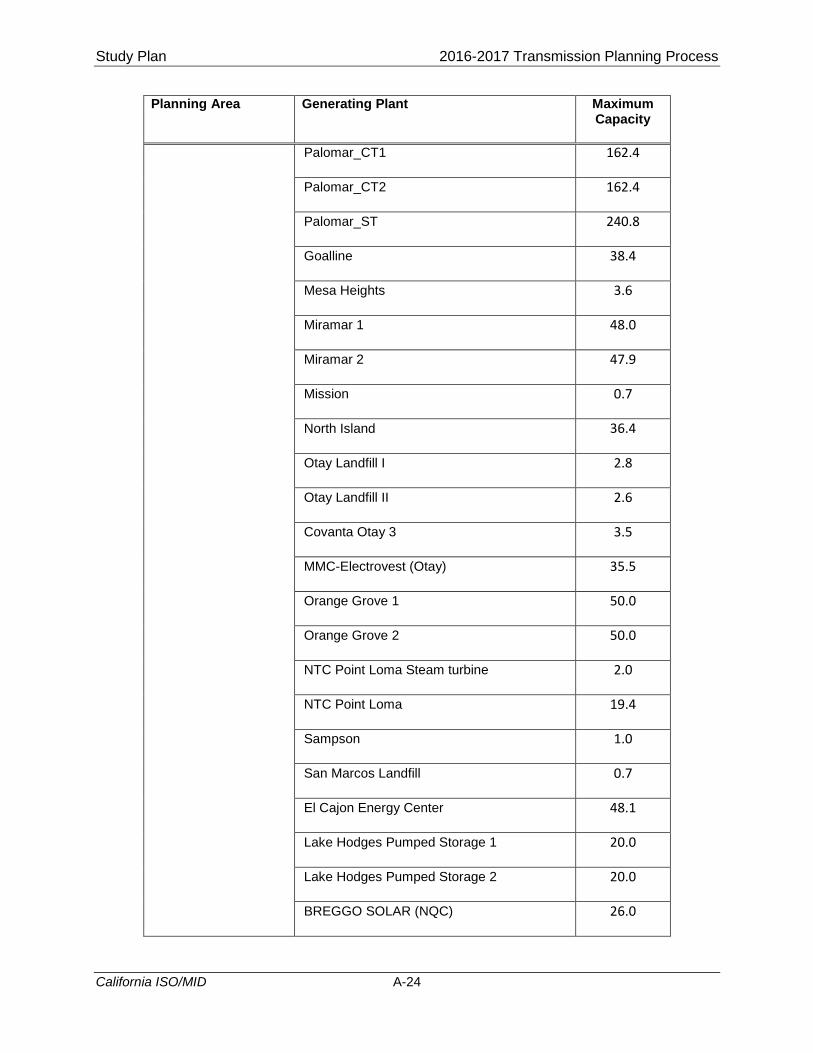
Study Plan 2016-2017 Transmission Planning Process
California ISO/MID A-24
Planning Area Generating Plant Maximum Capacity
Palomar_CT1 162.4
Palomar_CT2 162.4
Palomar_ST 240.8
Goalline 38.4
Mesa Heights 3.6
Miramar 1 48.0
Miramar 2 47.9
Mission 0.7
North Island 36.4
Otay Landfill I 2.8
Otay Landfill II 2.6
Covanta Otay 3 3.5
MMC-Electrovest (Otay) 35.5
Orange Grove 1 50.0
Orange Grove 2 50.0
NTC Point Loma Steam turbine 2.0
NTC Point Loma 19.4
Sampson 1.0
San Marcos Landfill 0.7
El Cajon Energy Center 48.1
Lake Hodges Pumped Storage 1 20.0
Lake Hodges Pumped Storage 2 20.0
BREGGO SOLAR (NQC) 26.0
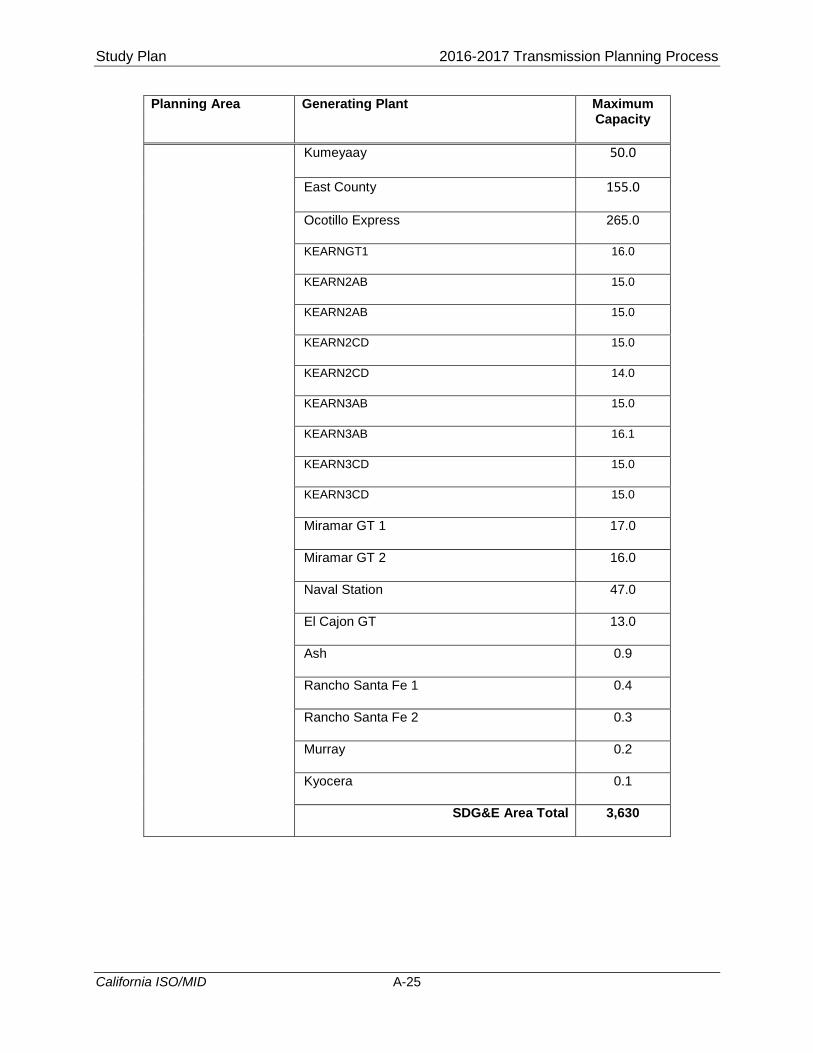
Study Plan 2016-2017 Transmission Planning Process
California ISO/MID A-25
Planning Area Generating Plant Maximum Capacity
Kumeyaay 50.0
East County 155.0
Ocotillo Express 265.0
KEARNGT1 16.0
KEARN2AB 15.0
KEARN2AB 15.0
KEARN2CD 15.0
KEARN2CD 14.0
KEARN3AB 15.0
KEARN3AB 16.1
KEARN3CD 15.0
KEARN3CD 15.0
Miramar GT 1 17.0
Miramar GT 2 16.0
Naval Station 47.0
El Cajon GT 13.0
Ash 0.9
Rancho Santa Fe 1 0.4
Rancho Santa Fe 2 0.3
Murray 0.2
Kyocera 0.1
SDG&E Area Total 3,630
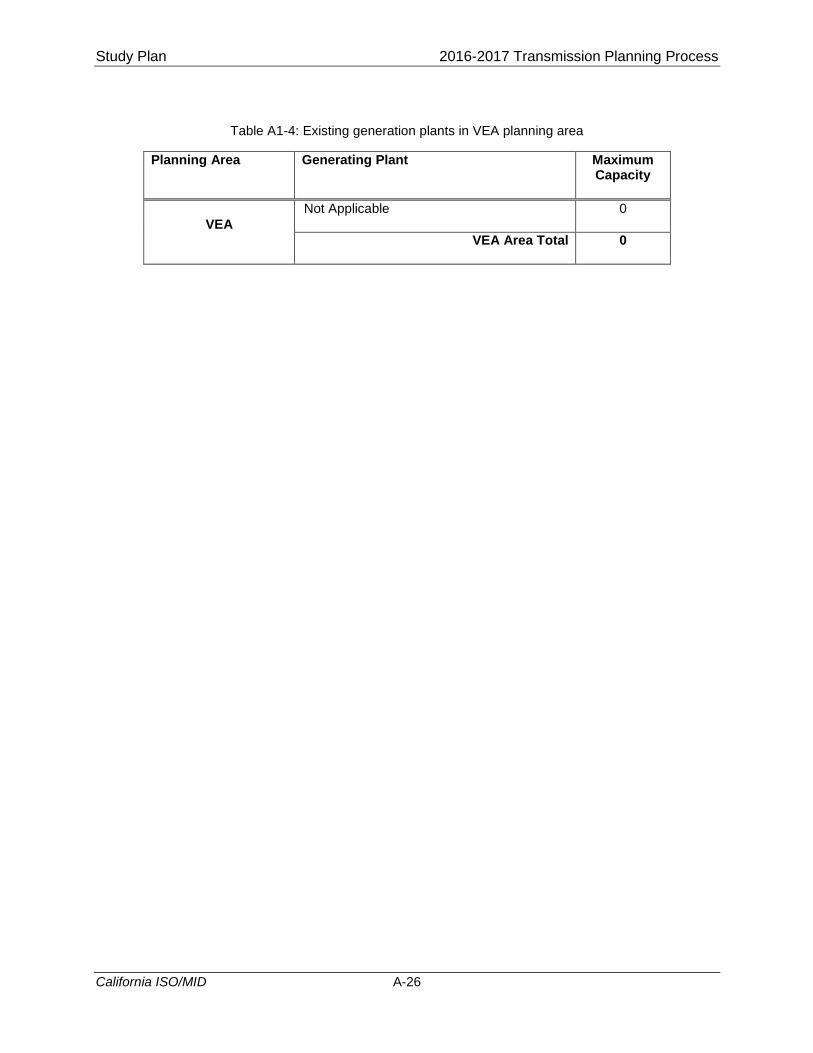
Study Plan 2016-2017 Transmission Planning Process
California ISO/MID A-26
Table A1-4: Existing generation plants in VEA planning area
Planning Area Generating Plant Maximum Capacity
VEA
Not Applicable 0
VEA Area Total 0
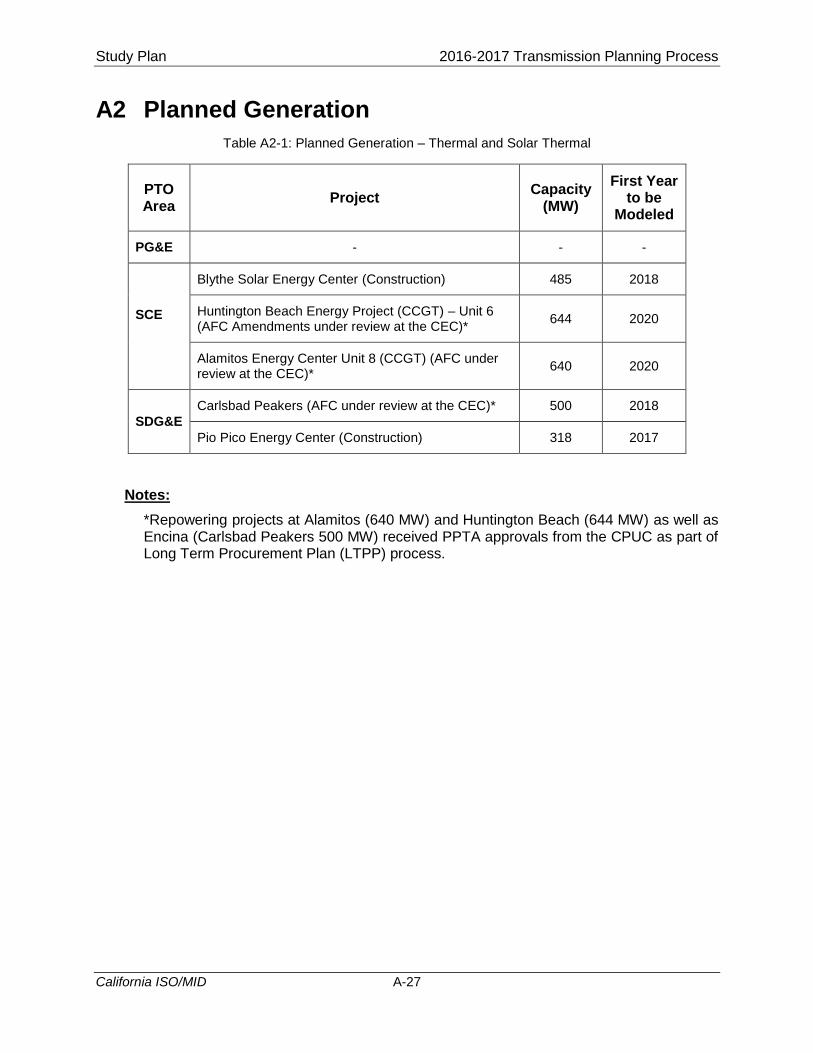
Study Plan 2016-2017 Transmission Planning Process
California ISO/MID A-27
A2 Planned Generation
Table A2-1: Planned Generation – Thermal and Solar Thermal
PTO Area
Project Capacity
(MW)
First Year to be
Modeled
PG&E - - -
SCE
Blythe Solar Energy Center (Construction) 485 2018
Huntington Beach Energy Project (CCGT) – Unit 6 (AFC Amendments under review at the CEC)*
644 2020
Alamitos Energy Center Unit 8 (CCGT) (AFC under review at the CEC)*
640 2020
SDG&E
Carlsbad Peakers (AFC under review at the CEC)* 500 2018
Pio Pico Energy Center (Construction) 318 2017
Notes:
*Repowering projects at Alamitos (640 MW) and Huntington Beach (644 MW) as well as Encina (Carlsbad Peakers 500 MW) received PPTA approvals from the CPUC as part of Long Term Procurement Plan (LTPP) process.
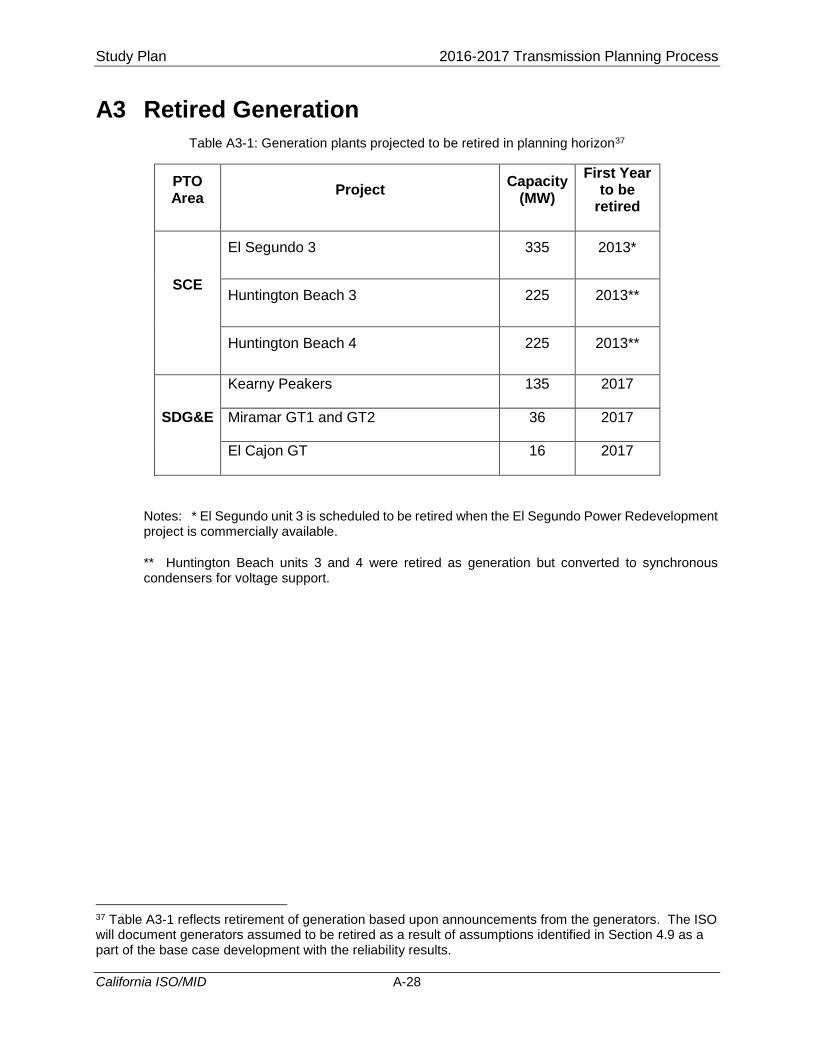
Study Plan 2016-2017 Transmission Planning Process
California ISO/MID A-28
A3 Retired Generation
Table A3-1: Generation plants projected to be retired in planning horizon37
PTO Area
Project Capacity
(MW)
First Year to be
retired
SCE
El Segundo 3 335 2013*
Huntington Beach 3 225 2013**
Huntington Beach 4 225 2013**
SDG&E
Kearny Peakers 135 2017
Miramar GT1 and GT2 36 2017
El Cajon GT 16 2017
Notes: * El Segundo unit 3 is scheduled to be retired when the El Segundo Power Redevelopment project is commercially available.
** Huntington Beach units 3 and 4 were retired as generation but converted to synchronous condensers for voltage support.
37 Table A3-1 reflects retirement of generation based upon announcements from the generators. The ISO will document generators assumed to be retired as a result of assumptions identified in Section 4.9 as a part of the base case development with the reliability results.
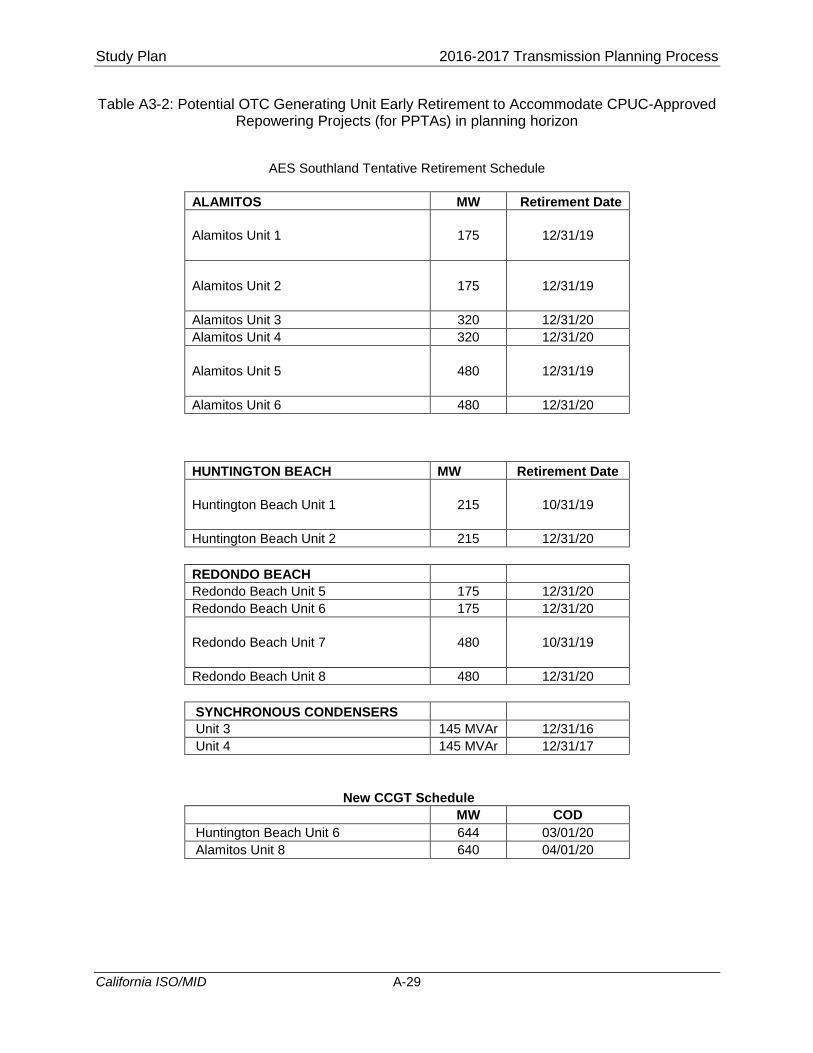
Study Plan 2016-2017 Transmission Planning Process
California ISO/MID A-29
Table A3-2: Potential OTC Generating Unit Early Retirement to Accommodate CPUC-Approved Repowering Projects (for PPTAs) in planning horizon
AES Southland Tentative Retirement Schedule
ALAMITOS MW Retirement Date
Alamitos Unit 1 175 12/31/19
Alamitos Unit 2 175 12/31/19
Alamitos Unit 3 320 12/31/20
Alamitos Unit 4 320 12/31/20
Alamitos Unit 5 480 12/31/19
Alamitos Unit 6 480 12/31/20
HUNTINGTON BEACH MW Retirement Date
Huntington Beach Unit 1 215 10/31/19
Huntington Beach Unit 2 215 12/31/20
REDONDO BEACH
Redondo Beach Unit 5 175 12/31/20
Redondo Beach Unit 6 175 12/31/20
Redondo Beach Unit 7 480 10/31/19
Redondo Beach Unit 8 480 12/31/20
SYNCHRONOUS CONDENSERS
Unit 3 145 MVAr 12/31/16
Unit 4 145 MVAr 12/31/17
New CCGT Schedule
MW COD
Huntington Beach Unit 6 644 03/01/20
Alamitos Unit 8 640 04/01/20
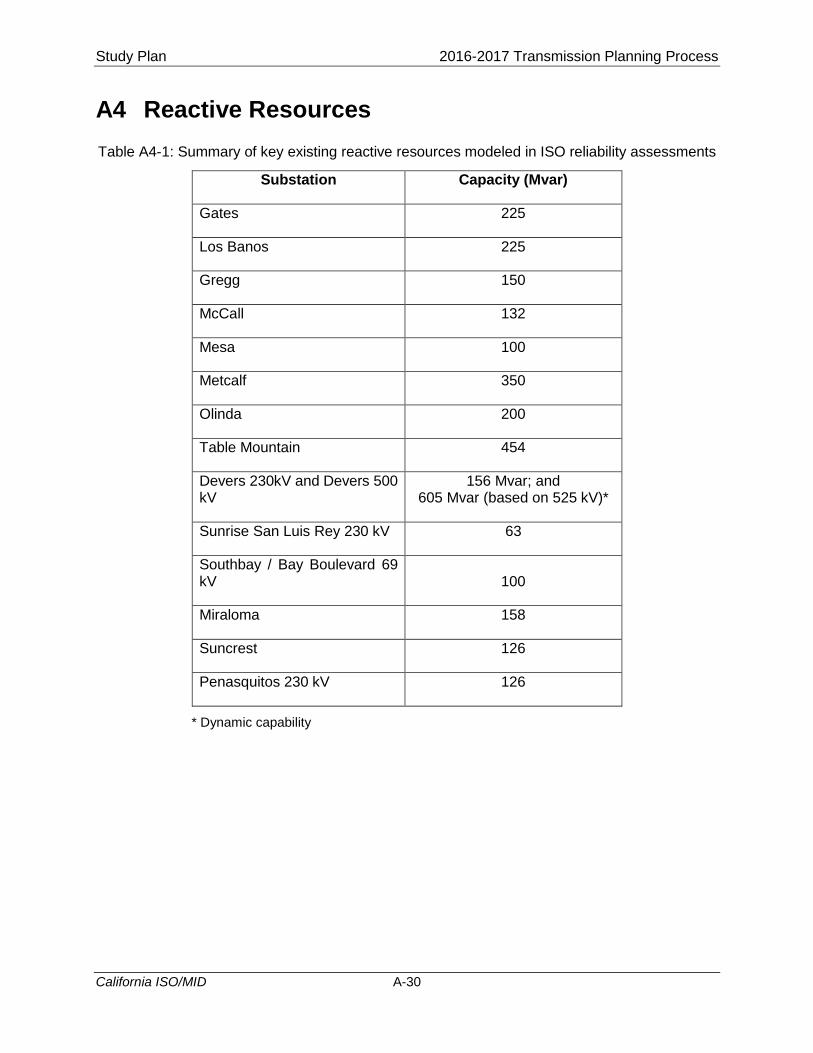
Study Plan 2016-2017 Transmission Planning Process
California ISO/MID A-30
A4 Reactive Resources
Table A4-1: Summary of key existing reactive resources modeled in ISO reliability assessments
Substation Capacity (Mvar)
Gates 225
Los Banos 225
Gregg 150
McCall 132
Mesa 100
Metcalf 350
Olinda 200
Table Mountain 454
Devers 230kV and Devers 500 kV
156 Mvar; and 605 Mvar (based on 525 kV)*
Sunrise San Luis Rey 230 kV 63
Southbay / Bay Boulevard 69 kV 100
Miraloma 158
Suncrest 126
Penasquitos 230 kV 126
* Dynamic capability
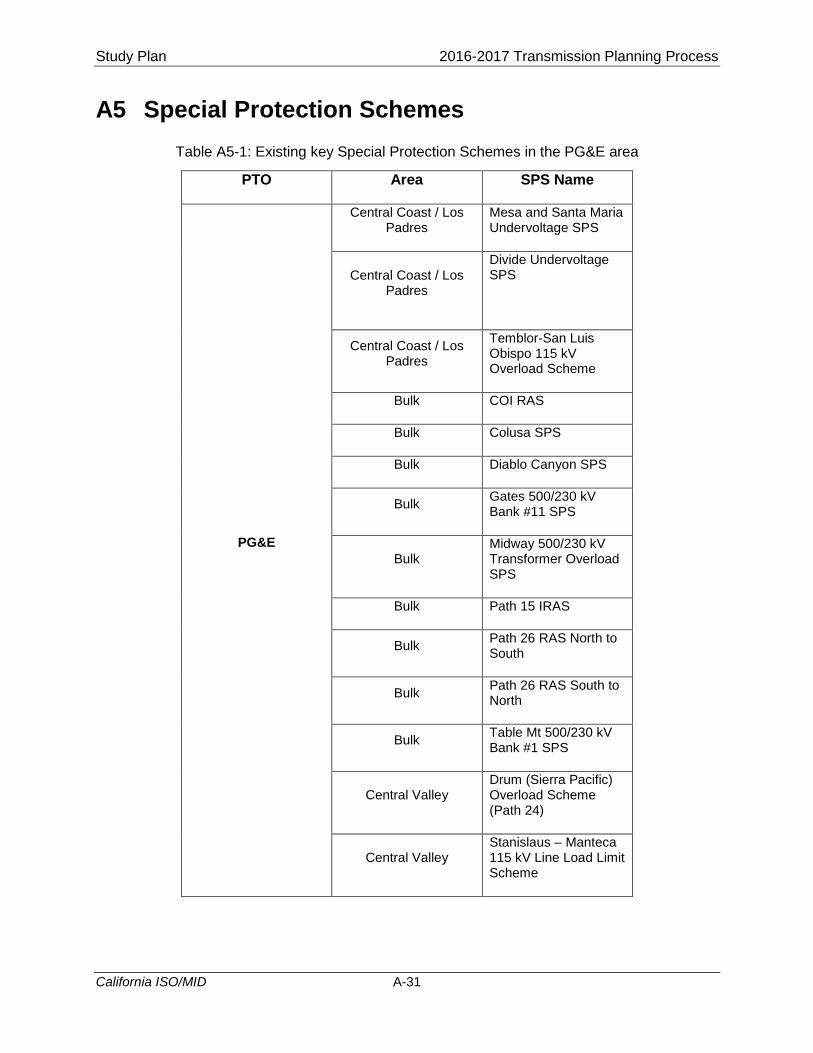
Study Plan 2016-2017 Transmission Planning Process
California ISO/MID A-31
A5 Special Protection Schemes
Table A5-1: Existing key Special Protection Schemes in the PG&E area
PTO Area SPS Name
PG&E
Central Coast / Los Padres
Mesa and Santa Maria Undervoltage SPS
Central Coast / Los Padres
Divide Undervoltage SPS
Central Coast / Los Padres
Temblor-San Luis Obispo 115 kV Overload Scheme
Bulk COI RAS
Bulk Colusa SPS
Bulk Diablo Canyon SPS
Bulk Gates 500/230 kV Bank #11 SPS
Bulk Midway 500/230 kV Transformer Overload SPS
Bulk Path 15 IRAS
Bulk Path 26 RAS North to South
Bulk Path 26 RAS South to North
Bulk Table Mt 500/230 kV Bank #1 SPS
Central Valley Drum (Sierra Pacific) Overload Scheme (Path 24)
Central Valley Stanislaus – Manteca 115 kV Line Load Limit Scheme
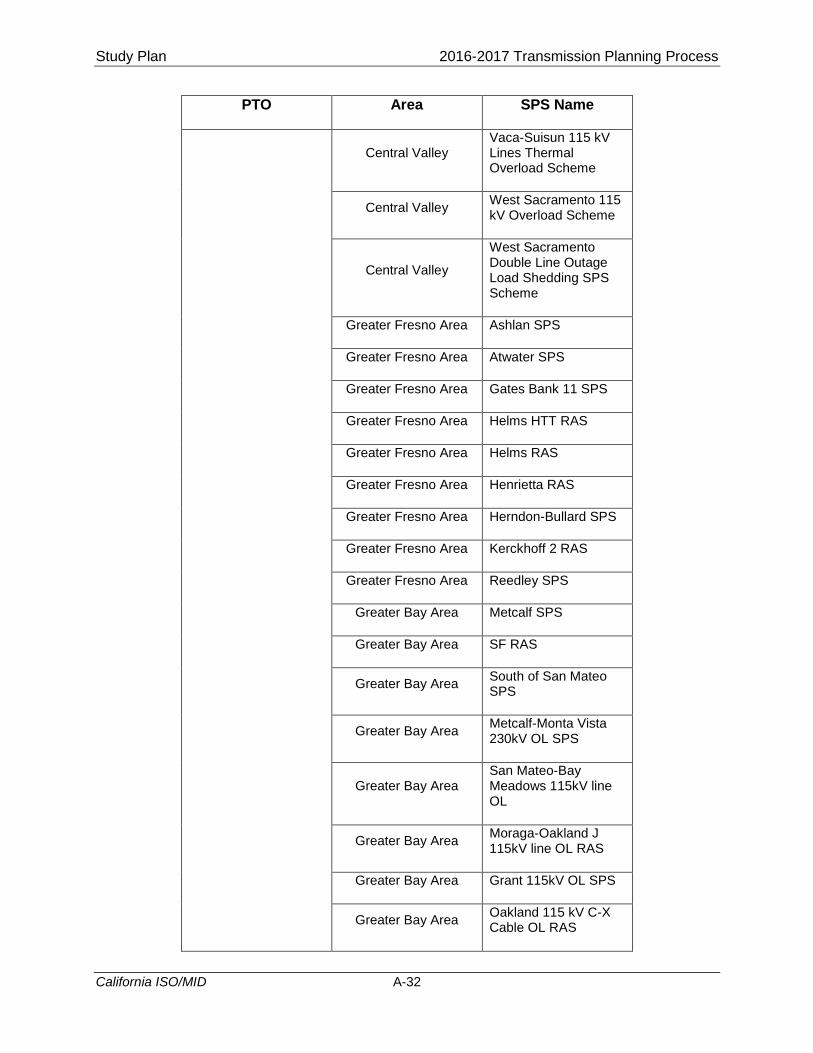
Study Plan 2016-2017 Transmission Planning Process
California ISO/MID A-32
PTO Area SPS Name
Central Valley Vaca-Suisun 115 kV Lines Thermal Overload Scheme
Central Valley West Sacramento 115 kV Overload Scheme
Central Valley
West Sacramento Double Line Outage Load Shedding SPS Scheme
Greater Fresno Area Ashlan SPS
Greater Fresno Area Atwater SPS
Greater Fresno Area Gates Bank 11 SPS
Greater Fresno Area Helms HTT RAS
Greater Fresno Area Helms RAS
Greater Fresno Area Henrietta RAS
Greater Fresno Area Herndon-Bullard SPS
Greater Fresno Area Kerckhoff 2 RAS
Greater Fresno Area Reedley SPS
Greater Bay Area Metcalf SPS
Greater Bay Area SF RAS
Greater Bay Area South of San Mateo SPS
Greater Bay Area Metcalf-Monta Vista 230kV OL SPS
Greater Bay Area San Mateo-Bay Meadows 115kV line OL
Greater Bay Area Moraga-Oakland J 115kV line OL RAS
Greater Bay Area Grant 115kV OL SPS
Greater Bay Area Oakland 115 kV C-X Cable OL RAS
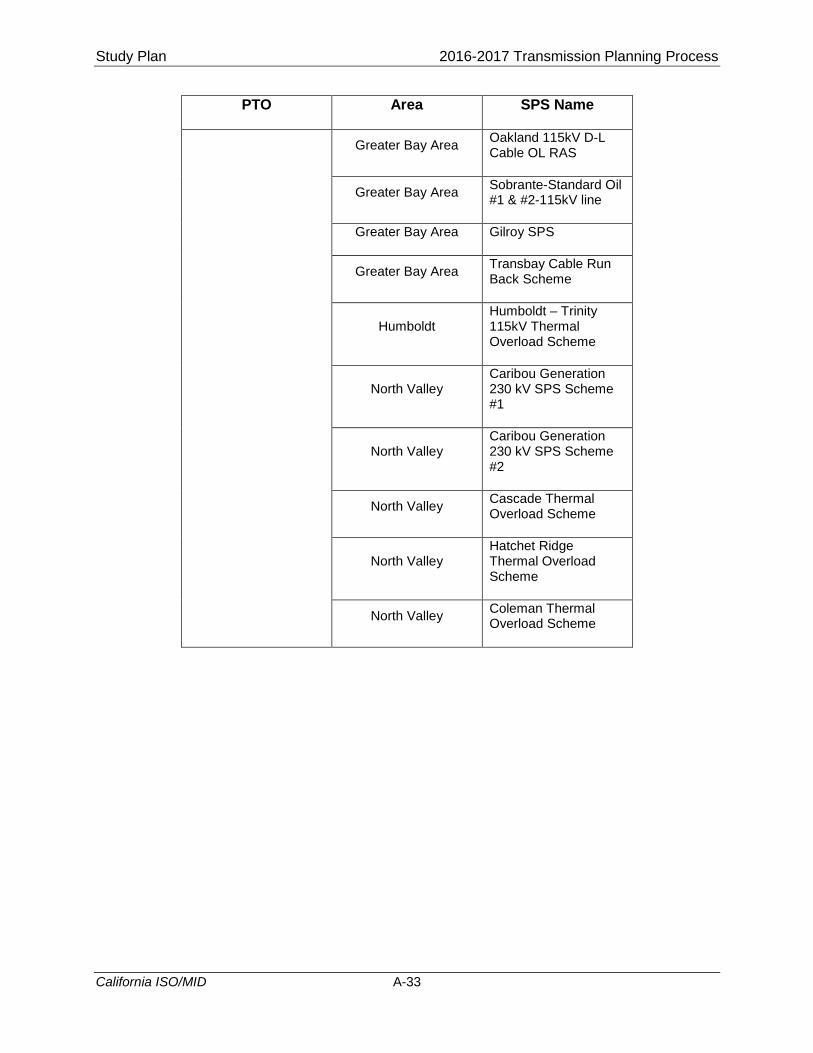
Study Plan 2016-2017 Transmission Planning Process
California ISO/MID A-33
PTO Area SPS Name
Greater Bay Area Oakland 115kV D-L Cable OL RAS
Greater Bay Area Sobrante-Standard Oil #1 & #2-115kV line
Greater Bay Area Gilroy SPS
Greater Bay Area Transbay Cable Run Back Scheme
Humboldt Humboldt – Trinity 115kV Thermal Overload Scheme
North Valley Caribou Generation 230 kV SPS Scheme #1
North Valley Caribou Generation 230 kV SPS Scheme #2
North Valley Cascade Thermal Overload Scheme
North Valley Hatchet Ridge Thermal Overload Scheme
North Valley Coleman Thermal Overload Scheme
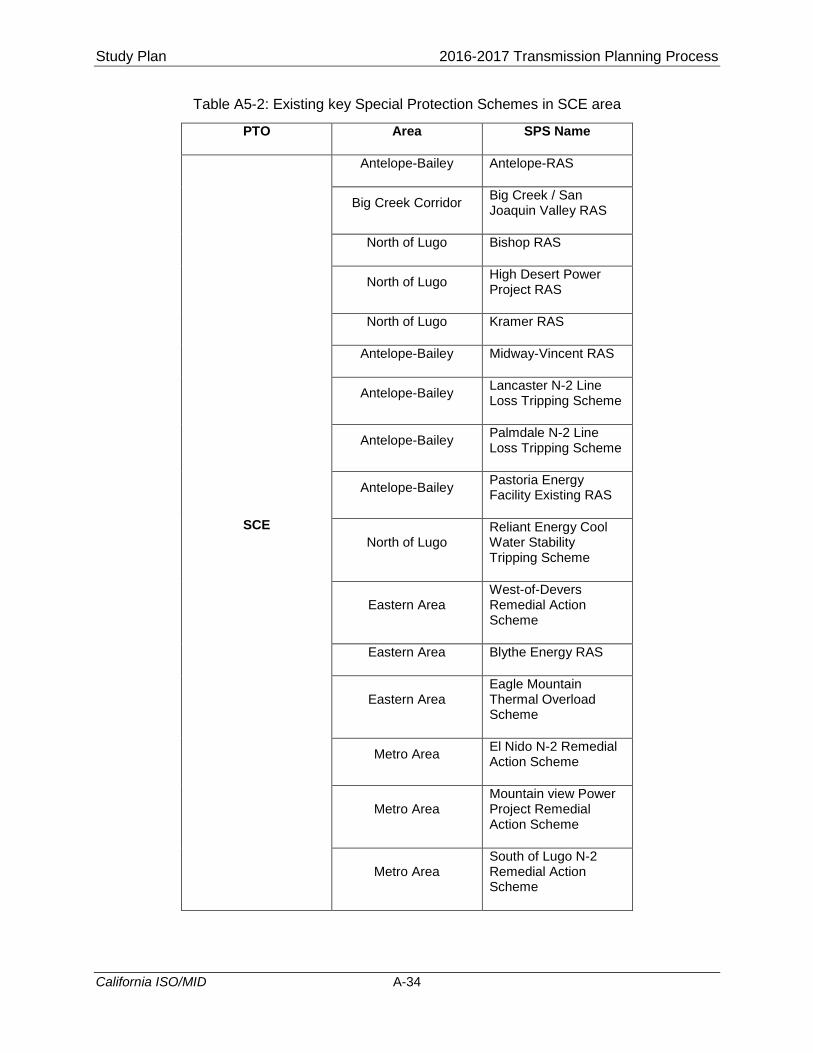
Study Plan 2016-2017 Transmission Planning Process
California ISO/MID A-34
Table A5-2: Existing key Special Protection Schemes in SCE area
PTO Area SPS Name
SCE
Antelope-Bailey Antelope-RAS
Big Creek Corridor Big Creek / San Joaquin Valley RAS
North of Lugo Bishop RAS
North of Lugo High Desert Power Project RAS
North of Lugo Kramer RAS
Antelope-Bailey Midway-Vincent RAS
Antelope-Bailey Lancaster N-2 Line Loss Tripping Scheme
Antelope-Bailey Palmdale N-2 Line Loss Tripping Scheme
Antelope-Bailey Pastoria Energy Facility Existing RAS
North of Lugo Reliant Energy Cool Water Stability Tripping Scheme
Eastern Area West-of-Devers Remedial Action Scheme
Eastern Area Blythe Energy RAS
Eastern Area Eagle Mountain Thermal Overload Scheme
Metro Area El Nido N-2 Remedial Action Scheme
Metro Area Mountain view Power Project Remedial Action Scheme
Metro Area South of Lugo N-2 Remedial Action Scheme
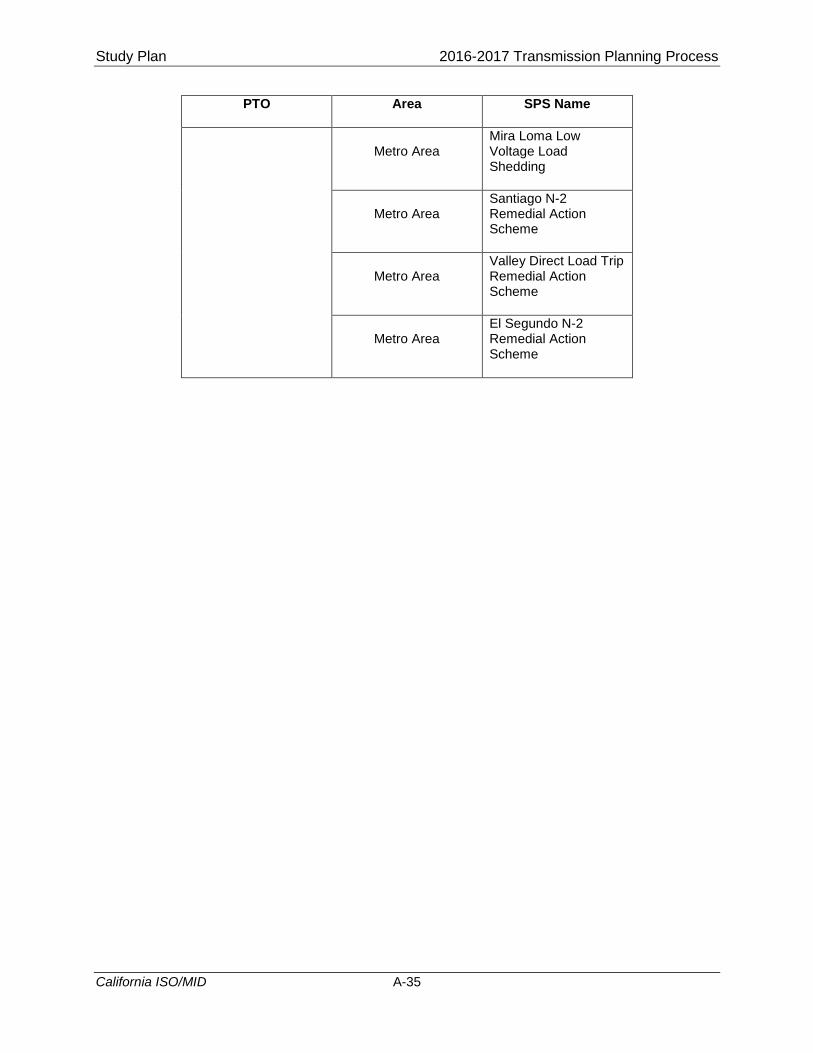
Study Plan 2016-2017 Transmission Planning Process
California ISO/MID A-35
PTO Area SPS Name
Metro Area Mira Loma Low Voltage Load Shedding
Metro Area Santiago N-2 Remedial Action Scheme
Metro Area Valley Direct Load Trip Remedial Action Scheme
Metro Area El Segundo N-2 Remedial Action Scheme
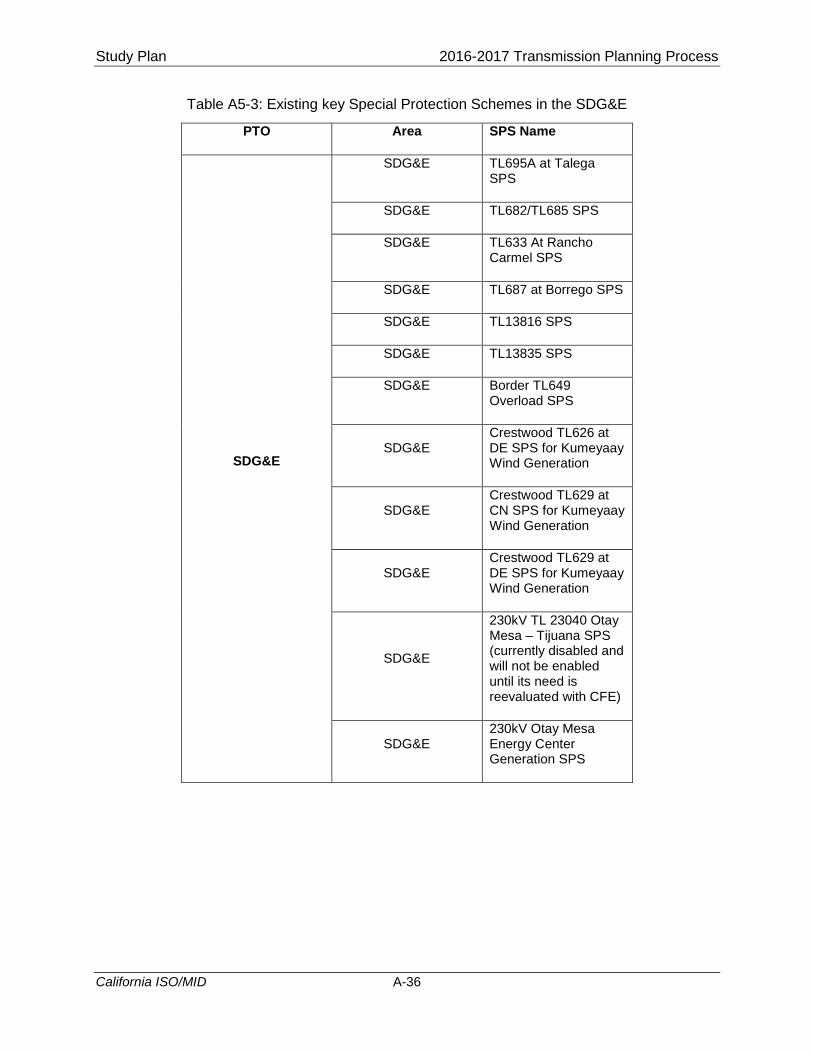
Study Plan 2016-2017 Transmission Planning Process
California ISO/MID A-36
Table A5-3: Existing key Special Protection Schemes in the SDG&E
PTO Area SPS Name
SDG&E
SDG&E TL695A at Talega SPS
SDG&E TL682/TL685 SPS
SDG&E TL633 At Rancho Carmel SPS
SDG&E TL687 at Borrego SPS
SDG&E TL13816 SPS
SDG&E TL13835 SPS
SDG&E Border TL649 Overload SPS
SDG&E Crestwood TL626 at DE SPS for Kumeyaay Wind Generation
SDG&E Crestwood TL629 at CN SPS for Kumeyaay Wind Generation
SDG&E Crestwood TL629 at DE SPS for Kumeyaay Wind Generation
SDG&E
230kV TL 23040 Otay Mesa – Tijuana SPS (currently disabled and will not be enabled until its need is reevaluated with CFE)
SDG&E 230kV Otay Mesa Energy Center Generation SPS
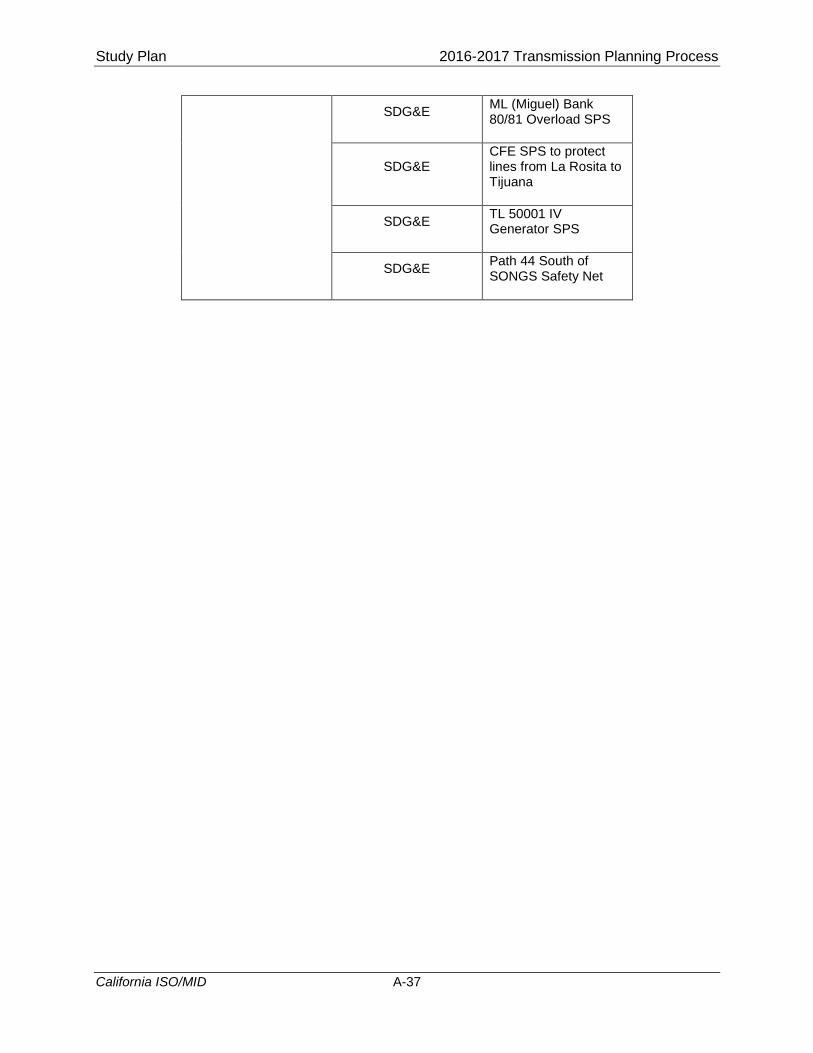
Study Plan 2016-2017 Transmission Planning Process
California ISO/MID A-37
SDG&E ML (Miguel) Bank 80/81 Overload SPS
SDG&E CFE SPS to protect lines from La Rosita to Tijuana
SDG&E TL 50001 IV Generator SPS
SDG&E Path 44 South of SONGS Safety Net