2015 yearbook: australian private equity and venture ... · australian private equity and venture...
TRANSCRIPT
AUSTRALIAN PRIVATE EQUITY AND VENTURE CAPITAL ACTIVITY REPORT – NOVEMBER 2015
2015 Yearbook
In partnership with


| 201
5 YE
AR
BO
OK
– N
ovem
ber
1
| avc
al.c
om.a
u |
CONTENTS
FOREWORD ......................................................................................................................................................................2
FROM OUR RESEARCH PARTNER .........................................................................................................3
EXECUTIVE SUMMARY ......................................................................................................................................4
ABOUT THE REPORT PARTNERS .............................................................................................................5
ABOUT THE YEARBOOK .....................................................................................................................................6
FUNDRAISING ACTIVITY ..................................................................................................................................7
Total funds raised ...........................................................................................................................................................8
Funds raised by investment stage focus .......................................................................................................9
Sources of new commitments ............................................................................................................................ 10
Dry powder ....................................................................................................................................................................... 12
INVESTMENT ACTIVITY ................................................................................................................................. 13
Total investments ......................................................................................................................................................... 14
Distribution of investments by current stage of investee company ........................................ 16
Distribution of investments by company sector .................................................................................... 18
Distribution of investments by geographical location ........................................................................ 21
Total investee companies in VC and PE portfolios............................................................................... 22
DIVESTMENT ACTIVITY ................................................................................................................................. 23
Distribution of divestments by exit methods ............................................................................................ 24
Distribution of divestments by sector ............................................................................................................ 25
METHODOLOGY ........................................................................................................................................................ 27
GLOSSARY ..................................................................................................................................................................... 31

| 201
5 YE
AR
BO
OK
– N
ovem
ber
2
| avc
al.c
om.a
u |
FOREWORD
The 2015 financial year has seen Australian private equity and venture capital finally approaching the levels of fundraising and investment activity seen before the Global Financial Crisis. After a period of strong and sustained divestment activity in the previous year, fund managers are now looking to replenish their portfolios with new investments.
This will be helped by a number of successful VC and PE fundraises over the last year. Renewed interest in VC funds from Australia’s ever-growing superannuation pool has been an encouraging sign of fresh institutional investor interest in new areas and industries of growth. Increased interest by foreign investors in Australian PE opportunities has seen more overseas than domestic investment in this segment over the last twelve months. And it is anticipated that foreign interest will continue to grow, helped by the Significant Investor Visa programme that is now targeted at directing more high net worth capital to early stage VC and growth PE funds.
Confidence in early stage startup activity is at its highest levels seen in a long time, primarily concentrated in the technology sector. But while the pickup in startup activity is a positive, the data tells us that later stage VC funding remains volatile across industry sectors. So, while it’s important we maintain and build on the strong momentum in early stage funding, it is imperative that we deepen the pool of capital for funding startups when they require Series A and subsequent later stage capital: after all, that capital represents the lifeblood needed to scale promising domestic startups to truly global businesses that create significant new employment opportunities across the economy.
PE investment was healthy in FY2015, with managers having some clear air after an exceptionally busy year of exit activity during 2014. The pipeline for new investment over the period ahead looks positive, and there is a clear opportunity to drive new investment activity even further if existing roadblocks are removed. Uncompetitive and inconsistent tax and regulatory frameworks are constraining the capacity of PE funds to raise new capital from superannuation funds, high net worth investors, corporates and family offices; with targeted changes in key areas of policy, Australian businesses would stand to benefit from access to a larger marketplace of private capital to fund their growth and expansion plans.
There is strong interest now from all sides of politics in building a more innovative and dynamic Australian economy that is ‘fit for the future’. Together with the Government, we have to do everything we can to realise Australia’s objective of creating an economy that attracts and grows value-adding businesses, and business leaders. We have the potential, and we know what needs to be done – we just have to get on and do it now.
I would like to express my thanks to all the GPs who contributed their valuable time, data and information to AVCAL in the production of this report. I would also like to thank EY, our research partner for the eighth year running, for their valuable input and support of our organisation and the industry that we represent.
Yasser El-Ansary Chief Executive AVCAL November 2015

| 201
5 YE
AR
BO
OK
– N
ovem
ber
3
| avc
al.c
om.a
u |
EY is proud to support AVCAL in our eighth consecutive year as Research Partner.
EY has been an active participant in and supporter of the private equity and venture capital industry in Australia for over a decade.
We are passionate about bringing objective insights to the Australian industry and raising awareness of the dynamic role participants play in this crucial part of the economy.
PE and VC fundraising has recently recorded the second highest level of activity seen in the past eight years, with overseas investors making up a larger proportion of new commitments. We have also seen sovereign wealth funds making a greater contribution to new fundraising than local pension funds.
Divestment activity has taken somewhat of a break in FY15, after the record exists achieved in FY14 driven by the favourable IPO market. The listed market continue to be an important source of value, as General Partners sold post-IPO stakes into the market as part of the exit process.
Given the recent success of fundraising and strong, globally competitive returns achieved in Australia, investment activity will continue to be high. Overseas interest will increase competition for assets and investments but, as we have seen over the longer term, Australian-based funds will continue to be successful in their endeavours.
In addition, with the increasing focus on innovation and entrepreneurship from government and business, VC activity should also increase, with more funds and increasing resources being drawn into the sector.
We look forward to another great year for investments and continued exit success.
Bryan Zekulich Oceania Leader - Private Equity EY November 2015
FROM OUR RESEARCH PARTNER

| 201
5 YE
AR
BO
OK
– N
ovem
ber
4
| avc
al.c
om.a
u |
There was a significant increase in total funds raised by Australian private equity (PE) and venture capital (VC) managers in FY2015, coming off the lows of the previous years. Investment activity also picked up as fund managers, after a string of successful exits in FY2014, took advantage of new opportunities arising in the local market to replenish their portfolios.
Some of the key highlights of the year are listed below.
Fundraising:
– Australian PE and VC funds raised $3.1b in FY2015, approaching the levels last seen three years ago (when $3.3b was raised in FY2012).
– PE fundraising almost tripled to $2.7b, with nine funds successfully recording interim or final closings, including Pacific Equity Partners Fund V and Crescent Capital Partners Fund V.
– VC fundraising increased to $368m, finally reaching pre-GFC levels. Seven funds were raised during the year, including Brandon Capital Partners’ $200m Medical Research Commercialisation Fund 3 (MRCF3). This made it Australia’s biggest life sciences fund to date, and the first VC fund in recent years to raise a sizable commitment from domestic superannuation funds.
– Overseas investors overtook domestic investors as a source of new commitments in FY2015. A surge in interest from Limited Partners (LPs) from Asia saw this investor group alone matching the level of new commitments by Australian LPs.
– New VC commitments from Australian superannuation funds accounted for 54% of total VC fundraising, with the balance coming from private individuals and corporates.
– As of 30 June 2015, an estimated $6.3b of dry powder was available for investment by Australian PE and VC fund managers.
Investment:
– Overall PE and VC investment rose by 32% to $3.5b invested in 177 companies.
– PE investment activity was 54% higher year-on-year in FY2015 at $3.3b. Both domestic and international corporates presented a number of buyout opportunities, including Archer Capital’s acquisition of Dun & Bradstreet’s ANZ business and the sale by Nine Entertainment of its Nine Live division to Affinity Equity Partners.
– International General Partners (GPs) accounted for some of the largest deals of the year, such as the acquisitions of the Velocity Frequent Flyer programme and Nine Live (Affinity Equity Partners), Leighton Holdings’ services division (Apollo Global Management) and Orica’s chemicals business (Blackstone).
– Mid-market activity also featured prominently, with expansion/growth PE investment rising nearly two-fold in FY2015 to over $1.3b invested in 50 companies.
– VC investment fell by 58% year-on-year to $224m from the previous year’s record levels, but still remained higher than FY2012 and FY2013 levels and the 10-year average of $203m.
– Most recipients of VC investment, and close to half of the total capital invested by VC, were in seed or Series A rounds.
Divestments:
– PE divestment activity was lower in FY2015, with IPO activity in particular moderating from the heightened activity seen the previous year.
– IPO exits in FY2015 were 25% lower (based on the number of companies) compared to the previous year. However, it should be noted that FY2014 saw a record number of exits via listings (12). Nevertheless, the IPO market still provided opportunities for large divestments, such as Healthscope’s listing in July 2014 with an issue size of over $2b.
– FY2015 also saw a number of GPs successfully exiting their post-IPO stakes of companies listed in the previous year, as their retained stakes were progressively released from escrow.
– FY2015 saw successful VC exits continuing to gather momentum from the previous year. These included the most successful exit in the history of Australian VC to date: the sale of Spinifex, backed by GBS Venture Partners, Brandon Capital Partners and Uniseed, to Novartis for an upfront payment of US$200m and potential milestone payments of US$500m.
EXECUTIVE SUMMARY
| 201
5 YE
AR
BO
OK
– N
ovem
ber
5
| avc
al.c
om.a
u |
ABOUT THE REPORT PARTNERS
The Australian Private Equity and Venture Capital Association Limited (AVCAL) is a national association which represents the private equity and venture capital industries. AVCAL’s members comprise most of the active private equity and venture capital firms in Australia. These firms provide capital for early stage companies, later stage expansion capital, and capital for management buyouts of established companies.
avcal.com.au twitter.com/avcal1 linkedin.com/company/avcal
If you lead a private equity business, we can help you meet your evolving requirements and those of your portfolio companies from acquisition to exit through a highly integrated global resource of more than 210,000 professionals across audit, tax, transactions and advisory services.
Whether you’re looking to improve portfolio performance, manage your funds better or maximise your transaction process more effectively, we can help you adapt to today’s environment with a tailored approach.
Follow @EYPrivateEquity to catch the latest insights on private equity deal and fund-raising activity, value creation and PE in emerging markets. ey.com/privateequity
The views reflected in this publication are the views of the author and do not necessarily reflect the views of the global EY organization or its member firms.

| 201
5 YE
AR
BO
OK
– N
ovem
ber
6
| avc
al.c
om.a
u |
The AVCAL database contains comprehensive data on the activities of 165 venture capital and private equity firms (both active and no longer active). FY2015 figures are based on the activities of 71 venture capital and private equity firms, comprising 42 AVCAL members and 29 non-members. These firms represented $27,719m in funds under management ($2,634m for VC and $25,086m for PE) as of 30 June 2015.
The information was obtained via direct submissions to AVCAL and other sources such as firm websites, press releases and industry news sources. Australian investments and divestments made by global/regional funds are included in the investment and divestment figures. However, global/regional funds are not included in fundraising numbers, unless the fund manager can identify the specific amount allocated to Australian investments.
Total funds under management are based on submissions or estimated amounts. For global/regional funds, these estimates are calculated as funds invested in Australia.
Notes:
1. All annual figures correspond to Australian fiscal years (ending 30 June) except where otherwise stated, e.g. FY2015 refers to the year ending 30 June 2015.
2. All currency units are denominated in Australian dollars unless otherwise stated.
3. All data are from AVCAL’s PEREP_Analytics platform, except where otherwise stated.
4. Historical data is updated when new or improved information becomes available. Therefore, the historical data presented in this Yearbook is the most accurate available as of the publication date.
For further information, please contact:
AVCAL Research Team Tel: +61 2 8243 7000 Email: [email protected]
Kar Mei Tang Head of Policy and Research Tel: +61 2 8243 7010 Email: [email protected]
Kosta Sinelnikov Senior Research Analyst Tel: +61 2 8243 7008 Email: [email protected]
ABOUT THE YEARBOOK

| 201
5 YE
AR
BO
OK
– N
ovem
ber
7
| avc
al.c
om.a
u |
FUNDRAISING ACTIVITY1

| 201
5 YE
AR
BO
OK
– N
ovem
ber
8
| avc
al.c
om.a
u |
FUNDRAISING ACTIVITY
Total funds raised
Figure 1: Australian VC funds raised by fiscal year (in AUD millions)
Figure 2: Australian PE funds raised by fiscal year (in AUD millions)
FY06
FY07
FY08
FY09
FY10
FY11
FY12
FY13
FY14
FY15
No. of funds
A$m Amount (A$m) No. of funds
0
3
6
9
12
15
0
100
200
300
400
No. of funds
A$m Amount (A$m) No. of funds
FY06
FY07
FY08
FY09
FY10
FY11
FY12
FY13
FY14
FY15
0
5
10
15
20
0
2,000
4,000
6,000
8,000
10,000
Increased levels of fundraising have seen the total amount raised by Australian PE and VC funds almost tripling from $1.1b in FY2014 to $3.1b in FY2015.
PE fundraising rose from $933m in FY2014 to $2.7b in FY2015, approaching the levels last seen three years ago (when $3.3b was raised in FY2012).
Reflecting the opportunities seen for a diverse range of strategies, there were successful fundraises across the spectrum from growth and expansion PE, large buyout, turnaround, to mezzanine debt funds.
While nine PE funds raised new capital in FY2015 – near the average of 10 funds raising capital over the previous five years – almost two thirds of the amount raised came from two funds alone: Pacific Equity Partners Fund V and Crescent Capital Partners Fund V.
Other funds that recorded closes included Next Capital Fund III, Allegro Private Equity Fund II, Mercury Capital Fund 2 and Babson Capital’s Gateway Mezzanine Partners II.
VC fundraising also increased in FY2015 from $126m to $368m, a 193% rise from the prior year. Seven funds closed successful fundraisings, the highest number since FY2010.
After an absence of several years, superannuation investors emerged again as the main source of new VC commitments in an encouraging sign of increasing appetite among long-term institutional investors for Australian early stage investments.
The seven VC funds raising new capital included Brandon Capital Partners’ $200m Medical Research Commercialisation Fund 3 (MRCF3), AirTree Ventures’ first fund at $60m, and the OneVentures Innovation and Growth Fund, which had – as at financial year-end – raised over $60m.
MRCF3’s successful close saw it become Australia’s biggest life sciences fund to date, and the second domestic VC fund to reach a record $200m (after Southern Cross Venture Partners’ Renewable Energy VC Fund in 2011).
| 201
5 YE
AR
BO
OK
– N
ovem
ber
9
| avc
al.c
om.a
u |
YEAR VENTURE CAPITAL PRIVATE EQUITY TOTAL
AMOUNT (A$m)
NO. OF FUNDS
AMOUNT (A$m)
NO. OF FUNDS
AMOUNT (A$m)
NO. OF FUNDS
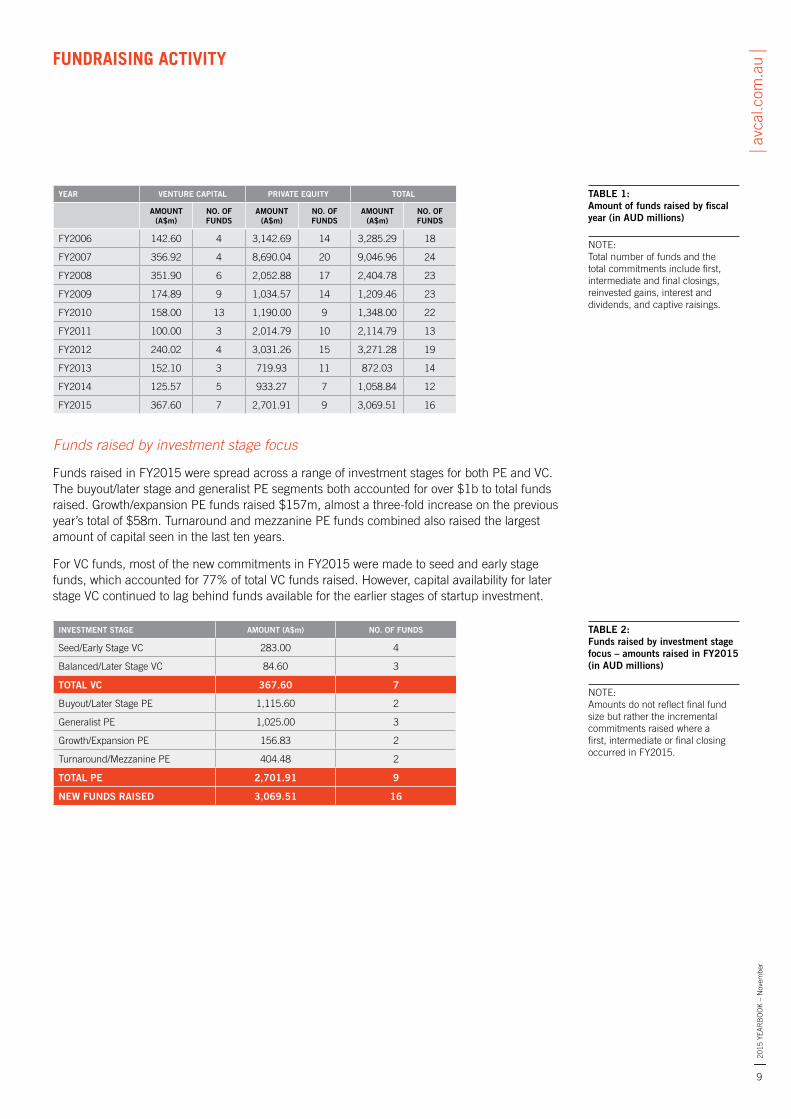
FY2006 142.60 4 3,142.69 14 3,285.29 18
FY2007 356.92 4 8,690.04 20 9,046.96 24
FY2008 351.90 6 2,052.88 17 2,404.78 23
FY2009 174.89 9 1,034.57 14 1,209.46 23
FY2010 158.00 13 1,190.00 9 1,348.00 22
FY2011 100.00 3 2,014.79 10 2,114.79 13
FY2012 240.02 4 3,031.26 15 3,271.28 19
FY2013 152.10 3 719.93 11 872.03 14
FY2014 125.57 5 933.27 7 1,058.84 12
FY2015 367.60 7 2,701.91 9 3,069.51 16
Funds raised by investment stage focus
Funds raised in FY2015 were spread across a range of investment stages for both PE and VC. The buyout/later stage and generalist PE segments both accounted for over $1b to total funds raised. Growth/expansion PE funds raised $157m, almost a three-fold increase on the previous year’s total of $58m. Turnaround and mezzanine PE funds combined also raised the largest amount of capital seen in the last ten years.
For VC funds, most of the new commitments in FY2015 were made to seed and early stage funds, which accounted for 77% of total VC funds raised. However, capital availability for later stage VC continued to lag behind funds available for the earlier stages of startup investment.
INVESTMENT STAGE AMOUNT (A$m) NO. OF FUNDS
Seed/Early Stage VC 283.00 4
Balanced/Later Stage VC 84.60 3
TOTAL VC 367.60 7
Buyout/Later Stage PE 1,115.60 2
Generalist PE 1,025.00 3
Growth/Expansion PE 156.83 2
Turnaround/Mezzanine PE 404.48 2
TOTAL PE 2,701.91 9
NEW FUNDS RAISED 3,069.51 16
TABLE 1: Amount of funds raised by fiscal year (in AUD millions)
NOTE: Total number of funds and the total commitments include first, intermediate and final closings, reinvested gains, interest and dividends, and captive raisings.
FUNDRAISING ACTIVITY
TABLE 2: Funds raised by investment stage focus – amounts raised in FY2015 (in AUD millions)
NOTE: Amounts do not reflect final fund size but rather the incremental commitments raised where a first, intermediate or final closing occurred in FY2015.

| 201
5 YE
AR
BO
OK
– N
ovem
ber
10
| avc
al.c
om.a
u |
Sources of new commitments
Overseas investors overtook domestic investors as a source of new commitments in FY2015, accounting for $2.1b (70%) of total new funds raised. For the first time, foreign investors committed over $1b more than domestic investors in a given year.
With domestic investors such as superannuation funds looking to allocate more of their assets offshore, the sources of capital for Australian PE and VC fund managers are also becoming more global.
The increase in fundraising was significantly boosted by a strong appetite among Asian investors for exposure to Australian PE. New commitments from Asia surged by 261% from the previous year to $920m, compared to $856m by Australian investors. Asian investors accounted for 30% of all new PE and VC commitments, whilst Australian investors accounted for 28%. Meanwhile, North American and European LPs increased their contributions to Australian PE fundraising from 16% and 3% in FY2014, respectively, to 23% and 9% in FY2015.
The three most significant investor categories contributing to PE fundraising in FY2015 were unchanged from the previous year. Sovereign wealth funds were again the biggest source of capital for PE in FY2015, contributing 30% of total PE funds raised. This was followed by superannuation/pension funds (19%), and fund-of-funds (19%).
The large increase in VC fundraising was largely due to the return of superannuation funds to the asset class, contributing over $200m, the largest dollar amount recorded in the last 10 years, to VC. This accounted for 60% of total VC fundraising in FY2015. A large proportion of this was attributable to Brandon Capital Partners’ MRCF3 fund, which raised funds from AustralianSuper, HESTA, StatewideSuper, and Hostplus. The balance of new VC commitments came from private individuals and corporates, continuing the trend seen from the previous year, as well as family offices.
Looking ahead, interest by offshore investors is expected to grow with the introduction of the new Significant Investor Visa (SIV) complying investment framework from 1 July 2015 which requires a minimum $500,000 allocation by visa applicants to be invested in qualifying VC and growth PE funds (or qualifying fund-of-funds).
Figure 3: Sources of new PE and VC commitments in FY2015 by investor type (based on AUD millions)
Figure 4: Sources of new PE and VC commitments in FY2015 by region (based on AUD millions)
Sovereign
Industrysuper/publicpension fund
Fund of funds
Corporate/financialinstitution
Private individual
GP Commitments
Family office
Public sector
Other
Unknown
2%
26%
23%
17%
9%
5%
2%
10%
1% 5%
Australia
Asia
North America
Europe
Unknown
Other
8%
30%
23%
9%
2%
28%
FUNDRAISING ACTIVITY

| 201
5 YE
AR
BO
OK
– N
ovem
ber
11
| avc
al.c
om.a
u |
Figure 5: Sources of new VC commitments by investor type, FY2011-FY2015 (in AUD millions)
Figure 6: Sources of new PE commitments by investor type, FY2011-FY2015 (in AUD millions)
Private individuals
Corporate investors
Public sector
Super funds (retail, industry, self-managed)
Other
Unknown
A$m
FY11
FY12
FY13
FY14
FY15
0
100
200
300
400
0
2,500
3,000
2,000
1,500
1,000
500
3,500
FY11
FY15
FY12
FY14
FY13
A$m
Fund funds
Unknown
Other
Academic/Endowment
Sovereign funds
Corporate/financial institutions
Super funds / pension funds
Family office
Figure 7: Sources of new VC commitments by geography, FY2011-FY2015 (in AUD millions)
Figure 8: Sources of new PE commitments by geography, FY2011-FY2015 (in AUD millions)
UnknownNorth America
AsiaAustralia
A$m
FY11
FY12
FY13
FY14
FY15
0
100
200
300
400
0
2,500
3,000
2,000
1,500
1,000
500
3,500
FY11
FY15
FY12
FY14
FY13
A$m
Europe
Unknown
AsiaAustralia
OtherOther Oceania
North Ameria
| 201
5 YE
AR
BO
OK
– N
ovem
ber
12
| avc
al.c
om.a
u |
Dry powder
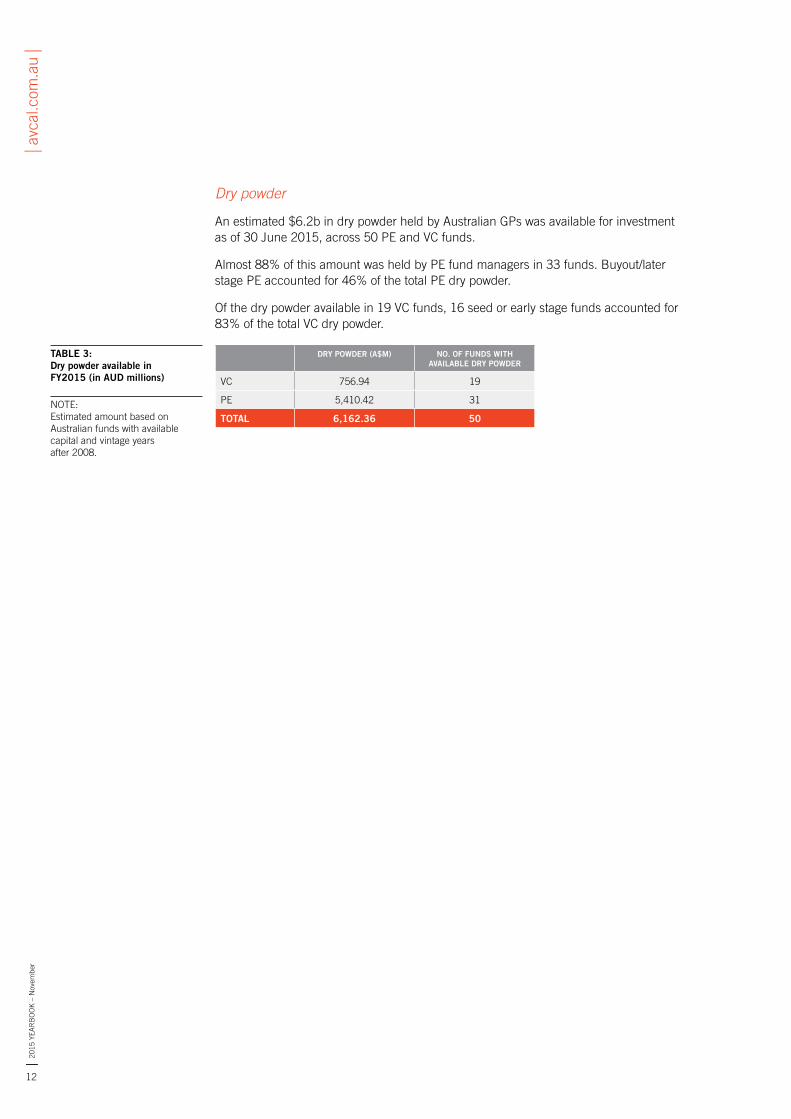
An estimated $6.2b in dry powder held by Australian GPs was available for investment as of 30 June 2015, across 50 PE and VC funds.
Almost 88% of this amount was held by PE fund managers in 33 funds. Buyout/later stage PE accounted for 46% of the total PE dry powder.
Of the dry powder available in 19 VC funds, 16 seed or early stage funds accounted for 83% of the total VC dry powder.
DRY POWDER (A$M) NO. OF FUNDS WITH AVAILABLE DRY POWDER
VC 756.94 19
PE 5,410.42 31
TOTAL 6,162.36 50
TABLE 3: Dry powder available in FY2015 (in AUD millions)
NOTE: Estimated amount based on Australian funds with available capital and vintage years after 2008.

| 201
5 YE
AR
BO
OK
– N
ovem
ber
13
| avc
al.c
om.a
u |
INVESTMENT ACTIVITY2

| 201
5 YE
AR
BO
OK
– N
ovem
ber
14
| avc
al.c
om.a
u |
INVESTMENT ACTIVITY
Total investments
Total PE and VC investment rose by 32% from the previous year to $3.5b, reversing the decline seen from FY2011 to FY2014. The number of companies invested in by PE and VC saw a steadier increase, rising by just 5% to 177.
The increase in activity was largely attributable to higher levels of PE investment from both domestic and offshore GPs.
Total PE investment grew by 54% to $3.3b in FY2015 with 84 companies invested in throughout the year (a 25% increase on the previous year).
International PE managers accounted for most of the largest deals of the year, such as Affinity Equity Partners’ $366m investment in the Velocity Frequent Flyer programme and its $640m acquisition of Nine Live, Apollo Global Management’s acquisition of a 50% stake in Leighton Holdings’ services division, and Blackstone’s buyout of the Orica Chemicals business, the firm’s first PE deal in Australia.
Mid-market deals also featured prominently with notable deals including Archer Growth’s investment in Planit Software Testing Group and Next Capital’s acquisition of a majority stake in Forest Coach Lines.
Average equity investment sizes were slightly higher in FY2015 at $36m per investment, compared to $26m in FY2014. Four investments of $150m or greater were recorded in FY2015, compared with only two seen in FY2014. Total dollar investment for larger PE deals (investment greater than $150m) increased by 40% in FY2015, after consistently falling from FY2011 to FY2014.
PE investments at the $20m-$150m investment range accounted for the majority of capital invested in FY2015 and were their highest levels since the last five years, demonstrating the growing strength of the mid-market segment.
Total VC investment activity in FY2015 fell back to $224m in FY2015, a 58% decrease from $535m the year before. This was not unexpected given the total amount invested by VC in FY2014 was nearly triple the amount the year before, driven by a number of large investments made by US-based VC funds (such as Insight Venture Partners’ $266m investment in Campaign Monitor in April 2014). The FY2015 total was still higher than the annual amounts invested in FY2012 and FY2013, and above the long term annual average of $203m over the preceding 10 years.
Continuing the trend seen in FY2014, the largest VC investments in FY2015 came from US firms and Australian corporate VCs, mostly in the ICT space. Notable examples included Invoice2go raising US$35m in Series A funding from Accel Partners and Ribbit Capital, and a US$50m investment round in Bigcommerce from a consortium which included Telstra Ventures and General Catalyst Partners.
In contrast to the continued interest by international VCs in Australian ICT startups, investment in Australian life sciences companies continued to come solely from Australian VCs.1 $46m was invested in this space in FY2015, with the majority of these constituting follow-on rounds in existing portfolio companies.
1 This is consistent with the propinquity typically seen in life sciences investment across the world, where research- intensive life sciences firms at the seed and early stages tend to be funded by locally-based VC funds.

| 201
5 YE
AR
BO
OK
– N
ovem
ber
15
| avc
al.c
om.a
u |
YEAR VENTURE CAPITAL PRIVATE EQUITY TOTAL
AMOUNT (AUDm)
NO. OF COMPANIES
NO. OF GPs AMOUNT (AUDm)
NO. OF COMPANIES
NO. OF GPs AMOUNT (AUDm)
NO. OF COMPANIES
NO. OF GPs
FY2006 136.95 68 17 3,128.36 118 32 3,265.31 182 49
FY2007 150.57 69 12 5,837.23 106 36 5,987.80 174 48
FY2008 211.57 77 16 4,194.40 103 36 4,405.97 176 52
FY2009 228.61 98 18 2,916.45 113 40 3,145.06 208 58
FY2010 191.38 95 18 2,155.74 97 45 2,347.12 189 63
FY2011 280.31 79 21 3,801.18 86 40 4,081.49 162 61
FY2012 153.18 88 20 3,080.19 70 39 3,233.37 157 59
FY2013 143.69 72 19 2,729.36 67 34 2,873.05 139 53
FY2014 535.35 101 23 2,120.56 67 35 2,655.91 168 58
FY2015 223.89 94 27 3,268.69 84 36 3,492.58 177 61
Figure 9: VC Investments by fiscal year (in AUD millions) Figure 10: PE Investments by fiscal year (in AUD millions)
FY06
FY07
FY08
FY09
FY10
FY11
FY12
FY13
FY14
FY15
A$m Foreign fundinvestmentamount (A$m)
Australian fundinvestmentamount (A$m)
No. of companies
No. of com
panies
0
30
60
90
120
150
0
300
200
100
400
500
600
FY06
FY07
FY08
FY09
FY10
FY11
FY12
FY13
FY14
FY15
No. of com
panies
A$m Foreign fundinvestmentamount (A$m)
Australian fundinvestmentamount (A$m)
No. of companies
0
90
60
30
120
150
0
2,000
4,000
6,000
Figure 11: PE investments by size of investment in FY2011-FY2015 (in AUD millions)
FY11
FY12
FY13
FY14
FY15
A$m <$20m $20m - $150m >$150m
0
1,500
1,000
500
2,000
2,500
TABLE 4: Investments by fiscal year (in AUD millions)
INVESTMENT ACTIVITY
Size of investment

| 201
5 YE
AR
BO
OK
– N
ovem
ber
16
| avc
al.c
om.a
u |
Distribution of investments by current stage of investee company
The buyout stage, including MBOs, LBOs and public-to-private deals, made up 43% of the total dollar value of PE investments in FY2015: not far off the 47% recorded in FY2014. Both domestic and international corporates provided a number of buyout opportunities to GPs, including Archer Capital’s acquisition of Dun & Bradstreet’s ANZ business and the sale by Nine Entertainment of its Nine Live division to Affinity Equity Partners. A total of 21 later stage buyouts were completed in FY2015.
Expansion/growth PE investment rose nearly two-fold in FY2015 with over $1.3b invested. These accounted for 40% of all PE funds invested in the year under review, which is a steady increase from 21% recorded in FY2013 and 32% in FY2014.
Similar to the previous year, most VC investments were concentrated at the earlier stages (seed, startup and other early stage), with only 16% of companies invested in at the later VC stage. Less capital as a proportion of overall VC investment was also deployed at the later stage of VC compared to FY2014, at 42% of the total dollar value of VC investment (72% in FY2014).
In terms of financing rounds, nearly half of total VC dollars invested in FY2015 was in early stage rounds (seed and Series A), with 40% in Series A rounds alone. In terms of the number of investments, 71% were in seed and Series A rounds, with the number dropping sharply for Series B and above, suggesting that a substantial gap still looms between early and later stage VC investment locally.
STAGE AMOUNT (AUDm)
% OF TOTAL PE OR VC
NO. OF COMPANIES
% OF TOTAL
Seed 19.34 9% 30 32%
Start-up 84.91 38% 35 37%
Other early stage 19.44 9% 12 13%
Late stage VC 93.97 42% 15 16%
Other VC 6.22 3% 3 3%
TOTAL VC 223.89 100% 94 100%
Expansion/growth capital 1,316.94 40% 50 60%
Rescue/turnaround 61.30 2% 5 6%
Buyout (MBO/MBI/LBO/P2P) 1,417.11 43% 21 25%
Secondary purchase/replacement capital 316.80 10% 5 6%
Other PE 156.54 5% 3 4%
TOTAL PE 3,268.69 100% 84 100%
TABLE 5: Distribution of investments in FY2015 (by stage of investee company)
NOTE: Stages with fewer than three companies invested in have been aggregated into “Other PE”. Percentage figures have been rounded off to the nearest whole percent, and refer to the percentage of either total PE or VC investment. As the figures only cover investments by Australian VC or PE funds and international funds investing in Australian companies, investments in companies domiciled overseas will only reflect the amount invested by the Australian fund, not the total round amount invested by a syndicate of international investors.
INVESTMENT ACTIVITY

| 201
5 YE
AR
BO
OK
– N
ovem
ber
17
| avc
al.c
om.a
u |
Figure 12: Investments by VC funds in FY2015 by investment round
Amount invested Number of investments
Seed round
Series DSeries A
Series E+
Series C
Series B
0%
75%
50%
25%
9%
40%
21%
7%
23%
1%
36%
35%
15%
6%6%
2%100%
Figure 13: VC investments by stage of investee company, FY2011-2015
2% 2% 0.1%1% 1% 0.1%100%
75%
50%
25%
By number of companies By investment amount
0%13%
17%
49%
19%
10%
27%
40%
22%
21%
26%
28%
24%
27%
20%
27%
25%
31%
36%
12%
19%
4%
18%
45%
32%
10%
16%
32%
43%
4%7%
9%
80%
9%
38%
9%
42%
3%
2%7%
27%
51%
13%
FY11
FY12
FY13
FY14
FY15
FY11
FY12
FY13
FY14
FY15
Seed Other VCStart-up Late Stage VCOther Early Stage
Figure 14: PE investments by stage of investee company, FY2011-2015
100%
75%
50%
25%
By number of companies By investment amount
0%
51%
23%
2%
14%
9%
68%
19%
6%1% 3%6%
61%
25%
7%
3%
58%
20%
4%
14%
3%
60%
25%
6%6%4%
42%
48%
7%
21%
57%
17%
4%
32%
47%
15%
5%
40%
43%
10%
5%
9%
59%
3%
1%
1% 1%
1%2%22%
7%
FY11
FY12
FY13
FY14
FY15
FY11
FY12
FY13
FY14
FY15
Expansion/growth capital
Other PEBuyout(MBO, MBI, LBO, P2P)
Secondary purchase/replacement capital
Rescue/turnaround
INVESTMENT ACTIVITY
NOTE: Note: Only includes investments with financing round information.

| 201
5 YE
AR
BO
OK
– N
ovem
ber
18
| avc
al.c
om.a
u |
Distribution of investments by company sector
The most active sector for VC investments in FY2015 was ICT, accounting for two thirds of total investment value (at $144m) and over half of all startups receiving VC investment (49 startups). This growth reflects the continued increase in interest in Australia’s tech startup space from local and offshore investors.
In the life sciences/biotech space, there was decreased activity given the scarcity of specialist funds available for investment in this segment. The number of life sciences startups receiving VC investment fell by 19% to 29 and the amount invested was 27% lower (at $46m) compared to FY2014.
Consumer-focused startups saw more interest from VC in FY2015 than in the previous five years. Investees in the consumer products and services sectors, such as Shoes of Prey (which announced it had closed a US$5.5m Series A round in December 2014), raised a total of over $15m.
For FY2015, PE investment continued to be diversified across a wide range of sectors. Just under a quarter of PE investees were in the consumer industry, and they accounted for 35% of total PE amounts invested in FY2015. Notable deals in this sector included Affinity Equity Partner’s investments in the Velocity Frequent Flyer programme, as well as the Riverside Company’s acquisition of C-Learning and Archer Growth’s investment in Laser Clinics Australia.
Business and industrial products and services accounted for one third of new PE investments, such as Orica’s chemicals division (acquired by Blackstone) and LCR Group (sold by CHAMP Private Equity to Archer Capital). 15% of PE investments were in energy and environment-related companies, and included Anchorage Capital Partners’ acquisition of Mark Group, a market leader in solar photo voltaic installations.
INVESTMENT ACTIVITY

| 201
5 YE
AR
BO
OK
– N
ovem
ber
19
| avc
al.c
om.a
u |
Figure 15: VC investments by sector in FY2015 (based on AUD millions)
Figure 16: VC investments by sector in FY2015 (based on number of companies)
ICT
Healthcare andlife sciences
Consumer products,services and retail
Business andindustrial productsand services
Energy andenvironment
Other
64%
7%
3% 4% 1%
21%
ICT
Healthcare andlife sciences
Consumer products,services and retail
Business andindustrial productsand services
Energy andenvironmentv
Other
52%
8%
3% 3%
3%
31%
Figure 17: PE investments by sector in FY2015 (based on AUD millions)
Figure 18: PE investments by sector in FY2015 (based on number of companies)
Agriculture,chemicals andmaterials
Healthcare andlife sciences
Consumer products,services and retail
Business andindustrial productsand services
Energy andenvironment
Financial services
Other
ICT
35%
17%
5% 25%
5% 3%
3%
7%
Agriculture,chemicals andmaterials
Healthcare andlife sciences
Consumer products,services and retail
Business andindustrial productsand services
Energy andenvironmentv
Financial services
Other
ICT
24%
12%
7%
33%
4% 4% 1%
15%
NOTE: Sectors with fewer than three companies receiving investments have been aggregated into “Other”.
INVESTMENT ACTIVITY
ICT
Healthcare andlife sciences
Consumer products,services and retail
Business andindustrial productsand services
Energy andenvironment
Other
64%
7%
3% 4% 1%
21%
Agriculture,chemicals andmaterials
Healthcare andlife sciences
Consumer products,services and retail
Business andindustrial productsand services
Energy andenvironment
Financial services
Other
ICT
35%
17%
5% 25%
5% 3%
3%
7%

| 201
5 YE
AR
BO
OK
– N
ovem
ber
20
| avc
al.c
om.a
u |
SECTOR AMOUNT (AUDm)
% OF TOTAL
NO. OF INV
% OF TOTAL
NO. OF CO.S
% OF TOTAL
Business and industrial products 220.35 6% 11 5% 11 6%
Business and industrial services 565.26 16% 24 11% 15 8%
Chemicals and materials 426.00 12% 4 2% 4 2%
Communications 39.49 1% 20 9% 18 10%
Computer and consumer electronics 266.58 8% 39 18% 33 19%
Consumer goods and retail 272.38 8% 17 8% 14 8%
Consumer services 896.03 26% 13 6% 13 7%
Energy and environment 127.66 4% 18 8% 16 9%
Financial services 279.55 8% 55 26% 39 22%
Life sciences 32.87 1% 6 3% 6 3%
Other 345.38 10% 7 3% 7 4%
TOTAL INVESTMENTS 3,492.58 100% 215 100% 177 100%
Subtotal High-tech 217.76 6% 101 47% 81 46%
Subtotal cleantech 119.25 3% 6 3% 6 3%
Figure 19: VC ICT investment by round type in FY2015 Figure 20: VC life sciences investment by round type in FY2015
Amount invested Number of investments
Seed round
Series C+Serie A
Serie B
0%
75%
50%
25%
5%
39%
22%
34%
27%
42%
17%
15%
100%
`
Amount invested Number of investments
Seed round
Series C+Serie A
Serie B
0%
75%
50%
25%
24%
35%
32%
9%
50%
19%
19%
12%100%
TABLE 6: Distribution of investments in FY2015 (by sector)
NOTE: Sectors with fewer than three companies receiving investments have been aggregated into “Other”
NOTE: The categories displayed in Figures 15-18 and respective sub-categories from Table 6 have been grouped as follows: Business and industrial products and services (Business and industrial products, business and industrial services, construction, transportation), consumer products, services and retail (consumer goods and retail, consumer services), financial services (financial services, real estate), ICT (communications, computer and consumer electronics).

| 201
5 YE
AR
BO
OK
– N
ovem
ber
21
| avc
al.c
om.a
u |
Distribution of investments by geographical location
Just under half of total PE and VC investment, at a combined $1.72b, in FY2015 went to New South Wales-headquartered companies, falling slightly from the 68% observed in the previous year. Conversely, both Victoria and Queensland saw total PE and VC investment growing from FY2014 to FY2015 by 64% and 192%, respectively.
As in previous years, North American companies such as US-based startups and Canadian resources companies accounted for the majority of offshore investment by Australian GPs, although the amount invested in these companies fell by 36% from FY2014 to FY2015. 22% of Australian VC investment went to US-based companies.
Capital deployed elsewhere around the world included a US$6 million Series A round led by Square Peg Capital in Tel-Aviv based Feedvisor, and Telstra Ventures’ participation in an investment round for location intelligence company AdNear, headquartered in Singapore.
Figure 21: Distribution of Australian investments in FY2011 - FY2015 (by location of company headquarters)
QLD A$m NO. OF COS
VC 63.38 15
PE 1,379.69 33
NSW A$m NO. OF COS
VC 672.42 70
PE 6,182.86 108
VIC A$m NO. OF COS
VC 218.24 53
PE 4,467.37 56
SA A$m NO. OF COS
VC 6.57 7
PE 703.12 12
WA A$m NO. OF COS
VC 18.35 8
PE 1,002.44 28
OTHER A$m NO. OF COS
VC/PE 116.49 10

| 201
5 YE
AR
BO
OK
– N
ovem
ber
22
| avc
al.c
om.a
u |
VENTURE CAPITAL PRIVATE EQUITY
LOCATION AMOUNT (AUDm)
% OF TOTAL
NO. OF COMPANIES
% OF TOTAL
AMOUNT (AUDm)
% OF TOTAL
NO. OF COMPANIES
% OF TOTAL
Australia 166.94 75% 70 74% 3,127.43 96% 75 89%
New South Wales 106.22 47% 30 32% 1,612.02 49% 32 38%
Victoria 40.45 18% 25 27% 607.89 19% 18 21%
Queensland 18.65 8% 9 10% 337.09 10% 11 13%
Western Australia N/A N/A N/A N/A 191.42 6% 9 11%
South Australia N/A N/A N/A N/A 211.00 6% 3 4%
ACT 1.57 1% 5 5% N/A N/A N/A N/A
Other 0.05 0% 1 1% 168.01 5% 2 2%
North America 49.56 22% 20 21% 35.84 1% 5 6%
Asia 7.06 3% 3 3% N/A N/A N/A N/A
Other 0.33 0% 1 1% 141.25 4% 4 5%
TOTAL INVESTMENT 223.89 100% 94 100% 3,268.69 100% 84 100%
Total investee companies in VC and PE portfolios
The total number of investee companies in VC and PE portfolios as of 30 June 2015 was 606, a 9% increase compared to the number recorded on 30 June 2014, as the slower pace of divestments and increased momentum in fundraising and investment throughout the year led to net growth in portfolios.
The number of high-tech companies as a proportion of all VC and PE-backed investees increased slightly from 38% to 39%.
The number of cleantech companies was down slightly from 44 in FY2014 to 40 in FY2015. New cleantech investees include Mark Group Australia (acquired by Anchorage Capital Partners in April 2015), and Octillion Power Systems (backed by Southern Cross Ventures Partners).
VENTURE CAPITAL PRIVATE EQUITY TOTAL
TOTAL NUMBER OF COMPANIES 270 345 606
Subtotal: no. of high-tech companies 210 34 239
Subtotal: no. of cleantech companies 22 19 40
TABLE 7: Distribution of investments in FY2015 (by location of company headquarters)
NOTE: States/countries with fewer than three companies receiving investments have been aggregated into “Other”.
TABLE 8: Number of investee companies in VC and PE portfolios as of 30 June 2015
NOTE: High-tech and cleantech are not mutually exclusive. A company can be backed by both VC and PE funds at the same time. See glossary for the definitions of high-tech and cleantech companies.

| 201
5 YE
AR
BO
OK
– N
ovem
ber
23
| avc
al.c
om.a
u |
DIVESTMENT ACTIVITY3

| 201
5 YE
AR
BO
OK
– N
ovem
ber
24
| avc
al.c
om.a
u |
Distribution of divestments by exit methods
The pace of divestments slowed in FY2015 compared to the previous two years, as the total number of companies exited by PE and VC fell to 51 (compared to 70 in FY2014 and 68 in FY2013). Despite the lower number of exits, however, divestments made throughout the year by both PE and VC funds continued to see very healthy returns being distributed back to investors.
PE-backed IPO activity in FY2015 was healthy but notably more subdued compared to the strong number of exits in FY2014 via the listed markets. Nevertheless, several PE-backed companies of significant issue size listed successfully during the year, including Healthscope (a TPG Capital and Carlyle Group investee) and Estia Health (backed by Quadrant Private Equity and Mercury Capital). As of 30 June 2015, Estia Health and Heathscope shares were trading 4% and 28% higher, respectively, than their issue prices.
Some GPs that had partially existed via IPOs in FY2014, but were still holding post-IPO equity stakes in escrow, were also able to fully realise those investments in FY2015. Funds managed by Pacific Equity Partners sold down stakes in Spotless and Veda, whilst Crescent Capital Partners exited travel insurer Cover-More. The shares of all three companies were trading substantially higher than their respective issue prices as of 30 June 2015.
Exits via trade sale in FY2015 fell to their lowest levels since FY2009, with only 20 PE and VC portfolio companies sold to trade buyers. Notable PE trade sales during the year include the acquisition by offshore fund ID Leisure Ventures of Hoyts (previously backed by funds managed by Pacific Equity Partners), and Affinity Equity Partners’ sale of Primo Smallgoods to JBS, a Brazil-based food processing company. A lack of secondary exits for both PE and VC in FY2015 also contributed to lower divestment levels.
Significant VC exits in FY2015 included the sale of Spinifex, backed by GBS Venture Partners, Brandon Capital Partners and Uniseed, in one of the most succesful exits in the history of Australian VC to date. The company was acquired by one of the largest pharmaceutical companies in the world, Swiss-based Novartis, for an upfront payment of US$200m and potential milestone payments of US$500m.
Trade sales accounted for the majority of VC exits, reaching its equal highest level in five years with over double the number of companies divested by this method in FY2015 compared to FY2014.
Notable non-trade sales for VC were the listing of 3P Learning, an online education provider backed by Insight Venture Partners, on the ASX in July 2014, and the $36.5m AirXpanders IPO in June 2015.2
DIVESTMENT ACTIVITY
2 AirXpanders investor GBS Venture Partners did not sell down any portion of its holding at the time of the IPO, and hence it has not been recorded as an exit in the Yearbook statistics.

| 201
5 YE
AR
BO
OK
– N
ovem
ber
25
| avc
al.c
om.a
u |
Figure 22: Divestments by Australian VC funds by fiscal year (in AUD millions)
Figure 23: Divestments by Australian PE funds by fiscal year (in AUD millions)
FY12
FY11
FY13
FY14
FY15
No. of com
panies
A$m Amount divested at cost (A$m) No. of companies
0
10
20
30
0
50
100
150
FY12
FY11
FY13
FY14
FY15
No. of com
panies
A$m Amount divested at cost (A$m) No. of companies
0
40
20
60
80
0
1,500
3,000
4,500
VENTURE CAPITAL PRIVATE EQUITY TOTAL
TYPE OF DIVESTMENT DIVESTMENT AT COST (AUDm)
NO. OF CO.S
DIVESTMENT AT COST (AUDm)
NO. OF CO.S
DIVESTMENT AT COST (AUDm)
NO. OF CO.S
Divestment by trade sale 69.73 10 825.51 10 897.02 20
Divestment on flotation (IPO) N/A N/A 1,379.38 8 1,379.38 8
Sale of equity post-flotation N/A N/A 708.61 10 708.61 10
Repayment of preference shares/loans N/A N/A 157.59 7 157.59 7
Other 26.77 4 35.03 3 61.80 7
TOTAL DIVESTMENTS 96.49 14 3,106.12 37 3,202.61 51
Distribution of divestments by sector
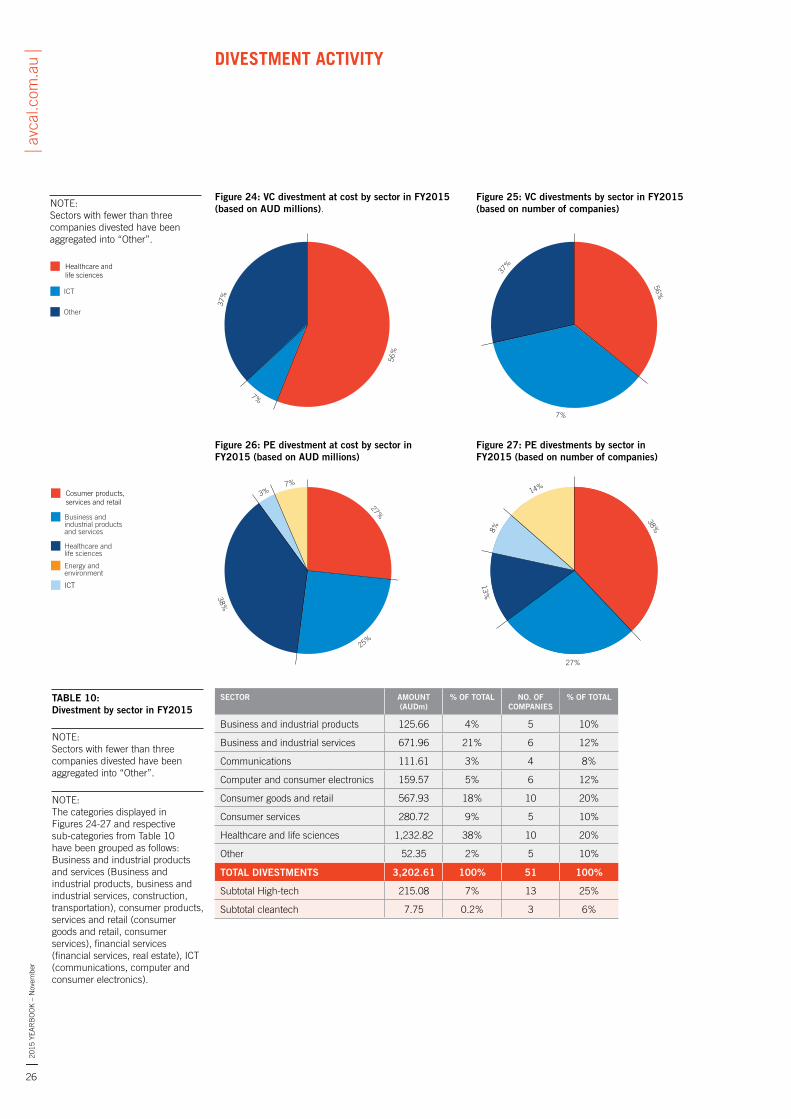
Close to 27% of PE divestment at cost in FY2015 came from the consumer sector. In terms of the number of companies, this sector accounted for a substantial 38% of PE exits, including the IPO of Adairs (part owned by Catalyst Investment Managers) and the sale of a post-IPO stake in Dick Smith by Anchorage Capital Partners.
The healthcare sector saw two significant exits in FY2015: the listings of Healthscope (the biggest exit of the year with an IPO issue size of over $2b), and Estia Health (with a $725m IPO). These exits contributed to healthcare being the most active sector by amount divested at cost, at 38%.
The business and industrial products and services sector made up about a quarter of total divested companies and the total amount divested at cost. Notable exits in this sector included the sell-down of Pacific Equity Partners’ post-IPO stake in Veda, which listed in December 2013.
The life sciences sector saw a flurry of VC exit activity in FY2015, with over half of the total amount divested at cost and 40% of total companies divested coming from this sector. The largest exit for the sector was the sale of Spinifex to Novartis.
A number of US-based portfolio companies backed by Australian VCs were also divested, including Boulder Ionics, a developer of ionic liquids backed by Southern Cross Venture Partners, and Elto, a Blackbird Ventures investee that was acquired by US web hosting company GoDaddy in April 2015.
TABLE 9: Divestment by exit routes in FY2015
NOTE: Divestment types with fewer than three companies have been aggregated into “Other”. Divestments by public offering are not included in the totals unless the investment has been realised partially or in full during the financial year.
DIVESTMENT ACTIVITY
| 201
5 YE
AR
BO
OK
– N
ovem
ber
26
| avc
al.c
om.a
u |
Figure 24: VC divestment at cost by sector in FY2015 (based on AUD millions).
Figure 25: VC divestments by sector in FY2015 (based on number of companies)
Healthcare andlife sciences
ICT
Other
56%
37%
7%
Healthcare andlife sciences
ICT
Other56%
37%
7%
Figure 26: PE divestment at cost by sector in FY2015 (based on AUD millions)
Figure 27: PE divestments by sector in FY2015 (based on number of companies)
Cosumer products,services and retail
Business andindustrial productsand services
Energy and environment
Healthcare andlife sciences
27%
7%3%
38%
25%
ICT
Other
Cosumer products,services and retail
Business andindustrial productsand services
Healthcare andlife sciences
38% 8%
14%
13%
27%
ICT
Other
SECTOR AMOUNT (AUDm)
% OF TOTAL NO. OF COMPANIES
% OF TOTAL
Business and industrial products 125.66 4% 5 10%
Business and industrial services 671.96 21% 6 12%
Communications 111.61 3% 4 8%
Computer and consumer electronics 159.57 5% 6 12%
Consumer goods and retail 567.93 18% 10 20%
Consumer services 280.72 9% 5 10%
Healthcare and life sciences 1,232.82 38% 10 20%
Other 52.35 2% 5 10%
TOTAL DIVESTMENTS 3,202.61 100% 51 100%
Subtotal High-tech 215.08 7% 13 25%
Subtotal cleantech 7.75 0.2% 3 6%
DIVESTMENT ACTIVITY
NOTE: Sectors with fewer than three companies divested have been aggregated into “Other”.
Healthcare andlife sciences
ICT
Other
56%
37%
7%
TABLE 10: Divestment by sector in FY2015
NOTE: Sectors with fewer than three companies divested have been aggregated into “Other”.
NOTE: The categories displayed in Figures 24-27 and respective sub-categories from Table 10 have been grouped as follows: Business and industrial products and services (Business and industrial products, business and industrial services, construction, transportation), consumer products, services and retail (consumer goods and retail, consumer services), financial services (financial services, real estate), ICT (communications, computer and consumer electronics).
Cosumer products,services and retail
Business andindustrial productsand services
Energy and environment
Healthcare andlife sciences
27%
7%3%
38%
25%
ICT
Other

| 201
5 YE
AR
BO
OK
– N
ovem
ber
27
| avc
al.c
om.a
u |
METHODOLOGY & GLOSSARY

| 201
5 YE
AR
BO
OK
– N
ovem
ber
28
| avc
al.c
om.a
u |
SAMPLE FY2015 figures are based on the activities of 79 venture capital and private equity firms, comprising 40 AVCAL members and 39 non-members. Of this number, 43 submitted data directly to AVCAL, representing 90% of total Australian funds under management. Publicly available information from firm websites, press releases and industry news sources was used to estimate the activities of the remaining firms. The sample does not include fund-of-funds, infrastructure or real estate funds.
Firms that participate in the survey benefit in the following areas:
– Access to more detailed industry data (see http://www.avcal.com.au/stats-research/statistics-research for details).
– Customised research reports by request.
Non-AVCAL members are also eligible to participate in the survey; however, they will need to contact [email protected] to receive individual login details to the PEREP_Analytics platform.
DATA COLLECTIONParticipants have the choice of providing data via the secure online PEREP_Analytics platform, or through standardised Excel spread sheet templates which are then uploaded by AVCAL research staff into the online platform.
The data collection exercise is complemented by the use of public sources of information (e.g. firms’ websites, press releases, news reports). This data is used for the following purposes:
– To pre-populate the database. The participant then either validates or edits this pre-populated information as necessary.
– To reduce response errors and verify accuracy of responses.
– To fill in missing information where such data is not provided directly.
Each submitted piece of information is reviewed according to a systematic process of quality checks, of which a certain number of checks are built into the PEREP platform. AVCAL research staff also contact the participating firms where necessary to seek further clarifications on the data provided.
EXCHANGE RATES The Yearbook’s default currency is the Australian dollar (AUD). PEREP_Analytics automatically converts non-AUD fundraisings, investments, and divestments to AUD at the Reserve Bank of Australia’s spot foreign exchange rates (which can be found here: http://www.rba.gov.au/statistics/frequency/exchange-rates.html) on the date of the fund’s reported close or investment/divestment date. If no exchange rate is available for a given fundraising or transaction date, the exchange rate of the previous available date is used.
FUNDRAISING
Fundraising amounts
These figures record the amount of commitments received as of a first, intermediate or final fund closing occurring within a particular financial year. It refers to the incremental commitments raised during a particular period. If a fund has had successive closings over more than one reporting period, only the incremental amount raised during the reporting period is included.
Fundraising by location of fund management office
The fund country is defined by the location of the advisory team, not by the place of incorporation of the fund for tax reasons. Global/regional VC and PE firms headquartered outside of Australia – including those with Australian offices – with funds that invest in Australia are not included in total funds under management or fundraising numbers, unless the fund manager can identify the specific amount allocated to Australian investments. However, investments/divestments made by these funds are included in the investment/divestment results.
INVESTMENTS AND DIVESTMENTS Important parameters apply to the measurement of investments and divestments:
– Only investments and divestments derived from VC or PE funds are included. If a deal involves non-VC or non-PE co-investors, only the investment from VC or PE vehicles is included in the total amounts invested.
– The activities of global/regional VC and PE funds that are active in Australia are included in the investment and divestment aggregates.
– While ad hoc investments into real estate or infrastructure deals made by qualifying funds are captured, any investments made by dedicated real estate or infrastructure funds are not captured (as these funds do not qualify as part of the universe of eligible funds in the sample).
METHODOLOGY

| 201
5 YE
AR
BO
OK
– N
ovem
ber
29
| avc
al.c
om.a
u |
METHODOLOGY
Amount of Investment
This refers to capital (in the form of equity, convertible equity, mezzanine, unsecured debt or secured debt) invested by the PE or VC fund. It does not refer to the deal’s transaction/enterprise value. Debt provided by third parties as part of a deal is not included in the investment figures, unless the debt is provided by VC or PE funds. This means that external bank debt, for example, is not included in the calculation of investment totals.
Number of investments
The number of investments is calculated based on the number of investments made by each reporting investment vehicle. For example, if a PE firm that manages three separate funds invests in a company using capital from each of these funds, then this is counted as three investments. New and follow-on investments are counted as separate investments. For syndicated deals, the investment attributable to each vehicle in the syndicate is counted as a separate investment.
Number of companies invested in
This refers to the companies receiving VC or PE investment. Companies with multiple VC or PE investors are only counted once under “number of companies” except for the instances described below under “Distribution of investments by stage of investee company” and “Sectoral distribution of investments”.
Distribution of investments by stage of investee company
The total number of companies in the relevant table corresponds to the number of portfolio companies that received PE or VC investments with respect to their stage. Because a company can be recorded under different investment stages over successive funding rounds, the sum of the number of companies in all stages can thus exceed the actual number of companies that receive investment. For a company receiving multiple rounds of financing a year – for example, an early stage venture investment of $100m by one investor, followed by a later stage venture investment of $200m by two investors in the same company in the same financial year – the table would indicate the following:
INVESTMENT STAGE AMOUNT (AUDm) NO. OF INV NO. OF CO.S
Early stage VC 100 1 1
Later stage VC 200 2 1
TOTAL INVESTMENT 300 3 1
This will only affect counts of companies – it does not affect amounts – and makes any average more accurate.
Sectoral distribution of investments
The total number of companies in the relevant corresponds to the number of portfolio companies that received PE or VC investments with respect to their business sector. Because GPs that are part of a syndicate may record the same portfolio company under different sectors, a small number of companies can be recorded under more than one business sector. The sum of the number of companies in all sectors can thus exceed the actual number of companies that receive investment. For example, for a syndicated deal involving two investors, with one investing $100m and the other $200m in the same company but with both independently reporting different business sectors for the target company, the table would indicate the following:
SECTOR AMOUNT (AUDm)
NO. OF INV NO. OF CO.S
Business and industrial products 100 1 1
Business and industrial services 200 1 1
TOTAL INVESTMENTS 300 2 1
This will only affect counts of companies – it does not affect amounts – and makes any average more accurate.

| 201
5 YE
AR
BO
OK
– N
ovem
ber
30
| avc
al.c
om.a
u |
Number of divestments
This is based on each fund’s exit from an investee company (e.g. two funds exiting the same company will be counted twice). Partial divestments are included in this number. A company could have had a number of divestments made from it in any particular year.
Number of companies being divested
This is the number of companies where there have been full or partial exits during a given reporting period. A company will only be counted once even if two or more funds are exiting from that company, or if multiple partial exits from the company have been made in any particular year.
Exit method
This refers to the means by which the divestment occurs. If the divestment is to a syndicate made of various types of buyers (e.g. a corporate, management and another buyout firm), the splits by divestment method would need to reflect the respective divestment methods (e.g. divestments by trade sale, sale to management and sale to another private equity firm). Similarly, partial divestments through different methods would need to reflect the respective divestment methods at each partial divestment.
Sectoral distribution of divestments
The total number of companies in the relevant table corresponds to the number of portfolio companies that were divested by VC or PE funds with respect to their business sector. Because GPs that are part of a syndicate may record the same portfolio company under different sectors, a small number of companies can be recorded under more than one business sector. The sum of the number of companies in all sectors can thus exceed the actual number of companies that were divested. For example, for a syndicated divestment involving two investors, with one divesting $100m at cost and the other $200m at cost from the same company but with both independently reporting different business sectors for the target company, the table would indicate the following:
SECTOR AMOUNT DIVESTED AT COST (AUDm)
NO. OF DIV NO. OF CO.S
Business and industrial products 100 1 1
Business and industrial services 200 2 1
TOTAL DIVESTMENTS 300 3 1
This will only affect counts of companies – it does not affect amounts – and makes any average more accurate.
METHODOLOGY
| 201
5 YE
AR
BO
OK
– N
ovem
ber
31
| avc
al.c
om.a
u |
Balanced VC fund Venture capital funds focused on both early stage and development with no particular concentration on either.
Buyout/Later stage PE fund Private equity funds whose strategy is to acquire other businesses.
Calendar year Year ending 31 December.
Captive funds Funds that are 100% owned by the parent organisation.
Cleantech Covers a diverse range of products, services, and processes that are inherently designed to provide superior performance at lower costs, greatly reduce or eliminate environmental impacts and, in doing so, improve the quality of life. Clean technologies span many industries such as Agriculture, Energy, Manufacturing, Transportation and Water.
Closing A closing is reached when a certain amount of money has been committed to a private equity or venture capital fund by investors. Several intermediate closings can occur (the initial one is called first closing), which allow the GPs to draw capital for investments while they are still finalising the fundraising. Some funds only have one (final) closing. The fundraising is captured at the date of commitment (when the closings are formalised) where possible. For evergreen funds their closings are always classified as intermediate closings.
Convertible equity Non-equity securities which are convertible to equity.
Corporate investor Corporations that deliver non-financial goods/services (excludes banks, fund-of-funds, insurance companies, pension funds, and other asset managers).
Distressed debt fund Funds that primarily invest in companies with undervalued debt that have either filed for bankruptcy protection or likely to be bankrupt in the near future with an intention to reorganise and reinstate the company as going concern.
Divestment A full or partial exit from an investee company.
Early stage VC fund Financing to companies that have completed the product development stage and require further funds to initiate commercial manufacturing and sales. They will typically have a proven concept, with minimal products but negative earnings. In most cases the product has not yet been commercialised. They will not yet be generating a profit.
Equity Ownership interest in a corporation, represented by the shares of stock, which are held by investors.
Fiscal year Year ending 30 June.
Fund-of-funds A private equity fund that primarily takes equity positions in other private equity funds.
Funds under management The total amount of funds available to fund managers for future investments plus the amount of funds already invested (at cost) and not yet divested. Excludes fund-of-funds, real estate funds, infrastructure funds, and venture credit funds.
Generalist fund Funds with either a stated focus of investing in all stages of private equity investment, or funds with a broad area of investment activity.
GP General partner. A class of partner in a partnership, the general partner retains liability for the actions of the partnership.
Growth/Expansion PE fund Funds whose strategy is to invest in or acquire relatively mature companies that are looking for capital to expand or restructure operations; they often provide the first private equity investment in a company.
High-tech A company with exclusive ownership of certain intellectual property rights such as design rights, patents, copyrights, etc. which are critical elements in adding value to the products and business of a company and which are being developed in-house by the company’s permanent staff. Although companies possessing these attributes are not limited to specific industries, they are most frequently found in telecommunications hardware, internet technology, computer products and services, electronics, biotechnology, medical instruments and devices.
ICT Information and communications technology.
Independent funds Semi-captive funds (those in which the parent owns less than 100%) as well as wholly independent funds.
Investment Capital (in the form of equity, convertible equity, mezzanine, unsecured debt or secured debt) invested by the fund. It does not refer to the deal’s transaction value/enterprise value.
IPO Initial public offering.
Later stage VC fund A venture capital fund focused on investments in later-stage companies in need of expansion capital, usually providing third- or fourth- (or a subsequent) round of venture investments.
LP Limited partner. An investor in a limited partnership, they are generally protected from legal actions and any losses beyond their original investment.
Management buy-out (MBO) Financing provided to enable current operating management and investors to acquire an existing product line or business.
Management buy-in (MBI) Financing provided to enable a manager or group of managers from outside the company to buy-in to the company with the support of private equity investors.
Mezzanine fund or Mezzanine financing Mezzanine funds are funds which provide (generally subordinated) debt to facilitate the financing of buyouts, frequently alongside a right to some of the equity upside. Mezzanine financing is loan finance that is halfway between equity and secured debt, either unsecured or with junior access to security.
GLOSSARYA – M
| 201
5 YE
AR
BO
OK
– N
ovem
ber
32
| avc
al.c
om.a
u |
GLOSSARYP – Z
P2P A public-to-private transaction. A form of leveraged buyout where a listed company is acquired and subsequently delisted.
PIPE A private investment in public equity (PIPE), as a minority or majority stake, without taking the company private.
Portfolio companies Companies the private equity firm have invested in and have not fully divested.
Private Equity Private Equity covers growth/expansion, generalist, buyout/later stage, turnaround, secondary and mezzanine funds.
Private Pension Fund A pension fund that is regulated under private sector law.
Proceeds Total proceeds realised from the sale of a portfolio company net of debt, transaction, and other costs.
Public Pension Fund A pension fund that is regulated under public sector law.
Public-to-private A transaction involving an offer for the entire share capital of a listed target company for the purpose of delisting the company; management may be involved in the offering.
Refinancing bank debt To reduce a company’s level of gearing.
Repayment of preference shares/loans If the private equity firm provided loans or bought preference shares in the company at the time of investment, then their repayment according to the amortisation schedule represents a decrease of the financial claim of the firm into the company, and hence a divestment.
Rescue/Turnaround Investment in companies with poor performance with an intention to achieve a positive performance reversal.
Sale of quoted equity post-flotation Sale of quoted shares by a PE or VC fund, e.g. sale of a listed investment, or sale of quoted shares after a lock-up period.
Sale to another PE firm The sale of company shares to another PE firm.
Sale to management The sale of company shares to the management of the company.
Secondary funds or secondary purchase/replacement capital Secondary Funds are funds that focus on purchasing the portfolios of investee companies from an existing PE firm. A secondary purchase is typically a purchase of existing shares in a company from another private equity firm.
Secured debt Loans secured on the company assets.
Seed stage Financing provided to research, assess and develop an initial concept before a business has reached the start-up phase.
Sovereign funds A state-owned investment fund.
Start-up Financing provided to companies for product development and initial marketing. Companies may be in the process of being set up or may have been in business for a short time, but have not sold their product commercially.
Trade sale The sale of company shares to an industry investor or a strategic buyer.
Unsecured debt Loans not secured on the company’s assets.
Venture capital A venture capital firm refers to a firm that makes equity investments for the launch, early development, or expansion of a business, typically in an innovative/high-tech product or service. Venture Capital covers Seed, Early Stage, Later Stage VC and Balanced VC funds. It does not include buyout investing, mezzanine investing, fund-of-fund investing, secondaries, etc.
Vintage year The year of the first closing of the fund.
Write-off The write-down of a portfolio company’s value to zero or a symbolic amount. The value of the investment is eliminated and the return to investors is zero or negative.


| avc
al.c
om.a
u |
Level 10, Kyle House 27-31 Macquarie Place Sydney NSW 2000 Tel +61 2 8243 7000 [email protected] on 50% recycled paper