2015 - foot locker · 330 west 34th street new york, ny 10001 developing our leadership positions...
TRANSCRIPT

330 WEST 34TH STREET
NEW YORK, NY 10001
Developing Our Leadership Positions
20
15
AN
NU
AL
RE
PO
RT
2015 ANNUAL REPORT
41378_Cover.indd 1 3/28/16 8:45 AM

TABLE OF CONTENTS
FINANCIAL HIGHLIGHTS*
2011 2012 2013 2014 2015
Sales** $ 5,623 $ 6,101 $ 6,505 $ 7,151 $ 7,412Sales per Gross Square Foot $ 406 $ 443 $ 460 $ 490 $ 504Adjusted Financial Results: Earnings Before Interest and Taxes** $ 446 $ 602 $ 676 $ 816 $ 946 EBIT Margin 7.9% 9.9% 10.4% 11.4% 12.8% Net Income** $ 281 $ 380 $ 432 $ 522 $ 606 Net Income Margin 5.0% 6.2% 6.6% 7.3% 8.2% Diluted EPS from Continuing Operations $ 1.82 $ 2.47 $ 2.87 $ 3.58 $ 4.29 Return on Invested Capital 11.8% 14.2% 14.1% 15.0% 15.8%Cash, Cash Equivalents and Short-Term Investment Position, Net of Debt** $ 716 $ 795 $ 728 $ 833 $ 891
See pages 16-17 of Form 10-K for the reconciliation of GAAP to non-GAAP adjusted results.
** In Millions
Financial Highlights ............................................................ 1Our Businesses .................................................................. 2Letter to Shareholders ........................................................ 3Our Vision, Core Values, Strategies and Goals .................. 6Core Business .................................................................... 7Kids’ Business .................................................................... 9European Expansion .......................................................... 11Digital ................................................................................. 12
Apparel ............................................................................... 13Growth in Women’s ............................................................ 15Industry-Leading Team ....................................................... 16Community ......................................................................... 17Form 10-K .......................................................................... 18Board of Directors, Corporate Management, Division Management, Corporate Information ................... IBC
Foot Locker, Inc. (NYSE: FL) is a leading global retailer of athletically inspired shoes and apparel. Headquartered in New York City, the Company operates 3,383 athletic retail stores in 23 countries in North America, Europe, Australia, and New Zealand under the brand names Foot Locker, Champs Sports, Kids Foot Locker, Footaction, SIX:02, Lady Foot Locker, Runners Point, and Sidestep.
mobile, and catalog channels. In addition to websites for each of the store banners, such as footlocker.com, the direct-to-customer business includes Eastbay, a leading destination for the serious athlete.
This report contains forward-looking statements within the meaning of the federal securities laws. Other than statements of historical facts, all statements which address activities, events, or developments
and disruptions to transportation services and distribution.
1
BOARD OFDIRECTORS
Nicholas DiPaolo 1, 3, 5
Chairman of the Board
Retired Vice Chairman
Bernard Chaus, Inc.
Maxine Clark 2, 5
Founder and Retired Chief Executive Bear Build-A-Bear Workshop, Inc.
Alan D. Feldman 1, 3, 5
Retired Chairman of the Board, President and Chief
Midas, Inc.
Jarobin Gilbert Jr. 2, 4
DBSS Group, Inc.
Richard A. Johnson 1
Guillermo G. Marmol 1, 2, 5
President Marmol & Associates
Matthew M. McKenna 1, 2, 5
Senior Advisor to the U.S. Secretary of Agriculture
Steven Oakland 3, 4
President - Coffee and FoodserviceThe J.M. Smucker Company
Cheryl Nido Turpin 3, 4
Retired President and
The Limited Stores
Dona D. Young 1, 3, 4 Retired Chairman of the Board,
The Phoenix Companies, Inc.
1 Member of Executive Committee
2 Member of Audit Committee
3 Member of Compensation and Management Resources Committee
4 Member of Nominating and Corporate Governance Committee
5 Member of Finance and Strategic Planning Committee
CORPORATEMANAGEMENT
Richard A. Johnson President and
Robert W. McHugh Executive Vice President – Operations Support Lauren B. Peters Executive Vice President and
Senior Vice Presidents:
Paulette R. Alviti
Jeffrey L. BerkReal Estate
Giovanna Cipriano
Sheilagh M. Clarke General Counsel and Secretary
Pawan Verma
Vice Presidents:
Saadi A. Majzoub Supply Chain
John A. Maurer Treasurer and Investor Relations
Dennis E. SheehanDeputy General Counsel
Bernard F. SteenmanRisk Management
Caryn M. SteinertHuman Resources
DIVISIONMANAGEMENT
Stephen D. Jacobs Executive Vice President and
Franklin R. BrackenVice President and General Manager, Foot Locker Canada
Natalie M. EllisVice President and General Manager, SIX:02
Andrew I. GrayVice President and General Manager, Foot Locker U.S. and Lady Foot Locker
Bryon W. MilburnSenior Vice President and General Manager, Champs Sports
Christopher L. SantaellaVice President and General Manager, Kids Foot Locker
Kenneth W. Side Vice President and General Manager, Footaction
Lewis P. Kimble Executive Vice President and
International
Bart de WildeVice President and General Manager, Runners Point Group
Nicholas Jones Vice President and General Manager, Foot Locker Europe
Phillip G. Laing Vice President and General
Dowe S. Tillema
Footlocker.com/Eastbay
CORPORATEINFORMATION
Corporate Headquarters330 West 34th Street
Worldwide Website -
er-inc.com offers information about -
quarterly results, press releases, and corporate governance documents.
Transfer Agent and Registrar Computershare
Outside U.S. and Canada
changes to: Computershare
Independent Registered Public Accounting Firm KPMG LLP
Dividend Reinvestment Dividends on Foot Locker, Inc. common stock may be reinvested through participation in the Dividend Reinvestment Program. Participating
cash purchases of Foot Locker, Inc. common stock. Please contact our Transfer Agent.
Service Marks and TrademarksThe service marks and trademarks Foot Locker, Footaction, Lady Foot Locker, Kids Foot Locker, Champs Sports, footlocker.com, Eastbay, Team Edition, SIX:02, Runners Point, and Sidestep are
Investor Information Investor inquiries should be directed to the Investor Relations Department at
41378_Cover.indd 2 3/25/16 12:20 PM

APPROVED
kidsfootlocker.comfootlocker.com
footaction.com
ladyfootlocker.com
THE PLACE FOR HER
YOUR WAY, OUR PASSION
GO BIG
IT’S YOUR TIME WE KNOW GAMEOWN IT
FIRST CHOICE FOR ATHLETES
eastbay.com
SNEAKER LIFESTYLE
sidestep-shoes.comrunnerspoint.com
six02.com
2
champssports.com

Welcome to Foot Locker, Inc.’s Annual Report for 2015, an outstanding year for our Company, filled as it was with record financial and operating results. Indeed, I could not be more proud of the many accomplishments our team compiled in this, my first full year as Chief Executive Officer. We began the year by introducing a revised strategic framework and priorities, as well as elevated long-term financial objectives, and I am pleased to report in this letter and on the following pages that we contin-ued to make progress throughout the year on multiple initiatives and on all the key performance measures we track. For those of you newer to our story, it was towards the end of 2009 that we truly started our journey to become the high-performance company we are today. It was then that we intro-duced our first set of strategic priorities and long-range financial goals, and one constant ever since has been our vision: to be the leading global retailer of athletically inspired shoes and apparel. While each of the words in that vision statement was chosen carefully, I would like to emphasize one particular word which will provide a theme for this shareholder report: leading. We do not aspire merely to be good, above average performers; we aspire to be leaders. We strive to be leaders as a company, as operating divisions, as teams, as individuals, in the communi-ties in which we work and live, and as business partners. This leadership crosses multiple dimensions: geographic regions, sales channels, retail banners, families of business, and product categories. Each person in the Company can and does play an impor-tant role in developing our position as leaders in the athletic industry, a point which we consistently emphasize at all levels of the organization. You will see many powerful examples of such leadership positions throughout this annual report.
2015 FINANCIAL HIGHLIGHTS
As a company, we continued to deliver industry-leading performance in 2015, as seen in the table above. Of particular note, in our first year working towards our current long-term objectives, we succeeded in attaining one of them, having achieved an Earnings Before Interest and Taxes rate of 12.8 percent of sales. Other financial highlights accomplished by the Foot Locker, Inc. team in 2015 include:• Sales of $7.4 billion in total, up 8.9 percent from 2014 on a
constant currency basis.
• Non-GAAP net income of $606 million in 2015, a 16 percent increase over last year’s $522 million.
• Earnings of $4.29 per share, a 20 percent increase over last year’s EPS, with the four percentage point differential be-tween the growth in net income and EPS due to our acceler-ated share repurchase activity during the year.
• 24 consecutive quarters of meaningful sales and profit increases, consistently lifting our operational and financial results to new heights.
BUILDING ON STRENGTHS
The strength of our results came from diverse sources. For example:
Channels We drove a 7.6 percent comparable sales gain in our stores while also increasing sales in our direct-to-customer channel by 14.4 percent.
Geographies Our performance was strong in the United States, with a mid-single digit comparable sales gain, while our teams outside the U.S. drove even faster sales growth, with total sales in Europe, Canada, and Australia each increasing more than 10 percent in local currencies.
Product Categories We made substantial progress improving the sales and profitability of all four legs of our product category stool: basketball, running, and casual footwear, and apparel. As the year unfolded, it became increasingly clear that we have de-veloped strong leadership positions in more than just basketball sneakers. True, our basketball business performed very well in 2015, up almost 10 percent, yet our sales of running product
Current Long-Term 2009 2014 2015 Objectives
Sales (billions) $4.9 $7.2 $7.4 $10Sales per Gross Square Foot $333 $490 $504 $600Adjusted EBIT Margin 2.8% 11.4% 12.8% 12.5%Adjusted Net Income Margin 1.8% 7.3% 8.2% 8.5%Return on Invested Capital 5.3% 15.0% 15.8% 17%
3
DEVELOPINGOUR LEADERSHIPP O S I T I O N S
LETTER TO SHAREHOLDERS

increased more than 10 percent. On top of that, we led the industry in sales of a wide variety of classic sneakers, demon-strating the strength and diversity of our footwear assortments. Apparel improved overall, as well, although not yet at the level of our footwear business.
Families of Business Each of our men’s, women’s and kids’ footwear businesses posted substantial sales gains. The gain in men’s footwear in our core adult banners of Foot Locker, Champs Sports, and Footaction was almost 10 percent, while sales of women’s product in those banners increased almost as much. Meanwhile, our women-specific division of Lady Foot Locker / SIX:02 also generated a solid mid-single digit compar-able sales gain. Finally, our already-leading children’s footwear business increased more than 10 percent, with strength in both Kids Foot Locker itself and in the sales of children’s product in our other banners.
Gross Margin Our strong performance did not stop at the sales line; the rest of our income statement was also managed carefully. Our gross margin rate increased to 33.8 percent of sales, an all-time high for our company, for two primary reasons. First, by focusing on offering the most innovative, premium sneakers created by our vendor partners, we strengthened our position at the top end of the distribution pyramid for athletic shoes and apparel, resulting in more full-price selling and higher merchandise margins. Second, we continued to drive success-ful initiatives to improve store productivity, leading to leverage of our mostly fixed rent expense.
SG&A This same emphasis on productivity, along with a steady discipline in managing operating expenses, led to a reduction in our selling, general, and administrative expense rate to an all-time best rate of 19.1 percent of sales in 2015.
CREATING SHAREHOLDER VALUE: A BALANCED APPROACH
Investing in the Business Our capital expend-itures increased to $225 million in 2015, as we continue to lead the athletic market in creating exciting places to shop and buy, not just in terms of our stores, but also our digital and mobile sites. We continued our
remodel program in our Foot Locker and Champs Sports banners, and we began a significant rollout of our remodeled Footaction store design, including several powerful flagship stores such as State Street in Chicago and Fulton Street in Brooklyn. Many of our remodeled stores, across all of our banners, included a vendor partnership space. For example, in partnership with Nike we reached 200 Foot Locker House of Hoops shops around the world and 37 Fly Zones in Kids Foot Lockers in North America. We have more shop-in-shops with Nike in our other banners, as well as additional partnerships with adidas, Puma, and Under Armour. We also continue to invest in our digital and mobile plat-forms, our logistics and information technology systems, and other infrastructure to support the growth of our business. That our return on invested capital reached a new height of 15.8 percent in 2015 is solid evidence that the strategic initiatives behind these investments have led us in a positive direction and generated tremendous value for our business and for you, our shareholders. The returns generated by our investments in recent years have put us in a strong financial position, enabling our Board of Directors to authorize an increase of our capital expenditure program to almost $300 million in 2016. We will continue to invest in our store remodel and vendor partnership projects, our website and mobile functionality, and training programs and technology to enhance the capabilities of our associates. At the same time, we are building transformative retail spaces in midtown Manhattan as well as relocating our corporate head-quarters down the block. 2016 will be another exciting year!
Returns to Shareholders While making significant capital investments in our business to support future growth towards our 2020 financial objectives, we are also committed to return-
ing cash to our shareholders, with both our dividend and our share repurchase program hitting new highs in
2015.
• Dividends We paid $1.00 per share in divi-dends overall in 2015, and in February our Board approved a 10 percent increase in our common stock dividend payable in the first quarter of 2016. This quarterly increase, to 27.5 cents per share, marks the sixth year in a row with a dividend increase in the 10 percent range.
4
TOTAL SALES(in billions)
EARNINGS PER SHARE
$6.5
$2.87
$7.2
$3.58$5.6
$1.82
$6.1
$2.47$4.9
$0.54
$5.1
$1.10
2009 20092010 20102011 20112012 20122013 20132014 20142015 2015
$7.4 $4.29

ACHIEVE RESULTS
CustomerEngagement
Kids
’
Euro
pe
Appa
rel
People
Dig
ital
Wom
en’s
Core Business
• Share Repurchases Early in 2015, our Board of Directors authorized a $1 billion share repurchase program, and during the year we spent $419 million to buy back approximately 6.7 million shares. Some of that activity was under our previ-ous authorization, leaving $637 million remaining under the current repurchase authorization at year end.
Between the $139 million spent on dividends and the $419 million of share repurchases, we returned $558 million directly to shareholders in 2015, which was 93 percent of non-GAAP net income, while still retaining a solid balance sheet offering good financial flexibility for the future. The authorizations to increase both our capital expenditures and our dividend rate in 2016 exhibit the Board’s confidence in our Company’s ability to lead the athletic retail industry and maintain our financial performance in the future.
LOOKING FORWARD
The strategic framework that we introduced early in 2015 remains central to our planning as we focus on the near- and long-term objectives we have challenged ourselves to achieve. As a reminder, the framework is depicted below:
The corresponding strategic priorities are to:• Drive performance in the Core Business with compelling
customer engagement• Expand our leading position in the Kids’ business• Aggressively pursue European expansion opportunities• Build our Apparel penetration and profitability• Build a more powerful Digital business with customer-
focused channel connectivity• Deliver exceptional growth in our Women’s business• Build on our industry-leading team by embracing the power
of our People We have already developed leadership positions in many of these areas—positions of strength we intend to build on further —and we believe we have excellent opportunities yet to seize in all of these businesses as we focus on the future. I’ll save most of the 2015 highlights and near-term initiatives for the remaining pages of this report.
CONCLUSION
There are a great many factors that need to align to create a high-performing team such as we have at Foot Locker, Inc. today. One phrase that is part of our company-specific leader-ship formula is “Love the Game.” Starting with our associates in stores around the world, and including associates in regional offices, distribution and financial service centers, and headquar-ters facilities, our entire team loves the game of retail, and we play to win. We are passionate about our own job responsibil-ities, our team’s specific goals, and the objectives of the entire corporation. This passion has enabled us to build leadership positions in many areas—across banners, geographies, chan-nels, and product categories—and consistently break records in our financial results. I want to thank each and every member of the Foot Locker, Inc. team for their high level of execution and outstanding contributions to our recent success, and for creat-ing the potential for even more excellent results in the future. I also want to thank our outstanding and highly-engaged Board of Directors, whose guidance and support for me and the rest of our senior leadership team has helped the Company achieve so much and positioned us so well for the future. I especially want to acknowledge and thank Nick DiPaolo, who was elected Chairman of the Board in May 2015, for his business insights and dedication to our Company. Finally, I want to thank you, our shareholders, for your sup-port and constructive dialogue over the past year. Your belief in our strategic initiatives, our core values, and, above all, the strength of our team is certainly gratifying. I look forward to continuing our journey together towards being the leading global retailer of athletically inspired shoes and apparel.
Richard A. JohnsonPresident and Chief Executive Officer
5
“Our love of the game has enabled us to build leadership positions in many areas—across banners, geographies, channels, and product categories—and
consistently break records in our financial results.”

Our Vision
INTEGRITYact honestly,
ethically and honorably
LEADERSHIPrespect, inspire,
develop and empower
EXCELLENCEstrive to be the
best in everything we do
SERVICEsatisfy our customers every time
TEAM WORKcollaborate,
trust, support, commit
INNOVATIONbe a student of the business to initiate
and foster new ideas
COMMUNITY embrace diversity, act responsibly for our customers, associates, investors and communities
CORE VALUES
• Drive performance in the Core Business with compelling customer engagement
• Expand our leading position in Kids’
• Aggressively pursue European expansion opportunities
• Build Apparel penetration and profitability
• Build a more powerful Digital business with customer-focused channel connectivity
• Deliver exceptional growth in Women’s
• Build on our industry-leading team by embracing the power of our People
EXECUTE STRATEGIES
BE A TOP QUARTILE
PERFORMER
Sales
$10 BILLION
Sales per Gross Square
Foot
$600
Earnings Before Interest
and Taxes
12.5%
Net Income
8.5%
Return on Invested Capital
17%
Inventory Turnover
3+ TIMES
ACHIEVE RESULTS
To be the leading global retailer of athletically inspired shoes and apparel.
6

DRIVEPERFORMANCEIN THE COREBUSINESS
7
A year ago, we identified five strategies to elevate the performance of our core Foot Locker, Champs Sports, and Footaction businesses from their already-record levels:
• Creating fresh, engaging store environments, primarily through our store remodel programs and by testing, developing, and expanding innovative vendor partnerships• By the end of 2015, we had remodeled approximately
30 percent of the Foot Locker and Champs Sports store fleets, and just under 20 percent of the Footaction stores
• We significantly expanded our vendor shop-in-shops, and now have 200 House of Hoops in partnership with Nike. We also have powerful collaborations with adidas, Jordan, Puma, and—new in 2015—an exciting premium destination with Under Armour called The Armoury at Champs Sports
• We created new flagship retail destinations in Chicago, Los Angeles, and Brooklyn, among other locations, with two more pinnacle shopping environ-ments scheduled to open in Manhattan in 2016
• Promoting and extending our store banners through powerful 360o marketing• We successfully extended our leadership position in
social media engagement on Facebook, Instagram, Twitter, and YouTube
• We created strong marketing programs featuring some of the most popular athletes and entertainers in the world
• Providing our sales associates with tools and training to best serve our customers• We invested in technology, both in-store—such as
handheld devices to facilitate inventory location— and behind-the-scenes systems to improve product allocation and trend analysis
• Building a highly-compelling, locally-relevant footwear and apparel assortment• The steadiness of our sales gains throughout the
year highlighted the fact that we have developed leadership positions in each of our primary footwear categories: basketball, running, and classics
Miracle Mile, Las Vegas, opened in Spring 2015

12 8
SALES PER SQUARE FOOT
$406
$360$333
$443
2009 2010 2011 2012 2013 2014 2015
$460$490 $504

Our Kids’ business continued to see tremendous growth around the world, as we expand our leadership position in this space as well. The three primary strategies we are pursuing to build on our advantage are:
• Developing the kids’ business globally• We expanded the geographical footprint of our Kids’ Foot Locker banner to
374 locations: 349 in the United States, 18 in Europe, and 7 in Canada• We opened 30 Fly Zone shop-in-shop concepts in partnership with Nike• Sales of children’s footwear increased at a double digit percentage rate in all
of our regions and in most of the banners that sell children’s product
• Driving a full-family experience by building connectivity with parents, both in-store and online• We utilized professional athletes, such as Under Armour’s NBA All-Star
Stephen Curry and Nike’s NFL All-Pro Rob Gronkowski, to create authentic, aspirational, and fun marketing content
• Kids Foot Locker expanded its partnership with the Boys and Girls Club, thereby making an even bigger difference in the lives of kids and their families
• Leveraging our strengths as the power player for kids in basketball, running, and casual shoes, as well as apparel• Similar to our adult business, we have developed leadership positions in
the kids’ market for premium, athletically-inspired shoes across categories. Foot Locker and Kids Foot Locker, in fact, occupy the #1 and #3 positions as destinations for children’s athletic footwear in the United States*
EXPANDOUR LEADING POSITION IN KIDS’
$281
$173
$85
$380
2009 2010 2011 2012 2013 2014 2015
$432
$522
$606NET INCOME
( i n m i l l i o n s )
2009 2010 2011 2012 2013 2014 2015
3.4%
5.0%
6.2% 6.6%
7.3%
1.8%
N E T I N C O M E M A R G I N
*NPD U.S. Consumer Panel as of July, 2015 (Wal-Mart #2)
8.2%
9

10

PURSUEEUROPEANEXPANSION Our Foot Locker business in Europe generated double-digit percentage comparable sales gains in almost every country and across all families of business. Our strategies to build on this momentum include:
• Continuing to expand the Foot Locker banner, especially in underpenetrated markets• We added 16 new Foot Locker stores and two
Kids Foot Locker stores in Europe, including a new flagship Foot Locker store in Madrid (shown below) that got off to a great start with a visit by NBA star Kevin Durant
• Expanding Runners Point and Sidestep banners into new countries• Runners Point entered Austria with three new stores,
including a key store in central Vienna (top right) which quickly drew exceptionally strong enthusiasm from the local running community
• We are continuing to focus on segmenting our banners in Germany and diversifying the product offerings in order to position ourselves for future geographical expansion
• Leveraging our strength as a power player across key product categories and families of business• Our merchant teams in Europe did an outstanding job
leading the market in offering exciting new footwear and apparel styles from adidas, Nike, and our other brand partners
• Our deep knowledge and understanding of local assort-ment preferences positions us well as a true pan-Euro-pean leader in the premium end of the sneaker market
• Building our capability for substantial digital growth• We streamlined and consolidated the leadership of our
Runners Point Group and Foot Locker digital businesses• We are embracing our digital opportunity by creating
powerful and engaging online marketing content and having an “always on” social media strategy
11

BUILD A MORE POWERFULDIGITAL BUSINESS
Our customers live in a world where they’re always connected digitally, and a very high percentage of our transactions, both those that end up being completed in a store and online, start on a mobile device. Due to strong profitability in our stores as well as online, we remain channel neutral and intend to let our customers decide how high digital will grow over time as a percentage of total sales. Meanwhile, the primary initiatives we identified last year to sustain our leadership position online include:
• Creating a more engaging, personalized digital experience that reflects each brand’s essence• We introduced mobile apps for Foot Locker and
Champs Sports with capabilities most in demand by our customers, including embedded product release calendars and locators
• We created shoemojis for the Foot Locker app, providing our customers a unique way to talk about and share their passion for their favorite sneaker styles
• Investing in technology platforms that deliver a high quality, coordinated shopping experience online, in store, and on mobile• We made significant investments in mobile technologies;
mobile represents a tremendous portion of our online traffic and a rapidly growing percentage of our digital sales
• We continued to enhance the customer experience by investing in systems to support BOSS (Buy Online, Ship from Store), another rapidly growing capability of our business
• Meeting customer needs by leveraging our entire Company’s capabilities• Drawing resources from around our Company, we consoli-
dated all of our European digital businesses onto a common technology platform, enhancing customer experience and facilitating future development
12

G R O S S M A R G I N
27.7%
30.0%
31.9%
32.8% 32.8%
33.2%33.8%
2009 2010 2011 2012 2013 2014 2015
13

BUILD APPAREL PENETRATION AND PROFITABILITYWe made solid progress improving our apparel busi-nesses in most of our banners, although apparel as a percent of total sales declined to 18.5 percent due largely to our very strong footwear sales in 2015. The strategies we are pursuing to lift our apparel performance include:
• Enhancing banner segmentation by clearly identifying the role of each brand and apparel category• Overall apparel profitability increased due to a
successful focus on special, athletically-inspired, and fashion-right assortments, carefully targeting the core customer at each banner
• Our goal is to drive the level of excitement in apparel to be on par with the premium footwear selections our customers already expect from us
• Strengthening our capabilities by investing in talent and tools• We continued to add experienced apparel
merchants and provide them with systems to more quickly identify opportunities to improve our apparel allocations
• Improving responsiveness and speed to market by partnering with existing vendors and expanding our vendor base• We utilized our Team Edition production capabilities
in collaboration with our vendors to get a jump on emerging t-shirt styles
• We built on our popular Sneaker Freak and Champs Sports Gear private label programs
• Improving our apparel presentations across the fleet and displaying full brand stories• By improving the visibility and accessibility of our
apparel and accessories, the continued rollout of store remodels and vendor shop-in-shops has significantly elevated the customer’s connection with our brands
• Actively managing product life cycles• Our apparel markdown rate decreased meaning-
fully as a result of initiatives to deliver fresh apparel styles more frequently and driving down the aver-age age of our inventory
• Improving the number of times our apparel inven-tory turns over in a year continues to be a major focus in 2016
E B I T M A R G I N
2.8%
5.4%
7.9%
9.9% 10.4%11.4%
12.8%
2009 2010 2011 2012 2013 2014 2015
14

We made good progress in our women’s business, especially in footwear. The Lady Foot Locker / SIX:02 division produced comparable store sales gains in each quarter, bringing our streak of delivering such gains to seven consecutive quarters.
The strategies to deliver exceptional growth in women’s going forward include:
• Developing SIX:02 into our primary women’s brand
• We opened 15 new SIX:02 stores, doubling the store count to 30
• We are separating the leadership of Lady Foot Locker and SIX:02, enabling the SIX:02 team to concentrate on developing that brand without the added responsibility of managing the transition of the Lady Foot Locker business
• Strengthening our SIX:02 customer connection by building brand awareness and providing superior store and online experiences
• In 2016, we intend to relaunch the SIX02.com site with stronger storytelling and connections to our store base
• We are also well underway in creating pinnacle SIX:02 experiences inside our new flagship Foot Locker stores in New York City on 34th Street and in Times Square
• Building our apparel business in concert with our major vendors
• We are resetting our apparel business to focus more on special, exclusive product with more of a fashion edge
• We are partnering with our vendors to tell stronger collection and limited edition stories
• Expanding women’s to play a more significant role in all of our relevant banners
• Sales of women’s footwear increased at a double digit percentage rate in most banners
DELIVEREXCEPTIONAL GROWTH IN WOMEN’S
15

The record-breaking success we have achieved over the last several years—and the potential to attain our 2020 financial and operational objectives—is due primarily to the strength of the outstanding team at Foot Locker, Inc. The initiatives we are focused on now to make our team even stronger include:
• Building on our reputation as being a great place to work, with a strong culture and highly-engaged work force
• Our overall favorability scores exceeded global and retail benchmarks in our associate engagement survey
• Associate turnover rates were significantly better than industry norms, both in headquarters organizations and among store teams
• Attracting talent with a powerful and inclusive employment brand
• We added key talent across our businesses, bolstering our merchant, technology development, and strategy functions, among others
• Accelerating our capability to drive operational perfor-mance and enable associates to reach their full potential
• During 2015, we developed a new global framework for our operating divisions, consolidating leadership of our North American store businesses under Jake Jacobs, and our international operations under Lew Kimble
• At the same time, we extended the General Manager role to each of our banners underneath those two leaders
• Creating a connected, diverse, and high-performing organization
• Our Human Resources team continues to develop exciting new education, coaching, and training programs that bring together leaders from different functions all around the world
BUILD ON OUR INDUSTRY-LEADING TEAM
16

REMAIN COMMITTED TO COMMUNITY AsaCompany,wenotonlystrivetomakeadifferencein the lives of our associates and our customers, we also aim to contribute to the communities in which we live and work. For example, the Foot Locker Foundation, Inc. hasdevelopedsignificantpartnershipsandprogramstoimprove and enrich the educational, health and sports opportunities for youth across the country. The Founda-tion’s “On Our Feet” fundraising gala has raised more than $16 million to support our youth over the past 15 years, and has awarded over 850 scholarships to out-standing students, both through its partners’ and its internal programs.
Since 2011, the Foot Locker Scholar Athlete’s pro-gram has invested $2 million in the education of some of America’s most promising scholar-athletes. The program awards $20,000 college scholarships to 20 exceptional students who demonstrate academic excellence and strong leadership skills, both in sports and within their communities.
As a new addition to the Foot Locker Scholar Athlete’s program in 2015, one of the twenty winners will also be selected for the Ken C. Hicks scholarship, in honor of our former Chairman and CEO, for demonstrating superior educational achievement, outstanding leadership, and a true love of the game.
Beyondourfinancialcommitment to education, wealsovolunteersignifi-cant time and resources to other premier charitable organizations, including the American Cancer Society, The Fred Jordan Missions, and the Two Ten Footwear Foundation. This past year we also generated great enthusiasm in the Fitness Challenge organized through the partnership between the Kids Foot Locker Foundation and the Boys & Girls Club of America. Kids Foot Locker was also the title sponsor of Alonzo Mourning’s Family Health and Wellness Winter Game event.
Along with our corporate initiatives, our people also take pride in supporting local and international key causes, such as Zoneparc in the Netherlands, building innovative playgrounds in neighborhoods in need, and the Make a Wish Foundation in Europe. Giving back to our communi-ties and enriching people’s lives is a long-held philosophy that extends to our associates all over the world, and we are proud to see it resonating today as part of Foot Locker, Inc.’s culture.
17

1818
FORM 10-K
This line represents final trim and will not print

This line represents final trim and will not print

UNITED STATESSECURITIES AND EXCHANGE COMMISSION
Washington, D.C. 20549
FORM 10-K(Mark One)� ANNUAL REPORT PURSUANT TO SECTION 13 OR 15(d) OF THE SECURITIES EXCHANGE ACT OF 1934
For the fiscal year ended January 30, 2016
OR
□ TRANSITION REPORT PURSUANT TO SECTION 13 OR 15(d) OF THE SECURITIES EXCHANGE ACT OF 1934For the transition period from to
Commission File No. 1-10299
(Exact name of registrant as specified in its charter)
New York 13-3513936(State or other jurisdiction ofincorporation or organization)
(I.R.S. Employer Identification No.)
112 West 34th Street, New York, New York 10120(Address of principal executive offices) (Zip Code)
Registrant’s telephone number, including area code: (212) 720-3700
Securities registered pursuant to Section 12(b) of the Act:
Title of each class Name of each exchange on which registeredCommon Stock, par value $0.01 New York Stock Exchange
Securities registered pursuant to Section 12(g) of the Act: None
Indicate by check mark if the registrant is a well-known seasoned issuer, as defined in Rule 405 of the Securities Act. Yes � No �
Indicate by check mark if the registrant is not required to file reports pursuant to Section 13 or Section 15(d) of theAct. Yes � No �
Indicate by check mark whether the Registrant (1) has filed all reports required to be filed by Section 13 or 15(d) of the SecuritiesExchange Act of 1934 during the preceding 12 months (or for such shorter period that the Registrant was required to file suchreports), and (2) has been subject to such filing requirements for the past 90 days. Yes � No �
Indicate by check mark whether the Registrant has submitted electronically and posted on its corporate Website, if any, everyInteractive Data File required to be submitted and posted pursuant to Rule 405 of Regulation S-T (§232.405 of this chapter) duringthe preceding 12 months (or for such shorter period that the registrant was required to submit and post such files). Yes � No �
Indicate by check mark if disclosure of delinquent filers pursuant to Item 405 of Regulation S-K is not contained herein, and will notbe contained, to the best of Registrant’s knowledge, in definitive proxy or information statements incorporated by reference inPart III of this Form 10-K or any amendment to this Form 10-K. □
Indicate by check mark whether the registrant is a large accelerated filer, an accelerated filer, a non-accelerated filer, or a smallerreporting company. See the definitions of ‘‘large accelerated filer,’’ ‘‘accelerated filer,’’ and ‘‘smaller reporting company’’ inRule 12b-2 of the Exchange Act.
Large accelerated filer � Accelerated filer □ Non-accelerated filer □ Smaller reporting company □
Indicate by check mark whether the registrant is a shell company (as defined in Rule 12b-2 of the Act). Yes � No �
The number of shares of the Registrant’s Common Stock, par value $0.01 per share, outstanding as ofMarch 21, 2016: 136,094,471
The aggregate market value of voting stock held by non-affiliates of the Registrant computed by referenceto the closing price as of the last business day of the Registrant’s most recently completed second fiscalquarter, August 1, 2015, was approximately: $7,523,772,438*
* For purposes of this calculation only (a) all directors plus three executive officers and owners of five percent ormore of the Registrantare deemed to be affiliates of the Registrant and (b) shares deemed to be ‘‘held’’ by such persons include only outstanding sharesof the Registrant’s voting stock with respect to which such persons had, on such date, voting or investment power.
DOCUMENTS INCORPORATED BY REFERENCEPortions of the Registrant’s definitive Proxy Statement (the ‘‘Proxy Statement’’) to be filed in connection with the Annual Meetingof Shareholders to be held on May 18, 2016: Parts III and IV.
This line represents final trim and will not print

This line represents final trim and will not print

TABLE OF CONTENTS
PART I
Item 1. Business 1
Item 1A. Risk Factors 2
Item 1B. Unresolved Staff Comments 9
Item 2. Properties 9
Item 3. Legal Proceedings 9
Item 4. Mine Safety Disclosures 9
PART II
Item 5. Market for the Company’s Common Equity, Related Stockholder Matters and Issuer Purchasesof Equity Securities 11
Item 6. Selected Financial Data 13
Item 7. Management’s Discussion and Analysis of Financial Condition and Results of Operations 14
Item 7A. Quantitative and Qualitative Disclosures About Market Risk 34
Item 8. Consolidated Financial Statements and Supplementary Data 34
Item 9. Changes in and Disagreements with Accountants on Accounting and Financial Disclosure 73
Item 9A. Controls and Procedures 73
Item 9B. Other Information 75
PART II I
Item 10. Directors, Executive Officers and Corporate Governance 75
Item 11. Executive Compensation 75
Item 12. Security Ownership of Certain Beneficial Owners and Management and Related StockholderMatters 75
Item 13. Certain Relationships and Related Transactions, and Director Independence 75
Item 14. Principal Accounting Fees and Services 75
PART IV
Item 15. Exhibits and Financial Statement Schedules 76
SIGNATURES 77
INDEX OF EXHIBITS 78
This line represents final trim and will not print

PART I
Item 1. Business
General
Foot Locker, Inc., incorporated under the laws of the State of New York in 1989, is a leading global retailer ofathletically inspired shoes and apparel, operating 3,383 primarily mall-based stores in the United States,Canada, Europe, Australia, and New Zealand as of January 30, 2016. Foot Locker, Inc. and its subsidiarieshereafter are referred to as the ‘‘Registrant,’’ ‘‘Company,’’ ‘‘we,’’ ‘‘our,’’ or ‘‘us.’’ Information regarding thebusiness is contained under the ‘‘Business Overview’’ section in ‘‘Item 7. Management’s Discussion and Analysisof Financial Condition and Results of Operations.’’
The Company maintains a website on the Internet at www.footlocker-inc.com. The Company’s filings with theU.S. Securities and Exchange Commission (the ‘‘SEC’’), including its annual reports on Form 10-K, quarterlyreports on Form 10-Q, current reports on Form 8-K, and all amendments to those reports are available free ofcharge through this website as soon as reasonably practicable after they are filed with or furnished to the SECby clicking on the ‘‘SEC Filings’’ link. The Corporate Governance section of the Company’s corporate websitecontains the Company’s Corporate Governance Guidelines, Committee Charters, and the Company’s Code ofBusiness Conduct for directors, officers and employees, including the Chief Executive Officer, Chief FinancialOfficer, and Chief Accounting Officer. Copies of these documents may also be obtained free of charge uponwritten request to the Company’s Corporate Secretary at 112 West 34th Street, New York, N.Y. 10120. EffectiveMay 1, 2016 the address to use will be 330 West 34th Street, New York, N.Y. 10001. The Company intends topromptly disclose amendments to the Code of Business Conduct and waivers of the Code for directors andexecutive officers on the Corporate Governance section of the Company’s corporate website.
Information Regarding Business Segments and Geographic Areas
The financial information concerning business segments, divisions, and geographic areas is contained underthe ‘‘Business Overview’’ and ‘‘Segment Information’’ sections in ‘‘Item 7. Management’s Discussion andAnalysis of Financial Condition and Results of Operations.’’ Information regarding sales, operating results, andidentifiable assets of the Company by business segment and by geographic area is contained under theSegment Information note in ‘‘Item 8. Consolidated Financial Statements and Supplementary Data.’’
The service marks, trade names, and trademarks appearing in this report (except for Nike, Inc.) are owned byFoot Locker, Inc. or its subsidiaries.
Employees
The Company and its consolidated subsidiaries had 14,944 full-time and 32,081 part-time employees atJanuary 30, 2016. The Company considers employee relations to be satisfactory.
Competition
Financial information concerning competition is contained under the ‘‘Business Risk’’ section in the FinancialInstruments and Risk Management note in ‘‘Item 8. Consolidated Financial Statements and SupplementaryData.’’
Merchandise Purchases
Financial information concerning merchandise purchases is contained under the ‘‘Liquidity’’ section in ‘‘Item 7.Management’s Discussion and Analysis of Financial Condition and Results of Operations’’ and under the‘‘Business Risk’’ section in the Financial Instruments and Risk Management note in ‘‘Item 8. ConsolidatedFinancial Statements and Supplementary Data.’’
1
This line represents final trim and will not print

Item 1A. Risk Factors
The statements contained in this Annual Report on Form 10-K (‘‘Annual Report’’) that are not historical facts,including, but not limited to, statements regarding our expected financial position, business and financingplans found in ‘‘Item 1. Business’’ and ‘‘Item 7. Management’s Discussion and Analysis of Financial Conditionand Results of Operations,’’ constitute ‘‘forward-looking statements’’ within the meaning of the PrivateSecurities Litigation Reform Act of 1995.
Please also see ‘‘Disclosure Regarding Forward-Looking Statements.’’ Our actual results may differ materiallydue to the risks and uncertainties discussed in this Annual Report, including those discussed below. Additionalrisks and uncertainties that we do not presently know about or that we currently consider to be insignificantmay also affect our business operations and financial performance.
Our inability to implement our strategic long range plan may adversely affect our future results.
Our ability to successfully implement and execute our long-range plan is dependent on many factors. Ourstrategies may require significant capital investment and management attention, which may result in thediversion of these resources from our core business and other business issues and opportunities. Additionally,any new initiative is subject to certain risks including customer acceptance of our products and renovated storedesigns, competition, product differentiation, and the ability to attract and retain qualified personnel. If wecannot successfully execute our strategic growth initiatives or if the long-range plan does not adequatelyaddress the challenges or opportunities we face, our financial condition and results of operations may beadversely affected. Additionally, failure to meet market expectations, particularly with respect to sales,operating margins, and earnings per share, would likely result in volatility in the market value of our stock.
The retail athletic footwear and apparel business is highly competitive.
Our athletic footwear and apparel operations compete primarily with athletic footwear specialty stores, sportinggoods stores, department stores, discount stores, traditional shoe stores, mass merchandisers, and Internetretailers, many of which are units of national or regional chains that have significant financial and marketingresources. The principal competitive factors in our markets are selection of merchandise, reputation, storelocation, quality, advertising, price, and customer service. Our success also depends on our ability todifferentiate ourselves from our competitors with respect to a quality merchandise assortment and superiorcustomer service. We cannot assure that we will continue to be able to compete successfully against existing orfuture competitors. Our expansion into markets served by our competitors, and entry of new competitors orexpansion of existing competitors into our markets, could have a material adverse effect on our business,financial condition, and results of operations.
Although we sell merchandise via the Internet, a significant shift in customer buying patterns to purchasingathletic footwear, athletic apparel, and sporting goods via the Internet could have a material adverse effect onour business results. In addition, all of our significant suppliers operate retail stores and distribute productsdirectly through the Internet and others may follow. Should this continue to occur, and if our customers decideto purchase directly from our suppliers, it could have a material adverse effect on our business, financialcondition, and results of operations.
The industry in which we operate is dependent upon fashion trends, customer preferences, productinnovations, and other fashion-related factors.
The athletic footwear and apparel industry is subject to changing fashion trends and customer preferences. Inaddition, retailers in the athletic industry rely on their suppliers to maintain innovation in the products theydevelop. We cannot guarantee that our merchandise selection will accurately reflect customer preferenceswhen it is offered for sale or that we will be able to identify and respond quickly to fashion changes, particularlygiven the long lead times for ordering much of our merchandise from suppliers. A substantial portion of ourhighest margin sales are to young males (ages 12 − 25), many of whom we believe purchase athletic footwearand athletic apparel as a fashion statement and are frequent purchasers. Our failure to anticipate, identify orreact appropriately in a timely manner to changes in fashion trends that would make athletic footwear or athleticapparel less attractive to these customers could have a material adverse effect on our business, financialcondition, and results of operations.
2
This line represents final trim and will not print

If we do not successfully manage our inventory levels, our operating results will be adversely affected.
We must maintain sufficient inventory levels to operate our business successfully. However, we also must guardagainst accumulating excess inventory. For example, we order most of our athletic footwear four to six monthsprior to delivery to our stores. If we fail to anticipate accurately either the market for the merchandise in ourstores or our customers’ purchasing habits, we may be forced to rely on markdowns or promotional sales todispose of excess or slow moving inventory, which could have a material adverse effect on our business,financial condition, and results of operations.
A change in the relationship with any of our key suppliers or the unavailability of our key products atcompetitive prices could affect our financial health.
Our business is dependent to a significant degree upon our ability to obtain exclusive product and the abilityto purchase brand-name merchandise at competitive prices from a limited number of suppliers. In addition, oursuppliers provide volume discounts, cooperative advertising, and markdown allowances, as well as the abilityto negotiate returns of excess or unneeded merchandise. We cannot be certain that such terms with oursuppliers will continue in the future.
The Company purchased approximately 90 percent of its merchandise in 2015 from its top five suppliers andexpects to continue to obtain a significant percentage of its athletic product from these suppliers in futureperiods. Approximately 72 percent of all merchandise purchased in 2015 was purchased from onesupplier — Nike, Inc. (‘‘Nike’’). Each of our operating divisions is highly dependent on Nike; they individuallypurchased 55 to 82 percent of their merchandise from Nike. Merchandise that is high profile and in highdemand is allocated by our suppliers based upon their internal criteria. Although we have generally been ableto purchase sufficient quantities of this merchandise in the past, we cannot be certain that our suppliers willcontinue to allocate sufficient amounts of such merchandise to us in the future. Our inability to obtainmerchandise in a timely manner from major suppliers (particularly Nike) as a result of business decisions by oursuppliers or any disruption in the supply chain could have a material adverse effect on our business, financialcondition, and results of operations. Because of our strong dependence on Nike, any adverse development inNike’s reputation, financial condition or results of operations or the inability of Nike to develop andmanufactureproducts that appeal to our target customers could also have an adverse effect on our business, financialcondition, and results of operations. We cannot be certain that we will be able to acquire merchandise atcompetitive prices or on competitive terms in the future. These risks could have a material adverse effect on ourbusiness, financial condition, and results of operations.
We depend on mall traffic and our ability to secure suitable store locations.
Our stores are located primarily in enclosed regional and neighborhood malls. Our sales are dependent, inpart, on the volume of mall traffic. Mall traffic may be adversely affected by, among other factors, economicdownturns, the closing of anchor department stores and/or specialty stores, and a decline in the popularity ofmall shopping among our target customers. Further, any terrorist act, natural disaster, public health or safetyconcern that decreases the level of mall traffic, or that affects our ability to open and operate stores in affectedareas, could have a material adverse effect on our business.
To take advantage of customer traffic and the shopping preferences of our customers, we need to maintain oracquire stores in desirable locations such as in regional and neighborhoodmalls anchored bymajor departmentstores. We cannot be certain that desirable mall locations will continue to be available at favorable rates. Sometraditional enclosed malls are experiencing significantly lower levels of customer traffic, driven by economicconditions as well as the closure of certain mall anchor tenants.
Several large landlords dominate the ownership of prime malls, particularly in the United States, Canada, andAustralia, and because of our dependence upon these landlords for a substantial number of our locations, anysignificant erosion of their financial condition or our relationships with these landlords would negatively affectour ability to obtain and retain store locations. Additionally, further landlord consolidation may negatively affectour ability to negotiate favorable lease terms.
3
This line represents final trim and will not print

We may experience fluctuations in and cyclicality of our comparable-store sales results.
Our comparable-store sales have fluctuated significantly in the past, on both an annual and a quarterly basis,and we expect them to continue to fluctuate in the future. A variety of factors affect our comparable-store salesresults, including, among others, fashion trends, product innovation, the highly competitive retail salesenvironment, economic conditions, timing of promotional events, changes in our merchandise mix, calendarshifts of holiday periods, supply chain disruptions, and weather conditions. Many of our products representdiscretionary purchases. Accordingly, customer demand for these products could decline in a recession or if ourcustomers develop other priorities for their discretionary spending. These risks could have a material adverseeffect on our business, financial condition, and results of operations.
Economic or political conditions in other countries, including fluctuations in foreign currency exchange ratesand tax rates may adversely affect our operations.
A significant portion of our sales and operating income for 2015 was attributable to our operations in Europe,Canada, Australia, and New Zealand. As a result, our business is subject to the risks associated with doingbusiness outside of the United States such as local customer product preferences, political unrest, disruptionsor delays in shipments, changes in economic conditions in countries in which we operate, foreign currencyfluctuations, real estate costs, and labor and employment practices in non-U.S. jurisdictions that may differsignificantly from those that prevail in the United States. In addition, because we and our suppliers have asubstantial amount of our products manufactured in foreign countries, our ability to obtain sufficient quantitiesof merchandise on favorable terms may be affected by governmental regulations, trade restrictions, andeconomic, labor, and other conditions in the countries from which our suppliers obtain their product.
Fluctuations in the value of the euro may affect the value of our European earnings when translated intoU.S. dollars. Similarly our earnings in Canada, Australia, and New Zealand may be affected by the value ofcurrencies when translated into U.S. dollars. Our operating results may be adversely affected by significantchanges in these foreign currencies relative to the U.S. dollar. For the most part, our international subsidiariestransact in their functional currency, other than in the U.K., whose inventory purchases are denominated in euro,which could result in foreign currency transaction gains or losses.
Our products are subject to import and excise duties and/or sales or value-added taxes in many jurisdictions.Fluctuations in tax rates and duties and changes in tax legislation or regulation could have a material adverseeffect on our results of operations and financial condition.
Macroeconomic developments may adversely affect our business.
Our performance is subject to global economic conditions and the related impact on consumer spendinglevels. Continued uncertainty about global economic conditions poses a risk as consumers and businessespostpone spending in response to tighter credit, unemployment, negative financial news, and/or declines inincome or asset values, which could have a material negative effect on demand for our products.
As a retailer that is dependent upon consumer discretionary spending, our results of operations are sensitive tochanges in macroeconomic conditions. Our customers may have less money for discretionary purchases as aresult of job losses, foreclosures, bankruptcies, increased fuel and energy costs, higher interest rates, highertaxes, reduced access to credit, and lower home values. There is also a risk that if negative economic conditionspersist for a long period of time or worsen, consumers may make long-lasting reductions to their discretionarypurchasing behavior. These and other economic factors could adversely affect demand for our products, whichcould adversely affect our financial condition and operating results.
Instability in the financial markets may adversely affect our business.
Any instability in the global financial markets could result in diminished credit availability. Although we currentlyhave a revolving credit agreement in place until January 27, 2017, and other than amounts used for standbyletters of credit, we do not have any borrowings under it, tightening of credit markets could make it moredifficult for us to access funds, refinance our existing indebtedness, enter into agreements for newindebtedness or obtain funding through the issuance of the Company’s securities.
4
This line represents final trim and will not print

We rely on a few key suppliers for a majority of our merchandise purchases (including a significant portion fromone key supplier). The inability of key suppliers to access liquidity, or the insolvency of key suppliers, could leadto their failure to deliver merchandise to us. Our inability to obtain merchandise in a timely manner from majorsuppliers could have a material adverse effect on our business, financial condition, and results of operations.
Material changes in the market value of the securities we hold may adversely affect our results of operationsand financial condition.
At January 30, 2016, our cash and cash equivalents totaled $1,021 million. The majority of our investments wereshort-term deposits in highly-rated banking institutions. As of January 30, 2016, $608 million of our cash andcash equivalents were held in foreign jurisdictions. We regularly monitor our counterparty credit risk andmitigate our exposure by making short-term investments only in highly-rated institutions and by limiting theamount we invest in any one institution. We continually monitor the creditworthiness of our counterparties. AtJanuary 30, 2016, almost all of the investments were in institutions rated A or better from a major credit ratingagency. Despite those ratings, it is possible that the value or liquidity of our investments may decline due to anynumber of factors, including general market conditions and bank-specific credit issues.
Our U.S. pension plan trust holds assets totaling $544 million at January 30, 2016. The fair values of these assetsheld in the trust are compared to the plan’s projected benefit obligation to determine the pension fundingliability. We attempt to mitigate funding risk through asset diversification, and we regularly monitor investmentrisk of our portfolio through quarterly investment portfolio reviews and periodic asset and liability studies.Despite these measures, it is possible that the value of our portfolio may decline in the future due to anynumber of factors, including general market conditions and credit issues. Such declines could have an impacton the funded status of our pension plan and future funding requirements.
If our long-lived assets, goodwill or other intangible assets become impaired, we may need to recordsignificant non-cash impairment charges.
We review our long-lived assets, goodwill and other intangible assets when events indicate that the carryingvalue of such assets may be impaired. Goodwill and other indefinite lived intangible assets are reviewed forimpairment if impairment indicators arise and, at a minimum, annually. As of January 30, 2016, we had$156 million of goodwill; this asset is not amortized but is subject to an impairment test, which consists of eithera qualitative assessment on a reporting unit level, or a two-step impairment test, if necessary. The determinationof impairment charges is significantly affected by estimates of future operating cash flows and estimates of fairvalue. Our estimates of future operating cash flows are identified from our strategic long-range plans, which arebased upon our experience, knowledge, and expectations; however, these estimates can be affected by factorssuch as our future operating results, future store profitability, and future economic conditions, all of which canbe difficult to predict accurately. Any significant deterioration in macroeconomic conditions could affect the fairvalue of our long-lived assets, goodwill, and other intangible assets and could result in future impairmentcharges, which would adversely affect our results of operations.
Our financial results may be adversely affected by tax rates or exposure to additional tax liabilities.
We are a U.S.-based multinational company subject to tax in multiple U.S. and foreign tax jurisdictions. Ourprovision for income taxes is based on a jurisdictional mix of earnings, statutory rates, and enacted tax rules,including transfer pricing. Significant judgment is required in determining our provision for income taxes and inevaluating our tax positions on a worldwide basis. Our effective tax rate could be adversely affected by anumber of factors, including shifts in the mix of pretax results by tax jurisdiction, changes in tax laws or relatedinterpretations in the jurisdictions in which we operate, and tax assessments and related interest and penaltiesresulting from income tax audits.
A substantial portion of our cash and investments is invested outside of the United States. As we plan topermanently reinvest our foreign earnings outside the United States, in accordance with U.S. GAAP, we havenot provided for U.S. federal and state income taxes or foreign withholding taxes that may result from futureremittances of undistributed earnings of foreign subsidiaries. Recent proposals to reform U.S. tax rules mayresult in a reduction or elimination of the deferral of U.S. income tax on our foreign earnings, which couldadversely affect our effective tax rate. Any of these changes could have an adverse effect on our results ofoperations and financial condition.
5
This line represents final trim and will not print

The effects of natural disasters, terrorism, acts of war, and public health issues may adversely affect ourbusiness.
Natural disasters, including earthquakes, hurricanes, floods, and tornados may affect store and distributioncenter operations. In addition, acts of terrorism, acts of war, and military action both in the United States andabroad can have a significant effect on economic conditions and may negatively affect our ability to purchasemerchandise from suppliers for sale to our customers. Public health issues, such as flu or other pandemics,whether occurring in the United States or abroad, could disrupt our operations and result in a significant partof our workforce being unable to operate or maintain our infrastructure or perform other tasks necessary toconduct our business. Additionally, public health issues may disrupt, or have an adverse effect on, our suppliers’operations, our operations, our customers, or customer demand. Our ability to mitigate the adverse impact ofthese events depends, in part, upon the effectiveness of our disaster preparedness and response planning aswell as business continuity planning. However, we cannot be certain that our plans will be adequate orimplemented properly in the event of an actual disaster. We may be required to suspend operations in some orall of our locations, which could have a material adverse effect on our business, financial condition, and resultsof operations. Any significant declines in public safety or uncertainties regarding future economic prospectsthat affect customer spending habits could have a material adverse effect on customer purchases of ourproducts.
Manufacturer compliance with our social compliance program requirements.
We require our independent manufacturers to comply with our policies and procedures, which cover manyareas including labor, health and safety, and environmental standards. We monitor compliance with our policiesand procedures using internal resources, as well as third-party monitoring firms. Although we monitor theircompliance with these policies and procedures, we do not control the manufacturers or their practices. Anyfailure of our independent manufacturers to comply with our policies and procedures or local laws in the countryof manufacture could disrupt the shipment of merchandise to us, force us to locate alternate manufacturingsources, reduce demand for our merchandise, or damage our reputation.
Complications in our distribution centers and other factors affecting the distribution of merchandise mayaffect our business.
We operate multiple distribution centers worldwide to support our businesses. In addition to the distributioncenters that we operate, we have third-party arrangements to support our operations in the United States,Canada, Australia, and New Zealand. If complications arise with any facility or if any facility is severely damagedor destroyed, our other distribution centers may be unable to support the resulting additional distributiondemands. We may be affected by disruptions in the global transportation network such as a port strike, weatherconditions, work stoppages or other labor unrest. These factors may adversely affect our ability to deliverinventory on a timely basis. We depend upon third-party carriers for shipment of a significant amount ofmerchandise. An interruption in service by these carriers for any reason could cause temporary disruptions inour business, a loss of sales and profits, and other material adverse effects.
Our freight cost is affected by changes in fuel prices through surcharges. Increases in fuel prices and surcharges,among other factors, may increase freight costs and thereby increase our cost of sales. We enter into diesel fuelforward and option contracts to mitigate a portion of the risk associated with the variability caused by thesesurcharges.
We are subject to technology risks including failures, security breaches, and cybersecurity risks which couldharm our business, damage our reputation, and increase our costs in an effort to protect against such risks.
Information technology is a critically important part of our business operations. We depend on informationsystems to process transactions, make operational decisions, manage inventory, operate our websites,purchase, sell and ship goods on a timely basis, and maintain cost-efficient operations. There is a risk that wecould experience a business interruption, theft of information, or reputational damage as a result of acyber-attack, such as an infiltration of a data center or data leakage of confidential information, either internallyor at our third-party providers. We may experience operational problems with our information systems as aresult of system failures, system implementation issues, viruses, malicious hackers, sabotage, or other causes.
6
This line represents final trim and will not print

Our business involves the storage and transmission of customers’ personal information, including consumerpreferences and credit card information. In an effort to enhance the security of our customers’ credit cardinformation, during 2015 we implemented an encryption and tokenization platform for certain credit cardtransactions, whereby no credit card data is stored in our internal systems, with plans to expand this platformto the entire Company. We invest in security technology to protect the data stored by the Company, includingour data and business processes, against the risk of data security breaches and cyber-attacks. Our data securitymanagement program includes enforcement of standard data protection policies such as Payment CardIndustry compliance. Additionally, we certify our major technology suppliers and any outsourced servicesthrough accepted security certification measures. We maintain and routinely test backup systems and disasterrecovery, along with external network security penetration testing by an independent third party as part of ourbusiness continuity preparedness. We also maintain an IT Security Incident Response Plan and routinelyperform a table-top exercise with key IT and business stakeholders.
While we believe that our security technology and processes follow leading practices in the prevention ofsecurity breaches and the mitigation of cybersecurity risks, given the ever-increasing abilities of those intent onbreaching cybersecurity measures and given the necessity of our reliance on the security procedures ofthird-party vendors, the total security effort at any point in time may not be completely effective. Any suchsecurity breaches and cyber incidents could adversely affect our business. Failure of our systems, includingfailures due to cyber-attacks that would prevent the ability of systems to function as intended, could causetransaction errors, loss of customers and sales, and negative consequences to us, our employees, and thosewith whom we do business. Any security breach involving the misappropriation, loss, or other unauthorizeddisclosure of confidential information by us could also severely damage our reputation, expose us to the risksof litigation and liability, increase operating costs associated with remediation, and harm our business. Whilewe carry insurance that would mitigate the losses, such insurance may be insufficient to compensate us forpotentially significant losses.
Risks associated with digital operations.
Our digital operations are subject to numerous risks, including risks related to the failure of the computersystems that operate our websites and mobile sites and their related support systems, computer viruses,telecommunications failures, denial of service attacks, and similar disruptions. Also, we may require additionalcapital in the future to sustain or grow our digital commerce. Business risks related to digital commerce includerisks associated with the need to keep pace with rapid technological change, Internet cybersecurity risks, risksof system failure or inadequacy, governmental regulation, legal uncertainties with respect to Internet regulatorycompliance, and collection of sales or other taxes by additional states or foreign jurisdictions. If any of theserisks materializes, it could have a material adverse effect on our business.
The technology enablement of omni-channel in our business is complex and involves the development of anew digital platform and a new order management system in order to enhance the complete customerexperience.
We continue to invest in initiatives geared towards delivering a high-quality, coordinated shopping experienceonline, in-stores, and on mobile, which requires substantial investment in technology, information systems,employees, and management time and resources. Our omni-channel retailing efforts include the integrationand implementation of new technology, software and processes to be able to fulfill orders from any point withinour system of stores and distribution centers, which is extremely complex and may not meet customerexpectations for timely and accurate deliveries. These efforts involve substantial risk, including risk ofimplementation delays, cost overruns, technology interruptions, supply and distribution delays, and otherissues that can affect the successful implementation and operation of our omni-channel initiatives. If ouromni-channel initiatives are not successful, or we do not realize the return on our omni-channel investmentsthat we anticipate, our financial performance and future growth could be materially adversely affected.
Our reliance on key management.
Future performance will depend upon our ability to attract, retain, and motivate our executive and seniormanagement team. Our executive and senior management teams have substantial experience and expertise inour business and have made significant contributions to our recent growth and success. Our future performance
7
This line represents final trim and will not print

depends to a significant extent both upon the continued services of our current executive and seniormanagement team, as well as our ability to attract, hire, motivate, and retain additional qualified managementin the future.
While we feel that we have adequate succession planning and executive development programs, competitionfor key executives in the retail industry is intense, and our operations could be adversely affected if we cannotretain and attract qualified executives.
Risks associated with attracting and retaining store and field associates.
Many of the store and field associates are in entry level or part-time positions which, historically, have had highrates of turnover. If we are unable to attract and retain quality associates, our ability to meet our growth goalsor to sustain expected levels of profitability may be compromised. Our ability to meet our labor needs whilecontrolling costs is subject to external factors such as unemployment levels, prevailing wage rates, minimumwage legislation, overtime regulations, and changing demographics.
Changes in employment laws or regulation could harm our performance.
Various foreign and domestic labor laws govern our relationship with our employees and affect our operatingcosts. These laws include minimum wage requirements, overtime pay, paid time off, work scheduling,healthcare reform and the implementation of the Patient Protection and Affordable Care Act, unemploymenttax rates, workers’ compensation rates, works council requirements, and union membership. A number offactors could adversely affect our operating results, including additional government-imposed increases inminimum wages, overtime pay, paid leaves of absence and mandated health benefits, and changingregulations from the National Labor Relations Board or other agencies.
Legislative or regulatory initiatives related to global warming/climate change concerns may negativelyaffect our business.
There has been an increasing focus and significant debate on global climate change, including increasedattention from regulatory agencies and legislative bodies. This increased focus may lead to new initiativesdirected at regulating an as-yet unspecified array of environmental matters. Legislative, regulatory, or otherefforts in the United States to combat climate change could result in future increases in taxes or in the cost oftransportation and utilities, which could decrease our operating profits and could necessitate future additionalinvestments in facilities and equipment. We are unable to predict the potential effects that any such futureenvironmental initiatives may have on our business.
We may be adversely affected by regulatory and litigation developments.
We are exposed to the risk that federal or state legislation may negatively impact our operations. Changes infederal or state wage requirements, employee rights, health care, social welfare or entitlement programs, suchas health insurance, paid leave programs, or other changes in workplace regulation could increase our cost ofdoing business or otherwise adversely affect our operations. Additionally, we are regularly involved in variouslitigation matters, including class actions and patent infringement claims, which arise in the ordinary course ofour business. Litigation or regulatory developments could adversely affect our business operations and financialperformance.
We operate in many different jurisdictions and we could be adversely affected by violations of theU.S. Foreign Corrupt Practices Act and similar worldwide anti-corruption laws.
The U.S. Foreign Corrupt Practices Act (‘‘FCPA’’) and similar worldwide anti-corruption laws, including theU.K. Bribery Act of 2010, which is broader in scope than the FCPA, generally prohibit companies and theirintermediaries from making improper payments to non-U.S. officials for the purpose of obtaining or retainingbusiness. Our internal policies mandate compliance with these anti-corruption laws. Despite our training andcompliance programs, we cannot be assured that our internal control policies and procedures will alwaysprotect us from reckless or criminal acts committed by our employees or agents.
8
This line represents final trim and will not print

Our continued expansion outside the United States, including in developing countries, could increase the riskof FCPA violations in the future. Violations of these laws, or allegations of such violations, could disrupt ourbusiness and result in a material adverse effect on our results of operations or financial condition.
Failure to fully comply with Section 404 of the Sarbanes-Oxley Act of 2002 could negatively affect ourbusiness, market confidence in our reported financial information, and the price of our common stock.
We continue to document, test, and monitor our internal controls over financial reporting in order to satisfy allof the requirements of Section 404 of the Sarbanes-Oxley Act of 2002; however, we cannot be assured that ourdisclosure controls and procedures and our internal controls over financial reporting will prove to be completelyadequate in the future. Failure to fully comply with Section 404 of the Sarbanes-Oxley Act of 2002 couldnegatively affect our business, market confidence in our reported financial information, and the price of ourcommon stock.
Item 1B. Unresolved Staff Comments
None.
Item 2. Properties
The properties of the Company and its consolidated subsidiaries consist of land, leased stores, administrativefacilities, and distribution centers. Gross square footage and total selling area for the Athletic Stores segmentat the end of 2015 were approximately 12.92 and 7.58 million square feet, respectively. These properties, whichare primarily leased, are located in the United States and its territories, Canada, various European countries,Australia, and New Zealand.
The Company currently operates five distribution centers, of which two are owned and three are leased,occupying an aggregate of 2.9 million square feet. Three distribution centers are located in the United States,one in Germany, and one in the Netherlands. The location in Germany relates to the central warehousedistribution centers for the Runners Point Group store locations, as well as a distribution center for itsdirect-to-customer business. During 2014, we opened a new distribution center in Germany which provides uswith increased capacity that will enable us to support the planned growth of both the store anddirect-to-customer businesses. This larger distribution center also allowed us to consolidate the previous twolocations in Germany during 2015.
We also own a cross-dock and manufacturing facility and operate a leased warehouse in the United States,both of which support our Team Edition apparel business.
Item 3. Legal Proceedings
Information regarding the Company’s legal proceedings is contained in the Legal Proceedings note under‘‘Item 8. Consolidated Financial Statements and Supplementary Data.’’
Item 4. Mine Safety Disclosures
Not applicable.
Executive Officers of the Registrant
Information with respect to Executive Officers of the Company, as of March 24, 2016, is set forth below:
President and Chief Executive Officer Richard A. JohnsonExecutive Vice President and Chief Executive Officer North America Stephen D. JacobsExecutive Vice President and Chief Executive Officer International Lewis P. KimbleExecutive Vice President — Operations Support Robert W. McHughExecutive Vice President and Chief Financial Officer Lauren B. PetersSenior Vice President and Chief Human Resources Officer Paulette R. AlvitiSenior Vice President — Real Estate Jeffrey L. BerkSenior Vice President and Chief Accounting Officer Giovanna CiprianoSenior Vice President, General Counsel and Secretary Sheilagh M. ClarkeSenior Vice President and Chief Information Officer Pawan VermaVice President, Treasurer and Investor Relations John A. Maurer
9
This line represents final trim and will not print

Richard A. Johnson, age 58, has served as President and Chief Executive Officer since December 1, 2014.Mr. Johnson previously served as Executive Vice President and Chief Operating Officer from May 16, 2012through November 30, 2014. He served as Executive Vice President and Group President from July 2011 toMay 15, 2012; President and Chief Executive Officer of Foot Locker U.S., Lady Foot Locker, Kids Foot Locker,and Footaction from January 2010 to July 2011; President and Chief Executive Officer of Foot Locker Europefrom August 2007 to January 2010; and President and Chief Executive Officer of Footlocker.com/Eastbay fromApril 2003 to August 2007.
Stephen D. Jacobs, age 53, has served as Executive Vice President and Chief Executive Officer North Americasince February 29, 2016. Mr. Jacobs has been with the Company for 18 years in positions of increasingresponsibility. Mr. Jacobs previously served as Executive Vice President and Chief Executive Officer Foot LockerNorth America from December 1, 2014 through February 28, 2016. He served as President and Chief ExecutiveOfficer of Foot Locker U.S., Lady Foot Locker, Kids Foot Locker, and Footaction from July 2011 toNovember 2014 and President and Chief Executive Officer of Champs Sports from January 2009 to June 2011.
Lewis P. Kimble, age 57, has served as Executive Vice President and Chief Executive Officer International sinceFebruary 29, 2016. Mr. Kimble previously served as President and Chief Executive Officer of Foot Locker Europefrom February 1, 2010 to February 28, 2016. Prior to that role Mr. Kimble led our business in Australia and NewZealand as Managing Director of Foot Locker Asia Pacific. Over his almost 40 years with the Company,Mr. Kimble has also held Vice President positions across multiple functions within the United States and Europe.
Robert W. McHugh, age 57, has served as Executive Vice President — Operations Support since July 2011. Heserved as Executive Vice President and Chief Financial Officer from May 2009 to July 2011.
Lauren B. Peters, age 54, has served as Executive Vice President and Chief Financial Officer since July 2011. Sheserved as Senior Vice President — Strategic Planning from April 2002 to July 2011.
Paulette R. Alviti, age 45, has served as Senior Vice President and Chief Human Resources Officer sinceJune 2013. From March 2010 to May 2013, Ms. Alviti served in various roles at PepsiCo, Inc.: SVP and ChiefHuman Resources Officer Asia, Middle East, Africa (February to May 2013); SVP Global Talent Acquisition andDeployment (July 2012 to February 2013); and SVP — Human Resources (March 2010 to July 2012). FromMarch 2008 to March 2010, she served as VP — Human Resources of The Pepsi Bottling Group, Inc.
Jeffrey L. Berk, age 60, has served as Senior Vice President — Real Estate since February 2000.
Giovanna Cipriano, age 46, has served as Senior Vice President and Chief Accounting Officer since May 2009.
Sheilagh M. Clarke, age 56, has served as Senior Vice President, General Counsel and Secretary since June 1,2014. She previously served as Vice President, Associate General Counsel and Assistant Secretary fromMay 2007 to May 2014.
Pawan Verma, age 39, has served as Senior Vice President and Chief Information Officer since August 10, 2015.From February 2013 to July 2015, Mr. Verma served in various technology leadership roles at Target Corporationranging from enterprise architecture, eCommerce, Mobile and digital, with his most recent role as VicePresident-Digital Technology and API Platforms. From March 2011 to January 2013, he served as Sr. Director,eCommerce, Digital and Mobile of Convergys Corporation. He also served in various technology leadershiproles at Verizon Wireless between October 2003 and February 2011.
John A. Maurer, age 56, has served as Vice President, Treasurer and Investor Relations since February 2011.Mr. Maurer served as Vice President and Treasurer from September 2006 to February 2011.
There are no family relationships among the executive officers or directors of the Company.
10
This line represents final trim and will not print

PART II
Item 5. Market for the Company’s Common Equity, Related Stockholder Matters and Issuer Purchasesof Equity Securities
Foot Locker, Inc. common stock (ticker symbol ‘‘FL’’) is listed on The New York Stock Exchange as well as on theBörse Stuttgart stock exchange in Germany. As of January 30, 2016, the Company had 14,237 shareholders ofrecord owning 136,976,809 common shares.
The following table provides the intra-day high and low sales prices for the Company’s common stock for theperiods indicated below:
2015 2014High Low High Low
1st Quarter $63.66 $52.12 $48.71 $36.652nd Quarter 71.07 60.14 52.07 46.203rd Quarter 77.25 63.02 58.40 47.904th Quarter 69.99 57.23 59.19 51.12
During each of the quarters of 2015, the Company declared a dividend of $0.25 per share. The Board ofDirectors reviews the dividend policy and rate, taking into consideration the overall financial and strategicoutlook for our earnings, liquidity, and cash flow. On February 17, 2016, the Board of Directors declared aquarterly dividend of $0.275 per share to be paid on April 29, 2016. This dividend represents a 10 percentincrease over the Company’s previous quarterly per share amount.
The following table is a summary of our fourth quarter share repurchases:
Date Purchased
TotalNumberof Shares
Purchased(1)
AveragePrice PaidPer Share(1)
Total Numberof Shares
Purchased asPart of PubliclyAnnouncedProgram(2)
ApproximateDollar Value ofShares that mayyet be Purchased
Under theProgram(2)
Nov. 1, 2015 − Nov. 28, 2015 1,305,157 $62.63 1,300,000 $658,881,376Nov. 29, 2015 − Jan. 2, 2016 219,484 64.76 219,484 644,668,097Jan. 3, 2016 − Jan. 30, 2016 124,418 63.20 123,616 636,854,327
1,649,059 62.96 1,643,100
(1) These columns also reflect shares acquired in satisfaction of the tax withholding obligation of holders of restricted stock awards whichvested during the quarter, stock swaps, and shares repurchased pursuant to Rule 10b5-1 under the Securities Exchange Act of 1934.The calculation of the average price paid per share includes all fees, commissions, and other costs associated with the repurchase ofsuch shares.
(2) On February 17, 2015, the Board of Directors approved a 3-year, $1 billion share repurchase program extending through January 2018.Through January 30, 2016, 5.6 million shares of common stock were purchased under this program, for an aggregate cost of$363 million.
11
This line represents final trim and will not print

Performance Graph
The graph below compares the cumulative five-year total return to shareholders (common stock priceappreciation plus dividends, on a reinvested basis) on Foot Locker, Inc.’s common stock relative to the totalreturns of the S&P 400 Retailing Index and the Russell Midcap Index.
The following Performance Graph and related information shall not be deemed ‘‘soliciting material’’ or to befiled with the SEC, nor shall such information be incorporated by reference into any future filing under theSecurities Act of 1933 or Securities Exchange Act of 1934, each as amended, except to the extent that wespecifically incorporate it by reference into such filing.
Indexed Share Price Performance
$0
$100
$200
$300
$400
$500
Russell Midcap IndexS&P 400 Retailing IndexFoot Locker, Inc.
1/30/20161/31/20152/1/20142/2/20131/28/20121/29/2011
1/29/2011 1/28/2012 2/2/2013 2/1/2014 1/31/2015 1/30/2016
Foot Locker, Inc. $100.00 $153.23 $204.76 $233.92 $328.29 $423.20S&P 400 Retailing Index $100.00 $121.84 $150.82 $170.21 $206.94 $181.10Russell Midcap Index $100.00 $103.82 $123.03 $150.86 $171.46 $158.80
12
This line represents final trim and will not print

Item 6. Selected Financial Data
FIVE-YEAR SUMMARY OF SELECTED FINANCIAL DATA
The selected financial data below should be read in conjunction with the Consolidated Financial Statementsand the Notes thereto and other information contained elsewhere in this report.
2015 2014 2013 2012(1) 2011
(in millions, except per share amounts)
Summary of OperationsSales $7,412 7,151 6,505 6,182 5,623Gross margin 2,505 2,374 2,133 2,034 1,796Selling, general and administrative expenses 1,415 1,426 1,334 1,294 1,244Litigation, impairment and other charges 105 4 2 12 5Depreciation and amortization 148 139 133 118 110Interest expense, net 4 5 5 5 6Other income (4) (9) (4) (2) (4)Net income 541 520 429 397 278Per Common Share Data
Basic earnings 3.89 3.61 2.89 2.62 1.81Diluted earnings 3.84 3.56 2.85 2.58 1.80Common stock dividends declared per share 1.00 0.88 0.80 0.72 0.66
Weighted-average Common Shares OutstandingBasic earnings 139.1 143.9 148.4 151.2 153.0Diluted earnings 140.8 146.0 150.5 154.0 154.4
Financial ConditionCash, cash equivalents, and short-term investments $1,021 967 867 928 851Merchandise inventories 1,285 1,250 1,220 1,167 1,069Property and equipment, net 661 620 590 490 427Total assets 3,775 3,577 3,487 3,367 3,050Long-term debt and obligations under capital leases 130 134 139 133 135Total shareholders’ equity 2,553 2,496 2,496 2,377 2,110Financial RatiosSales per average gross square foot(2) $ 504 490 460 443 406SG&A as a percentage of sales 19.1% 19.9 20.5 20.9 22.1Earnings before interest and taxes (EBIT) $ 841 814 668 612 441EBIT margin 11.3% 11.4 10.3 9.9 7.8EBIT margin (non-GAAP)(3) 12.8% 11.4 10.4 9.9 7.9Net income margin 7.3% 7.3 6.6 6.4 4.9Net income margin (non-GAAP)(3) 8.2% 7.3 6.6 6.2 5.0Return on assets (ROA) 14.7% 14.7 12.5 12.4 9.4Return on invested capital (ROIC)(3) 15.8% 15.0 14.1 14.2 11.8Net debt capitalization percent(3),(4) 47.4% 43.4 42.5 37.2 36.0Current ratio 3.7 3.5 3.8 3.7 3.8Other DataCapital expenditures $ 228 190 206 163 152Number of stores at year end 3,383 3,423 3,473 3,335 3,369Total selling square footage at year end (in millions) 7.58 7.48 7.47 7.26 7.38Total gross square footage at year end (in millions) 12.92 12.73 12.71 12.32 12.45
(1) 2012 represents the 53 weeks ended February 2, 2013.
(2) Calculated as Athletic Store sales divided by the average monthly ending gross square footage of the last thirteen months. Thecomputation for each of the years presented reflects the foreign exchange rate in effect for such year. The 2012 amount has beencalculated excluding the sales of the 53rd week.
(3) See Item 7, ‘‘Management’s Discussion and Analysis of Financial Condition and Results of Operations’’ for additional information andcalculation.
(4) Represents total debt and obligations under capital leases, net of cash, cash equivalents, and short-term investments. Additionally,this calculation includes the present value of operating leases, and accordingly is considered a non-GAAP measure.
13
This line represents final trim and will not print

Item 7. Management’s Discussion and Analysis of Financial Condition and Results of Operations
Business Overview
Foot Locker, Inc., through its subsidiaries, operates in two reportable segments — Athletic Stores andDirect-to-Customers. The Athletic Stores segment is one of the largest athletic footwear and apparel retailersin the world, with formats that include Foot Locker, Lady Foot Locker, SIX:02, Kids Foot Locker, Champs Sports,Footaction, Runners Point and Sidestep. The Direct-to-Customers segment includes Footlocker.com, Inc. andother affiliates, including Eastbay, Inc., and our international ecommerce businesses, which sell to customersthrough their Internet and mobile sites and catalogs.
The Foot Locker brand is one of the most widely recognized names in the markets in which the Companyoperates, epitomizing premium quality for the active lifestyle customer. This brand equity has aided theCompany’s ability to successfully develop and increase its portfolio of complementary retail store formats, suchas Lady Foot Locker, and Kids Foot Locker, as well as Footlocker.com, its direct-to-customer business. Throughvarious marketing channels, including broadcast, digital, social, print, and various sports sponsorships andevents, the Company reinforces its image with a consistent message — namely, that it is the destination forathletically inspired shoes and apparel with a wide selection of merchandise in a full-service environment.
Store ProfileSquare Footage(in thousands)January 31,
2015 Opened ClosedJanuary 30,
2016Relocations/Remodels Selling Gross
Foot Locker US 1,015 8 52 971 54 2,451 4,234Foot Locker Europe 603 16 13 606 34 863 1,884Foot Locker Canada 126 1 2 125 8 279 435Foot Locker Asia Pacific 91 4 1 94 6 128 210Lady Foot Locker 198 — 42 156 — 208 352SIX:02 15 15 — 30 — 62 101Kids Foot Locker 357 27 10 374 44 602 1,029Footaction 272 13 17 268 20 800 1,303Champs Sports 547 10 7 550 41 1,947 2,972Runners Point 116 10 5 121 2 158 259Sidestep 83 7 2 88 — 82 139
Total 3,423 111 151 3,383 209 7,580 12,918
Athletic Stores
The Company operates 3,383 stores in the Athletic Stores segment. The following is a brief description of theAthletic Stores segment’s operating businesses and their respective taglines:
Foot Locker — ‘‘Approved’’ — Foot Locker is a leading global athletic footwear and apparel retailer, whichcaters to the sneaker enthusiast — If it’s at Foot Locker, it’s Approved. Its stores offer the latest inathletically-inspired footwear and apparel, manufactured primarily by the leading athletic brands. Foot Lockerprovides the best selection of premium products for a wide variety of activities, including basketball, running,and training. Additionally, we operate 199 House of Hoops, primarily a shop-in-shop concept, which sellspremier basketball-inspired footwear and apparel. Foot Locker’s 1,796 stores are located in 23 countriesincluding 971 in the United States, Puerto Rico, U.S. Virgin Islands, and Guam, 125 in Canada, 606 in Europe,and a combined 94 in Australia and New Zealand. The domestic stores have an average of 2,500 selling squarefeet and the international stores have an average of 1,500 selling square feet.
Lady Foot Locker — ‘‘The Place for Her’’ — Lady Foot Locker is a U.S. retailer of athletic footwear, apparel, andaccessories dedicated to active women. Its stores carry major athletic footwear, apparel, and accessories brandsdesigned for a variety of activities, including running, walking, training, and fitness. Lady Foot Locker operates156 stores that are located in the United States and Puerto Rico. These stores have an average of 1,300 sellingsquare feet.
14
This line represents final trim and will not print

SIX:02 — ‘‘It’s Your Time’’— SIX:02 is an elevated retail concept designed for the modern woman, featuring topbrands in athletic-inspired style. The apparel, footwear, and accessories assortments are carefully curated to inspireher best self-expression — in the gym and out of it. This banner has unique local fitness and fashion partners ineach market and also leverages top celebrity and social influencers to connect meaningfully to all aspects of awoman’s life. SIX:02 operates 30 stores in the United States and have an average of 2,100 selling square feet.
Kids Foot Locker — ‘‘Go Big’’ — Kids Foot Locker is a youth athletic retailer that offers the largest selection ofbrand-name athletic footwear, apparel and accessories for young athletes. Its stores feature an environment gearedto appeal to both parents and children. Of its 374 stores, 349 are located in the United States, Puerto Rico, and theU.S. Virgin Islands, 18 in Europe, and 7 in Canada. These stores have an average of 1,600 selling square feet.
Footaction — ‘‘Own It’’ — Footaction is a national athletic footwear and apparel retailer that offers the freshest,best edited selection of athletic lifestyle brands and looks. This banner is uniquely positioned at the intersectionof sport and style. The primary customer is a style-obsessed, confident, influential young male who is alwaysdressed to impress. Its 268 stores are located throughout the United States and Puerto Rico and focus onauthentic, premium product. The Footaction stores have an average of 3,000 selling square feet.
Champs Sports — ‘‘We Know Game’’ — Champs Sports is one of the largest mall-based specialty athleticfootwear and apparel retailers in North America. Its product categories include athletic footwear and apparel,and sport-lifestyle inspired accessories. This assortment allows Champs Sports to differentiate itself from othermall-based stores by presenting complete head-to-toe merchandising stories representing the most powerfulathletic brands, sports teams, and athletes in North America. Of its 550 stores, 519 are located throughout theUnited States, Puerto Rico, and the U.S. Virgin Islands and 31 in Canada. The Champs Sports stores have anaverage of 3,500 selling square feet.
Runners Point— ‘‘Your Way, Our Passion’’ — Runners Point specializes in running footwear, apparel, andequipment for performance and lifestyle purposes. Its 121 stores are located in Germany, Austria and Switzerland.This banner caters to local running communities providing technical products, training tips and access to localrunning and group events. The Runners Point stores have an average of 1,300 selling square feet.
Sidestep— ‘‘Sneaker Lifestyle’’— Sidestep is a predominantly sports fashion footwear banner. Its 88 stores arelocated in Germany, Austria, the Netherlands, and Switzerland. Sidestep caters to a more discerning, fashionconsumer. Sidestep stores have an average of 900 selling square feet.
Direct-to-Customers
The Company’s Direct-to-Customers segment is multi-branded and sells directly to customers through itsInternet and mobile sites and catalogs. The Direct-to-Customers segment operates the websites foreastbay.com, final-score.com, eastbayteamsales.com, and sp24.com. Additionally, this segment includes thewebsites aligned with the brand names of its store banners (footlocker.com, ladyfootlocker.com, six02.comkidsfootlocker.com, champssports.com, footaction.com, footlocker.ca, footlocker.eu, runnerspoint.com, andsidestep-shoes.com). These sites offer some of the largest online selections of athletically inspired shoes andapparel, while providing a seamless link between ecommerce and store banners.
Eastbay— ‘‘First Choice For Athletes’’ — Eastbay is among the largest direct marketers in the United States,providing serious high school and other athletes with a complete sports solution including athletic footwear,apparel, equipment, team licensed, and private-label merchandise for a broad range of sports.
Franchise Operations
The Company has two separate ten-year agreements with third parties for the operation of Foot Locker storeslocated within theMiddle East and the Republic of Korea. The franchised stores located in Germany operate underthe Runners Point banner. A total of 64 franchised stores were operating at January 30, 2016, of which 40 wereoperating in theMiddle East, 16 in Germany, and 8 in the Republic of Korea. During 2015, the Company completedan acquisition from Futura Sport AG of 10 Runners Point and Sidestep stores, which were previously franchisestores. Royalty income from the franchised stores was not significant for any of the periods presented. These storesare not included in the Company’s operating store count above.
15
This line represents final trim and will not print

Reconciliation of Non-GAAP Measures
In the following tables, the Company has presented certain financial measures and ratios identified asnon-GAAP. The Company believes this non-GAAP information is useful to investors because it allows for a moredirect comparison of the Company’s performance for 2015 as compared with prior years and is useful inassessing the Company’s progress in achieving its long-term financial objectives. The following represents areconciliation of the non-GAAP measures discussed throughout the Overview of Consolidated Results:
2015 2014 2013(in millions, except per share amounts)
Sales $7,412 $7,151 $6,505Pre-tax income:Income before income taxes $ 837 $ 809 $ 663Pre-tax amounts excluded from GAAP:
Pension litigation charge 100 — —Impairment and other charges 5 4 2Runners Point Group integration and acquisition costs — 2 6Gain on sale of real estate — (4) —
Total pre-tax amounts excluded 105 2 8Income before income taxes (non-GAAP) $ 942 $ 811 $ 671
Calculation of Earnings Before Interest and Taxes (EBIT):Income before income taxes $ 837 $ 809 $ 663Interest expense, net 4 5 5EBIT $ 841 $ 814 $ 668Income before income taxes (non-GAAP) $ 942 $ 811 $ 671Interest expense, net 4 5 5EBIT (non-GAAP) $ 946 $ 816 $ 676EBIT margin % 11.3% 11.4% 10.3%EBIT margin % (non-GAAP) 12.8% 11.4% 10.4%
After-tax income:Net income $ 541 $ 520 $ 429After-tax amounts excluded from GAAP:
Pension litigation charge 61 — —Impairment and other charges 4 3 1Runners Point Group acquisition and integration costs — 2 5Gain on sale of property — (3) —Settlement of foreign tax audits — — (3)
Net income (non-GAAP) $ 606 $ 522 $ 432Net income margin % 7.3% 7.3% 6.6%Net income margin % (non-GAAP) 8.2% 7.3% 6.6%
Diluted earnings per share:Net income $ 3.84 $ 3.56 $ 2.85
Pension litigation charge 0.43 — —Impairment and other charges 0.02 0.02 0.01Runners Point Group acquisition and integration costs — 0.01 0.03Gain on sale of property — (0.01) —Settlement of foreign tax audits — — (0.02)
Net income (non-GAAP) $ 4.29 $ 3.58 $ 2.87
The Company estimates the tax effect of the non-GAAP adjustments by applying its marginal tax rate to eachof the respective items. During 2013, the Company recorded a benefit of $3 million, or $0.02 per diluted share,to reflect the settlement of foreign tax audits, which resulted in a reduction in tax reserves established in priorperiods.
When assessing Return on Invested Capital (‘‘ROIC’’), the Company adjusts its results to reflect its operatingleases as if they qualified for capital lease treatment. Operating leases are the primary financing vehicle usedto fund store expansion and, therefore, we believe that the presentation of these leases as if they were capital
16
This line represents final trim and will not print

leases is appropriate. Accordingly, the asset base and net income amounts are adjusted to reflect this in thecalculation of ROIC. ROIC, subject to certain adjustments, is also used as a measure in executive long-termincentive compensation.
The closest U.S. GAAP measure is Return on Assets (‘‘ROA’’) and is also represented below. ROA remainedunchanged compared with the prior year. Our ROIC improvement is due to an increase in our non-GAAPearnings before interest and income taxes, partially offset by an increase in our average invested capital,primarily related to an increase in capitalized operating leases. This reflected the inclusion of the newheadquarters lease and the effect of opening larger stores supporting the various shop-in-shop initiatives.
2015 2014 2013ROA(1) 14.7% 14.7% 12.5%ROIC % (non-GAAP)(2) 15.8% 15.0% 14.1%
(1) Represents net income of $541 million, $520 million, and $429 million divided by average total assets of $3,676 million, $3,532 million,and $3,427 million for 2015, 2014, and 2013, respectively.
(2) See below for the calculation of ROIC.
2015 2014 2013($ in millions)
EBIT (non-GAAP) $ 946 $ 816 $ 676+ Rent expense 640 635 600- Estimated depreciation on capitalized operating leases(3) (498) (482) (443)Net operating profit 1,088 969 833- Adjusted income tax expense(4) (391) (347) (298)= Adjusted return after taxes $ 697 $ 622 $ 535Average total assets $ 3,676 $ 3,532 $ 3,427- Average cash, cash equivalents and short-term investments (994) (917) (898)- Average non-interest bearing current liabilities (697) (659) (630)- Average merchandise inventories (1,268) (1,235) (1,194)+ Average estimated asset base of capitalized operating leases(3) 2,346 2,093 1,829+ 13-month average merchandise inventories 1,337 1,325 1,269= Average invested capital $ 4,400 $ 4,139 $ 3,803ROIC % 15.8% 15.0% 14.1%
(3) The determination of the capitalized operating leases and the adjustments to income have been calculated on a lease-by-lease basisand have been consistently calculated in each of the years presented above. Capitalized operating leases represent the best estimateof the asset base that would be recorded for operating leases as if they had been classified as capital or as if the property werepurchased. The present value of operating leases is discounted using various interest rates ranging from 2.5 percent to 14.5 percent,which represent the Company’s incremental borrowing rate at inception of the lease. The capitalized operating leases and relatedincome statements amounts disclosed above do not reflect the requirements of the recently issued Accounting Standards Update2016-02, Leases.
(4) The adjusted income tax expense represents the marginal tax rate applied to net operating profit for each of the periods presented.
Overview of Consolidated Results
In March 2015, the Company updated its long-range plan and long-term financial objectives as presentedbelow. The following represents our results and our progress towards meeting the updated objectives.Non-GAAP results are presented for all the periods.
Long-termObjectives 2015 2014 2013
Sales ($ in millions) $10,000 $7,412 $7,151 $6,505Sales per gross square foot $ 600 $ 504 $ 490 $ 460EBIT margin 12.5% 12.8% 11.4% 10.4%Net income margin 8.5% 8.2% 7.3% 6.6%ROIC 17.0% 15.8% 15.0% 14.1%
17
This line represents final trim and will not print

Highlights of our 2015 financial performance include:
• Sales and comparable-store sales, as noted in the table below, both increased and continued tobenefit from exciting assortments and enhanced store formats across our various banners, as well asimproved performance of the Company’s store banner.com websites.
2015 2014 2013
Sales increase 3.6% 9.9% 6.6%Comparable-store sales increase 8.5% 8.0% 4.2%
• The following represents the percentage of sales from each of the major product categories:
2015 2014 2013
Footwear sales 82% 79% 77%Apparel and accessories sales 18% 21% 23%
• Sales from the Direct-to-Customers segment increased 9.1 percent to $944 million, compared with$865 million in 2014 and increased 60 basis points as a percentage of total sales to 12.7 percent. Thedirect business has been steadily increasing over the last several years, led by the growth in the storebanners’ ecommerce sales.
• Gross margin, as a percentage of sales, increased by 60 basis points to 33.8 percent in 2015. Theimprovement was driven by a decrease in the occupancy and buyers’ expense rate coupled with anincrease in the merchandise margin rate. These reflect effective leverage on higher sales and a lowermarkdown rate.
• SG&A expenses on a constant currency basis were 19.2 percent of sales, a decrease of 70 basis pointsas compared with the prior year, as we continued to diligently manage expenses.
• EBIT margin was 12.8 percent, surpassing the long-term financial objective and reflecting the strongearnings generated during 2015.
• Net income on a non-GAAP basis was $606 million, or $4.29 diluted earnings per share, an increase of19.8 percent from the prior-year period.
• The Company ended the year in a strong financial position. At year end, the Company had $891 millionof cash and cash equivalents, net of debt and obligations under capital leases. Cash and cashequivalents at January 30, 2016 were $1,021 million, representing an increase of $54 million ascompared with last year. This improvement reflects earnings strength and the successful execution ofvarious key initiatives noted in the items below.
• Net cash provided by operating activities was $745 million, representing a $33 million increase overlast year.
• Cash capital expenditures during 2015 totaled $228 million and were primarily directed to theremodeling or relocation of 209 stores, the build-out of approximately 100 new stores, as well as othertechnology and infrastructure projects.
• During 2015 we returned significant value to our shareholders. Dividends totaling $139 million weredeclared and paid during 2015, and a total of 6.7 million shares were repurchased under our sharerepurchase program at a cost of $419 million.
• ROIC increased to 15.8 percent as compared to the prior year result of 15.0 percent, reflectingprofitability improvements and a disciplined approach to capital spending.
18
This line represents final trim and will not print

Summary of Consolidated Statements of Operations
2015 2014 2013(in millions, except per share data)
Sales $7,412 $7,151 $6,505Gross margin 2,505 2,374 2,133Selling, general and administrative expenses 1,415 1,426 1,334Depreciation and amortization 148 139 133Interest expense, net 4 5 5Net income $ 541 $ 520 $ 429Diluted earnings per share $ 3.84 $ 3.56 $ 2.85
Sales
All references to comparable-store sales for a given period relate to sales of stores that were open at theperiod-end and had been open for more than one year. The computation of comparable-store sales alsoincludes the sales of the Direct-to-Customers segment. Stores opened or closed during the period are notincluded in the comparable-store base; however, stores closed temporarily for relocation or remodeling areincluded. Computations exclude the effect of foreign currency fluctuations.
Sales of $7,412 million in 2015 increased by 3.6 percent from sales of $7,151 million in 2014, this represented acomparable-store sales increase of 8.5 percent. Excluding the effect of foreign currency fluctuations, salesincreased 8.9 percent as compared with 2014. Sales of $7,151 million in 2014 increased by 9.9 percent fromsales of $6,505 million in 2013, this represented a comparable-store sales increase of 8.0 percent. Excluding theeffect of foreign currency fluctuations and sales of Runners Point Group, sales increased 8.5 percent ascompared with 2013.
Gross Margin
2015 2014 2013
Gross margin rate 33.8% 33.2% 32.8%Basis point increase in the gross margin rate 60 40
Components of the increase-Merchandise margin rate improvement/(decline) 30 (30)Lower occupancy and buyers’ compensation expense rate 30 70
The gross margin rate improved by 60 basis points during 2015 as compared with the corresponding prior-yearperiod. Excluding the effect of foreign currency fluctuations, the gross margin rate improved by 70 basis pointsin 2015. The improvement was driven by both an improved merchandise margin rate and a decrease in theoccupancy and buyers’ compensation rate reflecting improved sales leverage. The improvement in themerchandise margin rate primarily reflected an enhanced ability to achieve full-priced selling, as fewermarkdowns were needed due to the freshness of inventory.
Gross margin in 2014 improved 40 basis points to 33.2 percent as compared with 2013. This improvementreflected a decrease in the occupancy and buyers’ compensation rate, which reflected improved leverage ofprimarily fixed costs. Merchandise margin declined by 30 basis points in 2014 as the cost of merchandiseincreased as compared with 2013. This primarily reflected the effect of lower initial markups driven by supplierand category mix, and lower shipping and handling margin, partially offset by lower markdowns.
Selling, General and Administrative Expenses (SG&A)
2015 2014 2013($ in millions)
SG&A $1,415 $1,426 $1,334$ Change $ (11) $ 92% Change (0.8)% 6.9%SG&A as a percentage of sales 19.1% 19.9% 20.5%
19
This line represents final trim and will not print

Excluding the effect of foreign currency fluctuations, SG&A increased by $72 million for 2015 as compared with2014. The increase was driven by higher variable expenses to support sales, such as store wages and bankingexpenses. As a percentage of sales, SG&A improved 80 basis points representing improved leverage on oursales increase. Consistent with the prior year, this improvement reflects effective expense management,specifically store wage improvements due to productivity gains reflecting the continued utilization of hiring andscheduling tools.
Excluding the effect of foreign currency fluctuations, SG&A increased by $101 million for 2014 as comparedwith 2013. Runners Point Group, which was acquired in early July 2013, represented an incremental $39 millionin expenses in 2014. Additionally, the Company incurred $2 million in integration costs during 2014. Excludingthese items, the increase was driven by higher variable expenses to support sales, such as store wages andbanking expenses. As a percentage of sales, SG&A improved 60 basis points representing improved leverageon our sales increase. This improvement reflected continued effective expense management, including storewages, which benefitted from the utilization of hiring and scheduling tools, as well as enhanced associatetraining.
Depreciation and Amortization
2015 2014 2013($ in millions)
Depreciation and Amortization $148 $139 $133$ Change 9 6% Change 6.5% 4.5%
Excluding the effect of foreign currency fluctuations, depreciation and amortization increased $17 million in2015. On a constant currency basis, the increases in each year presented reflect increased capital spending onstore improvements, our digital sites and other various technologies. In addition, the 2014 amount included$2 million of capital accrual adjustments made during the third quarter of 2014, which reduced depreciationand amortization.
Pension Litigation Charge
During the third quarter of 2015, the Company recorded a $100 million pension litigation charge ($61 millionafter-tax or $0.43 per diluted share). This charge relates to a class action in which the plaintiffs alleged that theCompany failed to properly disclose the effects of the 1996 conversion of the retirement plan to a definedbenefit plan with a cash balance formula. In September 2015, the court ruled in favor of the plaintiffs and issueda decision ordering that the pension plan be reformed. The Company is appealing the court’s decision, and thejudgment has been stayed pending the outcome of the appeal. The Company’s reasonable estimate of thisliability is a range between $100 million and $200 million, with no amount within that range more probable thanany other amount. Therefore, in accordance with U.S. GAAP, the Company recorded a pre-tax charge of$100 million. Please see Item 8. ‘‘Consolidated Financial Statements and Supplementary Data,’’ Note 23, LegalProceedings for further information.
Interest Expense, Net
2015 2014 2013($ in millions)
Interest expense $ 11 $ 11 $ 11Interest income (7) (6) (6)
Interest expense, net $ 4 $ 5 $ 5
Weighted-average interest rate (excluding fees) 7.2% 7.2% 7.1%
Net interest expense decreased by $1 million in 2015 as compared with 2014, reflecting increased income dueto higher interest rates. Net interest expense in 2014 was essentially unchanged from 2013. The Company didnot have any short-term borrowings, other than amounts outstanding in connection with capital leases, for anyof the periods presented.
20
This line represents final trim and will not print

Income Taxes
The effective tax rate for 2015 was 35.4 percent, as compared with 35.7 percent in 2014. The Company regularlyassesses the adequacy of the provisions for income tax contingencies in accordance with the applicableauthoritative guidance on accounting for income taxes. As a result, the reserves for unrecognized tax benefitsmay be adjusted due to new facts and developments, such as changes to interpretations of relevant tax law,assessments from taxing authorities, settlements with taxing authorities, and lapses of statutes of limitations.The effective tax rate for 2015 and 2014 includes reserve releases totaling $4 million and $5 million, respectively,due to audit settlements and lapses of statutes of limitations.
In 2015, the Company recorded a pension-related litigation charge of $100 million with a related tax benefit of$39 million. This litigation charge reduced the overall effective rate because it reduced the proportion of theCompany’s worldwide income taxed in the United States, where the tax rates are the highest.
Excluding the reserve releases in 2015 and in 2014 and the effect of the pension litigation charge, the effectivetax rate for 2015 was essentially unchanged as compared with 2014.
The effective tax rate for 2014 was 35.7 percent, as compared with 35.3 percent in 2013. Excluding the reservereleases, the effective tax rate for 2014 increased as compared with 2013 primarily due to the higher proportionof income earned in the United States, which is a higher tax jurisdiction.
Segment Information
The Company’s two reportable segments, Athletic Stores and Direct-to-Customers, are based on its method ofinternal reporting. The Company evaluates performance based on several factors, the primary financial measureof which is division results. Division profit reflects income before income taxes, pension litigation charge,corporate expense, non-operating income, and net interest expense.
2015 2014 2013($ in millions)
SalesAthletic Stores $6,468 $6,286 $5,790Direct-to-Customers 944 865 715
$7,412 $7,151 $6,505
Operating ResultsAthletic Stores $ 872 $ 777 $ 656Direct-to-Customers 142 109 84
Division profit 1,014 886 740Less: Pension litigation charge 100 — —Less: Corporate expense 77 81 76
Operating profit 837 805 664Other income 4 9 4
Earnings before interest expense and income taxes 841 814 668
Interest expense, net 4 5 5Income before income taxes $ 837 $ 809 $ 663
21
This line represents final trim and will not print

Athletic Stores
2015 2014 2013($ in millions)
Sales $6,468 $6,286 $5,790$ Change $ 182 $ 496% Change 2.9% 8.6%Division profit $ 872 $ 777 $ 656Division profit margin 13.5% 12.4% 11.3%
2015 compared with 2014
Excluding the effect of foreign currency fluctuations, sales from the Athletic Stores segment increased8.6 percent. Comparable-store sales increased by 7.6 percent. Foot Locker Europe and Foot Locker Asia Pacificled the comparable-stores sales increase. Foot Locker Europe generated double digit comparable-store gainsin footwear, apparel, and accessories. The increase in footwear was primarily related to sales of classic courtstyles, lifestyle running, and men’s basketball. Apparel sales experienced gains in both the branded and privatelabel categories.
The strong performance internationally was partially offset by the underperformance of the Runners Point andSidestep stores. The sales decline at our Runners Point and Sidestep stores reflected the continuedsegmentation process and the overreliance on a few key running styles. Our segmentation process includesbetter defining product offerings and executing upon our multi-banner strategy in the European market. Weare broadening the assortment in the Runners Point stores beyond performance running to include morelifestyle running products, while the Sidestep stores are being shifted to lifestyle and casual footwear. Wecontinue to refine this segmentation strategy, which we believe will position these banners to contribute to ourfurther success in Europe.
Domestically, sales increases were led by Foot Locker and Kids Foot Locker with all formats generating acomparable-store sales increase. Running and basketball were the strongest drivers of footwear sales. TheJordan brand, as well as the rise of new marquee styles contributed to the growth in the basketball category.Children’s footwear sales also performed well across all of the divisions. Sales continue to benefit from theexpansion of shop-in-shop partnerships with our key vendors. The Company opened more than40 shop-in-shops during the year, including 21 House of Hoops shops in partnership with Nike.
While Lady Foot Locker/SIX:02’s overall sales declined slightly in 2015, the combined banners produced amid-single digit comparable-store sales gain, the seventh consecutive quarter with a comparable-store salesgain. The comparable-store gain was led by both footwear and apparel, partially offset by a decline inaccessories. The overall sales decline reflects 42 Lady Foot Locker store closures, partially offset by the openingof 15 SIX:02 stores during the year. The SIX:02 banner provides the female customer with elevated,athletic-inspired product assortments featuring top brands. During 2015, we continued to work with ourvendors to refine this assortment to include more fashion styles. This initiative, as well other actions to promotebrand development, will continue into 2016.
Champs Sports generated a low single digit comparable-store sales increase driven by gains in footwear salespartially offset by declines in apparel and accessories. The decline in apparel primarily reflects the continuationof the customer’s shift away from licensed apparel.
Division profit increased by $95 million to $872 million in 2015 as compared with last year reflecting higher salesand an improved gross margin rate. Variable expenses, such as store wages, were also diligently managed,resulting in an improved SG&A rate. Due to the underperformance of the Runners Point and Sidestep storesduring 2015, an impairment review was performed. The review resulted in an impairment charge totaling$4 million, which was recorded to write down long-lived assets such as store fixtures and leaseholdimprovements for 61 stores.
22
This line represents final trim and will not print

2014 compared with 2013
Excluding the effect of foreign currency fluctuations, primarily related to the euro and Canadian dollar, salesfrom the Athletic Stores segment increased by 9.4 percent in 2014. Comparable-store sales increased by6.7 percent. This segment included $133 million of incremental sales related to the Runners Point stores, whichwere acquired in early July 2013. Excluding the sales of the Runners Point stores, the comparable-store gainwas primarily driven by Kids Foot Locker, Foot Locker U.S., Footaction, and Foot Locker Europe. While LadyFoot Locker’s overall sales declined in 2014, the banner generated a comparable-store gain for the year. Theshift into more performance oriented assortments has resonated with our customers, as both footwear andapparel grew on a comparable-store basis. The overall Lady Foot Locker sales decrease in 2014 primarilyreflected a net decline of 44 stores.
Basketball, running, and children’s footwear were strong drivers of sales increases. Sales of basketball footwearwere driven by Jordan and key marquee player styles, while running shoes from Nike and Adidas had strongresults. Additionally, children’s footwear continued to perform well across multiple divisions. Apparel sales werechallenging primarily in Foot Locker Europe and Champs Sports, as customers have shifted away from certainlifestyle and licensed apparel programs, which had previously driven strong results. This segment benefittedfrom strong banner differentiation, which has created unique store designs and product assortments whichhave resonated with customers and enhanced the shopping experience.
Included in 2014 division profit was a $1 million impairment charge related to the write-down of a trade namefor our stores operating in the Republic of Ireland, reflecting historical and projected underperformance.Additionally, a $1 million charge was recorded to fully write down the value of a private-label brand acquired aspart of the Runners Point Group acquisition, as a result of exiting the product line. The overall division profitimprovement in 2014 primarily reflected higher sales, an improved gross margin rate, and effective control overvariable expenses, such as store wages.
Direct-to-Customers
2015 2014 2013($ in millions)
Sales $ 944 $ 865 $ 715$ Change $ 79 $ 150% Change 9.1% 21.0%Division profit $ 142 $ 109 $ 84Division profit margin 15.0% 12.6% 11.7%
2015 compared with 2014
Excluding the effect of foreign currency fluctuations, sales of the Direct-to-Customers segment increased10.6 percent as compared with the prior year, while comparable sales increased by 14.4 percent. The increasewas primarily a result of continued strong sales performance of the Company’s domestic store-banner websites,as well as growth in our international ecommerce business, particularly in Europe. Of the total increase, salesfrom our U.S. store-banner websites comprised the majority of the increase. The growth in ecommerce reflectsthe continued elevation of the connection between the in-store experience and the banner websites, as well asthe development of features and functionality to deliver an enhanced digital experience. These increases werepartially offset by the 2014 closure of the CCS direct business. The strongest category for this segment wasfootwear, led by basketball and casual styles. Apparel increased slightly as compared with the prior year, whichprimarily reflected gains in the branded apparel category.
This segment generated a division profit increase of $33 million as compared with 2014, which represented adivision profit margin improvement of 240 basis points. The increase was the result of strong flow-through ofsales to profit, resulting from improved gross margins due to more full-price selling and effective expensemanagement. The improvement in gross margin was due, in part, to the fact that 2014 was negatively affectedby the liquidation of the CCS merchandise. Division profit in 2015 included a $1 million impairment charge towrite down the value of the SP24.com ecommerce trade name, which was acquired with the Runners PointGroup. SP24.com is a clearance website that has been deemphasized as we focus on full-priced selling on thewebsites aligned with the stores banners.
23
This line represents final trim and will not print

2014 compared with 2013
Comparable sales increased 17.8 percent as compared to 2013, led by basketball and running footwear. TheDirect-to-Customers segment included $18 million of incremental sales related to the ecommerce division ofRunners Point Group, which the Company acquired during the second quarter of 2013. Excluding those sales,the increase was primarily a result of continued strong sales performance related to the Company’sstore-banner websites both in the U.S. and in Europe, as well as increased Eastbay sales. Of the total increase,sales from our U.S. store-banner websites comprised the majority of the increase, which reflected the continuedsuccess of several initiatives, including the improvement of connectivity of the store banners to the ecommercesites, enhancements to the mobile ecommerce sites, investments in technology to improve the shoppingexperience, and investments in making the sites more engaging. These increases were offset, in part, by adecline in the CCS business, which transitioned to the Eastbay banner during the third quarter of 2014.
Division profit increased by $25 million as compared to 2013, representing a division profit margin improvementof 90 basis points. The 2014 results included a $2 million impairment charge related to the CCS business, whichwas triggered by the Company’s decision to transition the skate business to the Eastbay banner. Gross marginwas negatively affected by the liquidation of the CCS merchandise and the effects of providing additional freeshipping offers. Notwithstanding this, the increase in division profit was the result of strong flow-through ofsales to profit and good expense management.
Corporate Expense
2015 2014 2013($ in millions)
Corporate expense $77 $81 $76$ Change $ (4) $ 5
Corporate expense consists of unallocated general and administrative expenses as well as depreciation andamortization related to the Company’s corporate headquarters, centrally managed departments, unallocatedinsurance and benefit programs, certain foreign exchange transaction gains and losses, and other items.Depreciation and amortization included in corporate expense was $11 million, $13 million, and $12 million in2015, 2014, and 2013, respectively.
Corporate expense decreased by $4 million in 2015 as compared with the prior year. Depreciation andamortization included in corporate expense decreased by $2 million. The annual adjustment of the allocationof corporate expense to the operating divisions reduced corporate expense by $5 million. These decreaseswere offset by $3 million of costs incurred in late 2015 relating to the spring 2016 relocation of our corporateheadquarters within New York City.
Corporate expense increased by $5 million in 2014 as compared with 2013. This increase was primarily relatedto incentive compensation and legal costs, which increased $8 million and $2 million, respectively. Additionally,depreciation and amortization included in corporate expense increased by $1 million. These increases werepartially offset by the annual adjustment to the allocation of corporate expense to the operating divisions,which reduced corporate expense by $4 million. In addition, acquisition and integration costs related toRunners Point Group were $4 million less in 2014 than in 2013.
Liquidity and Capital Resources
Liquidity
The Company’s primary source of liquidity has been cash flow from earnings, while the principal uses of cashhave been: to fund inventory and other working capital requirements; to finance capital expenditures related tostore openings, store remodelings, Internet and mobile sites, information systems, and other support facilities;to make retirement plan contributions, quarterly dividend payments, and interest payments; and to fund othercash requirements to support the development of its short-term and long-term operating strategies.
The Company generally finances real estate with operating leases. Management believes its cash, cashequivalents, and future cash flow from operations will be adequate to fund these requirements.
24
This line represents final trim and will not print

As of January 30, 2016, the Company had $1,021 million of cash and cash equivalents, of which $608 million washeld in foreign jurisdictions. Because we plan to permanently reinvest our foreign earnings, in accordance withU.S. GAAP, we have not provided for U.S. federal and state income taxes or foreign withholding taxes that mayresult from potential future remittances of undistributed earnings of foreign subsidiaries. Depending on thesource, amount, and timing of a repatriation, some tax may be payable. The Company believes that its cashinvested domestically and future domestic cash flows are sufficient to satisfy domestic requirements.
The Company may also from time to time repurchase its common stock or seek to retire or purchaseoutstanding debt through open market purchases, privately negotiated transactions, or otherwise. Suchrepurchases and retirement of debt, if any, will depend on prevailing market conditions, liquidity requirements,contractual restrictions, and other factors. The amounts involved may be material. As of January 30, 2016,approximately $637 million remained available under the Company’s current $1 billion share repurchaseprogram.
On February 17, 2016, the Board of Directors declared a quarterly dividend of $0.275 per share to be paid onApril 29, 2016, representing a 10 percent increase over the Company’s previous quarterly per share amount.
As discussed further in the Legal Proceedings note under ‘‘Item 8. Financial Statements and SupplementaryData,’’ the Company recorded a pre-tax charge of $100 million ($61 million after-tax) in 2015. In light of theuncertainties involved in this matter, there is no assurance that the ultimate resolution will not differ from theamount currently accrued by the Company. The $100 million charge has been classified as a long-term liabilitydue to the uncertainty involved with the resolution of this litigation, as the appeals process can be lengthy. Thepension plan is sufficiently funded to absorb a $100 million liability and, accordingly, we do not anticipate theneed to make any additional pension contributions in the near term in connection with this matter. The timingand the amount of any future contributions to the pension plan are dependent on the funded status of the planand various other factors, such as interest rates and the performance of the plan’s assets.
Any material adverse change in customer demand, fashion trends, competitive market forces, or customeracceptance of the Company’s merchandise mix and retail locations, uncertainties related to the effect ofcompetitive products and pricing, the Company’s reliance on a few key suppliers for a significant portion of itsmerchandise purchases and risks associated with global product sourcing, economic conditions worldwide, theeffects of currency fluctuations, as well as other factors listed under the heading ‘‘Disclosure RegardingForward-Looking Statements,’’ could affect the ability of the Company to continue to fund its needs frombusiness operations.
Maintaining access to merchandise that the Company considers appropriate for its business may be subject tothe policies and practices of its key suppliers. Therefore, the Company believes that it is critical to continue tomaintain satisfactory relationships with its key suppliers. In 2015 and 2014, the Company purchasedapproximately 90 percent and 89 percent, respectively, of its merchandise from its top five suppliers and expectsto continue to obtain a significant percentage of its athletic product from these suppliers in future periods.Approximately 72 percent in 2015 and 73 percent in 2014 was purchased from one supplier — Nike, Inc.
The Company’s 2016 planned capital expenditures and lease acquisition costs are approximately $297 million.Planned capital expenditures are $292 million and planned lease acquisition costs related to the Company’soperations in Europe are $5 million. The Company’s planned capital expenditures reflect $210 million focusedon elevating the customer’s in-store experience. It also includes the remodeling and expansion of over250 existing stores, the planned opening of approximately 90 stores primarily related to Kids Foot Locker in theU.S. and Europe, as well as the continued expansion of the Foot Locker banner in Europe. Planned spendingfor 2016 also includes $82 million for the development of information systems, including a new ecommerceorder management system, websites, infrastructure, and costs related to the relocation of our corporateheadquarters within New York City. The Company has the ability to revise and reschedule much of theanticipated capital expenditure program, should the Company’s financial position require it.
25
This line represents final trim and will not print

Free Cash Flow (non-GAAP measure)
In addition to net cash provided by operating activities, the Company uses free cash flow as a useful measureof performance and as an indication of the strength of the Company and its ability to generate cash. TheCompany defines free cash flow as net cash provided by operating activities less capital expenditures (which isclassified as an investing activity). The Company believes the presentation of free cash flow is relevant anduseful for investors because it allows investors to evaluate the cash generated from the Company’s underlyingoperations in a manner similar to the method used by management.
Free cash flow is not defined under U.S. GAAP. Therefore, it should not be considered a substitute for incomeor cash flow data prepared in accordance with U.S. GAAP, and may not be comparable to similarly titledmeasures used by other companies. It should not be inferred that the entire free cash flow amount is availablefor discretionary expenditures.
The following table presents a reconciliation of the Company’s net cash flow provided by operating activities,the most directly comparable U.S. GAAP financial measure, to free cash flow.
2015 2014 2013($ in millions)
Net cash provided by operating activities $ 745 $ 712 $ 530Capital expenditures (228) (190) (206)
Free cash flow (non-GAAP) $ 517 $ 522 $ 324
Operating Activities
2015 2014 2013($ in millions)
Net cash provided by operating activities $745 $712 $530$ Change $ 33 $182
The amount provided by operating activities reflects income adjusted for non-cash items and working capitalchanges. Adjustments to net income for non-cash items include non-cash impairment charges, depreciationand amortization, deferred income taxes, share-based compensation expense and related tax benefits.
The improvements in both 2015 and 2014 represented the Company’s earnings strength and working capitalimprovements. During 2015, the Company contributed $4 million to its U.S. qualified pension plans ascompared with $6 million contributed to its Canadian qualified pension plan in 2014. Pension contributionswere $2 million in 2013. The amounts and timing of pension contributions are dependent on several factors,including asset performance. Cash paid for income taxes was $283 million, $251 million, and $175 million for2015, 2014, and 2013, respectively.
Investing Activities
2015 2014 2013($ in millions)
Net cash used in investing activities $230 $176 $248$ Change $ 54 $ (72)
Capital expenditures in 2015 were $228 million, an increase of $38 million compared with the prior year. Currentyear capital expenditures primarily related to the remodeling of 209 stores, the build-out of 111 new stores,preparing for our corporate headquarters relocation within New York City, and other corporate technologyprojects. Capital expenditures in 2014 were $190 million, primarily related to the remodeling of 319 stores, thebuild-out of 86 new stores, and various corporate technology upgrades. This was a decrease of $16 million ascompared with 2013, as the timing of certain projects shifted to 2015. As of the end of fiscal 2015, approximately30 percent of our domestic Foot Locker and Champs Sports stores and approximately 20 percent of theFootaction stores have been remodeled to the current store format.
During the third quarter of 2015, the Company completed an asset acquisition for $2 million involving 10previously franchised Runners Point and Sidestep stores in Switzerland.
26
This line represents final trim and will not print
During 2014, the Company sold real estate for proceeds of $5 million and recorded a gain on sale of $4 million.In addition, maturities of short-term investments totaled $9 million in 2014. This compares with net sales andmaturities of short-term investments of $37 million during 2013. The activity during 2013 included the purchaseof Runners Point Group for $81 million, net of cash acquired.
Financing Activities
2015 2014 2013($ in millions)
Net cash used in financing activities $456 $401 $309$ Change $ 55 $ 92
Cash used in financing activities consists primarily of the Company’s return to shareholders initiatives, includingits share repurchase program and cash dividend payments, as follows:
2015 2014 2013($ in millions)
Share repurchases $419 $305 $229Dividends paid on common stock 139 127 118
Total returned to shareholders $558 $432 $347
During 2015, 2014, and 2013, the Company repurchased 6,693,100 shares, 5,888,698 shares, and6,424,286 shares of its common stock under its share repurchase programs, respectively. Additionally, theCompany declared and paid dividends representing a quarterly rate of $0.25, $0.22, and $0.20 per share in2015, 2014, and 2013, respectively.
Offsetting the amounts above were proceeds received from the issuance of common stock and treasury stockin connection with the employee stock programs of $69 million, $22 million, and $30 million for 2015, 2014, and2013, respectively. In connection with stock option exercises, the Company recorded excess tax benefits relatedto share-based compensation of $35 million, $12 million, and $9 million for 2015, 2014, and 2013, respectively.
The financing activity also includes payments on capital lease obligations of $2 million, $3 million, and $1 millionfor 2015, 2014, and 2013, respectively. These obligations were recorded in connection with the acquisition ofthe Runners Point Group.
Capital Structure
The 2011 Restated Credit Agreement provides for a $200 million asset based revolving credit facility maturingon January 27, 2017. In addition, during the term of the 2011 Restated Credit Agreement, the Company maymake up to four requests for additional credit commitments in an aggregate amount not to exceed $200million.Interest is based on the LIBOR rate in effect at the time of the borrowing plus a 1.25 to 1.50 percent margindepending on certain provisions as defined in the 2011 Restated Credit Agreement. The 2011 Restated CreditAgreement provides for a security interest in certain of the Company’s domestic assets, including certaininventory assets, but excluding intellectual property. The Company is not required to comply with any financialcovenants as long as there are no outstanding borrowings. With regard to the payment of dividends and sharerepurchases, there are no restrictions if the Company is not borrowing and the payments are funded throughcash on hand. If the Company is borrowing, Availability as of the end of each fiscal month during thesubsequent projected six fiscal months following the payment must be at least 20 percent of the lesser of theAggregate Commitments and the Borrowing Base (all terms as defined in the 2011 Restated Credit Agreement).The Company’s management currently does not expect to borrow under the facility in 2016, other than amountsused to support standby letters of credit.
27
This line represents final trim and will not print
Credit Rating
As of March 24, 2016, the Company’s corporate credit ratings from Standard & Poor’s and Moody’s InvestorsService are BB+ and Ba1, respectively. In addition, Moody’s Investors Service has rated the Company’s seniorunsecured notes Ba2.
Debt Capitalization and Equity (non-GAAP Measure)
For purposes of calculating debt to total capitalization, the Company includes the present value of operatinglease commitments in total net debt. Total net debt including the present value of operating leases isconsidered a non-GAAP financial measure. The present value of operating leases is discounted using variousinterest rates ranging from 2.5 percent to 14.5 percent, which represent the Company’s incremental borrowingrate at inception of the lease. Operating leases are the primary financing vehicle used to fund store expansionand, therefore, we believe that the inclusion of the present value of operating leases in total debt is useful toour investors, credit constituencies, and rating agencies.
The following table sets forth the components of the Company’s capitalization, both with and without thepresent value of operating leases:
2015 2014($ in millions)
Long-term debt and obligations under capital leases $ 130 $ 134Present value of operating leases 3,192 2,745
Total debt including the present value of operating leases 3,322 2,879Less:Cash and cash equivalents 1,021 967
Total net debt including the present value of operating leases 2,301 1,912Shareholders’ equity 2,553 2,496
Total capitalization $4,854 $4,408
Total net debt capitalization percent —% —%Total net debt capitalization percent including the present value of operating
leases (non-GAAP) 47.4% 43.4%
The Company’s cash and cash equivalents increased by $54 million during 2015, which was the result of strongcash flow generation from operating activities. Including the present value of operating leases, the Company’snet debt capitalization percent increased 400 basis points in 2015, reflecting the effect of lease renewals andthe obligation associated with the New York City office headquarters, partially offset by foreign exchangefluctuations.
28
This line represents final trim and will not print
Contractual Obligations and Commitments
The following tables represent the scheduled maturities of the Company’s contractual cash obligations andother commercial commitments at January 30, 2016:
Payments Due by Fiscal Period
Contractual Cash Obligations Total 2016 2017 − 2018 2019 − 20202021 andBeyond
($ in millions)
Long-term debt(1) $ 184 $ 11 $ 22 $ 22 $ 129Operating leases(2) 4,105 574 1,032 851 1,648Capital leases 1 1 — — —Other long-term liabilities(3) 25 25 — — —
Total contractual cash obligations $4,315 $ 611 $1,054 $873 $1,777
Other Commercial CommitmentsPurchase commitments(4) 2,524 2,524 — — —Other(5) 34 22 10 2 —
Total commercial commitments $2,558 $2,546 $ 10 $ 2 $ —
(1) The amounts presented above represent the contractual maturities of the Company’s long-term debt, including interest; however, itexcludes the unamortized gain of the interest rate swap of $11 million. Additional information is included in the Long-Term Debt andObligations Under Capital Leases note under ‘‘Item 8. Consolidated Financial Statements and Supplementary Data.’’
(2) The amounts presented represent the future minimum lease payments under non-cancellable operating leases. In addition tominimum rent, certain of the Company’s leases require the payment of additional costs for insurance, maintenance, and other costs.These costs have historically represented approximately 20 to 30 percent of the minimum rent amount. These additional amounts arenot included in the table of contractual commitments as the timing and/or amounts of such payments are unknown.
(3) The Company’s other liabilities in the Consolidated Balance Sheet at January 30, 2016 primarily comprise pension and postretirementbenefits, deferred rent liability, income taxes, workers’ compensation and general liability reserves, and various other accruals. Theamount presented in the table represents the Company’s 2016 U.S. qualified pension contribution of $25 million. Other than thisliability, other amounts (including the Company’s unrecognized tax benefits of $36 million, as well as penalties and interest of$2 million) have been excluded from the above table as the timing and/or amount of any cash payment is uncertain. The timing of theremaining amounts that are known has not been included as they are minimal and not useful to the presentation. Additionalinformation is included in theOther Liabilities, Financial Instruments and Risk Management, and Retirement Plans and Other Benefitsnotes under ‘‘Item 8. Consolidated Financial Statements and Supplementary Data.’’
(4) Represents open purchase orders, as well as other commitments for merchandise purchases, at January 30, 2016. The Company isobligated under the terms of purchase orders; however, the Company is generally able to renegotiate the timing and quantity ofthese orders with certain suppliers in response to shifts in consumer preferences.
(5) Represents payments required by non-merchandise purchase agreements.
Off-Balance Sheet Arrangements
The majority of the Company’s contractual obligations relate to operating leases for our stores. Futurescheduled lease payments under non-cancellable operating leases as of January 30, 2016 are described in thetable under Contractual Obligations and Commitments above and with additional information in the Leasesnote in ‘‘Item 8. Consolidated Financial Statements and Supplementary Data.’’
The Company does not participate in transactions that generate relationships with unconsolidated entities orfinancial partnerships, including variable interest entities. Our policy prohibits the use of derivatives for whichthere is no underlying exposure.
In connection with the sale of various businesses and assets, the Company may be obligated for certain leasecommitments transferred to third parties and pursuant to certain normal representations, warranties, orindemnifications entered into with the purchasers of such businesses or assets. Although the maximumpotential amounts for such obligations cannot be readily determined, management believes that the resolutionof such contingencies will not significantly affect the Company’s consolidated financial position, liquidity, orresults of operations. The Company is also operating certain stores for which lease agreements are in theprocess of being negotiated with landlords. Although there is no contractual commitment to make thesepayments, it is likely that leases will be executed.
29
This line represents final trim and will not print
Critical Accounting Policies
Management’s responsibility for integrity and objectivity in the preparation and presentation of the financialstatements requires diligent application of appropriate accounting policies. Generally, the Company’saccounting policies and methods are those specifically required by U.S. generally accepted accountingprinciples. Included in the Summary of Significant Accounting Policies note in ‘‘Item 8. Consolidated FinancialStatements and Supplementary Data’’ is a summary of the Company’s most significant accounting policies.
In some cases, management is required to calculate amounts based on estimates for matters that are inherentlyuncertain. The Company believes the following to be the most critical of those accounting policies thatnecessitate subjective judgments.
Merchandise Inventories and Cost of Sales
Merchandise inventories for the Company’s Athletic Stores are valued at the lower of cost or market using theretail inventory method (‘‘RIM’’). The RIM is commonly used by retail companies to value inventories at cost andcalculate gross margins due to its practicality. Under the retail method, cost is determined by applying acost-to-retail percentage across groupings of similar items, known as departments. The cost-to-retailpercentage is applied to ending inventory at its current owned retail valuation to determine the cost of endinginventory on a department basis. The RIM is a system of averages that requires management’s estimates andassumptions regarding markups, markdowns and shrink, among others, and as such, could result in distortionsof inventory amounts.
Judgment is required for these estimates and assumptions, as well as to differentiate between promotional andother markdowns that may be required to correctly reflect merchandise inventories at the lower of cost ormarket. The Company provides reserves based on current selling prices when the inventory has not beenmarked down to market. The failure to take permanent markdowns on a timely basis may result in anoverstatement of cost under the retail inventory method. The decision to take permanent markdowns includesmany factors, including the current retail environment, inventory levels, and the age of the item. Managementbelieves this method and its related assumptions, which have been consistently applied, to be reasonable.
Impairment of Long-Lived Tangible Assets, Goodwill and Other Intangibles
The Company performs an impairment review when circumstances indicate that the carrying value of long-livedtangible assets may not be recoverable. Management’s policy in determining whether an impairment indicatorexists, a triggering event, comprises measurable operating performance criteria at the division level as well asqualitative measures. If an analysis is necessitated by the occurrence of a triggering event, the Company usesassumptions, which are predominately identified from the Company’s strategic long-range plans, in performingan impairment review. In the calculation of the fair value of long-lived assets, the Company compares thecarrying amount of the asset with the estimated future cash flows expected to result from the use of the asset.If the carrying amount of the asset exceeds the estimated expected undiscounted future cash flows, theCompany measures the amount of the impairment by comparing the carrying amount of the asset with itsestimated fair value. The estimation of fair value is measured by discounting expected future cash flows at theCompany’s weighted-average cost of capital. Management believes its policy is reasonable and is consistentlyapplied. Future expected cash flows are based upon estimates that, if not achieved, may result in significantlydifferent results. During 2015, the Company conducted an impairment review of the Runners Point and Sidestepstore-level assets, which resulted in an impairment charge of $4 million.
The Company reviews goodwill for impairment annually during the first quarter of its fiscal year or morefrequently if impairment indicators arise. The review of impairment consists of either using a qualitativeapproach to determine whether it is more likely than not that the fair value of the assets is less than theirrespective carrying values or a two-step impairment test, if necessary.
In performing the qualitative assessment, management considers many factors in evaluating whether thecarrying value of goodwill may not be recoverable, including declines in stock price and market capitalizationin relation to the book value of the Company and macroeconomic conditions affecting retail. If, based on theresults of the qualitative assessment, it is concluded that it is not more likely than not that the fair value of areporting unit exceeds its carrying value, additional quantitative impairment testing is performed using a
30
This line represents final trim and will not print

two-step test. The initial step requires that the carrying value of each reporting unit be compared with itsestimated fair value. The second step — to evaluate goodwill of a reporting unit for impairment — is onlyrequired if the carrying value of that reporting unit exceeds its estimated fair value. The Company uses acombination of a discounted cash flow approach and a market-based approach to determine the fair value ofa reporting unit. The determination of discounted cash flows of the reporting units and assets and liabilitieswithin the reporting units requires significant estimates and assumptions. These estimates and assumptionsprimarily include, but are not limited to, the discount rate, terminal growth rates, earnings before depreciationand amortization, and capital expenditures forecasts. The market approach requires judgment and uses one ormore methods to compare the reporting unit with similar businesses, business ownership interests, or securitiesthat have been sold. Due to the inherent uncertainty involved in making these estimates, actual results coulddiffer from those estimates. The Company evaluates the merits of each significant assumption, both individuallyand in the aggregate, used to determine the fair value of the reporting units, as well as the fair values of thecorresponding assets and liabilities within the reporting units.
In 2015, the Company elected to perform its review of goodwill using a qualitative approach, and noreporting units were evaluated using the two-step impairment method. Based on the qualitative assessmentperformed, we concluded that it is more likely than not that the fair values of our reporting units exceeded theirrespective carrying values and that there are no reporting units at risk of impairment. In 2014, the Companyelected to perform the first step of the two-step impairment analysis in connection with its annual review. Thisanalysis concluded that the fair value of all the reporting units substantially exceeded their carrying values.
Owned trademarks and trade names that have been determined to have indefinite lives are not subject toamortization but are reviewed at least annually for potential impairment. Our impairment evaluation forindefinite-lived intangible assets consists of either a qualitative or quantitative assessment, similar to theprocess for goodwill.
If the results of the qualitative assessment indicate that it is more likely than not that the fair value of theindefinite lived intangible is less than its carrying amount, or if we elect to proceed directly to a quantitativeassessment, we calculate the fair value using a discounted cash flow method, based on the relief-from-royaltyconcept, and compare the fair value to the carrying value to determine if the asset is impaired. Thismethodology assumes that, in lieu of ownership, a third party would be willing to pay a royalty in order toexploit the related benefits of these types of assets. This approach is dependent on a number of factors,including estimates of future growth and trends, royalty rates in the category of intellectual property, discountrates, and other variables. We base our fair value estimates on assumptions we believe to be reasonable, butwhich are unpredictable and inherently uncertain. Actual future results may differ from those estimates. Werecognize an impairment loss when the estimated fair value of the intangible asset is less than the carryingvalue. Our 2015 annual assessment using the quantitative method did not result in an impairment charge.However, during the fourth quarter of 2015, as a result of a triggering event, we recorded an impairment chargefor indefinite-lived intangibles of $1 million.
Share-Based Compensation
The Company estimates the fair value of options granted using the Black-Scholes option pricing model. TheBlack-Scholes option pricing valuation model requires the use of subjective assumptions. Changes in theseassumptions, listed below, can materially affect the fair value of the options.
Risk-free Interest Rate — The risk-free interest rate is determined using the Federal Reserve nominal rates forU.S. Treasury zero-coupon bonds with maturities similar to those of the expected term of the award beingvalued.
Expected Volatility — The Company estimates the expected volatility of its common stock at the grant dateusing a weighted-average of the Company’s historical volatility and implied volatility from traded options onthe Company’s common stock. A 50 basis point change in volatility would cause a 2 percent change to the fairvalue.
31
This line represents final trim and will not print

Expected Term — The expected term of options granted is estimated using historical exercise and post-vestingemployment termination patterns, which the Company believes are representative of future behavior. Changingthe expected term by one year changes the fair value by 8 to 9 percent depending on if the change was anincrease or decrease, respectively.
Dividend Yield — The expected dividend yield is derived from the Company’s historical experience. A 50 basispoint change to the dividend yield would change the fair value by approximately 6 percent.
Share-based compensation expense is recorded for those awards expected to vest using an estimatedforfeiture rate based on the Company’s historical pre-vesting forfeiture data, which it believes are representativeof future behavior, and periodically will revise those estimates in subsequent periods if actual forfeitures differfrom those estimates.
Legal Contingencies
The Company is exposed to various legal proceedings and claims arising in the ordinary course of business.The Company records a liability when a loss is probable and the amount of loss can be reasonably estimated.The accrual is recorded based on the reasonably estimable loss or range of loss. When no point of loss is morelikely than another, we record the lowest amount in the estimated range of loss and disclose the estimatedrange. In 2015, the Company recorded a pre-tax charge of $100 million related to its pension plan litigation.
There is significant judgment required in both the probability determination and as to whether an exposure canbe reasonably estimated. Management believes the accruals recorded in the Company’s consolidated financialstatements properly reflect loss exposures that are both probable and reasonably estimable. Due to theinherent uncertainty involved in making these estimates, actual results could differ from those estimates.
Pension and Postretirement Liabilities
Management reviews all assumptions used to determine its obligations for pension and postretirementliabilities annually with its independent actuaries, taking into consideration existing and future economicconditions and the Company’s intentions with regard to the plans. The assumptions used are:
Long-Term Rate of Return — The expected rate of return on plan assets is the long-term rate of return expectedto be earned on the plans’ assets and is recognized as a component of pension expense. The rate is based onthe plans’ weighted-average target asset allocation, as well as historical and future expected performance ofthose assets. The target asset allocation is selected to obtain an investment return that is sufficient to cover theexpected benefit payments and to reduce future contributions by the Company. The expected rate of return onplan assets is reviewed annually and revised, as necessary, to reflect changes in the financial markets and ourinvestment strategy. The weighted-average long-term rate of return used to determine 2015 pension expensewas 6.25 percent.
A decrease of 50 basis points in the weighted-average expected long-term rate of return would have increased2015 pension expense by approximately $3 million. The actual return on plan assets in a given year typicallydiffers from the expected long-term rate of return, and the resulting gain or loss is deferred and amortized intoexpense over the average life expectancy of the inactive participants.
Discount Rate — An assumed discount rate is used to measure the present value of future cash flow obligationsof the plans and the interest cost component of pension expense and postretirement income. The cash flowsare then discounted to their present value and an overall discount rate is determined. The discount rate isdetermined by reference to the Bond:Link interest rate model based upon a portfolio of highly ratedU.S. corporate bonds with individual bonds that are theoretically purchased to settle the plan’s anticipated cashoutflows. The discount rate selected to measure the present value of the Company’s Canadian benefitobligations was developed by using the plan’s bond portfolio indices, which match the benefit obligations. Theweighted-average discount rates used to determine the 2015 benefit obligations related to the Company’spension and postretirement plans was 4.1 percent for both.
32
This line represents final trim and will not print

Changing the weighted-average discount rate by 50 basis points would have changed the accumulated benefitobligation of the pension plans at January 30, 2016 by approximately $30 million and $33 million, depending onif the change was an increase or decrease, respectively. A decrease of 50 basis points in the weighted-averagediscount rate would have increased the accumulated benefit obligation on the postretirement plan byapproximately $1 million. Such a decrease would not have significantly changed 2015 pension expense orpostretirement income.
Trend Rate — The Company maintains two postretirement medical plans, one covering certain executiveofficers and key employees of the Company (‘‘SERP Medical Plan’’), and the other covering all other associates.With respect to the SERP Medical Plan, a one percent change in the assumed health care cost trend rate wouldchange this plan’s accumulated benefit obligation by approximately $2 million.
With respect to the postretirement medical plan covering all other associates, there is limited risk to theCompany for increases in health care costs since, beginning in 2001, new retirees have assumed the fullexpected costs and then-existing retirees have assumed all increases in such costs.
Mortality Assumptions — The mortality table used to determine the pension obligation in 2015 and 2014 wasthe RP 2000 mortality table with generational projection using scale AA for both males and females. Thismortality table was chosen after considering alternative tables including the RP 2014 table. We chose the RP2000 table because it resulted in the closest match to the Company’s actual experience. For the SERP MedicalPlan, the mortality assumption was updated to the RPH 2015 table with generational projection using MP 2015,which represents the most recent study from the Society of Actuaries. The RPH 2015 table with generationalprojection using MP 2014 was used in the prior year.
The Company expects to record postretirement income of approximately $1 million and pension expense ofapproximately $20 million in 2016.
Income Taxes
In accordance with U.S. GAAP, deferred tax assets are recognized for tax credit and net operating losscarryforwards, reduced by a valuation allowance, which is established when it is more likely than not that someportion or all of the deferred tax assets will not be realized. Management is required to estimate taxable incomefor future years by taxing jurisdiction and to use its judgment to determine whether or not to record a valuationallowance for part or all of a deferred tax asset. Estimates of taxable income are based upon the Company’sstrategic long-range plans. A one percent change in the Company’s overall statutory tax rate for 2015 wouldhave resulted in a change of $5 million to the carrying value of the net deferred tax asset and a correspondingcharge or credit to income tax expense depending on whether the tax rate change was a decrease or anincrease.
The Company has operations in multiple taxing jurisdictions and is subject to audit in these jurisdictions. Taxaudits by their nature are often complex and can require several years to resolve. Accruals of tax contingenciesrequire management to make estimates and judgments with respect to the ultimate outcome of tax audits.Actual results could vary from these estimates.
The Company expects its 2016 effective tax rate to approximate 36.5 percent, excluding the effect of anynonrecurring items that may occur. The actual tax rate will vary depending primarily on the level and mix ofincome earned in the United States as compared with its international operations.
Recent Accounting Pronouncements
Descriptions of the recently issued accounting principles, and the accounting principles adopted by theCompany during the year ended January 30, 2016, if any, are included in the Summary of Significant AccountingPolicies note in ‘‘Item 8. Consolidated Financial Statements and Supplementary Data.’’
33
This line represents final trim and will not print

Disclosure Regarding Forward-Looking Statements
This report contains forward-looking statements within the meaning of the federal securities laws. Other thanstatements of historical facts, all statements which address activities, events, or developments that theCompany anticipates will or may occur in the future, including, but not limited to, such things as future capitalexpenditures, expansion, strategic plans, financial objectives, dividend payments, stock repurchases, growth ofthe Company’s business and operations, including future cash flows, revenues, and earnings, and other suchmatters, are forward-looking statements. These forward-looking statements are based on many assumptionsand factors which are detailed in the Company’s filings with the Securities and Exchange Commission, includingthe effects of currency fluctuations, customer demand, fashion trends, competitive market forces, uncertaintiesrelated to the effect of competitive products and pricing, customer acceptance of the Company’s merchandisemix and retail locations, the Company’s reliance on a few key suppliers for a majority of its merchandisepurchases (including a significant portion from one key supplier), cybersecurity breaches, pandemics and similarmajor health concerns, unseasonable weather, deterioration of global financial markets, economic conditionsworldwide, deterioration of business and economic conditions, any changes in business, political and economicconditions due to the threat of future terrorist activities in the United States or in other parts of the world andrelated U.S. military action overseas, the ability of the Company to execute its business and strategic planseffectively with regard to each of its business units, and risks associated with global product sourcing, includingpolitical instability, changes in import regulations, and disruptions to transportation services and distribution.
For additional discussion on risks and uncertainties that may affect forward-looking statements, see ‘‘RiskFactors’’ in Part I, Item 1A. Any changes in such assumptions or factors could produce significantly differentresults. The Company undertakes no obligation to update forward-looking statements, whether as a result ofnew information, future events, or otherwise.
Item 7A. Quantitative and Qualitative Disclosures About Market Risk
Information regarding foreign exchange risk management is included in the Financial Instruments and RiskManagement note under ‘‘Item 8. Consolidated Financial Statements and Supplementary Data.’’
Item 8. Consolidated Financial Statements and Supplementary Data
The following Consolidated Financial Statements of the Company for the years ended January 30, 2016,January 31, 2015, and February 1, 2014 are included as part of this Report:
• Consolidated Statements of Operations for the Fiscal Years January 30, 2016, January 31, 2015, andFebruary 1, 2014.
• Consolidated Statements of Comprehensive Income for the Fiscal Years January 30, 2016, January 31,2015, and February 1, 2014.
• Consolidated Balance Sheets as of January 30, 2016 and January 31, 2015.
• Consolidated Statements of Shareholders’ Equity for the Fiscal Years January 30, 2016, January 31,2015, and February 1, 2014.
• Consolidated Statements of Cash Flows for the Fiscal Years January 30, 2016, January 31, 2015, andFebruary 1, 2014.
• Notes to the Consolidated Financial Statements.
34
This line represents final trim and will not print
REPORT OF INDEPENDENT REGISTERED PUBLIC ACCOUNTING FIRM
The Board of Directors and Shareholders ofFoot Locker, Inc.:
We have audited the accompanying consolidated balance sheets of Foot Locker, Inc. and subsidiaries as ofJanuary 30, 2016 and January 31, 2015, and the related consolidated statements of operations, comprehensiveincome, shareholders’ equity, and cash flows for each of the years in the three-year period ended January 30,2016. These consolidated financial statements are the responsibility of the Company’s management. Ourresponsibility is to express an opinion on these consolidated financial statements based on our audits.
We conducted our audits in accordance with the standards of the Public Company Accounting Oversight Board(United States). Those standards require that we plan and perform the audit to obtain reasonable assuranceabout whether the financial statements are free of material misstatement. An audit includes examining, on atest basis, evidence supporting the amounts and disclosures in the financial statements. An audit also includesassessing the accounting principles used and significant estimates made by management, as well as evaluatingthe overall financial statement presentation. We believe that our audits provide a reasonable basis for ouropinion.
In our opinion, the consolidated financial statements referred to above present fairly, in all material respects,the financial position of Foot Locker, Inc. and subsidiaries as of January 30, 2016 and January 31, 2015, and theresults of their operations and their cash flows for each of the years in the three-year period ended January 30,2016, in conformity with U.S. generally accepted accounting principles.
We also have audited, in accordance with the standards of the Public Company Accounting Oversight Board(United States), Foot Locker, Inc.’s internal control over financial reporting as of January 30, 2016, based oncriteria established in Internal Control — Integrated Framework (2013) issued by the Committee of SponsoringOrganizations of the Treadway Commission (COSO), and our report dated March 24, 2016 expressed anunqualified opinion on the effectiveness of the Company’s internal control over financial reporting.
/s/ KPMG
New York, New YorkMarch 24, 2016
35
This line represents final trim and will not print

FOOT LOCKER, INC.CONSOLIDATED STATEMENTS OF OPERATIONS
2015 2014 2013(in millions, except per share amounts)
Sales $7,412 $7,151 $6,505Cost of sales 4,907 4,777 4,372Selling, general and administrative expenses 1,415 1,426 1,334Depreciation and amortization 148 139 133Litigation, impairment and other charges 105 4 2Interest expense, net 4 5 5Other income (4) (9) (4)
6,575 6,342 5,842
Income before income taxes 837 809 663Income tax expense 296 289 234
Net income $ 541 $ 520 $ 429
Basic earnings per share $ 3.89 $ 3.61 $ 2.89Weighted-average shares outstanding 139.1 143.9 148.4
Diluted earnings per share $ 3.84 $ 3.56 $ 2.85Weighted-average shares outstanding, assuming dilution 140.8 146.0 150.5
See Accompanying Notes to Consolidated Financial Statements.
36
This line represents final trim and will not print

FOOT LOCKER, INC.CONSOLIDATED STATEMENTS OF COMPREHENSIVE INCOME
2015 2014 2013($ in millions)
Net income $541 $ 520 $429Other comprehensive income, net of income tax
Foreign currency translation adjustment:Translation adjustment arising during the period, net of income tax (44) (132) (25)
Cash flow hedges:Change in fair value of derivatives, net of income tax 5 (1) (5)
Pension and postretirement adjustments:Net actuarial gain (loss) and prior service cost and foreign currencyfluctuations arising during the year, net of income tax expense (benefit)of $(10), $(7) and $2 million, respectively (16) (8) 6
Amortization of net actuarial gain/loss and prior service cost included innet periodic benefit costs, net of income tax expense of $5, $4, and$5 million, respectively 8 8 9
Comprehensive income $494 $ 387 $414
See Accompanying Notes to Consolidated Financial Statements.
37
This line represents final trim and will not print

FOOT LOCKER, INC.CONSOLIDATED BALANCE SHEETS
2015 2014($ in millions)
ASSETS
Current assetsCash and cash equivalents $1,021 $ 967Merchandise inventories 1,285 1,250Other current assets 300 239
2,606 2,456Property and equipment, net 661 620Deferred taxes 234 221Goodwill 156 157Other intangible assets, net 45 49Other assets 73 74
$3,775 $3,577
LIABILITIES AND SHAREHOLDERS’ EQUITY
Current liabilitiesAccounts payable $ 279 $ 301Accrued and other liabilities 420 393Current portion of capital lease obligations 1 2
700 696Long-term debt and obligations under capital leases 129 132Other liabilities 393 253
Total liabilities 1,222 1,081Shareholders’ equity 2,553 2,496
$3,775 $3,577
See Accompanying Notes to Consolidated Financial Statements.
38
This line represents final trim and will not print
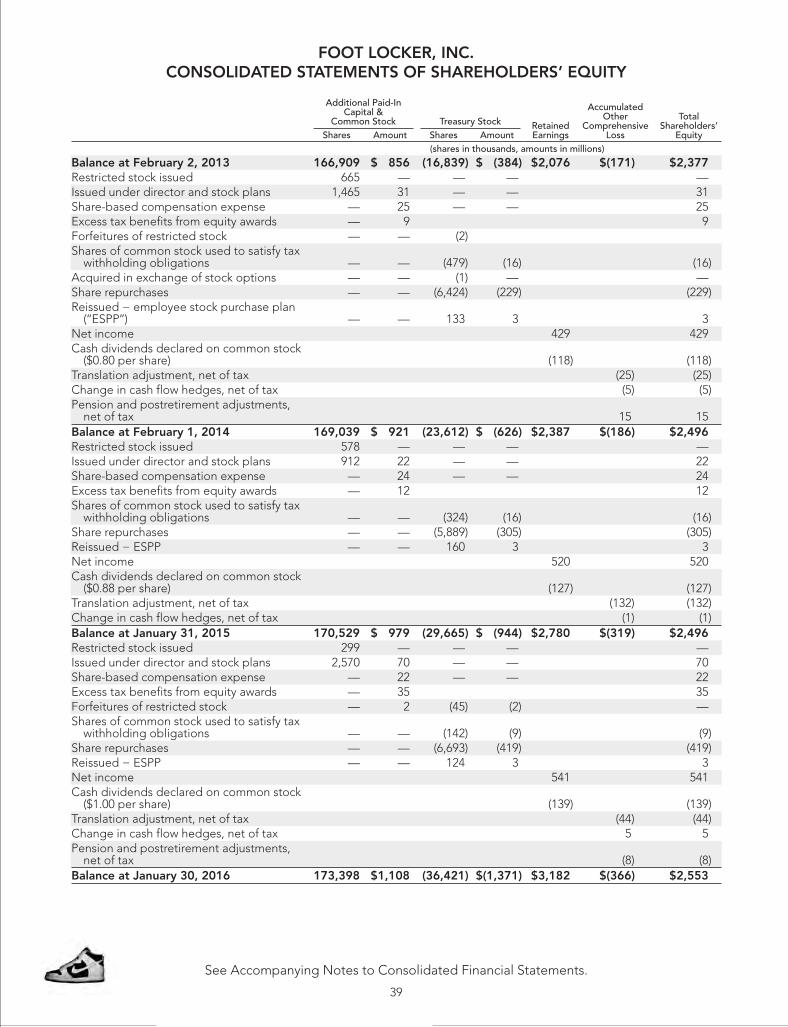
FOOT LOCKER, INC.CONSOLIDATED STATEMENTS OF SHAREHOLDERS’ EQUITY
Additional Paid-InCapital &
Common Stock Treasury Stock RetainedEarnings
AccumulatedOther
ComprehensiveLoss
TotalShareholders’
EquityShares Amount Shares Amount(shares in thousands, amounts in millions)
Balance at February 2, 2013 166,909 $ 856 (16,839) $ (384) $2,076 $(171) $2,377Restricted stock issued 665 — — — —Issued under director and stock plans 1,465 31 — — 31Share-based compensation expense — 25 — — 25Excess tax benefits from equity awards — 9 9Forfeitures of restricted stock — — (2)Shares of common stock used to satisfy taxwithholding obligations — — (479) (16) (16)
Acquired in exchange of stock options — — (1) — —Share repurchases — — (6,424) (229) (229)Reissued − employee stock purchase plan(‘‘ESPP’’) — — 133 3 3
Net income 429 429Cash dividends declared on common stock($0.80 per share) (118) (118)
Translation adjustment, net of tax (25) (25)Change in cash flow hedges, net of tax (5) (5)Pension and postretirement adjustments,net of tax 15 15
Balance at February 1, 2014 169,039 $ 921 (23,612) $ (626) $2,387 $(186) $2,496Restricted stock issued 578 — — — —Issued under director and stock plans 912 22 — — 22Share-based compensation expense — 24 — — 24Excess tax benefits from equity awards — 12 12Shares of common stock used to satisfy taxwithholding obligations — — (324) (16) (16)
Share repurchases — — (5,889) (305) (305)Reissued − ESPP — — 160 3 3Net income 520 520Cash dividends declared on common stock($0.88 per share) (127) (127)
Translation adjustment, net of tax (132) (132)Change in cash flow hedges, net of tax (1) (1)Balance at January 31, 2015 170,529 $ 979 (29,665) $ (944) $2,780 $(319) $2,496Restricted stock issued 299 — — — —Issued under director and stock plans 2,570 70 — — 70Share-based compensation expense — 22 — — 22Excess tax benefits from equity awards — 35 35Forfeitures of restricted stock — 2 (45) (2) —Shares of common stock used to satisfy taxwithholding obligations — — (142) (9) (9)
Share repurchases — — (6,693) (419) (419)Reissued − ESPP — — 124 3 3Net income 541 541Cash dividends declared on common stock($1.00 per share) (139) (139)
Translation adjustment, net of tax (44) (44)Change in cash flow hedges, net of tax 5 5Pension and postretirement adjustments,net of tax (8) (8)
Balance at January 30, 2016 173,398 $1,108 (36,421) $(1,371) $3,182 $(366) $2,553
See Accompanying Notes to Consolidated Financial Statements.
39
This line represents final trim and will not print
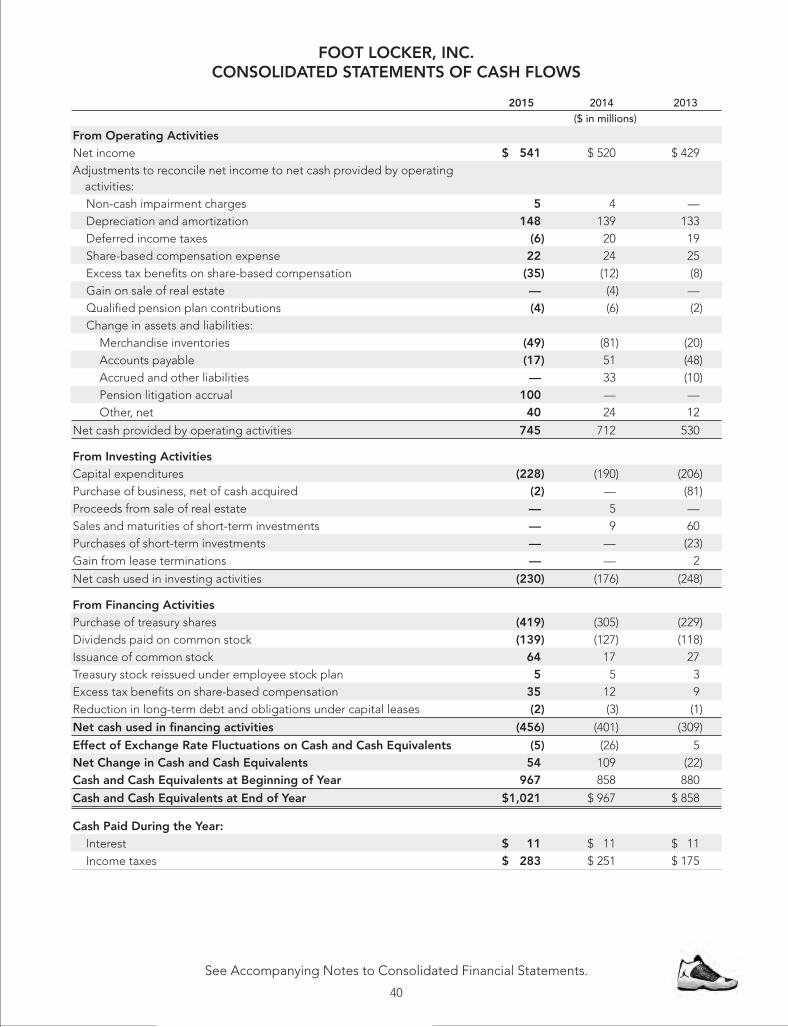
FOOT LOCKER, INC.CONSOLIDATED STATEMENTS OF CASH FLOWS
2015 2014 2013($ in millions)
From Operating ActivitiesNet income $ 541 $ 520 $ 429Adjustments to reconcile net income to net cash provided by operatingactivities:Non-cash impairment charges 5 4 —Depreciation and amortization 148 139 133Deferred income taxes (6) 20 19Share-based compensation expense 22 24 25Excess tax benefits on share-based compensation (35) (12) (8)Gain on sale of real estate — (4) —Qualified pension plan contributions (4) (6) (2)Change in assets and liabilities:
Merchandise inventories (49) (81) (20)Accounts payable (17) 51 (48)Accrued and other liabilities — 33 (10)Pension litigation accrual 100 — —Other, net 40 24 12
Net cash provided by operating activities 745 712 530
From Investing ActivitiesCapital expenditures (228) (190) (206)Purchase of business, net of cash acquired (2) — (81)Proceeds from sale of real estate — 5 —Sales and maturities of short-term investments — 9 60Purchases of short-term investments — — (23)Gain from lease terminations — — 2
Net cash used in investing activities (230) (176) (248)
From Financing ActivitiesPurchase of treasury shares (419) (305) (229)Dividends paid on common stock (139) (127) (118)Issuance of common stock 64 17 27Treasury stock reissued under employee stock plan 5 5 3Excess tax benefits on share-based compensation 35 12 9Reduction in long-term debt and obligations under capital leases (2) (3) (1)
Net cash used in financing activities (456) (401) (309)
Effect of Exchange Rate Fluctuations on Cash and Cash Equivalents (5) (26) 5Net Change in Cash and Cash Equivalents 54 109 (22)Cash and Cash Equivalents at Beginning of Year 967 858 880
Cash and Cash Equivalents at End of Year $1,021 $ 967 $ 858
Cash Paid During the Year:Interest $ 11 $ 11 $ 11Income taxes $ 283 $ 251 $ 175
See Accompanying Notes to Consolidated Financial Statements.
40
This line represents final trim and will not print

FOOT LOCKER, INC.NOTES TO CONSOLIDATED FINANCIAL STATEMENTS
1. Summary of Significant Accounting Policies
Basis of Presentation
The consolidated financial statements include the accounts of Foot Locker, Inc. and its domestic andinternational subsidiaries (the ‘‘Company’’), all of which are wholly owned. All significant intercompany amountshave been eliminated. The preparation of financial statements in conformity with U.S. generally acceptedaccounting principles requires management to make estimates and assumptions relating to the reporting ofassets and liabilities and the disclosure of contingent liabilities at the date of the financial statements, and thereported amounts of revenues and expenses during the reporting period. Actual results may differ from thoseestimates.
Reporting Year
The fiscal year end for the Company is the Saturday closest to the last day in January. Fiscal years 2015, 2014,and 2013 represented the 52 weeks ended January 30, 2016, January 31, 2015, and February 1, 2014,respectively. References to years in this annual report relate to fiscal years rather than calendar years.
Revenue Recognition
Revenue from retail stores is recognized at the point of sale when the product is delivered to customers. Internetand catalog sales revenue is recognized upon estimated receipt by the customer. Sales include shipping andhandling fees for all periods presented. Sales include merchandise, net of returns, and exclude taxes. TheCompany provides for estimated returns based on return history and sales levels. Revenue from layaway salesis recognized when the customer receives the product, rather than when the initial deposit is paid.
Gift Cards
The Company sells gift cards to its customers, which do not have expiration dates. Revenue from gift card salesis recorded when the gift cards are redeemed or when the likelihood of the gift card being redeemed by thecustomer is remote and there is no legal obligation to remit the value of unredeemed gift cards to the relevantjurisdictions, referred to as breakage. The Company has determined its gift card breakage rate based uponhistorical redemption patterns. Historical experience indicates that after 12 months, the likelihood ofredemption is deemed to be remote. Gift card breakage income is included in selling, general andadministrative expenses and unredeemed gift cards are recorded as a current liability. Gift card breakage was$5 million for 2015 and 2014, and $4 million for 2013.
Store Pre-Opening and Closing Costs
Store pre-opening costs are charged to expense as incurred. In the event a store is closed before its lease hasexpired, the estimated post-closing lease exit costs, less any sublease rental income, is provided for once thestore ceases to be used.
Advertising Costs and Sales Promotion
Advertising and sales promotion costs are expensed at the time the advertising or promotion takes place, netof reimbursements for cooperative advertising. Advertising expenses also include advertising costs as requiredby some of the Company’s mall-based leases. Cooperative advertising reimbursements earned for the launchand promotion of certain products agreed upon with vendors are recorded in the same period as the associatedexpenses are incurred.
41
This line represents final trim and will not print

FOOT LOCKER, INC.NOTES TO CONSOLIDATED FINANCIAL STATEMENTS
1. Summary of Significant Accounting Policies − (continued)
Reimbursement received in excess of expenses incurred related to specific, incremental, and identifiableadvertising costs, is accounted for as a reduction to the cost of merchandise, which is reflected in cost of salesas the merchandise is sold.
Advertising costs, which are included as a component of selling, general and administrative expenses, were asfollows:
2015 2014 2013($ in millions)
Advertising expenses $119 $125 $124Cooperative advertising reimbursements (19) (21) (22)
Net advertising expense $100 $104 $102
Catalog Costs
Catalog costs, which are primarily comprised of paper, printing, and postage, are capitalized and amortizedover the expected customer response period related to each catalog, which is generally 90 days. Cooperativereimbursements earned for the promotion of certain products are agreed upon with vendors and are recordedin the same period as the associated catalog expenses are amortized. Prepaid catalog costs were $2 millionand $3 million at January 30, 2016 and January 31, 2015, respectively.
Catalog costs, which are included as a component of selling, general and administrative expenses, were asfollows:
2015 2014 2013($ in millions)
Catalog costs $28 $32 $36Cooperative reimbursements (7) (7) (5)
Net catalog expense $21 $25 $31
Earnings Per Share
The Company accounts for and discloses earnings per share using the treasury stock method. Basic earningsper share is computed by dividing reported net income for the period by the weighted-average number ofcommon shares outstanding at the end of the period. Restricted stock awards, which contain non-forfeitablerights to dividends, are considered participating securities and are included in the calculation of basic earningsper share. Diluted earnings per share reflects the weighted-average number of common shares outstandingduring the period used in the basic earnings per share computation plus dilutive common stock equivalents.
The computation of basic and diluted earnings per share is as follows:
2015 2014 2013(in millions, except per share data)
Net Income $ 541 $ 520 $ 429
Weighted-average common shares outstanding 139.1 143.9 148.4Basic earnings per share $ 3.89 $ 3.61 $ 2.89
Weighted-average common shares outstanding 139.1 143.9 148.4Dilutive effect of potential common shares 1.7 2.1 2.1
Weighted-average common shares outstanding assuming dilution 140.8 146.0 150.5Diluted earnings per share $ 3.84 $ 3.56 $ 2.85
42
This line represents final trim and will not print

FOOT LOCKER, INC.NOTES TO CONSOLIDATED FINANCIAL STATEMENTS
1. Summary of Significant Accounting Policies − (continued)
Potential common shares include the dilutive effect of stock options and restricted stock units. Options topurchase 0.6 million shares of common stock for both January 30, 2016 and January 31, 2015, and 1.0 millionshares at February 1, 2014, were not included in the computations primarily because the exercise price of theoptions was greater than the average market price of the common shares and, therefore, the effect of theirinclusion would be antidilutive. Contingently issuable shares of 0.2 million, 0.3 million, and 0.2 million atJanuary 30, 2016, January 31, 2015, and February 1, 2014, respectively, have not been included as the vestingconditions have not been satisfied.
Share-Based Compensation
The Company recognizes compensation expense for share-based awards based on the grant date fair value ofthose awards. Additionally, stock-based compensation expense includes an estimate for pre-vesting forfeituresand expense is recognized on a straight-line basis over the requisite service period for each vesting tranche ofthe award. See Note 22, Share-Based Compensation, for information on the assumptions used to calculate thefair value of share-based compensation.
Upon exercise of stock options, issuance of restricted stock or units, or issuance of shares under the employeesstock purchase plan, the Company will issue authorized but unissued common stock or use common stock heldin treasury. The Company may make repurchases of its common stock from time to time, subject to legal andcontractual restrictions, market conditions, and other factors.
Cash and Cash Equivalents
Cash equivalents at January 30, 2016 and January 31, 2015 were $983 million and $930 million, respectively.Cash equivalents include amounts on demand with banks and all highly liquid investments with originalmaturities of three months or less, including money market funds. Additionally, amounts due from third-partycredit card processors for the settlement of debit and credit card transactions are included as cash equivalentsas they are generally collected within three business days.
Investments
Changes in the fair value of available-for-sale securities are reported as a component of accumulated othercomprehensive loss in the Consolidated Statements of Shareholders’ Equity and are not reflected in theConsolidated Statements of Operations until a sale transaction occurs or when declines in fair value aredeemed to be other-than-temporary. The Company routinely reviews available-for-sale securities forother-than-temporary declines in fair value below the cost basis, and when events or changes in circumstancesindicate the carrying value of a security may not be recoverable, the security is written down to fair value. As ofJanuary 30, 2016, the Company held $6 million of available-for-sale securities, which represented the Company’sauction rate security. See Note 20, Fair Value Measurements, for further discussion of these investments.
Merchandise Inventories and Cost of Sales
Merchandise inventories for the Company’s Athletic Stores are valued at the lower of cost or market using theretail inventory method. Cost for retail stores is determined on the last-in, first-out (‘‘LIFO’’) basis for domesticinventories and on the first-in, first-out (‘‘FIFO’’) basis for international inventories. Merchandise inventories ofthe Direct-to-Customers business are valued at the lower of cost or market using weighted-average cost, whichapproximates FIFO.
43
This line represents final trim and will not print

FOOT LOCKER, INC.NOTES TO CONSOLIDATED FINANCIAL STATEMENTS
1. Summary of Significant Accounting Policies − (continued)
The retail inventory method is commonly used by retail companies to value inventories at cost and calculategross margins due to its practicality. Under the retail inventory method, cost is determined by applying acost-to-retail percentage across groupings of similar items, known as departments. Thecost-to-retail percentage is applied to ending inventory at its current owned retail valuation to determine thecost of ending inventory on a department basis. The Company provides reserves based on current sellingprices when the inventory has not been marked down to market. Transportation, distribution center, andsourcing costs are capitalized in merchandise inventories. The Company expenses the freight associated withtransfers between its store locations in the period incurred. The Company maintains an accrual for shrinkagebased on historical rates.
Cost of sales is comprised of the cost of merchandise, as well as occupancy, buyers’ compensation, andshipping and handling costs. The cost of merchandise is recorded net of amounts received from suppliers fordamaged product returns, markdown allowances, and volume rebates, as well as cooperative advertisingreimbursements received in excess of specific, incremental advertising expenses. Occupancy costs include theamortization of amounts received from landlords for tenant improvements.
Property and Equipment
Property and equipment are recorded at cost, less accumulated depreciation and amortization. Significantadditions and improvements to property and equipment are capitalized. Depreciation and amortization arecomputed on a straight-line basis over the following estimated useful lives:
Buildings Maximum of 50 yearsLeasehold improvements 10 years or term of lease, if shorterFurniture, fixtures, and equipment 3 − 10 yearsSoftware 2 − 7 years
Maintenance and repairs are charged to current operations as incurred. Major renewals or replacements thatsubstantially extend the useful life of an asset are capitalized and depreciated.
Internal-Use Software Development Costs
TheCompany capitalizes certain external and internal computer software and software development costs incurredduring the application development stage. The application development stage generally includes software designand configuration, coding, testing, and installation activities. Capitalized costs include only external direct cost ofmaterials and services consumed in developing or obtaining internal-use software, and payroll and payroll-relatedcosts for employees who are directly associated with and devote time to the internal-use software project.Capitalization of such costs ceases no later than the point at which the project is substantially complete and readyfor its intended use. Training and maintenance costs are expensed as incurred, while upgrades and enhancementsare capitalized if it is probable that such expenditures will result in additional functionality. Capitalized software, netof accumulated amortization, is included as a component of property and equipment and was $46 million and$39 million at January 30, 2016 and January 31, 2015, respectively.
Recoverability of Long-Lived Tangible Assets
The Company performs an impairment review when circumstances indicate that the carrying value of long-livedtangible assets may not be recoverable. Management’s policy in determining whether an impairment indicatorexists, a triggering event, comprises measurable operating performance criteria at the division level, as well asqualitative measures. The Company considers historical performance and future estimated results, which arepredominately identified from the Company’s strategic long-range plans, in its evaluation of potentialstore-level impairment and then compares the carrying amount of the asset with the estimated future cashflows expected to result from the use of the asset. If the carrying amount of the asset exceeds the estimatedexpected undiscounted future cash flows, the Company measures the amount of the impairment by comparingthe carrying amount of the asset with its estimated fair value. The estimation of fair value is measured by
44
This line represents final trim and will not print

FOOT LOCKER, INC.NOTES TO CONSOLIDATED FINANCIAL STATEMENTS
1. Summary of Significant Accounting Policies − (continued)
discounting expected future cash flows at the Company’s weighted-average cost of capital. The Companyestimates fair value based on the best information available using estimates, judgments, and projections asconsidered necessary.
Goodwill and Other Intangible Assets
Goodwill and intangible assets with indefinite lives are reviewed for impairment annually during the first quarterof each fiscal year or more frequently if impairment indicators arise.
The review of goodwill impairment consists of either using a qualitative approach to determine whether it is morelikely than not that the fair value of the assets is less than their respective carrying values or a two-step impairmenttest, if necessary. If, based on the results of the qualitative assessment, it is concluded that it is not more likely thannot that the fair value of the intangible asset is greater than its carrying value, the two-step test is performed toidentify potential impairment. If it is determined that it is not more likely than not that the fair value of the reportingunit is less than its carrying value, it is unnecessary to perform the two-step impairment test.
Based on certain circumstances, we may elect to bypass the qualitative assessment and proceed directly toperforming the first step of the two-step impairment test. The first step of the two-step goodwill impairmenttest compares the fair value of the reporting unit to its carrying amount, including goodwill. The second stepincludes hypothetically valuing all the tangible and intangible assets of the reporting unit as if the reporting unithad been acquired in a business combination. Then, the implied fair value of the reporting unit’s goodwill iscompared to the carrying amount of that goodwill. If the carrying value of the asset exceeds its fair value, animpairment loss is recognized in the amount of the excess. The fair value of each reporting unit is determinedusing a combination of market and discounted cash flow approaches.
Intangible assets that are determined to have finite lives are amortized over their useful lives and are measuredfor impairment only when events or changes in circumstances indicate that the carrying value may be impaired.Intangible assets with indefinite lives are tested for impairment if impairment indicators arise and, at a minimum,annually. The impairment review for intangible assets with indefinite lives consists of either performing aqualitative or a quantitative assessment. If the results of the qualitative assessment indicate that it is more likelythan not that the fair value of the indefinite-lived intangible is less than its carrying amount, or if we elect toproceed directly to a quantitative assessment, we calculate the fair value using a discounted cash flow method,based on the relief from royalty concept, and compare the fair value to the carrying value to determine if theasset is impaired.
Derivative Financial Instruments
All derivative financial instruments are recorded in the Company’s Consolidated Balance Sheets at their fairvalues. For derivatives designated as a hedge, and effective as part of a hedge transaction, the effective portionof the gain or loss on the hedging derivative instrument is reported as a component of other comprehensiveincome/loss or as a basis adjustment to the underlying hedged item and reclassified to earnings in the periodin which the hedged item affects earnings. The effective portion of the gain or loss on hedges of foreign netinvestments is generally not reclassified to earnings unless the net investment is disposed of. To the extentderivatives do not qualify or are not designated as hedges, or are ineffective, their changes in fair value arerecorded in earnings immediately, which may subject the Company to increased earnings volatility.
Fair Value
The Company categorizes its financial instruments into a three-level fair value hierarchy that prioritizes theinputs to valuation techniques used to measure fair value into three broad levels. The fair value hierarchy givesthe highest priority to quoted prices in active markets for identical assets or liabilities (Level 1) and the lowestpriority to unobservable inputs (Level 3). If the inputs used to measure fair value fall within different levels of thehierarchy, the category level is based on the lowest priority level input that is significant to the fair valuemeasurement of the instrument. Fair value is determined based upon the exit price that would be received to
45
This line represents final trim and will not print

FOOT LOCKER, INC.NOTES TO CONSOLIDATED FINANCIAL STATEMENTS
1. Summary of Significant Accounting Policies − (continued)
sell an asset or paid to transfer a liability in an orderly transaction between market participants exclusive of anytransaction costs. The Company’s financial assets recorded at fair value are categorized as follows:
Level 1 — Quoted prices for identical instruments in active markets.
Level 2 — Quoted prices for similar instruments in active markets; quoted prices for identical or similarinstruments in markets that are not active; and model-derived valuations in which all significant inputs orsignificant value-drivers are observable in active markets.
Level 3 — Model-derived valuations in which one or more significant inputs or significant value-drivers areunobservable.
Income Taxes
The Company accounts for its income taxes under the asset and liability method, which requires the recognitionof deferred tax assets and liabilities for the expected future tax consequences of events that have been includedin the financial statements. Under this method, deferred tax assets and liabilities are determined on the basisof the differences between the financial statements and the tax basis of assets and liabilities using enacted taxrates in effect for the year in which the differences are expected to reverse. The effect of a change in tax rateson deferred tax assets and liabilities is recognized in income in the period that includes the enactment date.
Deferred tax assets are recognized for tax credits and net operating loss carryforwards, reduced by a valuationallowance, which is established when it is more likely than not that some portion or all of the deferred tax assetswill not be realized. The effect on deferred tax assets and liabilities of a change in tax rates is recognized inincome in the period that includes the enactment date.
The Company recognizes net deferred tax assets to the extent that it believes these assets are more likely thannot to be realized. In making such a determination, the Company considers all available positive and negativeevidence, including future reversals of existing taxable temporary differences, projected future taxable income,tax-planning strategies, and results of recent operations. If the Company determines that it would be able torealize its deferred tax assets in the future in excess of their net recorded amount, the Company would make anadjustment to the deferred tax asset valuation allowance, which would reduce the provision for income taxes.
A taxing authority may challenge positions that the Company adopted in its income tax filings. Accordingly, theCompany may apply different tax treatments for transactions in filing its income tax returns than for income taxfinancial reporting. The Company regularly assesses its tax positions for such transactions and records reservesfor those differences when considered necessary. Tax positions are recognized only when it is more likely thannot, based on technical merits, that the positions will be sustained upon examination. Tax positions that meetthe more-likely-than-not threshold are measured using a probability weighted approach as the largest amountof tax benefit that is greater than fifty percent likely of being realized upon settlement. Whether themore-likely-than-not recognition threshold is met for a tax position is a matter of judgment based on theindividual facts and circumstances of that position evaluated in light of all available evidence. The Companyrecognizes interest and penalties related to unrecognized tax benefits within income tax expense in theaccompanying Consolidated Statement of Operations. Accrued interest and penalties are included within therelated tax liability line in the Consolidated Balance Sheet. Provision for U.S. income taxes on undistributedearnings of foreign subsidiaries is made only on those amounts in excess of the funds considered to bepermanently reinvested.
Pension and Postretirement Obligations
The discount rate for the U.S. plans is determined by reference to the Bond:Link interest rate model basedupon a portfolio of highly rated U.S. corporate bonds with individual bonds that are theoretically purchased tosettle the plan’s anticipated cash outflows. The cash flows are discounted to their present value and an overalldiscount rate is determined. The discount rate selected to measure the present value of the Company’s
46
This line represents final trim and will not print

FOOT LOCKER, INC.NOTES TO CONSOLIDATED FINANCIAL STATEMENTS
1. Summary of Significant Accounting Policies − (continued)
Canadian benefit obligations was developed by using the plan’s bond portfolio indices, which match thebenefit obligations. The Company measures its plan assets and benefit obligations using the month-end datethat is closest to our fiscal year end.
Insurance Liabilities
The Company is primarily self-insured for health care, workers’ compensation, and general liability costs.Accordingly, provisions are made for the Company’s actuarially determined estimates of discounted futureclaim costs for such risks, for the aggregate of claims reported and claims incurred but not yet reported.Self-insured liabilities totaled $13 million at both January 30, 2016 and January 31, 2015. The Companydiscounts its workers’ compensation and general liability reserves using a risk-free interest rate. Imputedinterest expense related to these liabilities was not significant for any of the periods presented.
Accounting for Leases
The Company recognizes rent expense for operating leases as of the possession date for store leases or thecommencement of the agreement for a non-store lease. Rental expense, inclusive of rent holidays, concessions,and tenant allowances are recognized over the lease term on a straight-line basis. Contingent payments basedupon sales and future increases determined by inflation related indices cannot be estimated at the inception ofthe lease and accordingly, are charged to operations as incurred.
Foreign Currency Translation
The functional currency of the Company’s international operations is the applicable local currency. Thetranslation of the applicable foreign currency into U.S. dollars is performed for balance sheet accounts usingcurrent exchange rates in effect at the balance sheet date and for revenue and expense accounts using theweighted-average rates of exchange prevailing during the year. The unearned gains and losses resulting fromsuch translation are included as a separate component of accumulated other comprehensive loss withinshareholders’ equity.
Recent Accounting Pronouncements
In November 2015, the Financial Accounting Standards Board (‘‘FASB’’) issued Accounting Standards Update(‘‘ASU’’) 2015-17, Income Taxes (Topic 740): Balance Sheet Classification of Deferred Taxes. This amendmentchanges how deferred taxes are recognized by eliminating the requirement of presenting deferred tax liabilitiesand assets as current and noncurrent on the balance sheet. Instead, the requirement will be to classify alldeferred tax liabilities and assets as noncurrent. ASU 2015-17 is effective for annual reporting periods beginningafter December 15, 2016, including interim periods within that reporting period, with earlier adoptionpermitted. ASU 2015-17 can be adopted either prospectively or retrospectively to all periods presented. TheCompany plans on early adopting ASU 2015-17 prospectively during fiscal year 2016. The adoption of thisguidance is not expected to have an effect on our results of operations or cash flows, as this represents only achange in balance sheet classification.
In February 2016, the FASB issued ASU 2016-02, Leases. This ASU revises the existing guidance related toleases by requiring lessees to recognize a lease liability and a right-of-use asset for all leases. This ASU alsorequires additional disclosure regarding leasing arrangements. This standard will be effective for fiscal yearsbeginning after December 15, 2018, including interim periods within those fiscal years, and requires a modifiedretrospective adoption, with earlier adoption permitted. The Company is currently evaluating the impact of theadoption of this ASU on its consolidated financial statements.
47
This line represents final trim and will not print

FOOT LOCKER, INC.NOTES TO CONSOLIDATED FINANCIAL STATEMENTS
1. Summary of Significant Accounting Policies − (continued)
Other recently issued accounting pronouncements did not, or are not believed by management to, have amaterial effect on the Company’s present or future consolidated financial statements.
2. Acquisitions
On August 3, 2015, the Company completed an insignificant asset acquisition from Futura Sport AG for totalconsideration of $2 million. The assets acquired include store fixtures, lease agreements, and inventory for10 Runners Point and Sidestep franchise stores in Switzerland. The purchase price allocation has beencompleted as of January 30, 2016.
3. Segment Information
The Company has determined that its reportable segments are those that are based on its method of internalreporting. As of January 30, 2016, the Company has two reportable segments, Athletic Stores andDirect-to-Customers. The accounting policies of both segments are the same as those described in theSummary of Significant Accounting Policies note. The Company evaluates performance based on severalfactors, of which the primary financial measure is division results. Division profit reflects income before incometaxes, pension litigation charge, corporate expense, non-operating income, and net interest expense.
2015 2014 2013
($ in millions)
Sales
Athletic Stores $6,468 $6,286 $5,790
Direct-to-Customers 944 865 715
Total sales $7,412 $7,151 $6,505
Operating Results
Athletic Stores(1) $ 872 $ 777 $ 656
Direct-to-Customers(2) 142 109 84
Division profit 1,014 886 740
Less: Pension litigation charge 100 — —
Less: Corporate expense(3) 77 81 76
Operating profit 837 805 664
Interest expense, net 4 5 5
Other income 4 9 4
Income before income taxes $ 837 $ 809 $ 663
(1) Included in the results for 2015, 2014, and 2013 are impairment and other charges of $4 million, $2 million, and $2 million, respectively.The 2015 amount reflects charges to write-down long-lived store assets of Runners Point. The 2014 amount reflected impairmentcharges to fully write-down the value of certain trade names. The 2013 amounts were incurred in connection with the closure ofCCS stores. See Note 4, Litigation, Impairment and Other Charges for additional information.
(2) Included in the results for 2015 is a $1 million non-cash impairment charge relating to an ecommerce trade name. The 2014 amountreflected non-cash impairment charges of $2 million related to the CCS trade name. See Note 4, Litigation, Impairment and OtherCharges for additional information.
(3) Corporate expense for all years presented reflects the reallocation of expense between corporate and the operating divisions. Basedupon annual internal studies of corporate expense, the allocation of such expenses to the operating divisions was increased by$5 million for 2015, $4 million for 2014, and $27 million for 2013 thereby reducing corporate expense.
48
This line represents final trim and will not print

FOOT LOCKER, INC.NOTES TO CONSOLIDATED FINANCIAL STATEMENTS
3. Segment Information − (continued)
Depreciationand Amortization Capital Expenditures(1) Total Assets
2015 2014 2013 2015 2014 2013 2015 2014 2013
($ in millions)
Athletic Stores $130 $119 $112 $181 $151 $163 $2,612 $2,499 $2,398
Direct-to-Customers 7 7 9 7 9 5 330 315 320
137 126 121 188 160 168 2,942 2,814 2,718
Corporate 11 13 12 40 30 38 833 763 769
Total Company $148 $139 $133 $228 $190 $206 $3,775 $3,577 $3,487
(1) Reflects cash capital expenditures for all years presented.
Sales and long-lived asset information by geographic area as of and for the fiscal years ended January 30, 2016,January 31, 2015, and February 1, 2014 are presented in the following tables. Sales are attributed to the countryin which the sales transaction is fulfilled. Long-lived assets reflect property and equipment.
2015 2014 2013($ in millions)
SalesUnited States $5,305 $4,976 $4,567International 2,107 2,175 1,938Total sales $7,412 $7,151 $6,505
2015 2014 2013
($ in millions)
Long-Lived Assets
United States $486 $446 $394
International 175 174 196
Total long-lived assets $661 $620 $590
For the year ended January 30, 2016, the countries that comprised the majority of the sales and long-livedassets for the international category were Germany, Italy, Canada, and France. No other individual countryincluded in the international category is significant.
4. Litigation, Impairment and Other Charges2015 2014 2013
($ in millions)
Pension litigation charge $100 $ — $ —Impairment of long-lived assets 4 — —Other intangible asset impairments 1 4 —CCS store closure costs — — 2
Total litigation, impairment and other charges $105 $ 4 $ 2
During the third quarter of 2015, the Company recorded a $100 million pension litigation charge. Please seeNote 23, Legal Proceedings for further information.
49
This line represents final trim and will not print

FOOT LOCKER, INC.NOTES TO CONSOLIDATED FINANCIAL STATEMENTS
4. Litigation, Impairment and Other Charges − (continued)
During 2015, the Company evaluated the long-lived assets of Runners Point and Sidestep for impairment andrecorded a non-cash charge of $4 million to write-down store fixtures and leasehold improvements for 61 stores.As a result of the impairment review related to long-lived assets, the Company performed a review of otherintangible assets and recorded a non-cash impairment charge of $1 million, which was recorded to fully writedown the value of an ecommerce trade name reflecting a decline in sales as the Company has shifted awayfrom the use of this website.
In connection with the Company’s former CCS ecommerce business, the Company recorded charges of$2 million in each of 2014 and 2013. The 2014 charge represented impairment of the CCS trade name to its fairvalue, which was realized upon sale during 2014. The 2013 charge represented costs associated with the closureof CCS stores. Also during 2014, the Company recorded additional intangible asset impairment chargestotaling $2 million related to the full write down of the trade name related to stores in the Republic of Irelandand a full write down of the value of a private-label brand acquired as part of the Runners Point Groupacquisition, to reflect the exit of this product line.
5. Other Income
Other income includes non-operating items, such as: gains from insurance recoveries; discounts/premiumspaid on the repurchase and retirement of bonds; royalty income; and the changes in fair value, premiums paid,realized gains associated with foreign currency option contracts and property sales. Other income was$4 million in 2015, $9 million in 2014, and $4 million in 2013.
For 2015, other income includes a $2 million insurance recovery related to a business interruption claim and$2 million of royalty income. For 2014, it included a $4 million gain on a sale of property, $2 million of royaltyincome, $2 million of realized gain associated with foreign currency option contracts, and $1 million of leasetermination gains related to the sales of leasehold interests. Other income in 2013 represented $2 million ofroyalty income and $2 million related to lease termination gains.
6. Merchandise Inventories2015 2014
($ in millions)
LIFO inventories $ 847 $ 821FIFO inventories 438 429
Total merchandise inventories $1,285 $1,250
The value of the Company’s LIFO inventories, as calculated on a LIFO basis, approximates their value ascalculated on a FIFO basis.
7. Other Current Assets2015 2014
($ in millions)
Net receivables $ 94 $ 78Prepaid rent 81 77Prepaid income taxes 66 34Prepaid expenses and other current assets 33 32Deferred taxes and costs 22 17Fair value of derivative contracts 3 —Income tax receivable 1 1
$300 $239
50
This line represents final trim and will not print

FOOT LOCKER, INC.NOTES TO CONSOLIDATED FINANCIAL STATEMENTS
8. Property and Equipment, Net2015 2014
($ in millions)
Land $ 4 $ 4Buildings:
Owned 43 44Furniture, fixtures, equipment and software development costs:
Owned 954 900Assets under capital leases 8 9
1,009 957Less: accumulated depreciation (640) (606)
369 351Alterations to leased and owned buildings
Cost 804 779Less: accumulated amortization (512) (510)
292 269
$ 661 $ 620
9. Goodwill
The Athletic Stores segment’s goodwill is net of accumulated impairment charges of $167 million for all periodspresented. The 2015 and 2014 annual goodwill impairment tests did not result in an impairment charge.
AthleticStores
Direct-to-Customers Total($ in millions)
Goodwill at February 1, 2014 $ 21 $ 142 $ 163Foreign currency translation adjustment (4) (2) (6)Goodwill at January 31, 2015 $ 17 $ 140 $ 157Foreign currency translation adjustment — (1) (1)Goodwill at January 30, 2016 $17 $139 $156
10. Other Intangible Assets, netJanuary 30, 2016 Wtd. Avg.
Life inYears(2)
January 31, 2015
($ in millions)Grossvalue
Accum.amort.
NetValue
Grossvalue
Accum.amort.
NetValue
Amortized intangible assets:(1)
Lease acquisition costs $119 $(107) $12 10.0 $128 $(116) $12Trademarks/trade names 20 (12) 8 20.0 21 (12) 9Favorable leases 7 (5) 2 7.8 7 (4) 3
$146 $(124) $22 13.8 $156 $(132) $24Indefinite life intangible assets:(1)
Runners Point Group trademarks/tradenames(3) 23 25
$23 $25Other intangible assets, net $45 $49
(1) The movements in the ending balances also reflect the effect of foreign currency fluctuations due primarily to the movements of theeuro in relation to the U.S. dollar.
(2) The weighted-average useful life is as of January 30, 2016 and excludes those assets that are fully amortized.
(3) Includes non-cash impairment charges of $1 million recorded in both 2015 and 2014. These impairment charges are described morefully in Note 4, Litigation, Impairment and Other Charges.
51
This line represents final trim and will not print

FOOT LOCKER, INC.NOTES TO CONSOLIDATED FINANCIAL STATEMENTS
10. Other Intangible Assets, net − (continued)
Amortizing intangible assets primarily represent lease acquisition costs, which are amounts that are required tosecure prime lease locations and other lease rights, primarily in Europe. Amortizing intangible assets decreasedby $2 million in 2015, which reflects additions of $3 million related to new leases in Europe and theUnited States, partially offset by $1 million in foreign currency fluctuations. Amortization expense for intangiblessubject to amortization was $4 million, $6 million, and $11 million for 2015, 2014, and 2013, respectively.
Estimated future amortization expense for finite lived intangibles for the next five years is as follows:
($ in millions)2016 $42017 32018 32019 32020 3
11. Other Assets2015 2014
($ in millions)
Restricted cash(1) $22 $22Deferred tax costs 12 5Pension asset 8 13Auction rate security 6 6Funds deposited in insurance trust(2) 4 4Other 21 24
$73 $74
(1) Restricted cash is comprised of amounts held in escrow in connection with various leasing arrangements in Europe.
(2) The Company is required by its insurers to collateralize part of the self-insured workers’ compensation and liability claims. TheCompany has chosen to satisfy these collateral requirements by depositing funds in insurance trusts.
12. Accrued and Other Liabilities2015 2014
($ in millions)
Current deferred tax liabilities $ 62 $ 48Taxes other than income taxes 56 56Other payroll and payroll related costs, excluding taxes 54 54Customer deposits(1) 46 44Incentive bonuses 46 51Income taxes payable 39 10Property and equipment(2) 27 49Other 90 81
$420 $393
(1) Customer deposits include unredeemed gift cards and certificates, merchandise credits, and deferred revenue related to undeliveredmerchandise, including layaway sales.
(2) Accruals for property and equipment are properly excluded from the statements of cash flows for all years presented.
52
This line represents final trim and will not print

FOOT LOCKER, INC.NOTES TO CONSOLIDATED FINANCIAL STATEMENTS
13. Revolving Credit Facility
On January 27, 2012, the Company entered into an amended and restated credit agreement (the ‘‘2011Restated Credit Agreement’’) with its banks. The 2011 Restated Credit Agreement provides for a $200 millionasset based revolving credit facility maturing on January 27, 2017. In addition, during the term of the 2011Restated Credit Agreement, the Company may make up to four requests for additional credit commitments inan aggregate amount not to exceed $200 million. Interest is based on the LIBOR rate in effect at the time of theborrowing plus a 1.25 to 1.50 percent margin depending on certain provisions as defined in the 2011 RestatedCredit Agreement.
The 2011 Restated Credit Agreement provides for a security interest in certain of the Company’s domesticassets, including certain inventory assets, but excluding intellectual property. The Company is not required tocomply with any financial covenants as long as there are no outstanding borrowings. With regard to thepayment of dividends and share repurchases, there are no restrictions if the Company is not borrowing and thepayments are funded through cash on hand. If the Company is borrowing, Availability as of the end of eachfiscal month during the subsequent projected six fiscal months following the payment must be at least20 percent of the lesser of the Aggregate Commitments and the Borrowing Base (all terms as defined in the2011 Restated Credit Agreement).
The Company uses the credit facility to support standby letters of credit in connection with insurance programs.The letters of credit outstanding as of January 30, 2016 were not significant. Deferred financing fees areamortized over the life of the facility on a straight-line basis, which is comparable to the interest method. Theunamortized balance at January 30, 2016 is $1 million. The quarterly facility fees paid on the unused portion was0.25 percent for both 2015 and 2014. There were no short-term borrowings during 2015 or 2014. Interestexpense, including facility fees, related to the revolving credit facility was $1 million for all years presented.
14. Long-Term Debt and Obligations Under Capital Leases2015 2014
($ in millions)
8.5% debentures payable 2022 $118 $118Unamortized gain related to interest rate swaps(1) 11 12Obligations under capital leases 1 4
$130 $134Less: current portion of obligations under capital leases 1 2
$129 $132
(1) In 2009, the Company terminated an interest rate swap at a gain. This gain is being amortized as part of interest expense over theremaining term of the debt using the effective-yield method.
Interest expense related to long-term debt and the amortization of the associated debt issuance costs was$9 million for all years presented.
Maturities of long-term debt and minimum rent payments under capital leases in future periods are:
Long-TermDebt
CapitalLeases Total
($ in millions)
2016 $ — $ 1 $ 12017 − 2020 — — —Thereafter 118 — 118
$118 $ 1 $119Less: Imputed interest — — —
Current portion — 1 1
$118 $ — $118
53
This line represents final trim and will not print

FOOT LOCKER, INC.NOTES TO CONSOLIDATED FINANCIAL STATEMENTS
15. Other Liabilities2015 2014
($ in millions)
Straight-line rent liability $155 $124Pension litigation liability 100 —Pension benefits 69 46Income taxes 22 24Postretirement benefits 13 18Deferred taxes 13 14Workers’ compensation and general liability reserves 8 9Other 13 18
$393 $253
16. Leases
The Company is obligated under operating leases for almost all of its store properties. Some of the store leasescontain renewal options with varying terms and conditions. Management expects that in the normal course ofbusiness, expiring leases will generally be renewed or, upon making a decision to relocate, replaced by leaseson other premises. Operating lease periods generally range from 5 to 10 years.
Certain leases provide for additional rent payments based on a percentage of store sales. Also, most of theCompany’s leases require the payment of certain executory costs such as insurance, maintenance, and othercosts in addition to the future minimum lease payments. These costs, including the amortization of lease rights,totaled $137 million in 2015, $132 million in 2014, and $128 million in 2013.
Included in the amounts below, are non-store expenses that totaled $18 million in 2015, $17 million in 2014, and$16 million in 2013.
2015 2014 2013($ in millions)
Minimum rent $618 $615 $580Contingent rent based on sales 27 25 22Sublease income (5) (5) (2)
$640 $635 $600
Future minimum lease payments under non-cancellable operating leases, net of future non-cancellableoperating sublease payments, are:
($ in millions)
2016 $ 5742017 5422018 4902019 4452020 406Thereafter 1,648
Total operating lease commitments $4,105
54
This line represents final trim and will not print

FOOT LOCKER, INC.NOTES TO CONSOLIDATED FINANCIAL STATEMENTS
17. Accumulated Other Comprehensive Loss
Accumulated other comprehensive loss, net of tax, is comprised of the following:
2015 2014 2013($ in millions)
Foreign currency translation adjustments $(119) $ (75) $ 57Cash flow hedges 2 (3) (2)Unrecognized pension cost and postretirement benefit (248) (240) (240)Unrealized loss on available-for-sale security (1) (1) (1)
$(366) $(319) $(186)
The changes in accumulated other comprehensive loss for the period ended January 30, 2016 were as follows:
($ in millions)
ForeignCurrencyTranslationAdjustments
Cash FlowHedges
ItemsRelated
to Pensionand
PostretirementBenefits
UnrealizedLoss on
Available-For-Sale Security Total
Balance as of January 31, 2015 $ (75) $ (3) $(240) $ (1) $(319)OCI before reclassification (44) 5 (16) — (55)Reclassified from AOCI — — 8 — 8
Other comprehensive income/(loss) (44) 5 (8) — (47)
Balance as of January 30, 2016 $(119) $ 2 $(248) $ (1) $(366)
Reclassifications from accumulated other comprehensive loss for the period ended January 30, 2016 were asfollows:
($ in millions)
Amortization of actuarial (gain) loss:Pension benefits − amortization of actuarial loss $14Postretirement benefits − amortization of actuarial gain (1)
Net periodic benefit cost (see Note 21) 13Income tax benefit 5
Net of tax $ 8
18. Income Taxes
The domestic and international components of pre-tax income are as follows:
2015 2014 2013($ in millions)
Domestic $668 $654 $558International 169 155 105
Total pre-tax income $837 $809 $663
55
This line represents final trim and will not print

FOOT LOCKER, INC.NOTES TO CONSOLIDATED FINANCIAL STATEMENTS
18. Income Taxes − (continued)
The income tax provision consists of the following:
2015 2014 2013($ in millions)
Current:Federal $212 $195 $164State and local 37 34 26International 53 40 25
Total current tax provision 302 269 215
Deferred:Federal (8) 16 13State and local (1) 3 5International 3 1 1
Total deferred tax provision (6) 20 19
Total income tax provision $296 $289 $234
Provision has been made in the accompanying Consolidated Statements of Operations for additional incometaxes applicable to dividends received or expected to be received, if any, from international subsidiaries. Theamount of unremitted earnings of international subsidiaries for which no such tax is provided and which isconsidered to be permanently reinvested in the subsidiaries totaled $1,087 million and $999 million atJanuary 30, 2016 and January 31, 2015, respectively. The determination of the amount of the deferred taxliability related to permanently reinvested earnings is not practicable.
A reconciliation of the significant differences between the federal statutory income tax rate and the effectiveincome tax rate on pre-tax income is as follows:
2015 2014 2013
Federal statutory income tax rate 35.0% 35.0% 35.0%State and local income taxes, net of federal tax benefit 2.8 3.2 3.5International income taxed at varying rates (2.1) (1.9) (1.6)Foreign tax credits (2.8) (2.5) (2.5)Domestic/foreign tax settlements (0.1) (0.6) (1.1)Federal tax credits (0.2) (0.2) (0.2)Other, net 2.8 2.7 2.2
Effective income tax rate 35.4% 35.7% 35.3%
56
This line represents final trim and will not print

FOOT LOCKER, INC.NOTES TO CONSOLIDATED FINANCIAL STATEMENTS
18. Income Taxes − (continued)
Deferred income taxes are provided for the effects of temporary differences between the amounts of assetsand liabilities recognized for financial reporting purposes and the amounts recognized for income tax purposes.Items that give rise to significant portions of the Company’s deferred tax assets and deferred tax liabilities areas follows:
2015 2014($ in millions)
Deferred tax assets:Tax loss/credit carryforwards and capital loss $ 8 $ 9Employee benefits 97 65Property and equipment 121 137Straight-line rent 39 33Other 34 38
Total deferred tax assets 299 282Valuation allowance (5) (6)
Total deferred tax assets, net $294 $276
Deferred tax liabilities:Merchandise inventories 104 96Goodwill and other intangible assets 20 17Other 6 1
Total deferred tax liabilities $130 $114
Net deferred tax asset $164 $162
Balance Sheet caption reported in:Deferred taxes $234 $221Other current assets 5 3Accrued and other current liabilities (62) (48)Other liabilities (13) (14)
$164 $162
Based upon the level of historical taxable income and projections for future taxable income, which are based uponthe Company’s strategic long-range plans, over the periods in which the temporary differences are anticipated toreverse, management believes it is more likely than not that the Company will realize the benefits of thesedeductible differences, net of the valuation allowances at January 30, 2016. However, the amount of the deferredtax asset considered realizable could be adjusted in the future if estimates of taxable income are revised.
As of January 30, 2016, the Company has a valuation allowance of $5 million to reduce its deferred tax assetsto an amount that is more likely than not to be realized. A valuation allowance of $3 million relates to thedeferred tax assets arising from a capital loss associated with an impairment of the Northern Group notereceivable in 2008. The Company does not anticipate realizing capital gains to utilize the capital loss associatedwith the note receivable impairment. A valuation allowance of $2 million was recorded against tax losscarryforwards of certain foreign entities. Based on the history of losses and the absence of prudent and feasiblebusiness plans for generating future taxable income in certain foreign entities, the Company believes it is morelikely than not that the benefit of these loss carryforwards will not be realized.
At January 30, 2016, the Company has state operating loss carryforwards with a potential tax benefit of$2 million that expire between 2021 and 2035. The Company will have, when realized, a capital loss with apotential benefit of $3 million arising from a note receivable. This loss will carryforward for 5 years afterrealization. The Company has U.S. state credits of $1 million that expire in 2024. The Company has internationaloperating loss carryforwards with a potential tax benefit of $2 million, a portion of which will expire between2016 and 2034 and a portion of which will never expire. The state and international operating loss carryforwardsdo not include unrecognized tax benefits.
57
This line represents final trim and will not print

FOOT LOCKER, INC.NOTES TO CONSOLIDATED FINANCIAL STATEMENTS
18. Income Taxes − (continued)
The Company operates in multiple taxing jurisdictions and is subject to audit. Audits can involve complexissues that may require an extended period of time to resolve. A taxing authority may challenge positions thatthe Company has adopted in its income tax filings. Accordingly, the Company may apply different taxtreatments for transactions in filing its income tax returns than for income tax financial reporting. The Companyregularly assesses its tax positions for such transactions and records reserves for those differences.
The Company’s U.S. Federal income tax filings have been examined by the Internal Revenue Service through2014. The Company is participating in the IRS’s Compliance Assurance Process (‘‘CAP’’) for 2015, which isexpected to conclude during 2016. The Company has started the CAP for 2016. Due to the recent utilization ofnet operating loss carryforwards, the Company is subject to state and local tax examinations effectivelyincluding years from 1996 to the present. To date, no adjustments have been proposed in any audits that willhave a material effect on the Company’s financial position or results of operations.
At January 30, 2016 and January 31, 2015, the Company had $38 million and $40 million, respectively of grossunrecognized tax benefits, and $37 million and $39 million, respectively, of net unrecognized tax benefits thatwould, if recognized, affect the Company’s annual effective tax rate. The Company has classified certain incometax liabilities as current or noncurrent based on management’s estimate of when these liabilities will be settled.Interest expense and penalties related to unrecognized tax benefits are classified as income tax expense.Interest was not significant for any of the periods presented. The Company recognized $1 million of interestincome in 2013. The total amount of accrued interest and penalties was $2 million in 2015, 2014, and 2013.
The following table summarizes the activity related to unrecognized tax benefits:
2015 2014 2013($ in millions)
Unrecognized tax benefits at beginning of year $40 $48 $54Foreign currency translation adjustments (2) (6) (4)Increases related to current year tax positions 4 3 3Increases related to prior period tax positions 2 1 4Decreases related to prior period tax positions — (1) (2)Settlements (1) (1) (7)Lapse of statute of limitations (5) (4) —
Unrecognized tax benefits at end of year $38 $40 $48
It is reasonably possible that the liability associated with the Company’s unrecognized tax benefits will increaseor decrease within the next twelve months. These changes may be the result of foreign currency fluctuations,ongoing audits or the expiration of statutes of limitations. Settlements could increase earnings in an amountranging from $0 to $5 million based on current estimates. Audit outcomes and the timing of audit settlementsare subject to significant uncertainty. Although management believes that adequate provision has been madefor such issues, the ultimate resolution could have an adverse effect on the earnings of the Company.Conversely, if these issues are resolved favorably in the future, the related provision would be reduced,generating a positive effect on earnings. Due to the uncertainty of amounts and in accordance with itsaccounting policies, the Company has not recorded any potential impact of these settlements.
58
This line represents final trim and will not print

FOOT LOCKER, INC.NOTES TO CONSOLIDATED FINANCIAL STATEMENTS
19. Financial Instruments and Risk Management
The Company operates internationally and utilizes certain derivative financial instruments to mitigate its foreigncurrency exposures, primarily related to third-party and intercompany forecasted transactions. As a result of theuse of derivative instruments, the Company is exposed to the risk that counterparties will fail to meet theircontractual obligations. To mitigate this counterparty credit risk, the Company has a practice of entering intocontracts only with major financial institutions selected based upon their credit ratings and other financialfactors. The Company monitors the creditworthiness of counterparties throughout the duration of the derivativeinstrument.
Additional information is contained within Note 20, Fair Value Measurements.
Derivative Holdings Designated as Hedges
For a derivative to qualify as a hedge at inception and throughout the hedged period, the Company formallydocuments the nature of the hedged items and the relationships between the hedging instruments and thehedged items, as well as its risk-management objectives, strategies for undertaking the various hedgetransactions, and the methods of assessing hedge effectiveness and ineffectiveness. In addition, for hedges offorecasted transactions, the significant characteristics and expected terms of a forecasted transaction must bespecifically identified, and it must be probable that each forecasted transaction would occur. If it were deemedprobable that the forecasted transaction would not occur, the gain or loss on the derivative instrument wouldbe recognized in earnings immediately. No such gains or losses were recognized in earnings for any of theperiods presented. Derivative financial instruments qualifying for hedge accounting must maintain a specifiedlevel of effectiveness between the hedging instrument and the item being hedged, both at inception andthroughout the hedged period, which management evaluates periodically.
The primary currencies to which the Company is exposed are the euro, British pound, Canadian dollar, andAustralian dollar. For the most part, merchandise inventories are purchased by each geographic area in theirrespective local currency. The exception to this is the United Kingdom, whose merchandise inventory purchasesare denominated in euros.
For option and foreign exchange forward contracts designated as cash flow hedges of the purchase ofinventory, the effective portion of gains and losses is deferred as a component of Accumulated OtherComprehensive Loss (‘‘AOCL’’) and is recognized as a component of cost of sales when the related inventory issold. The amount reclassified to cost of sales related to such contracts was not significant for any of the periodspresented.
The effective portion of gains or losses associated with other forward contracts is deferred as a component ofAOCL until the underlying transaction is reported in earnings. The ineffective portion of gains and losses relatedto cash flow hedges recorded to earnings was not significant for any of the periods presented. When using aforward contract as a hedging instrument, the Company excludes the time value of the contract from theassessment of effectiveness. As of January 30, 2016, all of the Company’s hedged forecasted transactions areless than twelve months, and the Company expects all derivative-related amounts reported in AOCL to bereclassified to earnings within twelve months. During 2015, the net change in the fair value of the foreignexchange derivative financial instruments designated as cash flow hedges of the purchase of inventory resultedin a gain of $5 million and therefore decreased AOCL, this resulted in a gain of $2 million included in AOCL asof January 30, 2016.
The notional value of the contracts outstanding at January 30, 2016 was $72 million and these contracts matureat various dates through January 2017.
59
This line represents final trim and will not print

FOOT LOCKER, INC.NOTES TO CONSOLIDATED FINANCIAL STATEMENTS
19. Financial Instruments and Risk Management − (continued)
Derivative Holdings Not Designated as Hedges
The Company enters into foreign exchange forward contracts that are not designated as hedges in order tomanage the costs of foreign currency-denominated merchandise purchases and intercompany transactions.Changes in the fair value of these foreign exchange forward contracts are recorded in earnings immediatelywithin selling, general and administrative expenses. The net change in fair value was $1 million in 2015, was notsignificant for 2014, and was $1 million for 2013. The notional value of the contracts outstanding at January 30,2016 was $13 million, and these contracts mature at various dates through March 2016.
The Company mitigates the effect of fluctuating foreign exchange rates on the reporting of foreigncurrency-denominated earnings by entering into currency option contracts. Changes in the fair value of theseforeign currency option contracts, which are not designated as hedges, are recorded in earnings immediatelywithin other income. The realized gains, premiums paid, and changes in the fair market value recorded werenot significant for 2015, and was $1 million for 2014. There were no contracts outstanding at January 30, 2016.
Additionally, the Company enters into diesel fuel forward and option contracts to mitigate a portion of theCompany’s freight expense due to the variability caused by fuel surcharges imposed by our third-party freightcarriers. Changes in the fair value of these contracts are recorded in earnings immediately. The effect was notsignificant for any of the periods presented. The notional value of the diesel fuel forward contracts outstandingat January 30, 2016 was $1 million and these contracts mature at various dates through May 2016.
Fair Value of Derivative Contracts
The following represents the fair value of the Company’s derivative contracts. Many of the Company’sagreements allow for a netting arrangement. The following is presented on a gross basis, by type of contract:
($ in millions) Balance Sheet Caption 2015 2014
Hedging Instruments:Foreign exchange forward contracts Current assets $ 3 $ —Foreign exchange forward contracts Current liabilities $ — $ 4Non-hedging Instruments:Foreign exchange forward contracts Current liabilities $ — $ 1
Notional Values and Foreign Currency Exchange Rates
The table below presents the notional amounts for all outstanding derivatives and the weighted-averageexchange rates of foreign exchange forward contracts at January 30, 2016:
Contract Value($ in millions)
Weighted-AverageExchange Rate
InventoryBuy €/Sell British £ $72 0.7359IntercompanyBuy €/Sell British £ $11 0.7298Buy US/Sell CAD $ 2 1.4080Diesel fuel forwards $ 1 —
Business Risk
The retailing business is highly competitive. Price, quality, selection of merchandise, reputation, store location,advertising, and customer service are important competitive factors in the Company’s business. The Companyoperates in 23 countries and purchased approximately 90 percent of its merchandise in 2015 from its top 5suppliers. In 2015, the Company purchased approximately 72 percent of its athletic merchandise from one
60
This line represents final trim and will not print

FOOT LOCKER, INC.NOTES TO CONSOLIDATED FINANCIAL STATEMENTS
19. Financial Instruments and Risk Management − (continued)
major supplier, Nike, Inc. (‘‘Nike’’), and approximately 11 percent from another major supplier. Each of ouroperating divisions is highly dependent on Nike; they individually purchased 55 to 82 percent of theirmerchandise from Nike.
Included in the Company’s Consolidated Balance Sheet at January 30, 2016, are the net assets of the Company’sEuropean operations, which total $904 million and are located in 19 countries, 11 of which have adopted theeuro as their functional currency.
20. Fair Value Measurements
The following table provides a summary of the recognized assets and liabilities that are measured at fair valueon a recurring basis:
As of January 30, 2016 As of January 31, 2015($ in millions)
Level 1 Level 2 Level 3 Level 1 Level 2 Level 3AssetsAvailable-for-sale securities $ — $ 6 $ — $ — $ 6 $ —Foreign exchange forward contracts — 3 — — — —Total Assets $ — $ 9 $ — $ — $ 6 $ —
LiabilitiesForeign exchange forward contracts — — — — 5 —Total Liabilities $ — $ — $ — $ — $ 5 $ —
Securities classified as available-for-sale are recorded at fair value with unrealized gains and losses reported,net of tax, in other comprehensive income, unless unrealized losses are determined to be other than temporary.The fair value of the auction rate security is determined by using quoted prices for similar instruments in activemarkets and accordingly is classified as a Level 2 instrument.
The Company’s derivative financial instruments are valued using market-based inputs to valuation models.These valuation models require a variety of inputs, including contractual terms, market prices, yield curves, andmeasures of volatility and therefore are classified as Level 2 instruments.
There were no transfers into or out of Level 1, Level 2, or Level 3 assets and liabilities for any of the periodspresented.
The carrying value and estimated fair value of long-term debt and obligations under capital leases were asfollows:
2015 2014($ in millions)
Carrying value $130 $134Fair value $156 $163
The fair value of long-term debt is determined by using model-derived valuations in which all significant inputsor significant value-drivers are observable in active markets and therefore are classified as Level 2.
The carrying values of cash and cash equivalents, short-term investments, and other current receivables andpayables approximate their fair value.
61
This line represents final trim and will not print

FOOT LOCKER, INC.NOTES TO CONSOLIDATED FINANCIAL STATEMENTS
21. Retirement Plans and Other Benefits
Pension and Other Postretirement Plans
The Company has defined benefit pension plans covering certain of its North American employees, which arefunded in accordance with the provisions of the laws where the plans are in effect. In addition, the Company hasa defined benefit plan for certain individuals of Runners Point Group. The Company also sponsorspostretirement medical and life insurance plans, which are available to most of its retired U.S. employees.These plans are contributory and are not funded. The measurement date of the assets and liabilities is themonth-end date that is closest to our fiscal year end. The following tables set forth the plans’ changes in benefitobligations and plan assets, funded status, and amounts recognized in the Consolidated Balance Sheets, as ofJanuary 30, 2016 and January 31, 2015:
Pension Benefits Postretirement Benefits
2015 2014 2015 2014
($ in millions)
Change in benefit obligation
Benefit obligation at beginning of year $722 $674 $ 19 $ 15
Service cost 17 15 — —
Interest cost 24 28 1 1
Plan participants’ contributions — — 1 2
Actuarial (gain) loss (39) 67 (5) 4
Foreign currency translation adjustments (6) (9) — —
Benefits paid (51) (53) (2) (3)
Benefit obligation at end of year $667 $722 $ 14 $ 19
Change in plan assets
Fair value of plan assets at beginning of year $686 $650
Actual (loss) return on plan assets (34) 90
Employer contributions 8 9
Foreign currency translation adjustments (7) (10)
Benefits paid (51) (53)
Fair value of plan assets at end of year $602 $686
Funded status $ (65) $ (36) $(14) $ (19)
Amounts recognized on the balance sheet:
Other assets $ 8 $ 13 $ — $ —
Accrued and other liabilities (4) (3) (1) (1)
Other liabilities (69) (46) (13) (18)
$ (65) $ (36) $(14) $ (19)
Amounts recognized in accumulated othercomprehensive loss, pre-tax:
Net loss (gain) $410 $394 $(10) $ (6)
Prior service cost 1 1 — —
$411 $395 $(10) $ (6)
62
This line represents final trim and will not print

FOOT LOCKER, INC.NOTES TO CONSOLIDATED FINANCIAL STATEMENTS
21. Retirement Plans and Other Benefits − (continued)
As of January 30, 2016 and January 31, 2015, the Canadian qualified pension plan’s assets exceeded itsaccumulated benefit obligation. Information for those pension plans with an accumulated benefit obligation inexcess of plan assets is as follows:
2015 2014
($ in millions)
Projected benefit obligation $617 $662
Accumulated benefit obligation 617 662
Fair value of plan assets 544 613
The following tables set forth the changes in accumulated other comprehensive loss (pre-tax) at January 30,2016:
PensionBenefits
PostretirementBenefits
($ in millions)
Net actuarial loss (gain) at beginning of year $394 $ (6)
Amortization of net (loss) gain (14) 1
Loss (gain) arising during the year 34 (5)
Foreign currency fluctuations (4) —
Net actuarial loss (gain) at end of year (1) $410 $(10)
Net prior service cost at end of year (2) 1 —
Total amount recognized $411 $(10)
(1) The amounts in accumulated other comprehensive loss that are expected to be recognized as components of net periodic benefitcost (income) during the next year are approximately $14 million and $(2) million related to the pension and postretirement plans,respectively.
(2) The net prior service cost did not change during the year and is not expected to change significantly during the next year.
The following weighted-average assumptions were used to determine the benefit obligations under the plans:
Pension Benefits Postretirement Benefits
2015 2014 2015 2014
Discount rate 4.1% 3.4% 4.1% 3.4%
Rate of compensation increase 3.7% 3.7%
Pension expense is actuarially calculated annually based on data available at the beginning of each year. Theexpected return on plan assets is determined by multiplying the expected long-term rate of return on assets bythe market-related value of plan assets for the U.S. qualified pension plan and market value for the Canadianqualified pension plan. The market-related value of plan assets is a calculated value that recognizes investmentgains and losses in fair value related to equities over three or five years, depending on which computationresults in a market-related value closer to market value. Market-related value for the U.S. qualified plan was$604 million and $557 million for 2015 and 2014, respectively.
63
This line represents final trim and will not print

FOOT LOCKER, INC.NOTES TO CONSOLIDATED FINANCIAL STATEMENTS
21. Retirement Plans and Other Benefits − (continued)
Assumptions used in the calculation of net benefit cost include the discount rate selected and disclosed at theend of the previous year as well as other assumptions detailed in the table below:
Pension Benefits Postretirement Benefits2015 2014 2013 2015 2014 2013
Discount rate 3.4% 4.3% 3.8% 3.4% 4.2% 3.7%Rate of compensationincrease 3.7% 3.7% 3.7%
Expected long-term rate ofreturn on assets 6.1% 6.3% 6.2%
The expected long-term rate of return on invested plan assets is based on the plans’ weighted-average targetasset allocation, as well as historical and future expected performance of those assets. The target assetallocation is selected to obtain an investment return that is sufficient to cover the expected benefit paymentsand to reduce future contributions by the Company.
The components of net benefit expense (income) are:
Pension Benefits Postretirement Benefits
2015 2014 2013 2015 2014 2013
($ in millions)
Service cost $ 17 $ 15 $ 14 $ — $ — $ —
Interest cost 24 28 25 1 1 1
Expected return on planassets (39) (38) (39) — — —
Amortization of net loss (gain) 14 15 17 (1) (3) (3)
Net benefit expense (income) $ 16 $ 20 $ 17 $ — $ (2) $ (2)
Beginning with 2001, new retirees were charged the expected full cost of the medical plan and then-existingretirees will incur 100 percent of the expected future increases in medical plan costs. Any changes in the healthcare cost trend rates assumed would not affect the accumulated benefit obligation or net benefit income, sinceretirees will incur 100 percent of such expected future increases.
The Company maintains a Supplemental Executive Retirement Plan (‘‘SERP’’), which is an unfunded plan thatincludes provisions for the continuation of medical and dental insurance benefits to certain executive officersand other key employees of the Company (‘‘SERP Medical Plan’’). The SERP Medical Plan’s accumulatedprojected benefit obligation at January 30, 2016 was approximately $11 million. The following initial andultimate cost trend rate assumptions were used to determine the benefit obligations under the SERP MedicalPlan:
Medical Trend Rate Dental Trend Rate2015 2014 2013 2015 2014 2013
Initial cost trend rate 7.0% 7.0% 7.0% 5.0% 5.0% 5.0%Ultimate cost trend rate 5.0% 5.0% 5.0% 5.0% 5.0% 5.0%Year that the ultimate cost trend rateis reached 2021 2019 2018 2016 2015 2014
64
This line represents final trim and will not print

FOOT LOCKER, INC.NOTES TO CONSOLIDATED FINANCIAL STATEMENTS
21. Retirement Plans and Other Benefits − (continued)
The following initial and ultimate cost trend rate assumptions were used to determine the net periodic costunder the SERP Medical Plan:
Medical Trend Rate Dental Trend Rate2015 2014 2013 2015 2014 2013
Initial cost trend rate 7.0% 7.0% 7.5% 5.0% 5.0% 5.0%Ultimate cost trend rate 5.0% 5.0% 5.0% 5.0% 5.0% 5.0%Year that the ultimate cost trend rate
is reached 2019 2018 2018 2015 2014 2013
A one percentage-point change in the assumed health care cost trend rates would have the following effectson the SERP Medical Plan:
1% Increase 1% (Decrease)($ in millions)
Effect on total service and interest cost components $ — $ —Effect on accumulated postretirement benefit obligation 2 (2)
In 2014 and 2015, the Company used the RP 2000 mortality table with generational projection using scale AAfor both males and females. The RP 2000 table was selected because it resulted in the closest match to theCompany’s actual experience. For the SERP Medical Plan, the mortality assumption was updated in 2015 to theRPH 2015 table with generational projection using MP 2015, while in the prior year period we used the RP 2014table with generational projection using MP 2014.
Plan Assets
The target composition of the Company’s Canadian qualified pension plan assets is 95 percent fixed-incomesecurities and 5 percent equity. The Company believes that plan assets are invested in a prudent manner withthe same overall objective and investment strategy as noted below for the U.S. pension plan. The bondportfolio is comprised of government and corporate bonds chosen to match the duration of the pension plan’sbenefit payment obligations. This current asset allocation will limit future volatility with regard to the fundedstatus of the plan. This allocation has resulted in higher pension expense due to the lower long-term rate ofreturn associated with fixed-income securities.
The target composition of the Company’s U.S. qualified pension plan assets was 60 percent fixed-income securities,36.5 percent equity, and 3.5 percent real estate investment trust. The Company may alter the targets from time totime depending on market conditions and the funding requirements of the pension plan. This current assetallocation is expected to limit volatility with regard to the funded status of the plan, but will result in higher pensionexpense due to the lower long-term rate of return associated with fixed-income securities. Due to marketconditions and other factors, actual asset allocations may vary from the target allocation outlined above.
The Company believes that plan assets are invested in a prudent manner with an objective of providing a totalreturn that, over the long term, provides sufficient assets to fund benefit obligations, taking into account theCompany’s expected contributions and the level of risk deemed appropriate. The Company’s investmentstrategy seeks to utilize asset classes with differing rates of return, volatility, and correlation in order to reducerisk by providing diversification relative to equities. Diversification within asset classes is also utilized to ensurethat there are no significant concentrations of risk in plan assets and to reduce the effect that the return on anysingle investment may have on the entire portfolio.
65
This line represents final trim and will not print

FOOT LOCKER, INC.NOTES TO CONSOLIDATED FINANCIAL STATEMENTS
21. Retirement Plans and Other Benefits − (continued)
Valuation of Investments
Significant portions of plan assets are invested in commingled trust funds. These funds are valued at the netasset value of units held by the plan at year end. Stocks traded on U.S. and Canadian security exchanges arevalued at closing market prices on the measurement date.
The fair values of the Company’s Canadian pension plan assets at January 30, 2016 and January 31, 2015 wereas follows:
Level 1 Level 2 Level 32015Total
2014Total*
($ in millions)Cash and cash equivalents $ — $ 2 $ — $ 2 $ 3Equity securities:
Canadian and international(1) 4 — — 4 5Fixed-income securities:
Cash matched bonds(2) — 52 — 52 65Total assets at fair value $ 4 $54 $ — $58 $73
* Each category of plan assets is classified within the same level of the fair value hierarchy for 2015 and 2014.
(1) This category comprises one mutual fund that invests primarily in a diverse portfolio of Canadian securities.
(2) This category consists of fixed-income securities, including strips and coupons, issued or guaranteed by the Government of Canada,provinces or municipalities of Canada including their agencies and crown corporations, as well as other governmental bonds andcorporate bonds.
No Level 3 assets were held by the Canadian pension plan during 2015 and 2014.
The fair values of the Company’s U.S. pension plan assets at January 30, 2016 and January 31, 2015 were asfollows:
Level 1 Level 2 Level 32015Total
2014Total*
($ in millions)Cash and cash equivalents $ — $ 1 $ — $ 1 $ 1
Equity securities:U.S. large-cap(1) — 93 — 93 102U.S. mid-cap(1) — 26 — 26 31International(2) — 61 — 61 71Corporate stock(3) 27 — — 27 21
Fixed-income securities:Long duration corporate and government
bonds(4) — 217 — 217 254Intermediate duration corporate and
government bonds(5) — 99 — 99 110
Other types of investments:Real estate securities(6) — 17 — 17 20Insurance contracts — 1 — 1 1
Other(7) — 2 — 2 2Total assets at fair value $ 27 $517 $ — $544 $613
* Each category of plan assets is classified within the same level of the fair value hierarchy for 2015 and 2014.
(1) These categories consist of various managed funds that invest primarily in common stocks, as well as other equity securities and acombination of other funds.
66
This line represents final trim and will not print

FOOT LOCKER, INC.NOTES TO CONSOLIDATED FINANCIAL STATEMENTS
21. Retirement Plans and Other Benefits − (continued)
(2) This category comprises three managed funds that invest primarily in international common stocks, as well as other equity securitiesand a combination of other funds.
(3) This category consists of the Company’s common stock. The increase from the prior year is due to price appreciation. No additionalstock was contributed during the year.
(4) This category consists of various fixed-income funds that invest primarily in long-term bonds, as well as a combination of other funds,that together are designed to exceed the performance of related long-term market indices.
(5) This category consists of two fixed-income funds that invest primarily in intermediate duration bonds, as well as a combination ofother funds, that together are designed to exceed the performance of related indices.
(6) This category consists of one fund that invests in global real estate securities.
(7) This category consists primarily of cash related to net pending trade purchases and sales.
No Level 3 assets were held by the U.S. pension plan during 2015 and 2014.
During 2015, the Company made a contribution of $4 million to its U.S. qualified pension plan. Subsequent toyear end, in February 2016, the Company contributed $25 million to its U.S. qualified pension plan. TheCompany continuously evaluates the amount and timing of any future contributions. Future contributions aredependent on several factors, including the outcome of the ongoing U.S. pension litigation. See Note 23, LegalProceedings, for further information. During 2015, the Company also paid $4 million in pension benefits relatedto its non-qualified pension plans.
Estimated future benefit payments for each of the next five years and the five years thereafter are as follows:
PensionBenefits
PostretirementBenefits
($ in millions)2016 $ 71 $12017 54 12018 52 12019 51 12020 50 12021 − 2025 231 3
Savings Plans
The Company has two qualified savings plans, a 401(k) plan that is available to employees whose primary placeof employment is the U.S., and an another plan that is available to employees whose primary place ofemployment is in Puerto Rico. Both plans limit participation to employees who have attained at least the ageof twenty-one and have completed one year of service consisting of at least 1,000 hours. As of January 1, 2016,the savings plans allow eligible employees to contribute up to 40 percent of their compensation on a pre-taxbasis, subject to a maximum of $18,000 for the U.S. plan and $15,000 for the Puerto Rico plan. The Companymatches 25 percent of employees’ pre-tax contributions on up to the first 4 percent of the employees’compensation (subject to certain limitations). Matching contributions made before January 1, 2016 were madewith Company stock. Matching contributions made after January 1, 2016 will be made in cash. Such matchingcontributions are vested incrementally over the first 5 years of participation for both plans. The charge tooperations for the Company’s matching contribution was $3 million for all years presented.
67
This line represents final trim and will not print

FOOT LOCKER, INC.NOTES TO CONSOLIDATED FINANCIAL STATEMENTS
22. Share-Based Compensation
Stock Awards
Under the Company’s 2007 Stock Incentive Plan (the ‘‘2007 Stock Plan’’), stock options, restricted stock,restricted stock units, stock appreciation rights, or other stock-based awards may be granted to officers andother employees of the Company, including its subsidiaries and operating divisions worldwide. Nonemployeedirectors are also eligible to receive awards under this plan. Options for employees become exercisable insubstantially equal annual installments over a three-year period, beginning with the first anniversary of the dateof grant of the option, unless a shorter or longer duration is established at the time of the option grant. Optionsfor nonemployee directors become exercisable one year from the date of grant. The options terminate up toten years from the date of grant. On May 21, 2014, the 2007 Stock Plan was amended to increase the numberof shares of the Company’s common stock reserved for all awards to 14 million shares. As of January 30, 2016,there were 13,038,597 shares available for issuance under this plan.
Employees Stock Purchase Plan
Under the Company’s 2013 Foot Locker Employees Stock Purchase Plan (‘‘ESPP’’), participating employees areable to contribute up to 10 percent of their annual compensation, not to exceed $25,000 in any plan year,through payroll deductions to acquire shares of the Company’s common stock at 85 percent of the lower marketprice on one of two specified dates in each plan year. Of the 3,000,000 shares of common stock authorizedunder this plan, 996 participating employees purchased 124,494 shares in 2015, and 958 participatingemployees purchased 160,859 shares in 2014. As of January 30, 2016, there were 2,714,647 shares available forpurchase under this plan.
Share-Based Compensation Expense
Total compensation expense included in SG&A and the associated tax benefits recognized related to theCompany’s share-based compensation plans were as follows:
2015 2014 2013($ in millions)
Options and shares purchased under the employee stock purchase plan $11 $13 $12Restricted stock and restricted stock units 11 11 13Total share-based compensation expense $22 $24 $25Tax benefit recognized $ 8 $ 7 $ 8Excess income tax benefit from settled equity-classified share-based awardsreported as a cash flow from financing activities $35 $12 $ 9
Valuation Model and Assumptions
The Company uses a Black-Scholes option-pricing model to estimate the fair value of share-based awards. TheBlack-Scholes option-pricing model incorporates various and highly subjective assumptions, includingexpected term and expected volatility.
The Company estimates the expected term of share-based awards granted using the Company’s historicalexercise and post-vesting employment termination patterns, which it believes are representative of futurebehavior. The expected term for the employee stock purchase plan valuation is based on the length of eachpurchase period as measured at the beginning of the offering period, which is one year.
68
This line represents final trim and will not print

FOOT LOCKER, INC.NOTES TO CONSOLIDATED FINANCIAL STATEMENTS
22. Share-Based Compensation − (continued)
The Company estimates the expected volatility of its common stock at the grant date using a weighted-averageof the Company’s historical volatility and implied volatility from traded options on the Company’s commonstock. The Company believes that the combination of historical volatility and implied volatility provides a betterestimate of future stock price volatility.
The risk-free interest rate assumption is determined using the Federal Reserve nominal rates for U.S. Treasuryzero-coupon bonds with maturities similar to those of the expected term of the award being valued. Theexpected dividend yield is derived from the Company’s historical experience.
The Company records share-based compensation expense only for those awards expected to vest using anestimated forfeiture rate based on its historical pre-vesting forfeiture data. The Company estimates pre-vestingoption forfeitures at the time of grant and periodically revises those estimates in subsequent periods if actualforfeitures differ from those estimates.
The following table shows the Company’s assumptions used to compute the share-based compensationexpense:
Stock Option Plans Stock Purchase Plan
2015 2014 2013 2015 2014 2013
Weighted-average risk free rate ofinterest 1.5% 2.1% 1.0% 0.2% 0.1% 0.2%
Expected volatility 30% 39% 42% 25% 24% 40%
Weighted-average expected awardlife (in years) 6.0 6.1 6.0 1.0 1.0 1.0
Dividend yield 1.6% 1.9% 2.3% 1.6% 2.0% 2.3%
Weighted-average fair value $16.07 $15.30 $10.98 $10.47 $7.35 $5.79
The information set forth in the following table covers options granted under the Company’s stock optionplans:
Number ofShares
Weighted-AverageRemaining
Contractual Life
Weighted-AverageExercisePrice
(in thousands) (in years) (per share)
Options outstanding at January 31, 2015 5,569 $25.89
Granted 694 62.29
Exercised (2,511) 25.50
Expired or cancelled (58) 49.17
Options outstanding at January 30, 2016 3,694 5.6 $32.62
Options exercisable at end of year 2,495 4.1 $22.56
Options vested and expected to vest 3,662 5.5 $32.40
The total fair value of options vested during 2015, 2014, and 2013 was $15 million, $9 million, and $8 million,respectively.
69
This line represents final trim and will not print

FOOT LOCKER, INC.NOTES TO CONSOLIDATED FINANCIAL STATEMENTS
22. Share-Based Compensation − (continued)
The Company received $64 million in cash from option exercises for the year ended January 30, 2016. The totalintrinsic value of options exercised (the difference between the market price of the Company’s common stockon the exercise date and the price paid by the optionee to exercise the option) is presented below:
2015 2014 2013
($ in millions)
Exercised $99 $22 $21
The tax benefit realized from option exercises was $38 million, $8 million, and $7 million for 2015, 2014, and2013, respectively.
The aggregate intrinsic value for stock options outstanding, outstanding and exercisable, and vested andexpected to vest (the difference between the Company’s closing stock price on the last trading day of theperiod and the exercise price of the options, multiplied by the number of in-the-money stock options) ispresented below:
2015($ in millions)
Outstanding $129Outstanding and exercisable $112Vested and expected to vest $129
As of January 30, 2016, there was $7 million of total unrecognized compensation cost, net of estimatedforfeitures, related to nonvested stock options, which is expected to be recognized over a remainingweighted-average period of 1.4 years.
The following table summarizes information about stock options outstanding and exercisable at January 30,2016:
Options Outstanding Options Exercisable
Range of Exercise PricesNumber
Outstanding
Weighted-AverageRemaining
Contractual Life
Weighted-AverageExercisePrice
NumberExercisable
Weighted-AverageExercisePrice
(in thousands, except prices per share and contractual life)
$9.85 to $18.80 858 2.7 $13.32 858 $13.32
$18.84 to $24.75 855 3.3 19.80 855 19.80
$30.92 to $36.59 784 6.5 32.84 611 32.44
$45.08 to $73.21 1,197 8.7 55.48 171 47.42
3,694 5.6 $32.62 2,495 $22.56
Restricted Stock and Restricted Stock Units
Restricted shares of the Company’s common stock and restricted stock units (‘‘RSU’’) may be awarded to certainofficers and key employees of the Company. RSU awards are made to executives outside of the United Statesand to nonemployee directors. Each RSU represents the right to receive one share of the Company’s commonstock provided that the vesting conditions are satisfied. In 2015, 2014, and 2013, there were 588,308, 755,936,and 1,027,542 RSU awards outstanding, respectively.
Generally, awards fully vest after the passage of time, typically three years. However, RSU awards made inconnection with the Company’s long-term incentive program vest after the attainment of certain performancemetrics and the passage of time. Restricted stock is considered outstanding at the time of grant and the holdershave voting rights. Dividends are paid to holders of restricted stock that vest with the passage of time. With
70
This line represents final trim and will not print

FOOT LOCKER, INC.NOTES TO CONSOLIDATED FINANCIAL STATEMENTS
22. Share-Based Compensation − (continued)
regards to performance-based restricted stock, dividends will be accumulated and paid after the performancecriteria are met. No dividends are paid or accumulated on RSU awards.
Compensation expense is recognized using the fair market value at the date of grant and is amortized over thevesting period, provided the recipient continues to be employed by the Company.
Restricted share and RSU activity is summarized as follows:
Number ofShares
Weighted-AverageRemaining
Contractual Life
Weighted-Average
Grant DateFair Value
(in thousands) (in years) (per share)
Nonvested at beginning of year 1,038 $37.96
Granted 155 63.73
Vested (322) 32.34
Expired or cancelled (68) 37.97
Nonvested at end of year 803 0.8 $45.19
Aggregate value ($ in millions) $ 36
The total fair value of awards for which restrictions lapsed was $10 million, $14 million, and $9 million for 2015,2014, and 2013, respectively. At January 30, 2016, there was $10 million of total unrecognized compensationcost net of estimated forfeitures, related to nonvested restricted stock awards.
23. Legal Proceedings
Legal proceedings pending against the Company or its consolidated subsidiaries consist of ordinary, routinelitigation, including administrative proceedings, incidental to the business of the Company or businesses thathave been sold or disposed of by the Company in past years. These legal proceedings include commercial,intellectual property, customer, environmental, and employment-related claims.
The Company and the Company’s U.S. retirement plan are defendants in a class action (Osberg v. Foot LockerInc. et ano., filed in the U.S. District Court for the Southern District of New York) in which the plaintiff allegesthat, in connection with the 1996 conversion of the retirement plan to a defined benefit plan with a cash balanceformula, the Company and the retirement plan failed to properly advise plan participants of the ‘‘wear-away’’effect of the conversion. Plaintiff’s claims were for breach of fiduciary duty under the Employee RetirementIncome Security Act of 1974, as amended, and violation of the statutory provisions governing the content of theSummary Plan Description. The trial was held in July 2015 and the court issued a decision in September 2015 infavor of the class on the foregoing claims. The court ordered that the Plan be reformed. The Company isappealing the court’s decision, and the judgment has been stayed pending the outcome of the appeal. As aresult of this development, the Company has determined that it is probable a liability exists. The Company’sreasonable estimate of this liability is a range between $100 million and $200 million, with no amount within thatrange more probable than any other amount. Therefore, in accordance with U.S. GAAP, the Company recordeda charge of $100 million pre-tax ($61 million after-tax) in the third quarter of 2015. This amount has beenclassified as a long-term liability. The Company will continue to vigorously defend itself in this case. In light ofthe uncertainties involved in this matter, there is no assurance that the ultimate resolution will not differ fromthe amount currently accrued by the Company.
Certain of the Company’s subsidiaries were defendants in a number of lawsuits filed in state and federal courtscontaining various class action allegations under federal or state wage and hour laws, including allegationsconcerning unpaid overtime, meal and rest breaks, and uniforms. In Pereira v. Foot Locker, filed in theU.S. District Court for the Eastern District of Pennsylvania, the plaintiff alleged that the Company permitted
71
This line represents final trim and will not print

FOOT LOCKER, INC.NOTES TO CONSOLIDATED FINANCIAL STATEMENTS
23. Legal Proceedings − (continued)
unpaid off-the-clock hours in violation of the Fair Labor Standards Act and state labor laws and soughtcompensatory and punitive damages, injunctive relief, and attorneys’ fees and costs. Additional purportedwage and hour class actions were filed against the Company that asserted claims similar to those asserted inPereira and sought similar remedies. With the exception of Hill v. Foot Locker filed in state court in Illinois,Kissinger v. Foot Locker filed in state court in California, and Cortes v. Foot Locker filed in federal court in NewYork, all of these actions were consolidated by the United States Judicial Panel on Multidistrict Litigation withPereira under the caption In re Foot Locker, Inc. Fair Labor Standards Act and Wage and Hour Litigation,(‘‘Consolidated Cases’’).
The Company and plaintiffs entered into a settlement agreement resolving the Consolidated Cases and Hillthat was approved by the court during the second quarter of 2015. Additionally, during the third quarter of2015, the Company and plaintiffs in Cortes and Kissinger entered into settlement agreements that have alsobeen approved by the respective courts.
Management does not believe that the outcome of any such legal proceedings pending against the Companyor its consolidated subsidiaries, includingOsberg, as described above, would have a material adverse effect onthe Company’s consolidated financial position, liquidity, or results of operations, taken as a whole, based uponcurrent knowledge and taking into consideration current accruals. Litigation is inherently unpredictable, andjudgments could be rendered or settlements entered into that could adversely affect the Company’s operatingresults or cash flows in a particular period.
24. Quarterly Results (Unaudited)
1st Q 2nd Q 3rd Q(3) 4th Q(4) Year(in millions, except per share amounts)
Sales2015 1,916 1,695 1,794 2,007 $7,4122014 1,868 1,641 1,731 1,911 $ 7,151
Gross margin(1)
2015 670 553 607 675 $2,5052014 646 525 574 629 $ 2,374
Operating profit(2)
2015 290 186 117 244 $ 8372014 254 144 187 220 $ 805
Net income2015 184 119 80 158 $ 5412014 162 92 120 146 $ 520
Basic earnings per share:2015 1.31 0.85 0.57 1.15 $ 3.892014 1.12 0.63 0.84 1.03 $ 3.61
Diluted earnings per share:2015 1.29 0.84 0.57 1.14 $ 3.842014 1.10 0.63 0.82 1.01 $ 3.56
(1) Gross margin represents sales less cost of sales.
(2) Operating profit represents income before income taxes, interest expense, net, and non-operating income.
(3) During the third quarter of 2015, the Company recorded a pre-tax charge of $100 million, see Note 23, Legal Proceedings for furtherinformation.
(4) During the fourth quarter of 2015 impairment charges totaling $5 million were recorded, see Note 4, Litigation, Impairment and OtherCharges for further information.
72
This line represents final trim and will not print

Item 9. Changes in and Disagreements with Accountants on Accounting and Financial Disclosure
There were no disagreements between the Company and its independent registered public accounting firm onmatters of accounting principles or practices.
Item 9A. Controls and Procedures
(a) Evaluation of Disclosure Controls and Procedures.
The Company’s management performed an evaluation under the supervision and with the participation ofthe Company’s Chief Executive Officer (‘‘CEO’’) and Chief Financial Officer (‘‘CFO’’), and completed anevaluation of the effectiveness of the design and operation of the Company’s disclosure controls andprocedures (as that term is defined in Rules 13a-15(e) and 15d-15(e) under the Securities Exchange Act of1934, as amended (the ‘‘Exchange Act’’)) as of January 30, 2016. Based on that evaluation, the Company’sCEO and CFO concluded that the Company’s disclosure controls and procedures were effective to ensurethat information relating to the Company that is required to be disclosed in the reports that we file orsubmit under the Exchange Act is recorded, processed, summarized and reported, within the time periodsspecified in the SEC rules and forms, and is accumulated and communicated to management, includingthe CEO and CFO, as appropriate to allow timely decisions regarding required disclosure.
(b) Management’s Annual Report on Internal Control over Financial Reporting.
The Company’s management is responsible for establishing and maintaining adequate internal controlover financial reporting (as that term is defined in Exchange Act Rules 13a-15(f) and 15d-15(f)). To evaluatethe effectiveness of the Company’s internal control over financial reporting, the Company uses theframework in Internal Control-Integrated Framework (2013) issued by the Committee of SponsoringOrganizations of the Treadway Commission (the ‘‘2013 COSO Framework’’). Using the 2013 COSOFramework, the Company’s management, including the CEO and CFO, evaluated the Company’s internalcontrol over financial reporting and concluded that the Company’s internal control over financial reportingwas effective as of January 30, 2016. KPMG LLP, the independent registered public accounting firm thataudits the Company’s consolidated financial statements included in this annual report, has issued anattestation report on the Company’s effectiveness of internal control over financial reporting, which isincluded in Item 9A(d).
(c) Changes in Internal Control over Financial Reporting.
During the Company’s last fiscal quarter there were no changes in internal control over financial reportingthat materially affected, or are reasonably likely to materially affect, the Company’s internal control overfinancial reporting.
(d) Report of Independent Registered Public Accounting Firm on Internal Control Over Financial Reporting-the report appears on the following page.
73
This line represents final trim and will not print

REPORT OF INDEPENDENT REGISTERED PUBLIC ACCOUNTING FIRM
The Board of Directors and Shareholders ofFoot Locker, Inc.:
We have audited Foot Locker, Inc.’s internal control over financial reporting as of January 30, 2016, based oncriteria established in Internal Control — Integrated Framework (2013) issued by the Committee of SponsoringOrganizations of the Treadway Commission (COSO). Foot Locker, Inc.’s management is responsible formaintaining effective internal control over financial reporting and for its assessment of the effectiveness ofinternal control over financial reporting, included in the accompanying Management’s Annual Report onInternal Control over Financial Reporting (Item 9A(b)). Our responsibility is to express an opinion on theCompany’s internal control over financial reporting based on our audit.
We conducted our audit in accordance with the standards of the Public Company Accounting Oversight Board(United States). Those standards require that we plan and perform the audit to obtain reasonable assuranceabout whether effective internal control over financial reporting was maintained in all material respects. Ouraudit included obtaining an understanding of internal control over financial reporting, assessing the risk that amaterial weakness exists, and testing and evaluating the design and operating effectiveness of internal controlbased on the assessed risk. Our audit also included performing such other procedures as we considerednecessary in the circumstances. We believe that our audit provides a reasonable basis for our opinion.
A company’s internal control over financial reporting is a process designed to provide reasonable assuranceregarding the reliability of financial reporting and the preparation of financial statements for external purposesin accordance with generally accepted accounting principles. A company’s internal control over financialreporting includes those policies and procedures that (1) pertain to the maintenance of records that, inreasonable detail, accurately and fairly reflect the transactions and dispositions of the assets of the company;(2) provide reasonable assurance that transactions are recorded as necessary to permit preparation of financialstatements in accordance with generally accepted accounting principles, and that receipts and expenditures ofthe company are being made only in accordance with authorizations of management and directors of thecompany; and (3) provide reasonable assurance regarding prevention or timely detection of unauthorizedacquisition, use, or disposition of the company’s assets that could have a material effect on the financialstatements.
Because of its inherent limitations, internal control over financial reporting may not prevent or detectmisstatements. Also, projections of any evaluation of effectiveness to future periods are subject to the risk thatcontrols may become inadequate because of changes in conditions, or that the degree of compliance with thepolicies or procedures may deteriorate.
In our opinion, Foot Locker, Inc. maintained, in all material respects, effective internal control over financialreporting as of January 30, 2016, based on the criteria established in Internal Control — Integrated Framework(2013) issued by the Committee of Sponsoring Organizations of the Treadway Commission (COSO).
We also have audited, in accordance with the standards of the Public Company Accounting Oversight Board(United States), the consolidated balance sheets of Foot Locker, Inc. and subsidiaries as of January 30, 2016 andJanuary 31, 2015, and the related consolidated statements of operations, comprehensive income, shareholders’equity, and cash flows for each of the years in the three-year period ended January 30, 2016, and our reportdated March 24, 2016, expressed an unqualified opinion on these consolidated financial statements.
/s/ KPMG
New York, New YorkMarch 24, 2016
74
This line represents final trim and will not print

Item 9B. Other Information
None.
PART III
Item 10. Directors, Executive Officers and Corporate Governance
(a) Directors of the Company
Information relative to directors of the Company will be set forth under the section captioned ‘‘Proposal1-Election of Directors’’ in the Proxy Statement and is incorporated herein by reference.
(b) Executive Officers of the Company
Information with respect to executive officers of the Company will be set forth immediately following Item 4in Part I.
(c) Information with respect to compliance with Section 16(a) of the Securities Exchange Act of 1934 will be setforth under the section captioned ‘‘Section 16(a) Beneficial Ownership Reporting Compliance’’ in the ProxyStatement and is incorporated herein by reference.
(d) Information on our audit committee and the audit committee financial expert will be contained in theProxy Statement under the section captioned ‘‘Committees of the Board of Directors’’ and is incorporatedherein by reference.
(e) Information about the Code of Business Conduct governing our employees, including our Chief ExecutiveOfficer, Chief Financial Officer, Chief Accounting Officer, and the Board of Directors, will be set forth underthe heading ‘‘Code of Business Conduct’’ under the Corporate Governance section of the Proxy Statementand is incorporated herein by reference.
Item 11. Executive Compensation
Information set forth in the Proxy Statement beginning with the section captioned ‘‘Directors’ Compensationand Benefits’’ through and including the section captioned ‘‘Pension Benefits’’ is incorporated herein byreference, and information set forth in the Proxy Statement under the heading ‘‘Compensation andManagement Resources Committee Interlocks and Insider Participation’’ is incorporated herein by reference.
Item 12. Security Ownership of Certain Beneficial Owners and Management and Related StockholderMatters
Information set forth in the Proxy Statement under the sections captioned ‘‘Equity CompensationPlan Information’’ and ‘‘Beneficial Ownership of the Company’s Stock’’ is incorporated herein by reference.
Item 13. Certain Relationships and Related Transactions, and Director Independence
Information set forth in the Proxy Statement under the section captioned ‘‘Related Person Transactions’’ andunder the section captioned ‘‘Directors’ Independence’’ is incorporated herein by reference.
Item 14. Principal Accounting Fees and Services
Information about the principal accounting fees and services is set forth under the section captioned ‘‘Proposal2: Ratification of the Appointment of Independent Registered Public Accounting Firm — Audit and Non-AuditFees’’ in the Proxy Statement and is incorporated herein by reference. Information about the Audit Committee’spre-approval policies and procedures is set forth in the section captioned ‘‘Proposal 2: Ratification of theAppointment of Independent Registered Public Accounting Firm — Audit Committee Pre-Approval Policiesand Procedures’’ in the Proxy Statement and is incorporated herein by reference.
75
This line represents final trim and will not print

PART IV
Item 15. Exhibits and Financial Statement Schedules
(a)(1) and (2) Financial Statements
The list of financial statements required by this item is set forth in Item 8. ‘‘Consolidated FinancialStatements and Supplementary Data.’’ All other schedules specified under Regulation S-X have beenomitted because they are not applicable, because they are not required or because the informationrequired is included in the financial statements or notes thereto.
(a)(3) and (c) Exhibits
An index of the exhibits which are required by this item and which are included or incorporated herein byreference in this report appears on pages 78 through 80.
76
This line represents final trim and will not print

SIGNATURES
Pursuant to the requirements of Section 13 or 15(d) of the Securities Exchange Act of 1934, the Company hasduly caused this report to be signed on its behalf by the undersigned, thereunto duly authorized.
FOOT LOCKER, INC.
By: /s/ RICHARD A. JOHNSONRichard A. JohnsonPresident and Chief Executive Officer
Date: March 24, 2016
Pursuant to the requirements of the Securities Exchange Act of 1934, this report has been signed below onMarch 24, 2016, by the following persons on behalf of the Company and in the capacities indicated.
/s/ RICHARD A. JOHNSONRichard A. Johnson
President,Chief Executive Officer, and Director
/s/ LAUREN B. PETERSLauren B. Peters
Executive Vice President andChief Financial Officer
/s/ GIOVANNA CIPRIANOGiovanna Cipriano
Senior Vice President and Chief Accounting Officer
/s/ NICHOLAS DIPAOLONicholas DiPaolo
Non-Executive Chairman of the Board
/s/ MAXINE CLARKMaxine Clark
Director
/s/ MATTHEW M. MCKENNAMatthew M. McKenna
Director
/s/ ALAN D. FELDMANAlan D. Feldman
Director
/s/ CHERYL NIDO TURPINCheryl Nido Turpin
Director
/s/ JAROBIN GILBERT JR.Jarobin Gilbert Jr.
Director
/s/ STEVEN OAKLANDSteven Oakland
Director
/s/ GUILLERMO G. MARMOLGuillermo G. Marmol
Director
/s/ DONA D. YOUNGDona D. Young
Director
77
This line represents final trim and will not print

FOOT LOCKER, INC.
INDEX OF EXHIBITS
Exhibit No. Description
3(i)(a) Certificate of Incorporation of the Registrant, as filed by the Department of State of the Stateof New York on April 7, 1989 (incorporated herein by reference to Exhibit 3(i)(a) to the QuarterlyReport on Form 10-Q for the quarterly period ended July 26, 1997 filed on September 4, 1997(the ‘‘July 26, 1997 Form 10-Q’’)).
3(i)(b) Certificates of Amendment of the Certificate of Incorporation of the Registrant, as filed by theDepartment of State of the State of New York on (a) July 20, 1989, (b) July 24, 1990, (c) July 9,1997 (incorporated herein by reference to Exhibit 3(i)(b) to the July 26, 1997 Form 10-Q),(d) June 11, 1998 (incorporated herein by reference to Exhibit 4.2(a) to the RegistrationStatement on Form S-8 (Registration No. 333-62425) (the ‘‘1998 Form S-8’’)), (e) November 1,2001 (incorporated herein by reference to Exhibit 4.2 to the Registration Statement on Form S-8(Registration No. 333-74688) (the ‘‘2001 Form S-8’’)), and (f) May 28, 2014 (incorporated hereinby reference to Exhibit 3.1 to the Current Report on Form 8-K dated May 21, 2014 filed onMay 28, 2014).
3(ii) By-laws of the Registrant, as amended (incorporated herein by reference to Exhibit 3.1 to theCurrent Report on Form 8-K dated May 20, 2009 filed on May 27, 2009).
4.1 The rights of holders of the Registrant’s equity securities are defined in the Registrant’sCertificate of Incorporation, as amended (incorporated herein by reference to (a) Exhibits 3(i)(a)and 3(i)(b) to the July 26, 1997 Form 10-Q, Exhibit 4.2(a) to the 1998 Form S-8, and Exhibit 4.2to the 2001 Form S-8.
4.2 Indenture, dated as of October 10, 1991 (incorporated herein by reference to Exhibit 4.1 to theRegistration Statement on Form S-3 (Registration No. 33-43334)).
4.3 Form of 8-1/2% Debentures due 2022 (incorporated herein by reference to Exhibit 4 to theCurrent Report on Form 8-K dated January 16, 1992).
10.1† Foot Locker 1998 Stock Option and Award Plan (incorporated herein by reference toExhibit 10.4 to the Annual Report on Form 10-K for the fiscal year ended January 31, 1998 filedon April 21, 1998).
10.2† Amendment to the Foot Locker 1998 Stock Option and Award Plan (incorporated herein byreference to Exhibit 10.2 to the Quarterly Report on Form 10-Q for the quarterly period endedJuly 29, 2000 filed on September 7, 2000).
10.3† Executive Supplemental Retirement Plan (incorporated herein by reference to Exhibit 10(d) tothe Registration Statement on Form 8-B filed on August 7, 1989 (Registration No. 1-10299) (the‘‘8-B Registration Statement’’)).
10.4† Amendment to the Executive Supplemental Retirement Plan (incorporated herein by referenceto Exhibit 10(c)(i) to the Annual Report on Form 10-K for the fiscal year ended January 28, 1995filed on April 24, 1995).
10.5† Amendment to the Executive Supplemental Retirement Plan (incorporated herein by referenceto Exhibit 10(d)(ii) to the Annual Report on Form 10-K for the fiscal year ended January 27, 1996filed on April 26, 1996).
10.6† Supplemental Executive Retirement Plan, as Amended and Restated (incorporated herein byreference to Exhibit 10.1 to the Current Report on Form 8-K dated August 13, 2007 filed onAugust 17, 2007).
10.7† Amendment to the Foot Locker Supplemental Executive Retirement Plan (incorporated hereinby reference to Exhibit 10.1 to the Current Report on Form 8-K dated May 25, 2011 filed onMay 27, 2011).
10.8† Amendment Number Two to the Foot Locker Supplemental Executive Retirement Plan(incorporated herein by reference to Exhibit 10.3 to the Current Report on Form 8-K datedMarch 26, 2014 filed on April 1, 2014 (the ‘‘March 26, 2014 Form 8-K’’)).
78
This line represents final trim and will not print

Exhibit No. Description
10.9† Long-Term Incentive Compensation Plan, as amended and restated (incorporated herein byreference to Exhibit 10.2 to the Current Report on Form 8-K dated March 28, 2013 filed onApril 1, 2013 (the ‘‘March 28, 2013 Form 8-K’’)).
10.10† Annual Incentive Compensation Plan, as amended and restated (incorporated herein byreference to Exhibit 10.1 to the March 28, 2013 Form 8-K).
10.11 Form of indemnification agreement, as amended (incorporated herein by reference toExhibit 10(g) to the 8-B Registration Statement).
10.12 Amendment to form of indemnification agreement (incorporated herein by reference toExhibit 10.5 to the Quarterly Report on Form 10-Q for the quarterly period ended May 5, 2001filed on June 13, 2001 (the ‘‘May 5, 2001 Form 10-Q’’)).
10.13 Trust Agreement dated as of November 12, 1987 (‘‘Trust Agreement’’), betweenF.W. Woolworth Co. and The Bank of New York, as amended and assumed by the Registrant(incorporated herein by reference to Exhibit 10(j) to the 8-B Registration Statement).
10.14 Amendment to Trust Agreement made as of April 11, 2001 (incorporated herein by referenceto Exhibit 10.4 to the May 5, 2001 Form 10-Q).
10.15† Foot Locker Directors’ Retirement Plan, as amended (incorporated herein by reference toExhibit 10(k) to the 8-B Registration Statement).
10.16† Amendments to the Foot Locker Directors’ Retirement Plan (incorporated herein by referenceto Exhibit 10(c) to the Quarterly Report on Form 10-Q for the quarterly period endedOctober 28, 1995 filed on December 11, 1995).
10.17† Employment Agreement, dated November 6, 2014, by and between Richard A. Johnson andthe Company (incorporated herein by reference to Exhibit 10.2 to the Current Report onForm 8-K dated November 3, 2014 filed on November 7, 2014).
10.18† Form of Senior Executive Employment Agreement (incorporated herein by reference toExhibit 10.1 to the Current Report on Form 8-K dated April 20, 2015 filed on April 20, 2015).
10.19†* Form of Executive Employment Agreement.
10.20† Foot Locker, Inc. Excess Cash Balance Plan (incorporated herein by reference to Exhibit 10.22to the Annual Report on Form 10-K for the fiscal year ended January 31, 2009 filed on March 30,2009 (the ‘‘2008 Form 10-K’’)).
10.21† Form of Restricted Stock Agreement (incorporated herein by reference to Exhibit 10.30 to theAnnual Report on Form 10-K for the fiscal year ended January 30, 1999 filed on April 30, 1999).
10.22† From of Restricted Stock Agreement (incorporated herein by reference to Exhibit 10.2 to theMarch 26, 2014 Form 8-K).
10.23† Form of Restricted Stock Agreement (incorporated herein by reference to Exhibit 10.1 to theCurrent Report on Form 8-K dated December 23, 2014 filed on December 30, 2014 (the‘‘December 23, 2014 Form 8-K’’)).
10.24† Foot Locker 2002 Directors Stock Plan (incorporated herein by reference to Exhibit 10.24 to the2008 Form 10-K).
10.25† Automobile Expense Reimbursement Program for Senior Executives (incorporated herein byreference to Exhibit 10.26 to the 2008 Form 10-K).
10.26† Executive Medical Expense Allowance Program for Senior Executives (incorporated herein byreference to Exhibit 10.27 to the 2008 Form 10-K).
10.27† Financial Planning Allowance Program for Senior Executives (incorporated herein by referenceto Exhibit 10.28 to the 2008 Form 10-K).
10.28† Form of Nonstatutory Stock Option Award Agreement for Executive Officers (incorporatedherein by reference to Exhibit 10.40 to the Annual Report on Form 10-K for the fiscal yearended January 28, 2006 filed on March 27, 2006 (the ‘‘2005 Form 10-K’’)).
10.29† Form of Nonstatutory Stock Option Award Agreement for Executive Officers (incorporatedherein by reference to Exhibit 10.1 to the March 26, 2014 Form 8-K).
79
This line represents final trim and will not print

Exhibit No. Description
10.30† Form of Incentive Stock Option Award Agreement for Executive Officers (incorporated hereinby reference to Exhibit 10.41 to the 2005 Form 10-K).
10.31† Form of Nonstatutory Stock Option Award Agreement for Non-Employee Directors(incorporated herein by reference to Exhibit 10.2 to the Quarterly Report on Form 10-Q for thequarterly period ended July 31, 2004 filed on September 8, 2004).
10.32† Long-Term Disability Program for Senior Executives (incorporated herein by reference toExhibit 10.32 to the 2008 Form 10-K).
10.33† Foot Locker 2007 Stock Incentive Plan, amended and restated as of May 21, 2014 (incorporatedherein by reference to Exhibit 10.1 to the December 23, 2014 Form 8-K).
10.34 Amended and Restated Credit Agreement dated as of January 27, 2012 (incorporated hereinby reference to Exhibit 10.1 to the Current Report on Form 8-K dated January 27, 2012 filed onFebruary 2, 2012).
10.35 Guaranty dated as of March 20, 2009 (incorporated herein by reference to Exhibit 10.2 to theCurrent Report on Form 8-K dated March 20, 2009 filed on March 24, 2009).
10.36 Amended and Restated Security Agreement dated as of January 27, 2012 (incorporated hereinby reference to Exhibit 10.2 to the Current Report on Form 8-K dated January 27, 2012 filed onFebruary 2, 2012).
10.37† Form of Restricted Stock Unit Agreement (incorporated herein by reference to Exhibit 10.1 tothe Current Report on Form 8-K dated November 5, 2010 filed on November 12, 2010).
10.38† Form of Restricted Stock Unit Award Agreement (incorporated herein by reference toExhibit 10.3 to the March 28, 2013 Form 8-K).
10.39† Form of Restricted Stock Unit Agreement (incorporated herein by reference to Exhibit 10.2 tothe December 23, 2014 Form 8-K).
12* Computation of Ratio of Earnings to Fixed Charges.
21* Subsidiaries of the Registrant.
23* Consent of Independent Registered Public Accounting Firm.
31.1* Certification of Chief Executive Officer Pursuant to Section 302 of the Sarbanes-Oxley Act of2002.
31.2* Certification of Chief Financial Officer Pursuant to Section 302 of the Sarbanes-Oxley Act of2002.
32** Certification of Chief Executive Officer and Chief Financial Officer Pursuant to 18 U.S.C.Section 1350, as adopted pursuant to Section 906 of the Sarbanes-Oxley Act of 2002.
101.INS* XBRL Instance Document.
101.SCH* XBRL Taxonomy Extension Schema.
101.CAL* XBRL Taxonomy Extension Calculation Linkbase.
101.DEF* XBRL Taxonomy Extension Definition Linkbase.
101.LAB* XBRL Taxonomy Extension Label Linkbase.
101.PRE* XBRL Taxonomy Extension Presentation Linkbase.
† Management contract or compensatory plan or arrangement.* Filed herewith.** Furnished herewith.
80
This line represents final trim and will not print
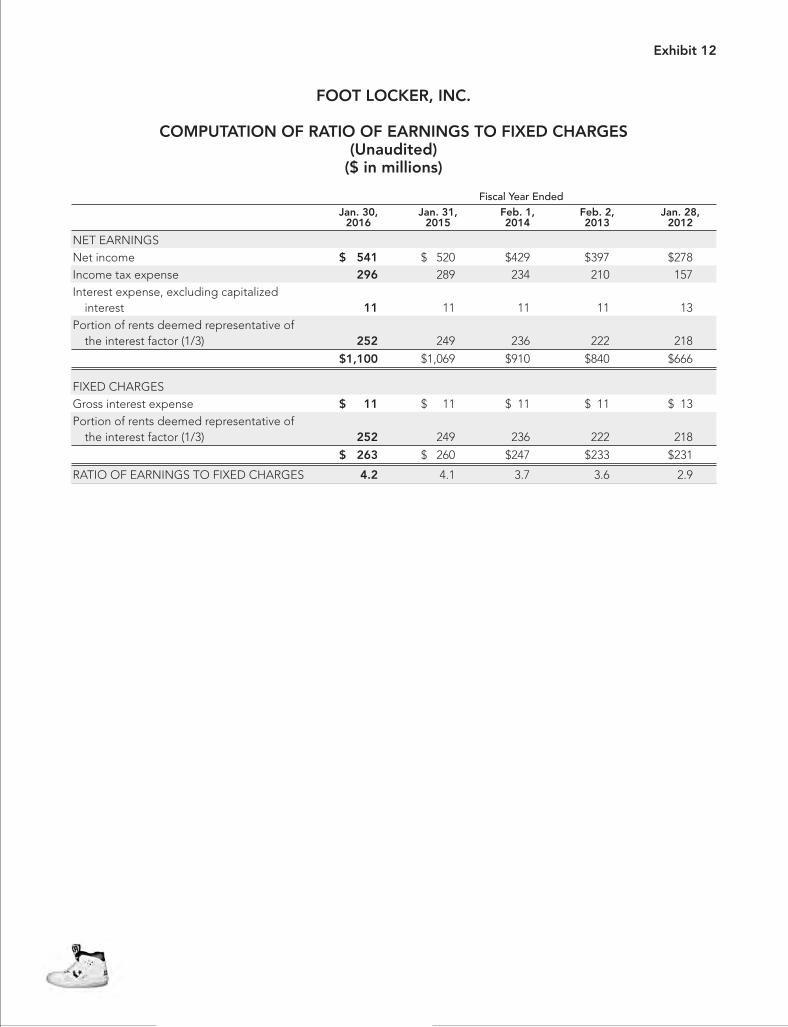
Exhibit 12
FOOT LOCKER, INC.
COMPUTATION OF RATIO OF EARNINGS TO FIXED CHARGES(Unaudited)($ in millions)
Fiscal Year EndedJan. 30,2016
Jan. 31,2015
Feb. 1,2014
Feb. 2,2013
Jan. 28,2012
NET EARNINGSNet income $ 541 $ 520 $429 $397 $278Income tax expense 296 289 234 210 157Interest expense, excluding capitalizedinterest 11 11 11 11 13
Portion of rents deemed representative ofthe interest factor (1/3) 252 249 236 222 218
$1,100 $1,069 $910 $840 $666
FIXED CHARGESGross interest expense $ 11 $ 11 $ 11 $ 11 $ 13Portion of rents deemed representative ofthe interest factor (1/3) 252 249 236 222 218
$ 263 $ 260 $247 $233 $231
RATIO OF EARNINGS TO FIXED CHARGES 4.2 4.1 3.7 3.6 2.9
This line represents final trim and will not print

Exhibit 21
FOOT LOCKER, INC. SUBSIDIARIES(1)
The following is a list of subsidiaries of Foot Locker, Inc. as of January 30, 2016, omitting some subsidiaries,which, considered in the aggregate, would not constitute a significant subsidiary.
Name
State or OtherJurisdiction ofIncorporation
Footlocker.com, Inc. DelawareEastbay, Inc. WisconsinFLE CV Management, Inc. DelawareFLE C.V. NetherlandsFLE Holdings Cooperatief U.A NetherlandsFL Europe Holdings, Inc. DelawareFoot Locker Austria GmbH AustriaFoot Locker Belgium B.V.B.A. BelgiumFoot Locker Europe B.V. NetherlandsFLE Logistics B.V. NetherlandsFoot Locker France S.A.S. FranceFoot Locker Italy S.r.l. ItalyFoot Locker Netherlands B.V. NetherlandsFoot Locker Germany GmbH & Co. KG GermanyFoot Locker ETVE, Inc. DelawareFoot Locker Europe Holdings, S.L. SpainFoot Locker Spain S.L. SpainFoot Locker Australia, Inc. DelawareFoot Locker New Zealand, Inc. DelawareFreedom Sportsline Limited United KingdomTeam Edition Apparel, Inc. FloridaFoot Locker Specialty, Inc. New YorkFoot Locker Retail, Inc. New YorkFoot Locker Europe.com B.V. NetherlandsFoot Locker Poland Sp. z o.o. PolandFoot Locker Czech Republic s.r.o. Czech RepublicFLE Partners C.V. NetherlandsFLE Partners LLC DelawareFoot Locker Stores, Inc. DelawareFoot Locker Corporate Services, Inc. DelawareFoot Locker Sourcing, Inc. DelawareFoot Locker Artigos desportivos e de tempos livres, Lda. PortugalFoot Locker Greece Athletic Goods Ltd. GreeceFoot Locker Suisse S.A. SwitzerlandFoot Locker Scandinavia B.V. NetherlandsFoot Locker Hungary Kft HungaryFoot Locker Retail Ireland Limited IrelandFL Finance (Europe) Limited IrelandFL Finance Europe (US) Limited IrelandFLE Franchising Limited IrelandFoot Locker Canada Co. CanadaFoot Locker Istanbul Sport Giyim Sanayi ve Ticaret LS TurkeyFoot Locker Spain C.V. NetherlandsFoot Locker Denmark B.V. NetherlandsRunners Point B.V. & Co. K.G. GermanySidestep GmbH GermanyFoot Locker Europe.com GmbH GermanyRPG Logistics GmbH GermanyRunners Point Administration GmbH GermanyRunners Point Switzerland LLC Switzerland
(1) Each subsidiary company is 100% owned, directly or indirectly, by Foot Locker, Inc. All subsidiaries areconsolidated with Foot Locker, Inc. for accounting and financial reporting purposes.
This line represents final trim and will not print

Exhibit 23
CONSENT OF INDEPENDENT REGISTERED PUBLIC ACCOUNTING FIRM
The Board of Directors ofFoot Locker, Inc.:
We consent to the incorporation by reference in the following registration statements of Foot Locker, Inc. andsubsidiaries of our reports dated March 24, 2016, with respect to the consolidated balance sheets of FootLocker, Inc. and subsidiaries as of January 30, 2016 and January 31, 2015, and the related consolidatedstatements of operations, comprehensive income, shareholders’ equity, and cash flows for each of the yearsin the three-year period ended January 30, 2016, and the effectiveness of internal control over financialreporting as of January 30, 2016, which reports appear in the January 30, 2016 annual report on Form 10-K ofFoot Locker, Inc.
Form S-8 No. 33-10783Form S-8 No. 33-91888Form S-8 No. 33-91886Form S-8 No. 33-97832Form S-8 No. 333-07215Form S-8 No. 333-21131Form S-8 No. 333-62425Form S-8 No. 333-33120Form S-8 No. 333-41056Form S-8 No. 333-41058Form S-8 No. 333-74688Form S-8 No. 333-99829Form S-8 No. 333-111222Form S-8 No. 333-121515Form S-8 No. 333-144044Form S-8 No. 333-149803Form S-3 No. 33-43334Form S-3 No. 33-86300Form S-3 No. 333-64930Form S-8 No. 333-167066Form S-8 No. 333-171523Form S-8 No. 333-190680Form S-8 No. 333-196899
/s/ KPMG
New York, New YorkMarch 24, 2016
This line represents final trim and will not print

Exhibit 31.1
CERTIFICATION
I, Richard A. Johnson, certify that:
1. I have reviewed this Annual Report on Form 10-K of Foot Locker, Inc. (the ‘‘Registrant’’);
2. Based on my knowledge, this report does not contain any untrue statement of a material fact or omit tostate a material fact necessary to make the statements made, in light of the circumstances under whichsuch statements were made, not misleading with respect to the period covered by this report;
3. Based on my knowledge, the financial statements, and other financial information included in this report,fairly present in all material respects the financial condition, results of operations and cash flows of theRegistrant as of, and for, the periods presented in this report;
4. The Registrant’s other certifying officer(s) and I are responsible for establishing and maintaining disclosurecontrols and procedures (as defined in Exchange Act Rules 13a-15(e) and 15d-15(e)) and internal controlover financial reporting (as defined in Exchange Act Rules 13a-15(f) and 15d-15(f)) for the Registrant andhave:
a) Designed such disclosure controls and procedures, or caused such disclosure controls and proceduresto be designed under our supervision, to ensure that material information relating to the Registrant,including its consolidated subsidiaries, is made known to us by others within those entities, particularlyduring the period in which this report is being prepared;
b) Designed such internal control over financial reporting, or caused such internal control over financialreporting to be designed under our supervision, to provide reasonable assurance regarding thereliability of financial reporting and the preparation of financial statements for external purposes inaccordance with generally accepted accounting principles;
c) Evaluated the effectiveness of the Registrant’s disclosure controls and procedures and presented inthis report our conclusions about the effectiveness of the disclosure controls and procedures, as of theend of the period covered by this report based on such evaluation; and
d) Disclosed in this report any change in the Registrant’s internal control over financial reporting thatoccurred during the Registrant’s most recent fiscal quarter (the Registrant’s fourth fiscal quarter in thecase of an annual report) that has materially affected, or is reasonably likely to materially affect, theRegistrant’s internal control over financial reporting; and
5. The Registrant’s other certifying officer(s) and I have disclosed, based on our most recent evaluation ofinternal control over financial reporting, to the Registrant’s auditors and the Audit Committee of theRegistrant’s Board of Directors:
a) All significant deficiencies and material weaknesses in the design or operation of internal control overfinancial reporting which are reasonably likely to adversely affect the Registrant’s ability to record,process, summarize and report financial information; and
b) Any fraud, whether or not material, that involves management or other employees who have asignificant role in the Registrant’s internal control over financial reporting.
March 24, 2016
/s/ RICHARD A. JOHNSON
Chief Executive Officer
This line represents final trim and will not print

Exhibit 31.2
CERTIFICATION
I, Lauren B. Peters, certify that:
1. I have reviewed this Annual Report on Form 10-K of Foot Locker, Inc. (the ‘‘Registrant’’);
2. Based on my knowledge, this report does not contain any untrue statement of a material fact or omit tostate a material fact necessary to make the statements made, in light of the circumstances under whichsuch statements were made, not misleading with respect to the period covered by this report;
3. Based on my knowledge, the financial statements, and other financial information included in this report,fairly present in all material respects the financial condition, results of operations and cash flows of theRegistrant as of, and for, the periods presented in this report;
4. The Registrant’s other certifying officer(s) and I are responsible for establishing and maintaining disclosurecontrols and procedures (as defined in Exchange Act Rules 13a-15(e) and 15d-15(e)) and internal controlover financial reporting (as defined in Exchange Act Rules 13a-15(f) and 15d-15(f)) for the Registrant andhave:
a) Designed such disclosure controls and procedures, or caused such disclosure controls and proceduresto be designed under our supervision, to ensure that material information relating to the Registrant,including its consolidated subsidiaries, is made known to us by others within those entities, particularlyduring the period in which this report is being prepared;
b) Designed such internal control over financial reporting, or caused such internal control over financialreporting to be designed under our supervision, to provide reasonable assurance regarding thereliability of financial reporting and the preparation of financial statements for external purposes inaccordance with generally accepted accounting principles;
c) Evaluated the effectiveness of the Registrant’s disclosure controls and procedures and presented inthis report our conclusions about the effectiveness of the disclosure controls and procedures, as of theend of the period covered by this report based on such evaluation; and
d) Disclosed in this report any change in the Registrant’s internal control over financial reporting thatoccurred during the Registrant’s most recent fiscal quarter (the Registrant’s fourth fiscal quarter in thecase of an annual report) that has materially affected, or is reasonably likely to materially affect, theRegistrant’s internal control over financial reporting; and
5. The Registrant’s other certifying officer(s) and I have disclosed, based on our most recent evaluation ofinternal control over financial reporting, to the Registrant’s auditors and the Audit Committee of theRegistrant’s Board of Directors:
a) All significant deficiencies and material weaknesses in the design or operation of internal control overfinancial reporting which are reasonably likely to adversely affect the Registrant’s ability to record,process, summarize and report financial information; and
b) Any fraud, whether or not material, that involves management or other employees who have asignificant role in the Registrant’s internal control over financial reporting.
March 24, 2016
/s/ LAUREN B. PETERS
Chief Financial Officer
This line represents final trim and will not print

Exhibit 32
FOOT LOCKER, INC.
CERTIFICATION PURSUANT TO18 U.S.C. SECTION 1350
AS ADOPTED PURSUANT TOSECTION 906 OF THE SARBANES-OXLEY ACT OF 2002
In connection with the Annual Report on Form 10-K of Foot Locker, Inc. (the ‘‘Registrant’’) for the period endedJanuary 30, 2016, as filed with the Securities and Exchange Commission on the date hereof (the ‘‘Report’’),Richard A. Johnson, as Chief Executive Officer of the Registrant and Lauren B. Peters, as Chief Financial Officerof the Registrant, each hereby certify, pursuant to 18 U.S.C. Section 1350, that:
(1) The Report fully complies with the requirements of Section 13(a) or 15(d) of the Securities ExchangeAct of 1934; and
(2) The information contained in the Report fairly presents, in all material respects, the financial conditionand results of operations of the Registrant.
Dated: March 24, 2016
/s/ RICHARD A. JOHNSON
Richard A. JohnsonChief Executive Officer
/s/ LAUREN B. PETERS
Lauren B. PetersChief Financial Officer
The foregoing certification is being furnished solely pursuant to 18 U.S.C. §1350 and is not being filed as partof the Report or as a separate disclosure document. Such certification will not be deemed to be incorporatedby reference into any filing under the Securities Act of 1933, as amended, or the Securities Exchange Act of1934, as amended, except to the extent that the company specifically incorporates it by reference.
This line represents final trim and will not print

This line represents final trim and will not print

TABLE OF CONTENTS
FINANCIAL HIGHLIGHTS*
2011 2012 2013 2014 2015
Sales** $ 5,623 $ 6,101 $ 6,505 $ 7,151 $ 7,412Sales per Gross Square Foot $ 406 $ 443 $ 460 $ 490 $ 504Adjusted Financial Results: Earnings Before Interest and Taxes** $ 446 $ 602 $ 676 $ 816 $ 946 EBIT Margin 7.9% 9.9% 10.4% 11.4% 12.8% Net Income** $ 281 $ 380 $ 432 $ 522 $ 606 Net Income Margin 5.0% 6.2% 6.6% 7.3% 8.2% Diluted EPS from Continuing Operations $ 1.82 $ 2.47 $ 2.87 $ 3.58 $ 4.29 Return on Invested Capital 11.8% 14.2% 14.1% 15.0% 15.8%Cash, Cash Equivalents and Short-Term Investment Position, Net of Debt** $ 716 $ 795 $ 728 $ 833 $ 891
See pages 16-17 of Form 10-K for the reconciliation of GAAP to non-GAAP adjusted results.
** In Millions
Financial Highlights ............................................................ 1Our Businesses .................................................................. 2Letter to Shareholders ........................................................ 3Our Vision, Core Values, Strategies and Goals .................. 6Core Business .................................................................... 7Kids’ Business .................................................................... 9European Expansion .......................................................... 11Digital ................................................................................. 12
Apparel ............................................................................... 13Growth in Women’s ............................................................ 15Industry-Leading Team ....................................................... 16Community ......................................................................... 17Form 10-K .......................................................................... 18Board of Directors, Corporate Management, Division Management, Corporate Information ................... IBC
Foot Locker, Inc. (NYSE: FL) is a leading global retailer of athletically inspired shoes and apparel. Headquartered in New York City, the Company operates 3,383 athletic retail stores in 23 countries in North America, Europe, Australia, and New Zealand under the brand names Foot Locker, Champs Sports, Kids Foot Locker, Footaction, SIX:02, Lady Foot Locker, Runners Point, and Sidestep.
mobile, and catalog channels. In addition to websites for each of the store banners, such as footlocker.com, the direct-to-customer business includes Eastbay, a leading destination for the serious athlete.
This report contains forward-looking statements within the meaning of the federal securities laws. Other than statements of historical facts, all statements which address activities, events, or developments
and disruptions to transportation services and distribution.
1
BOARD OFDIRECTORS
Nicholas DiPaolo 1, 3, 5
Chairman of the Board
Retired Vice Chairman
Bernard Chaus, Inc.
Maxine Clark 2, 5
Founder and Retired Chief Executive Bear Build-A-Bear Workshop, Inc.
Alan D. Feldman 1, 3, 5
Retired Chairman of the Board, President and Chief
Midas, Inc.
Jarobin Gilbert Jr. 2, 4
DBSS Group, Inc.
Richard A. Johnson 1
Guillermo G. Marmol 1, 2, 5
President Marmol & Associates
Matthew M. McKenna 1, 2, 5
Senior Advisor to the U.S. Secretary of Agriculture
Steven Oakland 3, 4
President - Coffee and FoodserviceThe J.M. Smucker Company
Cheryl Nido Turpin 3, 4
Retired President and
The Limited Stores
Dona D. Young 1, 3, 4 Retired Chairman of the Board,
The Phoenix Companies, Inc.
1 Member of Executive Committee
2 Member of Audit Committee
3 Member of Compensation and Management Resources Committee
4 Member of Nominating and Corporate Governance Committee
5 Member of Finance and Strategic Planning Committee
CORPORATEMANAGEMENT
Richard A. Johnson President and
Robert W. McHugh Executive Vice President – Operations Support
Lauren B. Peters Executive Vice President and
Senior Vice Presidents:
Paulette R. Alviti
Jeffrey L. BerkReal Estate
Giovanna Cipriano
Sheilagh M. Clarke General Counsel and Secretary
Pawan Verma
Vice Presidents:
Saadi A. Majzoub Supply Chain
John A. Maurer Treasurer and Investor Relations
Dennis E. SheehanDeputy General Counsel
Bernard F. SteenmanRisk Management
Caryn M. SteinertHuman Resources
DIVISIONMANAGEMENT
Stephen D. Jacobs Executive Vice President and
Franklin R. BrackenVice President and General Manager, Foot Locker Canada
Natalie M. EllisVice President and General Manager, SIX:02
Andrew I. GrayVice President and General Manager, Foot Locker U.S. and Lady Foot Locker
Bryon W. MilburnSenior Vice President and General Manager, Champs Sports
Christopher L. SantaellaVice President and General Manager, Kids Foot Locker
Kenneth W. Side Vice President and General Manager, Footaction
Lewis P. Kimble Executive Vice President and
International
Bart de WildeVice President and General Manager, Runners Point Group
Nicholas Jones Vice President and General Manager, Foot Locker Europe
Phillip G. Laing Vice President and General
Dowe S. Tillema
Footlocker.com/Eastbay
CORPORATEINFORMATION
Corporate Headquarters330 West 34th Street
Worldwide Website -
er-inc.com offers information about -
quarterly results, press releases, and corporate governance documents.
Transfer Agent and Registrar Computershare
Outside U.S. and Canada
changes to: Computershare
Independent Registered Public Accounting Firm KPMG LLP
Dividend Reinvestment Dividends on Foot Locker, Inc. common stock may be reinvested through participation in the Dividend Reinvestment Program. Participating
cash purchases of Foot Locker, Inc. common stock. Please contact our Transfer Agent.
Service Marks and TrademarksThe service marks and trademarks Foot Locker, Footaction, Lady Foot Locker, Kids Foot Locker, Champs Sports, footlocker.com, Eastbay, Team Edition, SIX:02, Runners Point, and Sidestep are
Investor Information Investor inquiries should be directed to the Investor Relations Department at
41378_Cover.indd 2 3/25/16 12:20 PM

330 WEST 34TH STREET
NEW YORK, NY 10001
Developing Our Leadership Positions
20
15
AN
NU
AL
RE
PO
RT
2015 ANNUAL REPORT
41378_Cover.indd 1 3/28/16 8:45 AM