2014 9-month sales call presentation
DESCRIPTION
The slides to accompany our 9-month sales investor call, October 16, 2015, 0830 CETTRANSCRIPT

October 16th, 2014 9 Month Sales
Wan Ling Martello
Chief Financial Officer
9 Month Sales Conference
October 16th, 2014 9 Month Sales
This presentation contains forward looking
statements which reflect Management’s current
views and estimates. The forward looking
statements involve certain risks and uncertainties
that could cause actual results to differ materially
from those contained in the forward looking
statements. Potential risks and uncertainties
include such factors as general economic
conditions, foreign exchange fluctuations,
competitive product and pricing pressures and
regulatory developments.
2
Disclaimer
October 16th, 2014 9 Month Sales
Highlights
3
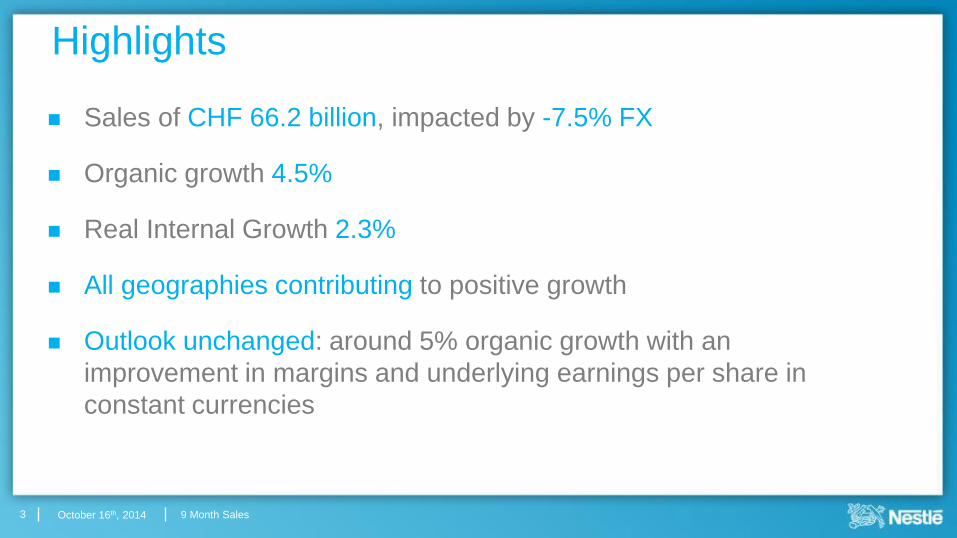
Sales of CHF 66.2 billion, impacted by -7.5% FX
Organic growth 4.5%
Real Internal Growth 2.3%
All geographies contributing to positive growth
Outlook unchanged: around 5% organic growth with an
improvement in margins and underlying earnings per share in
constant currencies
October 16th, 2014 9 Month Sales
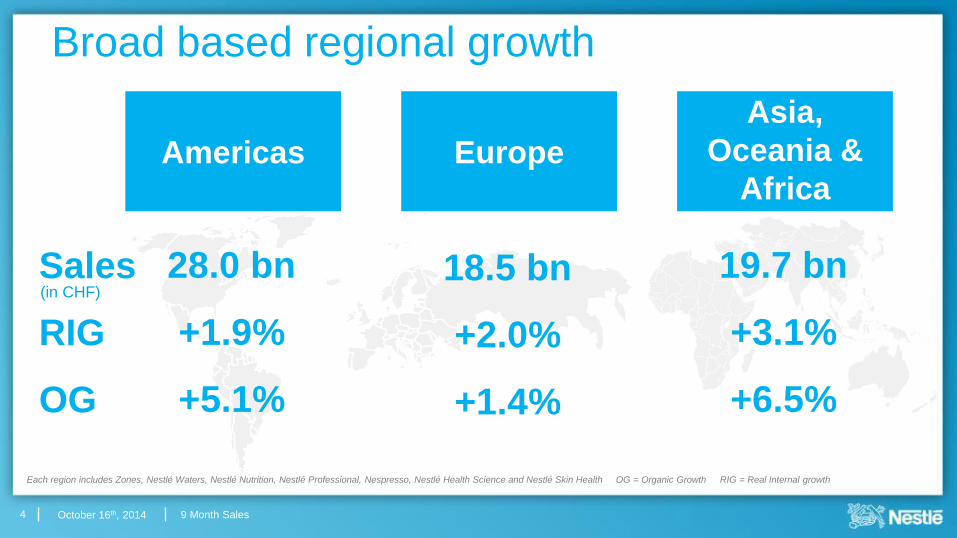
Each region includes Zones, Nestlé Waters, Nestlé Nutrition, Nestlé Professional, Nespresso, Nestlé Health Science and Nestlé Skin Health OG = Organic Growth RIG = Real Internal growth
Sales
RIG
OG
(in CHF)
4
Broad based regional growth
Asia,
Oceania &
Africa
19.7 bn
+3.1%
+6.5%
Americas
28.0 bn
+1.9%
+5.1%
Europe
18.5 bn
+2.0%
+1.4%
October 16th, 2014 9 Month Sales
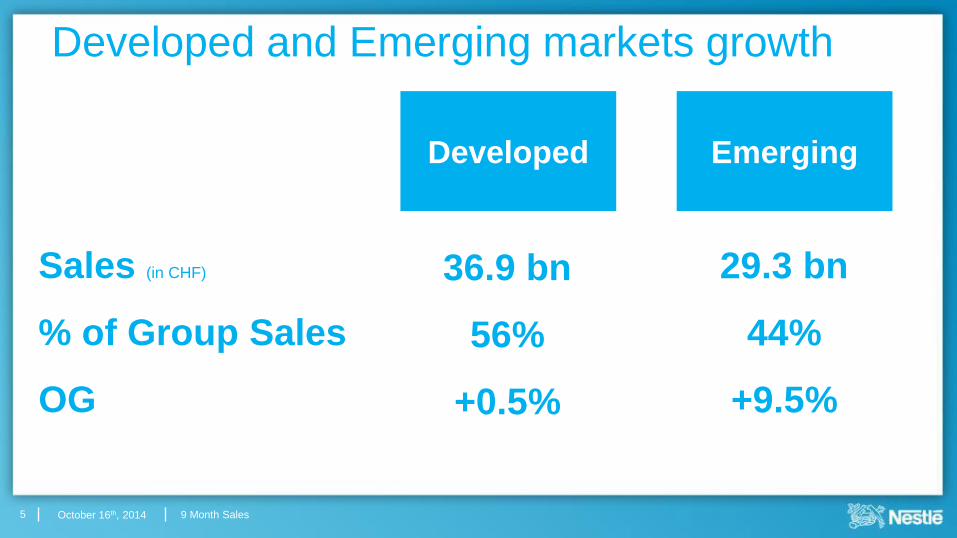
Developed
36.9 bn
56%
+0.5%
Emerging
29.3 bn
44%
+9.5%
5
Developed and Emerging markets growth
Sales (in CHF)
% of Group Sales
OG
October 16th, 2014 9 Month Sales
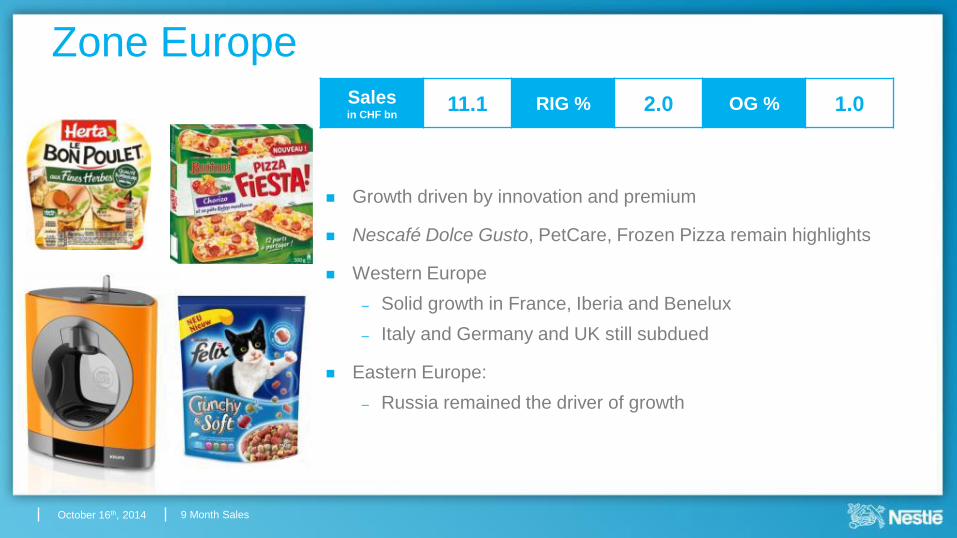
Zone Europe
Sales in CHF bn
11.1 RIG % 2.0 OG % 1.0
Growth driven by innovation and premium
Nescafé Dolce Gusto, PetCare, Frozen Pizza remain highlights
Western Europe
– Solid growth in France, Iberia and Benelux
– Italy and Germany and UK still subdued
Eastern Europe:
– Russia remained the driver of growth
October 16th, 2014 9 Month Sales
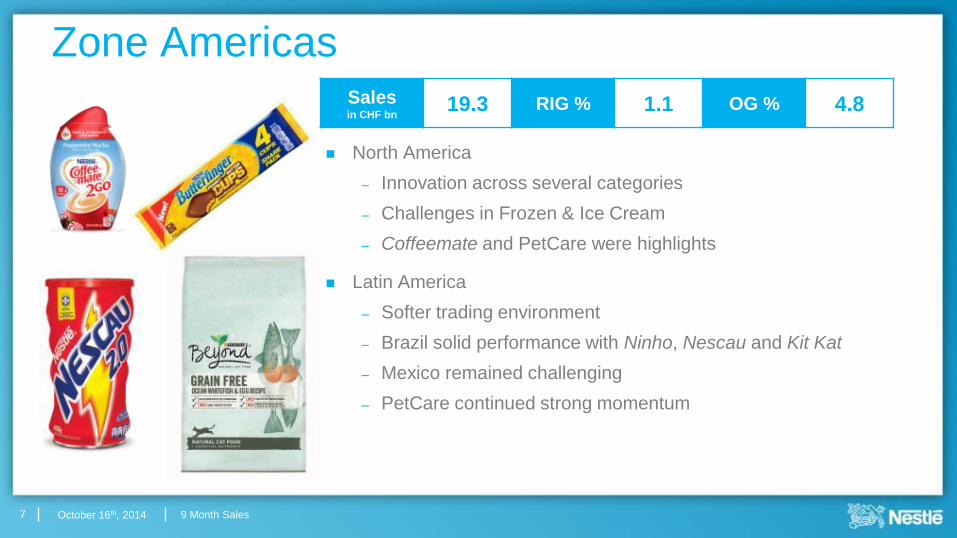
Zone Americas
7
North America
– Innovation across several categories
– Challenges in Frozen & Ice Cream
– Coffeemate and PetCare were highlights
Latin America
– Softer trading environment
– Brazil solid performance with Ninho, Nescau and Kit Kat
– Mexico remained challenging
– PetCare continued strong momentum
Sales in CHF bn
19.3 RIG % 1.1 OG % 4.8
October 16th, 2014 9 Month Sales
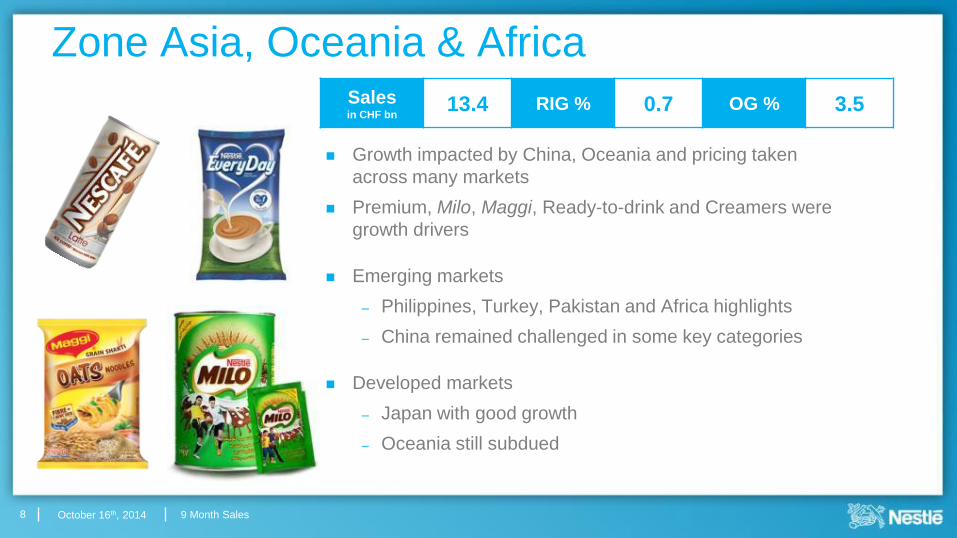
Growth impacted by China, Oceania and pricing taken
across many markets
Premium, Milo, Maggi, Ready-to-drink and Creamers were
growth drivers
Emerging markets
– Philippines, Turkey, Pakistan and Africa highlights
– China remained challenged in some key categories
Developed markets
– Japan with good growth
– Oceania still subdued
Zone Asia, Oceania & Africa
8
Sales in CHF bn
13.4 RIG % 0.7 OG % 3.5
October 16th, 2014 9 Month Sales
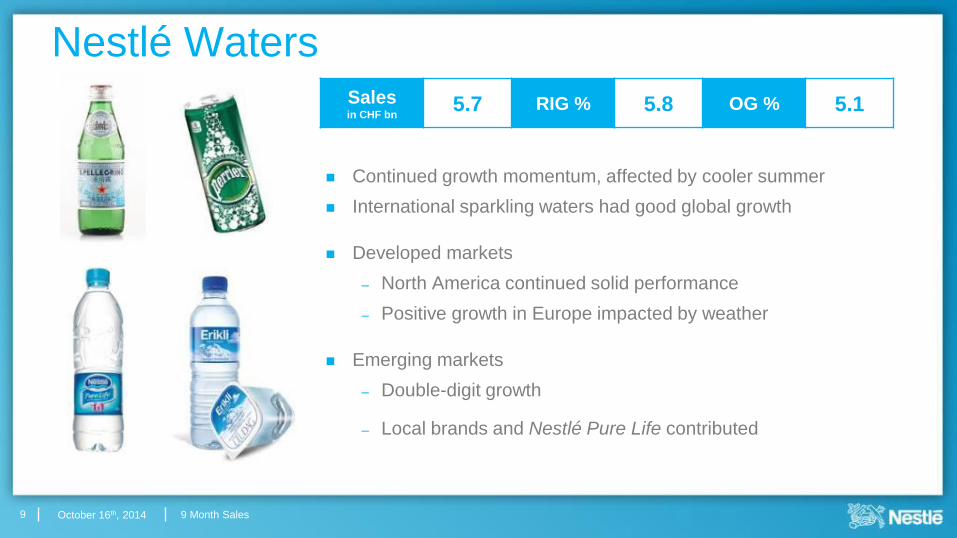
Continued growth momentum, affected by cooler summer
International sparkling waters had good global growth
Developed markets
– North America continued solid performance
– Positive growth in Europe impacted by weather
Emerging markets
– Double-digit growth
– Local brands and Nestlé Pure Life contributed
Nestlé Waters
9
Sales in CHF bn
5.7 RIG % 5.8 OG % 5.1
October 16th, 2014 9 Month Sales
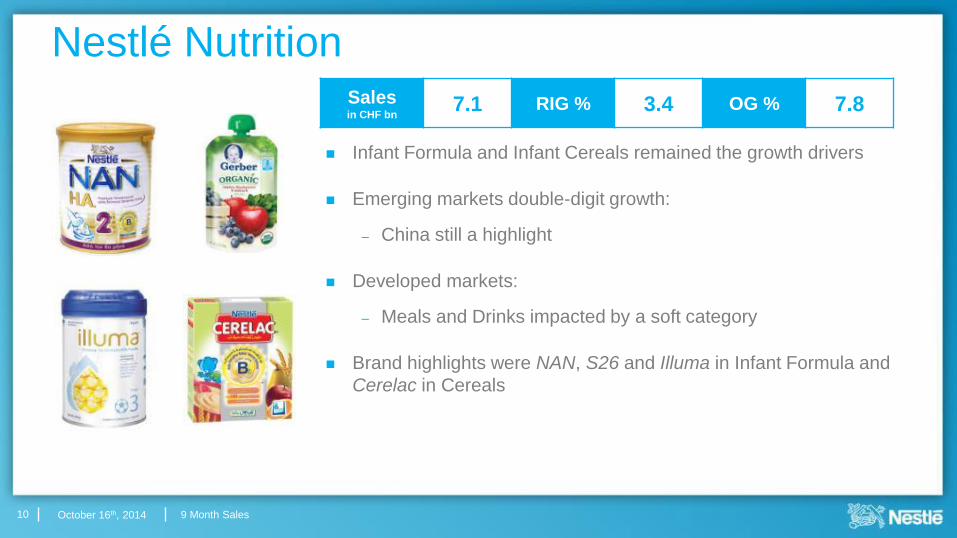
Infant Formula and Infant Cereals remained the growth drivers
Emerging markets double-digit growth:
– China still a highlight
Developed markets:
– Meals and Drinks impacted by a soft category
Brand highlights were NAN, S26 and Illuma in Infant Formula and
Cerelac in Cereals
Nestlé Nutrition
10
Sales in CHF bn
7.1 RIG % 3.4 OG % 7.8
October 16th, 2014 9 Month Sales
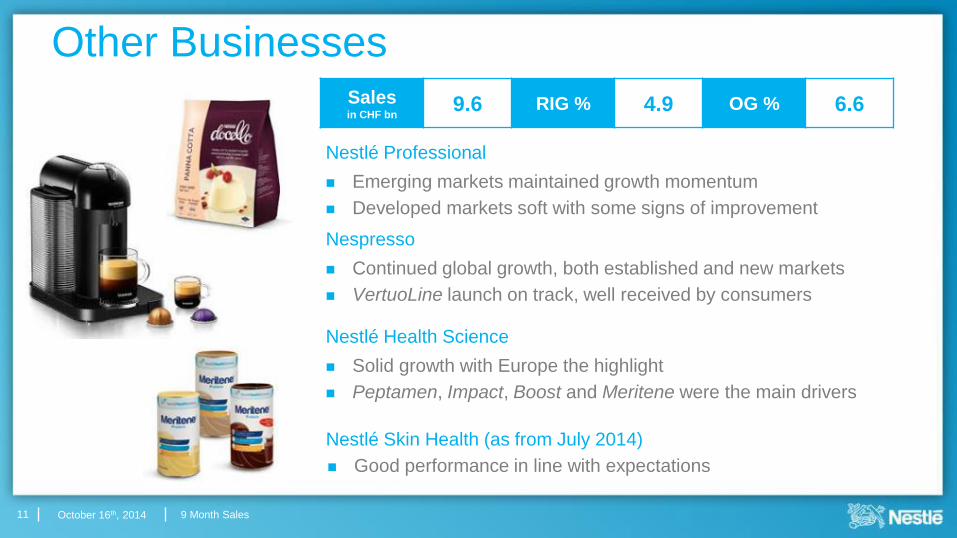
Other Businesses
11
Nespresso
Continued global growth, both established and new markets
VertuoLine launch on track, well received by consumers
Nestlé Professional
Emerging markets maintained growth momentum
Developed markets soft with some signs of improvement
Nestlé Health Science
Solid growth with Europe the highlight
Peptamen, Impact, Boost and Meritene were the main drivers
Nestlé Skin Health (as from July 2014)
Good performance in line with expectations
Sales in CHF bn
9.6 RIG % 4.9 OG % 6.6
October 16th, 2014 9 Month Sales
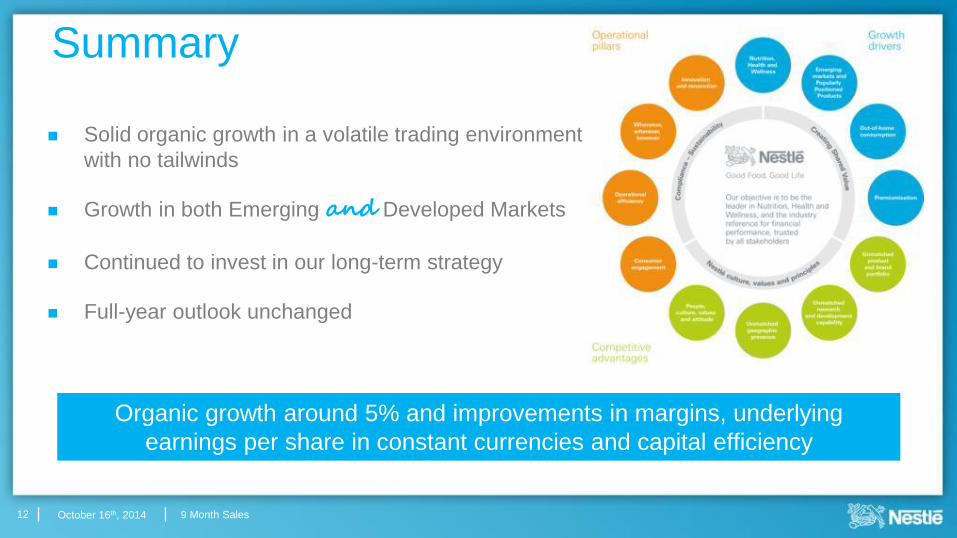
Summary
12
Solid organic growth in a volatile trading environment
with no tailwinds
Growth in both Emerging and Developed Markets
Continued to invest in our long-term strategy
Full-year outlook unchanged
Organic growth around 5% and improvements in margins, underlying
earnings per share in constant currencies and capital efficiency

October 16th, 2014 9 Month Sales 13
9 Month Sales
Discussion

October 16th, 2014 9 Month Sales
Appendix
14
October 16th, 2014 9 Month Sales
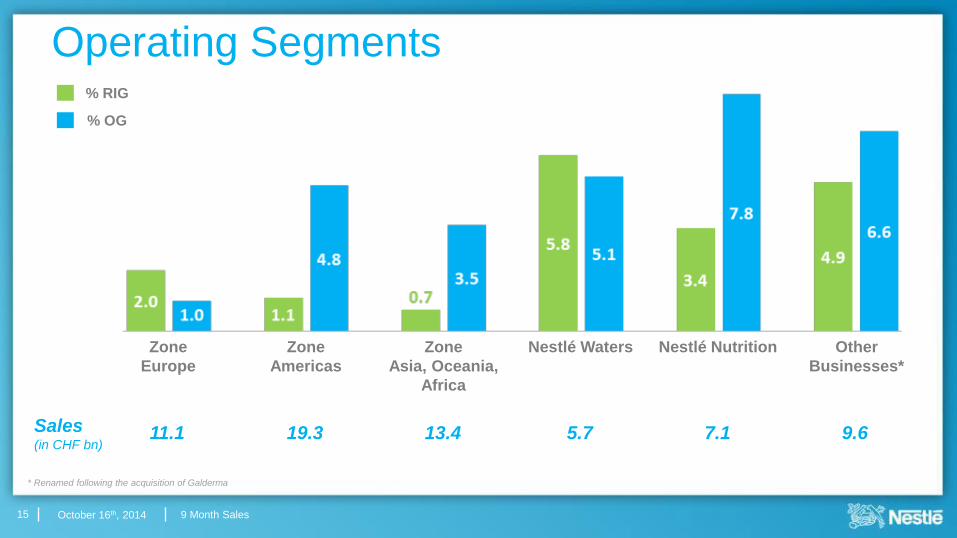
Operating Segments
Zone
Europe
Zone
Americas
Zone
Asia, Oceania,
Africa
Nestlé Waters Nestlé Nutrition Other
Businesses*
% OG
% RIG
15
Sales (in CHF bn)
11.1 19.3 13.4 5.7 7.1 9.6
* Renamed following the acquisition of Galderma
October 16th, 2014 9 Month Sales
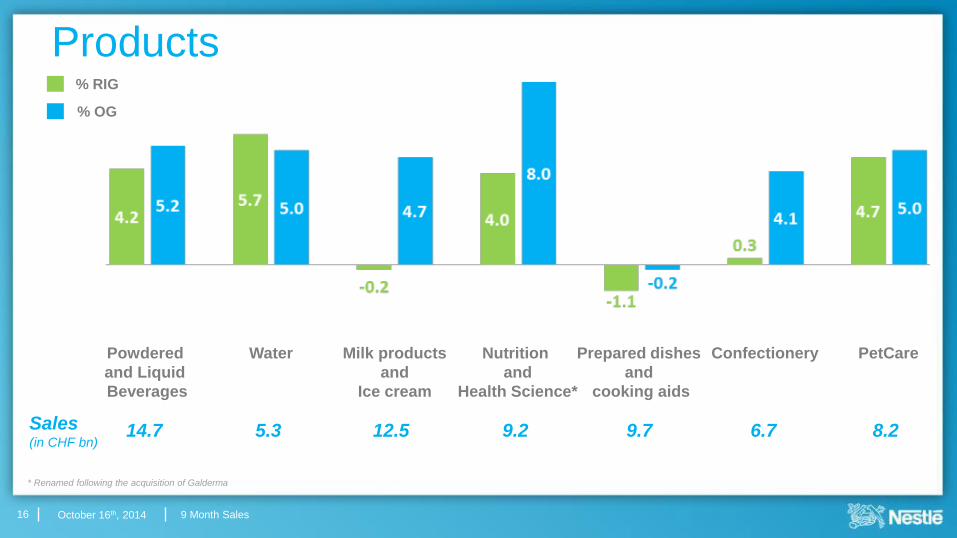
Products
Powdered
and Liquid
Beverages
Water Milk products
and
Ice cream
Nutrition
and
Health Science*
Prepared dishes
and
cooking aids
Confectionery
% OG
% RIG
16
Sales (in CHF bn)
14.7 5.3 12.5 9.2 9.7 6.7 8.2
PetCare
* Renamed following the acquisition of Galderma
October 16th, 2014 9 Month Sales
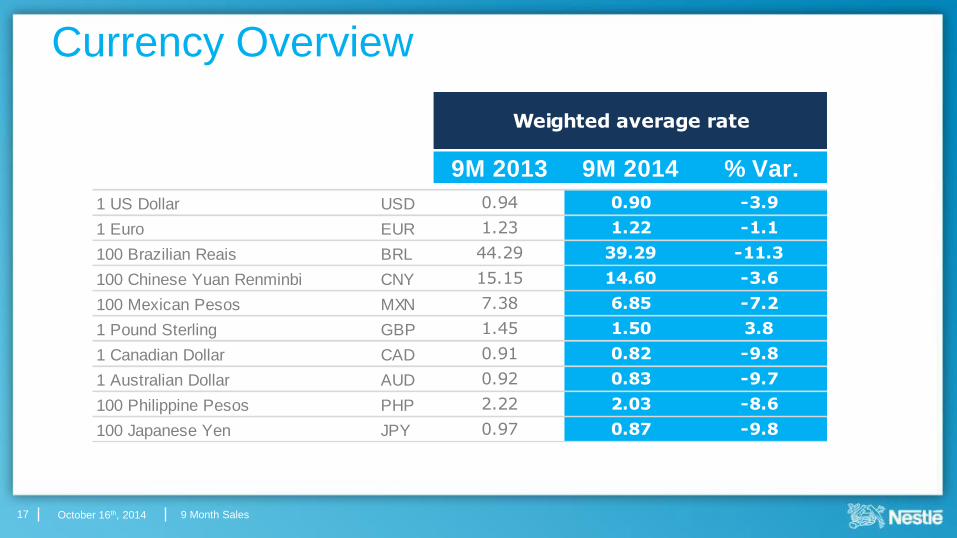
Currency Overview
17
Weighted average rate
9M 2013 9M 2014 % Var.
1 US Dollar USD 0.94 0.90 -3.9
1 Euro EUR 1.23 1.22 -1.1
100 Brazilian Reais BRL 44.29 39.29 -11.3
100 Chinese Yuan Renminbi CNY 15.15 14.60 -3.6
100 Mexican Pesos MXN 7.38 6.85 -7.2
1 Pound Sterling GBP 1.45 1.50 3.8
1 Canadian Dollar CAD 0.91 0.82 -9.8
1 Australian Dollar AUD 0.92 0.83 -9.7
100 Philippine Pesos PHP 2.22 2.03 -8.6
100 Japanese Yen JPY 0.97 0.87 -9.8
October 16th, 2014 9 Month Sales
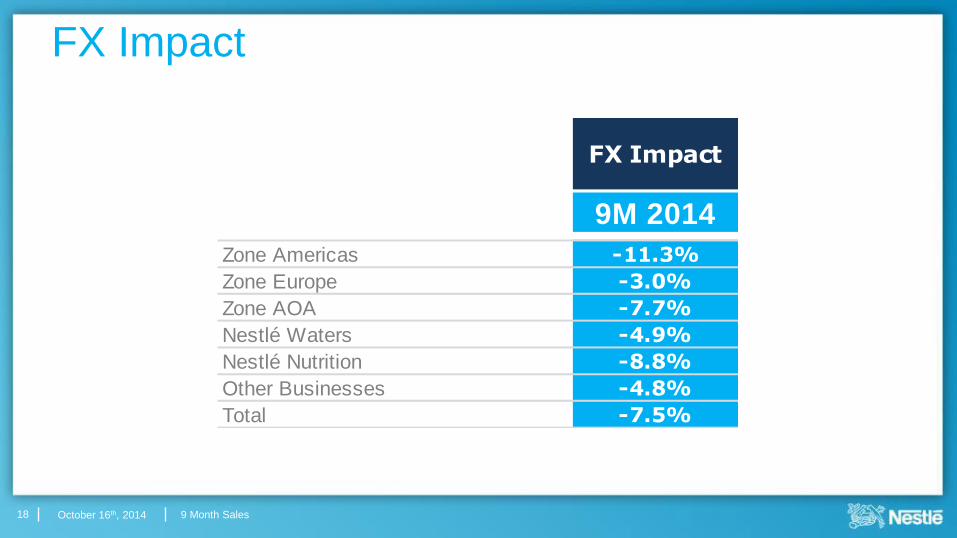
FX Impact
18
FX Impact
9M 2014
Zone Americas -11.3%
Zone Europe -3.0%
Zone AOA -7.7%
Nestlé Waters -4.9%
Nestlé Nutrition -8.8%
Other Businesses -4.8%
Total -7.5%