2012 property casualty insurance market - home ... property‐casualty insurance market...
TRANSCRIPT

Copyright © 2013 Independent Insurance Agents & Brokers of America, Inc. All rights reserved. All data in this report is the property of A.M. Best and is reprinted with its permission.
2012 Property‐Casualty Insurance Market
Opportunities & Competitive Challenges For Independent Agents & Brokers
By Madelyn Flannagan, IIABA Vice President, Education & Research;
and Peter van Aartrijk, CEO, Aartrijk February 27, 2014
I. Introduction .............................................................................................................. 2 II. P‐C Premium & Share Overview ................................................................................ 5 III. Personal Lines .......................................................................................................... 9 Personal Lines Market Share from 1995 to 2012 ....................................................................... 10
Gains & Losses ............................................................................................................................ 11
State‐by‐State Market Share Results ......................................................................................... 13
Private‐Passenger Auto .............................................................................................................. 15
Homeowners .............................................................................................................................. 21
Final Thoughts on Overall Personal Lines Market ...................................................................... 26
IV. Company Expense Comparisons ............................................................................ 27 2012 By‐Company Private Passenger Auto Operating Ratios .................................................... 28
V. Commercial Lines ................................................................................................... 29 Commercial Auto ........................................................................................................................ 32
Workers' Compensation ............................................................................................................. 33
Gains and Losses ......................................................................................................................... 34
State‐by‐State Market Share Results ......................................................................................... 37
VI. About the Data ...................................................................................................... 39

Copyright © 2013‐2014 Independent Insurance Agents & Brokers of America, Inc. All rights reserved. All data in this report is the property of A.M. Best and is reprinted with its permission.
2
I. Introduction & Commentary This is the 18th year the IIABA has reviewed the property and casualty insurance market using premium data provided by A.M. Best Company. Once again, this report is encouraging in several ways in light of how well the Independent Agency System performs in the face of an evolving and challenging marketplace. For a second year in a row, all property‐casualty insurance premium lines grew, building on the market rebound that began in 2011. After two years of solid growth, both personal and commercial lines are approaching their prerecession volumes, and combined are again generating annual premiums of more than $500 billion. Independent agents and brokers (IAs) were well poised to capture a larger piece of the market. Overall their share grew significantly in several states and once again regional IAs outpaced market growth in many business lines nationwide. Furthermore, several IA carriers increased their market share by substantial amounts. IAs outperformed exclusive agency carriers in personal lines and accelerated their personal lines growth considerably more than did direct response insurers:
IAs generated 58% of all of the growth in the homeowners market, growing premiums by nearly 8% over 2011.
IAs grew personal auto premiums more than captive agencies companies
IAs significantly narrowed the “growth gap” with direct response writers to $700 million. (IA premiums grew $1.8 billion in 2012 versus direct response writer growth of $2.5 billion.)
IA carriers also benefited from another great year for commercial lines, which grew by more than $10 billion for a second year in a row. IAs captured their share of this, increasing premiums by $8.2 billion in 2012.
Battling Direct Response Writers After years of trailing direct response giants such as GEICO and Progressive in their desire for personal auto customers and premiums, independent agents and brokers closed the performance gap considerably in 2012. IAs grew premiums in 2012 by $1.8 billion over 2011 levels, just $700 million less than the $2.5 billion growth recognized by direct response firms. This is a vast improvement over 2011, when IAs grew premiums by $200 million over 2010 production levels, compared with $2.0 billion growth in direct response premiums that year. As a result, direct response carriers recognized a very small increase in market share in 2012, coming at the expense of exclusive agencies rather than IA writers. While some in the industry believe direct response writers enjoy an inherent cost structure advantage, the data suggests that not only is this not always true. Several observers say IAs cannot possibly compete against direct response cost models. But the reality is that some IA writers have efficiency ratios close to those enjoyed by direct response carriers. The latter group’s enormous investments in television, radio and online advertising actually are offsetting the “benefit” of not paying agency commissions.

Copyright © 2013‐2014 Independent Insurance Agents & Brokers of America, Inc. All rights reserved. All data in this report is the property of A.M. Best and is reprinted with its permission.
3
Furthermore, capturing a significant number of drivers apparently isn’t helping direct response carriers cross‐sell other policies. While direct response carriers write 18% of personal auto premiums, they generate only 5%, or $4.4 billion, of the $77 billion homeowners market. And they write less than 1% of commercial premiums. The simple reality is that the overwhelming majority of customers who shop for auto insurance online need homeowners or renters, and millions need umbrellas, in‐home business, watercraft, and other lines. Many also own businesses or influence business decisions. Today, more agents and brokers are realizing that online auto insurance shoppers are willing to establish a relationship with someone who can act as a trusted advisor to help them understand risk and protection in today's economy. The advantages that direct response carriers may enjoy during marketing and customer acquisition can become disadvantages during the remainder of the customer life cycle. Many independent agency carriers and agencies are investing in online advertising and the ability to provide instant online quotes at the agency’s website to help capture new customers. And, they are also providing systematic customer communications during the entire customer life cycle. These carriers and agents provide the type of customer service, education and risk management that direct response writers cannot match. Key customer interaction points — such as onboarding, address changes and semiannual renewals — offer opportunities for needs‐assessment conversations. Claims filing and resolution assistance provide agents the opportunity to establish a personal relationship regardless of whether the customer came to the agency via the telephone or website. Given the increasingly robust technology ecosystem supporting them, IA carriers and agencies can provide a plethora of customer conveniences. Examples include allowing customers to use laptops and mobile devices to make payments, to download proof of insurance and other documents, to file initial notices of claim, or to initiate minor account or policy changes. Allowing customers to easily initiate these interactions via electronic channels does not preclude agents from systematically being alerted of these electronic contacts or from contacting them to walk them through the process, answer questions, and offer other assistance if needed. Now that so many industries (e.g., medical, legal and financial services) are supporting email and text communication, consumers will expect to be able to conduct, or at least initiate, business with agents using these pervasive communication methods.
Overall Health of the Independent Agency System The newly released data provide many positive signs that indicate strong overall health and considerable growth opportunities for independent agents and brokers:
IAs still control a majority of the entire p‐c market, writing 57% of all premiums, including a third of all personal lines premiums.
IAs still dominate commercial insurance sales, which have grown by more than $10 billion two years in a row, controlling 79% of these markets.

Copyright © 2013‐2014 Independent Insurance Agents & Brokers of America, Inc. All rights reserved. All data in this report is the property of A.M. Best and is reprinted with its permission.
4
IAs grew premiums and/or market share in 25 of the 50 states. In many states, they dominate both personal and commercial lines. That means IAs in other states have an opportunity to add share in more lines by continuing to focus their efforts.
IAs can be as efficient as other models. While as a sector direct writers and exclusive agent writers have lower expense ratios than IAs, several IA carriers posted personal auto expense ratios that were equal to or better than specific exclusive or direct writers.
IA personal auto premiums grew nine times more in 2012 than they did in 2011. IAs increased premiums $1.8 billion in 2012 — versus a mere $200 million the prior year period.
Many IIABA Best Practices agencies continued to grow in the face of the weak economy and are flourishing now that the property‐casualty market appears to have turned around. Agencies that are easy to do business with, use improved access to technology, and leverage the confidence and customization communicated through the Trusted Choice© brand, have the potential to enjoy robust growth in every state and every product line.
Copyright © 2013‐2014 Independent Insurance Agents & Brokers of America, Inc. All rights reserved. All data in this report is the property of A.M. Best and is reprinted with its permission.
5
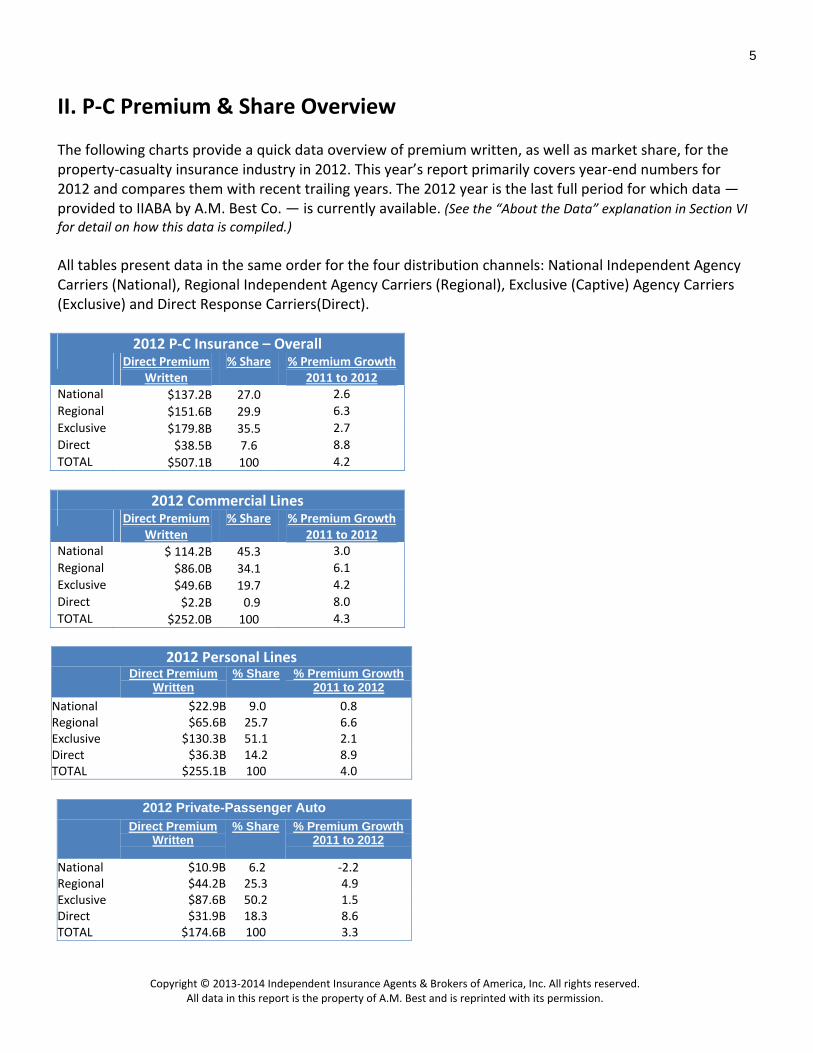
II. P‐C Premium & Share Overview The following charts provide a quick data overview of premium written, as well as market share, for the property‐casualty insurance industry in 2012. This year’s report primarily covers year‐end numbers for 2012 and compares them with recent trailing years. The 2012 year is the last full period for which data — provided to IIABA by A.M. Best Co. — is currently available. (See the “About the Data” explanation in Section VI for detail on how this data is compiled.) All tables present data in the same order for the four distribution channels: National Independent Agency Carriers (National), Regional Independent Agency Carriers (Regional), Exclusive (Captive) Agency Carriers (Exclusive) and Direct Response Carriers(Direct).
2012 P‐C Insurance – Overall Direct Premium
Written % Share % Premium Growth
2011 to 2012 National $137.2B 27.0 2.6
Regional $151.6B 29.9 6.3
Exclusive $179.8B 35.5 2.7
Direct $38.5B 7.6 8.8
TOTAL $507.1B 100 4.2
2012 Personal Lines Direct Premium
Written % Share % Premium Growth
2011 to 2012
National $22.9B 9.0 0.8Regional $65.6B 25.7 6.6Exclusive $130.3B 51.1 2.1Direct $36.3B 14.2 8.9TOTAL $255.1B 100 4.0
2012 Commercial Lines Direct Premium
Written % Share % Premium Growth
2011 to 2012 National $ 114.2B 45.3 3.0
Regional $86.0B 34.1 6.1
Exclusive $49.6B 19.7 4.2
Direct $2.2B 0.9 8.0
TOTAL $252.0B 100 4.3
2012 Private-Passenger Auto Direct Premium
Written % Share % Premium Growth
2011 to 2012
National $10.9B 6.2 ‐2.2Regional $44.2B 25.3 4.9Exclusive $87.6B 50.2 1.5Direct $31.9B 18.3 8.6TOTAL $174.6B 100 3.3

Copyright © 2013‐2014 Independent Insurance Agents & Brokers of America, Inc. All rights reserved. All data in this report is the property of A.M. Best and is reprinted with its permission.
6
The 2012 year saw the strongest property‐casualty market growth since the economy collapsed in 2008. Premiums grew by $20.4 billion, or 4.2%, over 2011 levels. Independent agency companies and their agents captured $12.5 billion of that growth, bringing in a total of $288.7 billion in p‐c premiums.
Regional independent agency companies wrote $151.6 billion — an impressive $9 billion, or 6.3%, more than they wrote in 2011. National IA carriers increased premiums by $3.5 billion or 2.6% over 2011, recording $137.2 billion for 2012. (Note that 2011 data shown in this report reflects data that has adjusted relative to the data shown in last year's report and may not match numbers published last year.)
Direct response carriers wrote $38.5 billion in 2012, an 8.8% or $3.1 billion increase over 2011. They boosted their total market share to 7.6%. Exclusive agents wrote $4.7 billion more than in 2011, for a total of nearly $180 billion.
Exclusive Agency Direct
Writers (Captive)35%
Direct Response Writers8%
National Agency Writers (National IAs)
27%
Regional Agency Writers (Regional IAs)
30%
OVERALL SHARE OF TOTAL 2012 P‐C PRODUCTION
2012 P‐C Insurance – Overall Direct Premium
Written % Share % Premium Growth
2011 to 2012 National $137.2B 27.0 2.6
Regional $151.6B 29.9 6.3
Exclusive $179.8B 35.5 2.7
Direct $38.5B 7.6 8.8
TOTAL $507.1B 100 4.2

Copyright © 2013‐2014 Independent Insurance Agents & Brokers of America, Inc. All rights reserved. All data in this report is the property of A.M. Best and is reprinted with its permission.
7
The commercial lines market continued to be dominated by regional and national independent agency carriers. The market grew a total of 4.3%, or $10.4 billion over 2011 volume for a total of $252 billion. IAs increased share remained constant at 79.4% of the market.
Regional carriers grew premiums $5.0 billion, or 6.1% over 2011, recording a total of $86 billion, and their national counterparts grew premiums 3.0% or $3.3 billion, to secure $114.2 billion for 2012. Direct response carriers grew premiums by 8.1% over 2011, failing once again to surpass just 1% market share of the total commercial market. However, their premium growth over 2011 was $165 million, which was double the 2010 to 2011 growth of $88 million. Exclusive agency carriers controlled just below 20% of the market in 2012. Their $49.6 billion constituted 19.7% of the market. Personal lines premiums grew nearly $10 billion in 2012 over 2011 production levels, coming within $70 million of the impressive milestone. Regional IAs captured a plurality of this growth, increasing production by just more than $4 billion. However, in sharp contrast, national IAs recorded growth of less than $200 million over 2011 volumes, an increase of less than 1% for a total of $22.9 billion for the year. Personal lines once again generated more revenue than did commercial lines ($255.1 billion vs. $252.0 billion), despite a slightly lower growth rate of 4.0% versus the 4.3% reported for commercial lines. However, the personal lines growth was an increase over the less than 3% growth rate reported for 2011.
Exclusive agents enjoyed $2.7 billion or ,2.1% more, in premiums written in 2012 over 2011. They wrote a total of $130.3 billion — still representing a majority of the market. Continuing the pattern established over the last several years, the direct channel again showed impressive growth of nearly 9%, or nearly $3 billion over 2011 levels. This $3 billion is second only to the $4 billion
2012 Commercial Lines Direct Premium
Written % Share % Premium Growth
2011 to 2012 National $ 114.2B 45.3 3.0
Regional $86.0B 34.1 6.1
Exclusive $49.6B 19.7 4.2
Direct $2.2B 0.9 8.0
TOTAL $252.0B 100 4.3
2012 Personal Lines Direct Premium
Written % Share % Premium Growth
2011 to 2012
National $22.9B 9.0 0.8Regional $65.6B 25.7 6.6Exclusive $130.3B 51.1 2.1Direct $36.3B 14.2 8.9TOTAL $255.1B 100 4.0
Copyright © 2013‐2014 Independent Insurance Agents & Brokers of America, Inc. All rights reserved. All data in this report is the property of A.M. Best and is reprinted with its permission.
8
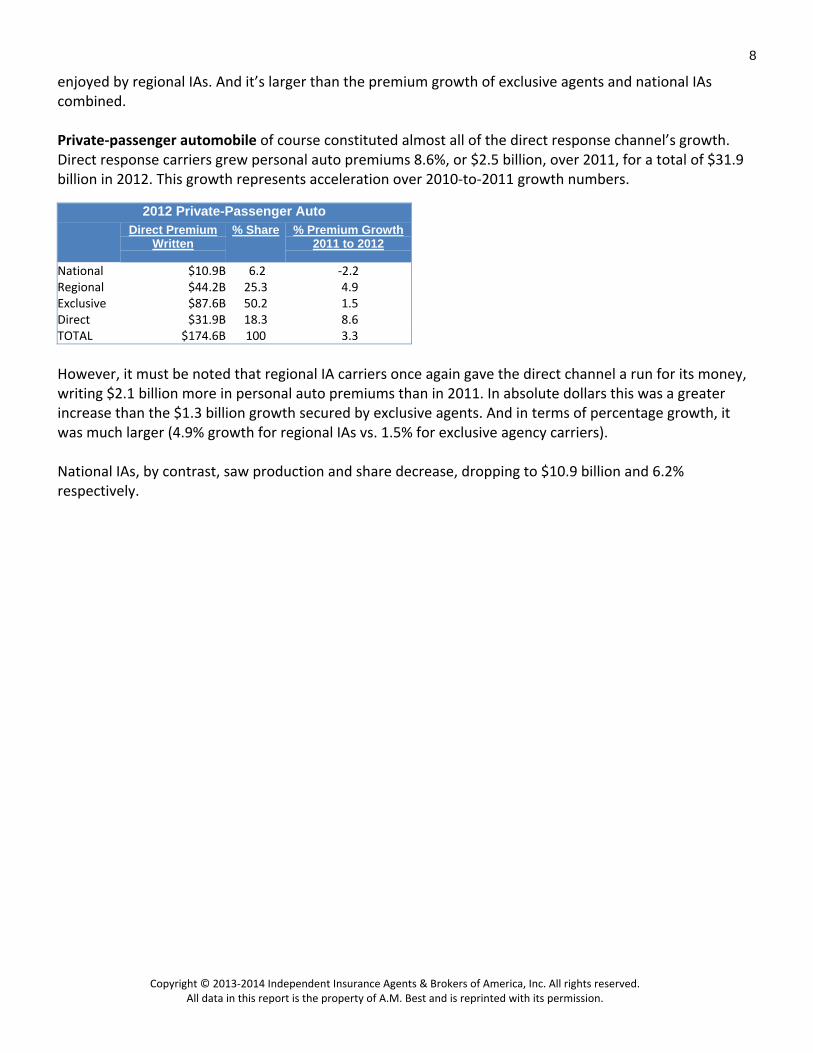
enjoyed by regional IAs. And it’s larger than the premium growth of exclusive agents and national IAs combined. Private‐passenger automobile of course constituted almost all of the direct response channel’s growth. Direct response carriers grew personal auto premiums 8.6%, or $2.5 billion, over 2011, for a total of $31.9 billion in 2012. This growth represents acceleration over 2010‐to‐2011 growth numbers.
However, it must be noted that regional IA carriers once again gave the direct channel a run for its money, writing $2.1 billion more in personal auto premiums than in 2011. In absolute dollars this was a greater increase than the $1.3 billion growth secured by exclusive agents. And in terms of percentage growth, it was much larger (4.9% growth for regional IAs vs. 1.5% for exclusive agency carriers). National IAs, by contrast, saw production and share decrease, dropping to $10.9 billion and 6.2% respectively.
2012 Private-Passenger Auto Direct Premium
Written % Share % Premium Growth
2011 to 2012
National $10.9B 6.2 ‐2.2Regional $44.2B 25.3 4.9Exclusive $87.6B 50.2 1.5Direct $31.9B 18.3 8.6TOTAL $174.6B 100 3.3

Copyright © 2013‐2014 Independent Insurance Agents & Brokers of America, Inc. All rights reserved. All data in this report is the property of A.M. Best and is reprinted with its permission.
9
III. Personal Lines
2012 Personal Lines Direct Premium
Written % Share % Premium Growth
2011 to 2012
National $22.9B 9.0 0.8Regional $65.6B 25.7 6.6Exclusive $130.3B 51.1 2.1Direct $36.3B 14.2 8.9TOTAL $255.1B 100 4.0
The personal lines market grew faster in 2012 than it did in 2011, jumping from a growth rate of close to 2.5% in 2011 to 4.0% growth in 2012. As mentioned above, personal lines grew just shy of $10 billion, surpassing the quarter‐trillion dollar mark by a solid $5 billion in premiums, for a grand total of $255.1 billion for the year. While the market is still dominated by captive agency carriers, independent agency companies continued to climb above the one‐third market share number they hit a few years ago, threatening the exclusive channel’s outright majority of market share. National and regional IAs together grew $4.3 billion, much more than either the direct channel or captive agents. IAs wrote $88.6 billion in personal lines policies. This represents a combined market share of 34.7%, comfortably above the one‐third mark, which together is slightly higher than in 2011 and represents more than twice the market share as the direct channel (14.2%). Regional IA carriers posted most of this growth. But national IA companies, which saw nearly no growth over 2010, also were up over 2011 levels. While the national IAs' 9.0% market share is slightly lower than last year's 9.3%, they continue to write 1 of every 11 personal lines premium dollars.

Copyright © 2013‐2014 Independent Insurance Agents & Brokers of America, Inc. All rights reserved. All data in this report is the property of A.M. Best and is reprinted with its permission.
10
A. Personal Lines Market Share: 1995 ‐ 2012 The IIABA Market Share report has consistently looked at this data over the long term to find macro shifts affecting independent agents. A look back to 1995 — when IIABA began reviewing the A.M. Best data — shows that the direct response channel and regional independent agency carriers have grown at the expense of captive carriers and national IA companies. (Note: 2011 data was updated and may not match numbers reported in last year’s report.)
Several key shifts are noticeable in the above chart, which covers 18 years of data:
While captive agency carriers continue to control approximately half of the personal lines market, this is down 8.3 percentage points from their market share in 1995 of just below 60%. However, most of this decrease occurred in the 15‐year period between 1995 and 2010, and captive market share has bounced between 50% and 52% since.
Regional IA carriers now enjoy 7.5 percentage points more market share than in 1995, but this shift too occurred primarily between 1995 and 2010. Since then regional carrier share has bounced between 25.1% and 26.1% and is now approximately halfway between those marks.
Direct response writers have doubled their market share, climbing steadily from 7.1% in 1995 to 14.4% in 2012.
The market share of national IA carriers has dropped more than 6 percentage points since 1995, although that decrease appears to have slowed since 2010.
15.3%15.0% 12.7%
9.6% 9.3% 9.0%
18.2%21.8% 23.3%
26.1% 25.1% 25.7%
59.4%54.8% 53.0%
50.0% 52.0% 51.1%
7.1% 8.5% 11.1%
12.9% 13.6% 14.2%
1995 2000 2005 2010 2011 2012
Personal Lines Market Share: 1995 ‐ 2012
National IA Regional IA Exclusive Agency Direct Response

Copyright © 2013‐2014 Independent Insurance Agents & Brokers of America, Inc. All rights reserved. All data in this report is the property of A.M. Best and is reprinted with its permission.
11
B. Gains & Losses in Personal Lines Share The following national independent agency companies with more than $100 million in premiums experienced the following changes in their 2012 market share relative to 2011: (Note for all tables: It is easier for carriers with smaller books in this line to show larger percentage changes in market share because they are working from a smaller premium base.)
National IA Carrier % Change in
Market Share
QBE Americas Group 10.5 Cincinnati Insurance Companies 7.2 ACE INA Group 7.0 Foremost Corporation Group 4.6 Assurant P‐C Group 2.9
Meanwhile, the following regional independent agency companies with at least $100 million in premiums saw at least 1 percentage point growth in their personal lines market share in 2012 over the prior year: Regional IA Carrier
% Growth in Market Share
ASI Companies 18.7 Infinity P‐C Group 11.2 Plymouth Rock Companies 7.5 Integon National Group 7.0 Safeway Insurance Group 5.8 Nationwide Agency Companies 5.6 Liberty Mutual Agency Companies 3.9 Drive Insurance 3.5 Erie Insurance Group 3.3 Selective Insurance Group 2.8 Safety Group 2.4 Pekin Insurance Group 2.4 Tower Group Companies 2.3 Arbella Insurance Group 1.5 Auto‐Owners Insurance Group 1.0

Copyright © 2013‐2014 Independent Insurance Agents & Brokers of America, Inc. All rights reserved. All data in this report is the property of A.M. Best and is reprinted with its permission.
12
Conversely, the national and regional independent agency carriers below — each posting more than $100 million in personal lines premiums — all declined by 4% or more in market share in 2012:
National/Regional IA Carrier % Loss in Market
Share
Grange Mutual Casualty Pool ‐4.4 Motorists Insurance Pool ‐4.7 MAPFRE North America Group ‐4.9 Hartford Insurance Group ‐5.0 Travelers Group ‐5.5 Allianz of America Companies ‐6.3 AIG (less direct response) ‐7.8 Kemper P‐C Group ‐9.2 Palisades Group ‐10.7 Main Street America Group ‐11.2
Below are major captive agency and direct response competitors (with premiums greater than $750 million) that experienced a change in market share greater than 1% in 2012, followed by market share changes for the direct response competitors: Major Captive Agency Competitors
% Change in Market Share
Liberty Mutual Direct Cos. 6.3 Texas Farm Bureau Group 4.5 Ameriprise P‐C Companies 3.5 Farm Bureau P‐C Group 2.8 Kentucky Farm Bureau Group ‐1.1 Farmers (less Foremost) ‐1.2 State Farm Group ‐1.8 California State Auto Group ‐1.9 COUNTRY Financial P‐C Group ‐2.8 American Family Insurance Group ‐3.2 Sentry Insurance Group ‐3.4 North Carolina Farm Bureau Group ‐4.1 Allstate Direct Companies ‐4.4 Alfa Insurance Group ‐4.5 Nationwide Direct Companies ‐5.4
Major Direct Response Competitors % Growth in Market
Share
USAA Group 5.2 Government Employees Group 5.0 Progressive Direct Companies 3.2 Amica Mutual Group 2.1

Copyright © 2013‐2014 Independent Insurance Agents & Brokers of America, Inc. All rights reserved. All data in this report is the property of A.M. Best and is reprinted with its permission.
13
C. State‐by‐State Market Share Results: Personal Lines The extent to which independent agents have established themselves in the personal lines market varies considerably across the 50 states and the District of Columbia. In 2012, the range varied massively, from Massachusetts where IAs wrote 75.9% of premiums down to the much more modest market share of 14.2% posted by IAs in Alaska. While New England states are a traditional stronghold for independent agents, several have seen decreased share over the last several years. Once again, IAs in Massachusetts lost almost 1.5 percentage points of market share, dropping from 77.4% to 75.9%. From 2010 to 2012, the IA share declined 3.0 points. However, Massachusetts was the only New England state that lost significant share in 2012. Maine, Connecticut, Delaware, and Rhode Island all held onto all but a fraction of 1 percentage point of their shares — each dropping less than 0.5 points. And in New Hampshire and Vermont, IAs lost only 0.6 and 0.7 points of market share respectively. In total, the IA share moved less than 1 percentage point up or down in 47 states in 2012, with half of those gaining somewhere less than a full point in share, and half losing less than a point. Only three states (Florida, North Carolina and West Virginia) gained more than 1 full percentage point in share. Florida jumped 1.3 percentage points in 2011 and another 2.3 percentage points in 2012, climbing from 45.7% in 2010 to 49.3% share in 2012. North Carolina also has climbed over the last two years, moving from 31.8% in 2010 to 33.0% in 2011 and to 34.3% in 2012. West Virginia climbed 1.1 percentage points in 2012 after a flat year in 2011. This means that independent agents and brokers made at least slight improvements in market share in one‐half of states, including jurisdictions with a relatively low share, such as Colorado and Mississippi (both at 22.7%), and those with a relatively high share, such as Wisconsin (42.9%) and Pennsylvania (44.9%).

Copyright © 2013‐2014 Independent Insurance Agents & Brokers of America, Inc. All rights reserved. All data in this report is the property of A.M. Best and is reprinted with its permission.
14
(Important note: This 2012 update to the data significantly revised downward share numbers for states. Last year we reported that 2010 had eight states at more than 50% and six had more than 50% in 2011. This year’s data revised that to just two each.)
Number of States with IA Share by Range/Year (Personal Lines)
Share 2007 2008 2009 2010 2011 2012
More than 50% 4 4 8 2 2 2
45‐50% 4 5 4 5 5 5
40‐45% 8 6 5 7 7 6
35‐40% 4 6 9 5 5 6
30‐35% 11 10 8 10 7 9
Less than 30% 20 20 17 22 25 23
A single percentage point of just the annual growth represents an opportunity of $100 million in premiums written.

Copyright © 2013‐2014 Independent Insurance Agents & Brokers of America, Inc. All rights reserved. All data in this report is the property of A.M. Best and is reprinted with its permission.
15
D. Private‐Passenger Automobile
2012 Private-Passenger Auto Direct Premium
Written % Share % Premium Growth
2011 to 2012
National $10.9B 6.2 ‐2.2Regional $44.2B 25.3 4.9Exclusive $87.6B 50.2 1.5Direct $31.9B 18.3 8.6TOTAL $174.6B 100 3.3
With a total of $174.6 billion in premiums written in 2012, personal automobile continues to constitute more than two‐thirds of personal lines markets and more than one‐third of the total property and casualty market, including both personal and commercial lines. Growing by more than $5.6 billion in one year, the personal auto market grew nearly twice as fast in 2012 as it did in 2011. The market grew 3.3% in 2012 over 2011 versus a more modest 1.6% growth in 2011 over 2010. This major jump in growth rate was not, however, driven by direct response carriers, as one may initially assume. While direct response did grow somewhat more in 2012 than in 2011, regional IAs' premiums jumped much higher in 2012 than they did in 2011. If we look at how much faster each channel grew in 2012 versus how much it grew in 2011, we see that regional IA carrier premiums drove this jump much more so than did direct response carriers. In fact, regional IAs grew four times as much in 2012 as they did in 2011, growing $2.0 billion in 2012 versus only $0.5 billion in 2011. That is $1.5 billion more growth in 2012 than in 2011. By contrast, direct response carriers grew only $0.5 billion more in 2012 than in 2011, growing $2.5 billion in 2012 versus $2.0 billion in 2011. The direct response market share continued to climb to 18.3% of the 2012 personal auto market and is now up nearly 1 percent over 2011’s 17.4% share. However, IA market share (national and regional combined) held solid at about 31.6% of the overall market.
Copyright © 2013‐2014 Independent Insurance Agents & Brokers of America, Inc. All rights reserved. All data in this report is the property of A.M. Best and is reprinted with its permission.
16
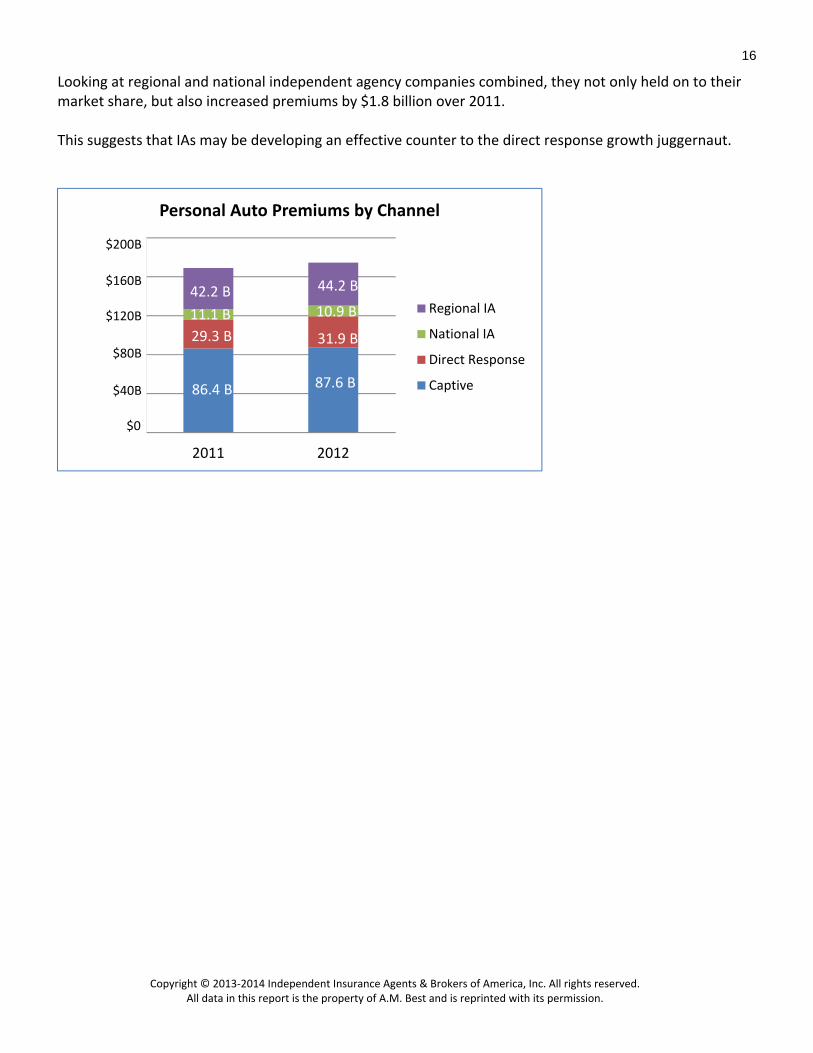
Looking at regional and national independent agency companies combined, they not only held on to their market share, but also increased premiums by $1.8 billion over 2011. This suggests that IAs may be developing an effective counter to the direct response growth juggernaut.
$
$40000000
$80000000
$120000000
$160000000
$200000000
2011 2012
Personal Auto Premiums by Channel
Regional IA
National IA
Direct Response
Captive$40B
$0
$80B
$120B
$160B
$200B
86.4 B
31.9 B
87.6 B
29.3 B
42.2 B 44.2 B
11.1 B 10.9 B

Copyright © 2013‐2014 Independent Insurance Agents & Brokers of America, Inc. All rights reserved. All data in this report is the property of A.M. Best and is reprinted with its permission.
17
E. Personal Auto Market Share: 1995 ‐ 2012 Only about 1 percentage point of market share shifted between 2011 and 2012, with captive agency companies yielding approximately 1% to direct response carriers. Exclusive agency companies dropped from 51.1% of the market down to 50.2%, while direct response climbed from 17.4% to 18.3%. Independent agency carriers together held their market share, and in fact climbed ever so slightly from 31.5% in 2011 to 31.6% in 2012. However, by looking more closely we see that regional IA carriers increased from 24.9% to 25.3%, while national IA carriers dropped from 6.6% to 6.2%. For the second year in a row, direct response companies produce more than one of every six dollars in personal auto; the channel’s share closed at 18.3%, up from 17.4% in 2011.
A look back to 1995 shows the market share mix has changed considerably.
From this perspective, the long‐term trend for captive carriers has resulted in the loss of nearly 10 percentage points of market share since 1995. This is characterized by:
A steep 4 percentage point drop in 2000.
A gradual drop from 54.4% in 2000 down to 52.5% in 2009.
Another significant drop to just below 50% in 2010.
A bounce back to around 50% in 2011 and 2012. Regional IAs companies have climbed nearly 7 percentage points during those 18 years, with a significant jump in 2000 followed by a gradual climb from 22% in 2000 to 24% in 2009, and then a jump of nearly 2.5 percentage points in 2010 before losing part of that gain in the two years since.
Captive Carriers50.2%
Regional IAs25.3%
National IAs6.2%
Direct Response18.3%
Share of 2012 Personal Auto Production

Copyright © 2013‐2014 Independent Insurance Agents & Brokers of America, Inc. All rights reserved. All data in this report is the property of A.M. Best and is reprinted with its permission.
18
By contrast, national IAs carriers have lost more than half of the 14.1% market share they enjoyed in 1995, closing 2012 with 6.2%. Their share remained fairly stable from 1995 to 2000, taking a significant dip in 2001, but stabilizing through 2005, when they began a steady, but slow decline from 2006 through 2012.
14.1%
13.7%
11.8%7.0% 6.2%
18.4%22.2% 23.9%
26.4% 25.3%
59.8% 54.4%52.8% 49.1% 50.2%
7.7%9.8%
12.5%16.4%
18.3%
‐10%
0%
10%
20%
30%
40%
50%
60%
95 96 97 98 99 00 01 02 03 04 05 06 07 08 09 10 11 12
Personal Auto Share: 1995 ‐ 2012Data Labels for '95, '00, '05, '10, '12
National IA Regional IA Exclusive Agency Direct Response

Copyright © 2013‐2014 Independent Insurance Agents & Brokers of America, Inc. All rights reserved. All data in this report is the property of A.M. Best and is reprinted with its permission.
19
While the national IAs as a group lost personal auto share slightly and regional IAs gained share, individual carrier performance was quite mixed between the two groups. Among those with at least $100 million in direct premiums written, companies showing at least a 1% gain in personal auto market share for 2012 versus 2011 include: National/Regional IA Carrier % Growth in
Share American Independent Companies 14.7 Foremost Corporation Group 12.2 Infinity P‐C Group 12.0 Plymouth Rock Companies 9.7 Integon National Group 7.8 Nationwide Agency Companies 7.7 ACE INA Group 7.6 Cincinnati Insurance Companies 6.5 MGA Insurance Company Inc. 5.9 Safeway Insurance Group 5.9 Drive Insurance 4.3 Pekin Insurance Group 2.2 Safety Group 1.9 Liberty Mutual Agency Companies 1.7 Arbella Insurance Group 1.5 Erie Insurance Group 1.0 Auto‐Owners Insurance Group 1.0
Among those with at least $100 million in direct premiums written, companies showing at least a 5% loss in personal auto market share for 2012 versus 2011 include:
Among the big direct‐response players, GEICO increased premiums by more than $1 billion again in 2012 for a total of $16.7 billion in 2012. GEICO thus boosted share by 5.8% in 2012 after increasing in 2011 by 6.1% over 2010 volumes.
National/Regional IA Carrier % Loss of Market Share
Hartford Insurance Group ‐5.0 Tower Group Companies ‐5.4 Allianz of America Companies ‐6.3 MAPFRE North America Group ‐6.4 Grange Mutual Casualty Pool ‐6.7 Travelers Group ‐6.9 Main Street America Group ‐8.8 QBE Americas Group ‐10.8 Palisades Group ‐11.2 AIG (less direct response) ‐11.2 Kemper P‐C Group ‐11.6

Copyright © 2013‐2014 Independent Insurance Agents & Brokers of America, Inc. All rights reserved. All data in this report is the property of A.M. Best and is reprinted with its permission.
20
Large military family provider USAA once again increased premiums by more than $500 million in 2012, boosting their share by 5.1% to $8.4 billion total for 2012. Comparable percentage changes in market share in 2012 (over year‐prior numbers) for agents’ major competitors were as follows:
Among major captive agency carriers with more than $500 million in annual premiums, comparable percentage changes in market share in 2012 (over year‐prior numbers) for agents’ major competitors were as follows: Major Captive Agency Competitors % Growth in
Market Share
Liberty Mutual Direct Companies 6.1 Texas Farm Bureau Group 2.7 NJM Insurance Group 0.5 Ameriprise P‐C Companies 0.0 Alfa Insurance Group ‐0.4 Auto Club Group ‐0.5 Farmers less Foremost ‐0.6 Auto Club Enterprises ‐0.6 Southern Farm Bureau ‐1.3 State Farm Group ‐1.3 Tennessee Farmers Ins. Companies ‐1.5 Shelter Insurance Companies ‐1.7 Sentry Insurance Group ‐2.0 California State Auto Group ‐2.4 American Family Insurance Group ‐3.9 Allstate Direct Companies ‐4.3 COUNTRY Financial P‐C Group ‐4.5 Nationwide Direct Companies ‐7.0
Major Direct Response Competitors
% Growth in Market Share
GEICO 5.8
USAA Group 5.1
Progressive Direct Cos. 3.9
Amica Mutual Group 1.6

Copyright © 2013‐2014 Independent Insurance Agents & Brokers of America, Inc. All rights reserved. All data in this report is the property of A.M. Best and is reprinted with its permission.
21
F. Homeowners Insurance Market
2012 Homeowners
Direct Premium Written
% Share % Premium Growth2011 to 2012
National $11.6B 15.1 3.9 Regional $20.3B 26.4 10.4 Exclusive $40.8B 52.9 3.3 Direct $ 4.4B 5.7 11.1 TOTAL $77.1B 100 5.6
The homeowners insurance market grew slightly faster in 2012 than in 2011, increasing $4.1 billion in 2012, up slightly from the approximately $3 billion it grew in 2011 over 2010. That $4.1 billion represented 5.6% growth over the $73 billion written in 2011, for a total of $77.1 billion in 2012. This 5.6% growth constitutes the fastest growth since the collapse of the housing market. While homeowners premium continued to grow even during the recession, the 2012 rate of 5.6% also represents an acceleration of growth during each of the last three years.
Fully 45% of this growth was driven by regional IAs, who wrote $20.3 billion, an increase of $1.9 billion, or a huge 10.4% increase. National IAs wrote $11.6 billion in premiums in 2012, an increase of $400 million or 3.9% over 2011. Taken together, national and regional IAs wrote a total of $31.9 billion of the $77.1 billion written in 2012, representing 41.4% of the homeowners market. Direct response also enjoyed double‐digit homeowners premium growth, writing 11.1% more in 2012 than 2011. However, because direct response companies only control 5.7% of the market, this impressive growth was off of a much smaller base.
6.1%7.4%
3.0% 2.2% 3.2% 3.0%4.5% 5.6%
2005 2006 2007 2008 2009 2010 2011% 2012
Homeowners Premium Growth

Copyright © 2013‐2014 Independent Insurance Agents & Brokers of America, Inc. All rights reserved. All data in this report is the property of A.M. Best and is reprinted with its permission.
22
In absolute dollars, direct response generated $4.4 billion in 2012, about $400 million more than it did in 2011. While captive agents continued to dominate the homeowners market and grew premiums by more than $1 billion in 2012, their market share continued to slip slightly. Captive agency carriers wrote $40.7 billion in 2012, up $1.3 billion (or 3.3%) over 2011. However, their growth was slightly less than the market average, and so their overall share dropped from 54.0% to 52.9% of the market.
Captive Carriers52.9%
Regional IAs26.4%
National IAs15.1%
Direct Response5.7%
2012 Homeowners Market Share by Channel

Copyright © 2013‐2014 Independent Insurance Agents & Brokers of America, Inc. All rights reserved. All data in this report is the property of A.M. Best and is reprinted with its permission.
23
G. Homeowners Market Share: 2005 ‐ 2012 The eight‐year view of the homeowners market tells the story of a slight shift where regional independent agency carriers appear to capture several percentage points of market share at the expense of exclusive agency companies. While captive agencies still have a solid majority at 52.9% of the market, this is down from a prerecession high of 56.6% in 2008. Conversely, regional IA companies write 26.4% of the market now, up 4 percentage points from 2008 and up 4.5% from 2006. National IA companies have slowly but surely lost a few fractions of a percentage point each year, culminating in a 1.5 percentage point decrease in share since 2005. Quite unlike its strong success in personal auto, direct response has grown very slowly in homeowners, up only six‐tenths of a percentage point over the last eight years, and still writing a modest 5.7% of the market. (Please refer to notes below regarding data that may have impacted homeowners share numbers.)
16.6% 16.8% 16.1% 16.1% 15.6% 15.7% 15.3% 15.1%
22.9% 21.9% 22.2% 22.4% 23.1% 24.9% 25.2% 26.4%
55.6% 56.1% 56.3% 56.6% 56.2%52.4% 54.0% 52.9%
4.9% 5.2% 5.4% 4.9% 5.1% 5.2% 5.4% 5.7%
2005 2006 2007 2008 2009 2010 2011 2012
Homeowners Share: 2005 ‐ 2012
National IA Regional IA Exclusive Agency Direct Response
Copyright © 2013‐2014 Independent Insurance Agents & Brokers of America, Inc. All rights reserved. All data in this report is the property of A.M. Best and is reprinted with its permission.
24
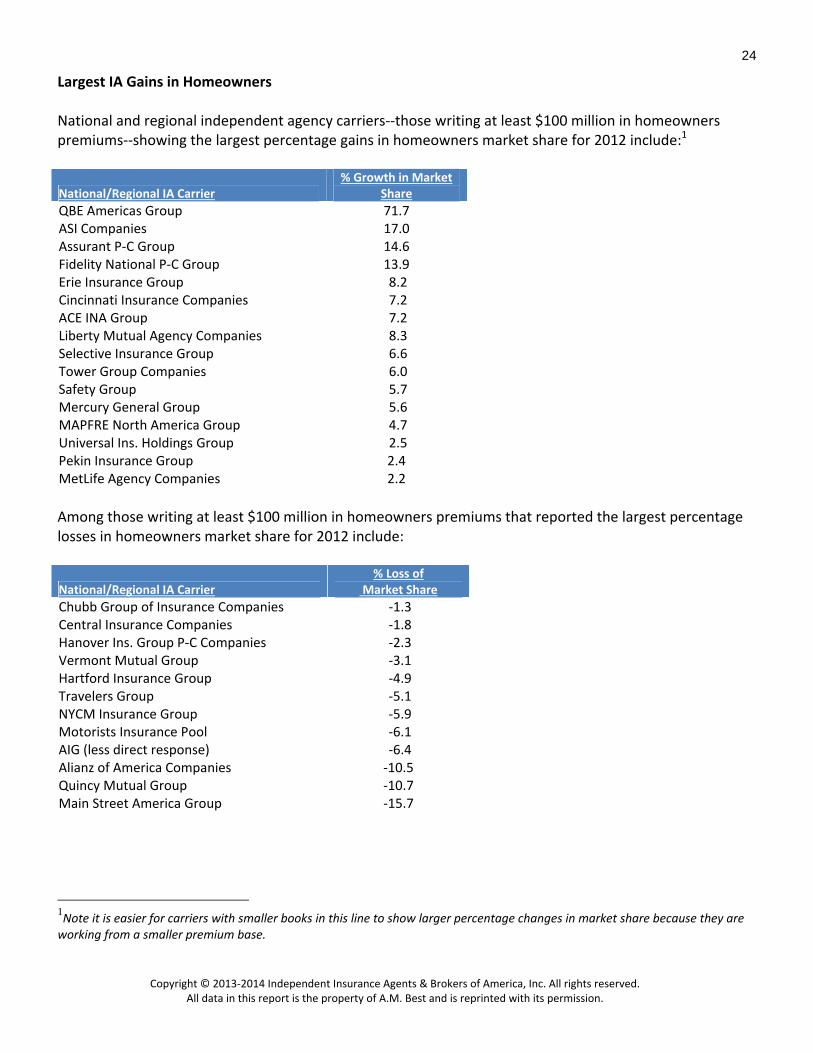
Largest IA Gains in Homeowners National and regional independent agency carriers‐‐those writing at least $100 million in homeowners premiums‐‐showing the largest percentage gains in homeowners market share for 2012 include:1
National/Regional IA Carrier % Growth in Market
Share
QBE Americas Group 71.7 ASI Companies 17.0 Assurant P‐C Group 14.6 Fidelity National P‐C Group 13.9 Erie Insurance Group 8.2 Cincinnati Insurance Companies 7.2 ACE INA Group 7.2 Liberty Mutual Agency Companies 8.3 Selective Insurance Group 6.6 Tower Group Companies 6.0 Safety Group 5.7 Mercury General Group 5.6 MAPFRE North America Group 4.7 Universal Ins. Holdings Group 2.5 Pekin Insurance Group 2.4 MetLife Agency Companies 2.2
Among those writing at least $100 million in homeowners premiums that reported the largest percentage losses in homeowners market share for 2012 include:
National/Regional IA Carrier % Loss of
Market Share
Chubb Group of Insurance Companies ‐1.3 Central Insurance Companies ‐1.8 Hanover Ins. Group P‐C Companies ‐2.3 Vermont Mutual Group ‐3.1 Hartford Insurance Group ‐4.9 Travelers Group ‐5.1 NYCM Insurance Group ‐5.9 Motorists Insurance Pool ‐6.1 AIG (less direct response) ‐6.4 Alianz of America Companies ‐10.5 Quincy Mutual Group ‐10.7 Main Street America Group ‐15.7
1Note it is easier for carriers with smaller books in this line to show larger percentage changes in market share because they are working from a smaller premium base.

Copyright © 2013‐2014 Independent Insurance Agents & Brokers of America, Inc. All rights reserved. All data in this report is the property of A.M. Best and is reprinted with its permission.
25
Competitors Of the direct response competitors, only USAA writes more than $1 billion in homeowners premiums. Major Direct Response Competitors
% Growth in Market Share
USAA Group 5.5 Amica Mutual Group 3.1 Progressive 1.3
Below are market share gains or losses for captive agencies with more than $100 million in homeowners premiums: Major Captive Agent Competitors*
% Change in Market Share
Ameriprise P‐C Companies 17.1 Texas Farm Bureau Group 6.5 Liberty Mutual Direct Companies 6.4 Farm Bureau P‐C Group 4.7 NJM Insurance Group 4.5 Tennessee Farmers Ins. Companies 4.0 Homesite Group 3.8 Auto Club Enterprises 2.6 Shelter Insurance Companies 1.4 COUNTRY Financial PC Group ‐1.6 American Family Insurance Group ‐2.0 Farmers (less Foremost) ‐2.3 State Farm Group ‐2.9 Farm Bureau Mutual Ins. of AR ‐3.1 Horace Mann Insurance Group ‐3.7 Nationwide Direct Companies ‐4.0 Allstate Direct Companies ‐4.3 American National P&C Group ‐5.4 Munich‐American Holding Corp. ‐5.9 North Carolina Farm Bureau Group ‐7.9 Georgia Farm Bureau Group ‐8.6 Alfa Insurance Group ‐14.4

Copyright © 2013‐2014 Independent Insurance Agents & Brokers of America, Inc. All rights reserved. All data in this report is the property of A.M. Best and is reprinted with its permission.
26
Final Thoughts on the Overall Personal Lines Market As noted in IIABA’s previous market share reports, independent agents and brokers have a lucrative opportunity in this enormous insurance consumer marketplace:
More than one‐quarter of a trillion dollars now are written in personal line premiums each year. Booking a market share of what appears to be a mere 0.1% actually translates to more than $250 million per year in premiums written.
The personal lines market is slightly larger than the commercial lines market. At $255 billion in total premiums, personal is $3 billion larger than the $252 billion commercial basket.
Personal lines premiums grew nearly $10.0 billion in 2012 over 2011 — and just 1 percentage point of the annual growth represents an opportunity of $100 million in premiums written.
The independent agency carriers’ overall share is higher now than it was during the 1990s, and regional IAs have increased their market share from about 18% to almost 26% of the personal lines market.
IAs were able to grow personal lines market share at least slightly in 26 states.
Private‐passenger auto alone represents more than one‐third of the total p‐c premium pool, including commercial lines. The sheer size of that market presents an attractive opportunity, particularly in those states where the IA channel isn’t saturated.
Relative to commercial lines — truly dominated by independent agents and brokers —auto, home and related personal lines of coverage represent a massive pool of untapped potential into which independent agents and brokers can wade. Well‐managed, strategically thinking agencies are seeking customers in all lines of coverage, including personal lines.
Many IAs are competing locally with the direct response companies and captive agencies by combining customized service and advanced technology in their personal lines marketing. In addition to exceptional personal service, agents are using real time pricing and communications technologies to provide a set of competitively priced products and choices from multiple Trusted Choice insurance brands, practices that direct response websites, call centers and captive agencies can’t replicate.
Some IAs have taken on direct response competitors directly by providing affordable instant online quotes from agency websites and then adding exceptional customer service during customer onboarding, routine servicing, and renewal.

Copyright © 2013‐2014 Independent Insurance Agents & Brokers of America, Inc. All rights reserved. All data in this report is the property of A.M. Best and is reprinted with its permission.
27
IV. Expense Comparisons A frequently discussed topic when comparing various insurance distribution systems is carrier expense ratios. Does one channel have an inherent advantage over the other resulting from lower costs? While it is true that direct response as a category is the most efficient channel, a closer look at individual insurance company performance shows that some independent agency players challenge direct response firms on this key performance metric. For this comparison, we examine carriers’ operating ratios for private‐passenger auto insurance — the line of business in which all distribution systems compete in a major way. Net operating expense ratios can be used to compare efficiency across companies and distribution methods.2 Lower net operating expense ratios reflect more efficient operations. The expense ratios calculated for 2012 for each channel did not vary greatly from 2011. As mentioned above, the direct response category is the most efficient overall, holding a slightly greater than 11‐percentage‐point advantage over regional independent agency carriers, and almost 14 percentage points over national IA carriers. Direct writers also enjoyed an 11‐point advantage over captive agency carriers in 2012. However, we consistently have found over the 18 years in which we have conducted this study that both national and regional IAs perform better than many captive agency firms and often rival direct response channels on efficiency. While it is true — generally speaking — that direct channels save by not paying agency commissions, this advantage is largely offset by the hefty advertising and marketing bills these firms pay.
2Because of the discrepancies in how companies categorize their expenses, IIABA has found that the only way to get a true “apples to apples” comparison is to use operating expense ratios. The operating ratio is the combination of the company’s underwriting expense ratio and loss adjustment expense ratio. The underwriting expense ratio includes the commissions/broker fees ratio, other acquisition expense ratio, general expense ratio, and the taxes, licenses and fees ratio.

Copyright © 2013‐2014 Independent Insurance Agents & Brokers of America, Inc. All rights reserved. All data in this report is the property of A.M. Best and is reprinted with its permission.
28
A. 2012 Private‐Passenger Auto Operating Ratios
The following table of operating ratios in personal automobile insurance lists selected independent agent, large captive and direct response companies. All are sorted from most efficient to least efficient.
Operating Expense Ratios for Select Insurance Agencies
National IA
Regional IA
Captive Agencies
Direct Response
USAA Group 21.1
Government Employees Group 26.7
Mercury General Group 31.9 Progressive Direct Companies 32.1
Donegal Insurance Group 33.3 Allstate Direct Companies 34.1 State Farm Group 34.3 Amica Mutual Group 34.4
Cincinnati Insurance Companies 35.5 Hartford Insurance Group 35.8 Farm Bureau P‐C Group 36.4
United Farm Bureau of IN Group 36.5
Arbella Insurance Group 36.7 State Auto Insurance Companies 37.3 Farmers (less Foremost) 38.9
Chubb Group of Insurance Companies 38.9 AIG (less direct response) 39.0 Hanover Ins. Group P‐C Companies 39.5 Erie Insurance Group 40.0 MetLife Agency Companies 40.7 Auto‐Owners Insurance Group 41.4 Kemper P‐C Group 42.0 Travelers Group 42.7 EMC Insurance Companies 44.6 Ameriprise P‐C Companies 44.9
American National P‐C Group 46.0
Auto Club Enterprises Ins. Group 46.2
ACE INA Group 51.3 Averages by Channel of Top Firms within Each Category: National Agency Writers 40.9
Regional Agency Writers 38.1 Exclusive Agency Writers 40.6
Direct Response Writers 26.4

Copyright © 2013‐2014 Independent Insurance Agents & Brokers of America, Inc. All rights reserved. All data in this report is the property of A.M. Best and is reprinted with its permission.
29
V. Commercial Lines The commercial insurance market grew more than $10 billion for the second year in a row and was approaching the size it enjoyed before the economic recession of the previous decade. Commercial lines premiums grew $10.4 billion in 2012 — and independent agents generated $8.3 billion of that new business. While this represents a slight slowdown relative to 2011, total premiums are now back over the quarter‐billion‐a‐year mark, proving that last year’s rebound from contraction to growth was the start of a trend rather than a blip.
Nearly identically to 2011, all channels saw premium growth in 2012, but regional agency writers again captured more than their previous share of this growth, slightly improving their market share at the expense of other channels. However, no channel gained or lost more than 1 percentage point of share. National independent agency carrier premiums grew by $3.3 billion, or 3.0%, to close at $114.2 billion in 2012. Regional IAs wrote $4.9 billion, or 6.1% more than in 2011, closing a total of $86 billion in premiums in 2012. Exclusive agency writers booked $2.0 billion more than in 2010, for a total of $43.8 billion. Direct response carriers grew premiums 8.1%, doubling 2011 annual growth, closing $166 million more in 2012 than in 2011, nearly double the $88 million in growth in 2011 over 2010. However, at $2.2 billion in total premiums, this again led to a market share of 1% of the market.
2012 Commercial Lines Direct Premium
Written % Share % Premium Growth
2011 to 2012 National $ 114.2B 45.3 3.0
Regional $86.0B 34.1 6.1
Exclusive $49.6B 19.7 4.2
Direct $2.2B 0.9 8.1
TOTAL $252.0B 100 4.3

Copyright © 2013‐2014 Independent Insurance Agents & Brokers of America, Inc. All rights reserved. All data in this report is the property of A.M. Best and is reprinted with its permission.
30
After two years of back‐to‐back growth of $10 billion, commercial lines are now the highest they have been since 2007. If this growth continues for a third year, the market will have fully rebounded to its pre‐recession size of about $260 billion per year.
110.9 114.2
81.0 86.0
47.6 49.6
2.12.2
$0
$50
$100
$150
$200
$250
$300
2011 2012
Commercial Lines in Billions
Direct Response Writers
Exclusive Agent DirectWriters
Regional Agency Writers
National Agency Writers
$261.6B $261.4B
$245B
$230.8B
$223.6B
$241.5
$252.0
$200
$210
$220
$230
$240
$250
$260
$270
2006 2007 2008 2009 2010 2011 2012
Direct Premium Written(Commercial Lines in Billions)

Copyright © 2013‐2014 Independent Insurance Agents & Brokers of America, Inc. All rights reserved. All data in this report is the property of A.M. Best and is reprinted with its permission.
31
In the last year, market share shifted a minor fraction of 1 percentage point, with national IAs giving regional IAs 0.6 points, and exclusive agency and direct response holding flat between 2011 and 2012. However, looking back over the last seven years, the shift becomes slightly more pronounced. Between 2006 and 2012, national IAs were down 2.8 percentage points while regionals were up 1.8 points. Captive writers increased 0.8 points over that period, while direct response crept up slightly, 0.2 points, although failing once again to control even 1 percentage point of market share.
Taken together, national and regional IA share has rebounded in 2011 and 2012, much like the broad commercial market itself.
48.1% 48.0% 46.2% 47.7% 47.2% 45.9% 45.3%
32.3% 32.1% 32.9% 31.5% 31.5%33.5% 34.1%
18.9% 19.1% 20.1% 19.9% 18.4% 19.7% 19.7%
0.7% 0.8% 0.8% 0.9% 0.9% 0.9% 0.9%
2006 2007 2008 2009 2010 2011 2012
Commercial Lines Share: 2006 ‐ 2012
National IA Regional IA Exclusive Agency Direct Response
80.5% 80.1% 79.3%78.4% 78.8% 79.4% 79.4%
2006 2007 2008 2009 2010 2011 2012
Independent Agent Market Share (Commercial)

Copyright © 2013‐2014 Independent Insurance Agents & Brokers of America, Inc. All rights reserved. All data in this report is the property of A.M. Best and is reprinted with its permission.
32
A. Commercial Auto Commercial automobile grew three times more in 2012 than in 2011, expanding by $1.1 billion (or 4.6%) in 2012 compared with the modest $330 million or 1.4% growth enjoyed in 2011 over 2010 results. Closing 2012 with $25.2 billion, commercial automobile insurance represents almost exactly 10% of the broader commercial market. Almost all of this growth was captured by independent insurance agents and brokers, who increased premiums $935 million over 2011 levels. Most of this was driven by regional writers who contributed $850 million of that growth. They wrote a total of $11.7 billion in premiums in 2012. National writers wrote about 1% more than the previous year, for a total of $9.5 billion. Together these IAs wrote 84% of all commercial auto premiums. While direct response growth was 27% over 2011 levels, a review of the math shows that this is a trivial increase of $13 million over a miniscule base of $46 million, which still represents less than one‐quarter of 1 percent market share. If the direct response writers were planning to replicate their success in personal auto in the commercial auto market, it did not happen in 2012. Captive agencies did increase premiums by $153 million, a 4% boost. And they’re closing in on $4 billion written, or just over 15% of the market.
2012 Commercial Auto
Direct Premium Written
% Share % Premium Growth2011 to 2012
National $9.5B 37.7 0.9 Regional $11.7B 46.4 7.8 Exclusive $4.0B 15.7 4.0 TOTAL $25.2B 100 4.6
The market share in commercial auto held relatively steady for captive agents and direct response, but national IA writers wrote 1.4 percentage points less, which was made up by regional IA writers, who jumped from 45.0% to 46.4%.
Captives 15.7%
National IAs37.7%
Regionals IAs46.4%
Share of Commercial Auto ‐ 2012

Copyright © 2013‐2014 Independent Insurance Agents & Brokers of America, Inc. All rights reserved. All data in this report is the property of A.M. Best and is reprinted with its permission.
33
B. Workers' Compensation
2012 Workers' Comp
Direct Premium Written
% Share % Premium Growth2009 to 2011
National $20.9B 45.7 6.0Regional $17.5B 38.3 4.3Exclusive $7.3B 16.0 9.8TOTAL $45.8B 100 5.9
While not growing as fast as the very bullish rate at which it did in 2011, the workers' compensation line experienced a second year of solid growth in 2012, after shrinking steadily between 2007 and 2010. Furthermore, workers' comp again grew faster than the overall commercial marketplace and now represents 18% of all commercial premiums. Increasing the premium pool by $2.6 billion over 2011 levels, workers' comp now totals $45.8 billion. Independent agency carrier premiums in workers' comp grew by $1.9 billion, which is less than the nearly $3 billion expansion it enjoyed in 2011, but it still represents a solid increase of 5.2% over 2011 levels. Of this, national IAs wrote $20.9 billion, a 6% or $1.2 billion increase over 2011. Regional IAs wrote $17.5 billion, a 4.3% ($0.7 billion) increase over the previous year. Exclusive agent writers wrote $650 million more in premiums for a total of $7.3 billion. Given the considerably smaller base, this represents a growth rate of 9.8%. By beating the market's overall growth rate, exclusive agents thus increased their market share slightly at the expense of national IA writers, with the later giving a portion of one percentage point to the former.

Copyright © 2013‐2014 Independent Insurance Agents & Brokers of America, Inc. All rights reserved. All data in this report is the property of A.M. Best and is reprinted with its permission.
34
C. Gains and Losses in Commercial Lines These national and regional independent agency carriers experienced percentage growth in overall commercial lines market share in 2012 (among carriers with at least $1 billion in direct premium written). (Note: Remember that it is easier for carriers with smaller books in this line to show big percentage changes in market share because they are working from a smaller premium base.)
Independent Agency Carrier % Growth in
Market Share
Starr International Group 41.7 Main Street America Group 15.3 Berkshire Hathaway (less GEICO) 14.4 State Auto Insurance Companies 13.8 Meadowbrook Insurance Group 12.7 Fairfax Financial (USA) Group 9.7 Cincinnati Insurance Companies 9.6 Alleghany Ins Holdings Group 8.4 Markel Corporation Group 8.0 Hanover Ins. Group P‐C 7.5 W. R. Berkley Insurance Group 7.4 Erie Insurance Group 5.8 Drive Insurance 6.6 EMC Insurance Companies 6.5 Nationwide Agency Companies 5.7 Philadelphia Ins/Tokio Marine Group 5.5 Selective Insurance Group 5.5 Arch Insurance Group 3.3 Assurant P‐C Group 2.8 Zurich Financial Svcs. NA Group 2.5 CNA Insurance Companies 1.7 Great American P‐C Ins. Group 1.4 Auto‐Owners Insurance Group 0.7 AXIS Insurance Group 0.7

Copyright © 2013‐2014 Independent Insurance Agents & Brokers of America, Inc. All rights reserved. All data in this report is the property of A.M. Best and is reprinted with its permission.
35
Many major independent agency carriers experienced some decline in commercial lines market share in 2012. Independent Agency Carrier % Change in
Market Share
Travelers Group ‐0.3 Tower Group Companies ‐1.1 Chubb Group of Insurance Co. ‐2.0 HCC Insurance Group ‐2.4 ACE INA Group ‐2.5 Hartford Insurance Group ‐2.9 XL America Group ‐4.1 Allianz of America Companies ‐5.9 Endurance Specialty Group ‐7.1 Liberty Mutual Agency Cos. ‐7.4 Mortgage Guaranty Group ‐10.6 AIG less Direct Response ‐11.8
Competitors Major captive agency competitors with more than $1 billion in commercial premiums experienced the following changes in their 2012 commercial lines market share: Captive Agency % Change in
Market Share
Everest Re U.S. Group 40.1
FM Global Group 6.7
Liberty Mutual Direct Companies 3.5
Nationwide Direct Companies 3.3
Farmers less Foremost ‐0.1
State Farm Group ‐3.8
Allstate Direct Companies ‐5.0
Wells Fargo Insurance Group ‐7.8
CUMIS Insurance Society Group ‐12.7
Munich‐American Holding. Corp. Companies ‐14.8

Copyright © 2013‐2014 Independent Insurance Agents & Brokers of America, Inc. All rights reserved. All data in this report is the property of A.M. Best and is reprinted with its permission.
36
Meanwhile, the direct response category continues to be less than 1% of the overall commercial market share, at $2.2 billion, and once again no direct response carrier has broken the $1 billion mark in commercial premiums. As a group, direct writers wrote slightly fewer premiums than in 2009, but several individual firms increased commercial premiums in 2012. Major Direct Response % Change in
Market Share
Government Employees Group 7.6 USAA Group 6.5 Progressive Direct Companies 5.2 Amica Mutual Group 2.0 AIG Direct Response 0.0

Copyright © 2013‐2014 Independent Insurance Agents & Brokers of America, Inc. All rights reserved. All data in this report is the property of A.M. Best and is reprinted with its permission.
37
D. State‐by‐State Market Share Results: Commercial Lines In most U.S. states, independent agents and brokers continue to dominate the commercial lines market and generally have retained their market share. Maine, Hawaii and Florida all had between 85% and 90% of the market. After dropping 3 percentage points since 2010, Oregon now has the lowest IA commercial market share, at 62.3%. While it is still near the bottom of the IA share list (62.9%), Delaware has climbed 4 percentage points since 2010, increasing from 58.9% to 62.9%. In the West, Washington dropped nearly 2 percentage points over two years, down to 73.0%, but Wyoming increased 2 percentage points to 79.3%. On the Eastern Seaboard, New York climbed 3 percentage points over two years to 82.8%, and the District of Columbia climbed 2.3 points to 83.0%. The IA channel’s commercial lines market share in all the states (plus the District of Columbia) broke down as follows over the last eight years:
Number of States with IA Share by Range (Commercial Lines)
Share 2005 2006 2007 2008 2009 2010 2011 2012
85‐90% 6 5 5 4 3 3 3 3
80‐85% 15 19 18 14 16 16 17 16
75‐80% 20 19 18 25 24 23 21 22
70‐75% 4 2 6 4 4 5 6 5
65‐70% 1 2 0 3 3 3 2 2
60‐65% 5 4 4 1 1 2 3
55‐60% 0 0 0 0 0 1 0 0

Copyright © 2013‐2014 Independent Insurance Agents & Brokers of America, Inc. All rights reserved. All data in this report is the property of A.M. Best and is reprinted with its permission.
38
Average IA Share
The independent agency carriers’ share increased by at least one‐half of 1 percentage point in 19 states, including seven states where the share grew by more than 1%. However, IA share decreased by more than 1 percentage point in seven states, and IA share in Oregon took a hit for another year in a row, dropping now to last place among the 50 states at 62.3% share. In Utah, IAs lost slightly less and slid to 67.4% share. Redefining the scale unfortunately again this year was Vermont, where IA share has dropped from mid‐80% in 2010 to 66.4% in 2012. A closer examination of the numbers in that state show that while IA production increased modestly, huge increases in captive writer production were recorded, thereby impacting the IA share of the total market by a large percentage.
States with 5 Largest Gains or Losses in IA Commercial Market Share 2011 to 2012
Percentage Points Gained
% Losses in IA Market Share
DE 2.8 OR ‐1.4
KS 2.7 UT ‐1.4
DC 1.8 MO ‐1.6
GA 1.6 WA ‐1.8
NY 1.5 VT ‐12.8
80.5% 80.1%79.3%
78.4% 78.8%79.4% 79.4%
2006 2007 2008 2009 2010 2011 2012
Independent Agent Market Share (Commercial)
Copyright © 2013‐2014 Independent Insurance Agents & Brokers of America, Inc. All rights reserved. All data in this report is the property of A.M. Best and is reprinted with its permission.
39
VI. About the Data This report marks the 18th year in which A.M. Best Co. has provided the Independent Insurance Agents & Brokers of America with year‐end industry market share and company expense data for the association to provide an updated assessment of the state of the independent agency system. All data in this report comes from A.M. Best and is printed with its permission. The 2012 calendar‐year figures represent the latest year in which segmented data is available from A.M. Best. The A.M. Best data offers IIABA the most accurate picture of changes with property‐casualty insurance distribution because it separates captive agency and direct response carriers. In addition, as requested by IIABA, the affiliates of groups leveraging various distribution systems are separated and placed in the appropriate distribution category (wherever the company group uses separate affiliates for this purpose). Adjusted Numbers In the charts in this report, previous‐year market share numbers are the most mature numbers compiled by A.M. Best, and they reflect the same affiliate adjustments in order to provide as accurate comparisons as possible. Careful readers of these IIABA market share reports will note some premium and market share data changes; we use the new numbers for prior years from the latest data, which covers 2012. This occurs because carriers report adjustments for prior years, which changes the market share percentages for prior years. Unreported Data — New for this report In some instances, A.M. Best is precluded from reporting firm‐specific data, but the data can be included in either total industry or total channel metrics. As a result, total channel share percentages do not always add to 100% market share. Two Further Data Changes There were a couple of major changes made to the IIABA information in recent years to further enhance the accuracy of the numbers. A.M. Best separated Progressive’s direct business from what is written by its agency group. Several company groups from the regional independent agency company category were reallocated to the national independent agency category. A.M. Best requires a company to write in many states and to write multiple lines of business in order to fit into the national agency category. When A.M. Best makes such changes, the changes are made for the prior years as well, in order to produce as accurate comparisons as possible. As a result of these changes, readers should use caution in reaching any broad conclusions as to trends affecting either the national agency company or regional agency company sub‐segments of the independent agency and broker market. Some of the groups that were reallocated to the national agency category include: W.R. Berkley Companies, Cincinnati Insurance Company, EMC, Harleysville, HDI U.S. Group, Markel Corporation, Old Republic General Group, Winterthur Swiss Group, and XL America Group. The Progressive agency companies, however, remained in the regional group because of the limited lines of business being written by those companies. A.M. Best moved the following companies from the national agency category to the regional category: Amerisure, Atlantic Mutual and Utica National.

Copyright © 2013‐2014 Independent Insurance Agents & Brokers of America, Inc. All rights reserved. All data in this report is the property of A.M. Best and is reprinted with its permission.
40
Reallocation to Distribution Category For this custom study, A.M. Best continues to reclassify the independent agency affiliates that can be identified for selected groups, such as Allstate, Liberty Mutual, MetLife, Nationwide and Farmers and Progressive. In all charts, A.M. Best has reallocated premium volume to the proper distribution category wherever the carrier used separate affiliates for its different distribution methods. In the personal lines, personal auto, and homeowners charts, however, the market shares for the direct response companies are somewhat understated because the direct business written by The Hartford cannot be separated from the independent agency business written by this company, as it is not written in a separate affiliate. In addition, A.M. Best has not been able to separate out most of AIG’s direct auto business (written in the AIG name) from that written through independent agencies, and that business appears in the national agency company category. A.M. Best does separate out AIG’s 21st Century business to the direct category, as well as the direct response business it acquired from GE Financial Assurance. This overstatement of independent agency numbers is partially offset by the fact that Allstate’s rural independent agency program was still classified as part of its captive agency business. Allstate’s other independent agency business, which is written in separate affiliates such as Encompass and Deerbrook, has been placed in the proper distribution system category. In addition, A.M. Best has not been able to separate out Farmers’ independent agency business that it writes in Eastern states, except for the business written under the Foremost banner. This additional Farmers’ independent agency business continues to be included in the captive agency category. IIABA and A.M. Best work together each year to continually refine the data and make adjustments wherever possible. IIABA comments on only the numbers ultimately provided by A.M. Best. We invite your comments and questions about this research. Please contact Madelyn Flannagan, IIABA Vice President, Education & Research, at (703) 706‐5409 or [email protected].