2012 nuclear benchmarking report - ontario power … · this report presents a comparison of...
TRANSCRIPT
- i -
August 2012
OPG Confidential – Internal Use Only Nuclear Finance - Business Planning and Performance Reporting
ONTARIO
POWER
GENERATION
NUCLEAR
2012 NUCLEAR BENCHMARKING REPORT
Filed: 2013-09-27 EB-2013-0321 Ex. F2-1-1 Attachment 1

- i -
Table of Contents
1.0 EXECUTIVE SUMMARY ..................................................................................................................................... 1
2.0 SAFETY ............................................................................................................................................................. 6
METHODOLOGY AND SOURCES OF DATA ............................................................................................................................. 6
ALL INJURY RATE ............................................................................................................................................................ 7
ROLLING AVERAGE INDUSTRIAL SAFETY ACCIDENT RATE ........................................................................................................ 9
ROLLING AVERAGE COLLECTIVE RADIATION EXPOSURE ........................................................................................................ 12
AIRBORNE TRITIUM EMISSIONS PER IN SERVICE UNIT .......................................................................................................... 17
FUEL RELIABILITY INDEX ................................................................................................................................................. 20
2-YEAR UNPLANNED AUTOMATIC REACTOR TRIPS .............................................................................................................. 23
3-YEAR AUXILIARY FEEDWATER SAFETY SYSTEM UNAVAILABILITY .......................................................................................... 27
3-YEAR EMERGENCY AC POWER SAFETY UNAVAILABILITY .................................................................................................... 31
3-YEAR HIGH PRESSURE SAFETY INJECTION ....................................................................................................................... 34
3.0 RELIABILITY .................................................................................................................................................... 38
METHODOLOGY AND SOURCES OF DATA ........................................................................................................................... 38
WANO NUCLEAR PERFORMANCE INDEX .......................................................................................................................... 39
ROLLING AVERAGE FORCED LOSS RATE............................................................................................................................. 44
ROLLING AVERAGE UNIT CAPABILITY FACTOR .................................................................................................................... 48
ROLLING AVERAGE CHEMISTRY PERFORMANCE INDICATOR (CPI) .......................................................................................... 52
1-YEAR ON-LINE DEFICIENT MAINTENANCE BACKLOG ......................................................................................................... 56
1-YEAR ON-LINE CORRECTIVE MAINTENANCE BACKLOG ...................................................................................................... 58
4.0 VALUE FOR MONEY ........................................................................................................................................ 60
METHODOLOGY AND SOURCES OF DATA ........................................................................................................................... 60
3-YEAR TOTAL GENERATING COST PER MWH ................................................................................................................... 61
3-YEAR NON-FUEL OPERATING COST PER MWH ............................................................................................................... 64
3-YEAR FUEL COST PER MWH ........................................................................................................................................ 67
3-YEAR CAPITAL COST PER MW DER .............................................................................................................................. 70
5.0 HUMAN PERFORMANCE ................................................................................................................................ 73
METHODOLOGY AND SOURCES OF DATA ........................................................................................................................... 73
18-MONTH HUMAN PERFORMANCE ERROR RATE.............................................................................................................. 74
6.0 MAJOR OPERATOR SUMMARY ....................................................................................................................... 76
PURPOSE .................................................................................................................................................................... 76
WANO NUCLEAR PERFORMANCE INDEX (NPI) ANALYSIS .................................................................................................... 76
UNIT CAPABILITY FACTOR (UCF) ANALYSIS ....................................................................................................................... 78
TOTAL GENERATING COST/MWH ANALYSIS ...................................................................................................................... 79
7.0 APPENDIX ...................................................................................................................................................... 82
Filed: 2013-09-27 EB-2013-0321 Ex. F2-1-1 Attachment 1
- 1 -
1.0 EXECUTIVE SUMMARY
Background
This report presents a comparison of Ontario Power Generation (OPG) Nuclear’s performance to
that of nuclear industry peer groups both in Canada and worldwide. The report was prepared as
part of OPG’s commitment to “performance informed” business management. The results of this
report are used during business planning to drive a top-down target setting process with business
improvement as the objective.
Benchmarking involves three key steps: (a) identifying key performance metrics to be
benchmarked, (b) identifying the most appropriate industry peer groups for comparison, and (c)
preparing supporting analyses and charts. OPG personnel responsible for specific performance
metrics assisted in the development of the supporting analyses by providing insight into the
factors contributing to current OPG operational performance.
Performance Indicators
Good performance indicators for benchmarking are defined as metrics with standard definitions,
reliable data sources, and utilization across a good portion of the industry. Good indicators allow
for benchmarking to be repeated year after year in order to track performance and improvement.
Additionally, when selecting an appropriate and relevant set of metrics, a balanced approach
covering all key areas of the business is essential. As such, 20 key performance indicators have
been selected for comparison to provide a balanced view of performance and for which
consistent, comparable data is available. These indicators are listed in Table 1 and are divided
into four categories aligned with OPG Nuclear’s four cornerstone values: safety, reliability, value
for money and human performance.
Consistent with OPG’s strategy to continuously pursue efficiency improvements, the Pickering A
and Pickering B nuclear generating stations were amalgamated into one Pickering site (6 units)
in 2011 to realize efficiencies and financial benefits associated with one unified station. The
charts and supporting analyses contained in this report reflect the amalgamation of the Pickering
A and Pickering B stations and retroactive changes have been applied where needed to capture
performance of one Pickering station.
There was a change in the maintenance backlog metrics this year to reflect the new industry
standard documented in AP-928 Work Management Practices at INPO. The new standard sets a
more consistent foundation for classification of backlogs such that comparisons between utilities
are more meaningful. This report has been updated accordingly.
Industry Peer Groups
Peer groups were selected based on performance indicators widely utilized within the nuclear
industry. Overall, six different peer groups were used as illustrated in Table 1 and panel
members are detailed in Section 7.0, Tables 7, 8, 9, 10 and 11.
Filed: 2013-09-27 EB-2013-0321 Ex. F2-1-1 Attachment 1
OPG Confidential – Internal Use Only 2012 Benchmarking Report
- 2 -
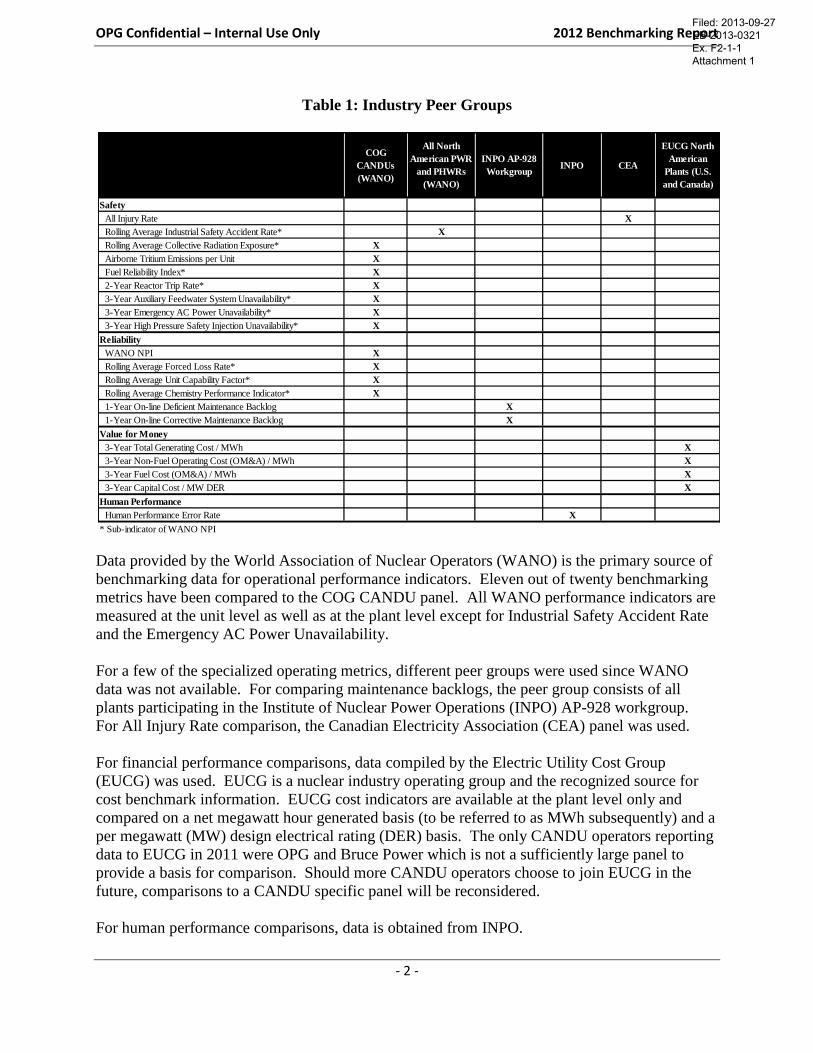
Table 1: Industry Peer Groups
Data provided by the World Association of Nuclear Operators (WANO) is the primary source of
benchmarking data for operational performance indicators. Eleven out of twenty benchmarking
metrics have been compared to the COG CANDU panel. All WANO performance indicators are
measured at the unit level as well as at the plant level except for Industrial Safety Accident Rate
and the Emergency AC Power Unavailability.
For a few of the specialized operating metrics, different peer groups were used since WANO
data was not available. For comparing maintenance backlogs, the peer group consists of all
plants participating in the Institute of Nuclear Power Operations (INPO) AP-928 workgroup.
For All Injury Rate comparison, the Canadian Electricity Association (CEA) panel was used.
For financial performance comparisons, data compiled by the Electric Utility Cost Group
(EUCG) was used. EUCG is a nuclear industry operating group and the recognized source for
cost benchmark information. EUCG cost indicators are available at the plant level only and
compared on a net megawatt hour generated basis (to be referred to as MWh subsequently) and a
per megawatt (MW) design electrical rating (DER) basis. The only CANDU operators reporting
data to EUCG in 2011 were OPG and Bruce Power which is not a sufficiently large panel to
provide a basis for comparison. Should more CANDU operators choose to join EUCG in the
future, comparisons to a CANDU specific panel will be reconsidered.
For human performance comparisons, data is obtained from INPO.
COG
CANDUs
(WANO)
All North
American PWR
and PHWRs
(WANO)
INPO AP-928
WorkgroupINPO CEA
EUCG North
American
Plants (U.S.
and Canada)
Safety
All Injury Rate X
Rolling Average Industrial Safety Accident Rate* X
Rolling Average Collective Radiation Exposure* X
Airborne Tritium Emissions per Unit X
Fuel Reliability Index* X
2-Year Reactor Trip Rate* X
3-Year Auxiliary Feedwater System Unavailability* X
3-Year Emergency AC Power Unavailability* X
3-Year High Pressure Safety Injection Unavailability* X
Reliability
WANO NPI X
Rolling Average Forced Loss Rate* X
Rolling Average Unit Capability Factor* X
Rolling Average Chemistry Performance Indicator* X
1-Year On-line Deficient Maintenance Backlog X
1-Year On-line Corrective Maintenance Backlog X
Value for Money
3-Year Total Generating Cost / MWh X
3-Year Non-Fuel Operating Cost (OM&A) / MWh X
3-Year Fuel Cost (OM&A) / MWh X
3-Year Capital Cost / MW DER X
Human Performance
Human Performance Error Rate X
* Sub-indicator of WANO NPI
Filed: 2013-09-27 EB-2013-0321 Ex. F2-1-1 Attachment 1
OPG Confidential – Internal Use Only 2012 Benchmarking Report
- 3 -
All data provided by the peer groups (WANO, INPO, CEA, EUCG) is confidential. A redacted
version of this report, which removes individual plant and unit names, is available from Nuclear
Finance – Business Planning should there be a requirement to publically release this report.
Benchmarking Results – Plant Level Summary
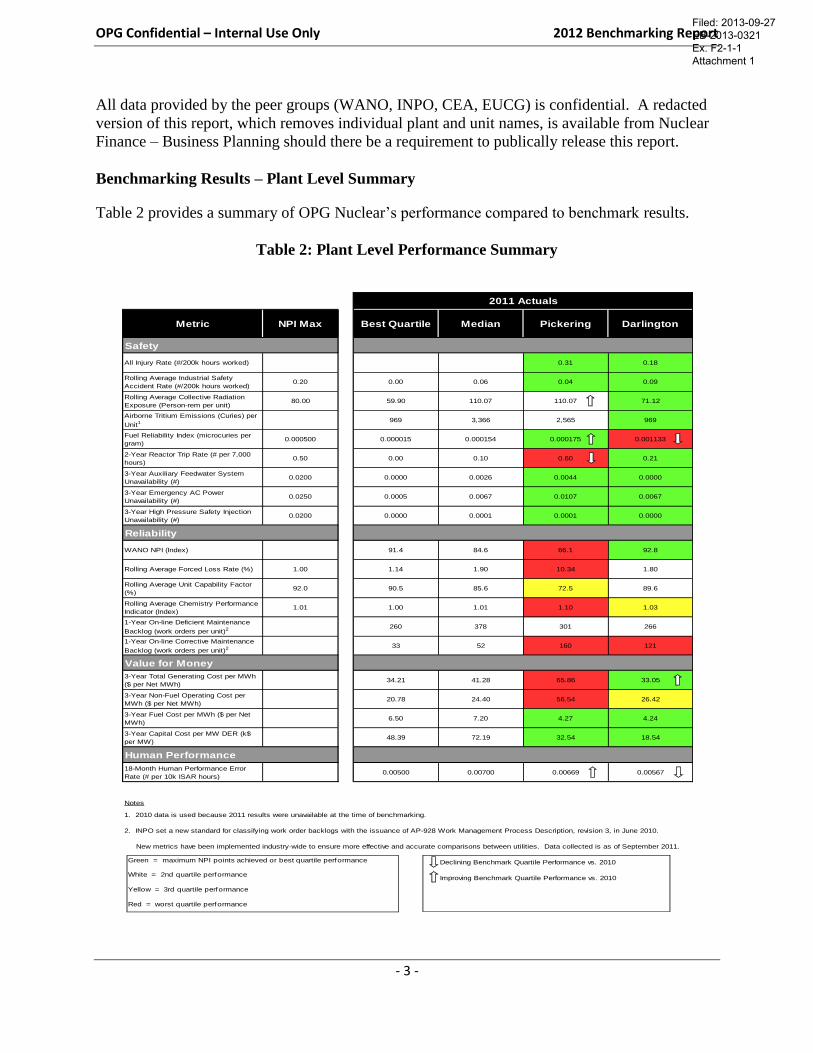
Table 2 provides a summary of OPG Nuclear’s performance compared to benchmark results.
Table 2: Plant Level Performance Summary
Metric NPI Max Best Quartile Median Pickering Darlington
Safety
All Injury Rate (#/200k hours worked) 0.31 0.18
Rolling Average Industrial Safety
Accident Rate (#/200k hours worked)0.20 0.00 0.06 0.04 0.09
Rolling Average Collective Radiation
Exposure (Person-rem per unit)80.00 59.90 110.07 110.07 71.12
Airborne Tritium Emissions (Curies) per
Unit1 969 3,366 2,565 969
Fuel Reliability Index (microcuries per
gram)0.000500 0.000015 0.000154 0.000175 0.001133
2-Year Reactor Trip Rate (# per 7,000
hours)0.50 0.00 0.10 0.60 0.21
3-Year Auxiliary Feedwater System
Unavailability (#)0.0200 0.0000 0.0026 0.0044 0.0000
3-Year Emergency AC Power
Unavailability (#)0.0250 0.0005 0.0067 0.0107 0.0067
3-Year High Pressure Safety Injection
Unavailability (#)0.0200 0.0000 0.0001 0.0001 0.0000
Reliability
WANO NPI (Index) 91.4 84.6 66.1 92.8
Rolling Average Forced Loss Rate (%) 1.00 1.14 1.90 10.34 1.80
Rolling Average Unit Capability Factor
(%)92.0 90.5 85.6 72.5 89.6
Rolling Average Chemistry Performance
Indicator (Index)1.01 1.00 1.01 1.10 1.03
1-Year On-line Deficient Maintenance
Backlog (work orders per unit)2 260 378 301 266
1-Year On-line Corrective Maintenance
Backlog (work orders per unit)2 33 52 160 121
Value for Money
3-Year Total Generating Cost per MWh
($ per Net MWh)34.21 41.28 65.86 33.05
3-Year Non-Fuel Operating Cost per
MWh ($ per Net MWh)20.78 24.40 56.54 26.42
3-Year Fuel Cost per MWh ($ per Net
MWh)6.50 7.20 4.27 4.24
3-Year Capital Cost per MW DER (k$
per MW)48.39 72.19 32.54 18.54
Human Performance
18-Month Human Performance Error
Rate (# per 10k ISAR hours)0.00500 0.00700 0.00669 0.00567
Notes
1. 2010 data is used because 2011 results were unavailable at the time of benchmarking.
2. INPO set a new standard for classifying work order backlogs with the issuance of AP-928 Work Management Process Description, revision 3, in June 2010.
New metrics have been implemented industry-wide to ensure more effective and accurate comparisons between utilities. Data collected is as of September 2011.
Declining Benchmark Quartile Performance vs. 2010
Improving Benchmark Quartile Performance vs. 2010
2011 Actuals
Green = maximum NPI points achieved or best quartile performance
White = 2nd quartile performance
Yellow = 3rd quartile performance
Red = worst quartile performance
Filed: 2013-09-27 EB-2013-0321 Ex. F2-1-1 Attachment 1
OPG Confidential – Internal Use Only 2012 Benchmarking Report
- 4 -
Since achievement of full WANO Nuclear Performance Index (NPI) points is recognized within
the industry as a measure of desirable performance, performance gaps are assessed against full
WANO NPI points in addition to median and best quartile performance. Green shaded boxes
indicate that maximum WANO NPI points were achieved or that performance is at or better than
the best quartile threshold, white shaded boxes indicate that performance is between the best
quartile and median thresholds, yellow shaded boxes indicate that performance is between the
median and worst quartile thresholds, and red shaded boxes indicate that performance is worse
than the worst quartile threshold.
Table 2 also identifies, by Nuclear cornerstone, where there has been either improving or
declining benchmarking quartile performance relative to 2010. For Safety, overall, OPG’s
nuclear generating stations continue to demonstrate strong performance. Pickering was able to
achieve notable year over year improvements in its benchmark quartile ranking relative to 2010
results for the Collective Radiation Exposure, Fuel Reliability Index and Human Performance
Error Rate. However, the Pickering station experienced a decline in quartile performance for
Reactor Trip Rate. Darlington achieved maximum NPI points or best quartile performance for
all but one metric under the Safety cornerstone, the Fuel Reliability Index, which showed a
decline in benchmark quartile performance from 2010.
For Reliability, Pickering remained in the 4th
quartile in 2011 when compared to other CANDU
plants for the WANO Nuclear Performance Index, the Forced Loss Rate and Chemistry
Performance Indicator and marginal performance (3rd
quartile) for the Unit Capability Factor.
As the strongest OPG performer for WANO NPI, Darlington achieved best quartile performance
in four of the last six years. Year over year quartile rankings were also maintained for Forced
Loss Rate (median), Unit Capability Factor (median) and Chemistry Performance Indicator (3rd
quartile) at Darlington in 2011. Since the industry standard for backlog metrics has recently
changed, historical data is not available to assess year over year industry benchmark quartile
progress from 2010 to 2011. Such comparison will be possible in future years when enough
information is accumulated through the AP-928 INPO panel using the new standard. Continued
fourth quartile station performance, for some metrics under the Reliability cornerstone,
represents a key focus area for further improvement for the business.
Under the Value for Money cornerstone, Pickering maintained fourth quartile performance in its
Total Generating Cost per MWh and Non-Fuel Operating Cost per MWh. This is due to longer
planned outage durations needed to extend the life of the Pickering station in order to ensure a
reliable supply of electricity during the refurbishment of the Darlington plant. In addition, lower
capability factors, due to forced outages and forced extensions to planned outages at the
Pickering station, have resulted in lower electricity production and additional costs which had an
unfavourable impact on the station’s Total Generating Cost per MWh and Non-Fuel Operating
Cost per MWh. On the other hand, Pickering sustained best quartile performance in Fuel Cost
per MWh and Capital Cost per MW DER. The relatively small size of Pickering’s generating
units also had an unfavourable impact on the station’s cost per MWh. Darlington’s Total
Generating Cost per MWh improved from median to best quartile performance in 2011.
Marginal (3rd
quartile) performance in Non-Fuel Operating Cost per MWh was offset by
excellent performance in Fuel Cost per MWh and Capital Cost per MW DER at Darlington in
2011.
Filed: 2013-09-27 EB-2013-0321 Ex. F2-1-1 Attachment 1
OPG Confidential – Internal Use Only 2012 Benchmarking Report
- 5 -
In the area of Human Performance, Pickering improved performance from third quartile in 2010
to second quartile at the end of 2011 for the Human Performance Error Rate. However, the
Darlington station experienced a decline in quartile performance in 2011, moving from best
quartile to second quartile.
Report Structure
Sections 2.0 to 5.0 of the report are structured to focus on the four OPG Nuclear cornerstone
areas, with detailed comparisons at the plant, and where applicable, unit level. Each indicator is
displayed graphically from best to worst (in bar chart format) for the most recent year in which
data is available. Zero values are excluded from all calculations except where zero is a valid
result. Missing data was input by averaging the prior and subsequent year where possible. If
this was not possible, the average of the two most recent years was used.
Next, the historical trend was graphed (in line chart format) using data for the last few years
(depending upon availability and metric). Each graph also includes median and best quartile
results, and for some WANO operating metrics, the graph also shows the values required to
achieve full WANO NPI points.
Following the graphical representation, performance observations were documented as well as
insights into the key factors driving performance at OPG’s nuclear generating stations.
Section 6.0 of the report is designed to provide an operator level summary across a few high-
level metrics. The operator level analysis looks at fleet operators across North America, utilizing
a simple average of the results (mean) from each of their units/plants. Operations related results
were averaged at the unit level and cost related results were averaged at the plant level. The list
and ranking of operators, for the nuclear performance index and unit capability factor, have been
restated to reflect industry developments.
Section 7.0 provides an appendix of supporting information, including common acronyms,
definitions, panel composition details and a WANO NPI plant level performance summary of
OPG stations against the North American panel.
Filed: 2013-09-27 EB-2013-0321 Ex. F2-1-1 Attachment 1
- 6 -
2.0 SAFETY
Methodology and Sources of Data
The majority of safety metrics were calculated using data from WANO. Data labelled as invalid
by WANO was excluded from all calculations. Indicator values of zero are not plotted or
included in calculations except in cases where zero is a valid result. Complete data for the 2004-
2011 period was obtained and averages are as provided by WANO.
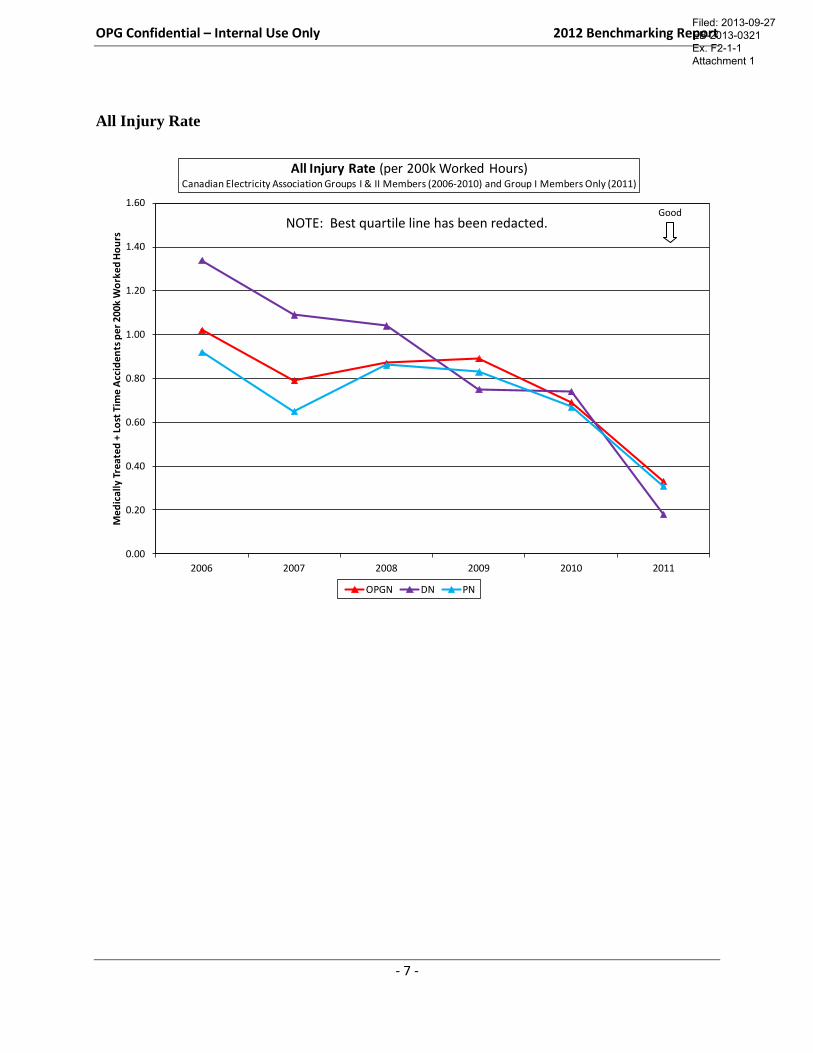
The All Injury Rate was calculated using data from the Canadian Electricity Association (CEA).
Median information and individual company information was not available for this metric;
therefore only trend and best quartile information is presented. The peer group for this metric is
limited to Group I members of CEA (Section 7.0, Table 10).
Airborne Tritium Emissions per unit data was collected from the CANDU Owners Group (COG)
for 2005 to 2010 as displayed in the historical trend line chart. Industry data for 2011 was
unavailable at the time of benchmarking. The peer group for this metric is all CANDUs which
are members of COG. The bar chart associated with this metric displays graphically plant
performance from best to worst using 2010 data (most recent benchmark data).
Discussion
Nine metrics are included in this benchmarking report to reflect safety performance, including
seven of the ten metrics which comprise the WANO Nuclear Performance Index: Industrial
Safety Accident Rate, Collective Radiation Exposure, Fuel Reliability, Unplanned Automatic
Reactor Trips, Auxiliary Feedwater Safety System, Emergency AC Power Safety System and
High Pressure Safety Injection. The remaining WANO NPI metrics are included in Section 3.0
under the Reliability cornerstone. In addition to the WANO sub-indicators listed above, the
CEA All Injury Rate and the COG Airborne Tritium Emissions per unit are included in this
section of the report.
Overall, OPG Nuclear’s performance in the WANO NPI safety measures is strong, achieving full
NPI points for many of the metrics. Pickering achieved industry best quartile performance for
the All Injury Rate and maximum WANO NPI points for five other metrics under the Safety
cornerstone, second quartile performance for two indicators and worst quartile performance for
one metric, the Reactor Trip Rate. Darlington achieved best quartile performance for four
metrics and maximum WANO NPI points for four other measures but reached worst quartile
performance for the Fuel Reliability Index.
Filed: 2013-09-27 EB-2013-0321 Ex. F2-1-1 Attachment 1
OPG Confidential – Internal Use Only 2012 Benchmarking Report
- 7 -
All Injury Rate
0.00
0.20
0.40
0.60
0.80
1.00
1.20
1.40
1.60
2006 2007 2008 2009 2010 2011
Me
dic
ally
Tre
ated
+ L
ost
Tim
e A
ccid
ents
per
200
k W
ork
ed H
ou
rs
All Injury Rate (per 200k Worked Hours)Canadian Electricity Association Groups I & II Members (2006-2010) and Group I Members Only (2011)
OPGN DN PN
Good NOTE: Best quartile line has been redacted.
Filed: 2013-09-27 EB-2013-0321 Ex. F2-1-1 Attachment 1
OPG Confidential – Internal Use Only 2012 Benchmarking Report
- 8 -
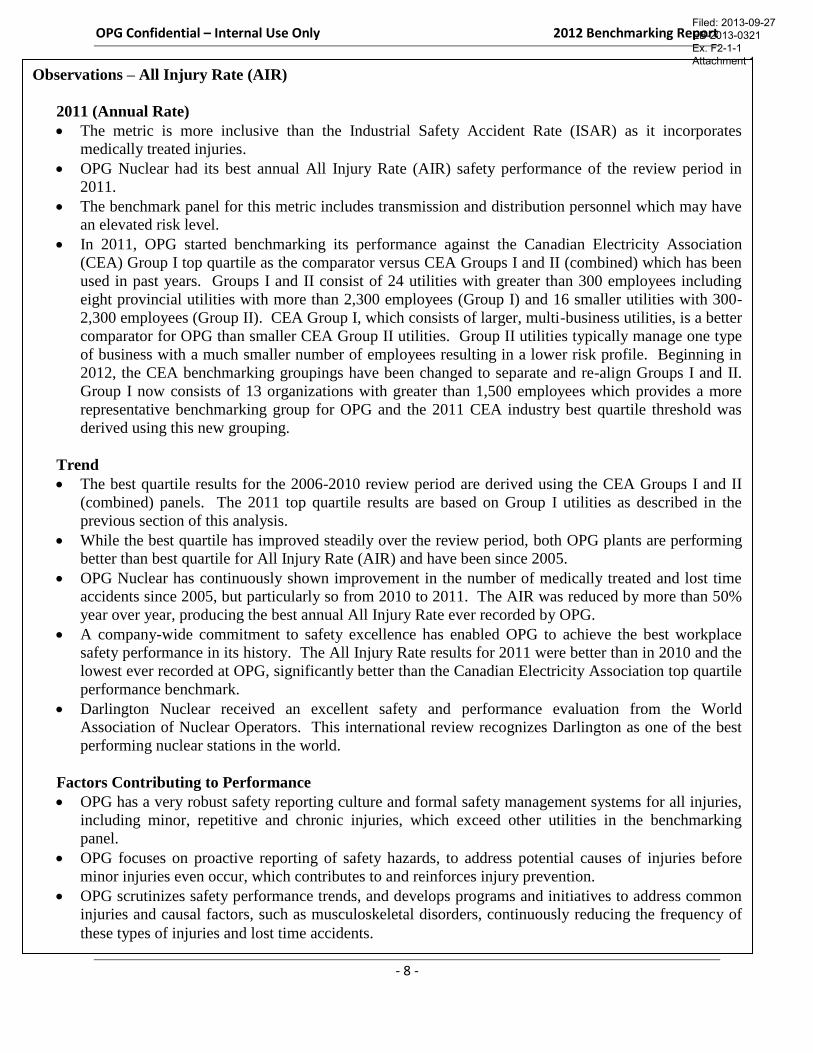
Observations – All Injury Rate (AIR)
2011 (Annual Rate)
The metric is more inclusive than the Industrial Safety Accident Rate (ISAR) as it incorporates
medically treated injuries.
OPG Nuclear had its best annual All Injury Rate (AIR) safety performance of the review period in
2011.
The benchmark panel for this metric includes transmission and distribution personnel which may have
an elevated risk level.
In 2011, OPG started benchmarking its performance against the Canadian Electricity Association
(CEA) Group I top quartile as the comparator versus CEA Groups I and II (combined) which has been
used in past years. Groups I and II consist of 24 utilities with greater than 300 employees including
eight provincial utilities with more than 2,300 employees (Group I) and 16 smaller utilities with 300-
2,300 employees (Group II). CEA Group I, which consists of larger, multi-business utilities, is a better
comparator for OPG than smaller CEA Group II utilities. Group II utilities typically manage one type
of business with a much smaller number of employees resulting in a lower risk profile. Beginning in
2012, the CEA benchmarking groupings have been changed to separate and re-align Groups I and II.
Group I now consists of 13 organizations with greater than 1,500 employees which provides a more
representative benchmarking group for OPG and the 2011 CEA industry best quartile threshold was
derived using this new grouping.
Trend
The best quartile results for the 2006-2010 review period are derived using the CEA Groups I and II
(combined) panels. The 2011 top quartile results are based on Group I utilities as described in the
previous section of this analysis.
While the best quartile has improved steadily over the review period, both OPG plants are performing
better than best quartile for All Injury Rate (AIR) and have been since 2005.
OPG Nuclear has continuously shown improvement in the number of medically treated and lost time
accidents since 2005, but particularly so from 2010 to 2011. The AIR was reduced by more than 50%
year over year, producing the best annual All Injury Rate ever recorded by OPG.
A company-wide commitment to safety excellence has enabled OPG to achieve the best workplace
safety performance in its history. The All Injury Rate results for 2011 were better than in 2010 and the
lowest ever recorded at OPG, significantly better than the Canadian Electricity Association top quartile
performance benchmark.
Darlington Nuclear received an excellent safety and performance evaluation from the World
Association of Nuclear Operators. This international review recognizes Darlington as one of the best
performing nuclear stations in the world.
Factors Contributing to Performance
OPG has a very robust safety reporting culture and formal safety management systems for all injuries,
including minor, repetitive and chronic injuries, which exceed other utilities in the benchmarking
panel.
OPG focuses on proactive reporting of safety hazards, to address potential causes of injuries before
minor injuries even occur, which contributes to and reinforces injury prevention.
OPG scrutinizes safety performance trends, and develops programs and initiatives to address common
injuries and causal factors, such as musculoskeletal disorders, continuously reducing the frequency of
these types of injuries and lost time accidents.
Filed: 2013-09-27 EB-2013-0321 Ex. F2-1-1 Attachment 1
OPG Confidential – Internal Use Only 2012 Benchmarking Report
- 9 -
Rolling Average Industrial Safety Accident Rate
Darlington
Median: 0.06
Pickering
Best Quartile: 0.00
0.00 0.20 0.40 0.60 0.80 1.00 1.20
Accidents per 200,000 Man-hours Worked
2011 Rolling Average Industrial Safety Accident Rate (per 200,000 man-hours worked)North American PWR & PHWR Plant Level Benchmarking
Max. NPI
Threshold = 0.2
Filed: 2013-09-27 EB-2013-0321 Ex. F2-1-1 Attachment 1
OPG Confidential – Internal Use Only 2012 Benchmarking Report
- 10 -
0.00
0.05
0.10
0.15
0.20
0.25
2006 2007 2008 2009 2010 2011
Re
stri
cte
d D
uty
+ L
ost
Tim
e A
ccid
en
ts p
er
200k
Wo
rke
d H
ou
rs
Rolling Average Industrial Safety Accident Rate (per 200k man-hours worked)North American PWR & PHWR Plant Level Benchmarking
DN PN Median Best Quartile Max. NPI
Max. NPI
Threshold = 0.2
Good
Filed: 2013-09-27 EB-2013-0321 Ex. F2-1-1 Attachment 1
OPG Confidential – Internal Use Only 2012 Benchmarking Report
- 11 -
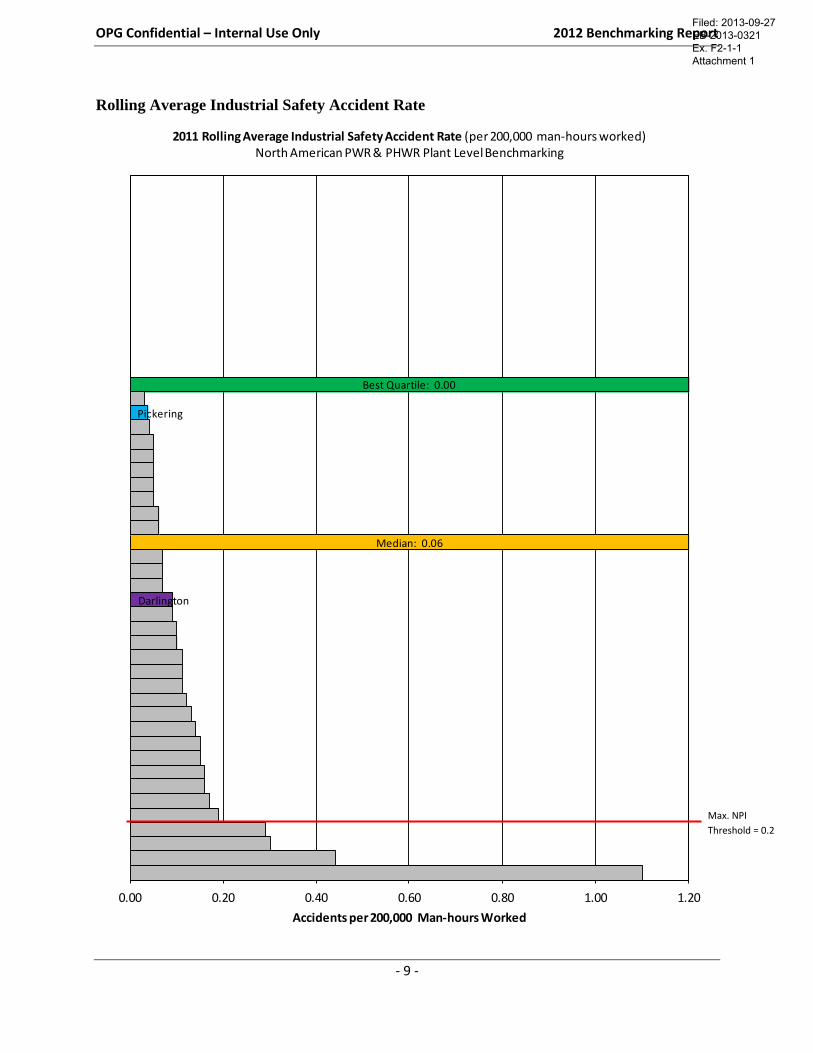
Observations – Rolling Average Industrial Safety Accident Rate (ISAR)
2011 (Rolling Average)
For reporting the Industrial Safety Accident Rate (ISAR), a 2-year rolling average was used
for all panel members with the exception of the Darlington station which follows a 3-year
outage cycle. This is consistent with the World Association of Nuclear Operators (WANO)
Nuclear Performance Index (NPI) reporting guidelines.
Best quartile for 2011 was 0.00 (i.e., zero ISAR events), significantly improving from 2010
(0.05) and slightly better than the 2009 best quartile of 0.02.
Pickering recorded its best annual ISAR ever in 2011, achieving second quartile performance
on a rolling average basis.
The annual ISAR performance of Darlington (0.09) in 2011 is consistent with its 3-year rolling
average performance in 2010.
Both Pickering and Darlington achieved maximum NPI points for the ISAR in 2011.
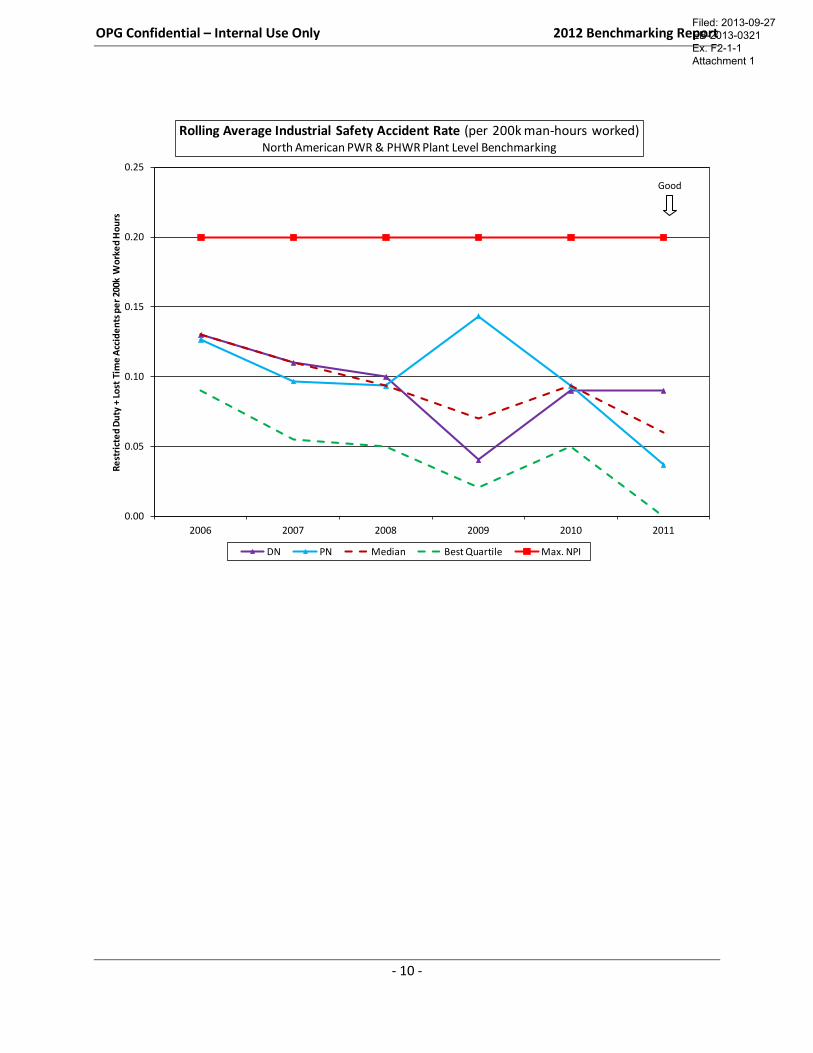
Trend
The overall OPG Nuclear fleet performance improved in 2011, with significant year over year
progress, on a rolling average basis, at Pickering (0.09 to 0.04).
Darlington showed a strong improving trend over the first four years of the review period, but
increased in 2010 and sustained that level of performance in 2011 (0.09).
The best quartile has shown an improving trend over the last 5 years, with a significant drop to
0.00 in 2011, equivalent to zero lost time and restricted duty injuries for the year.
Factors Contributing to Performance
ISAR is a measure of “permanent utility personnel” and does not include contractors. As
many of the utilities in the benchmarking panel utilize contractors to a greater extent than OPG
for higher risk work activities (e.g., outages), this can overstate the gap between OPG’s ISAR
and the reported industry benchmark quartiles.
Lost time and restricted duty injuries to non-station staff (support staff) who “reside at the
station” are counted against the station’s ISAR performance (WANO defined indicator).
Injuries to these types of personnel impacted performance at both stations in 2011.
OPG continues to monitor performance trends in the area of conventional safety and
implements action plans to support continuous improvement.
Filed: 2013-09-27 EB-2013-0321 Ex. F2-1-1 Attachment 1
OPG Confidential – Internal Use Only 2012 Benchmarking Report
- 12 -
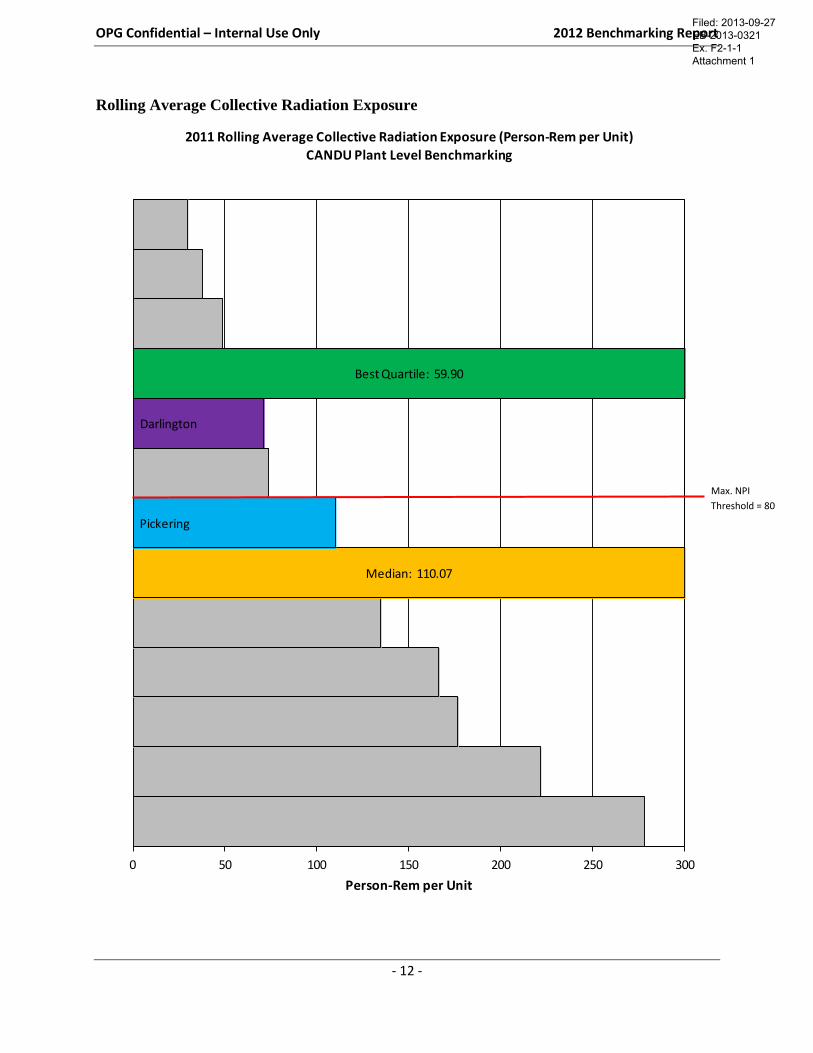
Rolling Average Collective Radiation Exposure
Median: 110.07
Pickering
Darlington
Best Quartile: 59.90
0 50 100 150 200 250 300
Person-Rem per Unit
2011 Rolling Average Collective Radiation Exposure (Person-Rem per Unit) CANDU Plant Level Benchmarking
Max. NPI
Threshold = 80
Filed: 2013-09-27 EB-2013-0321 Ex. F2-1-1 Attachment 1
OPG Confidential – Internal Use Only 2012 Benchmarking Report
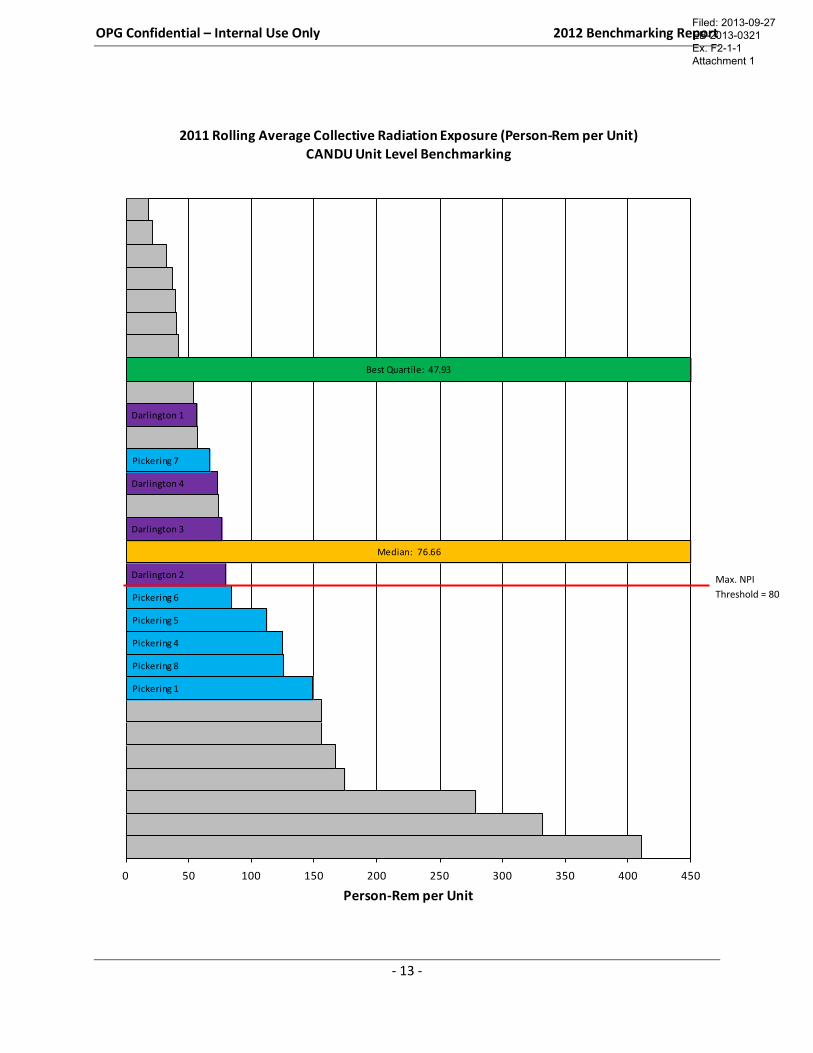
- 13 -
Pickering 1
Pickering 8
Pickering 4
Pickering 5
Pickering 6
Darlington 2
Median: 76.66
Darlington 3
Darlington 4
Pickering 7
Darlington 1
Best Quartile: 47.93
0 50 100 150 200 250 300 350 400 450
Person-Rem per Unit
2011 Rolling Average Collective Radiation Exposure (Person-Rem per Unit) CANDU Unit Level Benchmarking
Max. NPI
Threshold = 80
Filed: 2013-09-27 EB-2013-0321 Ex. F2-1-1 Attachment 1
OPG Confidential – Internal Use Only 2012 Benchmarking Report
- 14 -
0
20
40
60
80
100
120
140
2006 2007 2008 2009 2010 2011
Pe
rso
n-R
em
pe
r U
nit
Rolling Average Collective Radiation Exposure (Person-Rem per Unit)CANDU Plant Level Benchmarking
DN PN Median Best Quartile Max. NPI
0
20
40
60
80
100
120
140
160
2006 2007 2008 2009 2010 2011
Pe
rso
n-R
em
pe
r U
nit
Rolling Average Collective Radiation Exposure (Person-Rem per Unit)CANDU Unit Level Benchmarking
Darlington 1 Darlington 2 Darlington 3 Darlington 4
Pickering 1 Pickering 4 Pickering 5 Pickering 6
Pickering 7 Pickering 8 Median Best Quartile
Max. NPI
Good
Good
Filed: 2013-09-27 EB-2013-0321 Ex. F2-1-1 Attachment 1
OPG Confidential – Internal Use Only 2012 Benchmarking Report
- 15 -
Observations – Rolling Average Collective Radiation Exposure (CANDU)
Collective Radiation Exposure (CRE) is an industry composite indicator encompassing
external and internal collective Whole Body (WB) radiation dose. The industry recognized
yardstick for measuring CANDU reactor CRE performance is the World Association of
Nuclear Operators’ method for assigning points for the calculation of the Nuclear
Performance Index (NPI); full NPI points (10) at <80 person-rem per unit and zero points
at >140 person-rem per unit.
The industry uses a two or three year rolling average (based on the site outage cycle) to
define the CRE performance for a given year. Darlington follows a 3-year outage cycle
and Pickering and other panel members are on a 2-year outage cycle. The following
factors play a significant role in the CANDU reactors’ CRE performance: planned outage
scope and duration, forced outage rate, reactor face and Primary Heat Transport (PHT)
components external fields, tritiated ambient air in accessible and access controlled areas,
effectiveness of mitigated measures and initiatives being implemented to reduce identified
sources of radiological hazards, and human performance during execution of radiological
tasks.
2011 (Rolling Average)
The Pickering plant level rolling average performance was at the median of 110.07 person-
rem per unit in 2011. Planned outage scope and forced outages contributed to this level of
plant and unit performance at Pickering in 2011.
Darlington performance was better than median (110.07 person-rem per unit) at the plant
level. Darlington Units 1, 3 and 4 performed better than median (76.66 person-rem per
unit) and Unit 2 was worse than the median.
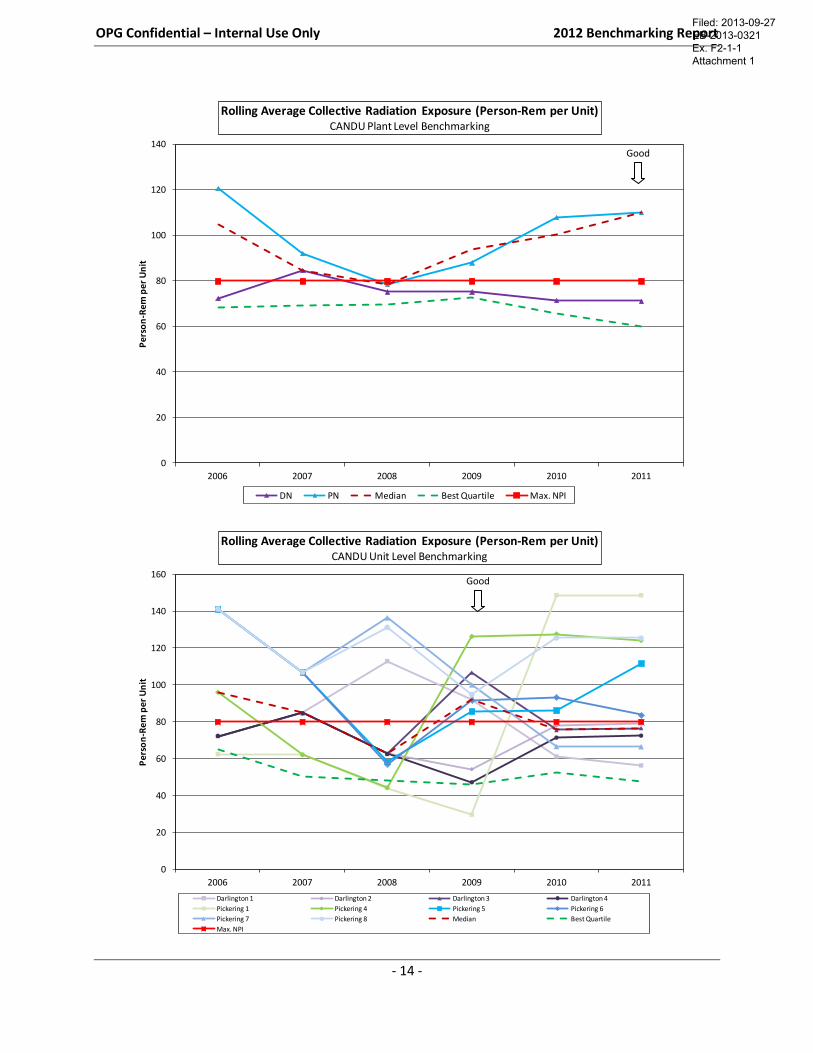
Trend
Best quartile and median CRE at both the plant and unit level have remained relatively flat
during the last six years.
Pickering achieved median performance in three of the last six years of the review period.
Darlington plant and unit performance improved slightly with post-outage reviews
indicating that, with the exception of scaffolding work, dose for all major work activities
was at or better than target. Internal dose contribution as a percentage of the collective
radiation exposure averaged 6.5 % in the last two years. This is considered good
performance per CANDU guideline of <15% of the CRE.
Filed: 2013-09-27 EB-2013-0321 Ex. F2-1-1 Attachment 1
OPG Confidential – Internal Use Only 2012 Benchmarking Report
- 16 -
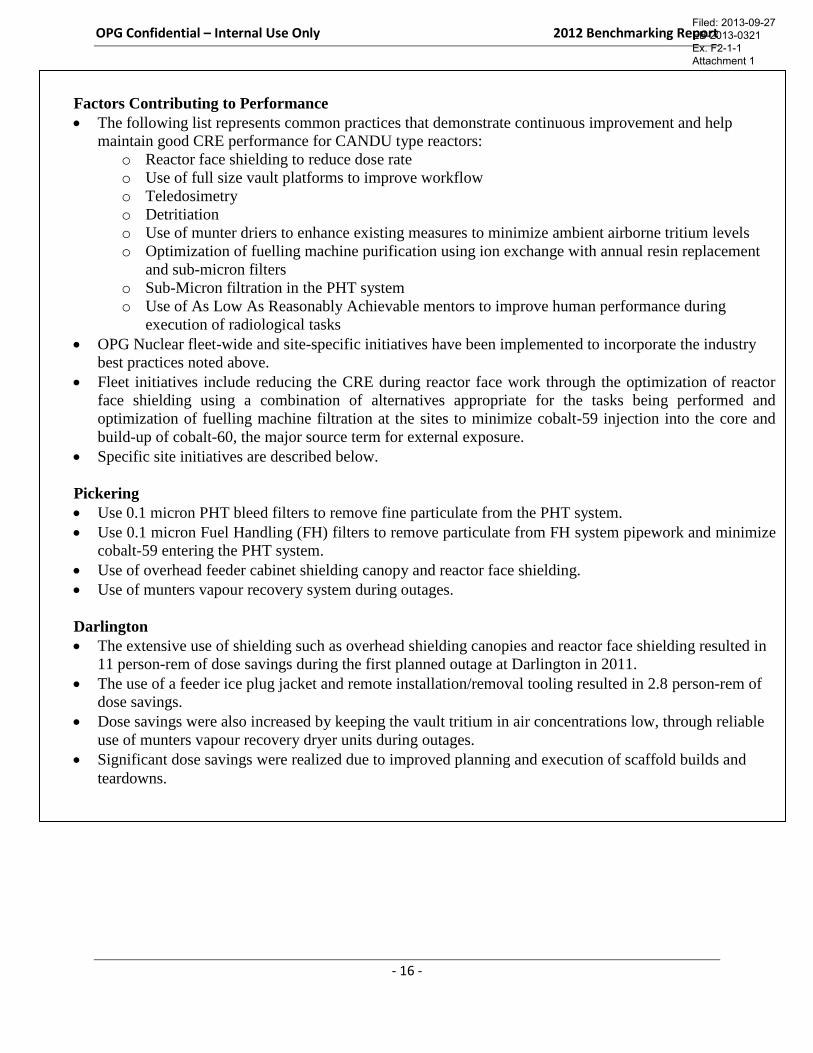
Factors Contributing to Performance
The following list represents common practices that demonstrate continuous improvement and help
maintain good CRE performance for CANDU type reactors:
o Reactor face shielding to reduce dose rate
o Use of full size vault platforms to improve workflow
o Teledosimetry
o Detritiation
o Use of munter driers to enhance existing measures to minimize ambient airborne tritium levels
o Optimization of fuelling machine purification using ion exchange with annual resin replacement
and sub-micron filters
o Sub-Micron filtration in the PHT system
o Use of As Low As Reasonably Achievable mentors to improve human performance during
execution of radiological tasks
OPG Nuclear fleet-wide and site-specific initiatives have been implemented to incorporate the industry
best practices noted above.
Fleet initiatives include reducing the CRE during reactor face work through the optimization of reactor
face shielding using a combination of alternatives appropriate for the tasks being performed and
optimization of fuelling machine filtration at the sites to minimize cobalt-59 injection into the core and
build-up of cobalt-60, the major source term for external exposure.
Specific site initiatives are described below.
Pickering
Use 0.1 micron PHT bleed filters to remove fine particulate from the PHT system.
Use 0.1 micron Fuel Handling (FH) filters to remove particulate from FH system pipework and minimize
cobalt-59 entering the PHT system.
Use of overhead feeder cabinet shielding canopy and reactor face shielding.
Use of munters vapour recovery system during outages.
Darlington
The extensive use of shielding such as overhead shielding canopies and reactor face shielding resulted in
11 person-rem of dose savings during the first planned outage at Darlington in 2011.
The use of a feeder ice plug jacket and remote installation/removal tooling resulted in 2.8 person-rem of
dose savings.
Dose savings were also increased by keeping the vault tritium in air concentrations low, through reliable
use of munters vapour recovery dryer units during outages.
Significant dose savings were realized due to improved planning and execution of scaffold builds and
teardowns.
Filed: 2013-09-27 EB-2013-0321 Ex. F2-1-1 Attachment 1
OPG Confidential – Internal Use Only 2012 Benchmarking Report
- 17 -
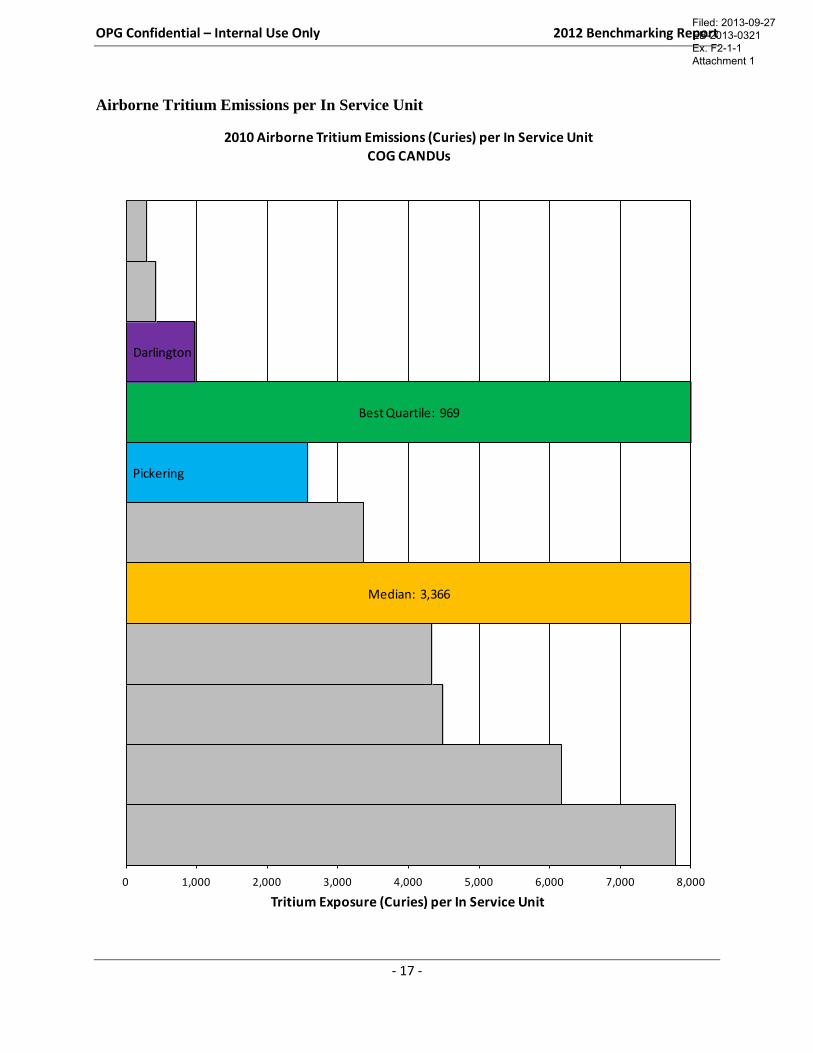
Airborne Tritium Emissions per In Service Unit
Median: 3,366
Pickering
Best Quartile: 969
Darlington
0 1,000 2,000 3,000 4,000 5,000 6,000 7,000 8,000
Tritium Exposure (Curies) per In Service Unit
2010 Airborne Tritium Emissions (Curies) per In Service UnitCOG CANDUs
Filed: 2013-09-27 EB-2013-0321 Ex. F2-1-1 Attachment 1
OPG Confidential – Internal Use Only 2012 Benchmarking Report
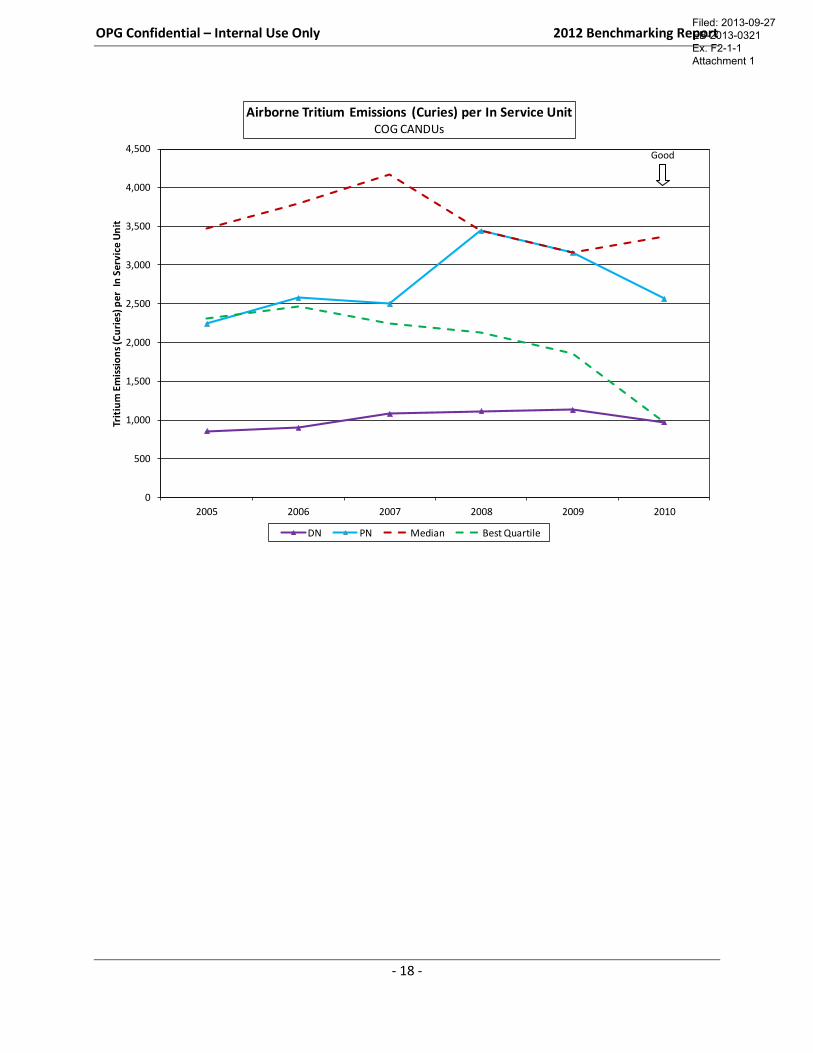
- 18 -
0
500
1,000
1,500
2,000
2,500
3,000
3,500
4,000
4,500
2005 2006 2007 2008 2009 2010
Trit
ium
Em
issi
on
s (C
uri
es)
pe
r In
Se
rvic
e U
nit
Airborne Tritium Emissions (Curies) per In Service UnitCOG CANDUs
DN PN Median Best Quartile
Good
Filed: 2013-09-27 EB-2013-0321 Ex. F2-1-1 Attachment 1
OPG Confidential – Internal Use Only 2012 Benchmarking Report
- 19 -
Observations – Airborne Tritium Emissions (Curies) per Unit
2010 (Annual Value)
Industry data for 2011 was unavailable at the time of benchmarking. The 2010 preliminary industry
results collected from the CANDU Owners Group are included in this report as the most up to date
figures available for benchmarking performance.
Tritium emissions from each facility are compared per in service reactor unit to allow consideration of
decreased emissions resulting from generating units undergoing major refurbishment work campaigns.
Curies per in service unit at top quartile CANDU plants was 969 or lower.
Darlington performed in the best quartile.
Pickering performed better than the median threshold of 3,366 curies per in service unit.
Trend
Ongoing focus on dryer performance, leak management and source term reduction has helped Darlington
sustain its strong performance over the review period and enabled the Pickering station to consistently
improve its performance since 2008.
The industry trend line graph shows that best quartile performance has improved considerably in 2010
with gradual improvement since 2006. The large change observed in 2010 is due to a significant
decrease in emissions from one of the CANDU plants upon placing the unit reactor into refurbishment.
Factors Contributing to Performance
Facilities with access to a tritium removal facility (e.g., Darlington and Pickering) fare better in this
measure, having the benefit of a reduced source term.
OPG is pursuing consistently executing moderator swaps, thereby taking full advantage of access to
detritiation capabilities in order to improve Pickering’s performance and allow Darlington to sustain best
quartile performance.
Implementation of tritium airborne leak-searching requirements and increased focus on tritium reduction
in the tritium removal facility organization at the Darlington site, combined with the execution of the
tritium reduction plan at Pickering, have helped both generating stations improve performance in 2010.
Filed: 2013-09-27 EB-2013-0321 Ex. F2-1-1 Attachment 1
OPG Confidential – Internal Use Only 2012 Benchmarking Report
- 20 -
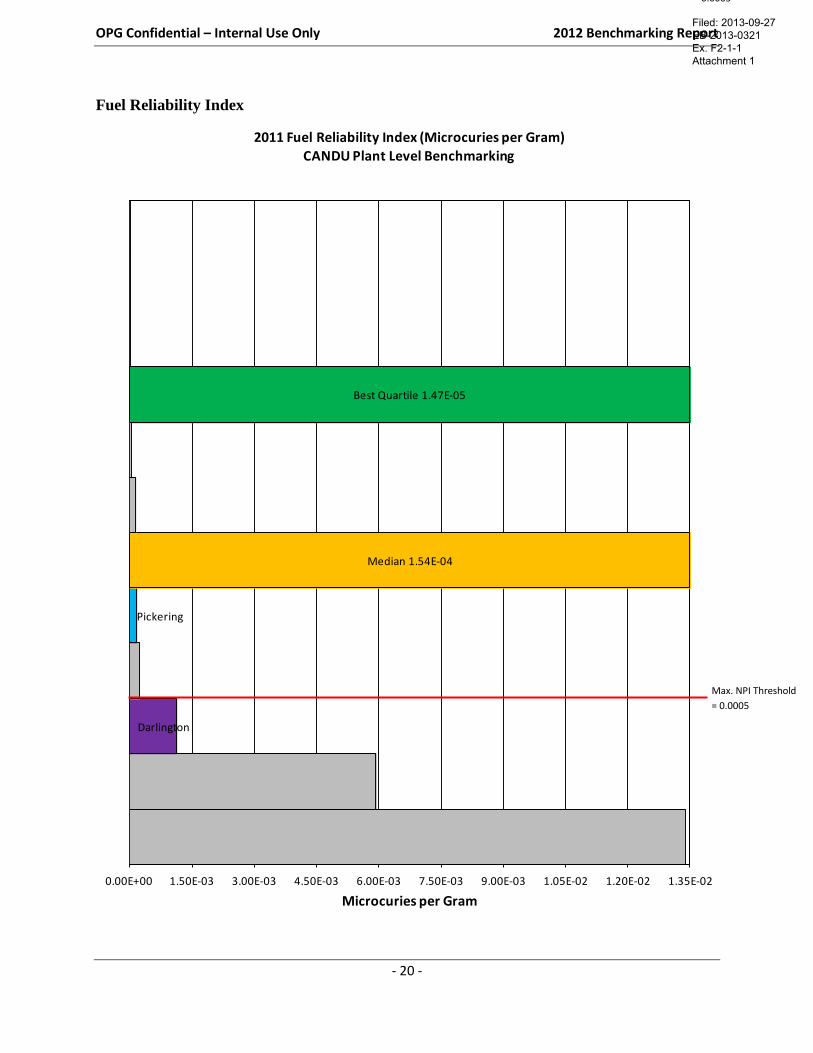
Fuel Reliability Index
Darlington
Pickering
Median 1.54E-04
Best Quartile 1.47E-05
0.00E+00 1.50E-03 3.00E-03 4.50E-03 6.00E-03 7.50E-03 9.00E-03 1.05E-02 1.20E-02 1.35E-02
Microcuries per Gram
2011 Fuel Reliability Index (Microcuries per Gram)CANDU Plant Level Benchmarking
Max. NPI Threshold
= 0.0005
Max. NPI Threshold =
0.0005
Filed: 2013-09-27 EB-2013-0321 Ex. F2-1-1 Attachment 1
OPG Confidential – Internal Use Only 2012 Benchmarking Report
- 21 -
0.0000
0.0005
0.0010
0.0015
0.0020
0.0025
0.0030
2006 2007 2008 2009 2010 2011
Mic
rocu
rie
s p
er
Gra
m
Fuel Reliability Index (Microcuries per Gram)CANDU Plant Level Benchmarking
DN PN Median Best Quartile Max. NPI
0.000
0.002
0.003
0.005
0.006
0.008
0.009
0.011
0.012
0.014
0.015
2006 2007 2008 2009 2010 2011
Mic
rocu
rie
s p
er
Gra
m
Fuel Reliability Index (Microcuries per Gram)CANDU Unit Level Benchmarking
Darlington 1 Darlington 2 Darlington 3 Darlington 4 Pickering 1
Pickering 4 Pickering 5 Pickering 6 Pickering 7 Pickering 8
Median Best Quartile Max. NPI
Good
Good
Max. NPI Threshold =
0.0005
Filed: 2013-09-27 EB-2013-0321 Ex. F2-1-1 Attachment 1
OPG Confidential – Internal Use Only 2012 Benchmarking Report
- 22 -
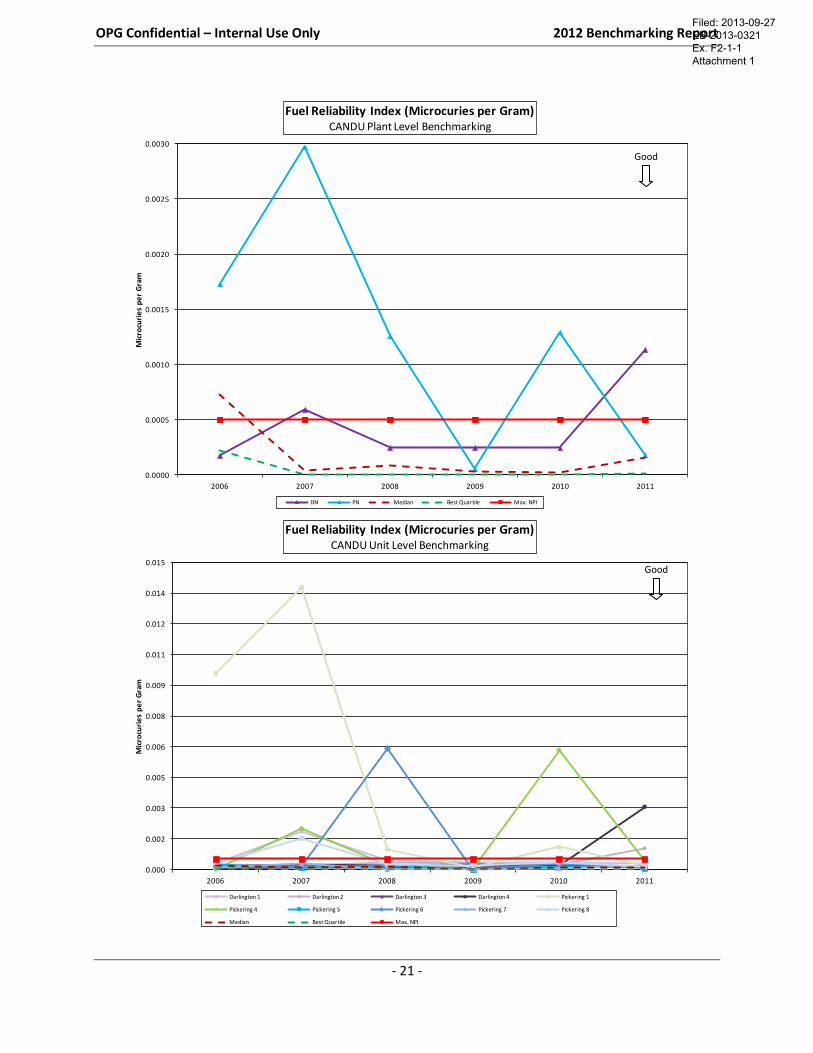
Observations – Fuel Reliability Index (CANDU) (FRI)
2011 (Most Recent Operating Quarter)
Fuel reliability at best quartile CANDU plants was 0.000015 and 0.000001 at the plant and unit level
respectively, and median performance was 0.000154 and 0.000069 at the plant and unit level respectively.
Pickering overall plant performance was slightly worse than median, albeit that two of the six units
performing better than the median. Fuel defects were present in Units 1 and 4, and suspected in Unit 8,
resulting in the fuel reliability index (FRI) being worse than median during the last operating quarter.
Darlington plant performance was worse than median for the last operating quarter. This is a result of
units 1, 2, and 4 experiencing fuel defects during the most recent operating quarter.
Trend
Both the industry best quartile and median FRI at both the plant and unit levels have been consistently
low over the past 5 years, with a slightly downward (i.e., improving) trend.
Pickering plant FRI performance has improved over the past 5 years. The 2009-2011 values are
significantly lower than the 2006-2008 FRI values, which were all well above the median threshold. This
was largely due to the performance of Pickering Unit 1 which experienced high FRI values in 2006-2008
due to fuel defects which have now been removed.
Darlington plant FRI performance, while relatively unchanged from 2008 to 2010, experienced an
upward trend in 2011 due to a series of fuel defects occurring that year. Despite these fuel defects, the
increase in FRI was relatively small as a result of rapid detection and removal of the defects.
Factors Contributing to Performance
Improving fuel reliability continues to be a focus area at both Pickering and Darlington stations.
Corrective actions are taken for each fuel defect, to locate, defuel, and examine the cause of the defect as
quickly as possible. To the extent practicable, each defected fuel bundle, when discharged from the core,
is examined to determine the reason for failure. Inspections are performed on-site, and if inconclusive,
are shipped for more extensive examinations off-site. Several initiatives were undertaken to improve fuel
integrity through improving foreign material exclusion from the heat transport system, fuel management,
and defect detection and removal strategies.
Darlington has experienced an increase in fuel defects in the last 9 months of 2011. Removal of these defects has
been very rapid, and the FRI has been affected minimally. Two teams have been assembled to identify areas for
improvement in manufacturing practices and foreign material exclusion. These teams focus on identifying and
correcting any deficiencies in these two areas, even before the causes of these defects have been identified.
Filed: 2013-09-27 EB-2013-0321 Ex. F2-1-1 Attachment 1
OPG Confidential – Internal Use Only 2012 Benchmarking Report
- 23 -
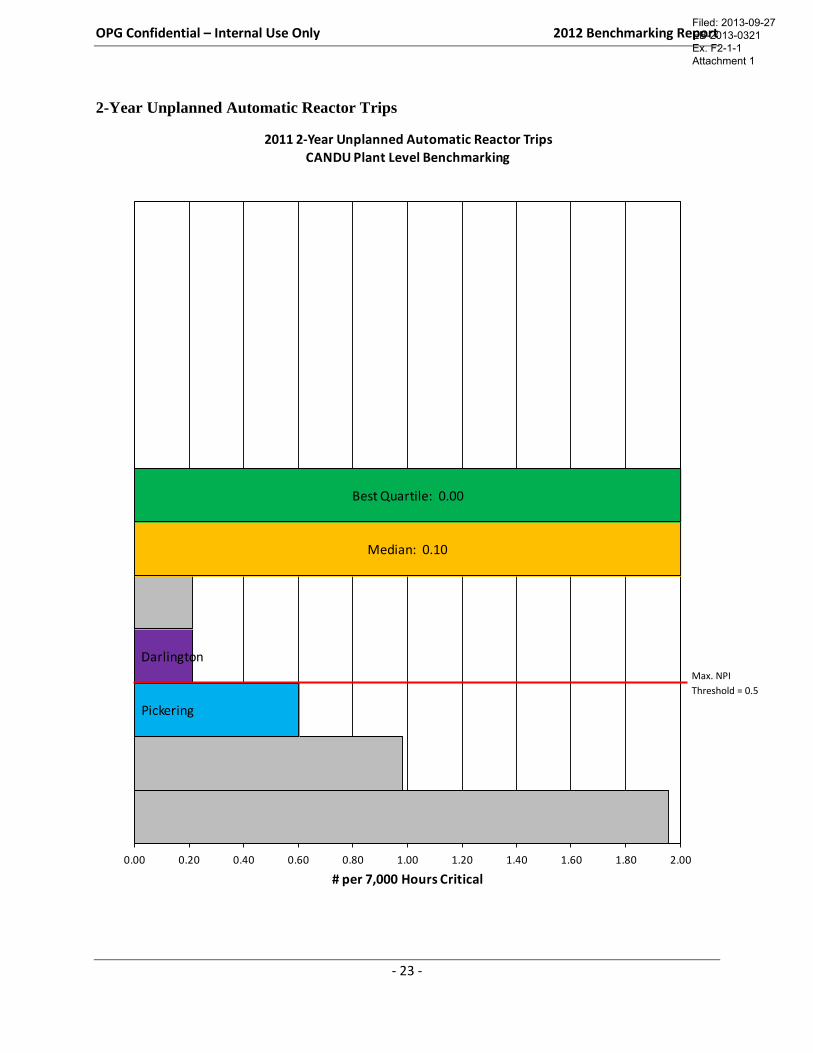
2-Year Unplanned Automatic Reactor Trips
Pickering
Darlington
Median: 0.10
Best Quartile: 0.00
0.00 0.20 0.40 0.60 0.80 1.00 1.20 1.40 1.60 1.80 2.00
# per 7,000 Hours Critical
2011 2-Year Unplanned Automatic Reactor TripsCANDU Plant Level Benchmarking
Max. NPI
Threshold = 0.5
Max. NPI Threshold
= 0.0005
Max. NPI Threshold
= 0.0005
Max. NPI
Threshold = 0.5
Filed: 2013-09-27 EB-2013-0321 Ex. F2-1-1 Attachment 1
OPG Confidential – Internal Use Only 2012 Benchmarking Report
- 24 -
Pickering 1
Pickering 5
Pickering 7
Pickering 8
Darlington 4
Darlington 3
Median: 0.00
Best Quartile: 0.00
Darlington 1
Darlington 2
Pickering 4
Pickering 6
0.00 0.25 0.50 0.75 1.00 1.25 1.50 1.75 2.00 2.25 2.50
# per 7,000 Hours Critical
2011 2-Year Unplanned Automatic Reactor TripsCANDU Unit Level Benchmarking
Max. NPI
Threshold = 0.5
Max. NPI
Threshold = 0.5
Filed: 2013-09-27 EB-2013-0321 Ex. F2-1-1 Attachment 1
OPG Confidential – Internal Use Only 2012 Benchmarking Report
- 25 -
0.00
0.10
0.20
0.30
0.40
0.50
0.60
0.70
2006 2007 2008 2009 2010 2011
# p
er 7
,000
Ho
urs
Cri
tica
l
2-Year Unplanned Automatic Reactor TripsCANDU Plant Level Benchmarking
DN PN Median Best Quartile Max. NPI
0.00
0.50
1.00
1.50
2.00
2.50
2006 2007 2008 2009 2010 2011
# p
er 7
,000
Ho
urs
Cri
tica
l
2-Year Unplanned Automatic Reactor TripsCANDU Unit Level Benchmarking
Darlington 1 Darlington 2 Darlington 3 Darlington 4
Pickering 1 Pickering 4 Pickering 5 Pickering 6
Pickering 7 Pickering 8 Median Best Quartile
Max. NPI
Good
Good
Filed: 2013-09-27 EB-2013-0321 Ex. F2-1-1 Attachment 1
OPG Confidential – Internal Use Only 2012 Benchmarking Report
- 26 -
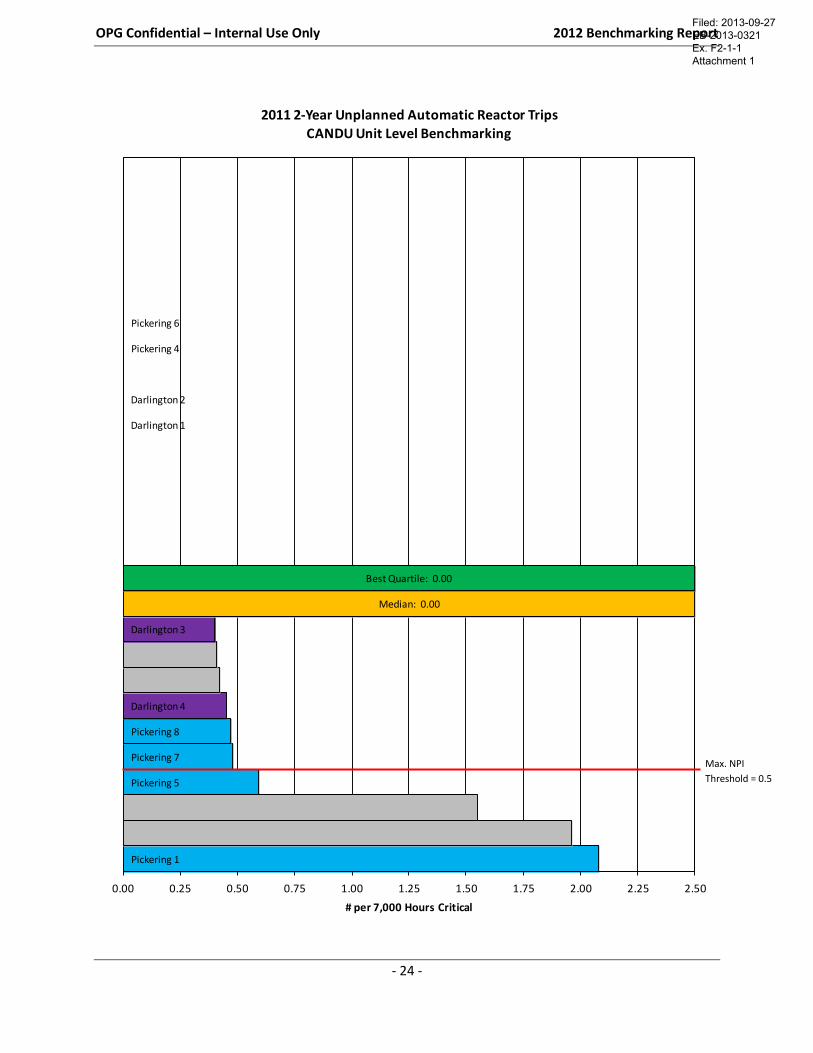
Observations – 2-Year Unplanned Automatic Reactor Trips (CANDU)
2011 (2-Year Rolling Average)
The 2-year rolling average unplanned automatic reactor trip rate best quartile for CANDU plants was
zero with a median of 0.10. For individual CANDU units, the best quartile and median values for
unplanned reactor trip rate was zero.
At the plant level, Pickering Nuclear achieved a trip rate of 0.60 in 2011, performing worse than the
third quartile benchmark of 0.51. On an individual unit basis, Units 4 and 6, with trip rates of zero,
performed within the best quartile of zero. Pickering Unit 1, with a trip rate of 2.08, was the worst
performing generating unit of the benchmarking panel and was significantly worse than the third
quartile of 0.44. Units 7 and 8, with trip rates of 0.48 and 0.47 respectively, performed slightly worse
than the third quartile in 2011.
Pickering Units 1 and 4 received 5 out of 10 World Association of Nuclear Operators (WANO)
nuclear performance index (NPI) points for unplanned automatic reactor trips as of the fourth quarter
of 2011. Pickering Units 5 to 8 received an average of 9.8 out of 10 WANO NPI points for
unplanned automatic reactor trips at the end of 2011.
Darlington Nuclear achieved a plant level trip rate of 0.21 in 2011, performing worse than the median
of 0.10 but better than the third quartile threshold of 0.51. On an individual unit basis, Units 1 and 2,
with trip rates of zero, performed within the best quartile, which is zero. Unit 3, with a trip rate of
0.40, performed worse than median, but better than the third quartile threshold of 0.44. Unit 4
achieved a trip rate of 0.45, performing slightly worse than the third quartile.
Darlington Nuclear received 10 out of 10 WANO NPI points for unplanned automatic reactor trips at
the end of 2011.
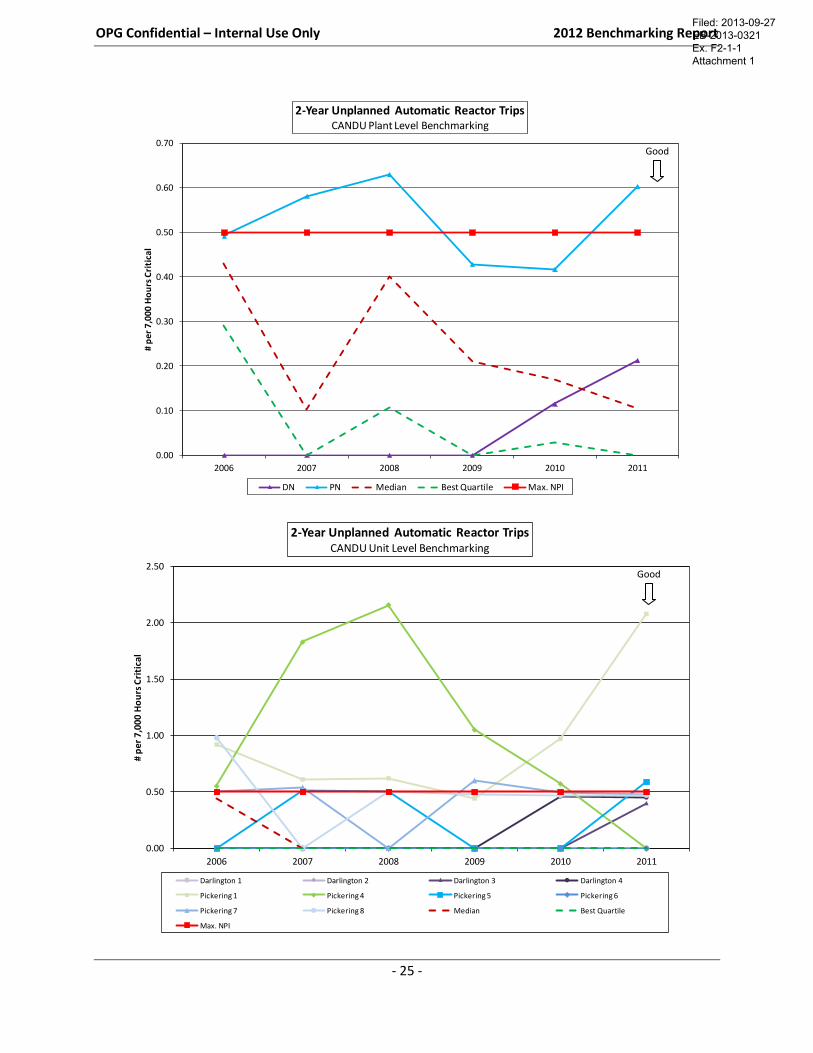
Trend
The unplanned automatic reactor trip rate best quartile and median of CANDU plants improved from
2010 to 2011. On an individual unit basis, the industry best quartile and median has remained strong
at zero since 2007.
The performance of the Pickering station has fluctuated over the 2006-2011 review period, achieving
0.49 trips in 2006, 0.63 trips in 2008 and ending the period with 0.60 trips in 2011. On an individual
unit basis, Unit 4 showed improved performance from 2010 and had no annual automatic reactor trip
events in 2010 and 2011. Unit 1 performance worsened from 2010 and the unit had two annual
automatic reactor trip events in both 2010 and 2011. Unit 5 performance also worsened from 2010 to
2011 and the unit had one automatic reactor trip event in 2011. Unit 6 has consistently performed at
zero trips since 2006. Unit 7 showed improvement in its reactor trip rate performance in 2011 from
2010. Unit 8 performance was consistent with 2010 and had no annual automatic reactor trip events
in 2011.
Darlington station performance worsened from 2010 to 2011. On an individual unit basis, Units 1
and 2 have consistently performed at zero trips since 2006. Unit 3 performance worsened from 2010
to 2011 and the unit had one annual automatic reactor trip event in 2011. Unit 4 showed slight
improvement in performance from 2010, with no annual automatic reactor trip events in 2011.
Factors Contributing to Performance
Key performance drivers for this metric include: general equipment reliability, material condition and
human performance.
Filed: 2013-09-27 EB-2013-0321 Ex. F2-1-1 Attachment 1
OPG Confidential – Internal Use Only 2012 Benchmarking Report
- 27 -
3-Year Auxiliary Feedwater Safety System Unavailability
Pickering
Median: 0.0026
Best Quartile: 0.0000
Darlington
0.0000 0.0025 0.0050 0.0075 0.0100 0.0125 0.0150 0.0175 0.0200 0.0225 0.0250
Hours Unavailable/Total Hours Required to be Available
2011 3-Year Auxiliary Feedwater Safety System Performance (Unavailability)CANDU Plant Level Benchmarking
Max. NPI
Threshold = 0.02
Filed: 2013-09-27 EB-2013-0321 Ex. F2-1-1 Attachment 1
OPG Confidential – Internal Use Only 2012 Benchmarking Report
- 28 -
Pickering 5
Pickering 1
Median: 0.0002
Best Quartile: 0.0000
Darlington 1
Darlington 2
Darlington 3
Darlington 4
Pickering 4
Pickering 6
Pickering 7
Pickering 8
0.0000 0.0050 0.0100 0.0150 0.0200 0.0250 0.0300
Hours Unavailable/Total Hours required to be Available
2011 3-Year Auxiliary Feedwater Safety System Performance (Unavailability)CANDU Unit Level Benchmarking
Max. NPI
Threshold = 0.02
Filed: 2013-09-27 EB-2013-0321 Ex. F2-1-1 Attachment 1
OPG Confidential – Internal Use Only 2012 Benchmarking Report
- 29 -
0.0000
0.0050
0.0100
0.0150
0.0200
0.0250
2006 2007 2008 2009 2010 2011
Ho
urs
Un
avai
lab
le/T
ota
l Ho
urs
re
qu
ire
d t
o b
e A
vaila
ble
3-Year Auxiliary Feedwater Safety System Performance (Unavailability)CANDU Plant Level Benchmarking
DN PN Median Best Quartile Max. NPI
0.0000
0.0050
0.0100
0.0150
0.0200
0.0250
2006 2007 2008 2009 2010 2011
Ho
urs
Un
avai
lab
le/
Tota
l Ho
urs
Re
qu
ire
d t
o b
e A
vail
able
3-Year Auxiliary Feedwater Safety System Performance (Unavailability)CANDU Unit Level Benchmarking
Darlington 1 Darlington 2 Darlington 3 Darlington 4
Pickering 1 Pickering 4 Pickering 5 Pickering 6
Pickering 7 Pickering 8 Median Best Quartile
Max. NPI
Good
Good
Filed: 2013-09-27 EB-2013-0321 Ex. F2-1-1 Attachment 1
OPG Confidential – Internal Use Only 2012 Benchmarking Report
- 30 -
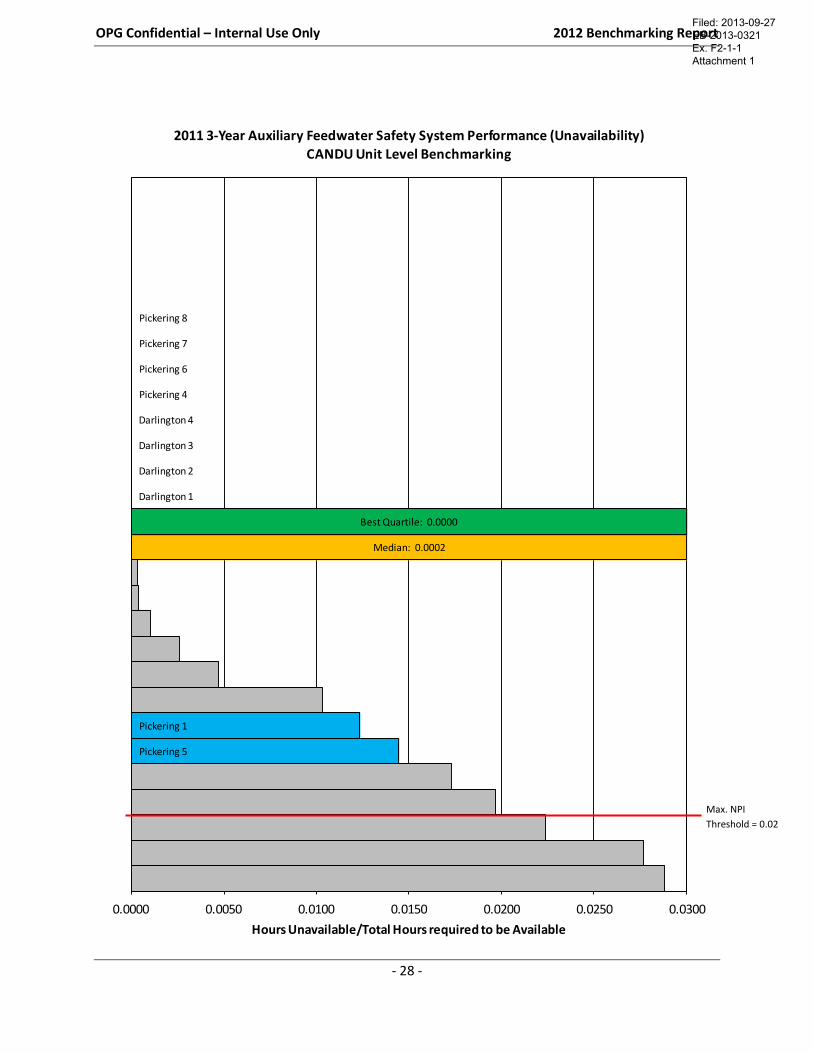
Observations – 3-Year Auxiliary Feedwater System (CANDU)
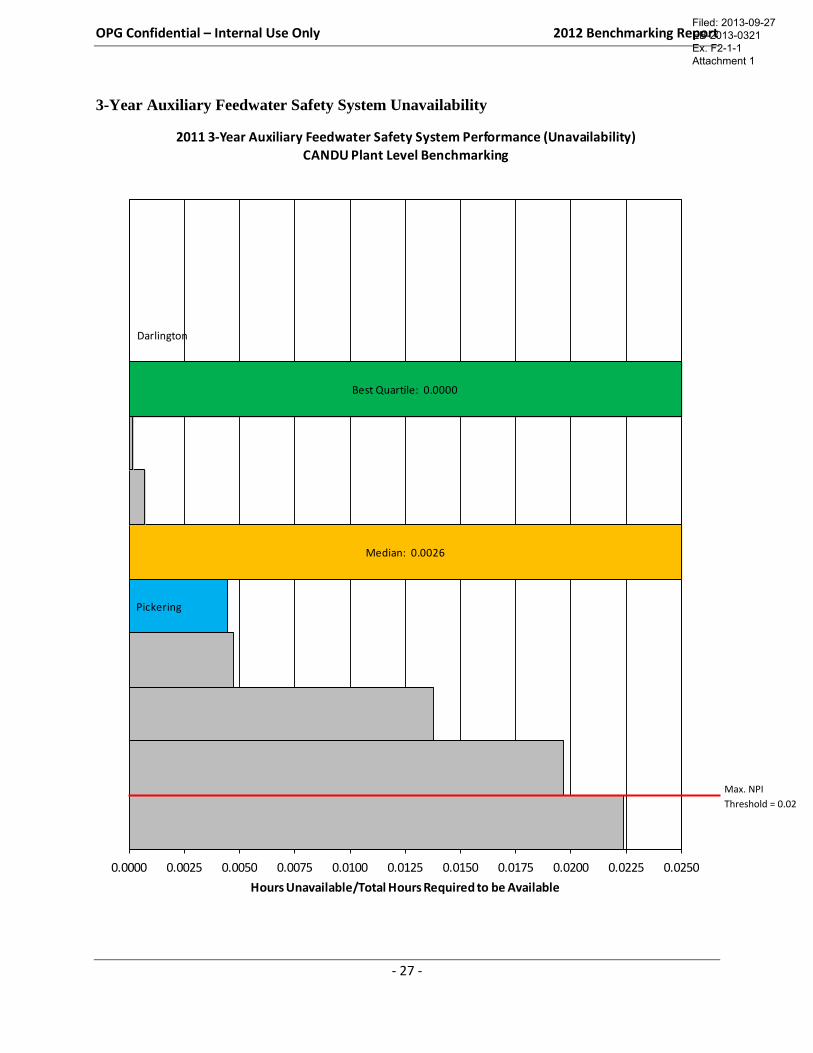
2011 (3-Year Rolling Average)
Auxiliary feedwater (AFW) safety system performance at best quartile CANDU plants
was zero with a median of 0.0026. For individual CANDU units, the best quartile was
zero with a median of 0.0002.
Pickering Nuclear station performance (0.0044) was worse than median but better than
third quartile in 2011. On an individual unit basis, Units 4, 6, 7 and 8 had zero
unavailability in 2011 (best quartile performance) and Units 1 and 5 performed worse
than the median with an unavailability of 0.0123 and 0.0144 respectively.
Darlington Nuclear achieved best quartile performance of zero unavailability at both the
station and unit levels in 2011.
Both OPG stations obtained full WANO NPI points at the end of 2011.
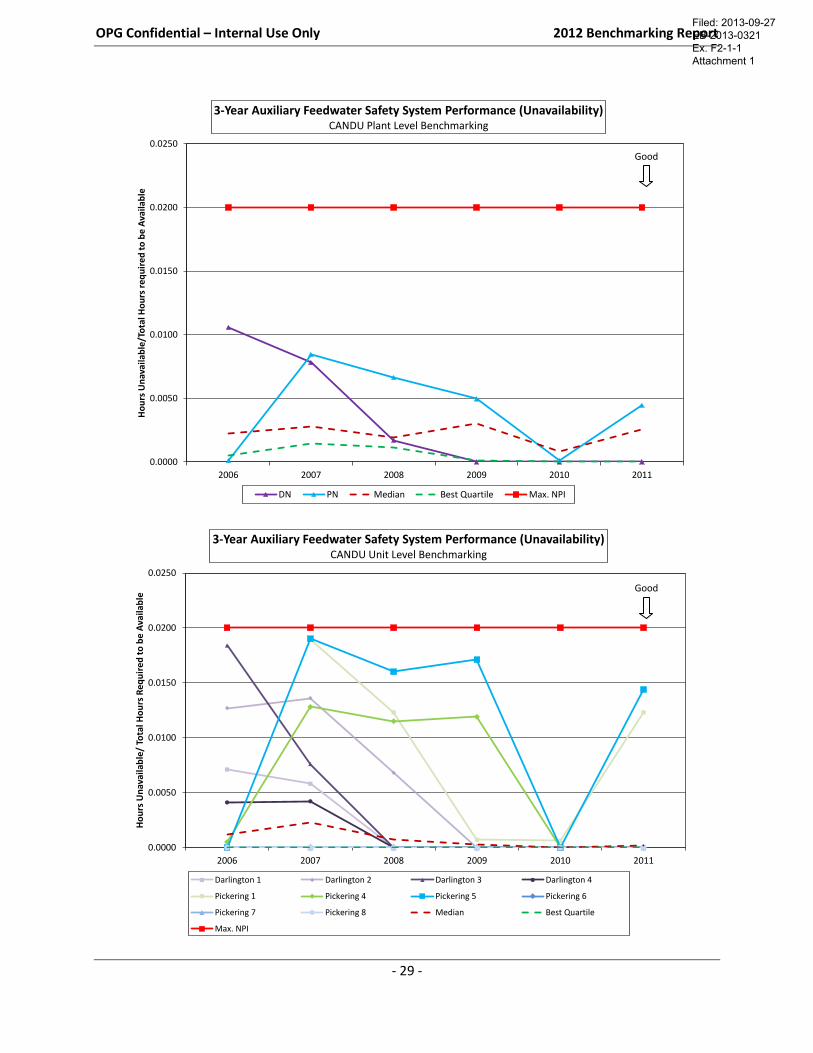
Trend
The 3-year auxiliary feedwater unavailability best quartile of CANDU plants improved
to zero unavailability in 2011 but the median value was slightly worse than in 2010. On
an individual unit basis, best quartile performance value was zero consistent with
performance observed in the past five years. The plant level industry median value was
slightly worse than in 2010.
Pickering station performance in 2011 was worse than 2010. On an individual unit
basis, the performance of Units 1 and 5 worsened from 2010 to 2011. Unit 4 achieved
an unavailability of zero similar to 2010. Units 6, 7 and 8 consistently maintained zero
unavailability (best quartile performance) over the last five years.
Darlington performance has steadily improved since 2006, decreasing from an average
station unavailability of 0.0106 in 2006 to sustaining zero unavailability for the last
three years of the review period. All Darlington units achieved zero unavailability since
2009.
Factors Contributing to Performance
Key performance drivers for this metric include: general equipment reliability, material
condition, and human performance.
Pickering Unit 1 saw a decline in performance in 2011 due to a failed close Auxiliary
Feedwater System pump control valve. This valve was subsequently replaced with a
new and improved design.
Pickering Unit 5 performance declined in 2011 due to the unavailability of pump 5
caused by a mechanical seal leakage. Bearing housing seals were replaced in 2011 and
the pump returned to service.
Filed: 2013-09-27 EB-2013-0321 Ex. F2-1-1 Attachment 1
OPG Confidential – Internal Use Only 2012 Benchmarking Report
- 31 -
3-Year Emergency AC Power Safety Unavailability
Pickering
Median: 0.0067
Darlington
Best Quartile: 0.0005
0.0000 0.0500 0.1000 0.1500 0.2000 0.2500
Hours Unavailable/Total Hours Required to be Available
2011 3-Year Emergency AC Power Safety System Performance (Unavailability)CANDU Plant Level Benchmarking
Max. NPI
Threshold = 0.025
Filed: 2013-09-27 EB-2013-0321 Ex. F2-1-1 Attachment 1
OPG Confidential – Internal Use Only 2012 Benchmarking Report
- 32 -
0.0000
0.0050
0.0100
0.0150
0.0200
0.0250
0.0300
2006 2007 2008 2009 2010 2011
Ho
urs
Un
avai
lab
le/T
ota
l Ho
urs
Req
uir
ed t
o b
e A
vaila
ble
3-Year Emergency AC Power Safety System Performance (Unavailability)CANDU Plant Level Benchmarking
DN PN Median Best Quartile Max. NPI
Max. NPI
Threshold = 0.025
Good
Filed: 2013-09-27 EB-2013-0321 Ex. F2-1-1 Attachment 1
OPG Confidential – Internal Use Only 2012 Benchmarking Report
- 33 -
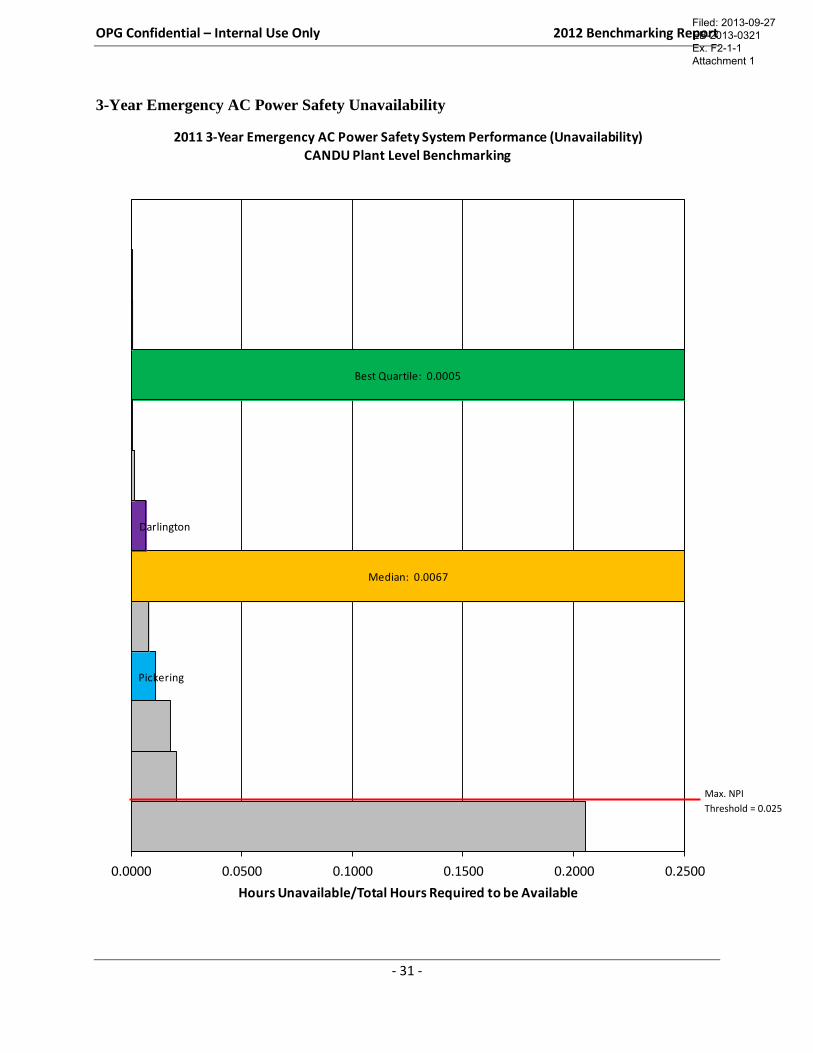
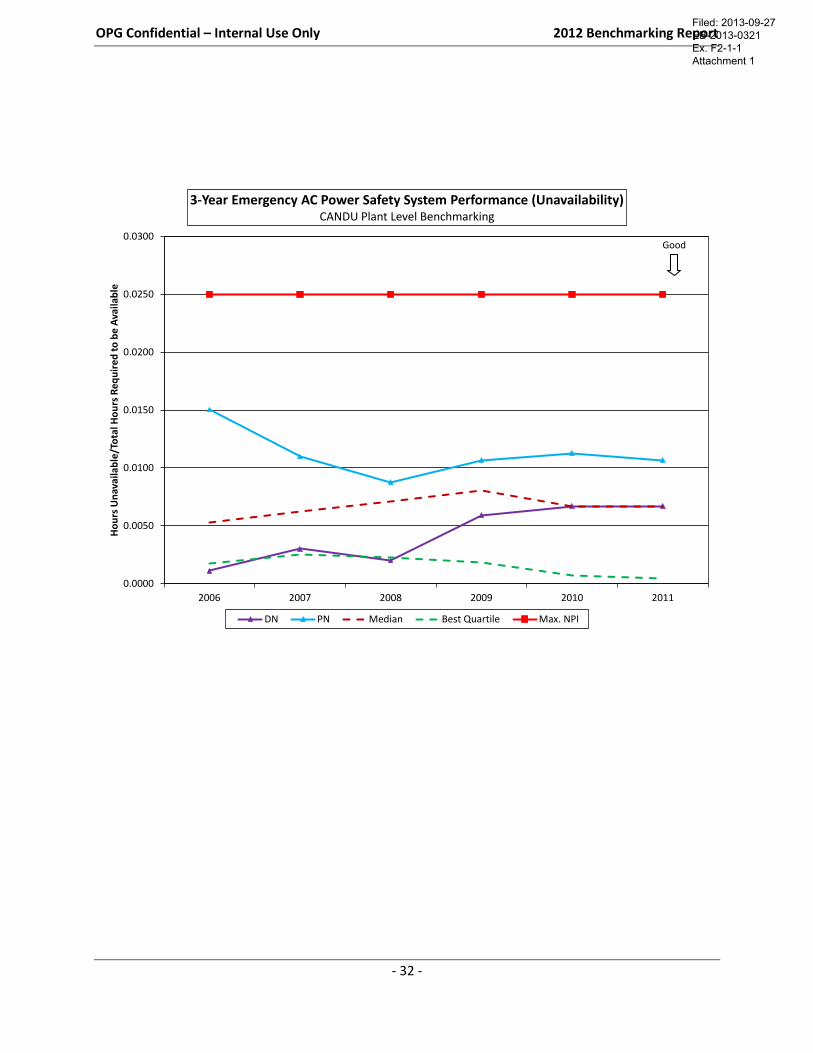
Observations – 3-Year Emergency AC Power Safety System (CANDU)
2011 (3-Year Rolling Average)
3-Year Emergency AC Power Safety System performance at best quartile CANDU
plants was 0.0005. The industry median value was 0.0067.
Pickering performed worse than median but better than the third quartile threshold in
2011, earning 10 out of 10 WANO NPI points at the end of 2011.
Darlington achieved median performance and earned 10 out of 10 WANO NPI points at
the end of 2011.
Trend
The 3-year Emergency AC Power Safety System unavailability industry best quartile of
CANDU plants has steadily improved since 2007, reaching its lowest point of the
review period in 2011 (0.0005). The industry median value in 2011 has remained the
same as 2010.
The performance of Pickering improved from 2006 to 2008, worsening in 2009 and
2010 before showing a favourable improvement in 2011.
Darlington station performance in 2011 was similar to 2010 but showed an
unfavourable trend in the 3-year rolling average from 2008 to 2010. Darlington
achieved an annual unavailability of zero in 2011.
Factors Contributing to Performance
Key performance drivers for this metric include: general equipment reliability, material
condition, and human performance.
Filed: 2013-09-27 EB-2013-0321 Ex. F2-1-1 Attachment 1
OPG Confidential – Internal Use Only 2012 Benchmarking Report
- 34 -
3-Year High Pressure Safety Injection
Pickering
Median: 0.0001
Best Quartile: 0.0000
Darlington
0.0000 0.0020 0.0040 0.0060 0.0080 0.0100
Hours Unavailable/Total Hours Required to be Available
2011 3-Year High Pressure Injection (ECI) Safety System Performance (Unavailability)
CANDU Plant Level Benchmarking
Max. NPI
Threshold = 0.02
Filed: 2013-09-27 EB-2013-0321 Ex. F2-1-1 Attachment 1
OPG Confidential – Internal Use Only 2012 Benchmarking Report
- 35 -
Pickering 4
Median: 0.0000
Best Quartile: 0.0000
Darlington 1
Darlington 2
Darlington 3
Darlington 4
Pickering 1
Pickering 5
Pickering 6
Pickering 7
Pickering 8
0.0000 0.0020 0.0040 0.0060 0.0080 0.0100 0.0120
Hours Unavailable/Total Hours Required to be Available
2011 3-Year High Pressure Injection (ECI) Safety System Performance (Unavailability)
CANDU Unit Level Benchmarking
Max. NPI
Threshold = 0.02
Filed: 2013-09-27 EB-2013-0321 Ex. F2-1-1 Attachment 1
OPG Confidential – Internal Use Only 2012 Benchmarking Report
- 36 -
0.0000
0.0050
0.0100
0.0150
0.0200
0.0250
2006 2007 2008 2009 2010 2011
Ho
urs
Un
avai
lab
le/T
ota
l Ho
urs
Req
uir
ed t
o b
e A
vaila
ble
3-Year High Pressure Injection (ECI) Safety System Performance (Unavailability)CANDU Plant Level Benchmarking
DN PN Median Best Quartile Max. NPI
0.0000
0.0050
0.0100
0.0150
0.0200
0.0250
2006 2007 2008 2009 2010 2011
Ho
urs
Un
avai
lab
le/T
ota
l Ho
urs
Re
qu
ire
d t
o b
e A
vail
able
3-Year High Pressure Injection (ECI) Safety System Performance (Unavailability)CANDU Unit Level Benchmarking
Darlington 1 Darlington 2 Darlington 3 Darlington 4
Pickering 1 Pickering 4 Pickering 5 Pickering 6
Pickering 7 Pickering 8 Median Best Quartile
Max. NPI
Good
Good
Filed: 2013-09-27 EB-2013-0321 Ex. F2-1-1 Attachment 1
OPG Confidential – Internal Use Only 2012 Benchmarking Report
- 37 -
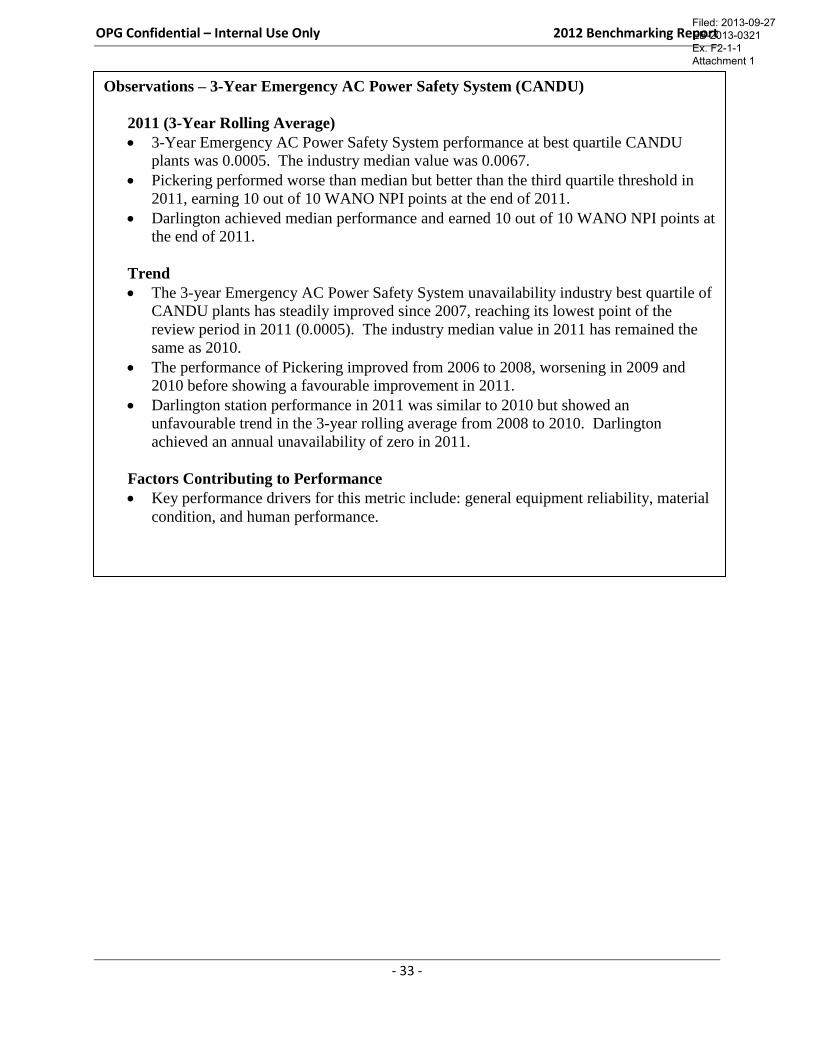
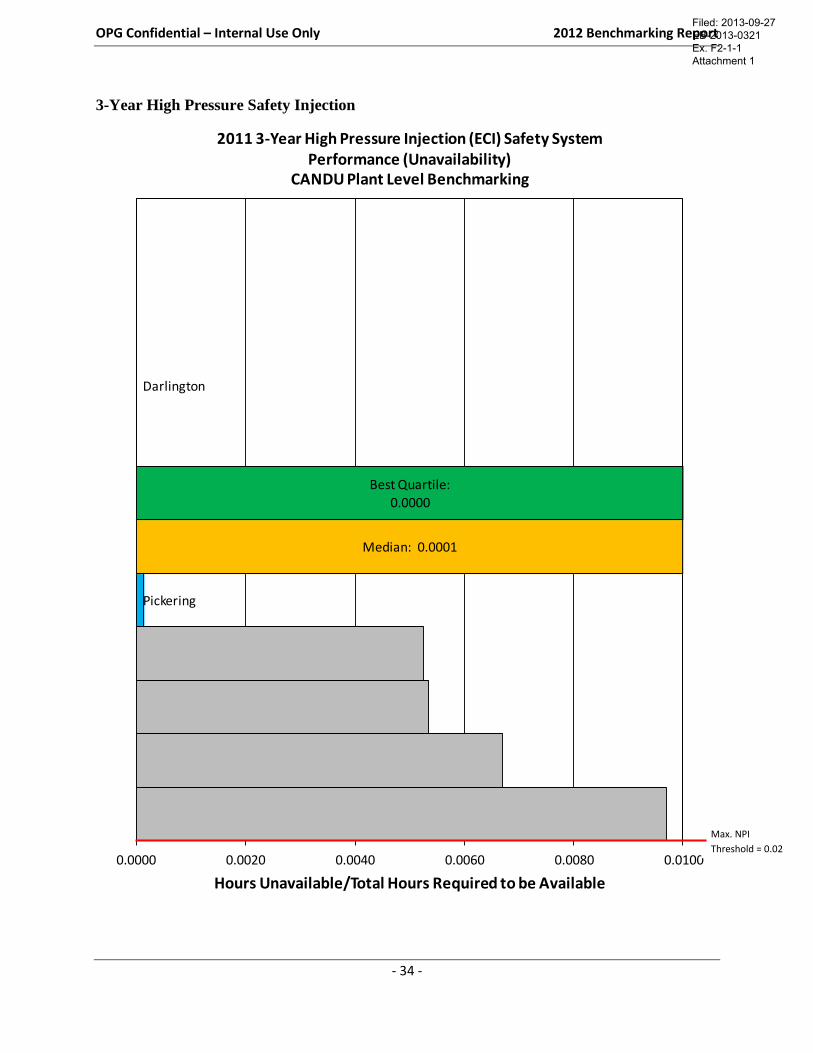
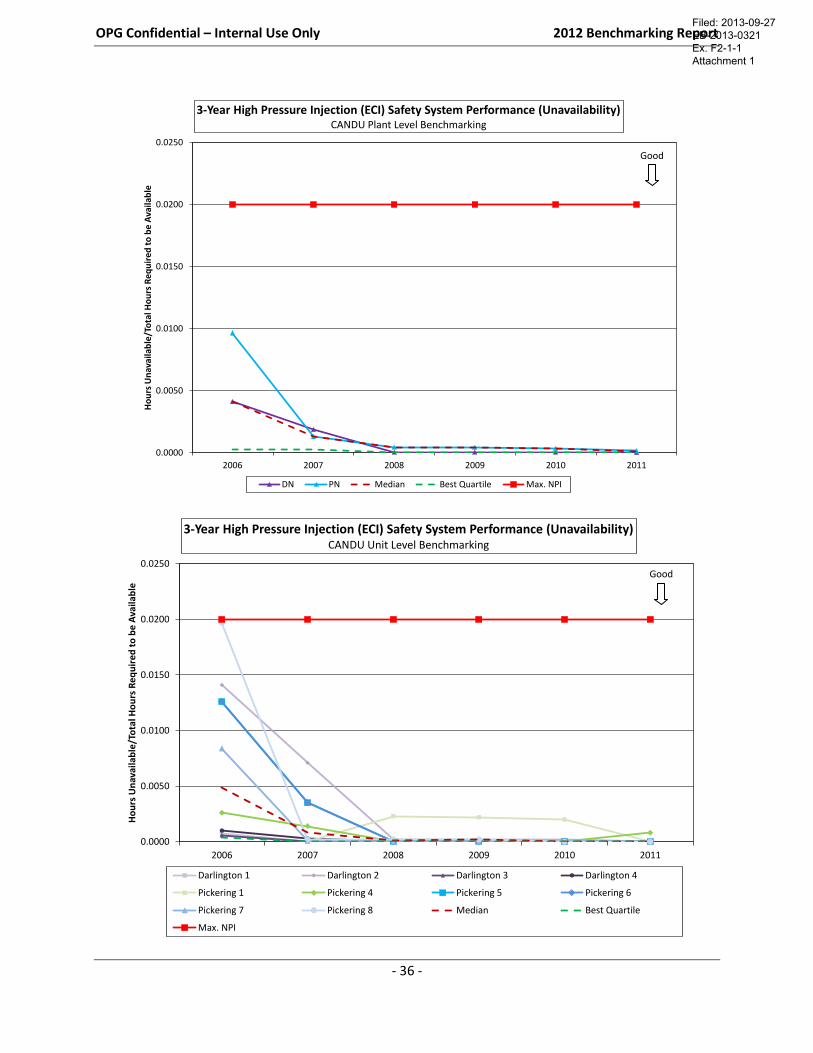
Observations – 3-Year High Pressure Safety Injection Unavailability (CANDU)
2011 (3-Year Rolling Average)
The 3-year High Pressure Safety Injection Unavailability performance at best quartile
CANDU plants was zero at both the plant and unit level. The industry median value
was 0.0001 at the plant level and zero at the unit level.
Pickering station performance was at median value and earned full WANO NPI points
at the end of 2011. On an individual unit basis, Units 1, 5, 6, 7 and 8 achieved best
quartile performance (zero unavailability) in 2011. Unit 4 performed worse than the
median but better than the industry third quartile threshold.
Darlington plant performance was at the best quartile of zero in 2011, earning full
WANO NPI points. On an individual unit basis, all Darlington units also achieved best
quartile performance (zero unavailability) in 2011.
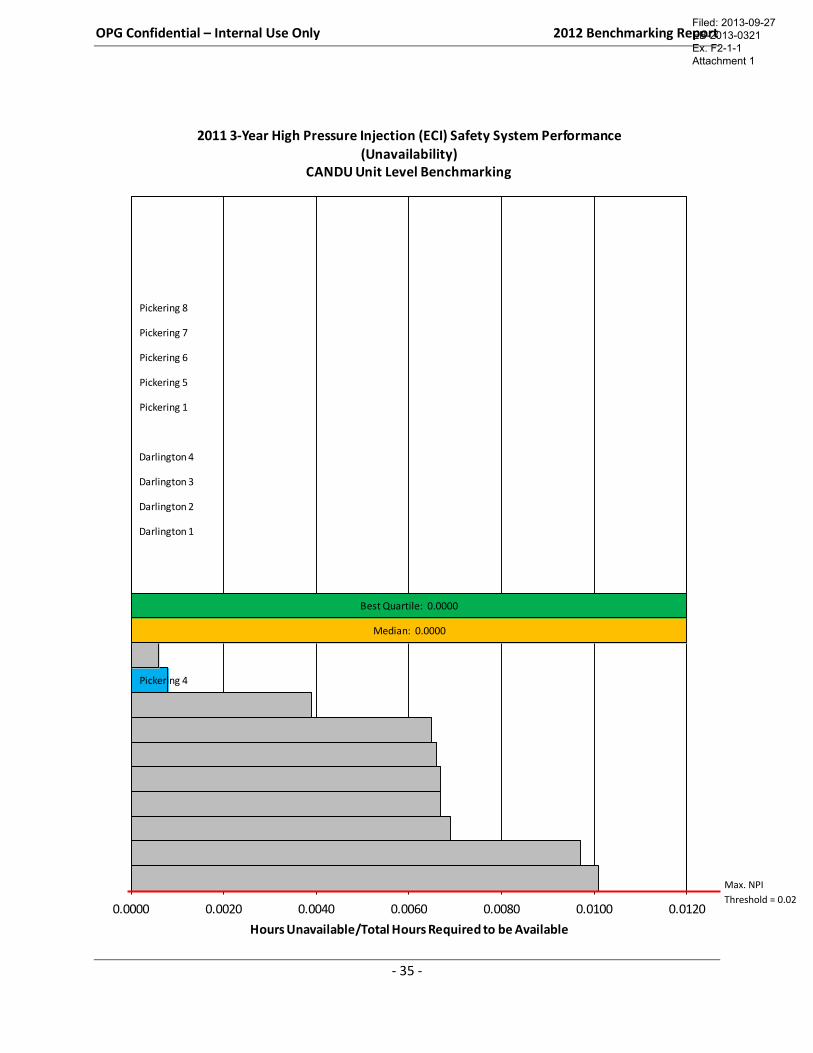
Trend
The 3-Year High Pressure Safety Injection unavailability best quartile performance of
CANDU plants has been at zero since 2008. The industry median value has improved
from 0.0041 in 2006 to 0.0001 in 2011. At the unit level, best quartile performance was
zero consistent with performance observed since 2007. The median value remained at
zero from 2010.
The plant performance of Pickering Nuclear has consistently improved over the past 5
years down from a high of 0.0096 in 2006 to 0.0001 in 2011. On an individual unit
basis, Unit 1 has consistently improved over the past three years down from 0.0023 in
2008 to zero unavailability in 2011. Unit 4 performance worsened from 2010 to 2011.
Units 5 and 7 have been at the best quartile of zero since 2008. Units 6 and 8 remained
at best quartile since 2010.
Darlington performance has been consistently strong in the past five years and achieved
the best quartile of zero unavailability in 2011. On an individual unit basis, Units 1 and
3 have been at the best quartile of zero since 2007. Darlington Unit 4 has been at the
best quartile of zero since 2008. Unit 2 has been consistently strong over the last three
years and achieved the best quartile of zero in 2011.
Factors Contributing to Performance
Key performance drivers for this metric include: general equipment reliability, material
condition, and human performance.
Pickering Unit 4 performance declined in 2011 due to a pump seal failure.
Filed: 2013-09-27 EB-2013-0321 Ex. F2-1-1 Attachment 1
- 38 -
3.0 RELIABILITY
Methodology and Sources of Data
The majority of reliability metrics were calculated using the data from WANO. Any data
labelled as invalid by WANO was excluded from all calculations. Indicator values of zero are
not plotted or included in calculations except in cases where zero is a valid result. Complete data
for the 2004-2011 period was obtained and averages are as provided by WANO.
The two backlog metrics, deficient and corrective maintenance, are also included within this
section and the data comes from an industry sponsored INPO AP-928 subcommittee rather than
from a more formal third-party source. Data points benchmarked are a single point in time, not a
rolling average. All of the data is self-reported. Industry backlog benchmark standards changed
with Revision 3 of AP-928 Work Management Practices at INPO in June of 2010. The new
standard created an alignment between engineering criticality coding and backlog classification
that allows improved focus on the more critical outstanding work. This standard also sets a more
consistent foundation for classification of backlogs such that comparisons between utilities will
be more meaningful. All OPG stations converted to the new standard on January 24, 2011. The
latest 2011 industry backlog benchmark data was collected on September 30. The results and
supporting analysis associated with the backlog metrics reflect this industry development.
Discussion
The primary metric within the reliability section is the WANO NPI. The WANO NPI is an
operational performance indicator comprised of 10 metrics, three of which are analyzed in this
section: Forced Loss Rate, Unit Capability Factor, and Chemistry Performance Indicator. The
remainder of the WANO NPI components are analyzed in the safety section (Section 2.0).
For WANO NPI, Darlington performed very well achieving best quartile performance against
CANDU plants in 2011. In addition, Darlington maintained median performance for three
metrics, third quartile performance for one indicator and fourth quartile performance for the On-
line Corrective Maintenance Backlog metric. The Pickering station needs to improve
performance significantly to achieve industry best quartile for the NPI. The metrics with the
poorest performance at the Pickering station are the Forced Loss Rate, Chemistry Performance
Indicator and On-line Corrective Maintenance Backlog which were in the fourth quartile in 2011.
Filed: 2013-09-27 EB-2013-0321 Ex. F2-1-1 Attachment 1
OPG Confidential – Internal Use Only 2012 Benchmarking Report
- 39 -
WANO Nuclear Performance Index
Pickering
Median: 84.6
Best Quartile: 91.4
Darlington
0 10 20 30 40 50 60 70 80 90 100
Index
2011 WANO Nuclear Performance IndexCANDU Plant Level Benchmarking
Filed: 2013-09-27 EB-2013-0321 Ex. F2-1-1 Attachment 1
OPG Confidential – Internal Use Only 2012 Benchmarking Report
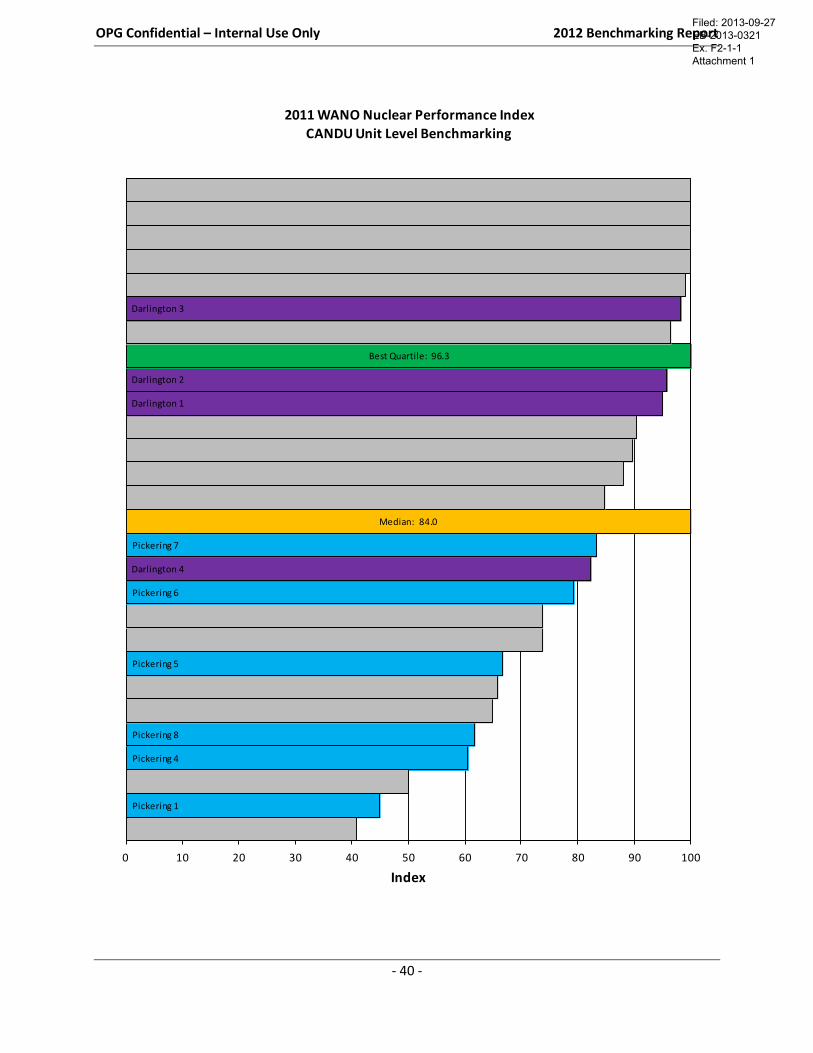
- 40 -
Pickering 1
Pickering 4
Pickering 8
Pickering 5
Pickering 6
Darlington 4
Pickering 7
Median: 84.0
Darlington 1
Darlington 2
Best Quartile: 96.3
Darlington 3
0 10 20 30 40 50 60 70 80 90 100
Index
2011 WANO Nuclear Performance IndexCANDU Unit Level Benchmarking
Filed: 2013-09-27 EB-2013-0321 Ex. F2-1-1 Attachment 1
OPG Confidential – Internal Use Only 2012 Benchmarking Report
- 41 -
0
10
20
30
40
50
60
70
80
90
100
2006 2007 2008 2009 2010 2011
Ind
ex
WANO Nuclear Performance IndexCANDU Plant Level Benchmarking
Darlington Pickering Median Best Quartile
0
10
20
30
40
50
60
70
80
90
100
2006 2007 2008 2009 2010 2011
Ind
ex
WANO Nuclear Performance IndexCANDU Unit Level Benchmarking
Darlington 1 Darlington 2 Darlington 3 Darlington 4 Pickering 1 Pickering 4
Pickering 5 Pickering 6 Pickering 7 Pickering 8 Median Best Quartile
Good
Good
Filed: 2013-09-27 EB-2013-0321 Ex. F2-1-1 Attachment 1
OPG Confidential – Internal Use Only 2012 Benchmarking Report
- 42 -
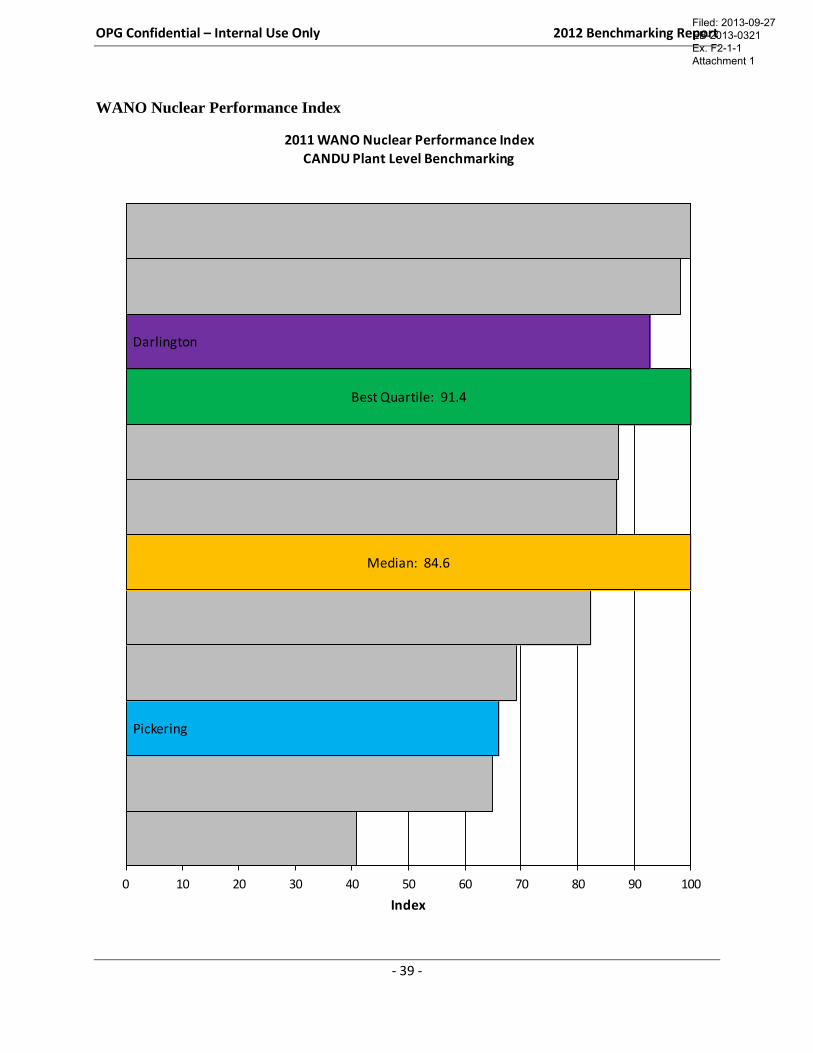
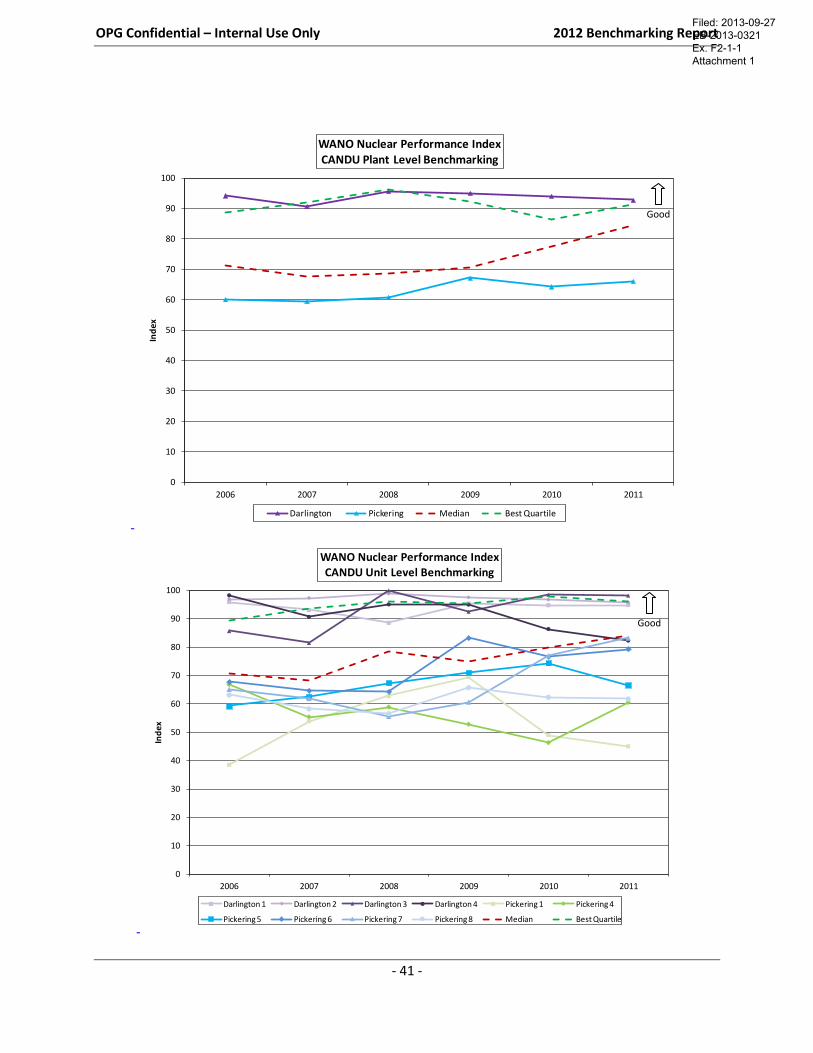
Observations – WANO Nuclear Performance Index (NPI) (CANDU)
2011
The 2011 best quartile of the CANDU plant comparison panel for WANO NPI is 91.4, representing an increase
of 4.7 points above the 2010 best quartile. Since the performance of the top quartile plants has remained
relatively stable, this increase is attributable to a smaller gap in performance between the top quartile and
median.
The median of the CANDU plant comparison panel rose 7.2 points from last year to 84.6 in 2011, indicating
that the performers in the lower quartiles are performing better.
Pickering’s station performance remained below median in 2011.
Darlington continued to demonstrate strong performance, maintaining best quartile in 2011.
Trend
The best quartile of the CANDU plant comparison panel, which had shown an upward trend from 2006 to 2008,
declined in 2009 and 2010. This trend reversed in 2011 with the best quartile threshold rising back to above
90%.
The median value of the CANDU plant comparison panel has continued to rise from 2007 to 2011, indicating
that the stations in the lower quartiles are performing better.
Pickering has performed below median over the review period.
Pickering showed improvement from 2007 to 2009, but this trend was reversed in 2010. More recently,
stronger performance has resulted in improved results for 2011.
As the strongest OPG performer, Darlington achieved best quartile performance over most of the review period.
Factors Contributing to Performance
The WANO NPI is a composite index reflecting the weighted sum of the scores of 10 separate performance
measures. A maximum score of 100 is possible. All of the sub-indicators in this index are reviewed separately
in this benchmarking report.
Pickering
For 2011, Pickering achieved maximum scores for 5 out of 10 NPI sub-indicators.
For each of the key safety system related metrics, High Pressure Injection, Auxiliary Feedwater, and
Emergency Alternating Current (AC) power, the station received 10 of 10 points.
Pickering also achieved perfect scores for Industrial Safety Accident Rate (5 of 5) and Fuel Reliability Index
(10 of 10).
Pickering earned 8.2 of 10 points for Reactor Trip Rate.
Pickering achieved 2.9 of 5 points for Chemistry Performance and 4.9 of 10 points for Collective Radiation
Exposure.
Due to challenges with forced outages and forced extensions to planned outages, Pickering received 0.3 of 15
points for Unit Capability Factor and 4.9 of 15 points for Forced Loss Rate.
Pickering’s WANO NPI performance was impacted by the execution of a station Vacuum Building Outage in
2010 and longer planned outage durations needed to extend the life of the station in order to ensure a reliable
supply of electricity during the refurbishment of the Darlington plant.
Filed: 2013-09-27 EB-2013-0321 Ex. F2-1-1 Attachment 1
OPG Confidential – Internal Use Only 2012 Benchmarking Report
- 43 -
Please refer to Table 12 of the Appendix for an NPI plant level performance summary of OPG
stations against the North American panel.
Factors Contributing to Performance (Cont’d)
Darlington
For 2011, Darlington achieved maximum scores for 6 out of 10 NPI sub-indicators.
For each of the key safety system related metrics, High Pressure Injection, Auxiliary
Feedwater, and Emergency Alternating Current (AC) power, Darlington received 10 of
10 points.
Darlington also achieved perfect scores for Reactor Trip Rate (10 of 10), Collective
Radiation Exposure (10 of 10) and Industrial Safety Accident Rate (5 of 5).
Darlington earned 8.3 of 10 points for Fuel Reliability Index and 4.3 of 5 points for
Chemistry Performance.
Darlington achieved 12.0 out of 15 points for Unit Capability Factor, 13.2 out of 15
points for Forced Loss Rate due to the forced outages and forced extensions to planned
outages. Darlington also continues to carry lower Unit Capability Factors in its rolling
average from the execution of the station Vacuum Building Outage in 2009.
Filed: 2013-09-27 EB-2013-0321 Ex. F2-1-1 Attachment 1
OPG Confidential – Internal Use Only 2012 Benchmarking Report
- 44 -
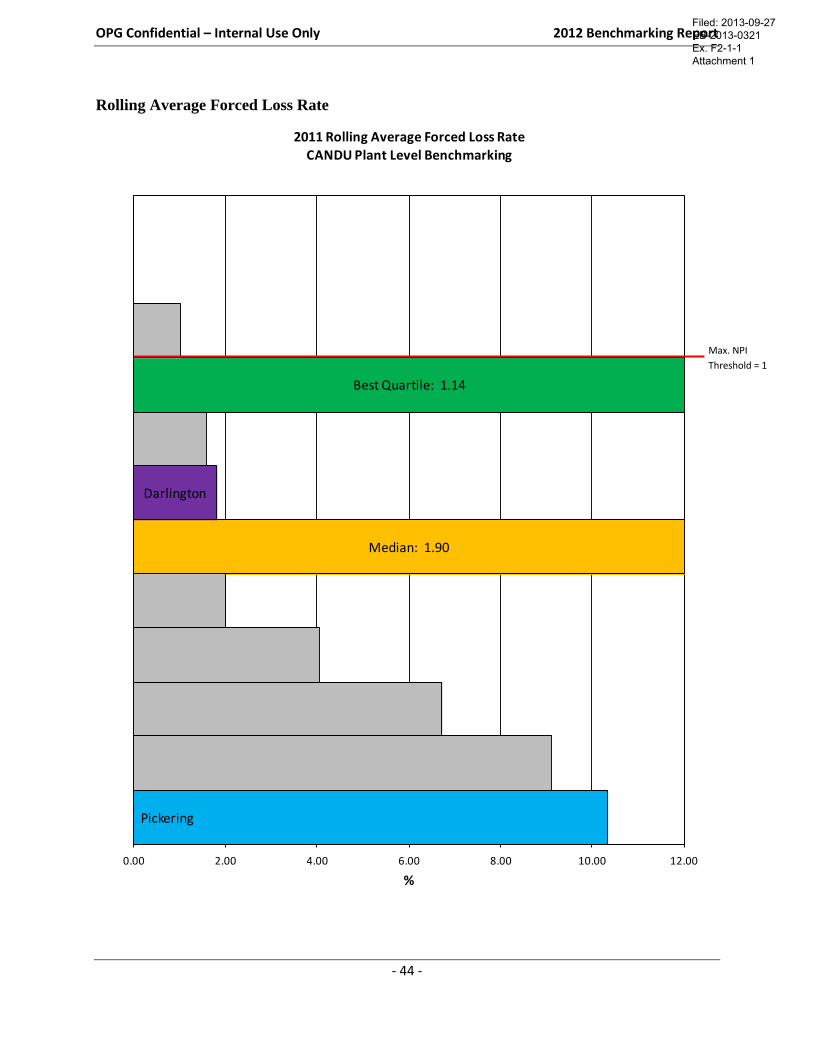
Rolling Average Forced Loss Rate
Pickering
Median: 1.90
Darlington
Best Quartile: 1.14
0.00 2.00 4.00 6.00 8.00 10.00 12.00
%
2011 Rolling Average Forced Loss RateCANDU Plant Level Benchmarking
Max. NPI
Threshold = 1
Filed: 2013-09-27 EB-2013-0321 Ex. F2-1-1 Attachment 1
OPG Confidential – Internal Use Only 2012 Benchmarking Report
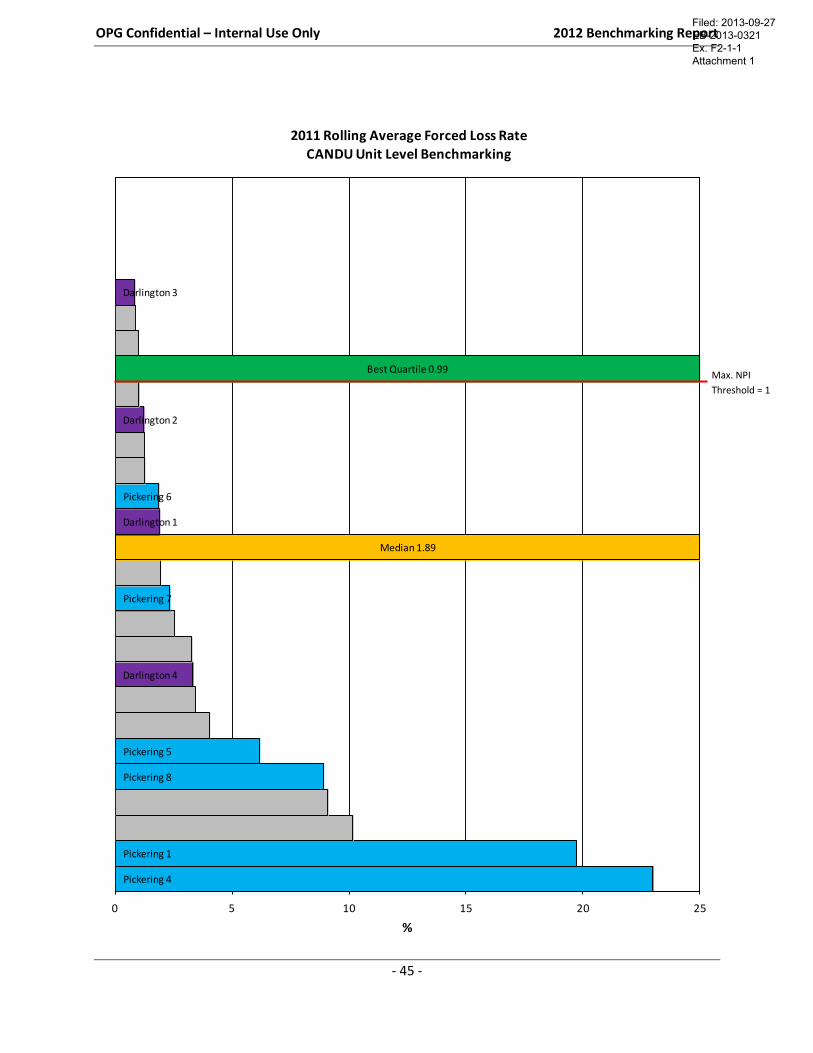
- 45 -
Pickering 4
Pickering 1
Pickering 8
Pickering 5
Darlington 4
Pickering 7
Median 1.89
Darlington 1
Pickering 6
Darlington 2
Best Quartile 0.99
Darlington 3
0 5 10 15 20 25
%
2011 Rolling Average Forced Loss RateCANDU Unit Level Benchmarking
Max. NPI
Threshold = 1
Filed: 2013-09-27 EB-2013-0321 Ex. F2-1-1 Attachment 1
OPG Confidential – Internal Use Only 2012 Benchmarking Report
- 46 -
0
5
10
15
20
25
30
2006 2007 2008 2009 2010 2011
%
Rolling Average Forced Loss RateCANDU Plant Level Benchmarking
DN PN Median Best Quartile Max. NPI
0
5
10
15
20
25
30
35
40
45
50
2006 2007 2008 2009 2010 2011
%
Rolling Average Forced Loss RateCANDU Unit Level Benchmarking
Darlington 1 Darlington 2 Darlington 3 Darlington 4 Pickering 1
Pickering 4 Pickering 5 Pickering 6 Pickering 7 Pickering 8
Median Best Quartile Max. NPI
Good
Good
Filed: 2013-09-27 EB-2013-0321 Ex. F2-1-1 Attachment 1

OPG Confidential – Internal Use Only 2012 Benchmarking Report
- 47 -
Observations – Rolling Average Forced Loss Rate (CANDU)
2011 (Rolling Average)
Forced loss rate (FLR) best quartile performance for the CANDU panel was 1.14% at the plant level and
0.99% at the unit level. This represents a decrease of 0.04% at the plant level and 0.22% at the unit level
over the rolling average FLR values reported for 2010.
As a station, Darlington maintained its relative ranking in the CANDU panel by performing better than
median but worse than best quartile.
Darlington had one unit in the best quartile, two units better than median, and one unit below the median
FLR threshold.
The Darlington gap to best quartile was 0.66% against the CANDU panel in 2011.
Pickering performance was worse than median at both the plant and unit level, with the exception of
Unit 6, which performed better than median.
The Pickering gap to best quartile was 9.2% against the CANDU panel in 2011.
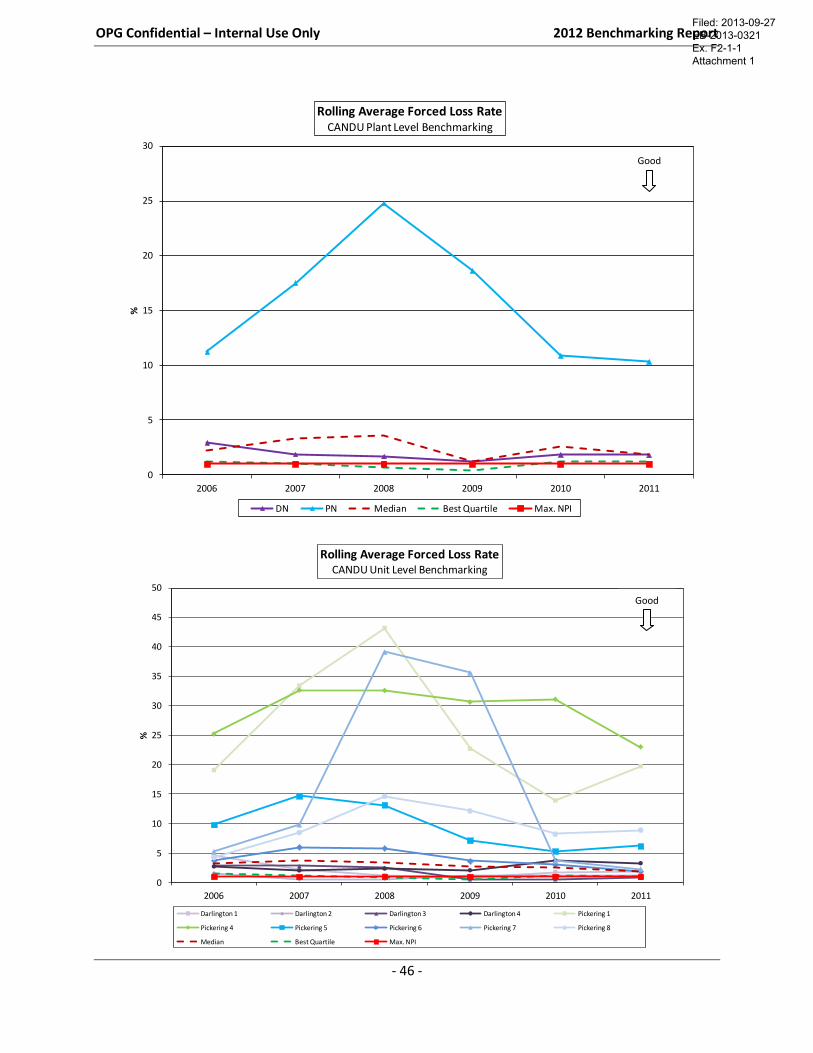
Trend
The industry best quartile and median improved slightly, during the review period, at both the unit and
plant level.
Darlington’s overall performance improved from just worse than median performance at the start of the
review period (2006) to between median and top quartile performance for the most recent time period
(2011).
Pickering station performance remains worse than median, but has improved from a high of 24.76% in
2008 to 10.34% in 2011.
Factors Contributing to Performance
Top performing plants achieve low forced loss rates through effective implementation and integration of
equipment reliability and human performance programs aligned with industry best practices.
OPG Nuclear has established a structured cross-functional equipment reliability program based on top
industry standards and supported by virtually every department in the organization. The implementation
of the program involves focusing the workforce and processes on critical equipment across the fleet.
OPG is currently working on reducing maintenance backlogs, optimizing the preventive maintenance
program and obtaining spare parts for critical equipment.
Darlington has established a fuel handling reliability project and developed new fuel bundles to prevent
unit derating.
Pickering has established short mid-cycle outages to complete critical maintenance activities to improve
the reliability of the plant.
Filed: 2013-09-27 EB-2013-0321 Ex. F2-1-1 Attachment 1
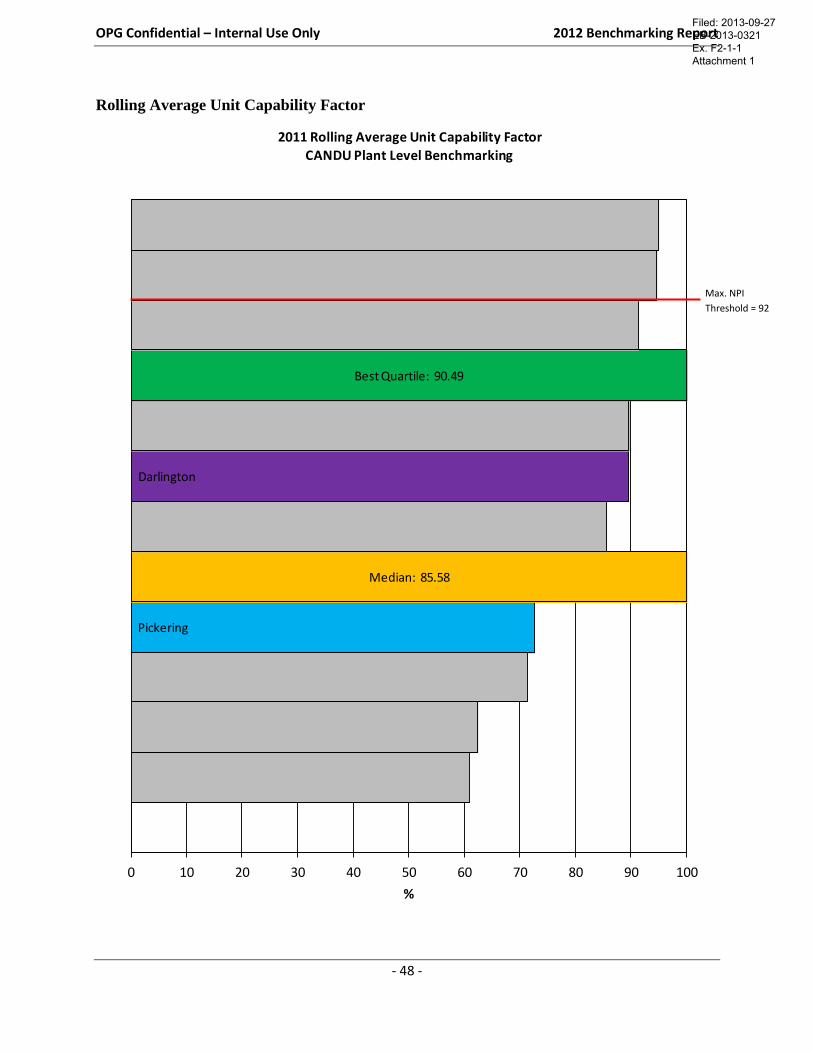
OPG Confidential – Internal Use Only 2012 Benchmarking Report
- 48 -
Rolling Average Unit Capability Factor
Pickering
Median: 85.58
Darlington
Best Quartile: 90.49
0 10 20 30 40 50 60 70 80 90 100
%
2011 Rolling Average Unit Capability FactorCANDU Plant Level Benchmarking
Max. NPI
Threshold = 92
Filed: 2013-09-27 EB-2013-0321 Ex. F2-1-1 Attachment 1
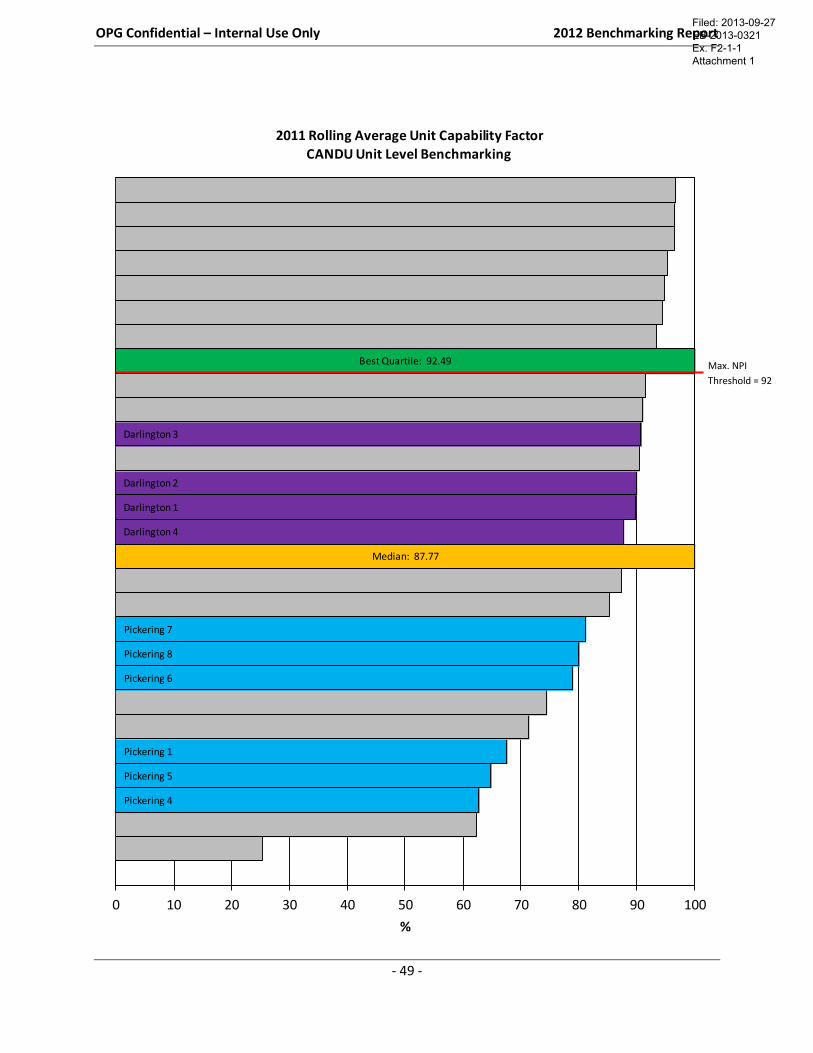
OPG Confidential – Internal Use Only 2012 Benchmarking Report
- 49 -
Pickering 4
Pickering 5
Pickering 1
Pickering 6
Pickering 8
Pickering 7
Median: 87.77
Darlington 4
Darlington 1
Darlington 2
Darlington 3
Best Quartile: 92.49
0 10 20 30 40 50 60 70 80 90 100
%
2011 Rolling Average Unit Capability FactorCANDU Unit Level Benchmarking
Max. NPI
Threshold = 92
Filed: 2013-09-27 EB-2013-0321 Ex. F2-1-1 Attachment 1
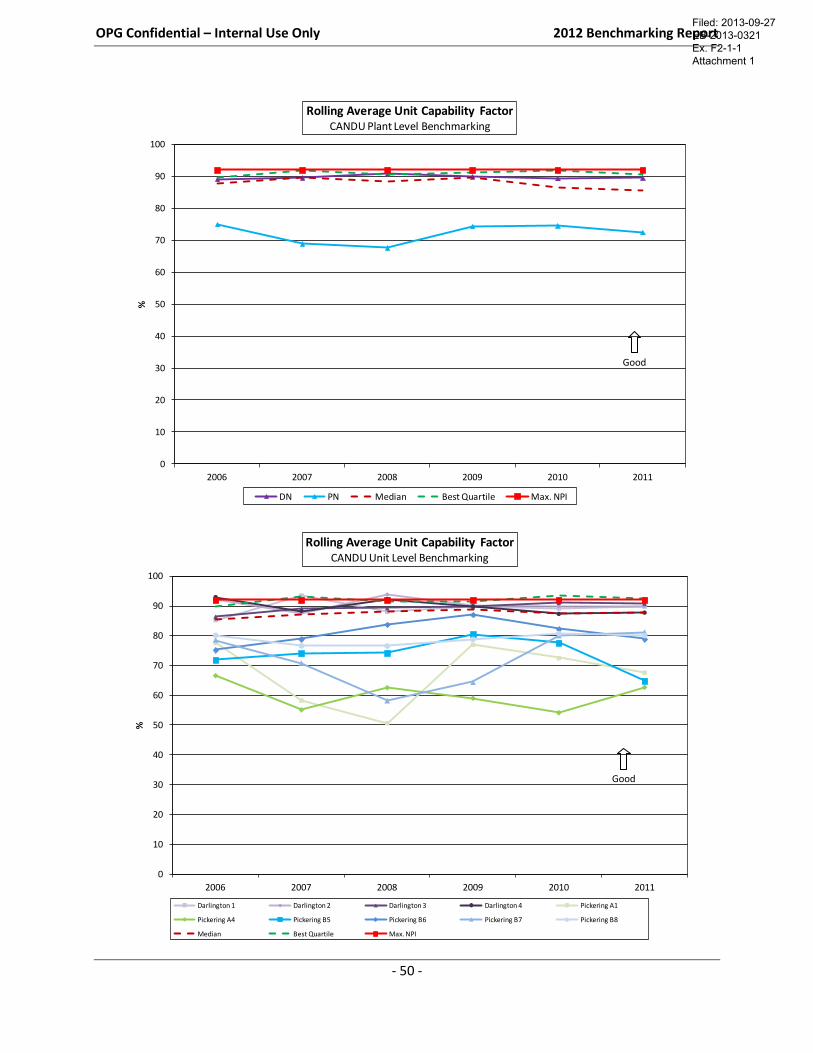
OPG Confidential – Internal Use Only 2012 Benchmarking Report
- 50 -
0
10
20
30
40
50
60
70
80
90
100
2006 2007 2008 2009 2010 2011
%
Rolling Average Unit Capability FactorCANDU Plant Level Benchmarking
DN PN Median Best Quartile Max. NPI
0
10
20
30
40
50
60
70
80
90
100
2006 2007 2008 2009 2010 2011
%
Rolling Average Unit Capability FactorCANDU Unit Level Benchmarking
Darlington 1 Darlington 2 Darlington 3 Darlington 4 Pickering A1
Pickering A4 Pickering B5 Pickering B6 Pickering B7 Pickering B8
Median Best Quartile Max. NPI
Good
Good
Filed: 2013-09-27 EB-2013-0321 Ex. F2-1-1 Attachment 1
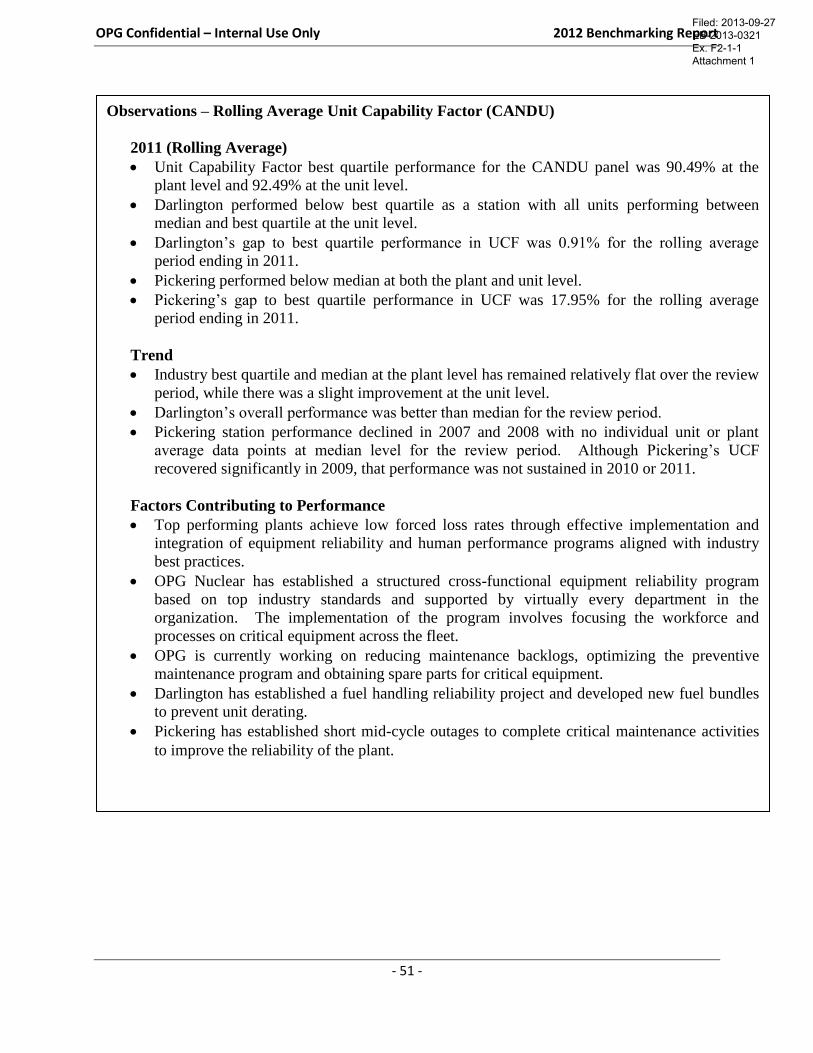
OPG Confidential – Internal Use Only 2012 Benchmarking Report
- 51 -
Observations – Rolling Average Unit Capability Factor (CANDU)
2011 (Rolling Average)
Unit Capability Factor best quartile performance for the CANDU panel was 90.49% at the
plant level and 92.49% at the unit level.
Darlington performed below best quartile as a station with all units performing between
median and best quartile at the unit level.
Darlington’s gap to best quartile performance in UCF was 0.91% for the rolling average
period ending in 2011.
Pickering performed below median at both the plant and unit level.
Pickering’s gap to best quartile performance in UCF was 17.95% for the rolling average
period ending in 2011.
Trend
Industry best quartile and median at the plant level has remained relatively flat over the review
period, while there was a slight improvement at the unit level.
Darlington’s overall performance was better than median for the review period.
Pickering station performance declined in 2007 and 2008 with no individual unit or plant
average data points at median level for the review period. Although Pickering’s UCF
recovered significantly in 2009, that performance was not sustained in 2010 or 2011.
Factors Contributing to Performance
Top performing plants achieve low forced loss rates through effective implementation and
integration of equipment reliability and human performance programs aligned with industry
best practices.
OPG Nuclear has established a structured cross-functional equipment reliability program
based on top industry standards and supported by virtually every department in the
organization. The implementation of the program involves focusing the workforce and
processes on critical equipment across the fleet.
OPG is currently working on reducing maintenance backlogs, optimizing the preventive
maintenance program and obtaining spare parts for critical equipment.
Darlington has established a fuel handling reliability project and developed new fuel bundles
to prevent unit derating.
Pickering has established short mid-cycle outages to complete critical maintenance activities
to improve the reliability of the plant.
Filed: 2013-09-27 EB-2013-0321 Ex. F2-1-1 Attachment 1

OPG Confidential – Internal Use Only 2012 Benchmarking Report
- 52 -
Rolling Average Chemistry Performance Indicator (CPI)
Pickering
Darlington
Median: 1.01
Best Quartile: 1.00
0.00 0.50 1.00 1.50 2.00 2.50 3.00
Indicator
2011 Rolling Average Chemistry Performance IndicatorCANDU Plant Level Benchmarking
Max. NPI
Threshold = 1.01
Filed: 2013-09-27 EB-2013-0321 Ex. F2-1-1 Attachment 1
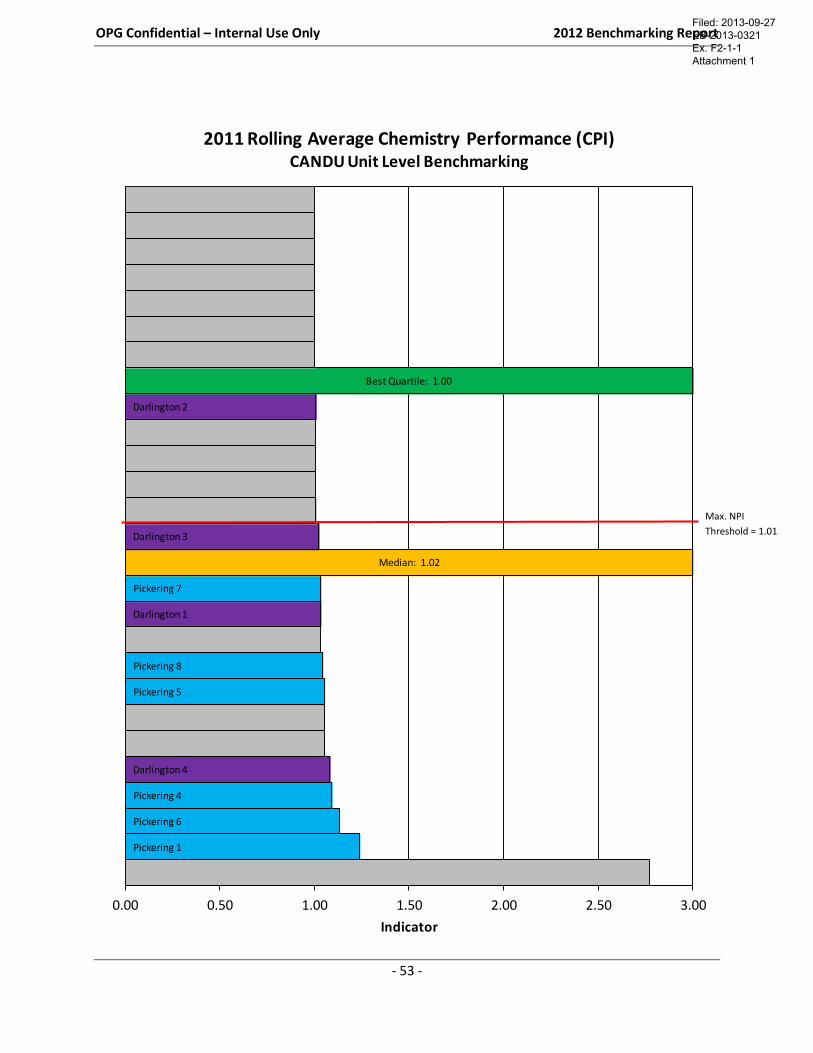
OPG Confidential – Internal Use Only 2012 Benchmarking Report
- 53 -
Pickering 1
Pickering 6
Pickering 4
Darlington 4
Pickering 5
Pickering 8
Darlington 1
Pickering 7
Median: 1.02
Darlington 3
Darlington 2
Best Quartile: 1.00
0.00 0.50 1.00 1.50 2.00 2.50 3.00
Indicator
2011 Rolling Average Chemistry Performance (CPI)CANDU Unit Level Benchmarking
Max. NPI
Threshold = 1.01
Filed: 2013-09-27 EB-2013-0321 Ex. F2-1-1 Attachment 1
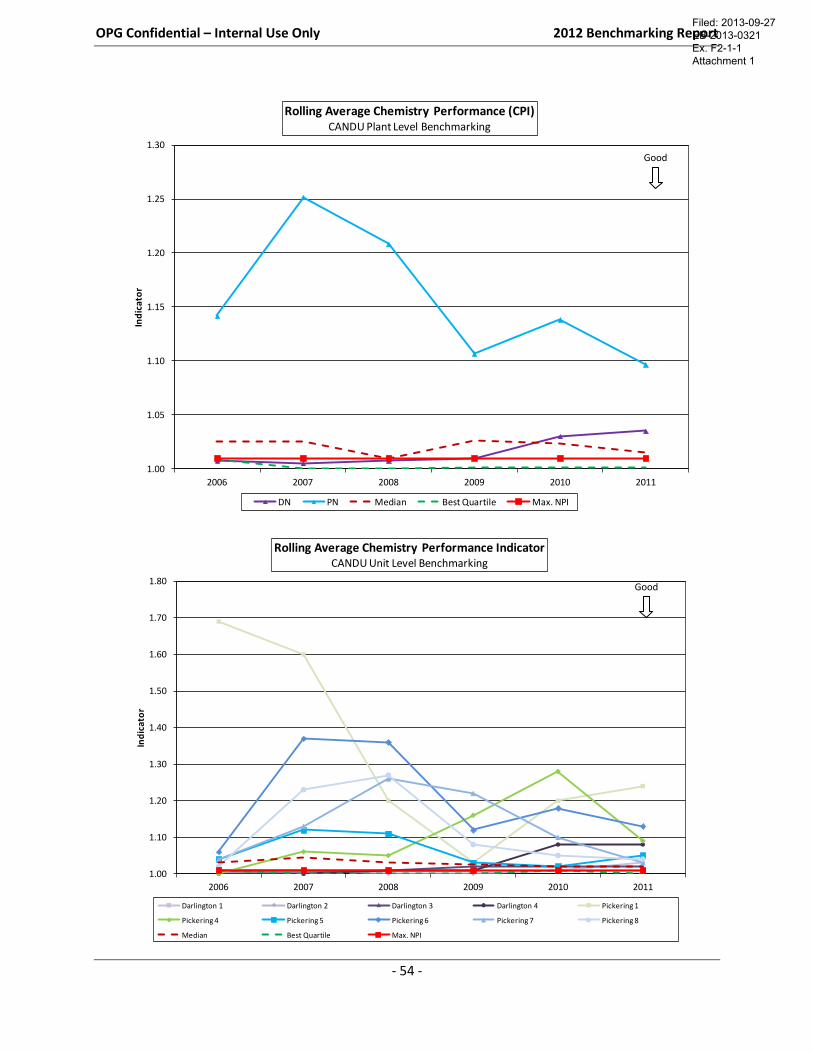
OPG Confidential – Internal Use Only 2012 Benchmarking Report
- 54 -
1.00
1.05
1.10
1.15
1.20
1.25
1.30
2006 2007 2008 2009 2010 2011
Ind
ica
tor
Rolling Average Chemistry Performance (CPI)CANDU Plant Level Benchmarking
DN PN Median Best Quartile Max. NPI
1.00
1.10
1.20
1.30
1.40
1.50
1.60
1.70
1.80
2006 2007 2008 2009 2010 2011
Ind
icat
or
Rolling Average Chemistry Performance IndicatorCANDU Unit Level Benchmarking
Darlington 1 Darlington 2 Darlington 3 Darlington 4 Pickering 1
Pickering 4 Pickering 5 Pickering 6 Pickering 7 Pickering 8
Median Best Quartile Max. NPI
Good
Good
Filed: 2013-09-27 EB-2013-0321 Ex. F2-1-1 Attachment 1
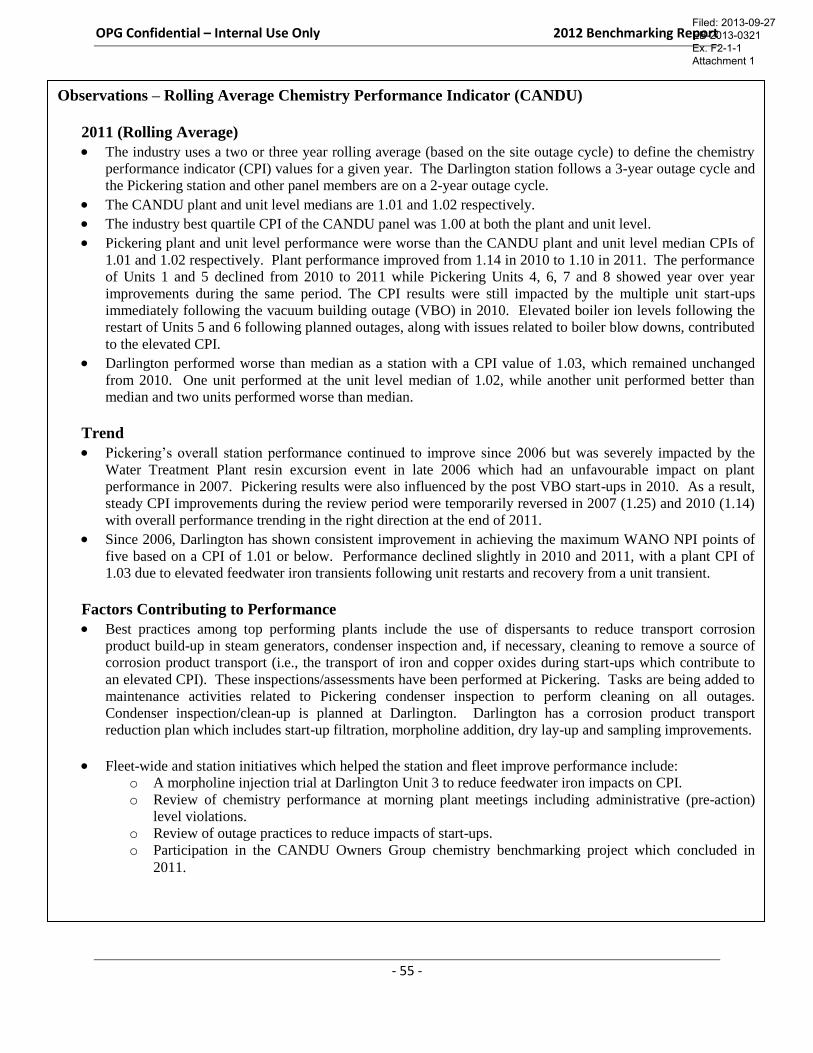
OPG Confidential – Internal Use Only 2012 Benchmarking Report
- 55 -
Observations – Rolling Average Chemistry Performance Indicator (CANDU)
2011 (Rolling Average)
The industry uses a two or three year rolling average (based on the site outage cycle) to define the chemistry
performance indicator (CPI) values for a given year. The Darlington station follows a 3-year outage cycle and
the Pickering station and other panel members are on a 2-year outage cycle.
The CANDU plant and unit level medians are 1.01 and 1.02 respectively.
The industry best quartile CPI of the CANDU panel was 1.00 at both the plant and unit level.
Pickering plant and unit level performance were worse than the CANDU plant and unit level median CPIs of
1.01 and 1.02 respectively. Plant performance improved from 1.14 in 2010 to 1.10 in 2011. The performance
of Units 1 and 5 declined from 2010 to 2011 while Pickering Units 4, 6, 7 and 8 showed year over year
improvements during the same period. The CPI results were still impacted by the multiple unit start-ups
immediately following the vacuum building outage (VBO) in 2010. Elevated boiler ion levels following the
restart of Units 5 and 6 following planned outages, along with issues related to boiler blow downs, contributed
to the elevated CPI.
Darlington performed worse than median as a station with a CPI value of 1.03, which remained unchanged
from 2010. One unit performed at the unit level median of 1.02, while another unit performed better than
median and two units performed worse than median.
Trend
Pickering’s overall station performance continued to improve since 2006 but was severely impacted by the
Water Treatment Plant resin excursion event in late 2006 which had an unfavourable impact on plant
performance in 2007. Pickering results were also influenced by the post VBO start-ups in 2010. As a result,
steady CPI improvements during the review period were temporarily reversed in 2007 (1.25) and 2010 (1.14)
with overall performance trending in the right direction at the end of 2011.
Since 2006, Darlington has shown consistent improvement in achieving the maximum WANO NPI points of
five based on a CPI of 1.01 or below. Performance declined slightly in 2010 and 2011, with a plant CPI of
1.03 due to elevated feedwater iron transients following unit restarts and recovery from a unit transient.
Factors Contributing to Performance
Best practices among top performing plants include the use of dispersants to reduce transport corrosion
product build-up in steam generators, condenser inspection and, if necessary, cleaning to remove a source of
corrosion product transport (i.e., the transport of iron and copper oxides during start-ups which contribute to
an elevated CPI). These inspections/assessments have been performed at Pickering. Tasks are being added to
maintenance activities related to Pickering condenser inspection to perform cleaning on all outages.
Condenser inspection/clean-up is planned at Darlington. Darlington has a corrosion product transport
reduction plan which includes start-up filtration, morpholine addition, dry lay-up and sampling improvements.
Fleet-wide and station initiatives which helped the station and fleet improve performance include:
o A morpholine injection trial at Darlington Unit 3 to reduce feedwater iron impacts on CPI.
o Review of chemistry performance at morning plant meetings including administrative (pre-action)
level violations.
o Review of outage practices to reduce impacts of start-ups.
o Participation in the CANDU Owners Group chemistry benchmarking project which concluded in
2011.
Filed: 2013-09-27 EB-2013-0321 Ex. F2-1-1 Attachment 1
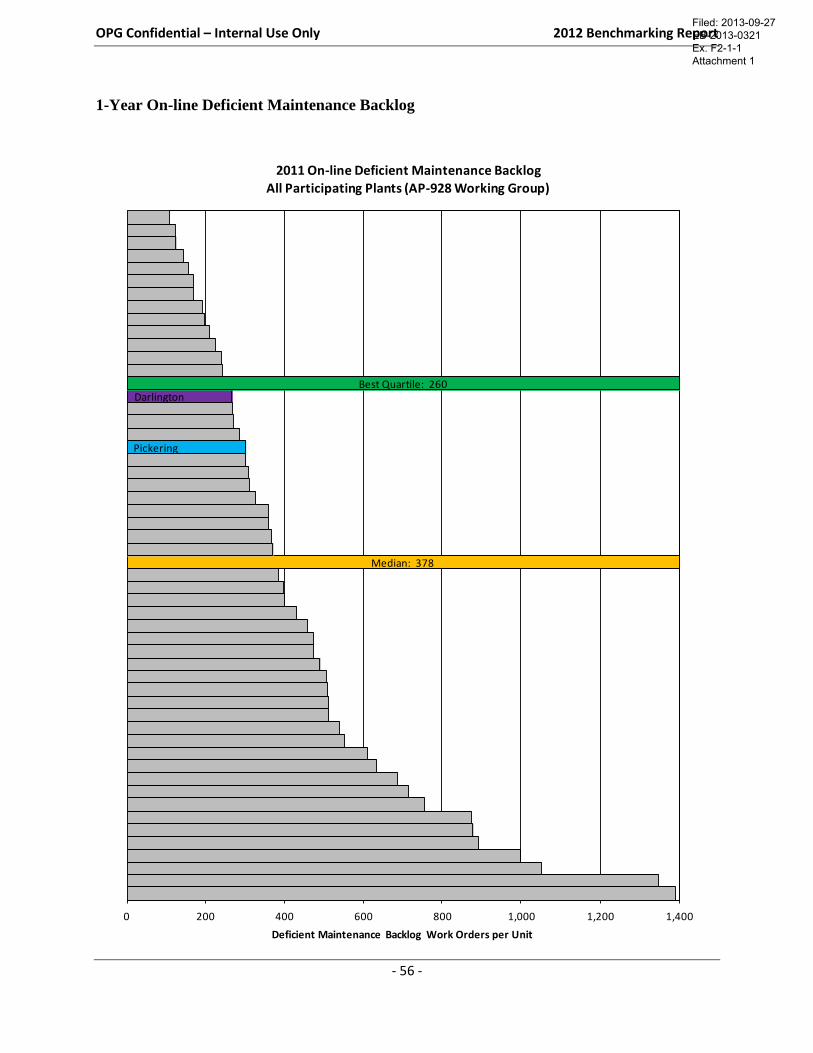
OPG Confidential – Internal Use Only 2012 Benchmarking Report
- 56 -
1-Year On-line Deficient Maintenance Backlog
Median: 378
Pickering
DarlingtonBest Quartile: 260
0 200 400 600 800 1,000 1,200 1,400
Deficient Maintenance Backlog Work Orders per Unit
2011 On-line Deficient Maintenance BacklogAll Participating Plants (AP-928 Working Group)
Filed: 2013-09-27 EB-2013-0321 Ex. F2-1-1 Attachment 1

OPG Confidential – Internal Use Only 2012 Benchmarking Report
- 57 -
Observations – On-line Deficient Maintenance Backlog
2011
The data in this panel is gathered by an independent industry peer group, the INPO AP-928
group. The last backlog benchmark was as of September 30, 2011 and this analysis utilizes that
data.
Industry backlog benchmark standards changed with Revision 3 of AP-928 Work Management
Practices at INPO in June 2010. All OPG sites converted to the new standard on January 24,
2011. This review reflects the new standard.
Using the new standard, the industry best quartile and median thresholds were 260 and 378
respectively for the panel.
Both Pickering and Darlington stations are currently performing better than median.
Trend
As described in the previous section, the INPO set a new standard for classifying work order
backlogs with the issuance of AP-928 Work Management Process Description, revision 3, in
June 2010. The new standard created an alignment between engineering criticality coding and
backlog classification that allows improved focus on the more critical outstanding work. The
new standard also sets a more consistent foundation for classification of backlogs such that
comparisons between utilities will be more meaningful. Due to this recent development, a
historical performance trend analysis may not be provided at this time.
Factors Contributing to Performance
Key performance drivers for deficient and corrective backlog include:
o Aging equipment and associated reliability
o Getting work ready in a timely fashion and parts availability
Pickering
Pickering is currently at 301 work orders per unit. A reduction of approximately 14% is required
to achieve industry top quartile.
A recovery plan is in place to reduce backlog levels to align with industry best quartile.
Darlington
Darlington sits closest to best quartile at 266 work orders per unit. A 2% reduction in backlogs is
required to bridge the gap to industry best quartile.
With the introduction of the new AP-928 backlog classification, the work control group at
Darlington has implemented a number of initiatives to prioritize and schedule the outstanding
work.
Filed: 2013-09-27 EB-2013-0321 Ex. F2-1-1 Attachment 1
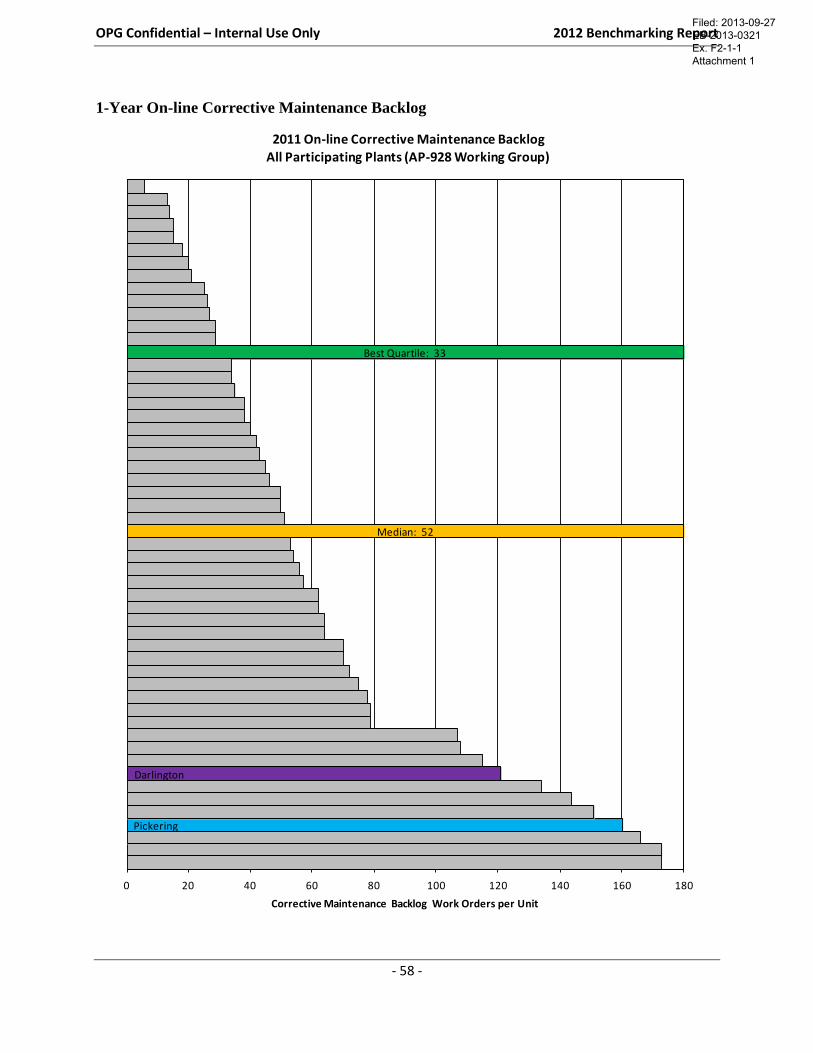
OPG Confidential – Internal Use Only 2012 Benchmarking Report
- 58 -
1-Year On-line Corrective Maintenance Backlog
Pickering
Darlington
Median: 52
Best Quartile: 33
0 20 40 60 80 100 120 140 160 180
Corrective Maintenance Backlog Work Orders per Unit
2011 On-line Corrective Maintenance BacklogAll Participating Plants (AP-928 Working Group)
Filed: 2013-09-27 EB-2013-0321 Ex. F2-1-1 Attachment 1
OPG Confidential – Internal Use Only 2012 Benchmarking Report
- 59 -
Observations – On-line Corrective Maintenance Backlog
2011
The data in this panel is gathered by an independent industry peer group, the INPO AP-928 group. The last
backlog benchmark was as of September 30, 2011 and this analysis utilizes that data.
Industry backlog benchmark standards changed with revision 3 of AP-928 Work Management Practices at
INPO in June 2010. All OPG sites converted to the new standard on January 24, 2011. This review
reflects the new standard.
Using the new standard, the industry best quartile and median thresholds were 33 and 52 respectively for
the panel.
Both Pickering and Darlington stations are currently performing below the median.
Trend
As described in the previous section, the INPO set a new standard for classifying work order backlogs with
the issuance of AP-928 Work Management Process Description, revision 3, in June 2010. The new
standard created an alignment between engineering criticality coding and backlog classification that allows
improved focus on the more critical outstanding work. The new standard also sets a more consistent
foundation for classification of backlogs such that comparisons between utilities will be more meaningful.
Due to this recent development, a historical performance trend analysis may not be provided at this time.
Factors Contributing to Performance
Key performance drivers for both corrective and deficient backlog include:
o Aging equipment and associated reliability
o Getting work ready in a timely fashion and parts availability
Pickering
Pickering is currently at 160 work order per unit. A reduction of approximately 68% is required to attain
median performance using the new benchmark standard.
Pickering has implemented a number of initiatives to improve performance, including:
o Using an on-line holds resolution team to support on-line schedule and holds removal
o Having the Work Control Peer Team create a process for risk review of the oldest work orders to
validate consequences
Darlington
A reduction of approximately 57% is required to attain median performance using the new benchmark
standard.
To improve station performance, the Darlington Work Control department has implemented a number of
initiatives to prioritize and schedule the outstanding work.
Filed: 2013-09-27 EB-2013-0321 Ex. F2-1-1 Attachment 1
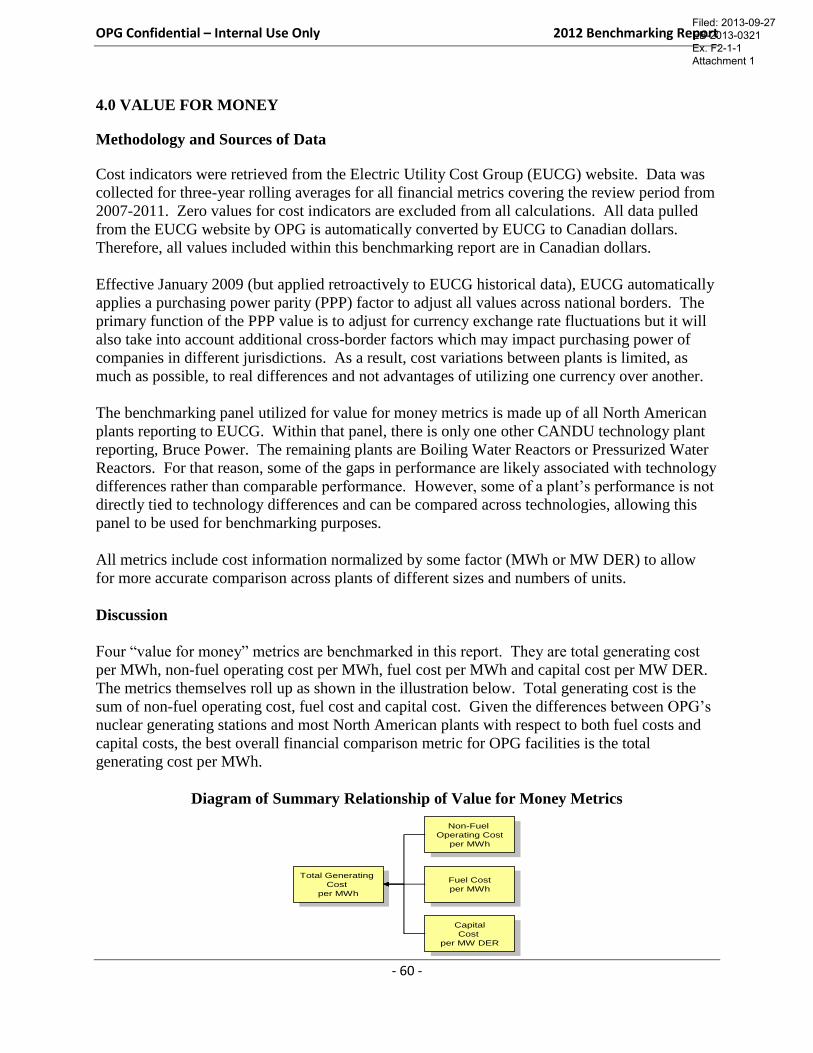
OPG Confidential – Internal Use Only 2012 Benchmarking Report
- 60 -
4.0 VALUE FOR MONEY
Methodology and Sources of Data
Cost indicators were retrieved from the Electric Utility Cost Group (EUCG) website. Data was
collected for three-year rolling averages for all financial metrics covering the review period from
2007-2011. Zero values for cost indicators are excluded from all calculations. All data pulled
from the EUCG website by OPG is automatically converted by EUCG to Canadian dollars.
Therefore, all values included within this benchmarking report are in Canadian dollars.
Effective January 2009 (but applied retroactively to EUCG historical data), EUCG automatically
applies a purchasing power parity (PPP) factor to adjust all values across national borders. The
primary function of the PPP value is to adjust for currency exchange rate fluctuations but it will
also take into account additional cross-border factors which may impact purchasing power of
companies in different jurisdictions. As a result, cost variations between plants is limited, as
much as possible, to real differences and not advantages of utilizing one currency over another.
The benchmarking panel utilized for value for money metrics is made up of all North American
plants reporting to EUCG. Within that panel, there is only one other CANDU technology plant
reporting, Bruce Power. The remaining plants are Boiling Water Reactors or Pressurized Water
Reactors. For that reason, some of the gaps in performance are likely associated with technology
differences rather than comparable performance. However, some of a plant’s performance is not
directly tied to technology differences and can be compared across technologies, allowing this
panel to be used for benchmarking purposes.
All metrics include cost information normalized by some factor (MWh or MW DER) to allow
for more accurate comparison across plants of different sizes and numbers of units.
Discussion
Four “value for money” metrics are benchmarked in this report. They are total generating cost
per MWh, non-fuel operating cost per MWh, fuel cost per MWh and capital cost per MW DER.
The metrics themselves roll up as shown in the illustration below. Total generating cost is the
sum of non-fuel operating cost, fuel cost and capital cost. Given the differences between OPG’s
nuclear generating stations and most North American plants with respect to both fuel costs and
capital costs, the best overall financial comparison metric for OPG facilities is the total
generating cost per MWh.
Diagram of Summary Relationship of Value for Money Metrics
Total Generating
Cost
per MWh
Total Generating
Cost
per MWh
Non-Fuel
Operating Cost
per MWh
Non-Fuel
Operating Cost
per MWh
Fuel Cost
per MWh
Fuel Cost
per MWh
Capital
Cost
per MW DER
Capital
Cost
per MW DER
Filed: 2013-09-27 EB-2013-0321 Ex. F2-1-1 Attachment 1
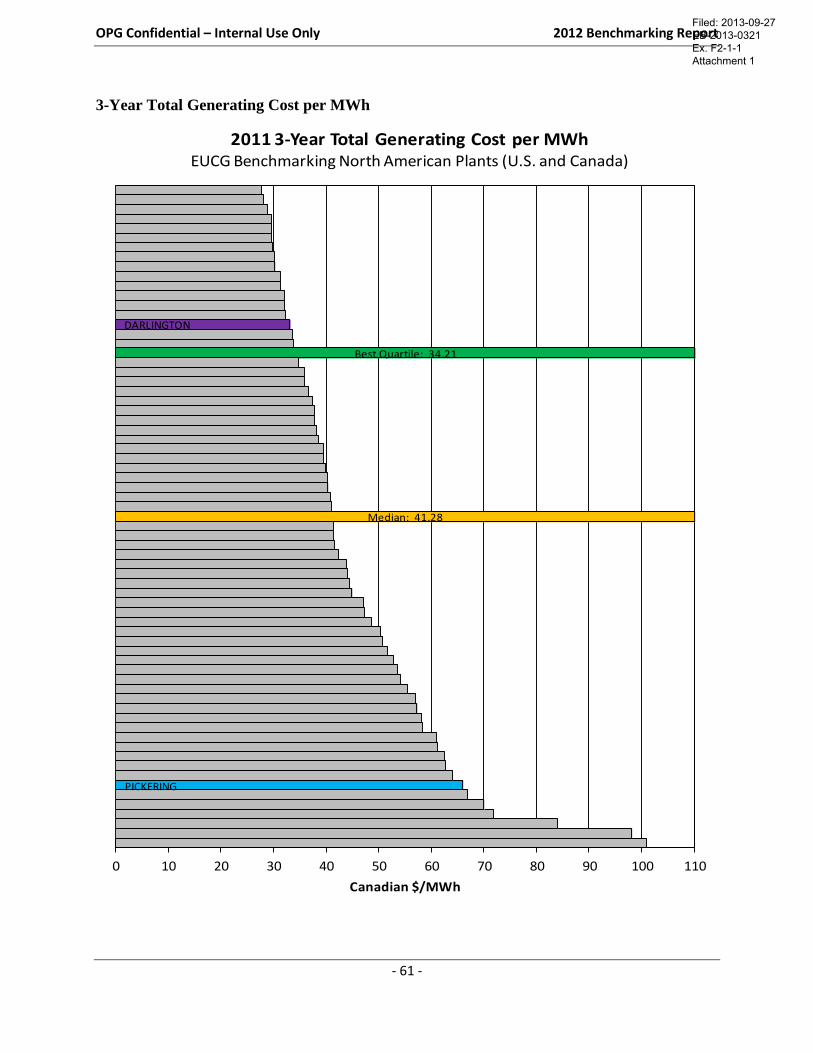
OPG Confidential – Internal Use Only 2012 Benchmarking Report
- 61 -
3-Year Total Generating Cost per MWh
PICKERING
Median: 41.28
Best Quartile: 34.21
DARLINGTON
0 10 20 30 40 50 60 70 80 90 100 110
Canadian $/MWh
2011 3-Year Total Generating Cost per MWhEUCG Benchmarking North American Plants (U.S. and Canada)
Filed: 2013-09-27 EB-2013-0321 Ex. F2-1-1 Attachment 1
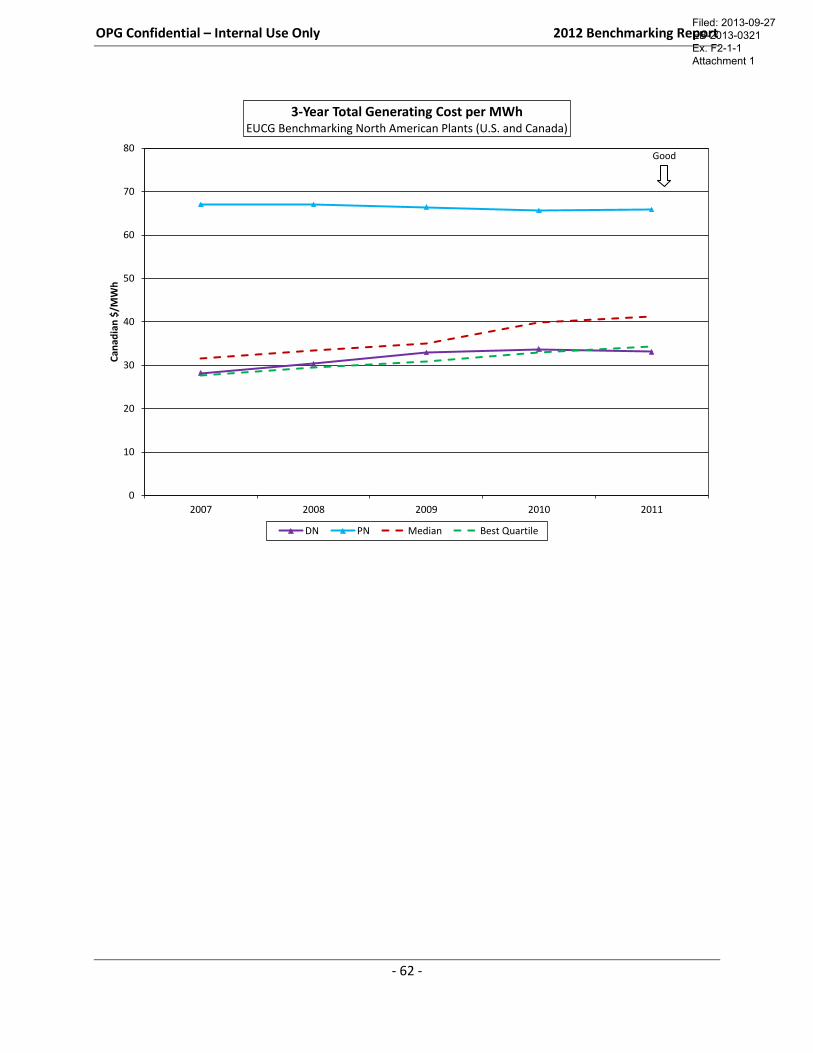
OPG Confidential – Internal Use Only 2012 Benchmarking Report
- 62 -
0
10
20
30
40
50
60
70
80
2007 2008 2009 2010 2011
Can
adia
n $
/MW
h3-Year Total Generating Cost per MWh
EUCG Benchmarking North American Plants (U.S. and Canada)
DN PN Median Best Quartile
Good
Filed: 2013-09-27 EB-2013-0321 Ex. F2-1-1 Attachment 1
OPG Confidential – Internal Use Only 2012 Benchmarking Report
- 63 -
Observations – 3-Year Total Generating Cost per MWh (All North American Plants)
2011 (3-Year Rolling Average)
The best quartile level for total generating cost per MWh (TGC/MWh) among North American EUCG
participants was $34.21/MWh while the median level was $41.28/MWh.
Darlington was the only CANDU plant in the panel to achieve a total generating cost per MWh in the best
quartile ($33.05/MWh).
Pickering had a TGC/MWh of $65.86/MWh, worse than the median of $41.28/MWh.
Trend
Both best quartile and median total generating costs per MWh have increased over the 2007 to 2011
period. The industry best quartile cost rose by $6.50/MWh while the median cost rose by $9.82/MWh
over the review period.
Darlington’s costs trended upward over the review period with a slight decrease in 2011 over 2010. In
2011, Darlington achieved best quartile performance, an improvement over the review period. The
growth in Darlington’s TGC/MWh was $4.86/MWh during the 2007-2011 period, mostly due to higher
base and outage operating, maintenance & administration costs partly offset by lower corporate
allocations.
Pickering’s costs have consistently trended worse than median but have decreased in 2009 and 2010 with
a slight increase in 2011. Over the 2007-2011 review period, Pickering had a negative escalation rate
(improving cost trend) per year while the industry median quartile experienced a positive (unfavourable)
cost trend per year.
Factors Contributing to Performance
Total generating cost per MWh is the sum of non-fuel operating cost per MWh, fuel cost per MWh and
capital cost per MWh. The benchmark metric is capital cost per MW DER. To include capital cost
impact in total generating cost, station capital costs are divided by net MWh produced – same as for fuel
and non-fuel operating costs.
For technological reasons, fuel cost per MWh is an advantage for all CANDUs and the OPG plants
performed within the best quartile.
Non-fuel operating cost per MWh, for all OPG plants, yielded results that are worse than median for the
most recent data point compared to the North American EUCG panel.
Pickering
Fuel cost per MWh and capital cost per MW DER were within the best quartile for Pickering while non-
fuel operating cost per MWh performance was worse than the industry median.
The overall largest driver of cost per MWh for Pickering during the review period is capability factor.
Station size also negatively impacted cost per MWh for Pickering (primarily driven by relatively small
units).
The remaining large drivers of cost performance at Pickering include CANDU technology, corporate cost
allocations, potential controllable costs and a Vacuum Building Outage during the review period.
Darlington
As stated above, Darlington achieved performance within the industry best quartile in 2011 for fuel cost
per MWh, capital cost per MW DER and total generating cost per MWh though its non-fuel operating
cost performance was worse than median.
The largest drivers of performance gap for Darlington are CANDU technology, corporate allocations and
potential controllable costs.
Due to strong electricity generation performance at Darlington, the capability factor had a positive impact
on its total generating cost per MWh.
Station size provides an overall advantage for Darlington (due to 4 relatively large units).
Filed: 2013-09-27 EB-2013-0321 Ex. F2-1-1 Attachment 1
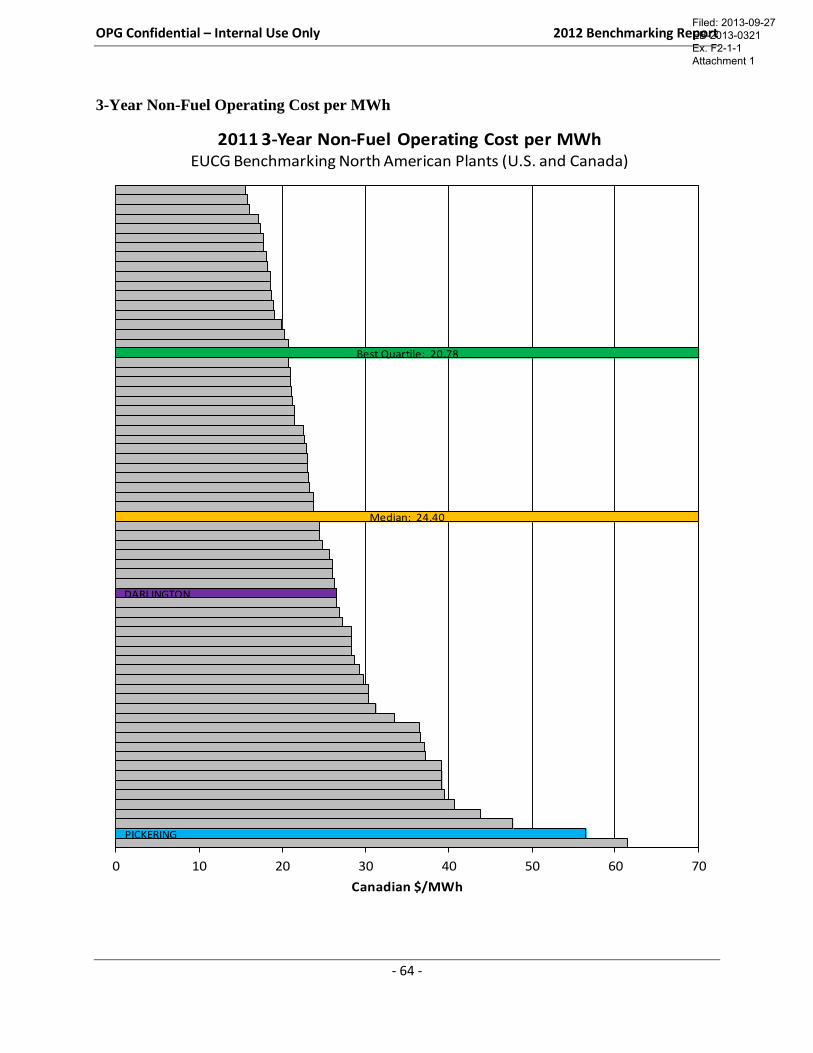
OPG Confidential – Internal Use Only 2012 Benchmarking Report
- 64 -
3-Year Non-Fuel Operating Cost per MWh
PICKERING
DARLINGTON
Median: 24.40
Best Quartile: 20.78
0 10 20 30 40 50 60 70
Canadian $/MWh
2011 3-Year Non-Fuel Operating Cost per MWhEUCG Benchmarking North American Plants (U.S. and Canada)
Filed: 2013-09-27 EB-2013-0321 Ex. F2-1-1 Attachment 1
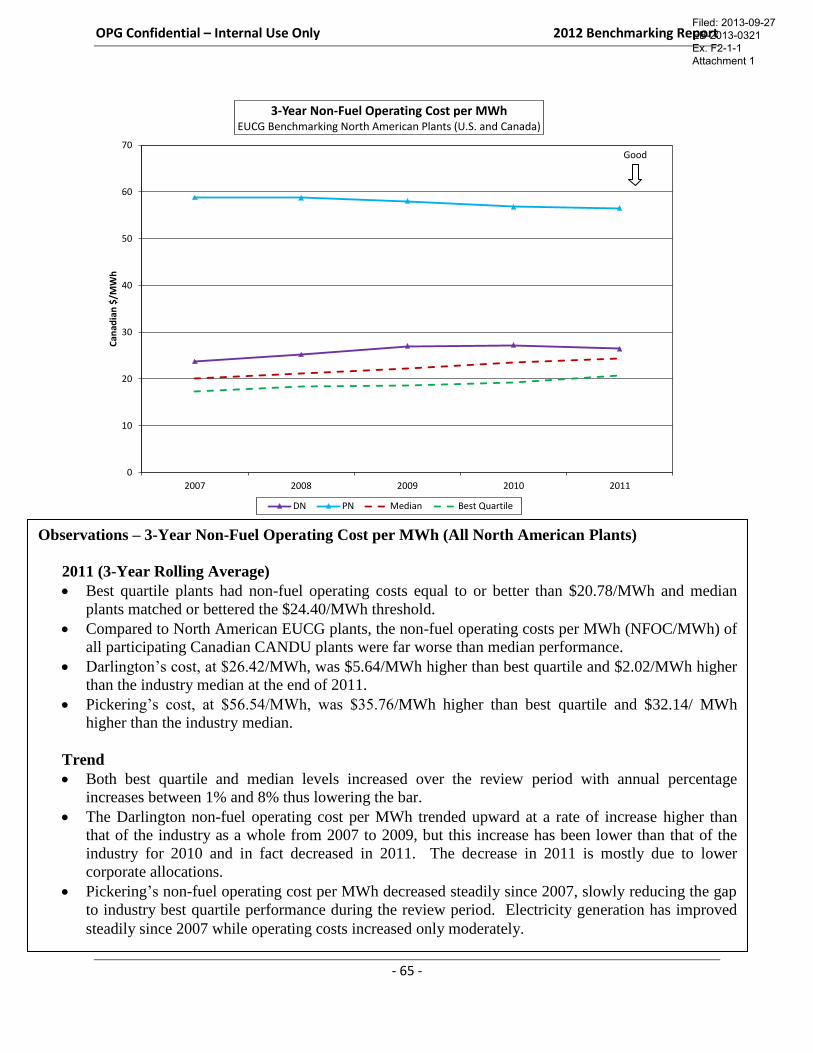
OPG Confidential – Internal Use Only 2012 Benchmarking Report
- 65 -
0
10
20
30
40
50
60
70
2007 2008 2009 2010 2011
Can
adia
n $
/MW
h3-Year Non-Fuel Operating Cost per MWh
EUCG Benchmarking North American Plants (U.S. and Canada)
DN PN Median Best Quartile
Good
Observations – 3-Year Non-Fuel Operating Cost per MWh (All North American Plants)
2011 (3-Year Rolling Average)
Best quartile plants had non-fuel operating costs equal to or better than $20.78/MWh and median
plants matched or bettered the $24.40/MWh threshold.
Compared to North American EUCG plants, the non-fuel operating costs per MWh (NFOC/MWh) of
all participating Canadian CANDU plants were far worse than median performance.
Darlington’s cost, at $26.42/MWh, was $5.64/MWh higher than best quartile and $2.02/MWh higher
than the industry median at the end of 2011.
Pickering’s cost, at $56.54/MWh, was $35.76/MWh higher than best quartile and $32.14/ MWh
higher than the industry median.
Trend
Both best quartile and median levels increased over the review period with annual percentage
increases between 1% and 8% thus lowering the bar.
The Darlington non-fuel operating cost per MWh trended upward at a rate of increase higher than
that of the industry as a whole from 2007 to 2009, but this increase has been lower than that of the
industry for 2010 and in fact decreased in 2011. The decrease in 2011 is mostly due to lower
corporate allocations.
Pickering’s non-fuel operating cost per MWh decreased steadily since 2007, slowly reducing the gap
to industry best quartile performance during the review period. Electricity generation has improved
steadily since 2007 while operating costs increased only moderately.
Filed: 2013-09-27 EB-2013-0321 Ex. F2-1-1 Attachment 1
OPG Confidential – Internal Use Only 2012 Benchmarking Report
- 66 -
Factors Contributing to Performance
Non-fuel operating cost per MWh is a big driver of OPG’s financial performance. Removing
OPG’s advantage from lower fuel costs and capital costs reveals relatively poor financial
performance at all OPG plants with respect to non-fuel operating cost per MWh. Overall, the
biggest performance drivers are: capability factor, station size, CANDU technology, corporate
cost allocations and potential controllable costs, all of which are further explained below:
o The ‘capability factor’ driver is specifically related to the generation performance of the
station in relation to the overall potential of the plant (results are discussed under the
Reliability section of the report for the Rolling Average Unit Capability Factor metric).
o The ‘station size’ driver is the combined effect of number of units and size of units which can
have a significant impact on plant cost performance.
o The ‘CANDU technology’ driver relates specifically to the concept that CANDU technology
results in some specific cost disadvantages related to the overall engineering and maintenance
of the station. In addition, this factor is influenced by the fact that due to the fact that there are
less CANDU plants worldwide, they have less well-developed user groups to share and adopt
operating experience information than do user groups for BWR and PWR plants. OPG
undertook a staffing study through a third-party consultant which concluded that technology,
design and regulatory differences exist between CANDU and PWR reactor units and that such
factors drive staffing differences. The study established that CANDU technology was a
contributor to explaining higher staffing levels for CANDU versus PWR plants which also
contributes to OPG’s performance in non-fuel operating costs. The study found that labour for
CANDU stations is approximately 20% higher than in benchmarked PWR stations.
o The ‘corporate cost allocations’ driver relates directly to the allocated corporate support costs
charged to the nuclear group.
o The ‘potential controllable costs’ driver relates to the remaining costs which are not
attributable to other specific cost drivers – and is an area that OPG is focused on in its
business planning to target areas for improvement.
o The only additional contributing factor which appears in non-fuel operating cost is
capitalization policy. The impact of differing capitalization policies is removed when looking
at total generating cost per MWh (i.e., the sum of non-fuel operating cost, fuel cost, and
capital cost).
The major contributing factors to Pickering and Darlington performance for non-fuel operating
cost per MWh were reviewed in the total generating cost per MWh section of the report.
In order to continue to control costs while its generation portfolio is shrinking, OPG proactively
initiated, in 2011, a corporate-wide Business Transformation initiative aimed at reducing labour
costs and implementing a range of other efficiencies within its corporate and support functions
(i.e., excluding operations and maintenance). Capitalizing on demographics to cost effectively
manage the transition, several business transformation initiatives have been identified to deliver
direct productivity savings and sustain them through cultural change.
Filed: 2013-09-27 EB-2013-0321 Ex. F2-1-1 Attachment 1
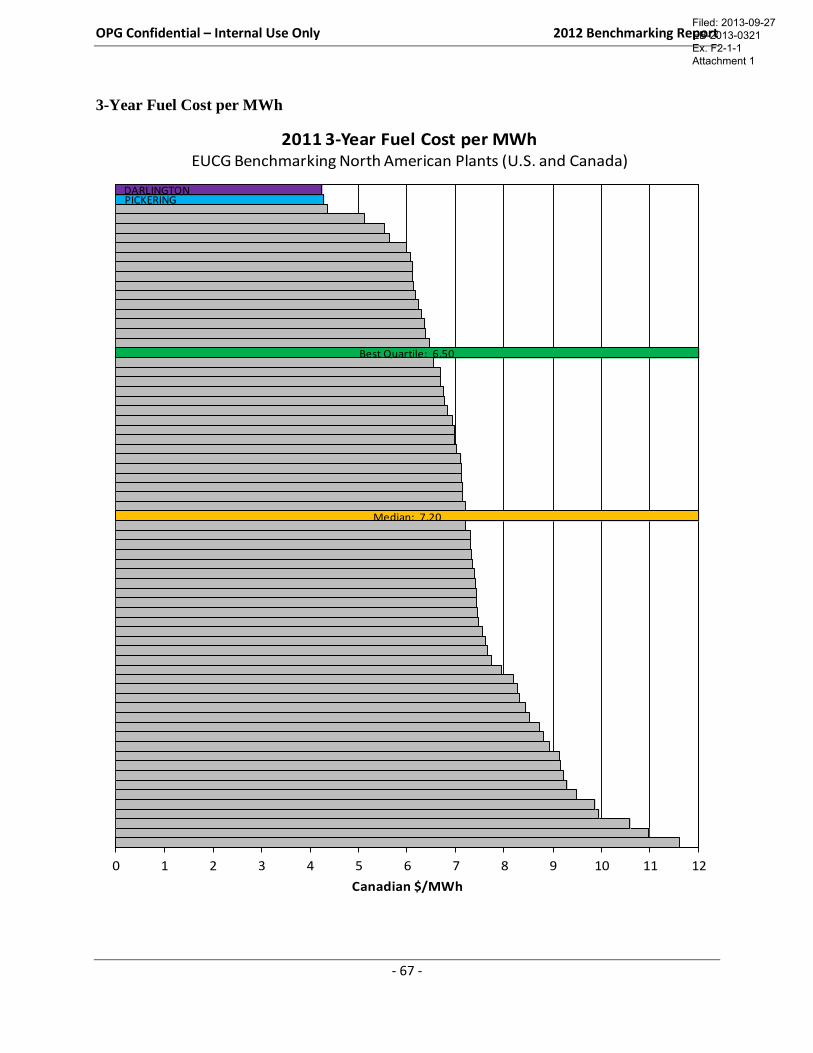
OPG Confidential – Internal Use Only 2012 Benchmarking Report
- 67 -
3-Year Fuel Cost per MWh
Median: 7.20
Best Quartile: 6.50
PICKERINGDARLINGTON
0 1 2 3 4 5 6 7 8 9 10 11 12
Canadian $/MWh
2011 3-Year Fuel Cost per MWhEUCG Benchmarking North American Plants (U.S. and Canada)
Filed: 2013-09-27 EB-2013-0321 Ex. F2-1-1 Attachment 1
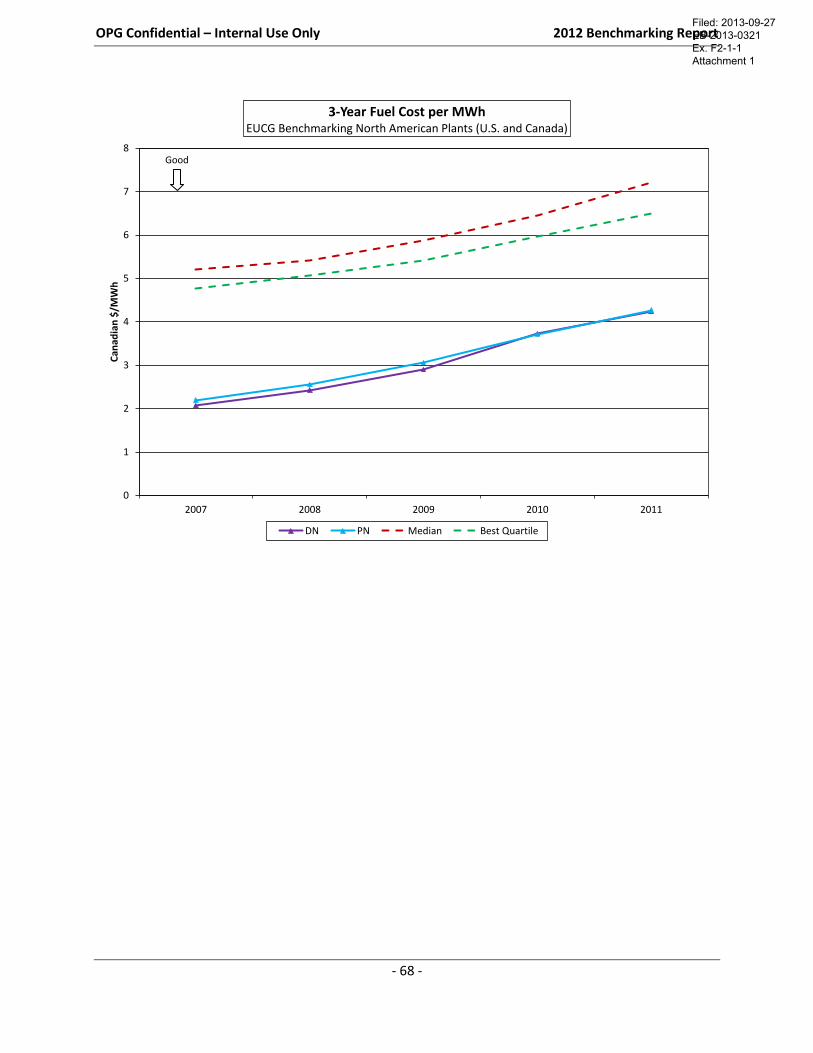
OPG Confidential – Internal Use Only 2012 Benchmarking Report
- 68 -
0
1
2
3
4
5
6
7
8
2007 2008 2009 2010 2011
Can
adia
n $
/MW
h3-Year Fuel Cost per MWh
EUCG Benchmarking North American Plants (U.S. and Canada)
DN PN Median Best Quartile
Good
Filed: 2013-09-27 EB-2013-0321 Ex. F2-1-1 Attachment 1
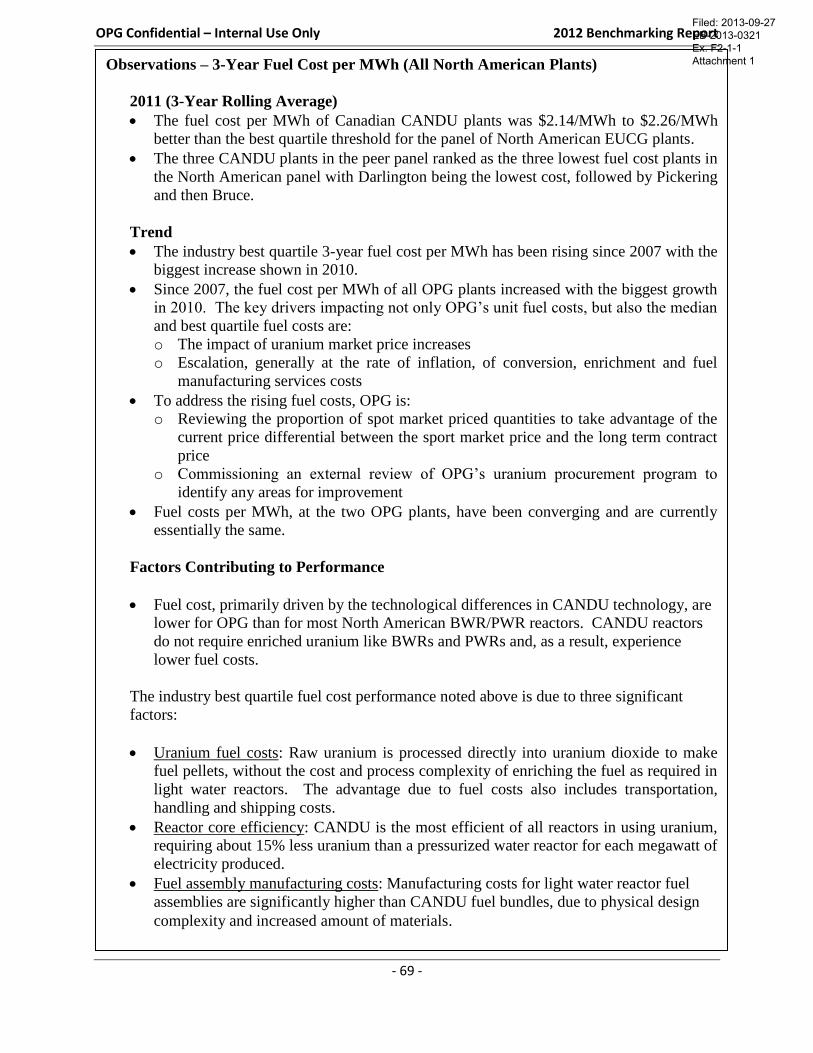
OPG Confidential – Internal Use Only 2012 Benchmarking Report
- 69 -
Observations – 3-Year Fuel Cost per MWh (All North American Plants)
2011 (3-Year Rolling Average)
The fuel cost per MWh of Canadian CANDU plants was $2.14/MWh to $2.26/MWh
better than the best quartile threshold for the panel of North American EUCG plants.
The three CANDU plants in the peer panel ranked as the three lowest fuel cost plants in
the North American panel with Darlington being the lowest cost, followed by Pickering
and then Bruce.
Trend
The industry best quartile 3-year fuel cost per MWh has been rising since 2007 with the
biggest increase shown in 2010.
Since 2007, the fuel cost per MWh of all OPG plants increased with the biggest growth
in 2010. The key drivers impacting not only OPG’s unit fuel costs, but also the median
and best quartile fuel costs are:
o The impact of uranium market price increases
o Escalation, generally at the rate of inflation, of conversion, enrichment and fuel
manufacturing services costs
To address the rising fuel costs, OPG is:
o Reviewing the proportion of spot market priced quantities to take advantage of the
current price differential between the sport market price and the long term contract
price
o Commissioning an external review of OPG’s uranium procurement program to
identify any areas for improvement
Fuel costs per MWh, at the two OPG plants, have been converging and are currently
essentially the same.
Factors Contributing to Performance
Fuel cost, primarily driven by the technological differences in CANDU technology, are
lower for OPG than for most North American BWR/PWR reactors. CANDU reactors
do not require enriched uranium like BWRs and PWRs and, as a result, experience
lower fuel costs.
The industry best quartile fuel cost performance noted above is due to three significant
factors:
Uranium fuel costs: Raw uranium is processed directly into uranium dioxide to make
fuel pellets, without the cost and process complexity of enriching the fuel as required in
light water reactors. The advantage due to fuel costs also includes transportation,
handling and shipping costs.
Reactor core efficiency: CANDU is the most efficient of all reactors in using uranium,
requiring about 15% less uranium than a pressurized water reactor for each megawatt of
electricity produced.
Fuel assembly manufacturing costs: Manufacturing costs for light water reactor fuel
assemblies are significantly higher than CANDU fuel bundles, due to physical design
complexity and increased amount of materials.
Filed: 2013-09-27 EB-2013-0321 Ex. F2-1-1 Attachment 1
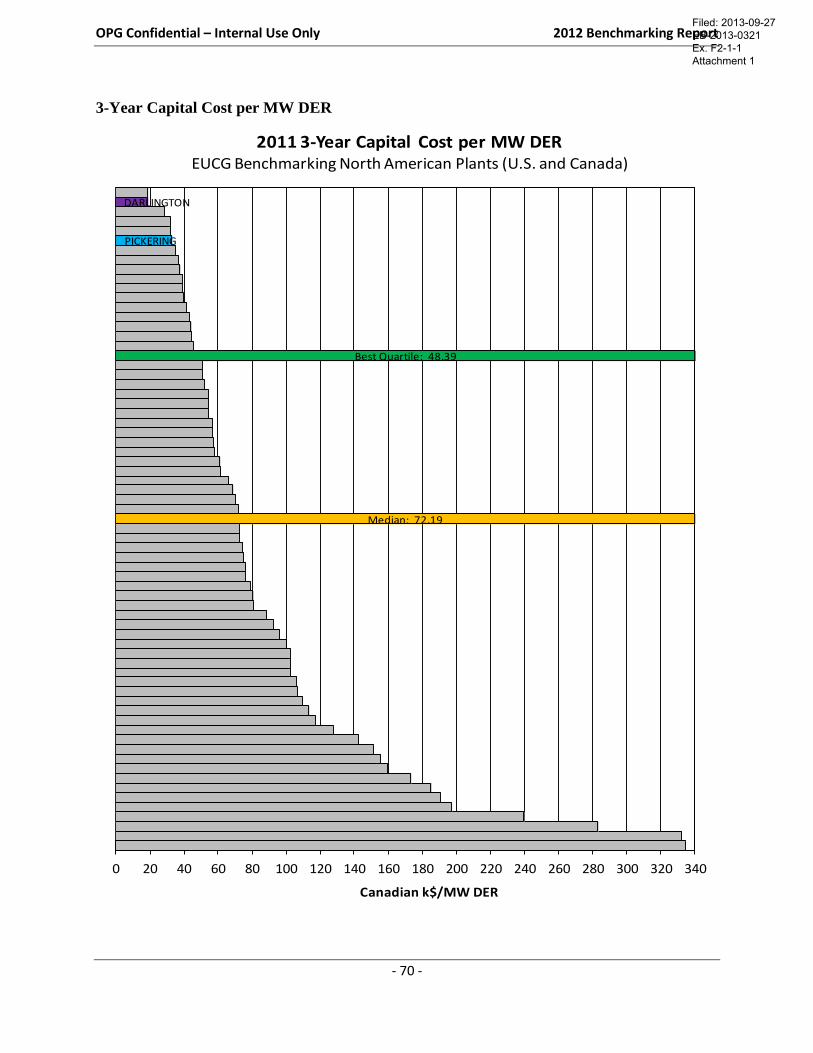
OPG Confidential – Internal Use Only 2012 Benchmarking Report
- 70 -
3-Year Capital Cost per MW DER
Median: 72.19
Best Quartile: 48.39
PICKERING
DARLINGTON
0 20 40 60 80 100 120 140 160 180 200 220 240 260 280 300 320 340
Canadian k$/MW DER
2011 3-Year Capital Cost per MW DEREUCG Benchmarking North American Plants (U.S. and Canada)
Filed: 2013-09-27 EB-2013-0321 Ex. F2-1-1 Attachment 1
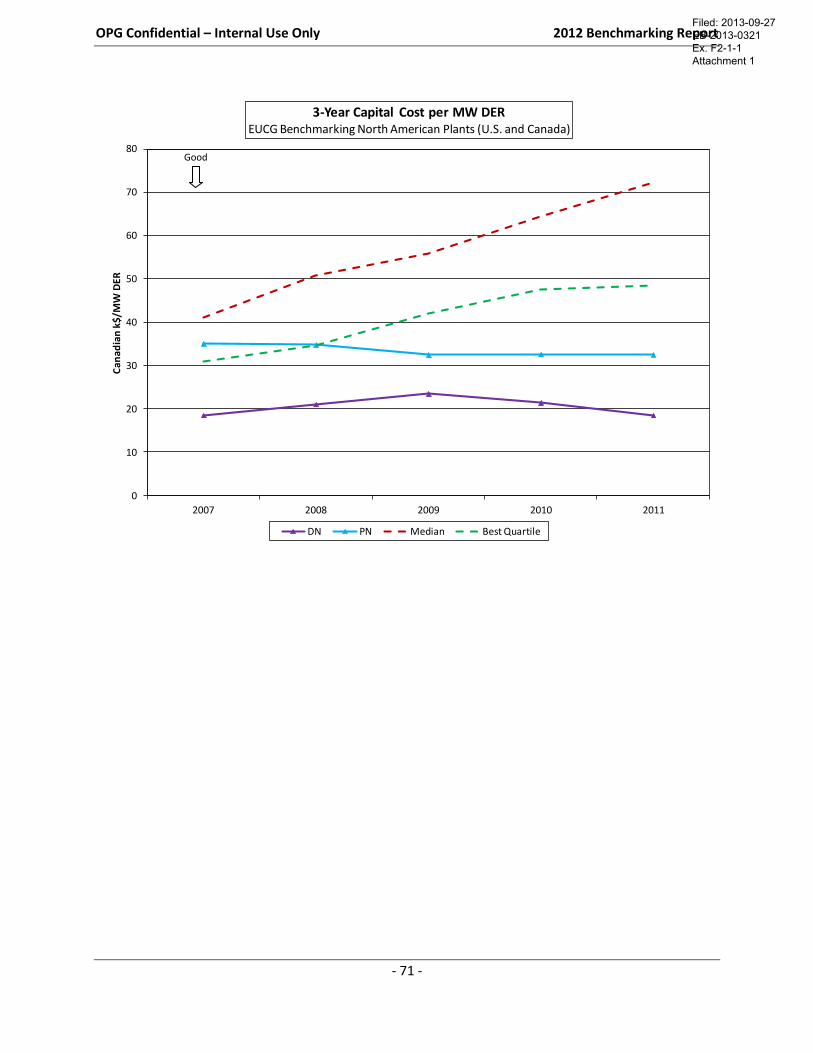
OPG Confidential – Internal Use Only 2012 Benchmarking Report
- 71 -
0
10
20
30
40
50
60
70
80
2007 2008 2009 2010 2011
Can
adia
n k
$/M
W D
ER3-Year Capital Cost per MW DER
EUCG Benchmarking North American Plants (U.S. and Canada)
DN PN Median Best Quartile
Good
Filed: 2013-09-27 EB-2013-0321 Ex. F2-1-1 Attachment 1
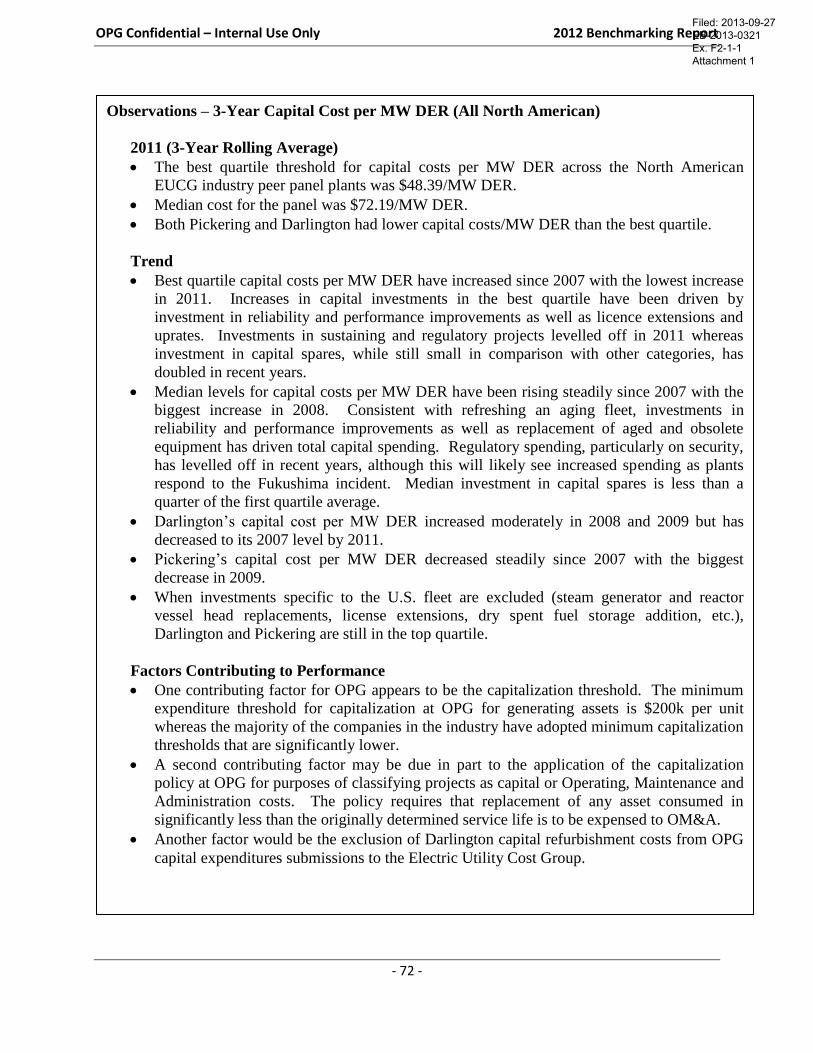
OPG Confidential – Internal Use Only 2012 Benchmarking Report
- 72 -
Observations – 3-Year Capital Cost per MW DER (All North American)
2011 (3-Year Rolling Average)
The best quartile threshold for capital costs per MW DER across the North American
EUCG industry peer panel plants was $48.39/MW DER.
Median cost for the panel was $72.19/MW DER.
Both Pickering and Darlington had lower capital costs/MW DER than the best quartile.
Trend
Best quartile capital costs per MW DER have increased since 2007 with the lowest increase
in 2011. Increases in capital investments in the best quartile have been driven by
investment in reliability and performance improvements as well as licence extensions and
uprates. Investments in sustaining and regulatory projects levelled off in 2011 whereas
investment in capital spares, while still small in comparison with other categories, has
doubled in recent years.
Median levels for capital costs per MW DER have been rising steadily since 2007 with the
biggest increase in 2008. Consistent with refreshing an aging fleet, investments in
reliability and performance improvements as well as replacement of aged and obsolete
equipment has driven total capital spending. Regulatory spending, particularly on security,
has levelled off in recent years, although this will likely see increased spending as plants
respond to the Fukushima incident. Median investment in capital spares is less than a
quarter of the first quartile average.
Darlington’s capital cost per MW DER increased moderately in 2008 and 2009 but has
decreased to its 2007 level by 2011.
Pickering’s capital cost per MW DER decreased steadily since 2007 with the biggest
decrease in 2009.
When investments specific to the U.S. fleet are excluded (steam generator and reactor
vessel head replacements, license extensions, dry spent fuel storage addition, etc.),
Darlington and Pickering are still in the top quartile.
Factors Contributing to Performance
One contributing factor for OPG appears to be the capitalization threshold. The minimum
expenditure threshold for capitalization at OPG for generating assets is $200k per unit
whereas the majority of the companies in the industry have adopted minimum capitalization
thresholds that are significantly lower.
A second contributing factor may be due in part to the application of the capitalization
policy at OPG for purposes of classifying projects as capital or Operating, Maintenance and
Administration costs. The policy requires that replacement of any asset consumed in
significantly less than the originally determined service life is to be expensed to OM&A.
Another factor would be the exclusion of Darlington capital refurbishment costs from OPG
capital expenditures submissions to the Electric Utility Cost Group.
Filed: 2013-09-27 EB-2013-0321 Ex. F2-1-1 Attachment 1
- 73 -
5.0 HUMAN PERFORMANCE
Methodology and Sources of Data
The Human Performance Error Rate metric has been selected to benchmark the performance of
OPG’s nuclear fleet against other INPO utilities in the area of Human Performance. This will
ensure a continued focus on improving Human Performance by comparing OPG Nuclear stations
to industry quartiles through the use of consistent and comparable data. Since this is a relatively
new metric being piloted, only three years’ worth of data was available through INPO when this
report was produced.
Ontario Power Generation’s association with INPO through WANO prevented its direct
participation in this pilot. However, OPG commenced calculating this measure and INPO
provided the company with data representing the aggregate results from U.S. utilities. OPG
realigned its criterion to the INPO criterion effective January 2011.
Filed: 2013-09-27 EB-2013-0321 Ex. F2-1-1 Attachment 1
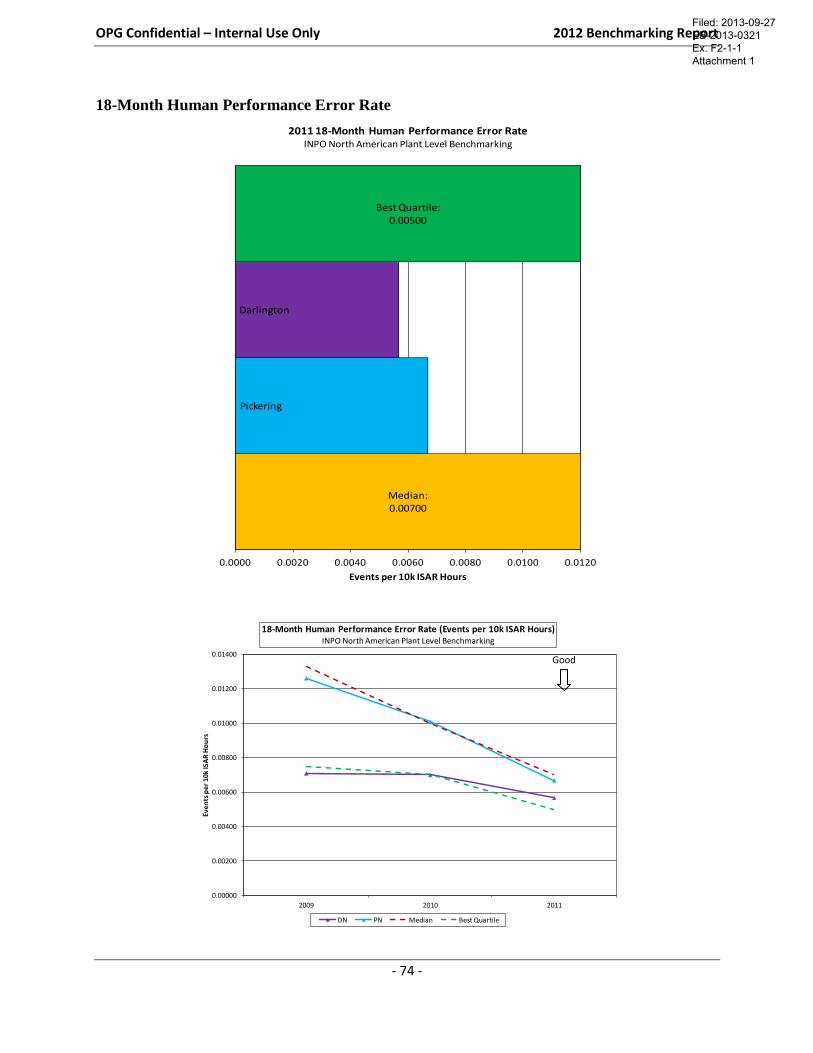
OPG Confidential – Internal Use Only 2012 Benchmarking Report
- 74 -
18-Month Human Performance Error Rate
Median: 0.00700
Pickering
Darlington
Best Quartile: 0.00500
0.0000 0.0020 0.0040 0.0060 0.0080 0.0100 0.0120
Events per 10k ISAR Hours
2011 18-Month Human Performance Error RateINPO North American Plant Level Benchmarking
0.00000
0.00200
0.00400
0.00600
0.00800
0.01000
0.01200
0.01400
2009 2010 2011
Even
ts p
er 1
0k IS
AR
Ho
urs
18-Month Human Performance Error Rate (Events per 10k ISAR Hours)INPO North American Plant Level Benchmarking
DN PN Median Best Quartile
Good
Filed: 2013-09-27 EB-2013-0321 Ex. F2-1-1 Attachment 1
OPG Confidential – Internal Use Only 2012 Benchmarking Report
- 75 -
Observations – 18-Month Human Performance Error Rate (INPO North American Plants)
2011 (18-Month Rolling Average)
The 18-month Human Performance Error Rate (HPER) industry quartiles for all North American INPO
plants were as follows at the end of 2011:
o Best Quartile: ≤0.00500
o Median: >0.00500 but ≤0.0070
o Third Quartile: >0.00700 but ≤0.01200
o Fourth Quartile: >0.01200
Both Pickering and Darlington stations achieved median performance compared to the INPO peer group at
the end of 2011.
Trend
The industry top quartile and median benchmarks have both improved over the 2009-2011 review period.
The industry has experienced some significant events as documented in the Significant Operating Experience
Report (SOER) 10-2 (Engaged, Thinking Organizations) released by the Institute of Nuclear Power
Operations in September of 2010.
Pickering performance continues to improve, moving sharply towards industry top quartile.
Darlington performance continues to be at or near industry top quartile.
Factors Contributing to Performance
OPG Nuclear’s Human Performance strategy focuses on and reinforces the right behaviours during all phases of
station operations and maintenance. It involves initiatives at the individual and leadership level and incorporates
appropriate reviews of organizational processes and values.
This approach aligns with industry best practices.
Individual Behaviours
OPG continues to train staff on the mastery of station fundamentals to establish a foundation for sound
decisions and behaviours.
OPG continues to train staff on Error Prevention techniques, "When, Why & How".
Leadership Behaviours
OPG implemented a 5-year continuing training plan for Supervisory Effectiveness.
Focused observations are used to improve leadership behaviours and have been essential to the success of
the Human Performance program at Ontario Power Generation.
Organizational Processes and Values
OPG has implemented Station Strategic Human Performance Improvement Plans.
OPG has embraced the Accountability Model, with an approach where behaviours are coached in a manner
that promotes discretionary efforts of organization members at all levels.
OPG is focused on removing organizational barriers and facilitating time to allow leaders to spend more time
coaching in the workplace.
OPG joined the INPO Corporate Functional Area Managers Human Performance working group to ensure
alignment with industry best practices and tools.
SOER 10-2, Engaged Thinking Organizations, has been reviewed and recommendations have been
incorporated into the Human Performance Program at OPG.
Filed: 2013-09-27 EB-2013-0321 Ex. F2-1-1 Attachment 1
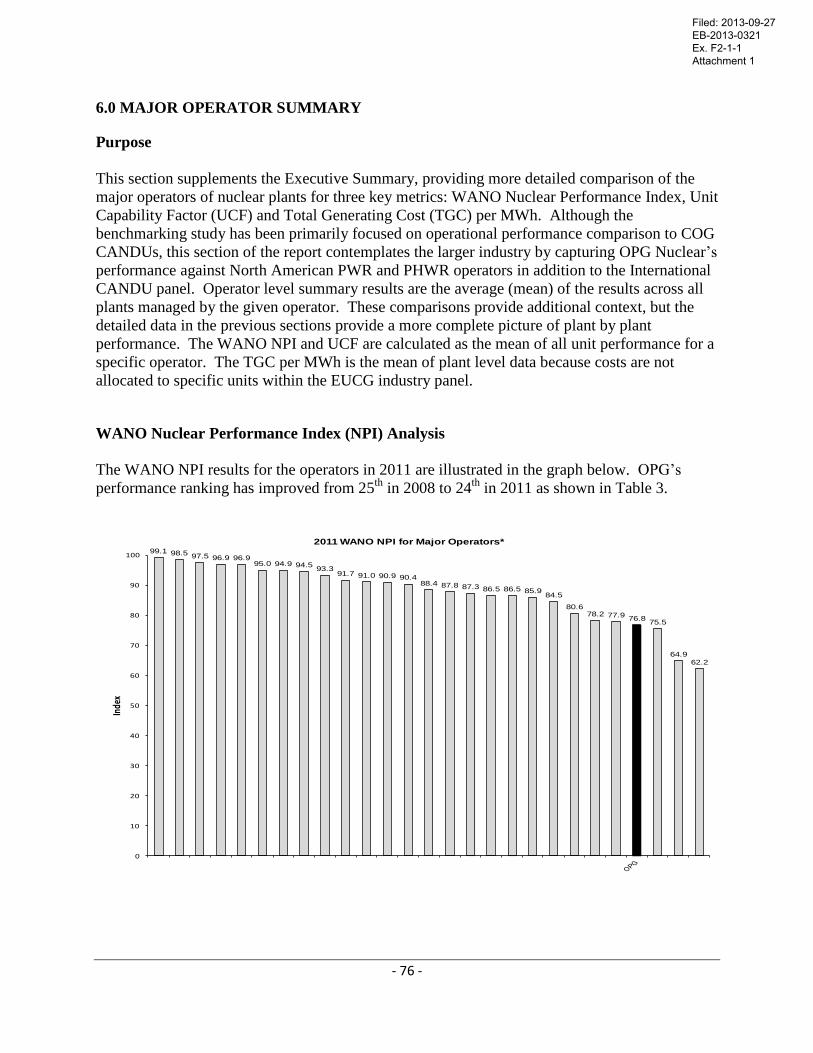
- 76 -
6.0 MAJOR OPERATOR SUMMARY
Purpose
This section supplements the Executive Summary, providing more detailed comparison of the
major operators of nuclear plants for three key metrics: WANO Nuclear Performance Index, Unit
Capability Factor (UCF) and Total Generating Cost (TGC) per MWh. Although the
benchmarking study has been primarily focused on operational performance comparison to COG
CANDUs, this section of the report contemplates the larger industry by capturing OPG Nuclear’s
performance against North American PWR and PHWR operators in addition to the International
CANDU panel. Operator level summary results are the average (mean) of the results across all
plants managed by the given operator. These comparisons provide additional context, but the
detailed data in the previous sections provide a more complete picture of plant by plant
performance. The WANO NPI and UCF are calculated as the mean of all unit performance for a
specific operator. The TGC per MWh is the mean of plant level data because costs are not
allocated to specific units within the EUCG industry panel.
WANO Nuclear Performance Index (NPI) Analysis
The WANO NPI results for the operators in 2011 are illustrated in the graph below. OPG’s
performance ranking has improved from 25th
in 2008 to 24th
in 2011 as shown in Table 3.
99.1 98.5 97.5 96.9 96.995.0 94.9 94.5
93.391.7 91.0 90.9 90.4
88.4 87.8 87.3 86.5 86.5 85.984.5
80.678.2 77.9
76.875.5
64.962.2
0
10
20
30
40
50
60
70
80
90
100
Inde
x
2011 WANO NPI for Major Operators*
Filed: 2013-09-27 EB-2013-0321 Ex. F2-1-1 Attachment 1
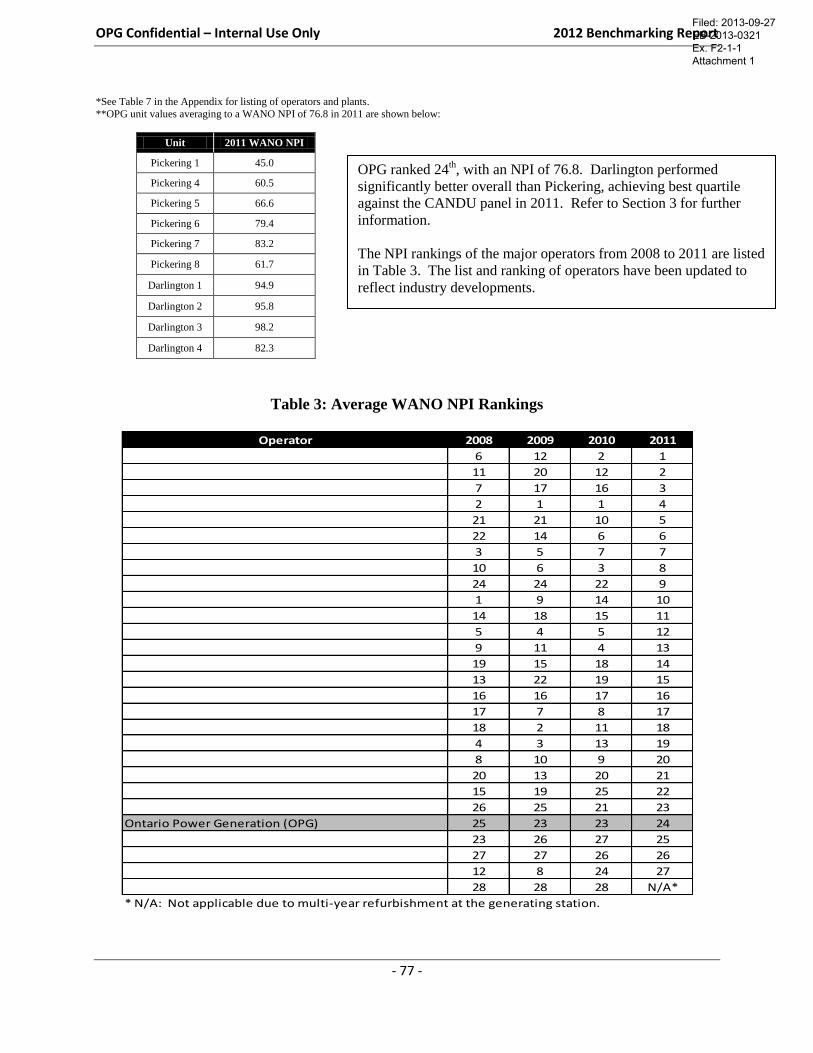
OPG Confidential – Internal Use Only 2012 Benchmarking Report
- 77 -
*See Table 7 in the Appendix for listing of operators and plants.
**OPG unit values averaging to a WANO NPI of 76.8 in 2011 are shown below:
Unit 2011 WANO NPI
Pickering 1 45.0
Pickering 4 60.5
Pickering 5 66.6
Pickering 6 79.4
Pickering 7 83.2
Pickering 8 61.7
Darlington 1 94.9
Darlington 2 95.8
Darlington 3 98.2
Darlington 4 82.3
Table 3: Average WANO NPI Rankings
Operator 2008 2009 2010 2011
6 12 2 1
11 20 12 2
7 17 16 3
2 1 1 4
21 21 10 5
22 14 6 6
3 5 7 7
10 6 3 8
24 24 22 9
1 9 14 10
14 18 15 11
5 4 5 12
9 11 4 13
19 15 18 14
13 22 19 15
16 16 17 16
17 7 8 17
18 2 11 18
4 3 13 19
8 10 9 20
20 13 20 21
15 19 25 22
26 25 21 23
Ontario Power Generation (OPG) 25 23 23 24
23 26 27 25
27 27 26 26
12 8 24 27
28 28 28 N/A*
* N/A: Not applicable due to multi-year refurbishment at the generating station.
OPG ranked 24th, with an NPI of 76.8. Darlington performed
significantly better overall than Pickering, achieving best quartile
against the CANDU panel in 2011. Refer to Section 3 for further
information.
The NPI rankings of the major operators from 2008 to 2011 are listed
in Table 3. The list and ranking of operators have been updated to
reflect industry developments.
Filed: 2013-09-27 EB-2013-0321 Ex. F2-1-1 Attachment 1
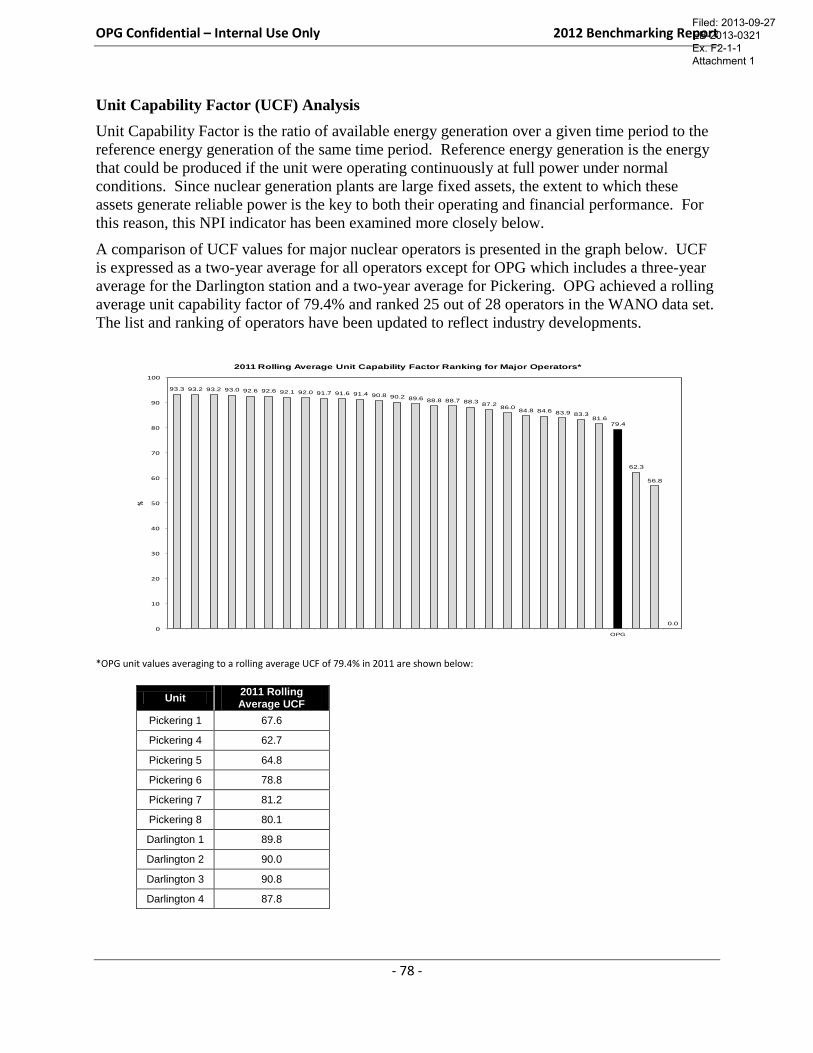
OPG Confidential – Internal Use Only 2012 Benchmarking Report
- 78 -
Unit Capability Factor (UCF) Analysis
Unit Capability Factor is the ratio of available energy generation over a given time period to the
reference energy generation of the same time period. Reference energy generation is the energy
that could be produced if the unit were operating continuously at full power under normal
conditions. Since nuclear generation plants are large fixed assets, the extent to which these
assets generate reliable power is the key to both their operating and financial performance. For
this reason, this NPI indicator has been examined more closely below.
A comparison of UCF values for major nuclear operators is presented in the graph below. UCF
is expressed as a two-year average for all operators except for OPG which includes a three-year
average for the Darlington station and a two-year average for Pickering. OPG achieved a rolling
average unit capability factor of 79.4% and ranked 25 out of 28 operators in the WANO data set.
The list and ranking of operators have been updated to reflect industry developments.
*OPG unit values averaging to a rolling average UCF of 79.4% in 2011 are shown below:
Unit 2011 Rolling Average UCF
Pickering 1 67.6
Pickering 4 62.7
Pickering 5 64.8
Pickering 6 78.8
Pickering 7 81.2
Pickering 8 80.1
Darlington 1 89.8
Darlington 2 90.0
Darlington 3 90.8
Darlington 4 87.8
93.3 93.2 93.2 93.0 92.6 92.6 92.1 92.0 91.7 91.6 91.4 90.8 90.2 89.6 88.8 88.7 88.387.2
86.084.8 84.6 83.9 83.3
81.679.4
62.3
56.8
0.00
10
20
30
40
50
60
70
80
90
100
OPG
%
2011 Rolling Average Unit Capability Factor Ranking for Major Operators*
Filed: 2013-09-27 EB-2013-0321 Ex. F2-1-1 Attachment 1
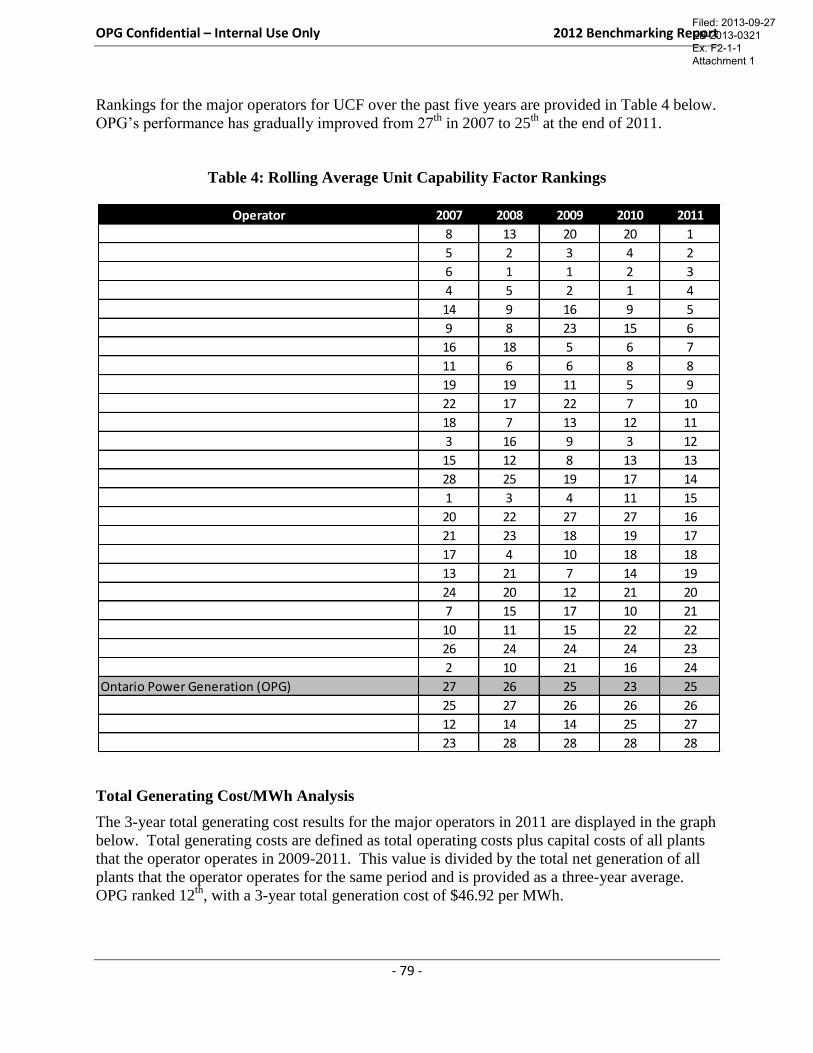
OPG Confidential – Internal Use Only 2012 Benchmarking Report
- 79 -
Rankings for the major operators for UCF over the past five years are provided in Table 4 below.
OPG’s performance has gradually improved from 27th
in 2007 to 25th
at the end of 2011.
Table 4: Rolling Average Unit Capability Factor Rankings
Total Generating Cost/MWh Analysis
The 3-year total generating cost results for the major operators in 2011 are displayed in the graph
below. Total generating costs are defined as total operating costs plus capital costs of all plants
that the operator operates in 2009-2011. This value is divided by the total net generation of all
plants that the operator operates for the same period and is provided as a three-year average.
OPG ranked 12th
, with a 3-year total generation cost of $46.92 per MWh.
Operator 2007 2008 2009 2010 2011
8 13 20 20 1
5 2 3 4 2
6 1 1 2 3
4 5 2 1 4
14 9 16 9 5
9 8 23 15 6
16 18 5 6 7
11 6 6 8 8
19 19 11 5 9
22 17 22 7 10
18 7 13 12 11
3 16 9 3 12
15 12 8 13 13
28 25 19 17 14
1 3 4 11 15
20 22 27 27 16
21 23 18 19 17
17 4 10 18 18
13 21 7 14 19
24 20 12 21 20
7 15 17 10 21
10 11 15 22 22
26 24 24 24 23
2 10 21 16 24
Ontario Power Generation (OPG) 27 26 25 23 25
25 27 26 26 26
12 14 14 25 27
23 28 28 28 28
Filed: 2013-09-27 EB-2013-0321 Ex. F2-1-1 Attachment 1
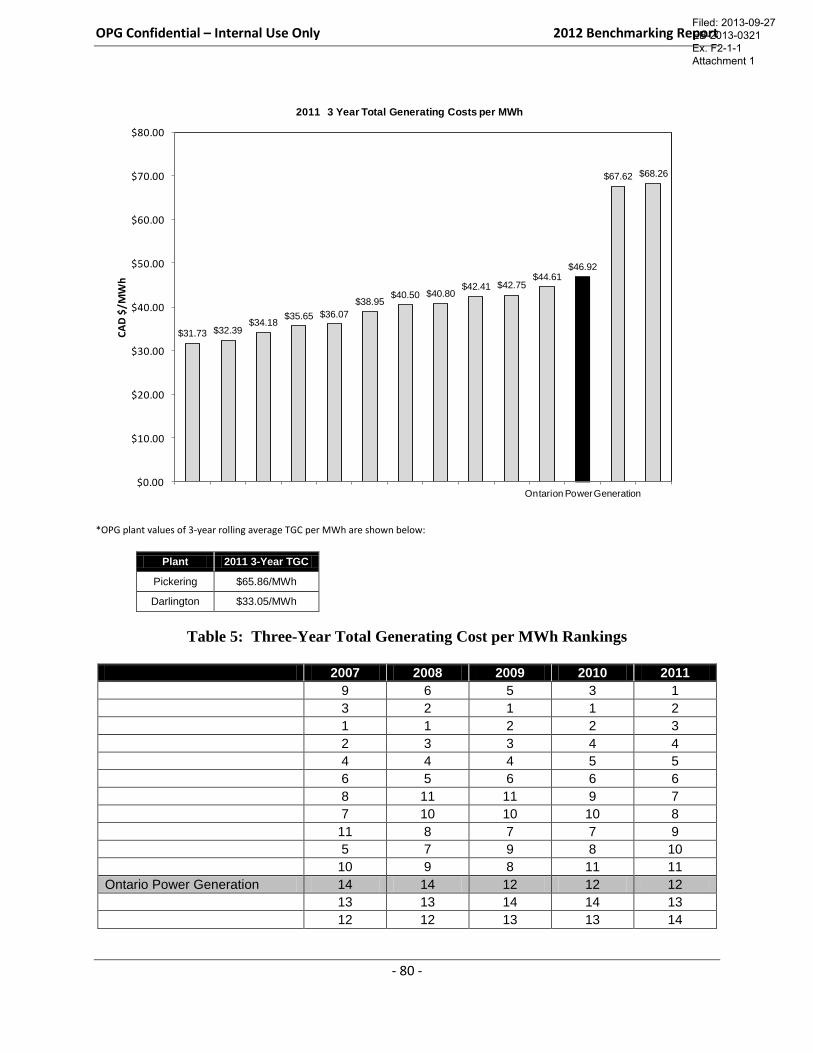
OPG Confidential – Internal Use Only 2012 Benchmarking Report
- 80 -
*OPG plant values of 3-year rolling average TGC per MWh are shown below:
Plant 2011 3-Year TGC
Pickering $65.86/MWh
Darlington $33.05/MWh
Table 5: Three-Year Total Generating Cost per MWh Rankings
2007 2008 2009 2010 2011
9 6 5 3 1
3 2 1 1 2
1 1 2 2 3
2 3 3 4 4
4 4 4 5 5
6 5 6 6 6
8 11 11 9 7
7 10 10 10 8
11 8 7 7 9
5 7 9 8 10
10 9 8 11 11
Ontario Power Generation 14 14 12 12 12
13 13 14 14 13
12 12 13 13 14
$31.73 $32.39$34.18
$35.65 $36.07
$38.95$40.50 $40.80
$42.41 $42.75$44.61
$46.92
$67.62 $68.26
$0.00
$10.00
$20.00
$30.00
$40.00
$50.00
$60.00
$70.00
$80.00
Ontarion Power Generation
CA
D $
/MW
h2011 3 Year Total Generating Costs per MWh
Filed: 2013-09-27 EB-2013-0321 Ex. F2-1-1 Attachment 1
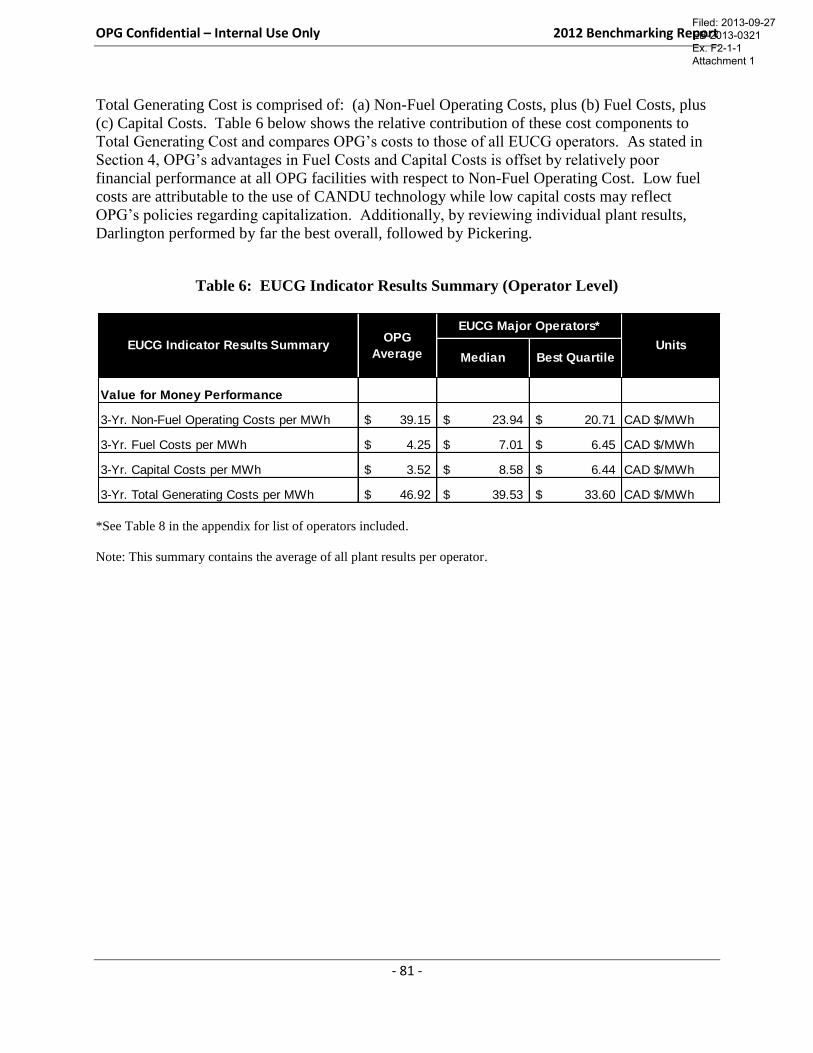
OPG Confidential – Internal Use Only 2012 Benchmarking Report
- 81 -
Total Generating Cost is comprised of: (a) Non-Fuel Operating Costs, plus (b) Fuel Costs, plus
(c) Capital Costs. Table 6 below shows the relative contribution of these cost components to
Total Generating Cost and compares OPG’s costs to those of all EUCG operators. As stated in
Section 4, OPG’s advantages in Fuel Costs and Capital Costs is offset by relatively poor
financial performance at all OPG facilities with respect to Non-Fuel Operating Cost. Low fuel
costs are attributable to the use of CANDU technology while low capital costs may reflect
OPG’s policies regarding capitalization. Additionally, by reviewing individual plant results,
Darlington performed by far the best overall, followed by Pickering.
Table 6: EUCG Indicator Results Summary (Operator Level)
*See Table 8 in the appendix for list of operators included.
Note: This summary contains the average of all plant results per operator.
Value for Money Performance
3-Yr. Non-Fuel Operating Costs per MWh 39.15$ 23.94$ 20.71$ CAD $/MWh
3-Yr. Fuel Costs per MWh 4.25$ 7.01$ 6.45$ CAD $/MWh
3-Yr. Capital Costs per MWh 3.52$ 8.58$ 6.44$ CAD $/MWh
3-Yr. Total Generating Costs per MWh 46.92$ 39.53$ 33.60$ CAD $/MWh
EUCG Indicator Results SummaryOPG
Average
EUCG Major Operators*
UnitsMedian Best Quartile
Filed: 2013-09-27 EB-2013-0321 Ex. F2-1-1 Attachment 1
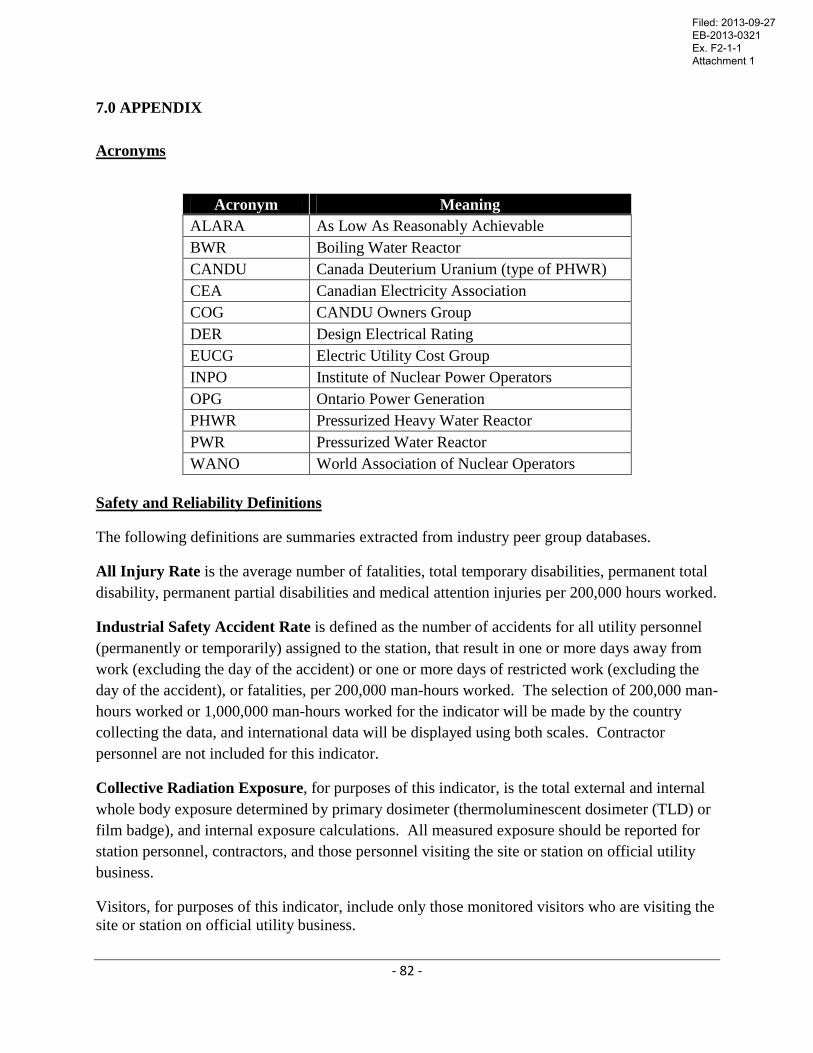
- 82 -
7.0 APPENDIX
Acronyms
Acronym Meaning
ALARA As Low As Reasonably Achievable
BWR Boiling Water Reactor
CANDU Canada Deuterium Uranium (type of PHWR)
CEA Canadian Electricity Association
COG CANDU Owners Group
DER Design Electrical Rating
EUCG Electric Utility Cost Group
INPO Institute of Nuclear Power Operators
OPG Ontario Power Generation
PHWR Pressurized Heavy Water Reactor
PWR Pressurized Water Reactor
WANO World Association of Nuclear Operators
Safety and Reliability Definitions
The following definitions are summaries extracted from industry peer group databases.
All Injury Rate is the average number of fatalities, total temporary disabilities, permanent total
disability, permanent partial disabilities and medical attention injuries per 200,000 hours worked.
Industrial Safety Accident Rate is defined as the number of accidents for all utility personnel
(permanently or temporarily) assigned to the station, that result in one or more days away from
work (excluding the day of the accident) or one or more days of restricted work (excluding the
day of the accident), or fatalities, per 200,000 man-hours worked. The selection of 200,000 man-
hours worked or 1,000,000 man-hours worked for the indicator will be made by the country
collecting the data, and international data will be displayed using both scales. Contractor
personnel are not included for this indicator.
Collective Radiation Exposure, for purposes of this indicator, is the total external and internal
whole body exposure determined by primary dosimeter (thermoluminescent dosimeter (TLD) or
film badge), and internal exposure calculations. All measured exposure should be reported for
station personnel, contractors, and those personnel visiting the site or station on official utility
business.
Visitors, for purposes of this indicator, include only those monitored visitors who are visiting the
site or station on official utility business.
Filed: 2013-09-27 EB-2013-0321 Ex. F2-1-1 Attachment 1
OPG Confidential – Internal Use Only 2012 Benchmarking Report
- 83 -
Airborne Tritium Emissions per Unit
Tritium emissions to air are one of the sites’ leading components of dose to the public. By
specific tracking of tritium emissions, the sites can maintain or reduce dose. Reducing OPG
Nuclear’s dose to the public demonstrates continuous improvement in operations.
Fuel Reliability Index is inferred from fission product activities present in the reactor coolant.
Due to design differences, this indicator is calculated differently for different reactor types. The
indicator is defined as the steady-state primary coolant iodine-131 activity (Becquerels/gram or
Microcuries/gram), corrected for the tramp uranium contribution and power level, and
normalized to a common purification rate.
Unplanned automatic reactor trips (SCRAMS) is defined as the number of unplanned
automatic reactor trips (reactor protection system logic actuations) that occur per 7,000 hours of
critical operation. The indicator is further defined as follows:
Unplanned means that the trip was not an anticipated part of a planned test.
Trip means the automatic shutdown of the reactor by a rapid insertion of negative
reactivity (e.g., by control rods, liquid injection shutdown system, etc.) that is caused
by actuation of the reactor protection system. The trip signal may have resulted from
exceeding a setpoint or may have been spurious
Automatic means that the initial signal that caused actuation of the reactor protection
system logic was provided from one of the sensors’ monitoring plant parameters and
conditions, rather than the manual trip switches or, in certain cases described in the
clarifying notes, manual turbine trip switches (or pushbuttons) provided in the main
control room
Critical means that, during the steady-state condition of the reactor prior to the trip,
the effective multiplication factor (keff) was essentially equal to one.
The value of 7,000 hours is representative of the critical hours of operation during a year for
most plants, and provides an indicator value that typically approximates the actual number of
scrams occurring during the year.
The safety system performance indicator is defined for the many different types of nuclear
reactors within the WANO membership. To facilitate better understanding of the indicator and
applicable system scope for these different type reactors a separate section has been developed
for each reactor type.
Also, because some members have chosen to report all data on a system train basis versus the
"standard" overall system approach, special sections have also been developed for those reactor
types where train reporting has been chosen. (The resulting indicator values resulting from
these methods are essentially the same.)
Each section is written specifically for that reactor type and reporting method. If a member
desires to understand how a different member is reporting or wishes to better understand that
member's indicator, it should consult the applicable section.
Filed: 2013-09-27 EB-2013-0321 Ex. F2-1-1 Attachment 1
OPG Confidential – Internal Use Only 2012 Benchmarking Report
- 84 -
The safety systems monitored by this indicator are the following:
PHWRs
Although the PHWR safety philosophy considers other special safety systems to be paramount to
public safety, the following PHWR safety and safety-related systems were chosen to be
monitored in order to maintain a consistent international application of the safety system
performance indicators:
Auxiliary boiler feedwater system
Emergency AC power
High pressure emergency coolant injection system
These systems were selected for the safety system performance indicator based on their
importance in preventing reactor core damage or extended plant outage. Not every risk
important system is monitored. Rather, those that are generally important across the broad
nuclear industry are included within the scope of this indicator. They include the principal
systems needed for maintaining reactor coolant inventory following a loss of coolant, for decay
heat removal following a reactor trip or loss of main feedwater, and for providing emergency AC
power following a loss of plant off-site power. (Gas cooled reactors have an additional decay
heat removal system instead of the coolant inventory maintenance system.)
Except as specifically stated in the definition and reporting guidance, no attempt is made to
monitor or give credit in the indicator results for the presence of other systems at a given plant
that add diversity to the mitigation or prevention of accidents. For example, no credit is given
for additional power sources that add to the reliability of the electrical grid supplying a plant
because the purpose of the indicator is to monitor the effectiveness of the plant's response once
the grid is lost.
The Nuclear Performance Index Method 4 is an INPO sponsored performance measure, and is
a weighted composite of ten WANO Performance Indicators related to safety and production
performance reliability.
The NPI is used for trending nuclear station and unit performance, and comparing the results to
the median or quartile values of a group of units, to give an indication of relative performance.
The quarterly NPI has also been used to trend the performance and monitor the effectiveness of
various improvement programs in achieving top quartile performance and allows nuclear
facilities to benchmark their achievements against other nuclear plants worldwide.
The Forced Loss Rate (FLR) is defined as the ratio of all unplanned forced energy losses during
a given period of time to the reference energy generation minus energy generation losses
corresponding to planned outages and any unplanned outage extensions of planned outages,
during the same period, expressed as a percentage.
Filed: 2013-09-27 EB-2013-0321 Ex. F2-1-1 Attachment 1
OPG Confidential – Internal Use Only 2012 Benchmarking Report
- 85 -
Unplanned energy losses are either unplanned forced energy losses (unplanned energy
generation losses not resulting from an outage extension) or unplanned outage extension of
planned outage energy losses.
Unplanned forced energy loss is energy that was not produced because of unplanned shutdowns
or unplanned load reductions due to causes under plant management control when the unit is
considered to be at the disposal of the grid dispatcher. Causes of forced energy losses are
considered to be unplanned if they are not scheduled at least four weeks in advance. Causes
considered to be under plant management control are further defined in the clarifying notes.
Unplanned outage extension energy loss is energy that was not produced because of an extension
of a planned outage beyond the original planned end date due to originally scheduled work not
being completed, or because newly scheduled work was added (planned and scheduled) to the
outage less than four weeks before the scheduled end of the planned outage.
Planned energy losses are those corresponding to outages or power reductions which were
planned and scheduled at least four weeks in advance (see clarifying notes for exceptions).
Reference energy generation is the energy that could be produced if the unit were operated
continuously at full power under reference ambient conditions throughout the given period.
Reference ambient conditions are environmental conditions representative of the annual mean
(or typical) ambient conditions for the unit.
Unit Capability Factor is defined as the ratio of the available energy generation over a given
time period to the reference energy generation over the same time period, expressed as a
percentage. Both of these energy generation terms are determined relative to reference ambient
conditions.
Available energy generation is the energy that could have been produced under reference
ambient conditions considering only limitations within control of plant management, i.e., plant
equipment and personnel performance, and work control.
Reference energy generation is the energy that could be produced if the unit were operated
continuously at full power under reference ambient conditions.
Reference ambient conditions are environmental conditions representative of the annual mean
(or typical) ambient conditions for the unit.
The Chemistry Performance Indicator compares the concentration of selected impurities and
corrosion products to corresponding limiting values. Each parameter is divided by its limiting
value, and the sum of these ratios is normalized to 1.0. For BWRs and most PWRs, these
limiting values are the medians for each parameter, based on data collected in 1993, thereby
reflecting recent actual performance levels. For other plants, they reflect challenging targets. If
an impurity concentration is equal to or better than the limiting value, the limiting value is used
as the concentration. This prevents increased concentrations of one parameter from being
masked by better performance in another. As a result, if a plant is at or below the limiting value
Filed: 2013-09-27 EB-2013-0321 Ex. F2-1-1 Attachment 1
OPG Confidential – Internal Use Only 2012 Benchmarking Report
- 86 -
for all parameters, its indicator value would be 1.0, the lowest chemistry indicator value
attainable under the indicator definition.
PWRs with recirculating steam generators and VVERs
Steam generator blowdown chloride
Steam generator blowdown cation conductivity (only applicable to VVER and
PWRs with I-800 steam generator tubes)
Steam generator blowdown sulfate
Steam generator blowdown sodium
Final feedwater iron
Final feedwater copper (not applicable to PWRs with I-800 steam generator
tubes)
Condensate dissolved oxygen (only applicable to PWRs with I-800 steam
generator tubes)
Steam generator molar ratio target range (by reporting the upper and lower range
limits (as "from" and "to" values when using molar ratio control)
Steam generator actual molar ratio (if reporting molar ratio control data)
PWRs with once through steam generators
Final feedwater chloride
Final feedwater sulfate
Final feedwater sodium
Final feedwater iron
Final feedwater copper
Pressurized heavy water reactors (PHWRs)
*Inconel-600 or Monel tubes
o Steam generator blowdown chloride
o Steam generator blowdown sulfate
o Steam generator blowdown sodium
o Final feedwater iron
o Final feedwater copper
o Final feedwater dissolved oxygen
Incoloy-800 tubes
o Steam generator blowdown chloride
o Steam generator blowdown sulfate
o Steam generator blowdown sodium
o Final feedwater iron
o Final feedwater dissolved oxygen
PHWRs on molar ratio control
Steam generator blowdown chloride
Filed: 2013-09-27 EB-2013-0321 Ex. F2-1-1 Attachment 1
OPG Confidential – Internal Use Only 2012 Benchmarking Report
- 87 -
Steam generator blowdown sulfate
Final feedwater iron
Final feedwater copper
Feedwater dissolved oxygen
Steam generator molar ratio target range (by reporting the upper and lower range
limits (as "from" and "to" values)
Steam generator actual molar ratio
Online Deficient Maintenance Backlog is the average number of active on-line maintenance
work orders per operating unit classified as Corrective Critical (CC) or Corrective Non-Critical
(CN) that can be worked on without requiring the unit shutdown. This metric identifies
deficiencies or degradation of plant equipment components that need to be remedied, but which
do not represent a loss of functionality of the component or system.
Online Corrective Maintenance Backlog is the average number of active on-line maintenance
work orders per operating unit classified as Corrective Critical (CC) or Corrective Non-Critical
(CN) that can be worked on without requiring the unit shutdown. This metric identifies
deficiencies or degradation of components that need to be remedied, and represents a loss of
functionality of a major component or system.
On-line maintenance is maintenance that will be performed with the main generator connected to
the grid.
Value for Money Definitions
The following definition summaries are taken from the January 2012 EUCG Nuclear Committee
Nuclear Database Instructions.
Capital Costs ($)
All costs associated with improvements and modifications made during the reporting year. These
costs should include design and installation costs in addition to equipment costs. Other
miscellaneous capital additions such as facilities, computer equipment, moveable equipment, and
vehicles should also be included. These costs should be fully burdened with indirect costs, but
exclude AFUDC (interest and depreciation).
Fuel ($)
The total cost associated with a load of fuel in the reactor which is burned up in a given year.
Net Generation (Gigawatt Hours)
The gross electrical output of the unit measured at the output terminals of the turbine-generator
minus the normal station service loads during the hours of the reporting period, expressed in
Gigawatt hours (GWh). Negative quantities should not be used.
Design Electrical Rating (DER)
The nominal net electrical output of a unit, specified by the utility and used for plant design
(DER net expressed in MWe). Design Electric Rating should be the value that the unit was
Filed: 2013-09-27 EB-2013-0321 Ex. F2-1-1 Attachment 1
OPG Confidential – Internal Use Only 2012 Benchmarking Report
- 88 -
certified/designed to produce when constructed. The value would change if a power uprate was
completed. After a power uprate, the value should be the certified or design value resulting from
the uprate.
Operating Costs ($)
The operating cost is to identify all relevant costs to operate and maintain the nuclear operations
in that company. It includes the cost of labour, materials, purchased services and other costs,
including administration and general.
Total Generating Costs ($)
The sum of total operating costs and capital costs as above.
Total Operating Costs ($)
The sum of operating costs and fuel costs as above.
Note: Capital costs, fuel costs, operating costs and total generating costs are divided by net
generation as above to obtain per MWh results. Capital costs are also divided by MW DER to
obtain MW results.
Human Performance Definitions
The following definition summary is taken from the Institute of Nuclear Power Operations
(INPO) database.
Human Performance Error Rate (# per ISAR Hours)
The Human Performance Error Rate metric represents the number of site level human
performance events in an 18-month period per 10,000 hours worked (ISAR hours). The formula
used is:
[# of S-EFDRs (in the last 18 months)] x [10,000 hours] / [total Industrial Safety Accident Rate
(ISAR) hours (in the last 18 months)]
Fleet results are calculated with the same formula, using the total hours worked and total number
of events of the three stations. Site event free day reset criteria was developed in 2004 to align
with criteria established by the STARS Alliance (Strategic Team and Resource Alliance) which
was used through to the end of 2010. This criterion was similar to but not identical to the
criterion set out by INPO in publication INPO 08-004, Human Performance Key Performance
Indicators. U.S. utilities were to align with this criterion in order to establish an effective
benchmark process. This was done with some exceptions. In the same publication, INPO
defined the Human Performance Error Rate metric. INPO piloted this metric throughout 2009
and 2010.
INPO defines an event to occur as a result of the following: An initiating action (error) by an individual or group of individuals (event resulting from an
active error) or an initiating action (not an error) by an individual or group of individuals during
an activity conducted as planned (event resulting from a flawed defense or latent organizational
Filed: 2013-09-27 EB-2013-0321 Ex. F2-1-1 Attachment 1
OPG Confidential – Internal Use Only 2012 Benchmarking Report
- 89 -
weakness). They may be related to Nuclear Safety, Radiological Safety, Industrial Safety,
Facility Operations or considered to be a Regulatory Event reportable to a regulator or governing
agency. OPG Nuclear’s criteria for defining station event free day resets have been developed
based on INPO guidelines. However, the definition may differ slightly due to adaptation
resulting from technological differences.
Filed: 2013-09-27 EB-2013-0321 Ex. F2-1-1 Attachment 1
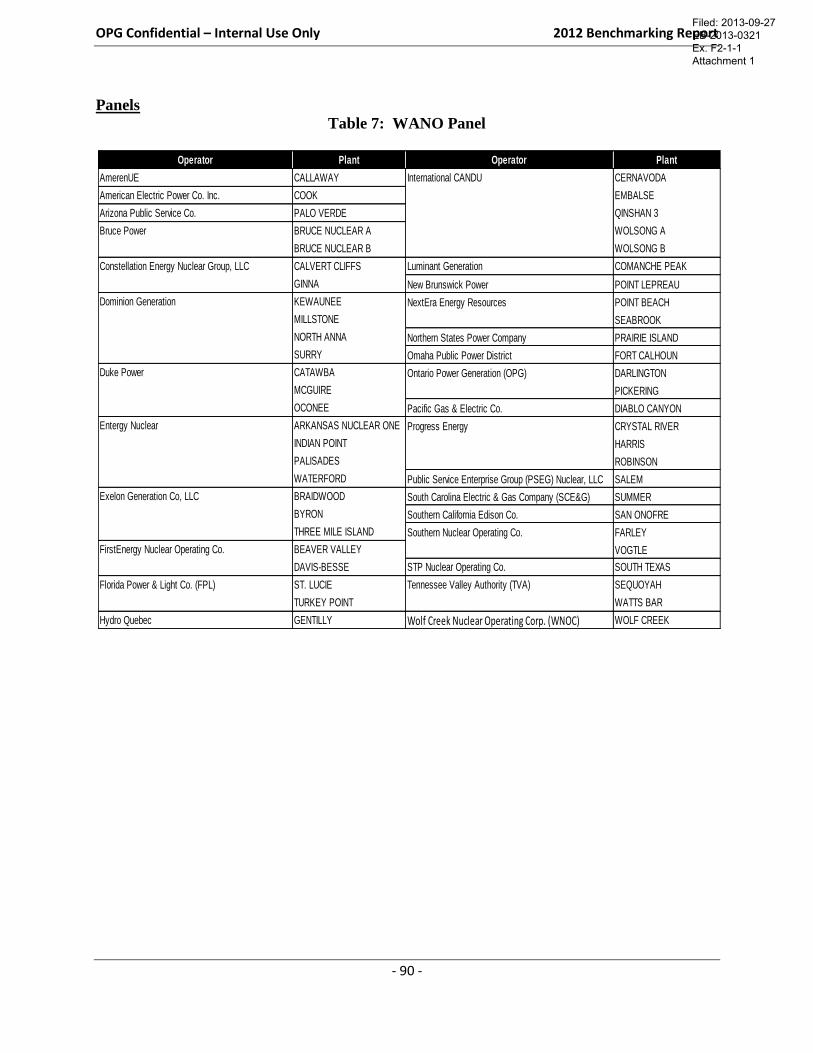
OPG Confidential – Internal Use Only 2012 Benchmarking Report
- 90 -
Panels
Table 7: WANO Panel
Operator Plant Operator Plant
AmerenUE CALLAWAY International CANDU CERNAVODA
American Electric Power Co. Inc. COOK EMBALSE
Arizona Public Service Co. PALO VERDE QINSHAN 3
Bruce Power BRUCE NUCLEAR A WOLSONG A
BRUCE NUCLEAR B WOLSONG B
Constellation Energy Nuclear Group, LLC CALVERT CLIFFS Luminant Generation COMANCHE PEAK
GINNA New Brunswick Power POINT LEPREAU
Dominion Generation KEWAUNEE NextEra Energy Resources POINT BEACH
MILLSTONE SEABROOK
NORTH ANNA Northern States Power Company PRAIRIE ISLAND
SURRY Omaha Public Power District FORT CALHOUN
Duke Power CATAWBA Ontario Power Generation (OPG) DARLINGTON
MCGUIRE PICKERING
OCONEE Pacific Gas & Electric Co. DIABLO CANYON
Entergy Nuclear ARKANSAS NUCLEAR ONE Progress Energy CRYSTAL RIVER
INDIAN POINT HARRIS
PALISADES ROBINSON
WATERFORD Public Service Enterprise Group (PSEG) Nuclear, LLC SALEM
Exelon Generation Co, LLC BRAIDWOOD South Carolina Electric & Gas Company (SCE&G) SUMMER
BYRON Southern California Edison Co. SAN ONOFRE
THREE MILE ISLAND Southern Nuclear Operating Co. FARLEY
FirstEnergy Nuclear Operating Co. BEAVER VALLEY VOGTLE
DAVIS-BESSE STP Nuclear Operating Co. SOUTH TEXAS
Florida Power & Light Co. (FPL) ST. LUCIE Tennessee Valley Authority (TVA) SEQUOYAH
TURKEY POINT WATTS BAR
Hydro Quebec GENTILLY Wolf Creek Nuclear Operating Corp. (WNOC) WOLF CREEK
Filed: 2013-09-27 EB-2013-0321 Ex. F2-1-1 Attachment 1
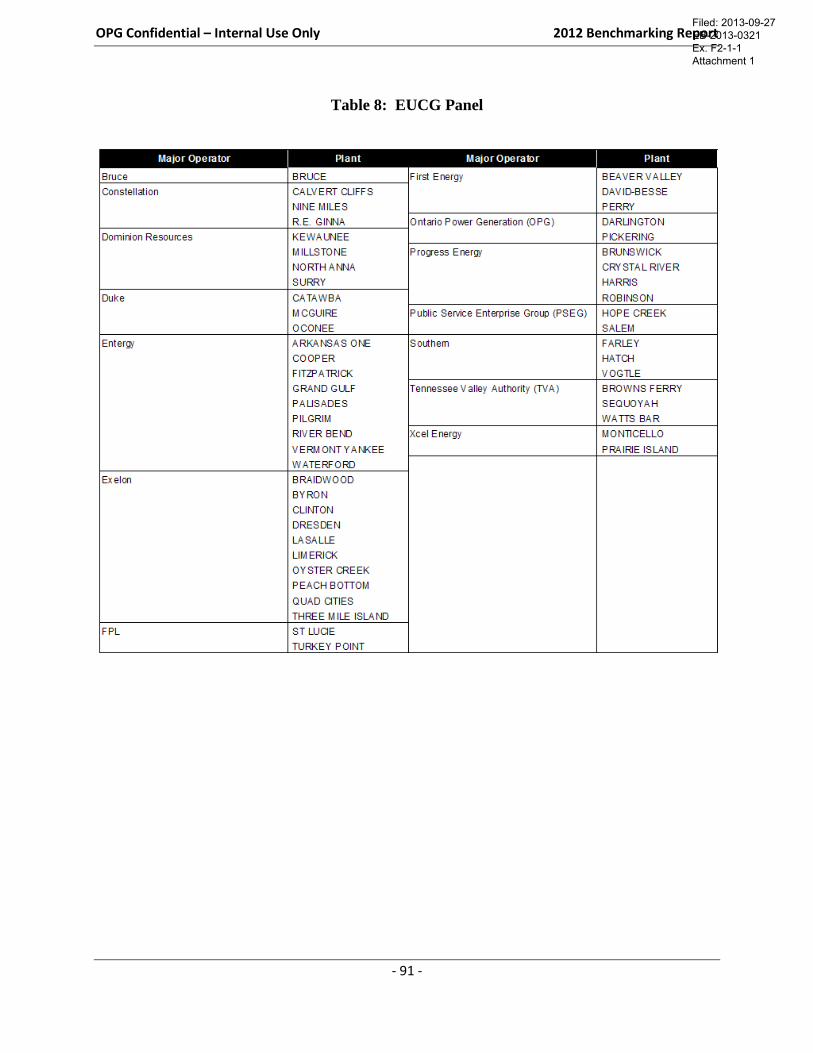
OPG Confidential – Internal Use Only 2012 Benchmarking Report
- 91 -
Table 8: EUCG Panel
Filed: 2013-09-27 EB-2013-0321 Ex. F2-1-1 Attachment 1
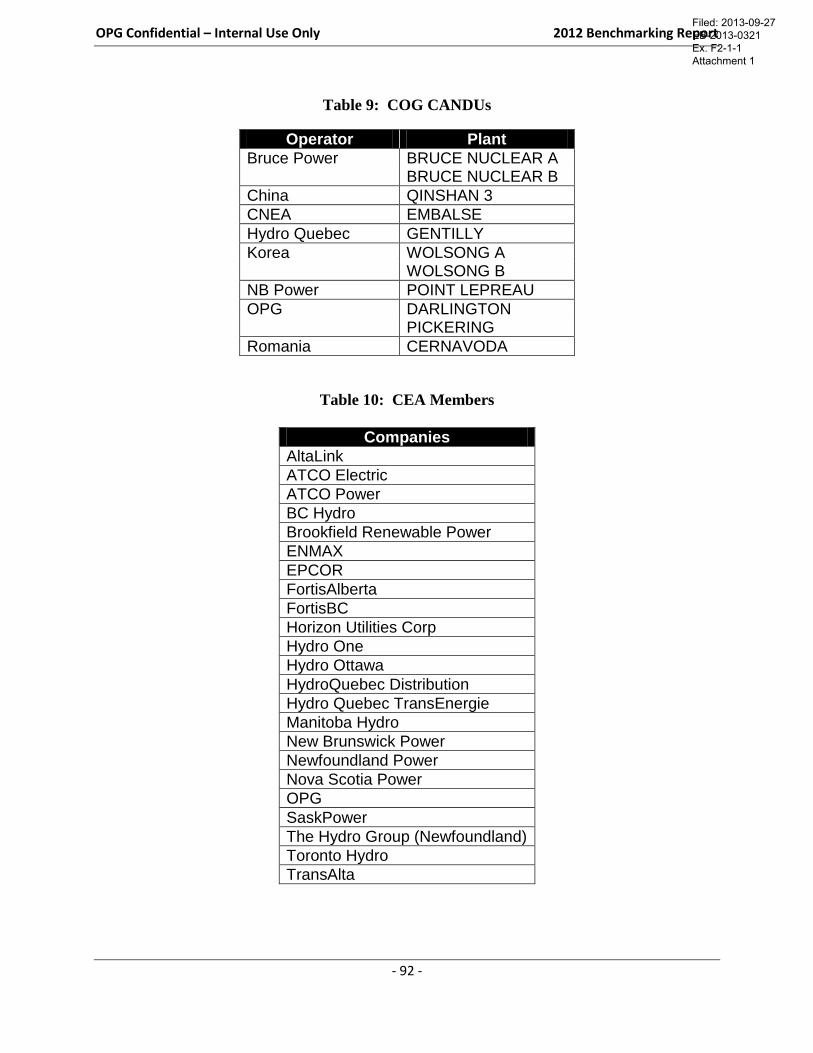
OPG Confidential – Internal Use Only 2012 Benchmarking Report
- 92 -
Table 9: COG CANDUs
Operator Plant
Bruce Power BRUCE NUCLEAR A BRUCE NUCLEAR B
China QINSHAN 3
CNEA EMBALSE
Hydro Quebec GENTILLY
Korea WOLSONG A WOLSONG B
NB Power POINT LEPREAU
OPG DARLINGTON PICKERING
Romania CERNAVODA
Table 10: CEA Members
Companies
AltaLink
ATCO Electric
ATCO Power
BC Hydro
Brookfield Renewable Power
ENMAX
EPCOR
FortisAlberta
FortisBC
Horizon Utilities Corp
Hydro One
Hydro Ottawa
HydroQuebec Distribution
Hydro Quebec TransEnergie
Manitoba Hydro
New Brunswick Power
Newfoundland Power
Nova Scotia Power
OPG
SaskPower
The Hydro Group (Newfoundland)
Toronto Hydro
TransAlta
Filed: 2013-09-27 EB-2013-0321 Ex. F2-1-1 Attachment 1
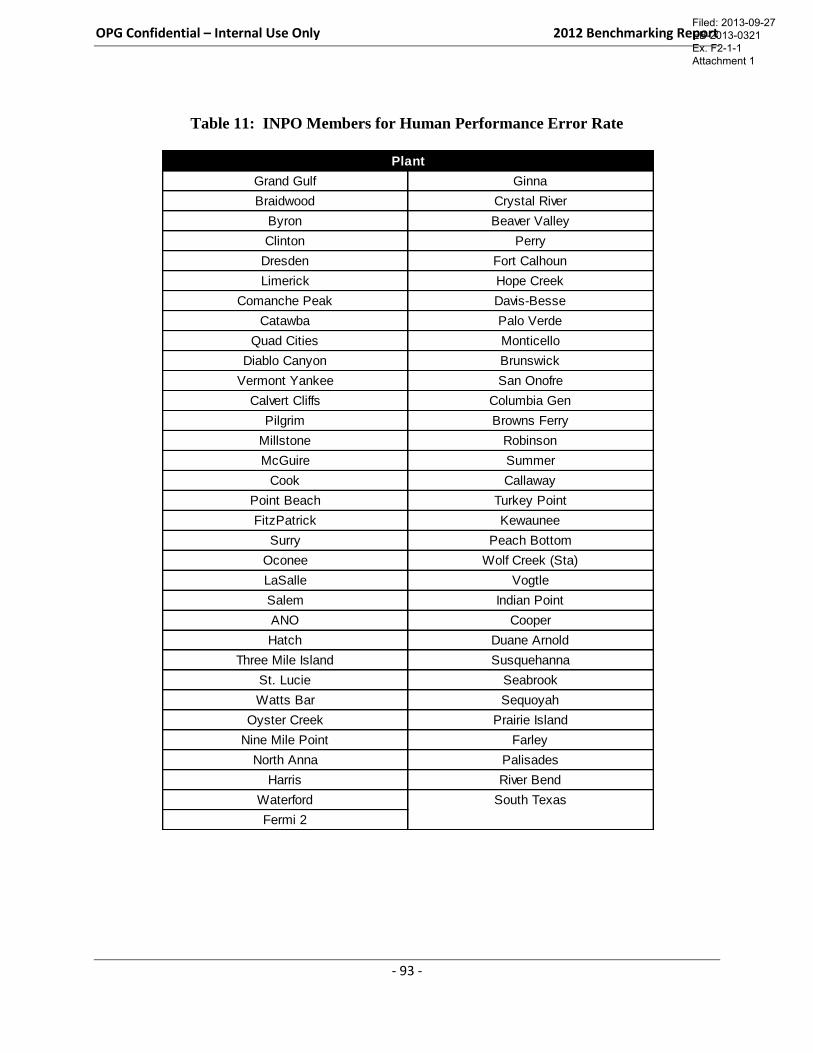
OPG Confidential – Internal Use Only 2012 Benchmarking Report
- 93 -
Table 11: INPO Members for Human Performance Error Rate
Grand Gulf Ginna
Braidwood Crystal River
Byron Beaver Valley
Clinton Perry
Dresden Fort Calhoun
Limerick Hope Creek
Comanche Peak Davis-Besse
Catawba Palo Verde
Quad Cities Monticello
Diablo Canyon Brunswick
Vermont Yankee San Onofre
Calvert Cliffs Columbia Gen
Pilgrim Browns Ferry
Millstone Robinson
McGuire Summer
Cook Callaway
Point Beach Turkey Point
FitzPatrick Kewaunee
Surry Peach Bottom
Oconee Wolf Creek (Sta)
LaSalle Vogtle
Salem Indian Point
ANO Cooper
Hatch Duane Arnold
Three Mile Island Susquehanna
St. Lucie Seabrook
Watts Bar Sequoyah
Oyster Creek Prairie Island
Nine Mile Point Farley
North Anna Palisades
Harris River Bend
Waterford South Texas
Fermi 2
Plant
Filed: 2013-09-27 EB-2013-0321 Ex. F2-1-1 Attachment 1
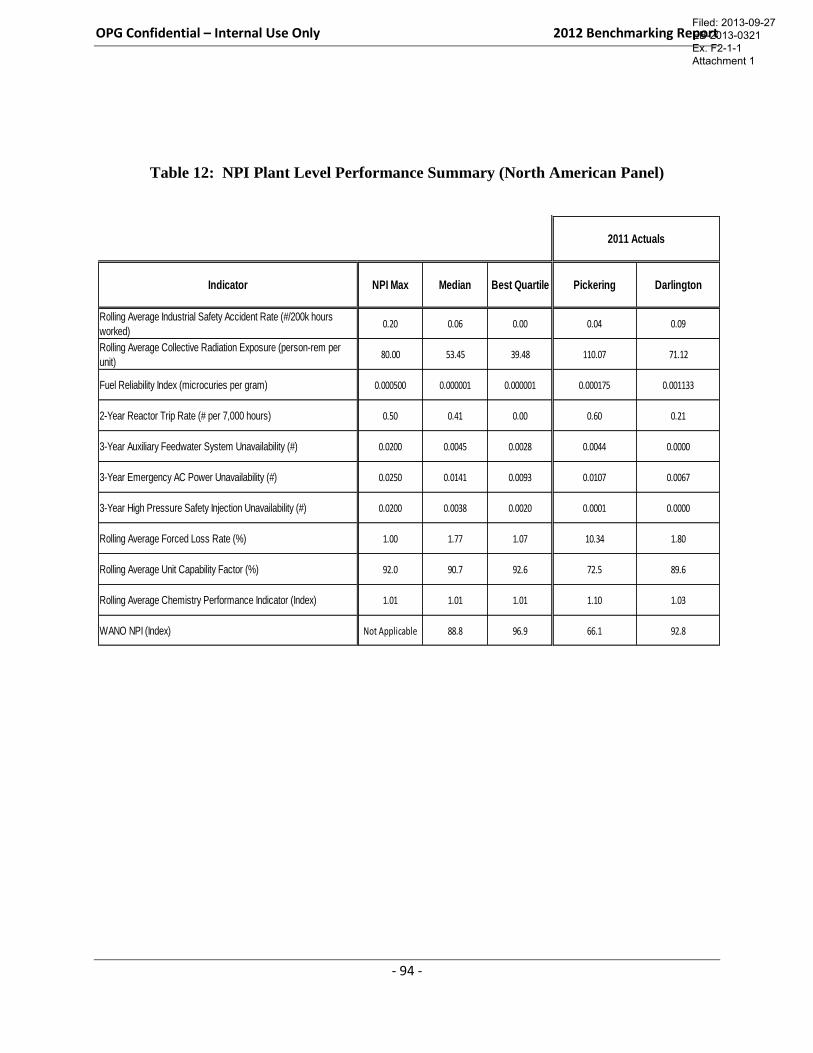
OPG Confidential – Internal Use Only 2012 Benchmarking Report
- 94 -
Table 12: NPI Plant Level Performance Summary (North American Panel)
Indicator NPI Max Median Best Quartile Pickering Darlington
Rolling Average Industrial Safety Accident Rate (#/200k hours
worked)0.20 0.06 0.00 0.04 0.09
Rolling Average Collective Radiation Exposure (person-rem per
unit)80.00 53.45 39.48 110.07 71.12
Fuel Reliability Index (microcuries per gram) 0.000500 0.000001 0.000001 0.000175 0.001133
2-Year Reactor Trip Rate (# per 7,000 hours) 0.50 0.41 0.00 0.60 0.21
3-Year Auxiliary Feedwater System Unavailability (#) 0.0200 0.0045 0.0028 0.0044 0.0000
3-Year Emergency AC Power Unavailability (#) 0.0250 0.0141 0.0093 0.0107 0.0067
3-Year High Pressure Safety Injection Unavailability (#) 0.0200 0.0038 0.0020 0.0001 0.0000
Rolling Average Forced Loss Rate (%) 1.00 1.77 1.07 10.34 1.80
Rolling Average Unit Capability Factor (%) 92.0 90.7 92.6 72.5 89.6
Rolling Average Chemistry Performance Indicator (Index) 1.01 1.01 1.01 1.10 1.03
WANO NPI (Index) Not Applicable 88.8 96.9 66.1 92.8
2011 Actuals
Filed: 2013-09-27 EB-2013-0321 Ex. F2-1-1 Attachment 1