2012 community survey report
DESCRIPTION
The full report from the 2012 QLI and Community Survey.TRANSCRIPT

Provided by
Peak Surveys
1042 W. Baptist Rd. #208
Colorado Springs, CO 80921
www.peaksurveys.com
Community and QLI Survey 2012
Community & Quality of Life Survey
2012 Methodology
Area of Sampling: El Paso County 95% & Teller County 5%
Estimated Population: El Paso 636,963 & Teller County 23356 (2011 estimates Us
Census Bureau)
N = 500 (El Paso 450, Teller 50)
Deployed: October 10th to October 20
th
Summary
The survey instrument was a combination of the most recent Quality of Life Survey
instrument and the most recent Community instrument. Combining these two survey
scripts, and programming the CATI instrument significantly reduced cost by limiting the
project to only one field effort.
Once question design and script was complete, the project was sent to Luce Research for
programming and deployment. To ensure the most valid sample, they contract with
ASDE Survey Sampler – a geographically stratified, general, phone population, random
sampling by RDD (random digit dial) methodology. www.surveysampler.com
In order to gather a better representation of the El Paso and Teller County demographics
the sampling frame included a random sample of residential
telephone numbers both counties and provides access to the majority of residents in the
region. The advantage to RDD sample is its efficiency in conducting the survey effort
being able to directly reach households and secure their participation in the survey in
a direct and active approach. The disadvantages of RDD sample are that it does not
include households with non-traditional telephone service (i.e., cellular-only service). To
account for this deficiency, a 10% oversample of Cell-Phone households was included.
Upon completion of data gathering – the raw data was then imported, data cleaned and
analyzed by Peak Surveys. Results were cross-checked with the initial top-line data from
Luce to ensure an accurate import. The data was input into two separate data files, then
combined into one report for presentation.
Sample Weighting: In order to adjust the sample to correlate more closely with the demographics for El Paso
and Teller Counties, the data was weighted to reflect the demographics of the 2000 US
Census, 2011 estimates for age and gender. The community survey was not weighted in
2010. The Quality of Life survey was weighted in 2011, but not in previous years.
Cross tabulated analysis: Designed to assist you in determining how the different demographics respond to
questions and whether or not there is a relationship. It’s better to look only at the
percentages when viewing any cross tabulated results.
Chi-squared: In a crosstab, patterns will appear, such as a relationship between the frequency someone
purchases and their satisfaction. Chi-squared (pronounced "kai") tells you the likelihood
that the relationship is a real pattern and not just random noise.

2012 Combined Community & QLI Survey
Table of Contents
A. Demographics
Weighted Pg. 8 A
Un-weighted Pg. 12 A
B. Overall Report
Community Survey Pg. 16 B
Overall Quality of Life in the Community Pg. 17 B
Community Headed in Right or Wrong Direction Pg. 17 B
Most Important Issue Facing the Community Pg. 18 B
Second Most Important Issue Facing the Community Pg. 19 B
Primary Source of Information When Volunteering Pg. 20 B
Who Respondents Trust when Addressing Community Issues Pg. 20 B
Favorability with County Commissioners Pg. 21 B
Favorability with Colorado Springs City Council Pg. 21 B
Favorability with Colorado Springs Mayor Pg. 21 B
Most Important for Local Government to do (trust/confidence) … Pg. 22 B
Positive or Negative Impact of Tabor Pg. 23 B
Favorability of Amending Tabor Pg. 23 B
Respondents Concerns for Community Issues Pg. 24 B
QLI
Economic Vision Council Pg. 32 B
Environment Council Pg. 32 B
Arts and Culture Council Pg. 33 B
Public Safety Pg. 35 B
Community Engagement Pg. 36 B
C. Yearly Comparison Reports
Community Survey Pg. 40 C
QLI Pg. 50 C
Cross Tabulated Responses
D. Household Income
Community Survey Pg. 60 D
QLI Pg. 78 D
E. Race
Community Survey Pg. 93 E
QLI Pg. 108 E
F. Age & Gender
Community Survey Pg. 120 F
QLI Pg. 138 F
G. Employment Status
Community Survey Pg. 149 G
QLI Pg. 170 G
H. Education
Community Survey Pg. 185 H
QLI Pg. 203 H
I. Political Affiliation
Community Survey Pg. 218 I
QLI Pg. 236 I
J. Zip by Region
Community Survey Pg. 247 J
QLI Pg. 259 J
K. Open-Ended Responses
Community Survey Pg. 266 K
QLI Pg. 286 K
Phone Survey Script 2012

Section A
demographics
Peak Surveys
www.peaksurveys.com
Community and QLI Survey 2012

Weighted Demographics
County
County
Counts Percents Percents0 100
El Paso County 477 95.47%
Teller County 23 4.53%
Totals 499 100.00%
Zip Code
Zip Code:
Counts Percents Percents0 100
South 106 24.52%
West 83 19.14%
North 156 36.06%
East 88 20.29%
Totals 432 100.00%
Age
Age
Counts Percents Percents0 100
18-29 Years Old 118 23.63%
30-39 Years Old 87 17.46%
40-49 Years Old 93 18.70%
50-64 Years Old 112 22.43%
65 Years and Older 74 14.73%
No Answer 15 3.05%
Totals 499 100.00%
Gender
(28) Gender
Counts Percents Percents0 100
Male 253 50.76%
Female 246 49.24%
Totals 499 100.00%
www.peaksurveys.com Weighted Demographics 8 A
Weighted Demographics

Race
Which of the following best describes your racial or ethnic background?
Counts Percents Percents0 100
White or Caucasian 396 79.23%
Black or African-American 19 3.82%
Hispanic, Spanish, or Latino 38 7.55%
Asian 2 0.33%
Other 45 9.07%
Totals 499 100.00%
Hispanic or Latino Origin
(A) Are you of Hispanic origin?
Counts Percents Percents0 100
Yes 11 2.34%
No 446 96.73%
Refused 4 0.93%
Totals 462 100.00%
Household Income
Household Income
Counts Percents Percents0 100
Under $25,000 72 14.43%
$25,001 to $49,999 107 21.34%
$50,000 to $74,999 84 16.88%
$75,000 to $150,000 119 23.75%
Over $150,000 34 6.83%
Don't know/NA/Refused 84 16.77%
Totals 499 100.00%
www.peaksurveys.com Weighted Demographics 9 A
Weighted Demographics

Employment Status
2012 What is your employment status?
Counts Percents Percents0 100
Employed by otherorganization
239 47.81%
Retired 88 17.57%
Self employed 70 13.93%
Unemployed 41 8.20%
Homemaker/keeping house 25 4.99%
Disabled 16 3.26%
Student 12 2.42%
Other 9 1.83%
Totals 499 100.00%
Education
What is the last grade you completed?
Counts Percents Percents0 100
Grade School 2 0.46%
Some high school 11 2.15%
High School Graduate 107 21.35%
Some college 130 26.00%
College graduate 174 34.78%
Graduate school 73 14.56%
Don't know/NA/Refused 3 0.69%
Totals 499 100.00%
Political Affiliation
Do you consider yourself a Democrat, Republican, an Independent orsomething else?
Counts Percents Percents0 100
Democrat 99 19.84%
Republican 179 35.90%
Independent 158 31.73%
Other 40 8.05%
Unaffiliated (not read) 5 1.03%
Don't know/NA (not read) 17 3.45%
Totals 499 100.00%
www.peaksurveys.com Weighted Demographics 10 A
Weighted Demographics
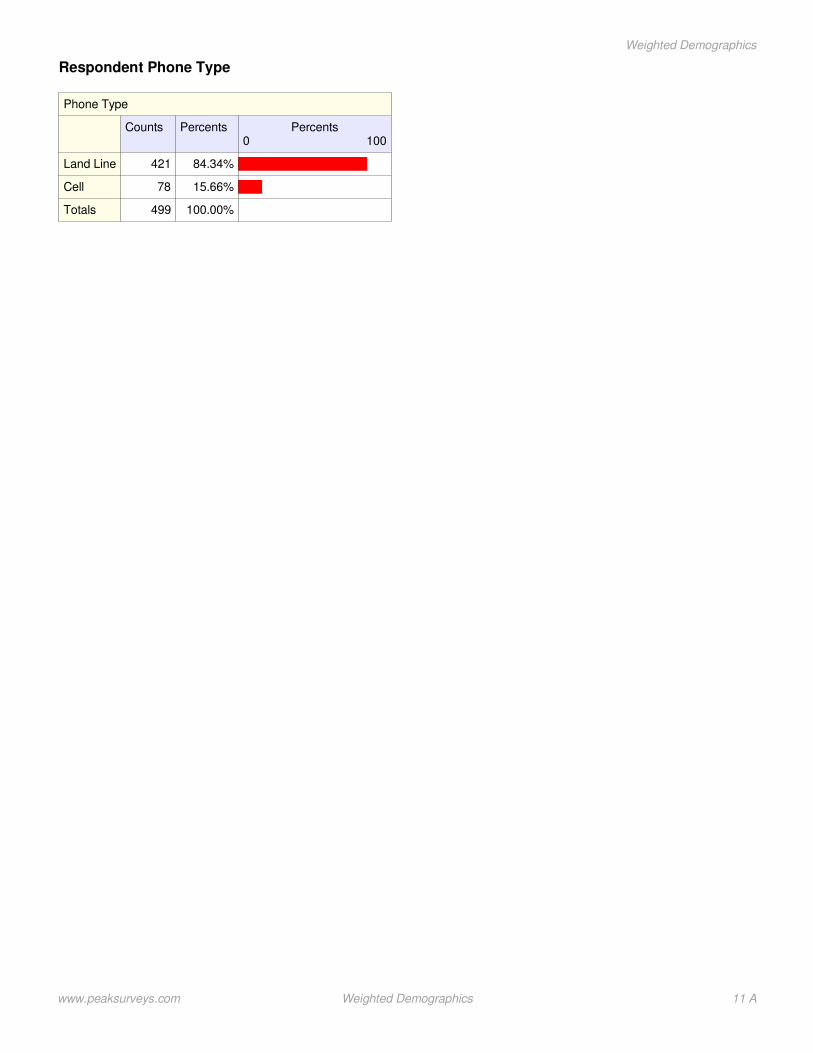
Respondent Phone Type
Phone Type
Counts Percents Percents0 100
Land Line 421 84.34%
Cell 78 15.66%
Totals 499 100.00%
www.peaksurveys.com Weighted Demographics 11 A
Weighted Demographics

Un-Weighted Demographics
County
County
Counts Percents Percents0 100
El Paso County 475 95.00%
Teller County 25 5.00%
Totals 500 100.00%
Zip Code
Zip Code:
Counts Percents Percents0 100
South 90 19.78%
West 110 24.18%
North 165 36.26%
East 90 19.78%
Totals 455 100.00%
Age
Age
Counts Percents Percents0 100
18-29 Years Old 35 7.00%
30-39 Years Old 68 13.60%
40-49 Years Old 70 14.00%
50-64 Years Old 159 31.80%
65 Years and Older 153 30.60%
No Answer 15 3.00%
Totals 500 100.00%
Gender
(28) Gender
Counts Percents Percents0 100
Male 251 50.20%
Female 249 49.80%
Totals 500 100.00%
www.peaksurveys.com Unweighted Demographics 12 A
Un-weighted Demographics
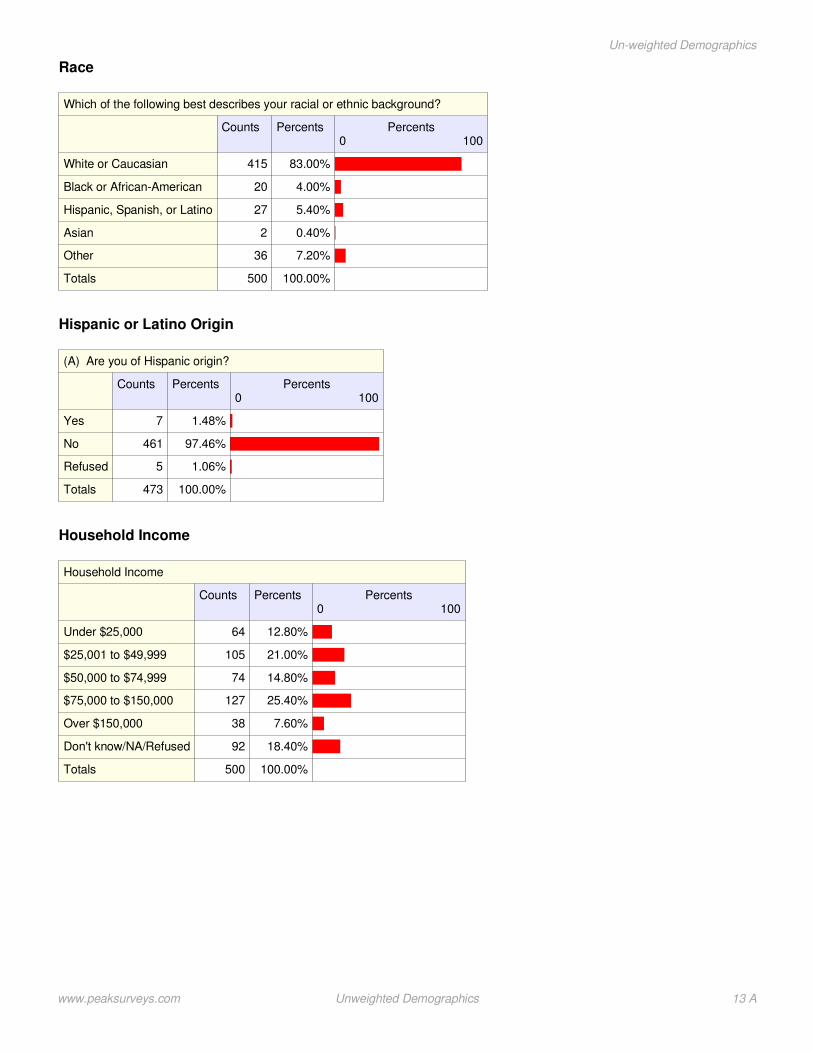
Race
Which of the following best describes your racial or ethnic background?
Counts Percents Percents0 100
White or Caucasian 415 83.00%
Black or African-American 20 4.00%
Hispanic, Spanish, or Latino 27 5.40%
Asian 2 0.40%
Other 36 7.20%
Totals 500 100.00%
Hispanic or Latino Origin
(A) Are you of Hispanic origin?
Counts Percents Percents0 100
Yes 7 1.48%
No 461 97.46%
Refused 5 1.06%
Totals 473 100.00%
Household Income
Household Income
Counts Percents Percents0 100
Under $25,000 64 12.80%
$25,001 to $49,999 105 21.00%
$50,000 to $74,999 74 14.80%
$75,000 to $150,000 127 25.40%
Over $150,000 38 7.60%
Don't know/NA/Refused 92 18.40%
Totals 500 100.00%
www.peaksurveys.com Unweighted Demographics 13 A
Un-weighted Demographics
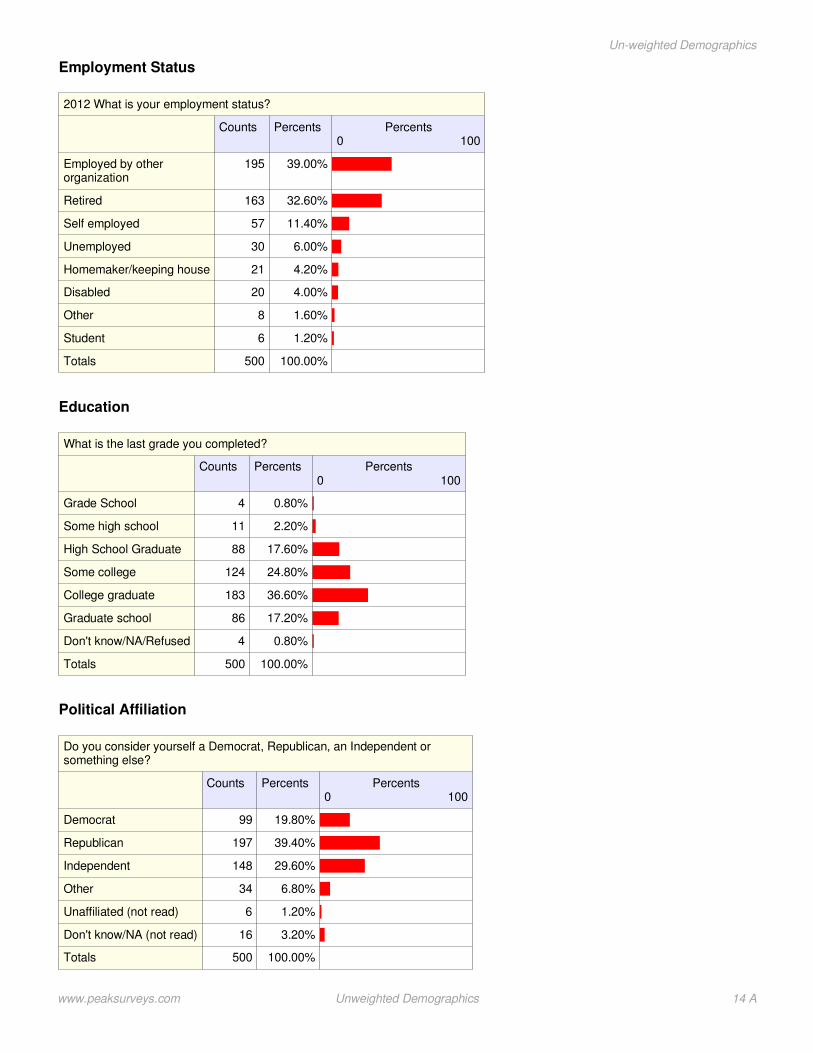
Employment Status
2012 What is your employment status?
Counts Percents Percents0 100
Employed by otherorganization
195 39.00%
Retired 163 32.60%
Self employed 57 11.40%
Unemployed 30 6.00%
Homemaker/keeping house 21 4.20%
Disabled 20 4.00%
Other 8 1.60%
Student 6 1.20%
Totals 500 100.00%
Education
What is the last grade you completed?
Counts Percents Percents0 100
Grade School 4 0.80%
Some high school 11 2.20%
High School Graduate 88 17.60%
Some college 124 24.80%
College graduate 183 36.60%
Graduate school 86 17.20%
Don't know/NA/Refused 4 0.80%
Totals 500 100.00%
Political Affiliation
Do you consider yourself a Democrat, Republican, an Independent orsomething else?
Counts Percents Percents0 100
Democrat 99 19.80%
Republican 197 39.40%
Independent 148 29.60%
Other 34 6.80%
Unaffiliated (not read) 6 1.20%
Don't know/NA (not read) 16 3.20%
Totals 500 100.00%
www.peaksurveys.com Unweighted Demographics 14 A
Un-weighted Demographics
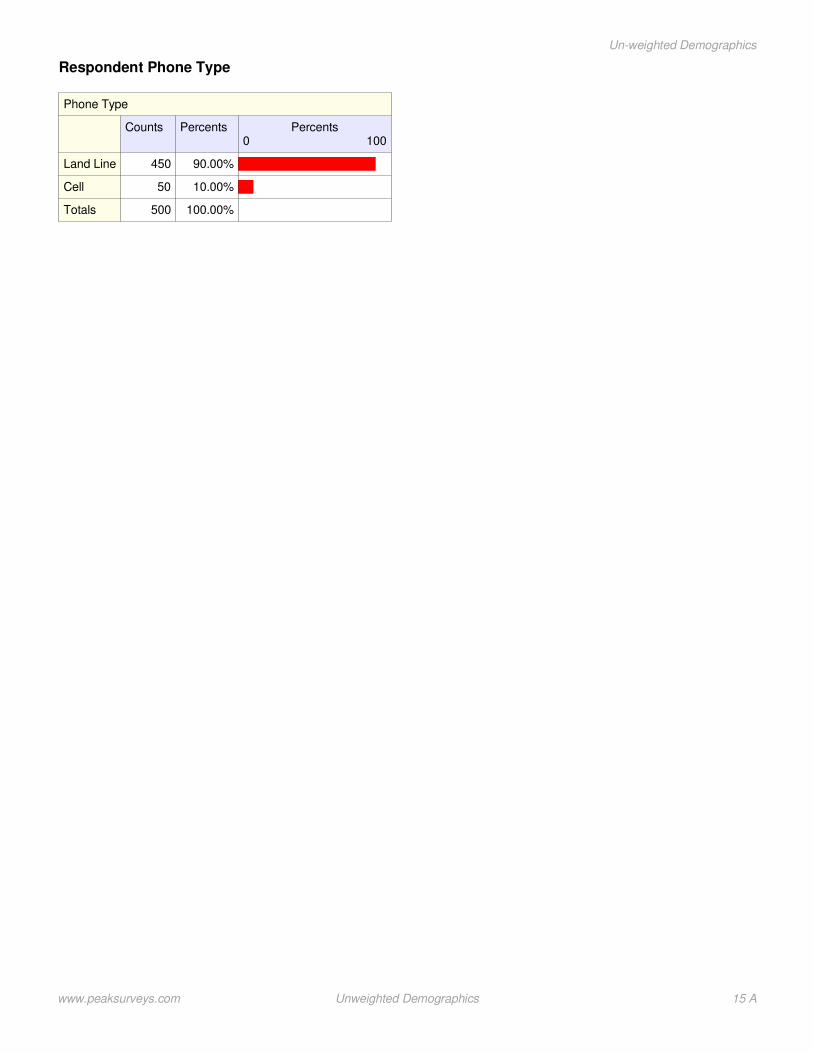
Respondent Phone Type
Phone Type
Counts Percents Percents0 100
Land Line 450 90.00%
Cell 50 10.00%
Totals 500 100.00%
www.peaksurveys.com Unweighted Demographics 15 A
Un-weighted Demographics
Section B
overall reportcommunity survey
Peak Surveys
www.peaksurveys.com
Community and QLI Survey 2012
Community Survey Overall Report
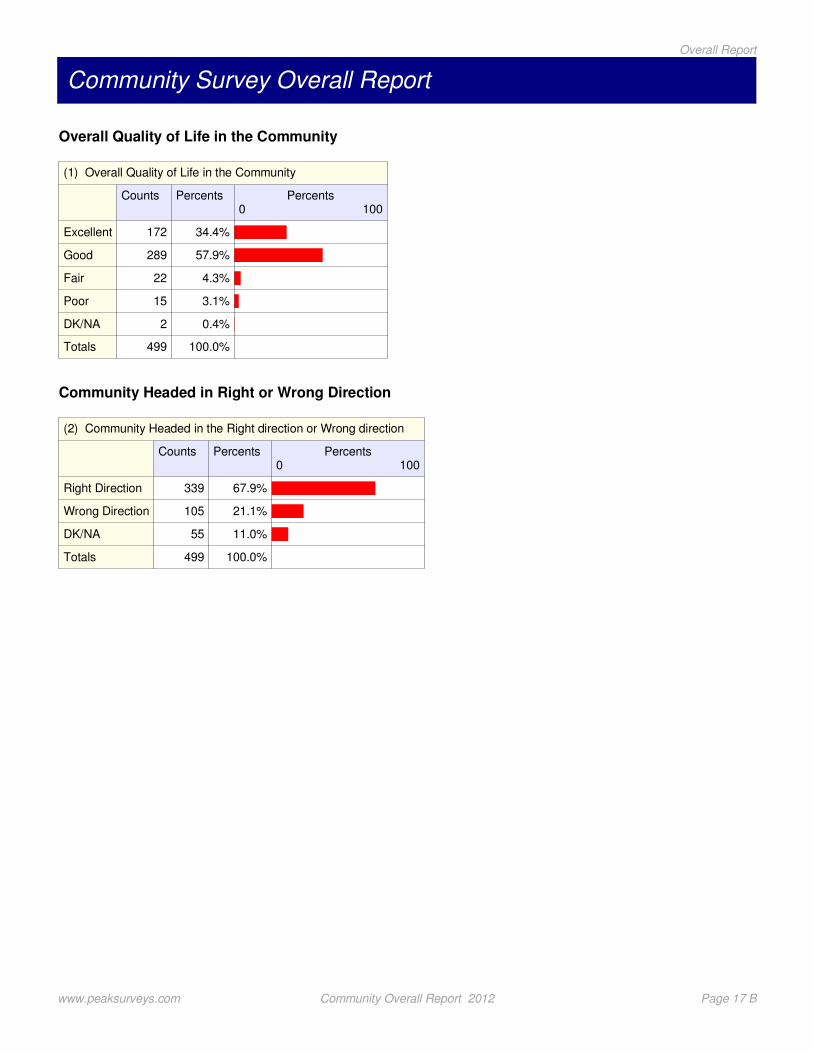
Overall Quality of Life in the Community
(1) Overall Quality of Life in the Community
Counts Percents Percents0 100
Excellent 172 34.4%
Good 289 57.9%
Fair 22 4.3%
Poor 15 3.1%
DK/NA 2 0.4%
Totals 499 100.0%
Community Headed in Right or Wrong Direction
(2) Community Headed in the Right direction or Wrong direction
Counts Percents Percents0 100
Right Direction 339 67.9%
Wrong Direction 105 21.1%
DK/NA 55 11.0%
Totals 499 100.0%
www.peaksurveys.com Community Overall Report 2012 Page 17 B
Overall Report

Most Important Issue Facing the Community
2012 Most Important Issue Facing the Community
Counts Percents Percents0 100
Jobs / Unemployment 89 17.8%
Economy 64 12.9%
Don't know/NA/Refused 52 10.5%
Crime 44 8.9%
Education / schools 42 8.5%
Budget / spending / finances 23 4.5%
Presidential election 17 3.4%
Growth and development 17 3.4%
Child safety / safety 15 3.0%
Environment 14 2.9%
Homeless 14 2.8%
Taxes 14 2.8%
Traffic / transportation 14 2.7%
Funding for emergencyservices (law enforcement/fire)
13 2.7%
Water issues 12 2.3%
Road repair / maintenance 11 2.2%
Government 9 1.7%
Healthcare 8 1.7%
None / nothing 6 1.2%
Military 4 0.9%
Infrastructure 3 0.7%
Housing 3 0.6%
Other 9 1.9%
Totals 499 100.0%
www.peaksurveys.com Community Overall Report 2012 Page 18 B
Overall Report

Second Most Important Issue Facing the Community
2012 Second Most Important Issue Facing the Community
Counts Percents Percents0 100
Don't know/NA/Refused 107 21.4%
Jobs / Unemployment 58 11.6%
Education / schools 41 8.2%
Crime 33 6.5%
Road repair / maintenance 29 5.9%
None / nothing 24 4.8%
Healthcare 18 3.7%
Budget / spending / finances 17 3.4%
Taxes 15 3.1%
Economy 14 2.8%
Homeless 12 2.5%
Child safety / safety 12 2.4%
Government 12 2.3%
Environment 11 2.3%
Water issues 11 2.2%
Traffic / transportation 11 2.1%
Funding for emergencyservices (law enforcement/fire)
9 1.8%
Presidential election 7 1.5%
Housing 7 1.4%
Utilities 6 1.1%
Growth and development 5 1.1%
Military 4 0.9%
Infrastructure 3 0.5%
Other 32 6.5%
Totals 499 100.0%
www.peaksurveys.com Community Overall Report 2012 Page 19 B
Overall Report
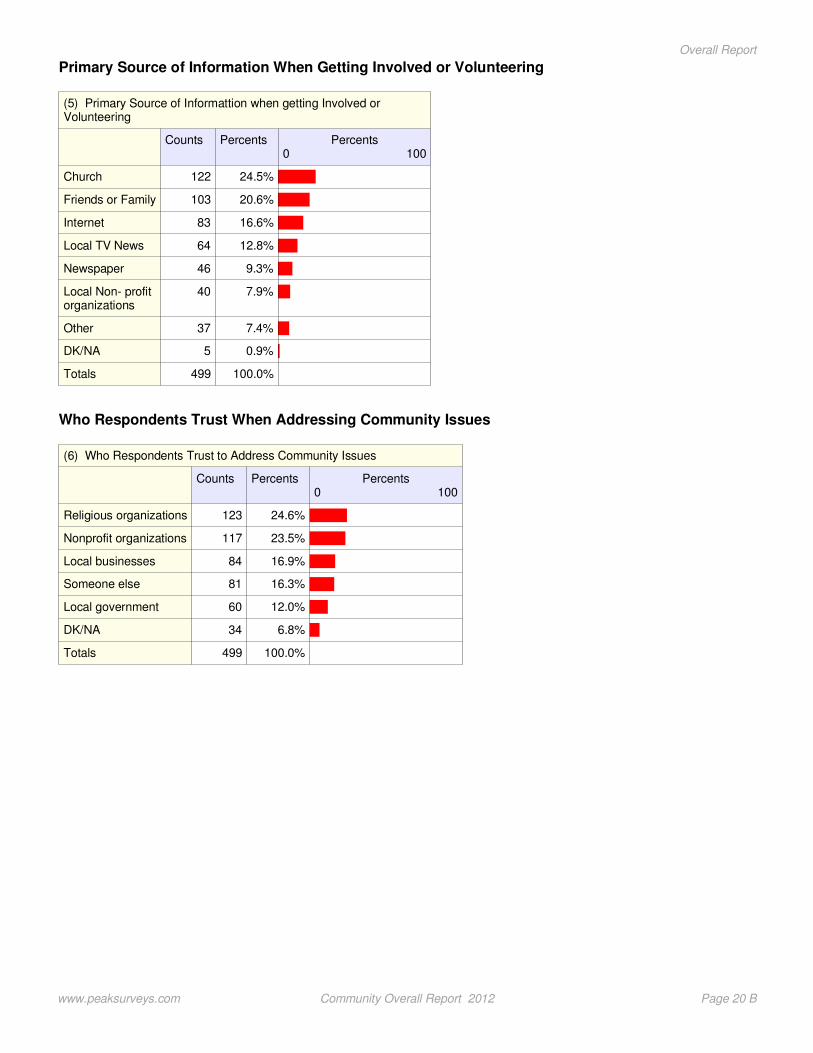
Primary Source of Information When Getting Involved or Volunteering
(5) Primary Source of Informattion when getting Involved orVolunteering
Counts Percents Percents0 100
Church 122 24.5%
Friends or Family 103 20.6%
Internet 83 16.6%
Local TV News 64 12.8%
Newspaper 46 9.3%
Local Non- profitorganizations
40 7.9%
Other 37 7.4%
DK/NA 5 0.9%
Totals 499 100.0%
Who Respondents Trust When Addressing Community Issues
(6) Who Respondents Trust to Address Community Issues
Counts Percents Percents0 100
Religious organizations 123 24.6%
Nonprofit organizations 117 23.5%
Local businesses 84 16.9%
Someone else 81 16.3%
Local government 60 12.0%
DK/NA 34 6.8%
Totals 499 100.0%
www.peaksurveys.com Community Overall Report 2012 Page 20 B
Overall Report

Favorability of County Commissioners
(7) Favorability of CountyCommissioners
County
Overall El PasoCounty
TellerCounty
Percents0 100
Very favorable 397.7%
336.8%
626.6%
Somewhat favorable 20440.8%
19841.5%
626.5%
Somewhat unfavorable 5310.6%
5211.0%
13.7%
Very unfavorable 428.4%
418.6%
15.9%
Never heard of them 7915.7%
7616.0%
29.8%
DK/NA 8316.7%
7716.2%
627.5%
Totals 499100.0%
477100.0%
23100.0%
Favorability of Colorado Springs City Council
(8) Favorability of Colorado Springs City Council
Counts Percents Percents0 100
Very favorable 22 6.3%
Somewhat favorable 135 39.5%
Somewhat unfavorable 57 16.7%
Very unfavorable 27 7.8%
Never heard of them 28 8.1%
DK/NA 73 21.5%
Totals 341 100.0%
Favorability of Colorado Springs Mayor
Favorability of Colorado Springs Mayor
Counts Percents Percents0 100
Very favorable 73 21.4%
Somewhat favorable 117 34.3%
Somewhat unfavorable 32 9.4%
Very unfavorable 31 9.0%
Never heard of them 27 7.9%
DK/NA 62 18.1%
Totals 341 100.0%
www.peaksurveys.com Community Overall Report 2012 Page 21 B
Overall Report
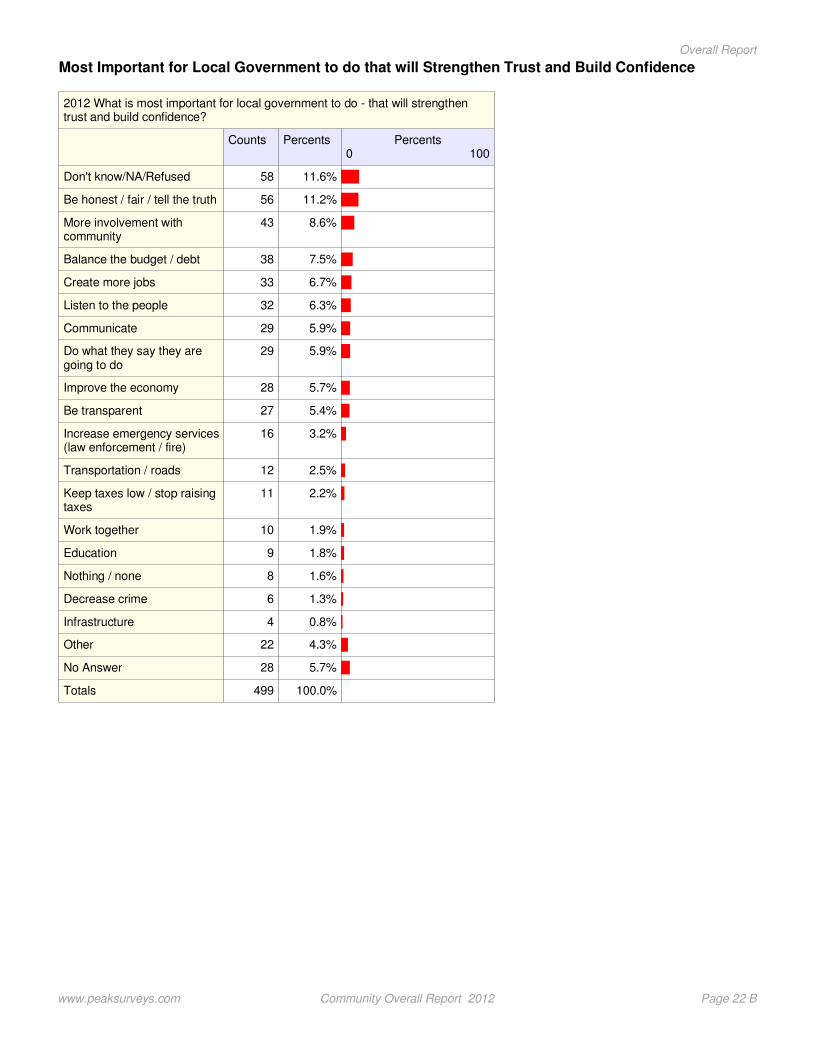
Most Important for Local Government to do that will Strengthen Trust and Build Confidence
2012 What is most important for local government to do - that will strengthentrust and build confidence?
Counts Percents Percents0 100
Don't know/NA/Refused 58 11.6%
Be honest / fair / tell the truth 56 11.2%
More involvement withcommunity
43 8.6%
Balance the budget / debt 38 7.5%
Create more jobs 33 6.7%
Listen to the people 32 6.3%
Communicate 29 5.9%
Do what they say they aregoing to do
29 5.9%
Improve the economy 28 5.7%
Be transparent 27 5.4%
Increase emergency services(law enforcement / fire)
16 3.2%
Transportation / roads 12 2.5%
Keep taxes low / stop raisingtaxes
11 2.2%
Work together 10 1.9%
Education 9 1.8%
Nothing / none 8 1.6%
Decrease crime 6 1.3%
Infrastructure 4 0.8%
Other 22 4.3%
No Answer 28 5.7%
Totals 499 100.0%
www.peaksurveys.com Community Overall Report 2012 Page 22 B
Overall Report

Positive or Negative Impact of Tabor in the Community
(10) Positive or Negative Impact of Tabor in the Community
Counts Percents Percents0 100
Generally positive impact 153 30.7%
Generally negative impact 132 26.3%
Really makes no difference 19 3.9%
Don't know enough about it 74 14.8%
Never heard of TABOR 79 15.9%
DK/NA 42 8.4%
Totals 499 100.0%
Favorability of Amending Tabor
(11) Favorability of Amending TABOR?
Counts Percents Percents0 100
Strongly favorable 97 19.4%
Somewhat favorable 130 26.0%
Somewhat unfavorable 40 8.0%
Strongly unfavorable 35 6.9%
DK/NA 198 39.6%
Totals 499 100.0%
www.peaksurveys.com Community Overall Report 2012 Page 23 B
Overall Report

For the following questions (12 through 28) the respondents were asked how concerned they arewith each issue.
(12) Employment and jobs
Counts Percents Percents0 100
Very Concerned 359 71.9%
Somewhat Concerned 106 21.2%
Not Very Concerned 25 5.0%
Not at all Concerned 8 1.6%
DK/NA 1 0.3%
Totals 499 100.0%
(13) Drugs and alcohol
Counts Percents Percents0 100
Very Concerned 255 51.1%
Somewhat Concerned 145 29.0%
Not Very Concerned 72 14.5%
Not at all Concerned 24 4.9%
DK/NA 3 0.5%
Totals 499 100.0%
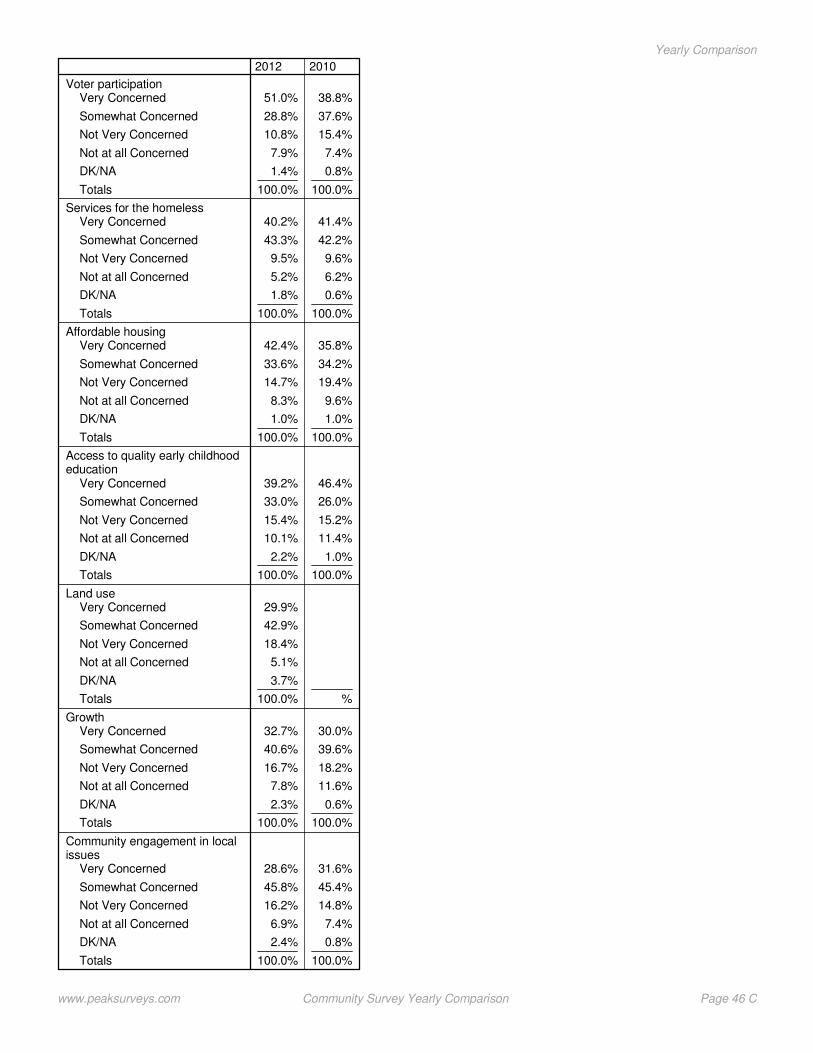
(14) Growth
Counts Percents Percents0 100
Very Concerned 163 32.7%
Somewhat Concerned 202 40.6%
Not Very Concerned 83 16.7%
Not at all Concerned 39 7.8%
DK/NA 11 2.3%
Totals 499 100.0%
(15) Affordable housing
Counts Percents Percents0 100
Very Concerned 212 42.4%
Somewhat Concerned 168 33.6%
Not Very Concerned 74 14.7%
Not at all Concerned 42 8.3%
DK/NA 5 1.0%
Totals 499 100.0%
www.peaksurveys.com Community Overall Report 2012 Page 24 B
Overall Report
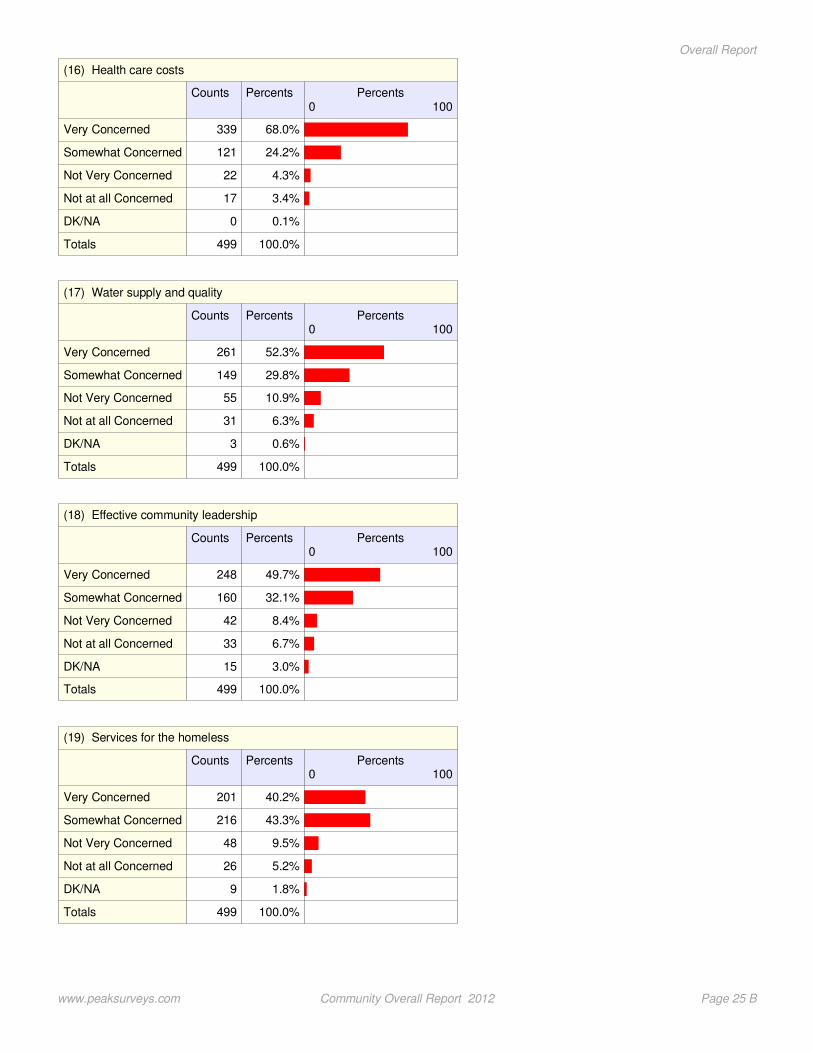
(16) Health care costs
Counts Percents Percents0 100
Very Concerned 339 68.0%
Somewhat Concerned 121 24.2%
Not Very Concerned 22 4.3%
Not at all Concerned 17 3.4%
DK/NA 0 0.1%
Totals 499 100.0%
(17) Water supply and quality
Counts Percents Percents0 100
Very Concerned 261 52.3%
Somewhat Concerned 149 29.8%
Not Very Concerned 55 10.9%
Not at all Concerned 31 6.3%
DK/NA 3 0.6%
Totals 499 100.0%
(18) Effective community leadership
Counts Percents Percents0 100
Very Concerned 248 49.7%
Somewhat Concerned 160 32.1%
Not Very Concerned 42 8.4%
Not at all Concerned 33 6.7%
DK/NA 15 3.0%
Totals 499 100.0%
(19) Services for the homeless
Counts Percents Percents0 100
Very Concerned 201 40.2%
Somewhat Concerned 216 43.3%
Not Very Concerned 48 9.5%
Not at all Concerned 26 5.2%
DK/NA 9 1.8%
Totals 499 100.0%
www.peaksurveys.com Community Overall Report 2012 Page 25 B
Overall Report

(20) Access to mental health care
Counts Percents Percents0 100
Very Concerned 180 36.1%
Somewhat Concerned 154 30.8%
Not Very Concerned 90 18.0%
Not at all Concerned 66 13.2%
DK/NA 10 1.9%
Totals 499 100.0%
(21) Access to quality early childhood education
Counts Percents Percents0 100
Very Concerned 196 39.2%
Somewhat Concerned 165 33.0%
Not Very Concerned 77 15.4%
Not at all Concerned 50 10.1%
DK/NA 11 2.2%
Totals 499 100.0%
(22) Student Achievement
Counts Percents Percents0 100
Very Concerned 265 53.1%
Somewhat Concerned 164 32.8%
Not Very Concerned 41 8.2%
Not at all Concerned 24 4.9%
DK/NA 5 1.1%
Totals 499 100.0%
(23) Arts and culture opportunities
Counts Percents Percents0 100
Very Concerned 106 21.2%
Somewhat Concerned 162 32.5%
Not Very Concerned 140 28.1%
Not at all Concerned 87 17.4%
DK/NA 5 1.0%
Totals 499 100.0%
www.peaksurveys.com Community Overall Report 2012 Page 26 B
Overall Report
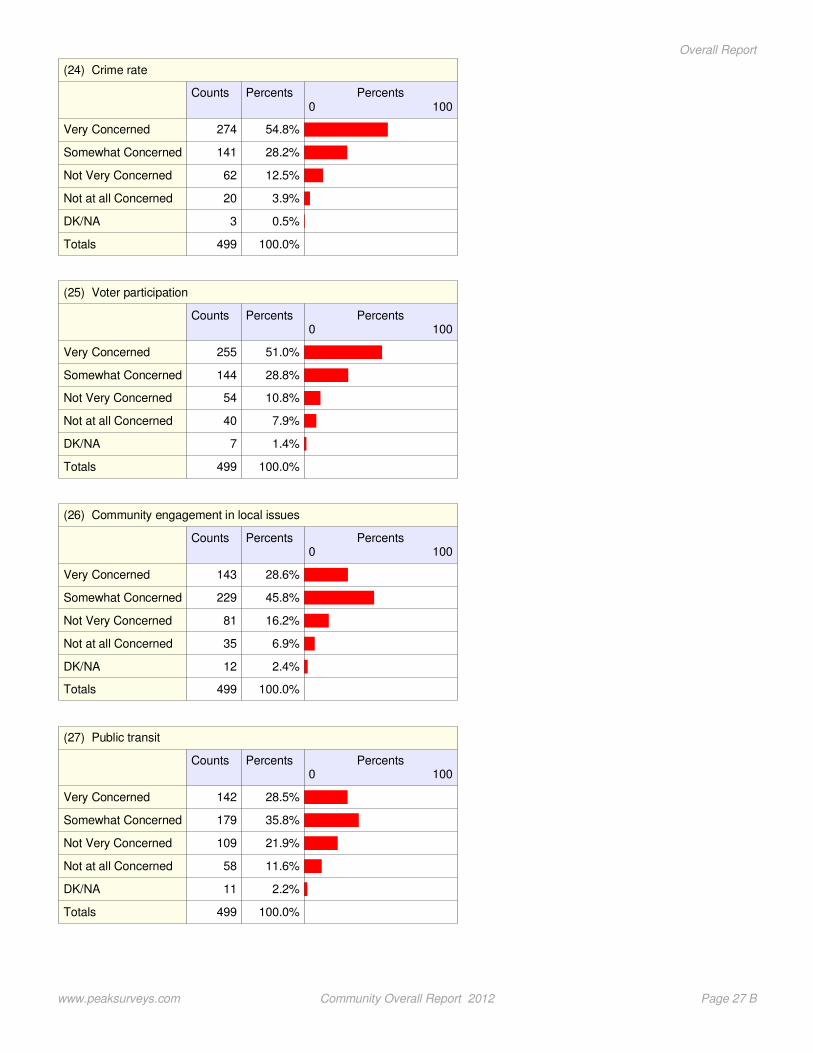
(24) Crime rate
Counts Percents Percents0 100
Very Concerned 274 54.8%
Somewhat Concerned 141 28.2%
Not Very Concerned 62 12.5%
Not at all Concerned 20 3.9%
DK/NA 3 0.5%
Totals 499 100.0%
(25) Voter participation
Counts Percents Percents0 100
Very Concerned 255 51.0%
Somewhat Concerned 144 28.8%
Not Very Concerned 54 10.8%
Not at all Concerned 40 7.9%
DK/NA 7 1.4%
Totals 499 100.0%
(26) Community engagement in local issues
Counts Percents Percents0 100
Very Concerned 143 28.6%
Somewhat Concerned 229 45.8%
Not Very Concerned 81 16.2%
Not at all Concerned 35 6.9%
DK/NA 12 2.4%
Totals 499 100.0%
(27) Public transit
Counts Percents Percents0 100
Very Concerned 142 28.5%
Somewhat Concerned 179 35.8%
Not Very Concerned 109 21.9%
Not at all Concerned 58 11.6%
DK/NA 11 2.2%
Totals 499 100.0%
www.peaksurveys.com Community Overall Report 2012 Page 27 B
Overall Report
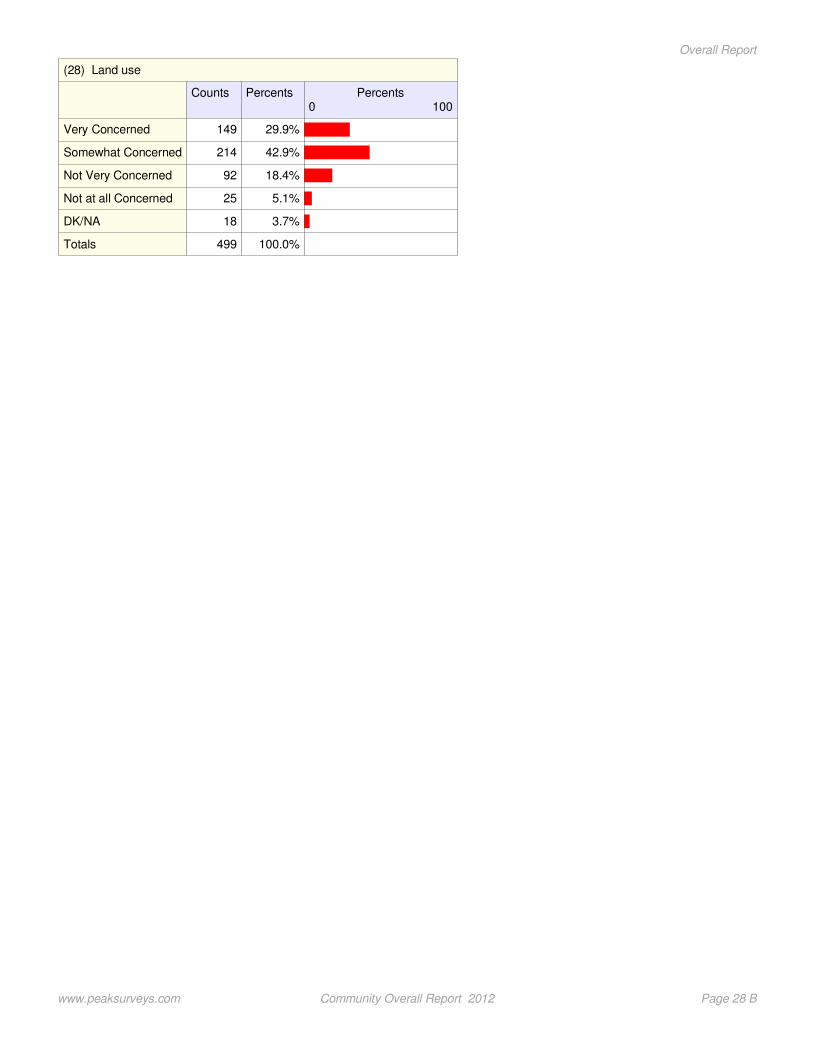
(28) Land use
Counts Percents Percents0 100
Very Concerned 149 29.9%
Somewhat Concerned 214 42.9%
Not Very Concerned 92 18.4%
Not at all Concerned 25 5.1%
DK/NA 18 3.7%
Totals 499 100.0%
www.peaksurveys.com Community Overall Report 2012 Page 28 B
Overall Report

For the following questions (12 through 28) the respondents were asked how concerned they arewith each issue. Collapse to Concerned and Not Concerned
93.1% 6.6% 0.3% 100.0%
80.1% 19.3% 0.5% 100.0%
73.2% 24.5% 2.3% 100.0%
76.0% 23.0% 1.0% 100.0%
92.1% 7.8% 0.1% 100.0%
82.1% 17.2% 0.6% 100.0%
81.9% 15.1% 3.0% 100.0%
83.5% 14.7% 1.8% 100.0%
66.9% 31.2% 1.9% 100.0%
72.3% 25.5% 2.2% 100.0%
85.9% 13.0% 1.1% 100.0%
53.6% 45.4% 1.0% 100.0%
83.1% 16.4% 0.5% 100.0%
79.9% 18.7% 1.4% 100.0%
74.4% 23.2% 2.4% 100.0%
64.3% 33.5% 2.2% 100.0%
72.8% 23.5% 3.7% 100.0%
Level of Concern aboutIssues
Employment and jobs
Drugs and alcohol
Growth
Affordable housing
Health care costs
Water supply andquality
Effective communityleadership
Services for thehomeless
Access to mentalhealth care
Access to qualityearly childhoodeducation
Student Achievement
Arts and cultureopportunities
Crime rate
Voter participation
Communityengagement in localissues
Public transit
Land use
Concerned/SomewhatConcerned
Frequencies:
Not Concerned/ NotVery Concerned
DK/NA Totals
www.peaksurveys.com Community Overall Report 2012 Page 29 B
Overall Report

Concern of Respondents Descending in order of Mean(Most Concerned to lowest concern)
3.64
3.57
3.36
3.35
3.29
3.29
3.27
3.25
3.21
3.11
3.04
3.01
3.00
2.98
2.91
2.83
2.58
Level of Concern aboutIssues
Employment and jobs
Health care costs
Student Achievement
Crime rate
Water supply andquality
Effective communityleadership
Drugs and alcohol
Voter participation
Services for thehomeless
Affordable housing
Access to qualityearly childhoodeducation
Land use
Growth
Communityengagement in localissues
Access to mentalhealth care
Public transit
Arts and cultureopportunities
Mean
Frequencies:
www.peaksurveys.com Community Overall Report 2012 Page 30 B
Overall Report

Section B
overall reportquality of life
Peak Surveys
www.peaksurveys.com
Community and QLI Survey 2012
Overall Report
Economic Vision
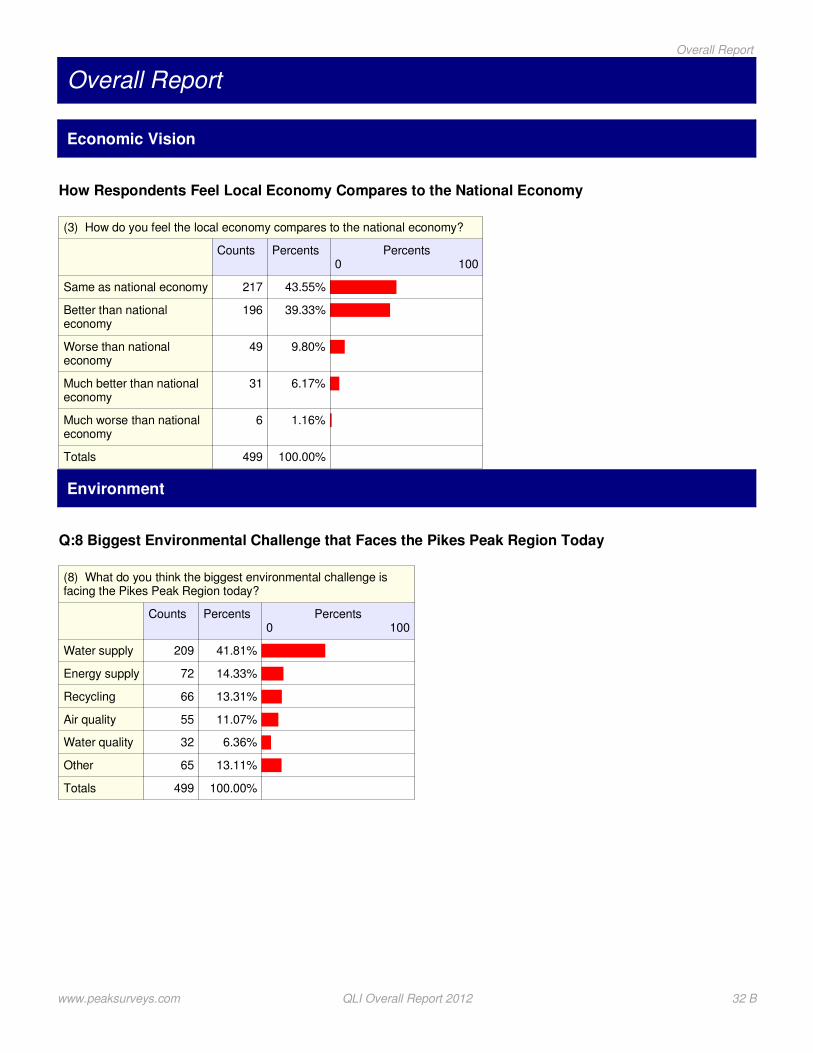
How Respondents Feel Local Economy Compares to the National Economy
(3) How do you feel the local economy compares to the national economy?
Counts Percents Percents0 100
Same as national economy 217 43.55%
Better than nationaleconomy
196 39.33%
Worse than nationaleconomy
49 9.80%
Much better than nationaleconomy
31 6.17%
Much worse than nationaleconomy
6 1.16%
Totals 499 100.00%
Environment
Q:8 Biggest Environmental Challenge that Faces the Pikes Peak Region Today
(8) What do you think the biggest environmental challenge isfacing the Pikes Peak Region today?
Counts Percents Percents0 100
Water supply 209 41.81%
Energy supply 72 14.33%
Recycling 66 13.31%
Air quality 55 11.07%
Water quality 32 6.36%
Other 65 13.11%
Totals 499 100.00%
www.peaksurveys.com QLI Overall Report 2012 32 B
Overall Report

Arts and Culture
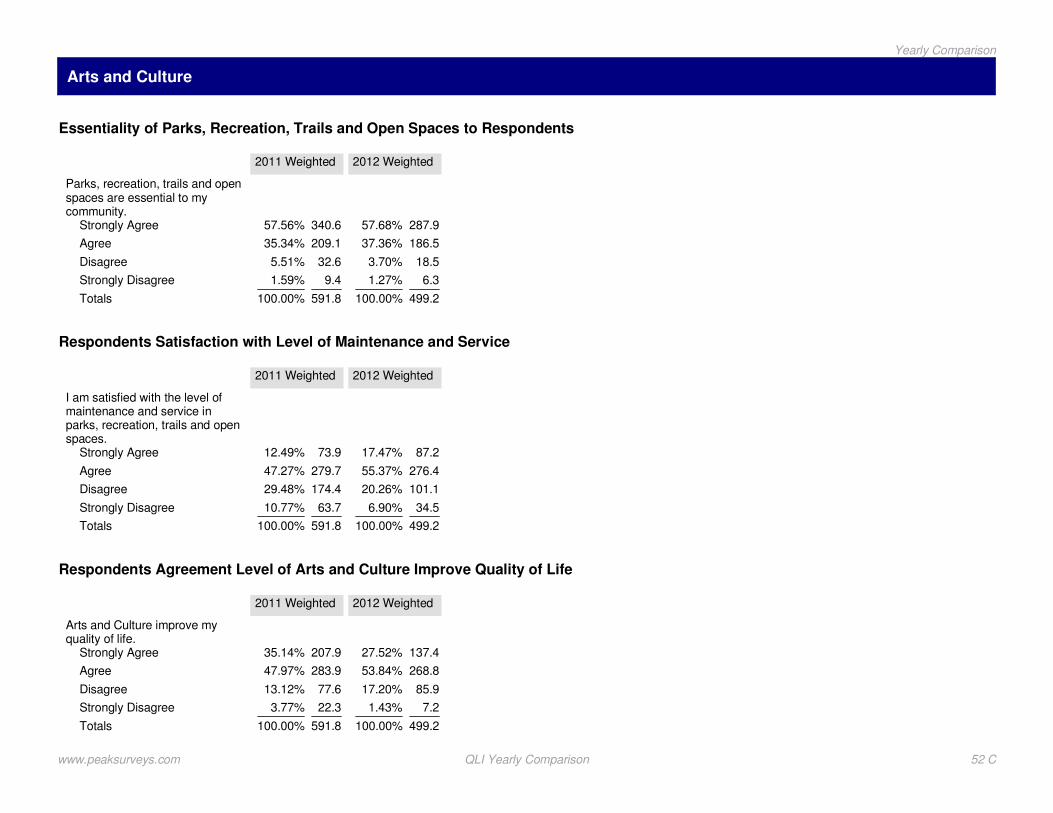
Essentiality of Parks, Recreation, Trails and Open Spaces to Respondents
Parks, recreation, trails and open spaces are essential to mycommunity.
Counts Percents Percents0 100
Strongly Agree 288 57.68%
Agree 186 37.36%
Disagree 18 3.70%
Strongly Disagree 6 1.27%
Totals 499 100.00%
Mean 3.514
Respondents Satisfaction with Level of Maintenance and Service
I am satisfied with the level of maintenance and service in parks,recreation, trails and open spaces.
Counts Percents Percents0 100
Strongly Agree 87 17.47%
Agree 276 55.37%
Disagree 101 20.26%
Strongly Disagree 34 6.90%
Totals 499 100.00%
Mean 2.834
Respondents Agreement Level of Arts and Culture Improve Quality of Life
Arts and Culture improve my quality of life.
Counts Percents Percents0 100
Strongly Agree 137 27.52%
Agree 269 53.84%
Disagree 86 17.20%
Strongly Disagree 7 1.43%
Totals 499 100.00%
Mean 3.075
www.peaksurveys.com QLI Overall Report 2012 33 B
Overall Report

Why Respondent Believes it Improves the Quality of Their Life
Why do you believe it improves the quality of your life?
Counts Percents Percents0 100
Enriches Life 75 18.55%
Exposure / Growth 56 13.87%
Exposure to New Cultures 47 11.58%
Better Educated / OpenMind
44 10.80%
Artist / Musician 36 8.89%
Entertaining 33 8.04%
Something To Do 28 6.96%
Experience Something New 24 6.03%
Don't Know/refused 21 5.14%
Recreation 15 3.60%
Nothing / none 12 3.08%
Spiritual / Relaxing 11 2.63%
Other 3 0.85%
Totals 405 100.00%
Why Respondent Believes it Does Not Improve the Quality of Their Life
Why do you believe it does not improve the quality of your life?
Counts Percents Percents0 100
No Interest 34 38.86%
More Important Things ToDo
23 26.39%
No effect on my life 15 17.83%
Do not participate 5 6.13%
Other 5 5.95%
Don't Know/refused 3 3.86%
Other 1 0.98%
Totals 86 100.00%
www.peaksurveys.com QLI Overall Report 2012 34 B
Overall Report

Public Safety
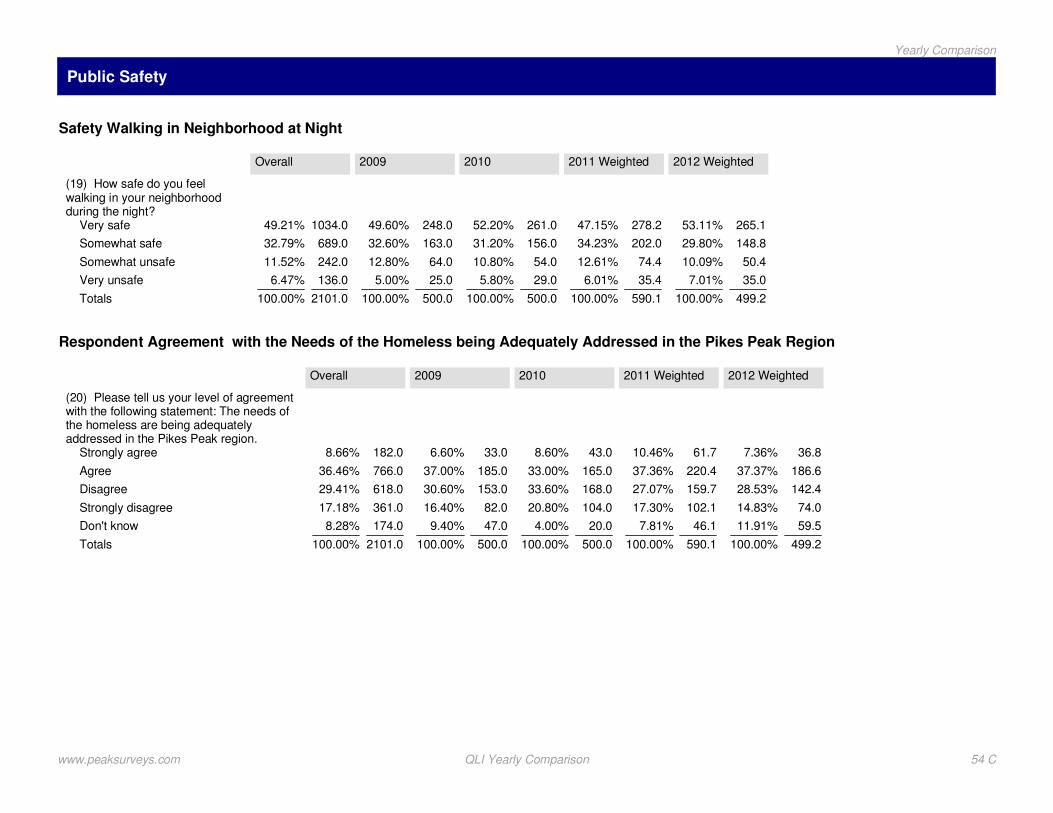
Safety Walking in Neighborhood at Night
(19) How safe do you feel walking in your neighborhood during thenight?
Counts Percents Percents0 100
Very safe 265 53.11%
Somewhat safe 149 29.80%
Somewhat unsafe 50 10.09%
Very unsafe 35 7.01%
Totals 499 100.00%
Respondent Agreement with the Needs of the Homeless being Adequately Addressed in the PikesPeak Region
(20) Please tell us your level of agreement with the followingstatement: The needs of the homeless are being adequatelyaddressed in the Pikes Peak region.
Counts Percents Percents0 100
Strongly agree 37 7.36%
Agree 187 37.37%
Disagree 142 28.53%
Strongly disagree 74 14.83%
Don't know 59 11.91%
Totals 499 100.00%
www.peaksurveys.com QLI Overall Report 2012 35 B
Overall Report
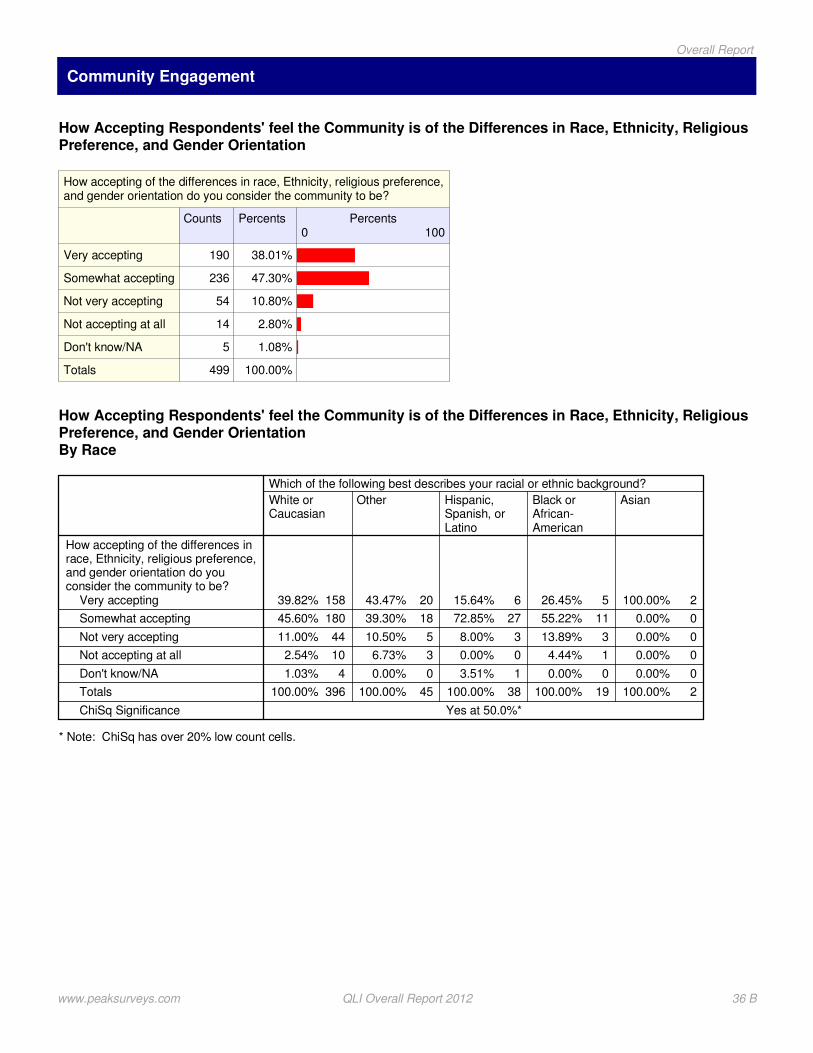
Community Engagement
How Accepting Respondents' feel the Community is of the Differences in Race, Ethnicity, ReligiousPreference, and Gender Orientation
How accepting of the differences in race, Ethnicity, religious preference,and gender orientation do you consider the community to be?
Counts Percents Percents0 100
Very accepting 190 38.01%
Somewhat accepting 236 47.30%
Not very accepting 54 10.80%
Not accepting at all 14 2.80%
Don't know/NA 5 1.08%
Totals 499 100.00%
* Note: ChiSq has over 20% low count cells.
How Accepting Respondents' feel the Community is of the Differences in Race, Ethnicity, ReligiousPreference, and Gender OrientationBy Race
How accepting of the differences inrace, Ethnicity, religious preference,and gender orientation do youconsider the community to be?
Very accepting
Somewhat accepting
Not very accepting
Not accepting at all
Don't know/NA
Totals
ChiSq Significance
White orCaucasian
Which of the following best describes your racial or ethnic background?
15839.82%
18045.60%
4411.00%
102.54%
41.03%
396100.00%
Yes at 50.0%*
Other
2043.47%
1839.30%
510.50%
36.73%
00.00%
45100.00%
Hispanic,Spanish, orLatino
615.64%
2772.85%
38.00%
00.00%
13.51%
38100.00%
Black orAfrican-American
526.45%
1155.22%
313.89%
14.44%
00.00%
19100.00%
Asian
2100.00%
00.00%
00.00%
00.00%
00.00%
2100.00%
www.peaksurveys.com QLI Overall Report 2012 36 B
Overall Report
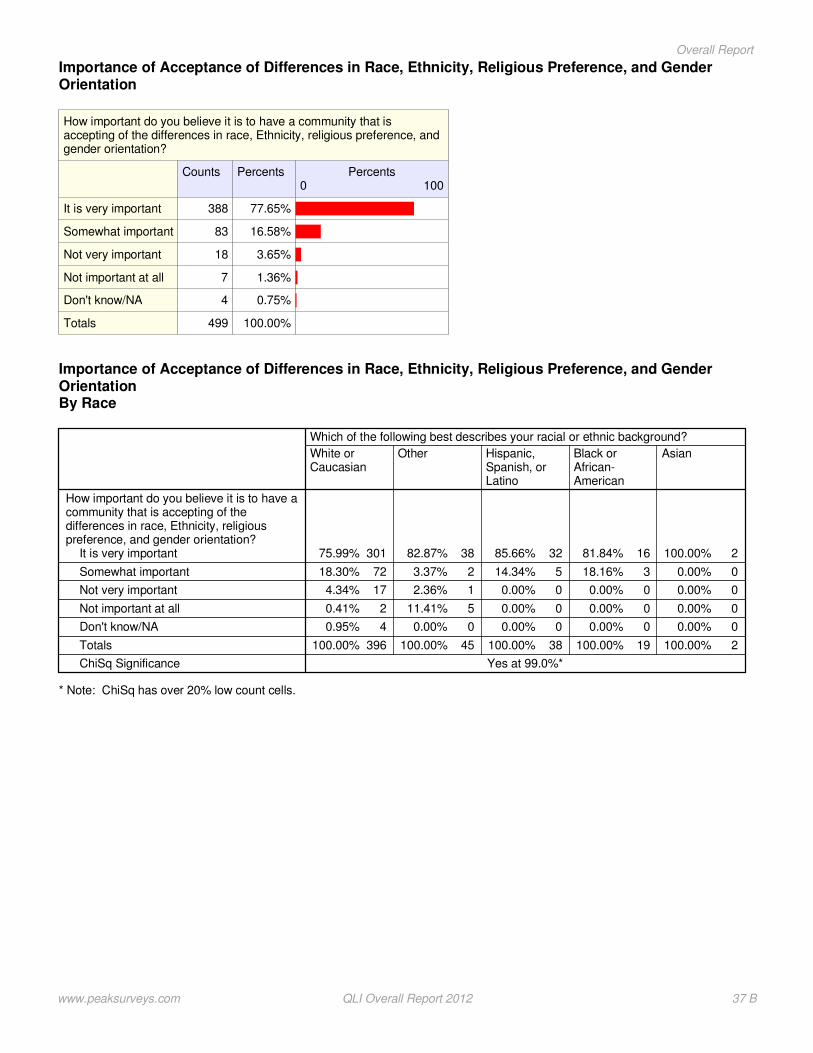
Importance of Acceptance of Differences in Race, Ethnicity, Religious Preference, and GenderOrientation
How important do you believe it is to have a community that isaccepting of the differences in race, Ethnicity, religious preference, andgender orientation?
Counts Percents Percents0 100
It is very important 388 77.65%
Somewhat important 83 16.58%
Not very important 18 3.65%
Not important at all 7 1.36%
Don't know/NA 4 0.75%
Totals 499 100.00%
* Note: ChiSq has over 20% low count cells.
Importance of Acceptance of Differences in Race, Ethnicity, Religious Preference, and GenderOrientationBy Race
How important do you believe it is to have acommunity that is accepting of thedifferences in race, Ethnicity, religiouspreference, and gender orientation?
It is very important
Somewhat important
Not very important
Not important at all
Don't know/NA
Totals
ChiSq Significance
White orCaucasian
Which of the following best describes your racial or ethnic background?
30175.99%
7218.30%
174.34%
20.41%
40.95%
396100.00%
Yes at 99.0%*
Other
3882.87%
23.37%
12.36%
511.41%
00.00%
45100.00%
Hispanic,Spanish, orLatino
3285.66%
514.34%
00.00%
00.00%
00.00%
38100.00%
Black orAfrican-American
1681.84%
318.16%
00.00%
00.00%
00.00%
19100.00%
Asian
2100.00%
00.00%
00.00%
00.00%
00.00%
2100.00%
www.peaksurveys.com QLI Overall Report 2012 37 B
Overall Report

Frequency of Charitable or Voluntary Service in the Last 12 Months
During the last 12 months how often did you or other members of yourhousehold spend on charitable or voluntary service activities?
Counts Percents Percents0 100
Several times a month 101 20.14%
Rarely 86 17.16%
Once a month 86 17.13%
Once or twice a quarter 85 17.02%
Never 71 14.31%
More than once a week 67 13.50%
Don't know/NA 4 0.73%
Totals 499 100.00%
Frequency of Donating Money or Property in the Last 12 Months
How often have you or other members of your household donatedmoney or property to charity in the last 12 months? By donating Imean making a voluntary contribution with no intention of makinga profi
Counts Percents Percents0 100
Monthly 189 37.88%
Occasionally 111 22.20%
Quarterly 98 19.62%
Weekly 72 14.46%
Never 27 5.41%
Don't know/NA 2 0.43%
Totals 499 100.00%
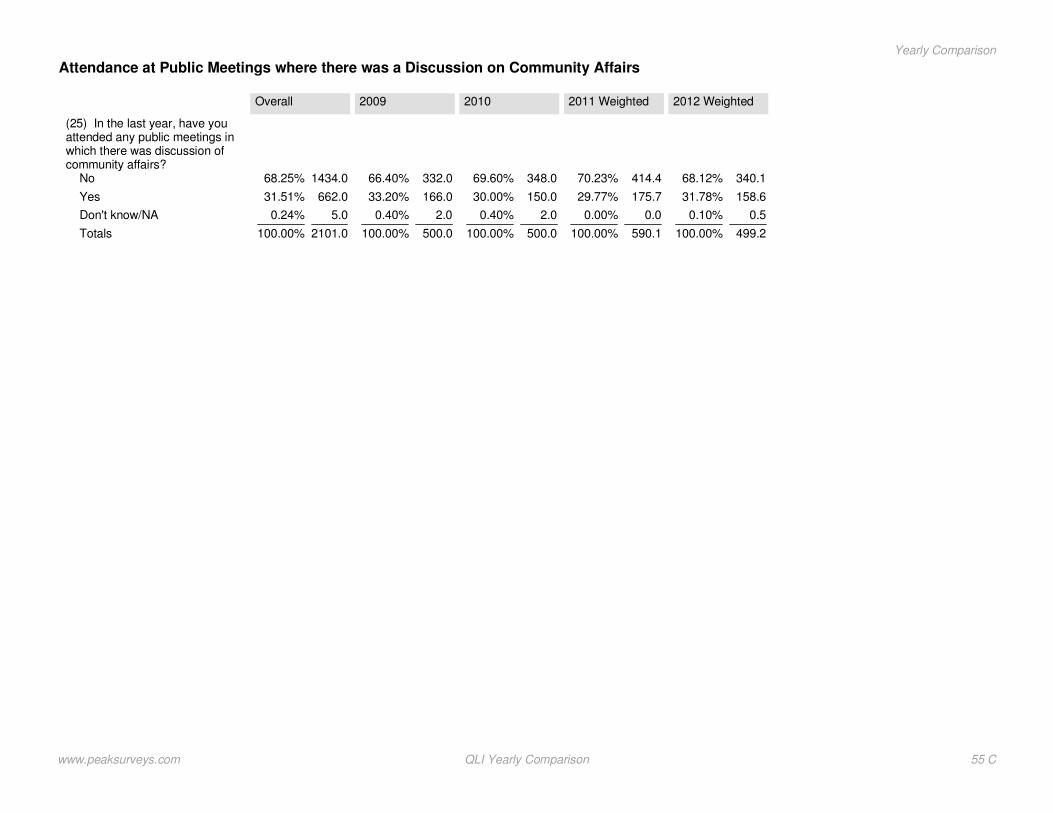
Attendance at Public Meetings where there was a Discussion on Community Affairs
(25) In the last year, have you attended any publicmeetings in which there was discussion of communityaffairs?
Counts Percents Percents0 100
No 340 68.12%
Yes 159 31.78%
Other 0 0.10%
Totals 499 100.00%
www.peaksurveys.com QLI Overall Report 2012 38 B
Overall Report
Section C
yearly comparisoncommunity survey
Peak Surveys
www.peaksurveys.com
Community and QLI Survey 2012

Yearly Comparison
Overall Quality of Life in the Community
34.4% 57.9% 4.3% 3.1% 0.4% 100.0%
28.0% 60.2% 8.2% 2.8% 0.8% 100.0%
2012
2010
Excellent
(1) Overall Quality of Life in the Community
Good Fair Poor DK/NA Totals
Community Headed in Right or Wrong Direction
67.9% 21.1% 11.0% 100.0%
51.0% 40.2% 8.8% 100.0%
2012
2010
RightDirection
(2) Community Headed in the Rightdirection or Wrong direction
WrongDirection
DK/NA Totals
Most Important Issue Facing the Community
(3) 2010 Most Important IssueFacing the Community
Economic problems
Employment / jobs
Schools / education
Crime
Taxes
Streets / roads / highways
Other
Totals
18.6%
12.8%
7.4%
6.4%
6.2%
5.8%
42.8%
100.0%
2012 Most Important IssueFacing the Community
Jobs / Unemployment
Economy
Don't know/NA/Refused
Crime
Education / schools
Budget / spending / finances
Other
Totals
2012 Weighted
89.117.8%
64.312.9%
52.410.5%
44.58.9%
42.38.5%
22.64.5%
184.136.9%
499.2100.0%
www.peaksurveys.com Community Survey Yearly Comparison Page 40 C
2006 31% 61% 5% 2% 1%2004 31% 60% 6% 2% 1% 2002 28% 63% 7% 2% 1%
2006 55% 25% 17%2002 70% 21% 9%
2002-2006 worded as "Right Direction", "Wrong Track"
Top 3 from Previous Surveys
2006 200221% Uncontrolled/exc.growth 14% Traffic 17% Traffic 9% Streets/roads/highways 8% Water Conservation 7% Schools/education
Yearly Comparison
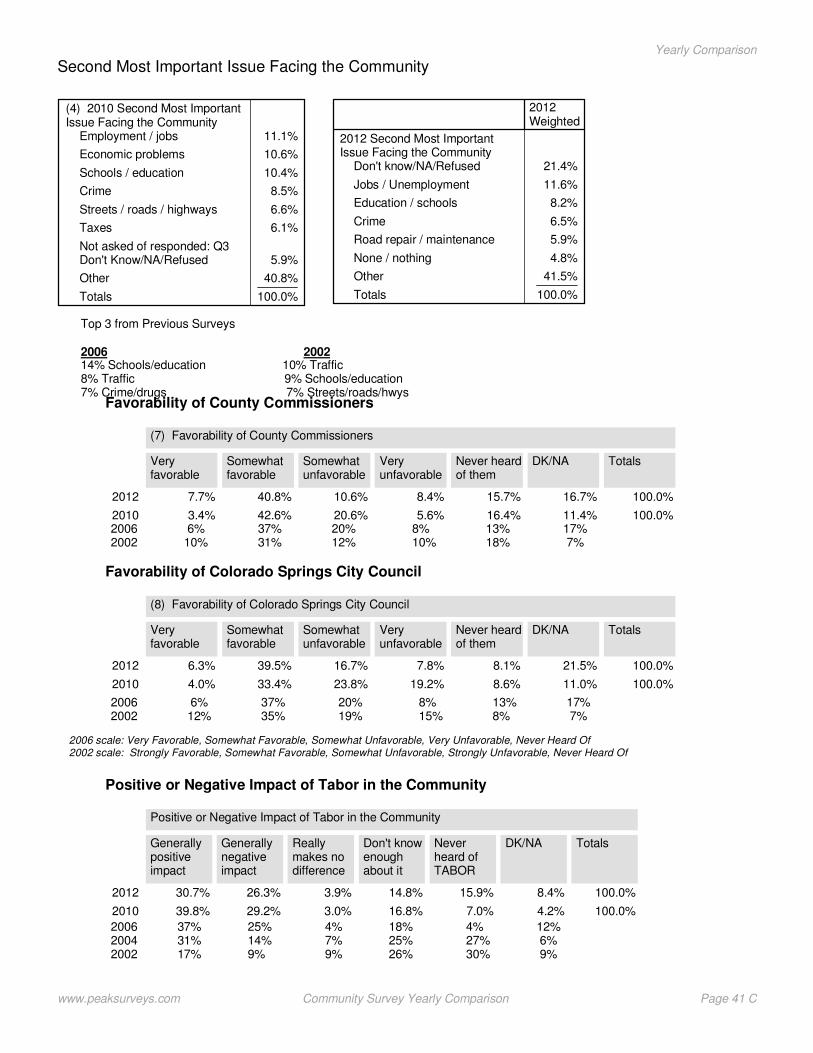
Second Most Important Issue Facing the Community
(4) 2010 Second Most ImportantIssue Facing the Community
Employment / jobs
Economic problems
Schools / education
Crime
Streets / roads / highways
Taxes
Not asked of responded: Q3Don't Know/NA/Refused
Other
Totals
11.1%
10.6%
10.4%
8.5%
6.6%
6.1%
5.9%
40.8%
100.0%
2012 Second Most ImportantIssue Facing the Community
Don't know/NA/Refused
Jobs / Unemployment
Education / schools
Crime
Road repair / maintenance
None / nothing
Other
Totals
2012Weighted
21.4%
11.6%
8.2%
6.5%
5.9%
4.8%
41.5%
100.0%
Favorability of County Commissioners
7.7% 40.8% 10.6% 8.4% 15.7% 16.7% 100.0%
3.4% 42.6% 20.6% 5.6% 16.4% 11.4% 100.0%
2012
2010
Veryfavorable
(7) Favorability of County Commissioners
Somewhatfavorable
Somewhatunfavorable
Veryunfavorable
Never heardof them
DK/NA Totals
Favorability of Colorado Springs City Council
6.3% 39.5% 16.7% 7.8% 8.1% 21.5% 100.0%
4.0% 33.4% 23.8% 19.2% 8.6% 11.0% 100.0%
2012
2010
Veryfavorable
(8) Favorability of Colorado Springs City Council
Somewhatfavorable
Somewhatunfavorable
Veryunfavorable
Never heardof them
DK/NA Totals
Positive or Negative Impact of Tabor in the Community
30.7% 26.3% 3.9% 14.8% 15.9% 8.4% 100.0%
39.8% 29.2% 3.0% 16.8% 7.0% 4.2% 100.0%
2012
2010
Generallypositiveimpact
Positive or Negative Impact of Tabor in the Community
Generallynegativeimpact
Reallymakes nodifference
Don't knowenoughabout it
Neverheard ofTABOR
DK/NA Totals
www.peaksurveys.com Community Survey Yearly Comparison Page 41 C
Top 3 from Previous Surveys
2006 200214% Schools/education 10% Traffic 8% Traffic 9% Schools/education 7% Crime/drugs 7% Streets/roads/hwys
2006 6% 37% 20% 8% 13% 17%2002 10% 31% 12% 10% 18% 7%
2006 scale: Very Favorable, Somewhat Favorable, Somewhat Unfavorable, Very Unfavorable, Never Heard Of2002 scale: Strongly Favorable, Somewhat Favorable, Somewhat Unfavorable, Strongly Unfavorable, Never Heard Of
2006 6% 37% 20% 8% 13% 17%2002 12% 35% 19% 15% 8% 7%
2006 37% 25% 4% 18% 4% 12%2004 31% 14% 7% 25% 27% 6% 2002 17% 9% 9% 26% 30% 9%
Yearly Comparison

Primary Source of Information When Getting Involved or Volunteering
(5) Primary Source ofInformattion when gettingInvolved or Volunteering
Friends or Family
Newspaper
Church
Local TV News
Internet
Local Non- profit organizations
Other
DK/NA
Totals
2012
102.720.6%
46.59.3%
122.424.5%
63.712.8%
82.716.6%
39.77.9%
36.97.4%
4.60.9%
499.2100.0%
2010
84.016.8%
80.016.0%
98.019.6%
90.018.0%
63.012.6%
39.07.8%
36.07.2%
10.02.0%
500.0100.0%
Who Respondents Trust When Addressing Community Issues
(6) Who Respondents Trust toAddress Community Issues
Religious organizations
Nonprofit organizations
Local businesses
Someone else
Local government
DK/NA
Totals
2012
122.624.6%
117.423.5%
84.316.9%
81.216.3%
59.912.0%
33.86.8%
499.2100.0%
2010
136.027.2%
90.018.0%
93.018.6%
99.019.8%
49.09.8%
33.06.6%
500.0100.0%
Level of Concern - Growth
32.7% 40.6% 16.7% 7.8% 2.3% 100.0%
30.0% 39.6% 18.2% 11.6% 0.6% 100.0%
2012
2010
VeryConcerned
Growth
SomewhatConcerned
Not VeryConcerned
Not at allConcerned
DK/NA Totals
Level of Concern - Affordable Housing
42.4% 33.6% 14.7% 8.3% 1.0% 100.0%
35.8% 34.2% 19.4% 9.6% 1.0% 100.0%
2012
2010
VeryConcerned
(15) Affordable housing
SomewhatConcerned
Not VeryConcerned
Not at allConcerned
DK/NA Totals
www.peaksurveys.com Community Survey Yearly Comparison Page 42 C
2006 55% 30% 11% 4% 0% *asked "Growth & Development"
Yearly Comparison
2006 36% 38% 17% 8% 1%

Level of Concern - Health Care Costs
68.0% 24.2% 4.3% 3.4% 0.1% 100.0%
63.2% 20.8% 9.0% 6.4% 0.6% 100.0%
2012
2010
VeryConcerned
(16) Health care costs
SomewhatConcerned
Not VeryConcerned
Not at allConcerned
DK/NA Totals
Level of Concern - Effective Community Leadership
49.7% 32.1% 8.4% 6.7% 3.0% 100.0%
53.6% 32.6% 9.0% 4.0% 0.8% 100.0%
2012
2010
VeryConcerned
(18) Effective community leadership
SomewhatConcerned
Not VeryConcerned
Not at allConcerned
DK/NA Totals
Level of Concern -Service for Homeless
40.2% 43.3% 9.5% 5.2% 1.8% 100.0%
41.4% 42.2% 9.6% 6.2% 0.6% 100.0%
2012
2010
VeryConcerned
(19) Services for the homeless
SomewhatConcerned
Not VeryConcerned
Not at allConcerned
DK/NA Totals
Level of Concern - Access to Mental Health Care
36.1% 30.8% 18.0% 13.2% 1.9% 100.0%
34.6% 37.4% 16.8% 9.6% 1.6% 100.0%
2012
2010
VeryConcerned
(20) Access to mental health care
SomewhatConcerned
Not VeryConcerned
Not at allConcerned
DK/NA Totals
Level of Concern - Access to Early Childhood Education
39.2% 33.0% 15.4% 10.1% 2.2% 100.0%
46.4% 26.0% 15.2% 11.4% 1.0% 100.0%
2012
2010
VeryConcerned
(21) Access to quality early childhood education
SomewhatConcerned
Not VeryConcerned
Not at allConcerned
DK/NA Totals
www.peaksurveys.com Community Survey Yearly Comparison Page 43 C
2006 63% 21% 10% 5% 1%
2006 41% 36% 15% 4% 3%
Yearly Comparison

Level of Concern - Student Acheivement
53.1% 32.8% 8.2% 4.9% 1.1% 100.0%
48.8% 33.4% 12.2% 5.0% 0.6% 100.0%
2012
2010
VeryConcerned
(22) Student Achievement
SomewhatConcerned
Not VeryConcerned
Not at allConcerned
DK/NA Totals
Level of Concern - Arts and Culture Opportunities
21.2% 32.5% 28.1% 17.4% 1.0% 100.0%
18.0% 43.6% 23.6% 13.6% 1.2% 100.0%
2012
2010
VeryConcerned
(23) Arts and culture opportunities
SomewhatConcerned
Not VeryConcerned
Not at allConcerned
DK/NA Totals
Level of Concern - Crime Rate
54.8% 28.2% 12.5% 3.9% 0.5% 100.0%
57.0% 33.8% 7.2% 2.0% 0.0% 100.0%
2012
2010
VeryConcerned
(24) Crime rate
SomewhatConcerned
Not VeryConcerned
Not at allConcerned
DK/NA Totals
Level of Concern - Voter Participation
51.0% 28.8% 10.8% 7.9% 1.4% 100.0%
38.8% 37.6% 15.4% 7.4% 0.8% 100.0%
2012
2010
VeryConcerned
(25) Voter participation
SomewhatConcerned
Not VeryConcerned
Not at allConcerned
DK/NA Totals
Level of Concern - Community Engagement in Local Issues
28.6% 45.8% 16.2% 6.9% 2.4% 100.0%
31.6% 45.4% 14.8% 7.4% 0.8% 100.0%
2012
2010
VeryConcerned
(26) Community engagement in local issues
SomewhatConcerned
Not VeryConcerned
Not at allConcerned
DK/NA Totals
www.peaksurveys.com Community Survey Yearly Comparison Page 44 C
Yearly Comparison

2010 & 2012 Comparison of Concerns
Employment and jobsVery Concerned
Somewhat Concerned
Not Very Concerned
Not at all Concerned
DK/NA
Totals
Health care costsVery Concerned
Somewhat Concerned
Not Very Concerned
Not at all Concerned
DK/NA
Totals
Student AchievementVery Concerned
Somewhat Concerned
Not Very Concerned
Not at all Concerned
DK/NA
Totals
Crime rateVery Concerned
Somewhat Concerned
Not Very Concerned
Not at all Concerned
DK/NA
Totals
Water supply and qualityVery Concerned
Somewhat Concerned
Not Very Concerned
Not at all Concerned
DK/NA
Totals
Effective community leadershipVery Concerned
Somewhat Concerned
Not Very Concerned
Not at all Concerned
DK/NA
Totals
Drugs and alcoholVery Concerned
Somewhat Concerned
Not Very Concerned
Not at all Concerned
DK/NA
Totals
2012
71.9%
21.2%
5.0%
1.6%
0.3%
100.0%
68.0%
24.2%
4.3%
3.4%
0.1%
100.0%
53.1%
32.8%
8.2%
4.9%
1.1%
100.0%
54.8%
28.2%
12.5%
3.9%
0.5%
100.0%
52.3%
29.8%
10.9%
6.3%
0.6%
100.0%
49.7%
32.1%
8.4%
6.7%
3.0%
100.0%
51.1%
29.0%
14.5%
4.9%
0.5%
100.0%
2010
72.0%
20.4%
2.8%
4.6%
0.2%
100.0%
63.2%
20.8%
9.0%
6.4%
0.6%
100.0%
48.8%
33.4%
12.2%
5.0%
0.6%
100.0%
57.0%
33.8%
7.2%
2.0%
0.0%
100.0%
44.2%
33.8%
13.8%
7.8%
0.4%
100.0%
53.6%
32.6%
9.0%
4.0%
0.8%
100.0%
52.6%
32.0%
10.2%
5.0%
0.2%
100.0%
www.peaksurveys.com Community Survey Yearly Comparison Page 45 C
Yearly Comparison
Voter participationVery Concerned
Somewhat Concerned
Not Very Concerned
Not at all Concerned
DK/NA
Totals
Services for the homelessVery Concerned
Somewhat Concerned
Not Very Concerned
Not at all Concerned
DK/NA
Totals
Affordable housingVery Concerned
Somewhat Concerned
Not Very Concerned
Not at all Concerned
DK/NA
Totals
Access to quality early childhoodeducation
Very Concerned
Somewhat Concerned
Not Very Concerned
Not at all Concerned
DK/NA
Totals
Land useVery Concerned
Somewhat Concerned
Not Very Concerned
Not at all Concerned
DK/NA
Totals
GrowthVery Concerned
Somewhat Concerned
Not Very Concerned
Not at all Concerned
DK/NA
Totals
Community engagement in localissues
Very Concerned
Somewhat Concerned
Not Very Concerned
Not at all Concerned
DK/NA
Totals
2012
51.0%
28.8%
10.8%
7.9%
1.4%
100.0%
40.2%
43.3%
9.5%
5.2%
1.8%
100.0%
42.4%
33.6%
14.7%
8.3%
1.0%
100.0%
39.2%
33.0%
15.4%
10.1%
2.2%
100.0%
29.9%
42.9%
18.4%
5.1%
3.7%
100.0%
32.7%
40.6%
16.7%
7.8%
2.3%
100.0%
28.6%
45.8%
16.2%
6.9%
2.4%
100.0%
2010
38.8%
37.6%
15.4%
7.4%
0.8%
100.0%
41.4%
42.2%
9.6%
6.2%
0.6%
100.0%
35.8%
34.2%
19.4%
9.6%
1.0%
100.0%
46.4%
26.0%
15.2%
11.4%
1.0%
100.0%
%
30.0%
39.6%
18.2%
11.6%
0.6%
100.0%
31.6%
45.4%
14.8%
7.4%
0.8%
100.0%
www.peaksurveys.com Community Survey Yearly Comparison Page 46 C
Yearly Comparison

Access to mental health careVery Concerned
Somewhat Concerned
Not Very Concerned
Not at all Concerned
DK/NA
Totals
Public transitVery Concerned
Somewhat Concerned
Not Very Concerned
Not at all Concerned
DK/NA
Totals
Arts and culture opportunitiesVery Concerned
Somewhat Concerned
Not Very Concerned
Not at all Concerned
DK/NA
Totals
2012
36.1%
30.8%
18.0%
13.2%
1.9%
100.0%
28.5%
35.8%
21.9%
11.6%
2.2%
100.0%
21.2%
32.5%
28.1%
17.4%
1.0%
100.0%
2010
34.6%
37.4%
16.8%
9.6%
1.6%
100.0%
%
18.0%
43.6%
23.6%
13.6%
1.2%
100.0%
2010 & 2012 Comparison of Concerns
Level of Concern about IssuesMean
Employment and jobs
Health care costs
Student Achievement
Crime rate
Water supply and quality
Effective communityleadership
Drugs and alcohol
Voter participation
Services for the homeless
Affordable housing
Access to quality earlychildhood education
Land use
Growth
Community engagement inlocal issues
Access to mental health care
Public transit
Arts and culture opportunities
2012
3.64
3.57
3.36
3.35
3.29
3.29
3.27
3.25
3.21
3.11
3.04
3.01
3.00
2.98
2.91
2.83
2.58
2010
3.60
3.42
3.27
3.46
3.15
3.37
3.32
3.09
3.20
2.97
3.08
-
2.89
3.02
2.99
-
2.67
www.peaksurveys.com Community Survey Yearly Comparison Page 47 C
Yearly Comparison

www.peaksurveys.com Community Survey Yearly Comparison Page 48 C
Yearly Comparison
Section C
yearly comparisonquality of life
Peak Surveys
www.peaksurveys.com
Community and QLI Survey 2012
Yearly Comparison
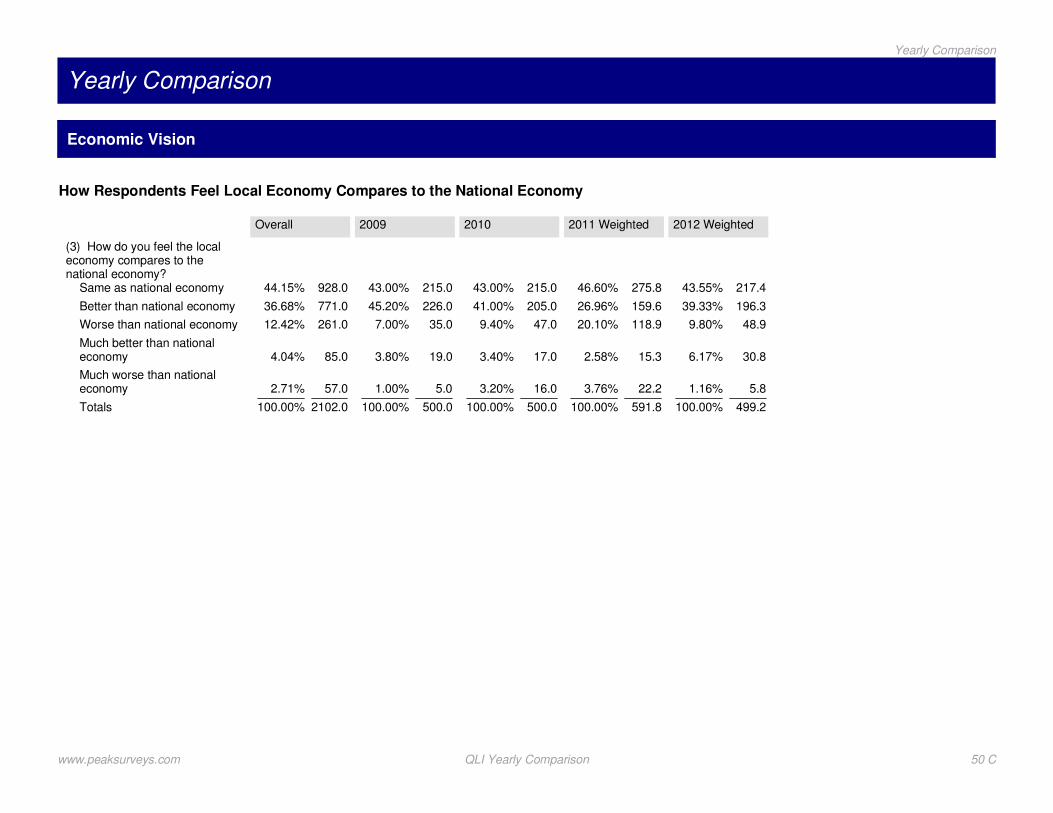
Economic Vision
How Respondents Feel Local Economy Compares to the National Economy
(3) How do you feel the localeconomy compares to thenational economy?
Same as national economy
Better than national economy
Worse than national economy
Much better than nationaleconomy
Much worse than nationaleconomy
Totals
Overall
928.044.15%
771.036.68%
261.012.42%
85.04.04%
57.02.71%
2102.0100.00%
2009
215.043.00%
226.045.20%
35.07.00%
19.03.80%
5.01.00%
500.0100.00%
2010
215.043.00%
205.041.00%
47.09.40%
17.03.40%
16.03.20%
500.0100.00%
2011 Weighted
275.846.60%
159.626.96%
118.920.10%
15.32.58%
22.23.76%
591.8100.00%
2012 Weighted
217.443.55%
196.339.33%
48.99.80%
30.86.17%
5.81.16%
499.2100.00%
www.peaksurveys.com QLI Yearly Comparison 50 C
Yearly Comparison
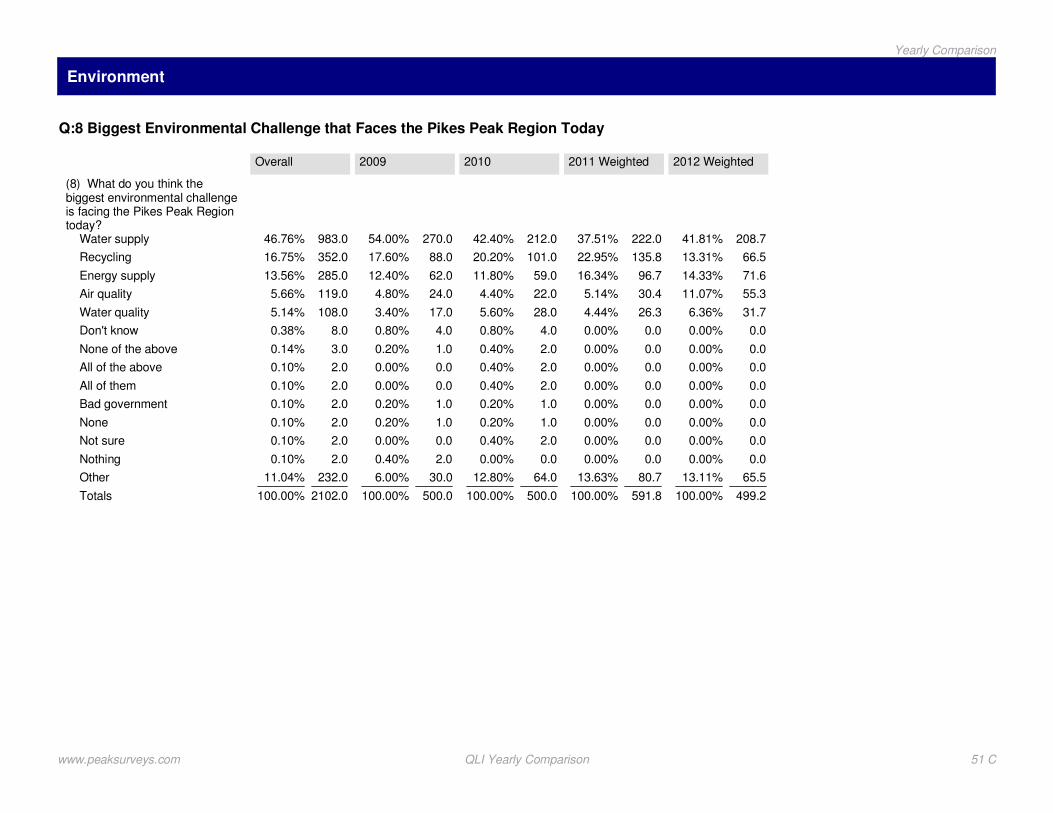
Environment
Q:8 Biggest Environmental Challenge that Faces the Pikes Peak Region Today
(8) What do you think thebiggest environmental challengeis facing the Pikes Peak Regiontoday?
Water supply
Recycling
Energy supply
Air quality
Water quality
Don't know
None of the above
All of the above
All of them
Bad government
None
Not sure
Nothing
Other
Totals
Overall
983.046.76%
352.016.75%
285.013.56%
119.05.66%
108.05.14%
8.00.38%
3.00.14%
2.00.10%
2.00.10%
2.00.10%
2.00.10%
2.00.10%
2.00.10%
232.011.04%
2102.0100.00%
2009
270.054.00%
88.017.60%
62.012.40%
24.04.80%
17.03.40%
4.00.80%
1.00.20%
0.00.00%
0.00.00%
1.00.20%
1.00.20%
0.00.00%
2.00.40%
30.06.00%
500.0100.00%
2010
212.042.40%
101.020.20%
59.011.80%
22.04.40%
28.05.60%
4.00.80%
2.00.40%
2.00.40%
2.00.40%
1.00.20%
1.00.20%
2.00.40%
0.00.00%
64.012.80%
500.0100.00%
2011 Weighted
222.037.51%
135.822.95%
96.716.34%
30.45.14%
26.34.44%
0.00.00%
0.00.00%
0.00.00%
0.00.00%
0.00.00%
0.00.00%
0.00.00%
0.00.00%
80.713.63%
591.8100.00%
2012 Weighted
208.741.81%
66.513.31%
71.614.33%
55.311.07%
31.76.36%
0.00.00%
0.00.00%
0.00.00%
0.00.00%
0.00.00%
0.00.00%
0.00.00%
0.00.00%
65.513.11%
499.2100.00%
www.peaksurveys.com QLI Yearly Comparison 51 C
Yearly Comparison
Arts and Culture
Essentiality of Parks, Recreation, Trails and Open Spaces to Respondents
Parks, recreation, trails and openspaces are essential to mycommunity.
Strongly Agree
Agree
Disagree
Strongly Disagree
Totals
2011 Weighted
340.657.56%
209.135.34%
32.65.51%
9.41.59%
591.8100.00%
2012 Weighted
287.957.68%
186.537.36%
18.53.70%
6.31.27%
499.2100.00%
Respondents Satisfaction with Level of Maintenance and Service
I am satisfied with the level ofmaintenance and service inparks, recreation, trails and openspaces.
Strongly Agree
Agree
Disagree
Strongly Disagree
Totals
2011 Weighted
73.912.49%
279.747.27%
174.429.48%
63.710.77%
591.8100.00%
2012 Weighted
87.217.47%
276.455.37%
101.120.26%
34.56.90%
499.2100.00%
Respondents Agreement Level of Arts and Culture Improve Quality of Life
Arts and Culture improve myquality of life.
Strongly Agree
Agree
Disagree
Strongly Disagree
Totals
2011 Weighted
207.935.14%
283.947.97%
77.613.12%
22.33.77%
591.8100.00%
2012 Weighted
137.427.52%
268.853.84%
85.917.20%
7.21.43%
499.2100.00%
www.peaksurveys.com QLI Yearly Comparison 52 C
Yearly Comparison
Reasons Respondents Agree on Arts and Culture Improve Quality of Life
Why do you believe it improves thequality of your life?
Spiritual / Relaxing
Entertaining
Exposure / Growth
Enriches Life
Something To Do
Better Educated / Open Mind
Experience Something New
Exposure to New Cultures
Recreation
Artist / Musician
Nothing / none
Other
Don't Know/refused
Totals
2011 Weighted
35.17.13%
36.97.50%
59.412.07%
120.624.52%
29.35.95%
52.610.70%
50.410.26%
38.07.72%
7.81.58%
10.42.12%
0.00.00%
31.86.47%
19.63.98%
491.8100.00%
2012 Weighted
10.72.63%
32.68.04%
56.213.87%
75.118.55%
28.26.96%
43.810.80%
24.46.03%
46.911.58%
14.63.60%
36.08.89%
12.53.08%
3.40.85%
20.85.14%
405.1100.00%
Why Respondent Believes it Does Not Improve the Quality of Their Life
Why do you believe it does notimprove the quality of your life?
No Interest
More Important Things To Do
No effect on my life
Do not participate
Other
Don't Know/refused
Other
Totals
2011 Weighted
60.560.22%
4.74.63%
0.00.00%
0.00.00%
23.623.50%
8.88.72%
2.92.93%
100.5100.00%
2012 Weighted
33.538.86%
22.726.39%
15.417.83%
5.36.13%
5.15.95%
3.33.86%
0.80.98%
86.2100.00%
www.peaksurveys.com QLI Yearly Comparison 53 C
Yearly Comparison
Public Safety
Safety Walking in Neighborhood at Night
(19) How safe do you feelwalking in your neighborhoodduring the night?
Very safe
Somewhat safe
Somewhat unsafe
Very unsafe
Totals
Overall
1034.049.21%
689.032.79%
242.011.52%
136.06.47%
2101.0100.00%
2009
248.049.60%
163.032.60%
64.012.80%
25.05.00%
500.0100.00%
2010
261.052.20%
156.031.20%
54.010.80%
29.05.80%
500.0100.00%
2011 Weighted
278.247.15%
202.034.23%
74.412.61%
35.46.01%
590.1100.00%
2012 Weighted
265.153.11%
148.829.80%
50.410.09%
35.07.01%
499.2100.00%
Respondent Agreement with the Needs of the Homeless being Adequately Addressed in the Pikes Peak Region
(20) Please tell us your level of agreementwith the following statement: The needs ofthe homeless are being adequatelyaddressed in the Pikes Peak region.
Strongly agree
Agree
Disagree
Strongly disagree
Don't know
Totals
Overall
182.08.66%
766.036.46%
618.029.41%
361.017.18%
174.08.28%
2101.0100.00%
2009
33.06.60%
185.037.00%
153.030.60%
82.016.40%
47.09.40%
500.0100.00%
2010
43.08.60%
165.033.00%
168.033.60%
104.020.80%
20.04.00%
500.0100.00%
2011 Weighted
61.710.46%
220.437.36%
159.727.07%
102.117.30%
46.17.81%
590.1100.00%
2012 Weighted
36.87.36%
186.637.37%
142.428.53%
74.014.83%
59.511.91%
499.2100.00%
www.peaksurveys.com QLI Yearly Comparison 54 C
Yearly Comparison
Attendance at Public Meetings where there was a Discussion on Community Affairs
(25) In the last year, have youattended any public meetings inwhich there was discussion ofcommunity affairs?
No
Yes
Don't know/NA
Totals
Overall
1434.068.25%
662.031.51%
5.00.24%
2101.0100.00%
2009
332.066.40%
166.033.20%
2.00.40%
500.0100.00%
2010
348.069.60%
150.030.00%
2.00.40%
500.0100.00%
2011 Weighted
414.470.23%
175.729.77%
0.00.00%
590.1100.00%
2012 Weighted
340.168.12%
158.631.78%
0.50.10%
499.2100.00%
www.peaksurveys.com QLI Yearly Comparison 55 C
Yearly Comparison

www.peaksurveys.com QLI Yearly Comparison 56 C
Yearly Comparison

www.peaksurveys.com QLI Yearly Comparison 57 C
Yearly Comparison

www.peaksurveys.com QLI Yearly Comparison 58 C
Yearly Comparison

Section D
household incomecommunity survey
Peak Surveys
www.peaksurveys.com
Community and QLI Survey 2012
Household Income
* Note: ChiSq has over 20% low count cells.
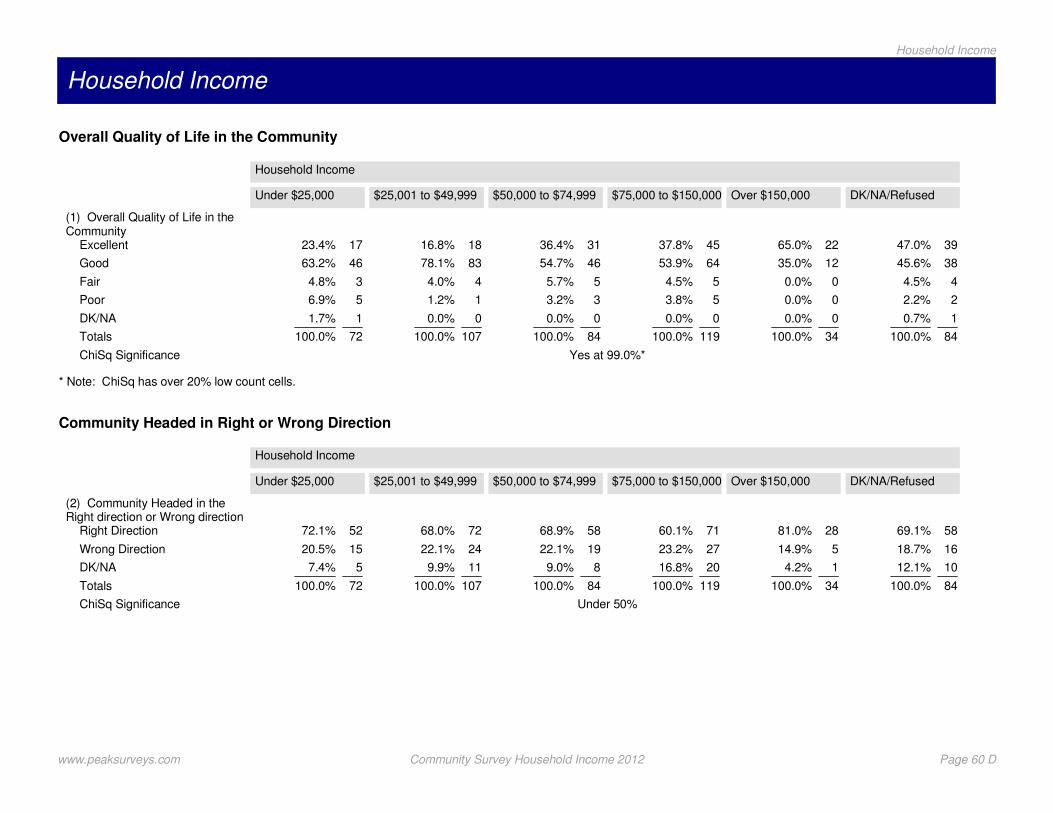
Overall Quality of Life in the Community
(1) Overall Quality of Life in theCommunity
Excellent
Good
Fair
Poor
DK/NA
Totals
ChiSq Significance
Under $25,000
Household Income
1723.4%
4663.2%
34.8%
56.9%
11.7%
72100.0%
Yes at 99.0%*
$25,001 to $49,999
1816.8%
8378.1%
44.0%
11.2%
00.0%
107100.0%
$50,000 to $74,999
3136.4%
4654.7%
55.7%
33.2%
00.0%
84100.0%
$75,000 to $150,000
4537.8%
6453.9%
54.5%
53.8%
00.0%
119100.0%
Over $150,000
2265.0%
1235.0%
00.0%
00.0%
00.0%
34100.0%
DK/NA/Refused
3947.0%
3845.6%
44.5%
22.2%
10.7%
84100.0%
Community Headed in Right or Wrong Direction
(2) Community Headed in theRight direction or Wrong direction
Right Direction
Wrong Direction
DK/NA
Totals
ChiSq Significance
Under $25,000
Household Income
5272.1%
1520.5%
57.4%
72100.0%
Under 50%
$25,001 to $49,999
7268.0%
2422.1%
119.9%
107100.0%
$50,000 to $74,999
5868.9%
1922.1%
89.0%
84100.0%
$75,000 to $150,000
7160.1%
2723.2%
2016.8%
119100.0%
Over $150,000
2881.0%
514.9%
14.2%
34100.0%
DK/NA/Refused
5869.1%
1618.7%
1012.1%
84100.0%
www.peaksurveys.com Community Survey Household Income 2012 Page 60 D
Household Income

* Note: ChiSq has over 20% low count cells.
Most Important Issue Facing the Community
2012 Most Important IssueFacing the Community
Jobs / Unemployment
Economy
Don't know/NA/Refused
Crime
Education / schools
Budget / spending / finances
Presidential election
Growth and development
Child safety / safety
Environment
Homeless
Taxes
Traffic / transportation
Funding for emergencyservices (law enforcement/fire)
Water issues
Road repair / maintenance
Government
Healthcare
None / nothing
Military
Infrastructure
Housing
Other
Totals
ChiSq Significance
Under $25,000
Household Income
1824.8%
45.7%
1014.0%
710.0%
1014.2%
00.0%
00.0%
00.6%
22.2%
56.8%
34.6%
33.6%
33.7%
00.0%
00.0%
00.0%
11.5%
11.7%
00.0%
11.1%
00.0%
00.6%
44.9%
72100.0%
Yes at 99.0%*
$25,001 to $49,999
2624.1%
1413.6%
1312.0%
98.6%
10.9%
21.7%
87.2%
22.1%
33.3%
22.2%
87.7%
10.8%
32.5%
32.4%
32.4%
54.7%
21.6%
10.6%
11.2%
00.0%
00.0%
00.5%
00.0%
107100.0%
$50,000 to $74,999
911.0%
78.3%
911.0%
910.1%
1012.0%
45.2%
56.5%
77.9%
00.6%
00.0%
11.7%
33.0%
33.6%
22.0%
22.8%
11.5%
33.0%
33.9%
33.9%
11.6%
00.0%
00.0%
00.5%
84100.0%
$75,000 to $150,000
1714.5%
2117.9%
108.1%
86.9%
1411.5%
75.7%
21.5%
21.9%
00.0%
32.9%
10.7%
54.0%
53.9%
75.8%
54.1%
54.0%
10.7%
11.1%
00.0%
11.1%
21.8%
00.4%
21.7%
119100.0%
Over $150,000
720.6%
721.9%
13.8%
513.5%
37.8%
26.8%
01.3%
01.3%
00.0%
00.0%
00.0%
12.3%
00.0%
14.1%
01.4%
00.0%
37.4%
00.0%
00.0%
00.0%
13.8%
00.0%
13.8%
34100.0%
DK/NA/Refused
1214.5%
1011.9%
911.2%
78.1%
55.7%
78.8%
22.1%
56.0%
1011.4%
44.5%
00.6%
22.7%
10.7%
11.1%
11.7%
00.0%
00.0%
22.3%
11.4%
11.0%
00.0%
11.8%
22.5%
84100.0%
www.peaksurveys.com Community Survey Household Income 2012 Page 61 D
Household Income

* Note: ChiSq has over 20% low count cells.
Second Most Important Issue Facing the Community
2012 Second Most ImportantIssue Facing the Community
Don't know/NA/Refused
Jobs / Unemployment
Education / schools
Crime
Road repair / maintenance
None / nothing
Healthcare
Budget / spending / finances
Taxes
Economy
Homeless
Child safety / safety
Government
Environment
Water issues
Traffic / transportation
Funding for emergencyservices (law enforcement/fire)
Presidential election
Housing
Utilities
Growth and development
Military
Infrastructure
Other
Totals
ChiSq Significance
Under $25,000
Household Income
1825.0%
1115.3%
00.6%
34.6%
810.7%
45.7%
79.7%
00.6%
11.9%
11.7%
00.0%
11.9%
00.6%
22.8%
00.0%
00.6%
00.0%
00.0%
00.0%
00.0%
00.7%
11.8%
11.2%
1014.3%
72100.0%
Yes at 99.0%*
$25,001 to $49,999
3028.4%
98.9%
76.1%
98.5%
54.5%
54.4%
54.5%
32.8%
00.0%
22.1%
54.7%
32.6%
11.2%
32.4%
32.5%
33.2%
32.4%
32.4%
11.4%
21.6%
11.3%
00.4%
00.0%
43.7%
107100.0%
$50,000 to $74,999
1720.2%
911.2%
78.0%
34.1%
77.9%
22.9%
33.4%
33.6%
44.4%
11.5%
34.0%
11.0%
00.0%
33.6%
11.6%
11.8%
11.1%
33.3%
22.0%
10.9%
11.5%
11.0%
11.5%
89.3%
84100.0%
$75,000 to $150,000
1613.7%
1613.2%
1210.2%
119.3%
54.5%
32.9%
11.0%
97.4%
54.5%
54.0%
10.9%
75.5%
32.6%
10.7%
32.2%
54.1%
43.7%
00.0%
10.7%
11.1%
10.8%
21.4%
00.0%
75.7%
119100.0%
Over $150,000
719.8%
39.3%
00.0%
39.0%
00.0%
26.6%
12.3%
00.0%
37.9%
38.9%
26.3%
00.0%
25.1%
25.4%
26.6%
00.0%
00.0%
00.0%
00.0%
12.5%
12.3%
00.0%
00.0%
38.0%
34100.0%
DK/NA/Refused
1922.1%
911.3%
1518.2%
33.2%
55.8%
78.4%
22.0%
22.2%
22.5%
11.5%
11.0%
00.5%
56.1%
11.2%
22.6%
00.5%
11.6%
22.3%
33.6%
11.1%
00.5%
00.0%
00.5%
11.1%
84100.0%
www.peaksurveys.com Community Survey Household Income 2012 Page 62 D
Household Income
* Note: ChiSq has over 20% low count cells.
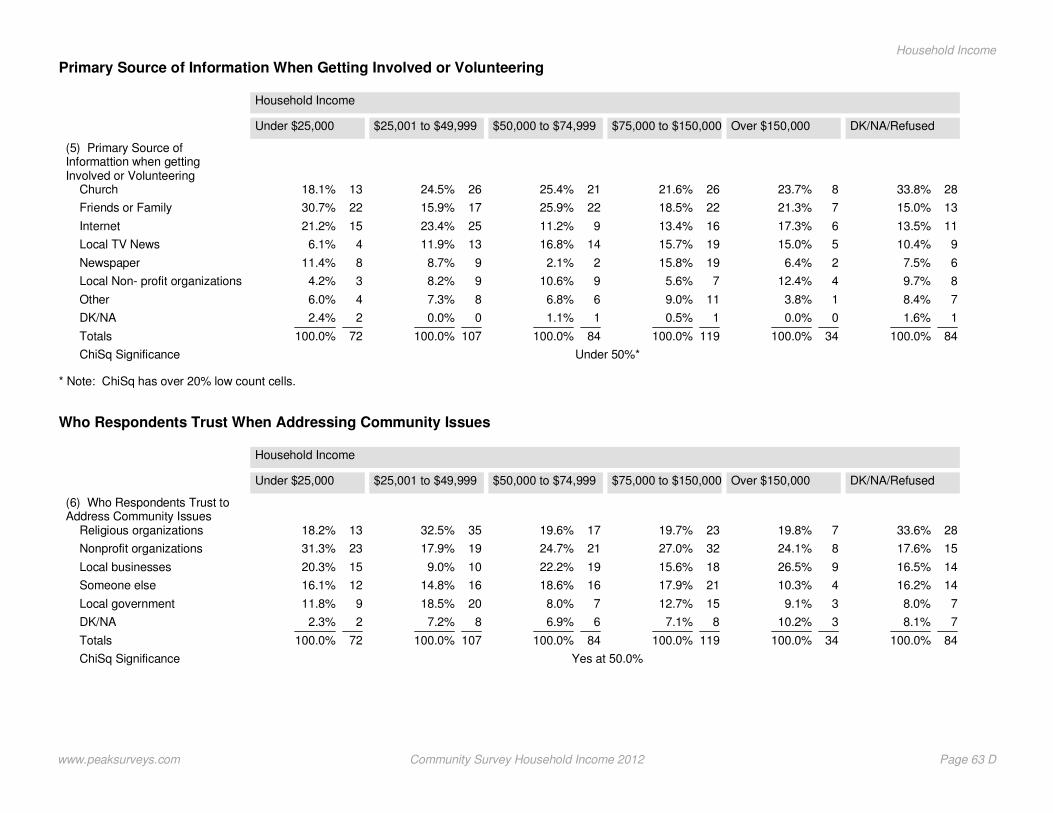
Primary Source of Information When Getting Involved or Volunteering
(5) Primary Source ofInformattion when gettingInvolved or Volunteering
Church
Friends or Family
Internet
Local TV News
Newspaper
Local Non- profit organizations
Other
DK/NA
Totals
ChiSq Significance
Under $25,000
Household Income
1318.1%
2230.7%
1521.2%
46.1%
811.4%
34.2%
46.0%
22.4%
72100.0%
Under 50%*
$25,001 to $49,999
2624.5%
1715.9%
2523.4%
1311.9%
98.7%
98.2%
87.3%
00.0%
107100.0%
$50,000 to $74,999
2125.4%
2225.9%
911.2%
1416.8%
22.1%
910.6%
66.8%
11.1%
84100.0%
$75,000 to $150,000
2621.6%
2218.5%
1613.4%
1915.7%
1915.8%
75.6%
119.0%
10.5%
119100.0%
Over $150,000
823.7%
721.3%
617.3%
515.0%
26.4%
412.4%
13.8%
00.0%
34100.0%
DK/NA/Refused
2833.8%
1315.0%
1113.5%
910.4%
67.5%
89.7%
78.4%
11.6%
84100.0%
Who Respondents Trust When Addressing Community Issues
(6) Who Respondents Trust toAddress Community Issues
Religious organizations
Nonprofit organizations
Local businesses
Someone else
Local government
DK/NA
Totals
ChiSq Significance
Under $25,000
Household Income
1318.2%
2331.3%
1520.3%
1216.1%
911.8%
22.3%
72100.0%
Yes at 50.0%
$25,001 to $49,999
3532.5%
1917.9%
109.0%
1614.8%
2018.5%
87.2%
107100.0%
$50,000 to $74,999
1719.6%
2124.7%
1922.2%
1618.6%
78.0%
66.9%
84100.0%
$75,000 to $150,000
2319.7%
3227.0%
1815.6%
2117.9%
1512.7%
87.1%
119100.0%
Over $150,000
719.8%
824.1%
926.5%
410.3%
39.1%
310.2%
34100.0%
DK/NA/Refused
2833.6%
1517.6%
1416.5%
1416.2%
78.0%
78.1%
84100.0%
www.peaksurveys.com Community Survey Household Income 2012 Page 63 D
Household Income

Favorability of County Commissioners
(7) Favorability of CountyCommissioners
Very favorable
Somewhat favorable
Somewhat unfavorable
Very unfavorable
Never heard of them
DK/NA
Totals
ChiSq Significance
Under $25,000
Household Income
1115.8%
2534.5%
1115.4%
67.9%
1521.4%
45.0%
72100.0%
Yes at 99.0%
$25,001 to $49,999
32.9%
5047.2%
76.7%
66.1%
2018.9%
1918.3%
107100.0%
$50,000 to $74,999
33.3%
3541.9%
1112.7%
67.3%
1821.1%
1113.6%
84100.0%
$75,000 to $150,000
108.3%
5546.8%
108.5%
1311.2%
129.8%
1815.4%
119100.0%
Over $150,000
411.5%
1645.8%
37.8%
515.2%
25.2%
514.5%
34100.0%
DK/NA/Refused
78.9%
2226.4%
1113.7%
56.3%
1214.2%
2530.4%
84100.0%
* Note: ChiSq has over 20% low count cells.
Favorability of Colorado Springs Mayor
Favorability of Colorado SpringsMayor
Very favorable
Somewhat favorable
Somewhat unfavorable
Very unfavorable
Never heard of them
DK/NA
Totals
ChiSq Significance
Under $25,000
Household Income
59.4%
1729.5%
1017.4%
1627.0%
23.1%
813.6%
58100.0%
Yes at 99.0%*
$25,001 to $49,999
2126.2%
2227.8%
79.0%
34.4%
45.6%
2127.0%
79100.0%
$50,000 to $74,999
47.7%
1628.8%
59.6%
59.0%
916.4%
1628.5%
56100.0%
$75,000 to $150,000
1925.5%
2940.0%
67.5%
56.6%
56.3%
1014.1%
73100.0%
Over $150,000
942.7%
840.4%
14.7%
02.2%
210.0%
00.0%
21100.0%
DK/NA/Refused
1527.2%
2444.4%
35.7%
12.4%
58.8%
611.5%
55100.0%
www.peaksurveys.com Community Survey Household Income 2012 Page 64 D
Household Income

* Note: ChiSq has over 20% low count cells.
Favorability of Colorado Springs City Council
(8) Favorability of ColoradoSprings City Council
Very favorable
Somewhat favorable
Somewhat unfavorable
Very unfavorable
Never heard of them
DK/NA
Totals
ChiSq Significance
Under $25,000
Household Income
47.2%
3154.4%
610.2%
69.9%
23.1%
915.2%
58100.0%
Yes at 75.0%*
$25,001 to $49,999
55.7%
2430.7%
1215.0%
56.4%
67.8%
2734.5%
79100.0%
$50,000 to $74,999
00.0%
2240.2%
1424.4%
11.6%
59.7%
1324.1%
56100.0%
$75,000 to $150,000
57.1%
2940.0%
1114.7%
810.9%
1013.5%
1013.7%
73100.0%
Over $150,000
14.7%
1046.8%
419.8%
16.2%
00.0%
522.5%
21100.0%
DK/NA/Refused
712.4%
1832.6%
1119.8%
610.5%
47.8%
916.9%
55100.0%
www.peaksurveys.com Community Survey Household Income 2012 Page 65 D
Household Income

Question 9 below was asked as an open-ended question. We compiled the results into themes for easier analysis, however we havelisted all responses at the end of the document for more in-depth study.
* Note: ChiSq has over 20% low count cells.
Most Important for Local Government to do that will Strengthen Trust and Build Confidence
2012 What is most important forlocal government to do - that willstrengthen trust and buildconfidence?
Don't know/NA/Refused
Be honest / fair / tell the truth
More involvement withcommunity
Balance the budget / debt
Create more jobs
Listen to the people
Communicate
Do what they say they aregoing to do
Improve the economy
Be transparent
Increase emergency services(law enforcement / fire)
Transportation / roads
Keep taxes low / stop raisingtaxes
Work together
Education
Nothing / none
Decrease crime
Infrastructure
Other
Totals
ChiSq Significance
Under $25,000
Household Income
811.3%
46.2%
1217.6%
22.9%
710.5%
811.1%
46.2%
811.7%
69.0%
00.6%
00.6%
11.9%
00.0%
00.6%
22.9%
11.1%
11.1%
00.0%
34.5%
71100.0%
Yes at 99.0%*
$25,001 to $49,999
1817.5%
1110.8%
65.6%
32.6%
55.3%
1414.2%
55.3%
109.5%
33.1%
54.9%
65.7%
44.3%
44.0%
11.3%
00.0%
32.7%
00.0%
00.0%
33.4%
100100.0%
$50,000 to $74,999
78.6%
45.0%
911.3%
1113.4%
1113.8%
11.7%
45.5%
22.2%
11.7%
911.6%
11.6%
44.9%
33.2%
44.5%
55.9%
11.3%
00.0%
00.0%
33.8%
79100.0%
$75,000 to $150,000
1312.4%
1715.8%
87.6%
109.1%
22.2%
65.1%
33.0%
43.8%
1211.1%
108.7%
10.7%
11.1%
10.9%
43.7%
11.2%
33.0%
43.5%
11.2%
65.9%
109100.0%
Over $150,000
27.4%
310.3%
38.5%
517.2%
01.5%
25.9%
25.8%
26.1%
14.2%
12.8%
14.5%
13.0%
25.4%
00.0%
00.0%
00.0%
25.6%
14.3%
27.7%
30100.0%
DK/NA/Refused
1012.2%
1720.4%
56.1%
79.0%
78.2%
11.1%
1012.7%
44.6%
45.1%
22.7%
67.7%
11.0%
22.3%
00.6%
11.0%
00.0%
00.0%
11.5%
33.9%
81100.0%
www.peaksurveys.com Community Survey Household Income 2012 Page 66 D
Household Income

Positive or Negative Impact of Tabor in the Community
(10) Positive or Negative Impactof Tabor in the Community
Generally positive impact
Generally negative impact
Really makes no difference
Don't know enough about it
Never heard of TABOR
DK/NA
Totals
ChiSq Significance
Under $25,000
Household Income
2331.9%
1824.8%
11.5%
1521.2%
1013.9%
56.7%
72100.0%
Under 50%
$25,001 to $49,999
2725.7%
2119.4%
65.7%
1312.3%
2321.2%
1715.7%
107100.0%
$50,000 to $74,999
2832.8%
2428.7%
11.0%
1315.3%
1214.6%
67.7%
84100.0%
$75,000 to $150,000
4134.9%
3630.6%
65.0%
1513.0%
1411.8%
54.6%
119100.0%
Over $150,000
1131.2%
927.0%
01.4%
719.5%
412.8%
38.1%
34100.0%
DK/NA/Refused
2327.6%
2327.9%
55.9%
1112.8%
1619.2%
66.6%
84100.0%
Favorability of Amending Tabor
(11) Favorability of AmendingTABOR?
Strongly favorable
Somewhat favorable
Somewhat unfavorable
Strongly unfavorable
DK/NA
Totals
ChiSq Significance
Under $25,000
Household Income
1317.4%
1520.2%
912.4%
57.4%
3142.6%
72100.0%
Yes at 75.0%
$25,001 to $49,999
1211.2%
2927.2%
1110.7%
44.0%
5046.9%
107100.0%
$50,000 to $74,999
1922.4%
3035.3%
44.6%
11.6%
3036.0%
84100.0%
$75,000 to $150,000
3327.8%
3226.6%
64.8%
98.0%
3932.8%
119100.0%
Over $150,000
1029.6%
515.5%
37.9%
24.8%
1442.1%
34100.0%
DK/NA/Refused
1012.4%
2023.3%
89.1%
1315.0%
3440.1%
84100.0%
www.peaksurveys.com Community Survey Household Income 2012 Page 67 D
Household Income

For the following questions (12 through 26) the respondents were asked how concerned they are with each issue.
* Note: ChiSq has over 20% low count cells.
Employment and Jobs
(12) Employment and jobsVery Concerned
Somewhat Concerned
Not Very Concerned
Not at all Concerned
DK/NA
Totals
ChiSq Significance
Under $25,000
Household Income
5069.3%
1419.1%
57.5%
23.4%
00.7%
72100.0%
Under 50%*
$25,001 to $49,999
8176.1%
1514.1%
98.2%
21.7%
00.0%
107100.0%
$50,000 to $74,999
5565.7%
2327.1%
66.7%
00.0%
00.5%
84100.0%
$75,000 to $150,000
9378.6%
2319.0%
10.9%
21.5%
00.0%
119100.0%
Over $150,000
2573.2%
720.4%
00.0%
26.5%
00.0%
34100.0%
DK/NA/Refused
5465.0%
2529.6%
44.9%
00.0%
00.5%
84100.0%
* Note: ChiSq has over 20% low count cells.
Drugs and Alcohol
(13) Drugs and alcoholVery Concerned
Somewhat Concerned
Not Very Concerned
Not at all Concerned
DK/NA
Totals
ChiSq Significance
Under $25,000
Household Income
4055.9%
1926.0%
79.2%
68.9%
00.0%
72100.0%
Yes at 50.0%*
$25,001 to $49,999
7066.0%
2725.0%
76.2%
21.6%
11.2%
107100.0%
$50,000 to $74,999
3845.5%
2833.7%
1618.6%
22.1%
00.0%
84100.0%
$75,000 to $150,000
5244.0%
3529.8%
2218.1%
97.4%
10.7%
119100.0%
Over $150,000
1132.8%
1234.1%
1027.9%
25.1%
00.0%
34100.0%
DK/NA/Refused
4351.3%
2428.9%
1214.5%
44.8%
00.5%
84100.0%
www.peaksurveys.com Community Survey Household Income 2012 Page 68 D
Household Income

* Note: ChiSq has over 20% low count cells.
Growth
(14) GrowthVery Concerned
Somewhat Concerned
Not Very Concerned
Not at all Concerned
DK/NA
Totals
ChiSq Significance
Under $25,000
Household Income
2027.3%
3446.5%
1622.7%
22.4%
11.1%
72100.0%
Under 50%*
$25,001 to $49,999
3330.7%
4643.3%
1817.3%
55.0%
43.7%
107100.0%
$50,000 to $74,999
3137.1%
3136.7%
1113.1%
89.2%
33.9%
84100.0%
$75,000 to $150,000
4437.0%
4739.7%
1613.4%
119.4%
10.5%
119100.0%
Over $150,000
822.6%
1440.8%
822.6%
39.2%
24.8%
34100.0%
DK/NA/Refused
2833.4%
3136.9%
1416.6%
1011.6%
11.4%
84100.0%
* Note: ChiSq has over 20% low count cells.
Affordable Housing
(15) Affordable housingVery Concerned
Somewhat Concerned
Not Very Concerned
Not at all Concerned
DK/NA
Totals
ChiSq Significance
Under $25,000
Household Income
4258.0%
2331.8%
56.7%
22.7%
10.8%
72100.0%
Yes at 99.0%*
$25,001 to $49,999
6661.8%
3028.0%
65.3%
54.5%
00.4%
107100.0%
$50,000 to $74,999
3541.1%
2428.2%
1719.8%
89.9%
11.1%
84100.0%
$75,000 to $150,000
3529.4%
4537.8%
2521.1%
1310.9%
10.8%
119100.0%
Over $150,000
514.1%
1442.5%
824.6%
618.7%
00.0%
34100.0%
DK/NA/Refused
3035.9%
3237.9%
1315.5%
78.5%
22.2%
84100.0%
www.peaksurveys.com Community Survey Household Income 2012 Page 69 D
Household Income
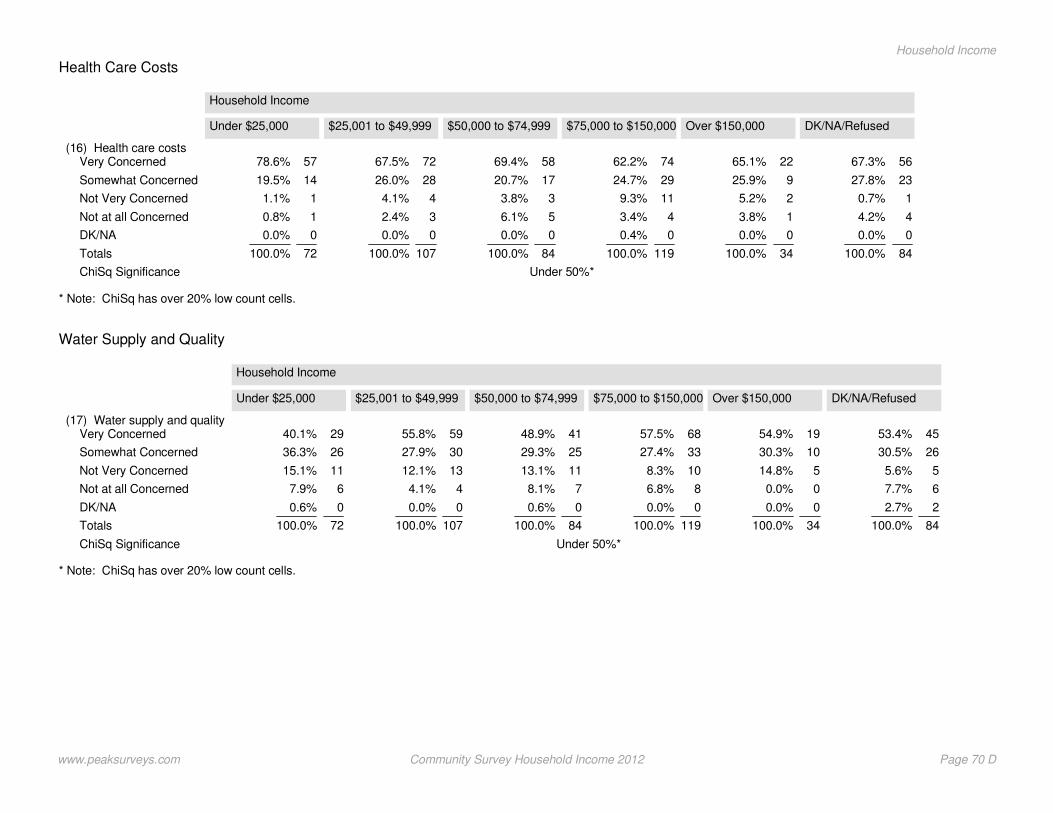
* Note: ChiSq has over 20% low count cells.
Health Care Costs
(16) Health care costsVery Concerned
Somewhat Concerned
Not Very Concerned
Not at all Concerned
DK/NA
Totals
ChiSq Significance
Under $25,000
Household Income
5778.6%
1419.5%
11.1%
10.8%
00.0%
72100.0%
Under 50%*
$25,001 to $49,999
7267.5%
2826.0%
44.1%
32.4%
00.0%
107100.0%
$50,000 to $74,999
5869.4%
1720.7%
33.8%
56.1%
00.0%
84100.0%
$75,000 to $150,000
7462.2%
2924.7%
119.3%
43.4%
00.4%
119100.0%
Over $150,000
2265.1%
925.9%
25.2%
13.8%
00.0%
34100.0%
DK/NA/Refused
5667.3%
2327.8%
10.7%
44.2%
00.0%
84100.0%
* Note: ChiSq has over 20% low count cells.
Water Supply and Quality
(17) Water supply and qualityVery Concerned
Somewhat Concerned
Not Very Concerned
Not at all Concerned
DK/NA
Totals
ChiSq Significance
Under $25,000
Household Income
2940.1%
2636.3%
1115.1%
67.9%
00.6%
72100.0%
Under 50%*
$25,001 to $49,999
5955.8%
3027.9%
1312.1%
44.1%
00.0%
107100.0%
$50,000 to $74,999
4148.9%
2529.3%
1113.1%
78.1%
00.6%
84100.0%
$75,000 to $150,000
6857.5%
3327.4%
108.3%
86.8%
00.0%
119100.0%
Over $150,000
1954.9%
1030.3%
514.8%
00.0%
00.0%
34100.0%
DK/NA/Refused
4553.4%
2630.5%
55.6%
67.7%
22.7%
84100.0%
www.peaksurveys.com Community Survey Household Income 2012 Page 70 D
Household Income

* Note: ChiSq has over 20% low count cells.
Effective Community Leadership
(18) Effective communityleadership
Very Concerned
Somewhat Concerned
Not Very Concerned
Not at all Concerned
DK/NA
Totals
ChiSq Significance
Under $25,000
Household Income
3853.3%
1724.0%
811.4%
67.9%
23.4%
72100.0%
Under 50%*
$25,001 to $49,999
5349.9%
3633.8%
77.0%
87.3%
22.1%
107100.0%
$50,000 to $74,999
3946.3%
3237.6%
89.8%
45.1%
11.1%
84100.0%
$75,000 to $150,000
6453.6%
3428.8%
97.7%
76.0%
53.9%
119100.0%
Over $150,000
1338.1%
1544.0%
13.8%
310.1%
14.1%
34100.0%
DK/NA/Refused
4149.2%
2631.4%
89.2%
56.0%
34.2%
84100.0%
* Note: ChiSq has over 20% low count cells.
Services to Homeless
(19) Services for the homelessVery Concerned
Somewhat Concerned
Not Very Concerned
Not at all Concerned
DK/NA
Totals
ChiSq Significance
Under $25,000
Household Income
4461.0%
1724.3%
33.5%
79.4%
11.8%
72100.0%
Yes at 99.0%*
$25,001 to $49,999
5552.1%
4239.6%
65.4%
21.7%
11.2%
107100.0%
$50,000 to $74,999
3541.1%
3541.7%
89.5%
33.0%
44.6%
84100.0%
$75,000 to $150,000
2521.0%
6958.4%
1613.4%
65.3%
21.9%
119100.0%
Over $150,000
617.6%
1647.9%
822.1%
412.4%
00.0%
34100.0%
DK/NA/Refused
3642.5%
3642.8%
89.4%
44.9%
00.5%
84100.0%
www.peaksurveys.com Community Survey Household Income 2012 Page 71 D
Household Income

* Note: ChiSq has over 20% low count cells.
Access to Mental Health
(20) Access to mental healthcare
Very Concerned
Somewhat Concerned
Not Very Concerned
Not at all Concerned
DK/NA
Totals
ChiSq Significance
Under $25,000
Household Income
2636.1%
2534.6%
1014.2%
1013.8%
11.3%
72100.0%
Yes at 50.0%*
$25,001 to $49,999
5249.0%
2523.7%
1816.4%
1110.4%
00.4%
107100.0%
$50,000 to $74,999
3136.2%
2631.4%
1417.0%
1214.7%
10.7%
84100.0%
$75,000 to $150,000
3226.7%
4638.4%
2218.6%
1311.0%
65.3%
119100.0%
Over $150,000
823.1%
926.2%
1132.8%
616.4%
01.4%
34100.0%
DK/NA/Refused
3238.0%
2326.9%
1517.5%
1416.6%
11.0%
84100.0%
* Note: ChiSq has over 20% low count cells.
Access to Quality Early Childhood Education
(21) Access to quality earlychildhood education
Very Concerned
Somewhat Concerned
Not Very Concerned
Not at all Concerned
DK/NA
Totals
ChiSq Significance
Under $25,000
Household Income
2737.9%
3446.7%
811.3%
23.0%
11.1%
72100.0%
Yes at 90.0%*
$25,001 to $49,999
5955.0%
2927.4%
98.2%
87.6%
21.8%
107100.0%
$50,000 to $74,999
3237.8%
3137.1%
1113.4%
89.9%
21.8%
84100.0%
$75,000 to $150,000
4134.6%
3831.7%
2319.7%
119.6%
54.4%
119100.0%
Over $150,000
721.3%
927.6%
1131.2%
719.8%
00.0%
34100.0%
DK/NA/Refused
3035.6%
2428.5%
1517.7%
1416.3%
22.0%
84100.0%
www.peaksurveys.com Community Survey Household Income 2012 Page 72 D
Household Income

* Note: ChiSq has over 20% low count cells.
Student Achievement
(22) Student AchievementVery Concerned
Somewhat Concerned
Not Very Concerned
Not at all Concerned
DK/NA
Totals
ChiSq Significance
Under $25,000
Household Income
4054.9%
2534.8%
68.2%
11.3%
10.8%
72100.0%
Under 50%*
$25,001 to $49,999
5753.6%
3734.4%
98.0%
43.5%
00.4%
107100.0%
$50,000 to $74,999
5160.5%
2529.6%
22.3%
67.0%
00.6%
84100.0%
$75,000 to $150,000
5546.7%
3630.8%
1814.9%
86.4%
11.2%
119100.0%
Over $150,000
1853.9%
1235.6%
37.8%
12.7%
00.0%
34100.0%
DK/NA/Refused
4351.9%
2934.3%
45.0%
56.2%
22.7%
84100.0%
Arts and Culture Opportunities
(23) Arts and cultureopportunities
Very Concerned
Somewhat Concerned
Not Very Concerned
Not at all Concerned
DK/NA
Totals
ChiSq Significance
Under $25,000
Household Income
1723.3%
2940.2%
2128.5%
68.0%
00.0%
72100.0%
Yes at 95.0%
$25,001 to $49,999
3028.5%
3431.8%
2119.4%
1917.9%
32.5%
107100.0%
$50,000 to $74,999
2630.6%
1821.0%
1619.4%
2428.5%
00.5%
84100.0%
$75,000 to $150,000
1613.5%
4336.0%
4033.4%
1916.4%
10.7%
119100.0%
Over $150,000
616.9%
618.0%
1440.4%
824.6%
00.0%
34100.0%
DK/NA/Refused
1113.1%
3339.0%
2934.9%
1011.9%
11.0%
84100.0%
www.peaksurveys.com Community Survey Household Income 2012 Page 73 D
Household Income

* Note: ChiSq has over 20% low count cells.
Crime Rate
(24) Crime rateVery Concerned
Somewhat Concerned
Not Very Concerned
Not at all Concerned
DK/NA
Totals
ChiSq Significance
Under $25,000
Household Income
4055.9%
1926.3%
1014.3%
23.4%
00.0%
72100.0%
Yes at 50.0%*
$25,001 to $49,999
7065.5%
2826.5%
65.5%
11.2%
11.2%
107100.0%
$50,000 to $74,999
3844.5%
2327.3%
1922.1%
44.9%
11.1%
84100.0%
$75,000 to $150,000
6655.4%
3227.2%
1714.5%
32.9%
00.0%
119100.0%
Over $150,000
1439.8%
1131.6%
719.4%
39.2%
00.0%
34100.0%
DK/NA/Refused
4755.9%
2833.1%
44.5%
56.1%
00.5%
84100.0%
* Note: ChiSq has over 20% low count cells.
Voter Participation
(25) Voter participationVery Concerned
Somewhat Concerned
Not Very Concerned
Not at all Concerned
DK/NA
Totals
ChiSq Significance
Under $25,000
Household Income
3650.6%
1825.4%
1013.5%
57.0%
23.4%
72100.0%
Yes at 50.0%*
$25,001 to $49,999
5753.7%
2725.6%
1110.5%
1110.1%
00.0%
107100.0%
$50,000 to $74,999
3845.3%
2226.6%
1315.0%
1012.4%
10.7%
84100.0%
$75,000 to $150,000
7059.4%
2924.6%
1411.8%
32.8%
21.4%
119100.0%
Over $150,000
1439.8%
1132.4%
412.4%
515.4%
00.0%
34100.0%
DK/NA/Refused
3946.5%
3642.6%
22.4%
55.5%
23.0%
84100.0%
www.peaksurveys.com Community Survey Household Income 2012 Page 74 D
Household Income
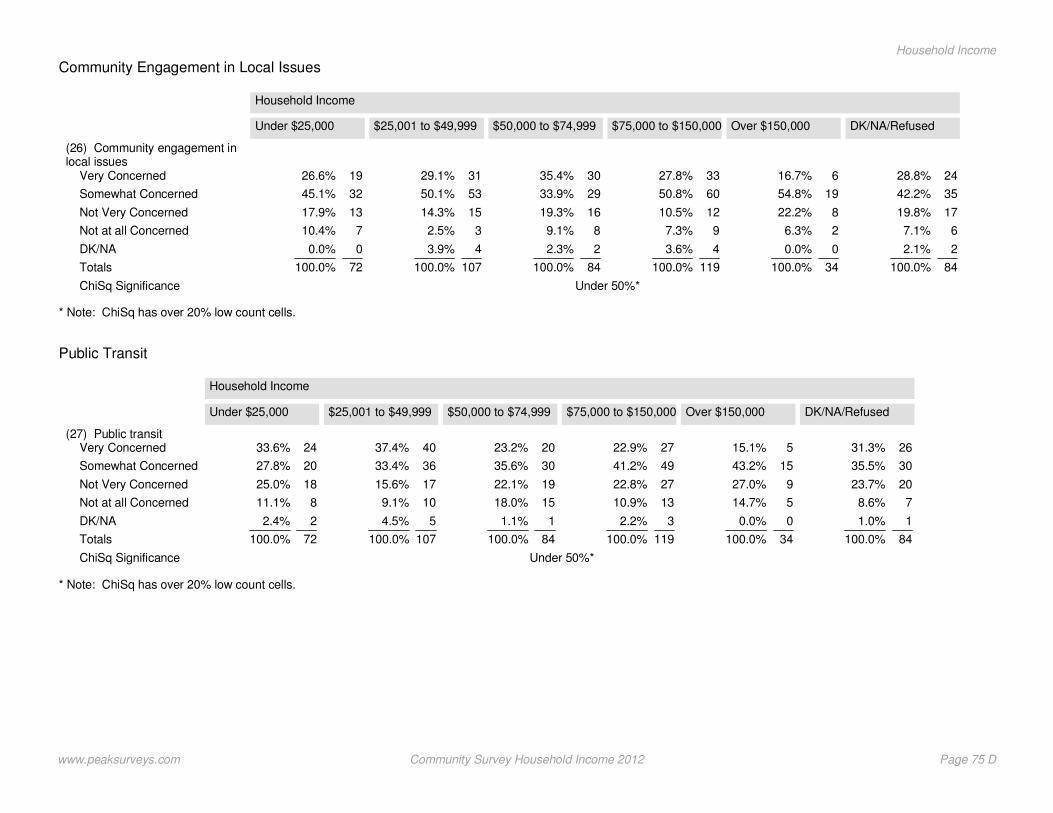
* Note: ChiSq has over 20% low count cells.
Community Engagement in Local Issues
(26) Community engagement inlocal issues
Very Concerned
Somewhat Concerned
Not Very Concerned
Not at all Concerned
DK/NA
Totals
ChiSq Significance
Under $25,000
Household Income
1926.6%
3245.1%
1317.9%
710.4%
00.0%
72100.0%
Under 50%*
$25,001 to $49,999
3129.1%
5350.1%
1514.3%
32.5%
43.9%
107100.0%
$50,000 to $74,999
3035.4%
2933.9%
1619.3%
89.1%
22.3%
84100.0%
$75,000 to $150,000
3327.8%
6050.8%
1210.5%
97.3%
43.6%
119100.0%
Over $150,000
616.7%
1954.8%
822.2%
26.3%
00.0%
34100.0%
DK/NA/Refused
2428.8%
3542.2%
1719.8%
67.1%
22.1%
84100.0%
* Note: ChiSq has over 20% low count cells.
Public Transit
(27) Public transitVery Concerned
Somewhat Concerned
Not Very Concerned
Not at all Concerned
DK/NA
Totals
ChiSq Significance
Under $25,000
Household Income
2433.6%
2027.8%
1825.0%
811.1%
22.4%
72100.0%
Under 50%*
$25,001 to $49,999
4037.4%
3633.4%
1715.6%
109.1%
54.5%
107100.0%
$50,000 to $74,999
2023.2%
3035.6%
1922.1%
1518.0%
11.1%
84100.0%
$75,000 to $150,000
2722.9%
4941.2%
2722.8%
1310.9%
32.2%
119100.0%
Over $150,000
515.1%
1543.2%
927.0%
514.7%
00.0%
34100.0%
DK/NA/Refused
2631.3%
3035.5%
2023.7%
78.6%
11.0%
84100.0%
www.peaksurveys.com Community Survey Household Income 2012 Page 75 D
Household Income
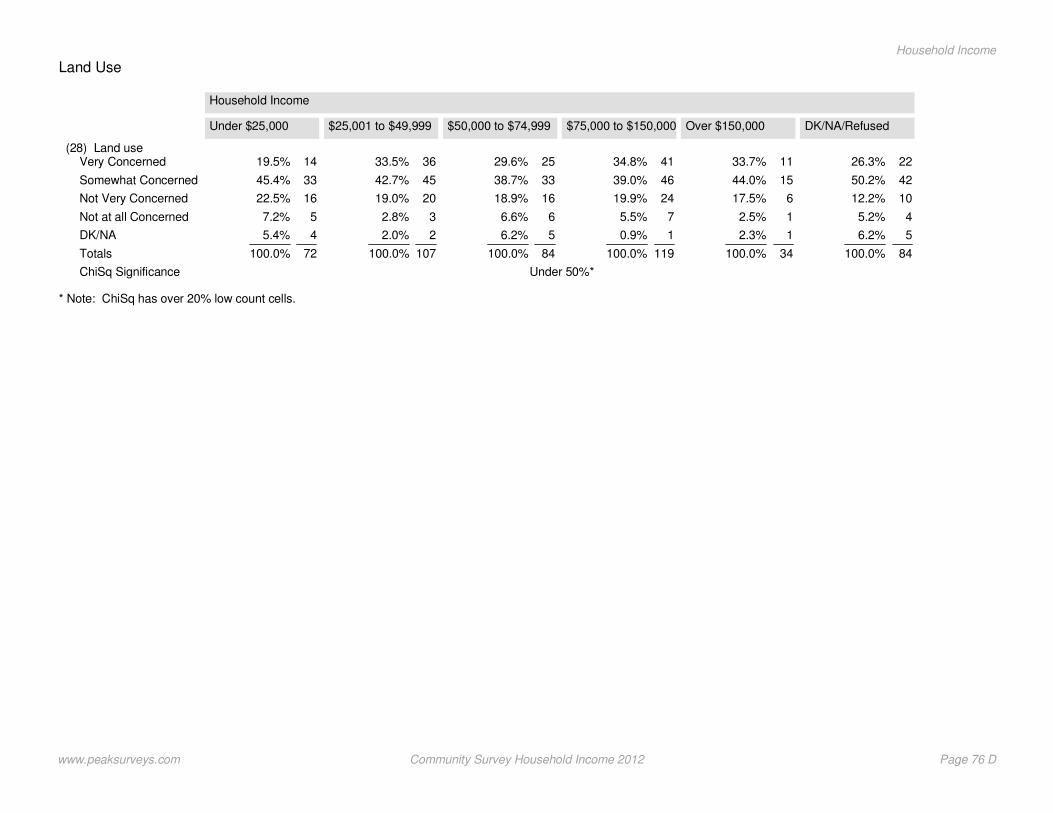
* Note: ChiSq has over 20% low count cells.
Land Use
(28) Land useVery Concerned
Somewhat Concerned
Not Very Concerned
Not at all Concerned
DK/NA
Totals
ChiSq Significance
Under $25,000
Household Income
1419.5%
3345.4%
1622.5%
57.2%
45.4%
72100.0%
Under 50%*
$25,001 to $49,999
3633.5%
4542.7%
2019.0%
32.8%
22.0%
107100.0%
$50,000 to $74,999
2529.6%
3338.7%
1618.9%
66.6%
56.2%
84100.0%
$75,000 to $150,000
4134.8%
4639.0%
2419.9%
75.5%
10.9%
119100.0%
Over $150,000
1133.7%
1544.0%
617.5%
12.5%
12.3%
34100.0%
DK/NA/Refused
2226.3%
4250.2%
1012.2%
45.2%
56.2%
84100.0%
www.peaksurveys.com Community Survey Household Income 2012 Page 76 D
Household Income

Section D
household incomequality of life
Peak Surveys
www.peaksurveys.com
Community and QLI Survey 2012

Household Incomed
Economic Vision
* Note: ChiSq has over 20% low count cells.
How Respondents Feel Local Economy Compares to the National Economy
How do you feel the localeconomy compares to thenational economy?
Same as national economy
Better than national economy
Worse than national economy
Much better than nationaleconomy
Much worse than nationaleconomy
Totals
ChiSq Significance
Under $25,000
Household Income
2737.20%
3142.44%
810.70%
57.23%
22.43%
72100.00%
Under 50%*
$25,001 to $49,999
4844.66%
3735.12%
1211.15%
87.48%
21.59%
107100.00%
$50,000 to $74,999
3743.98%
3440.63%
66.80%
56.38%
22.22%
84100.00%
$75,000 to $150,000
6151.06%
4436.95%
108.80%
32.81%
00.39%
119100.00%
Over $150,000
1439.72%
1751.21%
37.74%
01.34%
00.00%
34100.00%
How do you feel the localeconomy compares to thenational economy?
Same as national economy
Better than national economy
Worse than national economy
Much better than nationaleconomy
Much worse than nationaleconomy
Totals
ChiSq Significance
Don't know/NA/Refused
Household Income
3238.07%
3339.24%
1112.59%
810.10%
00.00%
84100.00%
Under 50%*
www.peaksurveys.com QLI Household Income 2012 78 D
Household Income
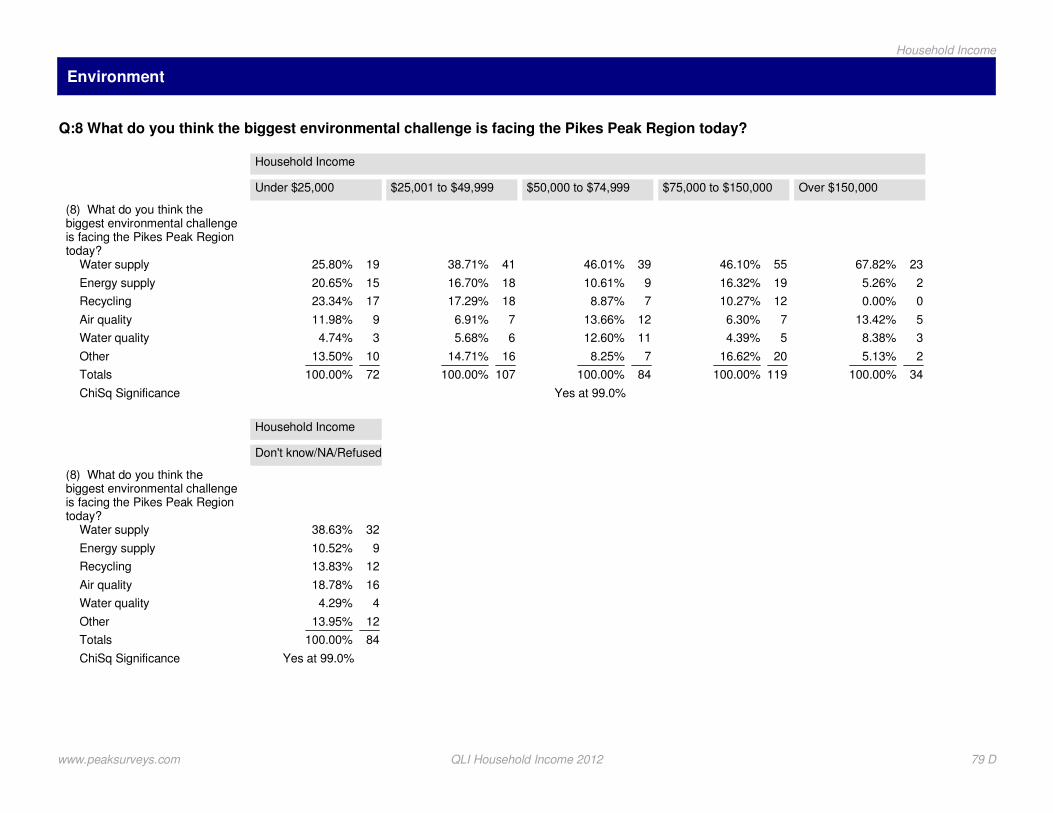
Environment
Q:8 What do you think the biggest environmental challenge is facing the Pikes Peak Region today?
(8) What do you think thebiggest environmental challengeis facing the Pikes Peak Regiontoday?
Water supply
Energy supply
Recycling
Air quality
Water quality
Other
Totals
ChiSq Significance
Under $25,000
Household Income
1925.80%
1520.65%
1723.34%
911.98%
34.74%
1013.50%
72100.00%
Yes at 99.0%
$25,001 to $49,999
4138.71%
1816.70%
1817.29%
76.91%
65.68%
1614.71%
107100.00%
$50,000 to $74,999
3946.01%
910.61%
78.87%
1213.66%
1112.60%
78.25%
84100.00%
$75,000 to $150,000
5546.10%
1916.32%
1210.27%
76.30%
54.39%
2016.62%
119100.00%
Over $150,000
2367.82%
25.26%
00.00%
513.42%
38.38%
25.13%
34100.00%
(8) What do you think thebiggest environmental challengeis facing the Pikes Peak Regiontoday?
Water supply
Energy supply
Recycling
Air quality
Water quality
Other
Totals
ChiSq Significance
Don't know/NA/Refused
Household Income
3238.63%
910.52%
1213.83%
1618.78%
44.29%
1213.95%
84100.00%
Yes at 99.0%
www.peaksurveys.com QLI Household Income 2012 79 D
Household Income

Arts and Culture
* Note: ChiSq has over 20% low count cells.
Essentiality of Parks, Recreation, Trails and Open Spaces to Respondents
Parks, recreation, trails and openspaces are essential to mycommunity.
Strongly Agree
Agree
Disagree
Strongly Disagree
Totals
ChiSq Significance
Under $25,000
Household Income
4561.77%
2535.02%
23.21%
00.00%
72100.00%
Yes at 75.0%*
$25,001 to $49,999
6560.97%
3634.14%
54.47%
00.43%
107100.00%
$50,000 to $74,999
5868.76%
2327.19%
33.05%
11.00%
84100.00%
$75,000 to $150,000
7159.69%
4134.97%
32.19%
43.16%
119100.00%
Over $150,000
1851.96%
1440.73%
25.97%
01.34%
34100.00%
Parks, recreation, trails and openspaces are essential to mycommunity.
Strongly Agree
Agree
Disagree
Strongly Disagree
Totals
ChiSq Significance
Don't know/NA/Refused
Household Income
3238.29%
4755.71%
45.00%
11.01%
84100.00%
Yes at 75.0%*
www.peaksurveys.com QLI Household Income 2012 80 D
Household Income

Respondents Satisfaction with Level of Maintenance and Service
I am satisfied with the level ofmaintenance and service inparks, recreation, trails and openspaces.
Strongly Agree
Agree
Disagree
Strongly Disagree
Totals
ChiSq Significance
Under $25,000
Household Income
1317.44%
3447.87%
2027.73%
56.97%
72100.00%
Yes at 75.0%
$25,001 to $49,999
1918.10%
5753.63%
1918.18%
1110.09%
107100.00%
$50,000 to $74,999
1315.25%
5565.83%
1517.37%
11.54%
84100.00%
$75,000 to $150,000
2621.64%
5344.66%
2722.35%
1311.35%
119100.00%
Over $150,000
823.44%
1956.18%
720.39%
00.00%
34100.00%
I am satisfied with the level ofmaintenance and service inparks, recreation, trails and openspaces.
Strongly Agree
Agree
Disagree
Strongly Disagree
Totals
ChiSq Significance
Don't know/NA/Refused
Household Income
910.61%
5768.36%
1416.34%
44.69%
84100.00%
Yes at 75.0%
www.peaksurveys.com QLI Household Income 2012 81 D
Household Income

* Note: ChiSq has over 20% low count cells.
Respondents Agreement Level of Arts and Culture Improve Quality of Life
Arts and Culture improve myquality of life.
Strongly Agree
Agree
Disagree
Strongly Disagree
Totals
ChiSq Significance
Under $25,000
Household Income
2028.38%
3954.05%
1216.47%
11.10%
72100.00%
Under 50%*
$25,001 to $49,999
3432.32%
5148.22%
2018.72%
10.74%
107100.00%
$50,000 to $74,999
2833.05%
4452.68%
1112.73%
11.55%
84100.00%
$75,000 to $150,000
2722.38%
7058.79%
2117.39%
21.44%
119100.00%
Over $150,000
1130.95%
1440.40%
822.55%
26.10%
34100.00%
Arts and Culture improve myquality of life.
Strongly Agree
Agree
Disagree
Strongly Disagree
Totals
ChiSq Significance
Don't know/NA/Refused
Household Income
1820.99%
5160.45%
1517.97%
00.58%
84100.00%
Under 50%*
www.peaksurveys.com QLI Household Income 2012 82 D
Household Income

* Note: ChiSq has over 20% low count cells.
Reasons Respondents Agree on Arts and Culture Improve Quality of Life
Why do you believe it improves thequality of your life?
Spiritual / Relaxing
Entertaining
Exposure / Growth
Enriches Life
Something To Do
Better Educated / Open Mind
Experience Something New
Exposure to New Cultures
Recreation
Artist / Musician
Nothing / none
Other
Don't Know/refused
Totals
ChiSq Significance
Under $25,000
Household Income
46.68%
35.53%
1017.19%
69.38%
69.28%
46.48%
47.13%
813.29%
00.00%
610.13%
24.02%
00.00%
610.89%
59100.00%
Yes at 75.0%*
$25,001 to $49,999
44.63%
67.55%
1720.18%
910.70%
77.75%
1213.41%
22.04%
1315.29%
45.10%
22.63%
00.53%
11.24%
88.95%
86100.00%
$50,000 to $74,999
00.00%
912.50%
810.74%
1723.27%
23.03%
79.59%
45.26%
79.37%
00.00%
1420.14%
33.71%
00.00%
22.39%
72100.00%
$75,000 to $150,000
21.83%
76.86%
1111.98%
2020.44%
77.30%
1515.84%
99.30%
99.04%
54.72%
66.54%
22.25%
22.00%
21.92%
96100.00%
Over $150,000
14.02%
417.38%
310.80%
625.29%
28.73%
27.18%
00.00%
416.69%
15.68%
01.88%
12.34%
00.00%
00.00%
24100.00%
Don't know/NA/Refused
00.00%
34.47%
710.08%
1826.39%
56.97%
56.78%
68.47%
69.46%
46.32%
79.64%
46.22%
00.67%
34.55%
68100.00%
www.peaksurveys.com QLI Household Income 2012 83 D
Household Income
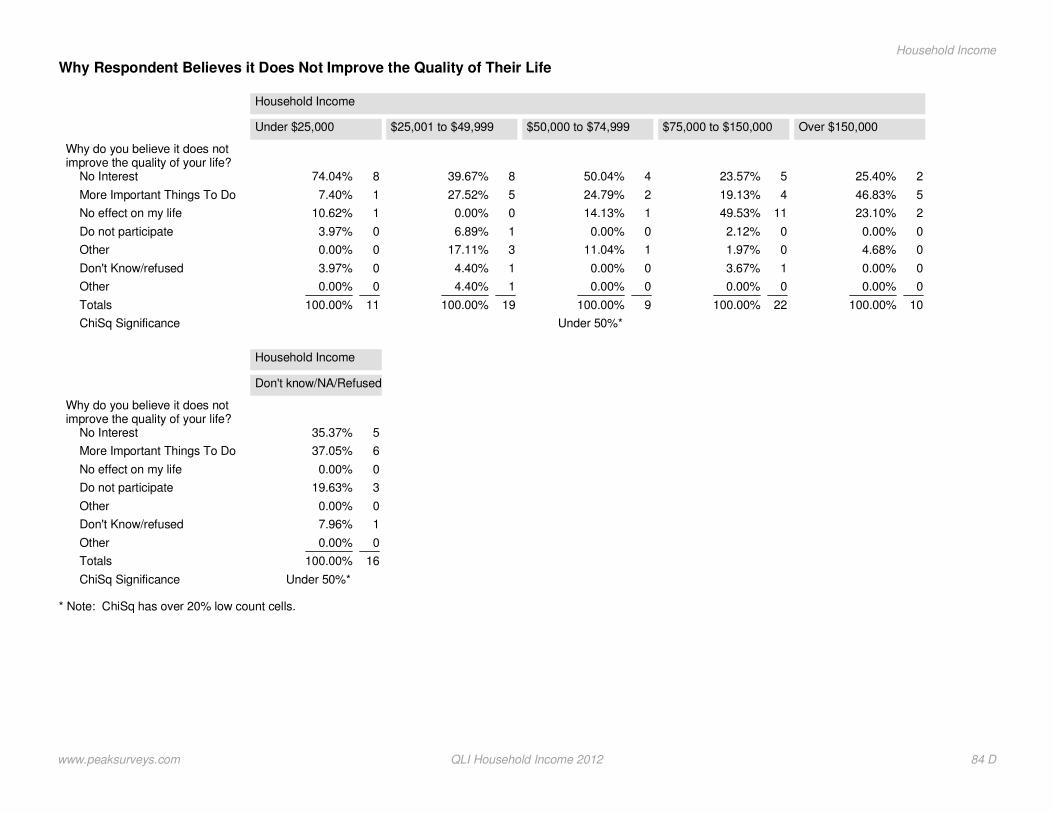
* Note: ChiSq has over 20% low count cells.
Why Respondent Believes it Does Not Improve the Quality of Their Life
Why do you believe it does notimprove the quality of your life?
No Interest
More Important Things To Do
No effect on my life
Do not participate
Other
Don't Know/refused
Other
Totals
ChiSq Significance
Under $25,000
Household Income
874.04%
17.40%
110.62%
03.97%
00.00%
03.97%
00.00%
11100.00%
Under 50%*
$25,001 to $49,999
839.67%
527.52%
00.00%
16.89%
317.11%
14.40%
14.40%
19100.00%
$50,000 to $74,999
450.04%
224.79%
114.13%
00.00%
111.04%
00.00%
00.00%
9100.00%
$75,000 to $150,000
523.57%
419.13%
1149.53%
02.12%
01.97%
13.67%
00.00%
22100.00%
Over $150,000
225.40%
546.83%
223.10%
00.00%
04.68%
00.00%
00.00%
10100.00%
Why do you believe it does notimprove the quality of your life?
No Interest
More Important Things To Do
No effect on my life
Do not participate
Other
Don't Know/refused
Other
Totals
ChiSq Significance
Don't know/NA/Refused
Household Income
535.37%
637.05%
00.00%
319.63%
00.00%
17.96%
00.00%
16100.00%
Under 50%*
www.peaksurveys.com QLI Household Income 2012 84 D
Household Income

Public Safety
Safety Walking in Neighborhood at Night
(19) How safe do you feelwalking in your neighborhoodduring the night?
Very safe
Somewhat safe
Somewhat unsafe
Very unsafe
Totals
ChiSq Significance
Under $25,000
Household Income
2939.95%
1825.09%
1216.82%
1318.14%
72100.00%
Yes at 99.0%
$25,001 to $49,999
3936.69%
4441.30%
1513.90%
98.11%
107100.00%
$50,000 to $74,999
5666.71%
2024.06%
44.46%
44.78%
84100.00%
$75,000 to $150,000
7361.96%
3428.51%
108.11%
21.43%
119100.00%
Over $150,000
2264.25%
925.16%
12.48%
38.10%
34100.00%
(19) How safe do you feelwalking in your neighborhoodduring the night?
Very safe
Somewhat safe
Somewhat unsafe
Very unsafe
Totals
ChiSq Significance
Don't know/NA/Refused
Household Income
4654.56%
2428.70%
911.02%
55.72%
84100.00%
Yes at 99.0%
www.peaksurveys.com QLI Household Income 2012 85 D
Household Income

Respondent Agreement with the Needs of the Homeless being Adequately Addressed in the Pikes Peak Region
(20) Please tell us your level of agreementwith the following statement: The needs ofthe homeless are being adequatelyaddressed in the Pikes Peak region.
Strongly agree
Agree
Disagree
Strongly disagree
Don't know
Totals
ChiSq Significance
Under $25,000
Household Income
57.58%
1723.86%
2129.15%
2433.30%
46.11%
72100.00%
Yes at 99.0%
$25,001 to $49,999
87.89%
3331.40%
4138.34%
1110.31%
1312.06%
107100.00%
$50,000 to $74,999
44.53%
3642.49%
1921.98%
1720.53%
910.47%
84100.00%
$75,000 to $150,000
119.25%
5243.78%
3226.79%
1512.47%
97.71%
119100.00%
Over $150,000
37.44%
1646.05%
618.93%
01.34%
926.24%
34100.00%
(20) Please tell us your level of agreementwith the following statement: The needs ofthe homeless are being adequatelyaddressed in the Pikes Peak region.
Strongly agree
Agree
Disagree
Strongly disagree
Don't know
Totals
ChiSq Significance
Don't know/NA/Refused
Household Income
66.65%
3338.84%
2428.45%
77.79%
1518.27%
84100.00%
Yes at 99.0%
www.peaksurveys.com QLI Household Income 2012 86 D
Household Income

Community Engagement
* Note: ChiSq has over 20% low count cells.
How Accepting Respondents' feel the Community is of the Differences in Race, Ethnicity, Religious Preference, and GenderOrientation
How accepting of the differences inrace, Ethnicity, religious preference,and gender orientation do youconsider the community to be?
Very accepting
Somewhat accepting
Not very accepting
Not accepting at all
Don't know/NA
Totals
ChiSq Significance
Under $25,000
Household Income
1723.57%
4664.12%
68.12%
34.19%
00.00%
72100.00%
Yes at 90.0%*
$25,001 to $49,999
5147.67%
4239.73%
1110.57%
10.79%
11.24%
107100.00%
$50,000 to $74,999
2731.52%
4249.44%
1517.54%
00.50%
11.00%
84100.00%
$75,000 to $150,000
4739.43%
4941.47%
1714.07%
43.75%
21.28%
119100.00%
Over $150,000
1337.51%
1748.39%
00.00%
411.62%
12.48%
34100.00%
How accepting of the differences inrace, Ethnicity, religious preference,and gender orientation do youconsider the community to be?
Very accepting
Somewhat accepting
Not very accepting
Not accepting at all
Don't know/NA
Totals
ChiSq Significance
Don't know/NA/Refused
Household Income
3642.91%
4048.13%
56.40%
11.52%
11.05%
84100.00%
Yes at 90.0%*
www.peaksurveys.com QLI Household Income 2012 87 D
Household Income
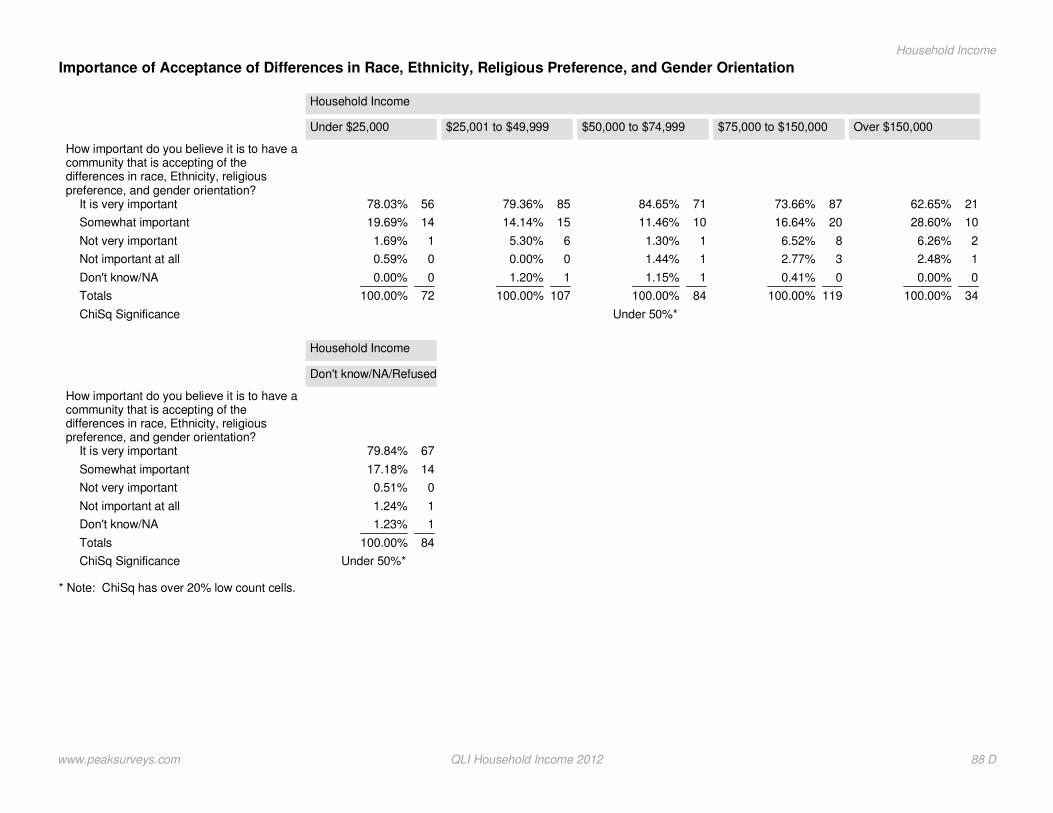
* Note: ChiSq has over 20% low count cells.
Importance of Acceptance of Differences in Race, Ethnicity, Religious Preference, and Gender Orientation
How important do you believe it is to have acommunity that is accepting of thedifferences in race, Ethnicity, religiouspreference, and gender orientation?
It is very important
Somewhat important
Not very important
Not important at all
Don't know/NA
Totals
ChiSq Significance
Under $25,000
Household Income
5678.03%
1419.69%
11.69%
00.59%
00.00%
72100.00%
Under 50%*
$25,001 to $49,999
8579.36%
1514.14%
65.30%
00.00%
11.20%
107100.00%
$50,000 to $74,999
7184.65%
1011.46%
11.30%
11.44%
11.15%
84100.00%
$75,000 to $150,000
8773.66%
2016.64%
86.52%
32.77%
00.41%
119100.00%
Over $150,000
2162.65%
1028.60%
26.26%
12.48%
00.00%
34100.00%
How important do you believe it is to have acommunity that is accepting of thedifferences in race, Ethnicity, religiouspreference, and gender orientation?
It is very important
Somewhat important
Not very important
Not important at all
Don't know/NA
Totals
ChiSq Significance
Don't know/NA/Refused
Household Income
6779.84%
1417.18%
00.51%
11.24%
11.23%
84100.00%
Under 50%*
www.peaksurveys.com QLI Household Income 2012 88 D
Household Income
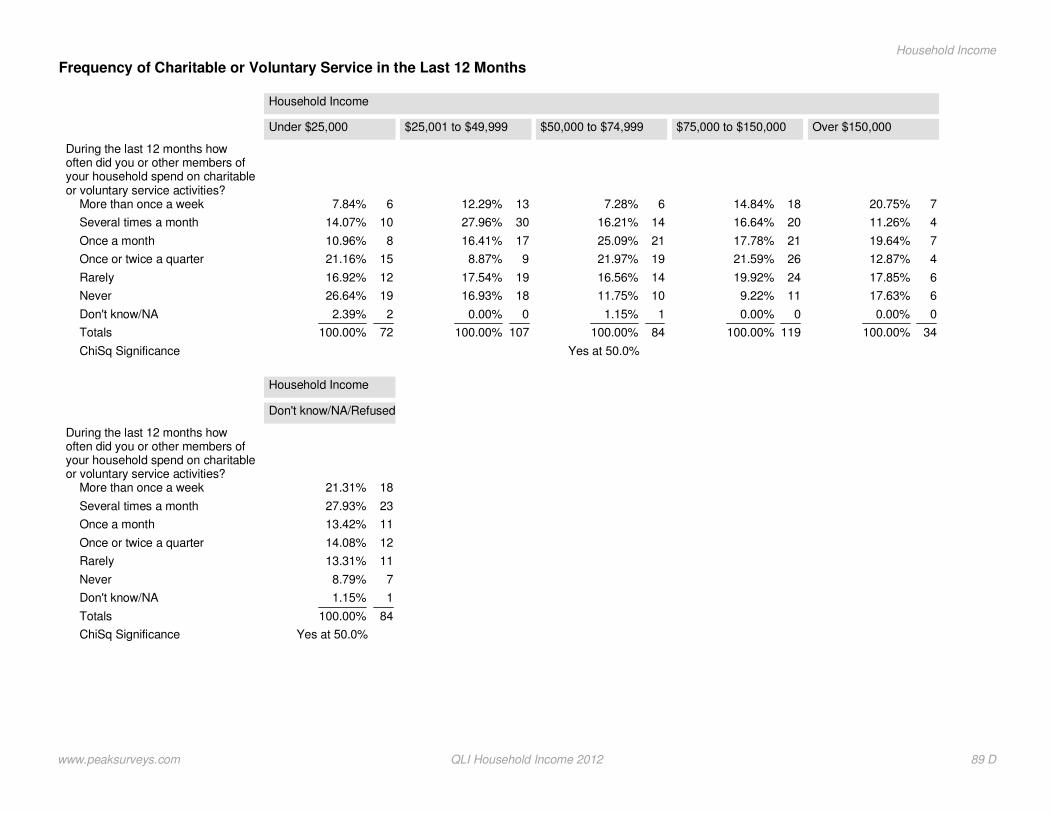
Frequency of Charitable or Voluntary Service in the Last 12 Months
During the last 12 months howoften did you or other members ofyour household spend on charitableor voluntary service activities?
More than once a week
Several times a month
Once a month
Once or twice a quarter
Rarely
Never
Don't know/NA
Totals
ChiSq Significance
Under $25,000
Household Income
67.84%
1014.07%
810.96%
1521.16%
1216.92%
1926.64%
22.39%
72100.00%
Yes at 50.0%
$25,001 to $49,999
1312.29%
3027.96%
1716.41%
98.87%
1917.54%
1816.93%
00.00%
107100.00%
$50,000 to $74,999
67.28%
1416.21%
2125.09%
1921.97%
1416.56%
1011.75%
11.15%
84100.00%
$75,000 to $150,000
1814.84%
2016.64%
2117.78%
2621.59%
2419.92%
119.22%
00.00%
119100.00%
Over $150,000
720.75%
411.26%
719.64%
412.87%
617.85%
617.63%
00.00%
34100.00%
During the last 12 months howoften did you or other members ofyour household spend on charitableor voluntary service activities?
More than once a week
Several times a month
Once a month
Once or twice a quarter
Rarely
Never
Don't know/NA
Totals
ChiSq Significance
Don't know/NA/Refused
Household Income
1821.31%
2327.93%
1113.42%
1214.08%
1113.31%
78.79%
11.15%
84100.00%
Yes at 50.0%
www.peaksurveys.com QLI Household Income 2012 89 D
Household Income

* Note: ChiSq has over 20% low count cells.
Frequency of Donating Money or Property in the Last 12 Months
How often have you or other members of yourhousehold donated money or property to charity in thelast 12 months? By donating I mean making a voluntarycontribution with no intention of making a profi
Weekly
Monthly
Quarterly
Occasionally
Never
Don't know/NA
Totals
ChiSq Significance
Under $25,000
Household Income
34.72%
2027.19%
811.10%
3244.83%
810.47%
11.69%
72100.00%
Yes at 99.0%*
$25,001 to $49,999
109.49%
4037.20%
1816.73%
2523.09%
1413.06%
00.43%
107100.00%
$50,000 to $74,999
1719.79%
2832.87%
1619.55%
2327.12%
10.68%
00.00%
84100.00%
$75,000 to $150,000
2016.76%
4941.62%
3529.44%
1411.67%
10.51%
00.00%
119100.00%
How often have you or other members of yourhousehold donated money or property to charity in thelast 12 months? By donating I mean making a voluntarycontribution with no intention of making a profi
Weekly
Monthly
Quarterly
Occasionally
Never
Don't know/NA
Totals
ChiSq Significance
Over $150,000
Household Income
824.50%
1441.65%
618.73%
515.12%
00.00%
00.00%
34100.00%
Yes at 99.0%*
Don't know/NA/Refused
1416.45%
3946.16%
1417.15%
1214.44%
45.25%
00.55%
84100.00%
www.peaksurveys.com QLI Household Income 2012 90 D
Household Income
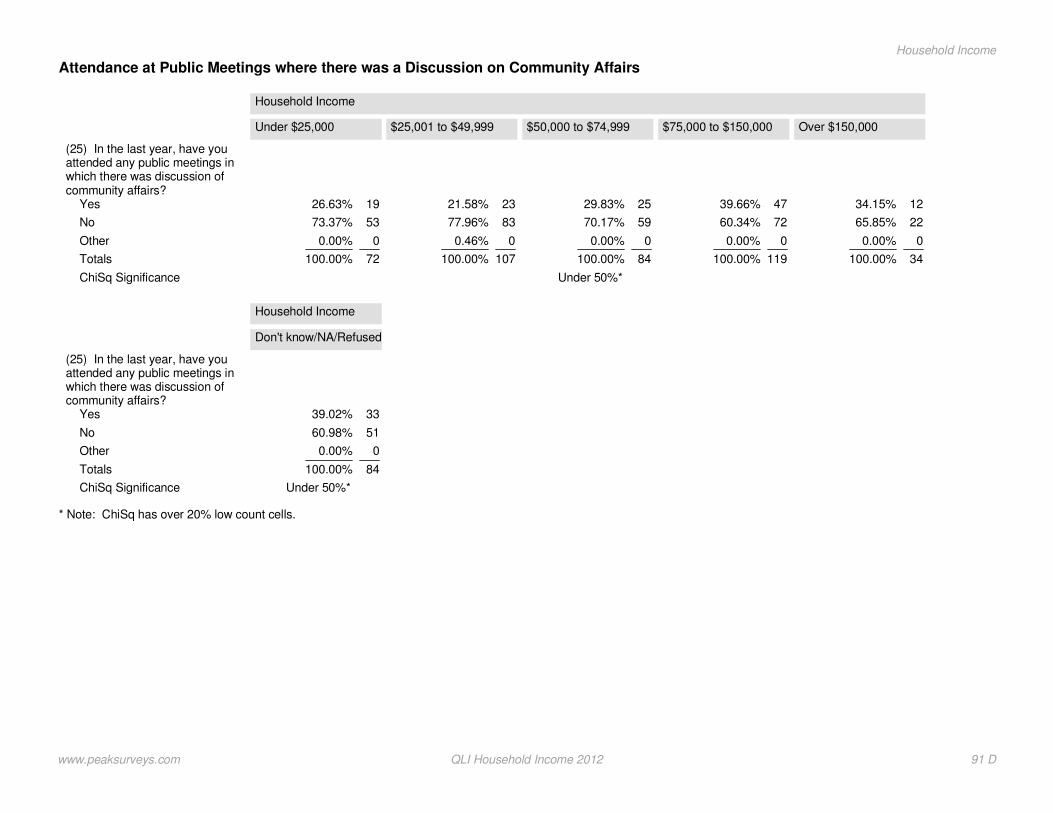
* Note: ChiSq has over 20% low count cells.
Attendance at Public Meetings where there was a Discussion on Community Affairs
(25) In the last year, have youattended any public meetings inwhich there was discussion ofcommunity affairs?
Yes
No
Other
Totals
ChiSq Significance
Under $25,000
Household Income
1926.63%
5373.37%
00.00%
72100.00%
Under 50%*
$25,001 to $49,999
2321.58%
8377.96%
00.46%
107100.00%
$50,000 to $74,999
2529.83%
5970.17%
00.00%
84100.00%
$75,000 to $150,000
4739.66%
7260.34%
00.00%
119100.00%
Over $150,000
1234.15%
2265.85%
00.00%
34100.00%
(25) In the last year, have youattended any public meetings inwhich there was discussion ofcommunity affairs?
Yes
No
Other
Totals
ChiSq Significance
Don't know/NA/Refused
Household Income
3339.02%
5160.98%
00.00%
84100.00%
Under 50%*
www.peaksurveys.com QLI Household Income 2012 91 D
Household Income
Section E
racecommunity survey
Peak Surveys
www.peaksurveys.com
Community and QLI Survey 2012
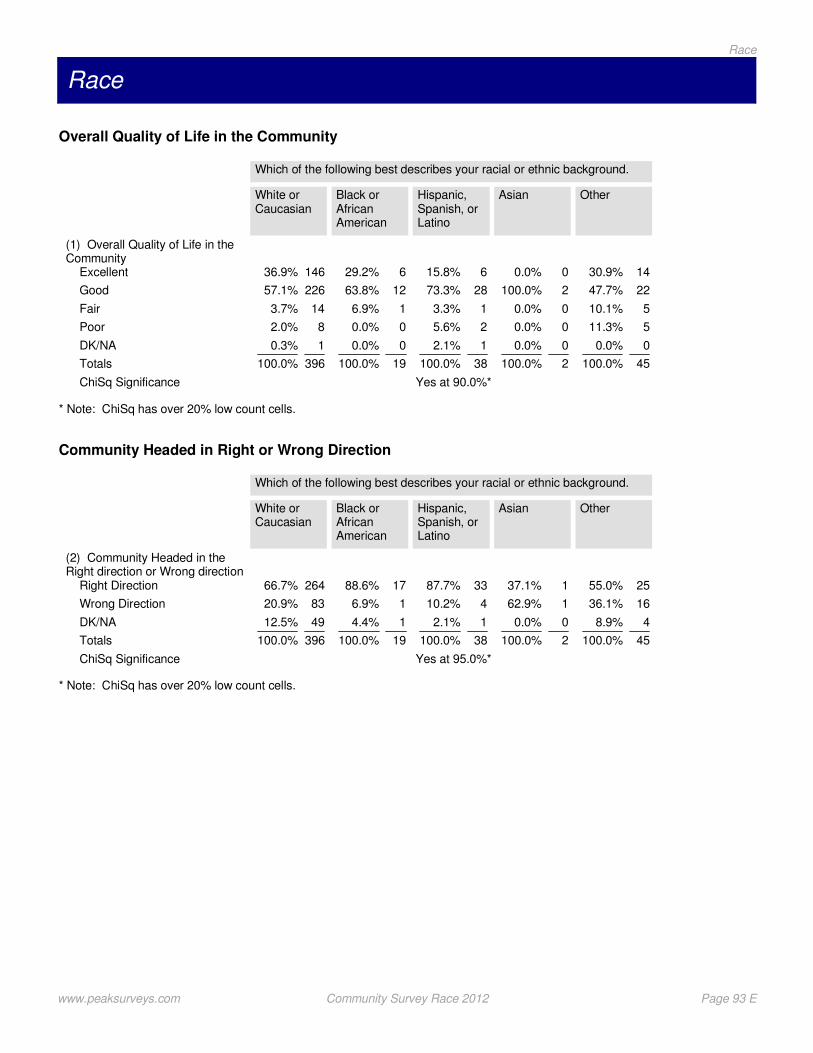
Race
* Note: ChiSq has over 20% low count cells.
Overall Quality of Life in the Community
(1) Overall Quality of Life in theCommunity
Excellent
Good
Fair
Poor
DK/NA
Totals
ChiSq Significance
White orCaucasian
Which of the following best describes your racial or ethnic background.
14636.9%
22657.1%
143.7%
82.0%
10.3%
396100.0%
Yes at 90.0%*
Black orAfricanAmerican
629.2%
1263.8%
16.9%
00.0%
00.0%
19100.0%
Hispanic,Spanish, orLatino
615.8%
2873.3%
13.3%
25.6%
12.1%
38100.0%
Asian
00.0%
2100.0%
00.0%
00.0%
00.0%
2100.0%
Other
1430.9%
2247.7%
510.1%
511.3%
00.0%
45100.0%
* Note: ChiSq has over 20% low count cells.
Community Headed in Right or Wrong Direction
(2) Community Headed in theRight direction or Wrong direction
Right Direction
Wrong Direction
DK/NA
Totals
ChiSq Significance
White orCaucasian
Which of the following best describes your racial or ethnic background.
26466.7%
8320.9%
4912.5%
396100.0%
Yes at 95.0%*
Black orAfricanAmerican
1788.6%
16.9%
14.4%
19100.0%
Hispanic,Spanish, orLatino
3387.7%
410.2%
12.1%
38100.0%
Asian
137.1%
162.9%
00.0%
2100.0%
Other
2555.0%
1636.1%
48.9%
45100.0%
www.peaksurveys.com Community Survey Race 2012 Page 93 E
Race

* Note: ChiSq has over 20% low count cells.
Most Important Issue Facing the Community
2012 Most Important IssueFacing the Community
Jobs / Unemployment
Economy
Don't know/NA/Refused
Crime
Education / schools
Budget / spending / finances
Presidential election
Growth and development
Child safety / safety
Environment
Homeless
Taxes
Traffic / transportation
Funding for emergencyservices (law enforcement/fire)
Water issues
Road repair / maintenance
Government
Healthcare
None / nothing
Military
Infrastructure
Housing
Other
Totals
ChiSq Significance
White orCaucasian
Which of the following best describes your racial or ethnic background.
7318.4%
5413.6%
4611.7%
246.1%
318.0%
194.9%
174.3%
123.1%
71.7%
133.2%
92.2%
123.0%
102.4%
112.9%
102.5%
102.6%
82.0%
61.4%
61.5%
41.1%
30.9%
10.3%
92.3%
396100.0%
Yes at 99.0%*
Black orAfricanAmerican
02.4%
315.7%
02.6%
422.2%
211.4%
00.0%
00.0%
16.8%
318.3%
14.1%
00.0%
00.0%
02.6%
14.4%
00.0%
00.0%
00.0%
14.1%
00.0%
00.0%
00.0%
15.4%
00.0%
19100.0%
Hispanic,Spanish, orLatino
512.5%
512.4%
01.3%
1231.7%
615.2%
00.0%
00.0%
00.0%
24.2%
00.0%
514.5%
01.1%
25.9%
00.0%
00.0%
00.0%
00.0%
01.2%
00.0%
00.0%
00.0%
00.0%
00.0%
38100.0%
Asian
00.0%
00.0%
137.1%
00.0%
00.0%
00.0%
00.0%
00.0%
00.0%
162.9%
00.0%
00.0%
00.0%
00.0%
00.0%
00.0%
00.0%
00.0%
00.0%
00.0%
00.0%
00.0%
00.0%
2100.0%
Other
1124.7%
36.0%
49.9%
49.3%
36.5%
37.3%
00.0%
47.8%
47.8%
00.0%
00.0%
12.9%
12.9%
12.7%
23.9%
11.7%
11.3%
13.3%
00.0%
00.0%
00.0%
01.1%
01.0%
45100.0%
www.peaksurveys.com Community Survey Race 2012 Page 94 E
Race

* Note: ChiSq has over 20% low count cells.
Second Most Important Issue Facing the Community
2012 Second Most ImportantIssue Facing the Community
Don't know/NA/Refused
Jobs / Unemployment
Education / schools
Crime
Road repair / maintenance
None / nothing
Healthcare
Budget / spending / finances
Taxes
Economy
Homeless
Child safety / safety
Government
Environment
Water issues
Traffic / transportation
Funding for emergencyservices (law enforcement/fire)
Presidential election
Housing
Utilities
Growth and development
Military
Infrastructure
Other
Totals
ChiSq Significance
White orCaucasian
Which of the following best describes your racial or ethnic background.
9123.1%
358.9%
379.5%
256.3%
225.6%
205.0%
102.4%
153.8%
143.5%
133.2%
123.0%
81.9%
112.8%
92.2%
102.7%
92.4%
71.7%
61.5%
41.1%
61.4%
41.0%
20.4%
30.7%
235.9%
396100.0%
Yes at 99.0%*
Black orAfricanAmerican
29.3%
16.9%
00.0%
317.9%
15.4%
00.0%
02.4%
14.4%
00.0%
00.0%
00.0%
315.5%
00.0%
14.4%
00.0%
16.9%
16.9%
00.0%
00.0%
00.0%
14.1%
00.0%
00.0%
315.5%
19100.0%
Hispanic,Spanish, orLatino
410.0%
1334.1%
13.5%
37.1%
512.5%
410.6%
01.2%
13.4%
00.0%
00.0%
12.1%
13.4%
00.0%
12.1%
00.0%
00.0%
00.0%
13.2%
13.3%
00.0%
00.0%
00.0%
00.0%
13.4%
38100.0%
Asian
137.1%
00.0%
00.0%
00.0%
00.0%
00.0%
00.0%
00.0%
00.0%
00.0%
00.0%
00.0%
00.0%
162.9%
00.0%
00.0%
00.0%
00.0%
00.0%
00.0%
00.0%
00.0%
00.0%
00.0%
2100.0%
Other
920.5%
919.2%
25.1%
13.2%
12.9%
00.0%
817.3%
00.0%
13.3%
12.9%
00.0%
00.0%
01.0%
00.0%
01.0%
00.0%
12.7%
00.0%
13.1%
00.0%
01.0%
35.7%
00.0%
511.0%
45100.0%
www.peaksurveys.com Community Survey Race 2012 Page 95 E
Race

* Note: ChiSq has over 20% low count cells.
Primary Source of Information When Getting Involved or Volunteering
(5) Primary Source ofInformattion when gettingInvolved or Volunteering
Church
Friends or Family
Internet
Local TV News
Newspaper
Local Non- profit organizations
Other
DK/NA
Totals
ChiSq Significance
White orCaucasian
Which of the following best describes your racial or ethnic background.
9925.0%
8120.4%
6716.9%
4411.1%
4310.8%
328.0%
276.8%
40.9%
396100.0%
Under 50%*
Black orAfricanAmerican
315.3%
314.0%
420.9%
634.0%
00.0%
16.9%
28.9%
00.0%
19100.0%
Hispanic,Spanish, orLatino
718.3%
923.0%
924.6%
614.8%
12.3%
38.8%
36.9%
01.3%
38100.0%
Asian
137.1%
162.9%
00.0%
00.0%
00.0%
00.0%
00.0%
00.0%
2100.0%
Other
1329.0%
920.9%
35.8%
816.9%
36.2%
37.5%
612.6%
01.1%
45100.0%
* Note: ChiSq has over 20% low count cells.
Who Respondents Trust When Addressing Community Issues
(6) Who Respondents Trust toAddress Community Issues
Religious organizations
Nonprofit organizations
Local businesses
Someone else
Local government
DK/NA
Totals
ChiSq Significance
White orCaucasian
Which of the following best describes your racial or ethnic background.
9824.7%
8521.5%
7318.4%
6215.7%
5213.0%
266.7%
396100.0%
Yes at 50.0%*
Black orAfricanAmerican
738.9%
315.5%
210.9%
527.9%
00.0%
16.8%
19100.0%
Hispanic,Spanish, orLatino
820.8%
1436.7%
614.6%
37.6%
719.1%
01.2%
38100.0%
Asian
00.0%
2100.0%
00.0%
00.0%
00.0%
00.0%
2100.0%
Other
1021.0%
1431.0%
48.8%
1124.1%
12.8%
612.3%
45100.0%
www.peaksurveys.com Community Survey Race 2012 Page 96 E
Race

* Note: ChiSq has over 20% low count cells.
Favorability of County Commissioners
(7) Favorability of CountyCommissioners
Very favorable
Somewhat favorable
Somewhat unfavorable
Very unfavorable
Never heard of them
DK/NA
Totals
ChiSq Significance
White orCaucasian
Which of the following best describes your racial or ethnic background.
307.6%
16642.1%
4110.3%
307.5%
5514.0%
7318.4%
396100.0%
Yes at 75.0%*
Black orAfricanAmerican
00.0%
527.2%
420.0%
210.9%
632.1%
29.9%
19100.0%
Hispanic,Spanish, orLatino
12.1%
1951.2%
614.8%
12.6%
820.0%
49.3%
38100.0%
Asian
00.0%
00.0%
162.9%
00.0%
137.1%
00.0%
2100.0%
Other
716.5%
1328.1%
24.0%
920.4%
920.0%
511.0%
45100.0%
* Note: ChiSq has over 20% low count cells.
Favorability of Colorado Springs Mayor
Favorability of Colorado SpringsMayor
Very favorable
Somewhat favorable
Somewhat unfavorable
Very unfavorable
Never heard of them
DK/NA
Totals
ChiSq Significance
White orCaucasian
Which of the following best describes your racial or ethnic background.
6323.9%
9435.6%
228.2%
197.2%
166.2%
5018.8%
264100.0%
Yes at 99.0%*
Black orAfricanAmerican
17.5%
439.2%
213.9%
00.0%
432.0%
17.5%
11100.0%
Hispanic,Spanish, orLatino
24.9%
1748.1%
411.5%
27.1%
25.9%
822.6%
35100.0%
Asian
0
0
0
0
0
0
0%
Other
723.3%
14.9%
515.6%
930.2%
515.7%
310.1%
30100.0%
www.peaksurveys.com Community Survey Race 2012 Page 97 E
Race

* Note: ChiSq has over 20% low count cells.
Favorability of Colorado Springs City Council
(8) Favorability of ColoradoSprings City Council
Very favorable
Somewhat favorable
Somewhat unfavorable
Very unfavorable
Never heard of them
DK/NA
Totals
ChiSq Significance
White orCaucasian
Which of the following best describes your racial or ethnic background.
176.4%
10740.4%
4517.1%
207.4%
176.3%
5922.3%
264100.0%
Yes at 95.0%*
Black orAfricanAmerican
00.0%
327.5%
00.0%
213.9%
439.4%
219.1%
11100.0%
Hispanic,Spanish, orLatino
13.7%
1850.2%
411.6%
00.0%
38.2%
926.4%
35100.0%
Asian
0
0
0
0
0
0
0%
Other
310.9%
724.0%
825.5%
518.2%
411.7%
39.9%
30100.0%
www.peaksurveys.com Community Survey Race 2012 Page 98 E
Race

Question 9 below was asked as an open-ended question. We compiled the results into themes foreasier analysis, however we have listed all responses at the end of the document for more in-depth study.
* Note: ChiSq has over 20% low count cells.
Most Important for Local Government to do that will Strengthen Trust and Build Confidence
2012 What is most important forlocal government to do - that willstrengthen trust and buildconfidence?
Don't know/NA/Refused
Be honest / fair / tell the truth
More involvement withcommunity
Balance the budget / debt
Create more jobs
Listen to the people
Communicate
Do what they say they aregoing to do
Improve the economy
Be transparent
Increase emergency services(law enforcement / fire)
Transportation / roads
Keep taxes low / stop raisingtaxes
Work together
Education
Nothing / none
Decrease crime
Infrastructure
Other
Totals
ChiSq Significance
White orCaucasian
Which of the following best describes your racial or ethnic background.
4612.4%
4211.3%
328.7%
359.3%
287.6%
215.6%
287.5%
205.4%
277.3%
205.4%
113.1%
92.4%
72.0%
102.6%
61.7%
71.9%
51.5%
41.0%
133.6%
374100.0%
Yes at 90.0%*
Black orAfricanAmerican
16.8%
211.4%
420.7%
00.0%
16.9%
28.9%
14.1%
16.9%
15.4%
28.3%
00.0%
02.4%
16.9%
00.0%
14.1%
14.4%
00.0%
00.0%
02.6%
19100.0%
Hispanic,Spanish, orLatino
516.2%
719.9%
412.3%
00.0%
37.9%
721.5%
01.4%
14.2%
00.0%
13.7%
00.0%
39.0%
01.5%
00.0%
00.0%
00.0%
12.6%
00.0%
00.0%
33100.0%
Asian
137.1%
162.9%
00.0%
00.0%
00.0%
00.0%
00.0%
00.0%
00.0%
00.0%
00.0%
00.0%
00.0%
00.0%
00.0%
00.0%
00.0%
00.0%
00.0%
2100.0%
Other
410.3%
49.8%
25.3%
36.6%
12.2%
24.9%
00.0%
715.2%
00.0%
410.1%
49.9%
00.0%
24.2%
00.0%
24.0%
00.0%
00.0%
00.0%
817.6%
43100.0%
www.peaksurveys.com Community Survey Race 2012 Page 99 E
Race

* Note: ChiSq has over 20% low count cells.
Positive or Negative Impact of Tabor in the Community
(10) Positive or Negative Impactof Tabor in the Community
Generally positive impact
Generally negative impact
Really makes no difference
Don't know enough about it
Never heard of TABOR
DK/NA
Totals
ChiSq Significance
White orCaucasian
Which of the following best describes your racial or ethnic background.
12030.3%
11328.6%
153.9%
6215.7%
5413.7%
317.8%
396100.0%
Yes at 50.0%*
Black orAfricanAmerican
633.2%
318.3%
16.8%
28.3%
633.3%
00.0%
19100.0%
Hispanic,Spanish, orLatino
1025.9%
717.4%
12.1%
513.3%
1334.6%
36.7%
38100.0%
Asian
00.0%
162.9%
137.1%
00.0%
00.0%
00.0%
2100.0%
Other
1737.6%
716.5%
12.8%
511.8%
612.6%
818.8%
45100.0%
* Note: ChiSq has over 20% low count cells.
Favorability of Amending Tabor
(11) Favorability of AmendingTABOR?
Strongly favorable
Somewhat favorable
Somewhat unfavorable
Strongly unfavorable
DK/NA
Totals
ChiSq Significance
White orCaucasian
Which of the following best describes your racial or ethnic background.
8020.3%
9323.5%
369.2%
266.7%
16040.4%
396100.0%
Yes at 50.0%*
Black orAfricanAmerican
16.8%
631.1%
313.9%
14.4%
843.8%
19100.0%
Hispanic,Spanish, orLatino
410.3%
1436.3%
01.1%
13.4%
1848.8%
38100.0%
Asian
162.9%
137.1%
00.0%
00.0%
00.0%
2100.0%
Other
1023.2%
1636.3%
11.9%
613.6%
1125.1%
45100.0%
www.peaksurveys.com Community Survey Race 2012 Page 100 E
Race

For the following questions (12 through 28) the respondents were asked how concerned they arewith each issue.
* Note: ChiSq has over 20% low count cells.
Employment and Jobs
(12) Employment and jobsVery Concerned
Somewhat Concerned
Not Very Concerned
Not at all Concerned
DK/NA
Totals
ChiSq Significance
White orCaucasian
Which of the following best describes your racial or ethnic background.
27970.6%
9022.8%
174.3%
81.9%
10.3%
396100.0%
Yes at 95.0%*
Black orAfricanAmerican
1576.5%
423.5%
00.0%
00.0%
00.0%
19100.0%
Hispanic,Spanish, orLatino
3284.9%
513.9%
01.2%
00.0%
00.0%
38100.0%
Asian
162.9%
00.0%
00.0%
137.1%
00.0%
2100.0%
Other
3270.9%
613.1%
716.0%
00.0%
00.0%
45100.0%
* Note: ChiSq has over 20% low count cells.
Drugs and Alcohol
(13) Drugs and alcoholVery Concerned
Somewhat Concerned
Not Very Concerned
Not at all Concerned
DK/NA
Totals
ChiSq Significance
White orCaucasian
Which of the following best describes your racial or ethnic background.
18647.1%
11729.5%
6716.9%
235.8%
30.6%
396100.0%
Yes at 99.0%*
Black orAfricanAmerican
1053.9%
632.3%
313.7%
00.0%
00.0%
19100.0%
Hispanic,Spanish, orLatino
1847.3%
1950.4%
00.0%
12.3%
00.0%
38100.0%
Asian
162.9%
00.0%
00.0%
137.1%
00.0%
2100.0%
Other
4087.4%
37.0%
35.7%
00.0%
00.0%
45100.0%
* Note: ChiSq has over 20% low count cells.
Growth
(14) GrowthVery Concerned
Somewhat Concerned
Not Very Concerned
Not at all Concerned
DK/NA
Totals
ChiSq Significance
White orCaucasian
Which of the following best describes your racial or ethnic background.
11729.5%
17243.6%
6616.8%
348.6%
61.5%
396100.0%
Yes at 99.0%*
Black orAfricanAmerican
735.6%
527.0%
423.4%
29.5%
14.4%
19100.0%
Hispanic,Spanish, orLatino
1130.3%
1436.0%
718.0%
13.5%
512.1%
38100.0%
Asian
162.9%
137.1%
00.0%
00.0%
00.0%
2100.0%
Other
2759.9%
1123.8%
612.9%
23.4%
00.0%
45100.0%
www.peaksurveys.com Community Survey Race 2012 Page 101 E
Race

* Note: ChiSq has over 20% low count cells.
Affordable Housing
(15) Affordable housingVery Concerned
Somewhat Concerned
Not Very Concerned
Not at all Concerned
DK/NA
Totals
ChiSq Significance
White orCaucasian
Which of the following best describes your racial or ethnic background.
15839.8%
13133.1%
6917.4%
358.9%
30.8%
396100.0%
Yes at 99.0%*
Black orAfricanAmerican
1579.2%
420.8%
00.0%
00.0%
00.0%
19100.0%
Hispanic,Spanish, orLatino
1951.1%
1847.7%
01.2%
00.0%
00.0%
38100.0%
Asian
162.9%
00.0%
00.0%
00.0%
137.1%
2100.0%
Other
1941.6%
1532.6%
49.4%
614.2%
12.1%
45100.0%
* Note: ChiSq has over 20% low count cells.
Health Care Costs
(16) Health care costsVery Concerned
Somewhat Concerned
Not Very Concerned
Not at all Concerned
DK/NA
Totals
ChiSq Significance
White orCaucasian
Which of the following best describes your racial or ethnic background.
26266.2%
9925.1%
194.7%
153.9%
00.1%
396100.0%
Under 50%*
Black orAfricanAmerican
1686.0%
29.6%
14.4%
00.0%
00.0%
19100.0%
Hispanic,Spanish, orLatino
2463.5%
1232.9%
00.0%
13.5%
00.0%
38100.0%
Asian
162.9%
00.0%
00.0%
137.1%
00.0%
2100.0%
Other
3680.0%
715.4%
24.6%
00.0%
00.0%
45100.0%
* Note: ChiSq has over 20% low count cells.
Water Supply and Quality
(17) Water supply and qualityVery Concerned
Somewhat Concerned
Not Very Concerned
Not at all Concerned
DK/NA
Totals
ChiSq Significance
White orCaucasian
Which of the following best describes your racial or ethnic background.
20150.8%
13233.3%
328.2%
287.0%
30.7%
396100.0%
Yes at 99.0%*
Black orAfricanAmerican
1578.5%
314.5%
00.0%
16.9%
00.0%
19100.0%
Hispanic,Spanish, orLatino
1950.2%
820.4%
1128.2%
01.1%
00.0%
38100.0%
Asian
162.9%
00.0%
00.0%
137.1%
00.0%
2100.0%
Other
2555.8%
714.7%
1125.2%
13.3%
01.0%
45100.0%
www.peaksurveys.com Community Survey Race 2012 Page 102 E
Race

* Note: ChiSq has over 20% low count cells.
Effective Community Leadership
(18) Effective communityleadership
Very Concerned
Somewhat Concerned
Not Very Concerned
Not at all Concerned
DK/NA
Totals
ChiSq Significance
White orCaucasian
Which of the following best describes your racial or ethnic background.
18847.5%
12732.0%
348.6%
328.1%
153.8%
396100.0%
Yes at 50.0%*
Black orAfricanAmerican
1265.3%
632.2%
00.0%
02.6%
00.0%
19100.0%
Hispanic,Spanish, orLatino
1643.0%
1746.0%
49.9%
01.1%
00.0%
38100.0%
Asian
162.9%
00.0%
00.0%
137.1%
00.0%
2100.0%
Other
3167.7%
1022.5%
49.8%
00.0%
00.0%
45100.0%
* Note: ChiSq has over 20% low count cells.
Services to Homeless
(19) Services for the homelessVery Concerned
Somewhat Concerned
Not Very Concerned
Not at all Concerned
DK/NA
Totals
ChiSq Significance
White orCaucasian
Which of the following best describes your racial or ethnic background.
13634.4%
18847.4%
4411.1%
194.7%
92.3%
396100.0%
Yes at 99.0%*
Black orAfricanAmerican
1263.7%
736.3%
00.0%
00.0%
00.0%
19100.0%
Hispanic,Spanish, orLatino
2052.4%
1539.6%
13.2%
24.7%
00.0%
38100.0%
Asian
162.9%
00.0%
00.0%
137.1%
00.0%
2100.0%
Other
3269.7%
714.9%
25.0%
510.3%
00.0%
45100.0%
* Note: ChiSq has over 20% low count cells.
Access to Mental Health
(20) Access to mental healthcare
Very Concerned
Somewhat Concerned
Not Very Concerned
Not at all Concerned
DK/NA
Totals
ChiSq Significance
White orCaucasian
Which of the following best describes your racial or ethnic background.
12631.9%
12631.7%
7518.9%
5915.0%
102.4%
396100.0%
Yes at 75.0%*
Black orAfricanAmerican
1263.7%
314.0%
211.4%
210.9%
00.0%
19100.0%
Hispanic,Spanish, orLatino
1846.9%
1437.6%
38.7%
36.9%
00.0%
38100.0%
Asian
162.9%
00.0%
00.0%
137.1%
00.0%
2100.0%
Other
2350.7%
1125.1%
1021.1%
13.1%
00.0%
45100.0%
www.peaksurveys.com Community Survey Race 2012 Page 103 E
Race

* Note: ChiSq has over 20% low count cells.
Access to Quality Early Childhood Education
(21) Access to quality earlychildhood education
Very Concerned
Somewhat Concerned
Not Very Concerned
Not at all Concerned
DK/NA
Totals
ChiSq Significance
White orCaucasian
Which of the following best describes your racial or ethnic background.
13534.0%
13433.9%
7218.3%
4411.1%
102.6%
396100.0%
Yes at 99.0%*
Black orAfricanAmerican
1473.8%
420.7%
15.4%
00.0%
00.0%
19100.0%
Hispanic,Spanish, orLatino
1950.9%
1949.1%
00.0%
00.0%
00.0%
38100.0%
Asian
162.9%
00.0%
00.0%
137.1%
00.0%
2100.0%
Other
2759.3%
818.4%
47.9%
612.6%
11.7%
45100.0%
* Note: ChiSq has over 20% low count cells.
Student Achievement
(22) Student AchievementVery Concerned
Somewhat Concerned
Not Very Concerned
Not at all Concerned
DK/NA
Totals
ChiSq Significance
White orCaucasian
Which of the following best describes your racial or ethnic background.
19549.2%
14235.8%
358.8%
194.9%
51.3%
396100.0%
Yes at 50.0%*
Black orAfricanAmerican
1683.4%
316.6%
00.0%
00.0%
00.0%
19100.0%
Hispanic,Spanish, orLatino
2566.0%
1027.5%
24.4%
12.1%
00.0%
38100.0%
Asian
162.9%
00.0%
137.1%
00.0%
00.0%
2100.0%
Other
2963.0%
919.7%
48.2%
49.1%
00.0%
45100.0%
* Note: ChiSq has over 20% low count cells.
Arts and Culture Opportunities
(23) Arts and cultureopportunities
Very Concerned
Somewhat Concerned
Not Very Concerned
Not at all Concerned
DK/NA
Totals
ChiSq Significance
White orCaucasian
Which of the following best describes your racial or ethnic background.
7017.7%
12531.7%
11729.7%
7919.9%
41.0%
396100.0%
Yes at 99.0%*
Black orAfricanAmerican
633.8%
527.1%
527.7%
211.4%
00.0%
19100.0%
Hispanic,Spanish, orLatino
512.7%
1642.7%
1437.5%
37.1%
00.0%
38100.0%
Asian
162.9%
00.0%
00.0%
137.1%
00.0%
2100.0%
Other
2351.7%
1634.3%
37.3%
25.0%
11.7%
45100.0%
www.peaksurveys.com Community Survey Race 2012 Page 104 E
Race

* Note: ChiSq has over 20% low count cells.
Crime Rate
(24) Crime rateVery Concerned
Somewhat Concerned
Not Very Concerned
Not at all Concerned
DK/NA
Totals
ChiSq Significance
White orCaucasian
Which of the following best describes your racial or ethnic background.
19850.1%
11930.1%
5614.1%
204.9%
30.7%
396100.0%
Yes at 50.0%*
Black orAfricanAmerican
1578.7%
421.3%
00.0%
00.0%
00.0%
19100.0%
Hispanic,Spanish, orLatino
2668.7%
922.6%
38.7%
00.0%
00.0%
38100.0%
Asian
162.9%
00.0%
137.1%
00.0%
00.0%
2100.0%
Other
3474.0%
920.3%
35.7%
00.0%
00.0%
45100.0%
* Note: ChiSq has over 20% low count cells.
Voter Participation
(25) Voter participationVery Concerned
Somewhat Concerned
Not Very Concerned
Not at all Concerned
DK/NA
Totals
ChiSq Significance
White orCaucasian
Which of the following best describes your racial or ethnic background.
19348.7%
11328.6%
5112.8%
328.2%
71.7%
396100.0%
Yes at 75.0%*
Black orAfricanAmerican
1156.8%
422.3%
16.9%
211.4%
02.6%
19100.0%
Hispanic,Spanish, orLatino
1847.6%
1848.9%
13.4%
00.0%
00.0%
38100.0%
Asian
162.9%
00.0%
137.1%
00.0%
00.0%
2100.0%
Other
3271.1%
817.9%
00.0%
511.1%
00.0%
45100.0%
* Note: ChiSq has over 20% low count cells.
Community Engagement in Local Issues
(26) Community engagement inlocal issues
Very Concerned
Somewhat Concerned
Not Very Concerned
Not at all Concerned
DK/NA
Totals
ChiSq Significance
White orCaucasian
Which of the following best describes your racial or ethnic background.
9223.3%
19549.3%
7118.0%
266.5%
122.9%
396100.0%
Yes at 99.0%*
Black orAfricanAmerican
1263.7%
318.2%
318.0%
00.0%
00.0%
19100.0%
Hispanic,Spanish, orLatino
718.3%
2259.6%
717.4%
24.7%
00.0%
38100.0%
Asian
162.9%
00.0%
00.0%
137.1%
00.0%
2100.0%
Other
3167.6%
816.6%
00.0%
714.8%
01.0%
45100.0%
www.peaksurveys.com Community Survey Race 2012 Page 105 E
Race

* Note: ChiSq has over 20% low count cells.
Public Transit
(27) Public transitVery Concerned
Somewhat Concerned
Not Very Concerned
Not at all Concerned
DK/NA
Totals
ChiSq Significance
White orCaucasian
Racial Background
9624.2%
14536.6%
9223.2%
5313.3%
112.8%
396100.0%
Yes at 90.0%*
Black orAfricanAmerican
1262.4%
524.1%
16.8%
16.7%
00.0%
19100.0%
Hispanic,Spanish, orLatino
1745.8%
1334.9%
512.4%
36.9%
00.0%
38100.0%
Asian
162.9%
00.0%
00.0%
137.1%
00.0%
2100.0%
Other
1636.1%
1636.3%
1225.6%
12.1%
00.0%
45100.0%
* Note: ChiSq has over 20% low count cells.
Land Use
(28) Land useVery Concerned
Somewhat Concerned
Not Very Concerned
Not at all Concerned
DK/NA
Totals
ChiSq Significance
White orCaucasian
Which of the following best describes your racial or ethnic background.
11128.0%
17343.7%
7118.0%
246.0%
174.3%
396100.0%
Under 50%*
Black orAfricanAmerican
737.9%
945.6%
313.9%
02.6%
00.0%
19100.0%
Hispanic,Spanish, orLatino
1130.5%
1436.1%
1130.0%
00.0%
13.4%
38100.0%
Asian
162.9%
00.0%
00.0%
137.1%
00.0%
2100.0%
Other
1941.7%
1941.7%
715.4%
01.1%
00.0%
45100.0%
www.peaksurveys.com Community Survey Race 2012 Page 106 E
Race

Section E
racequality of life
Peak Surveys
www.peaksurveys.com
Community and QLI Survey 2012
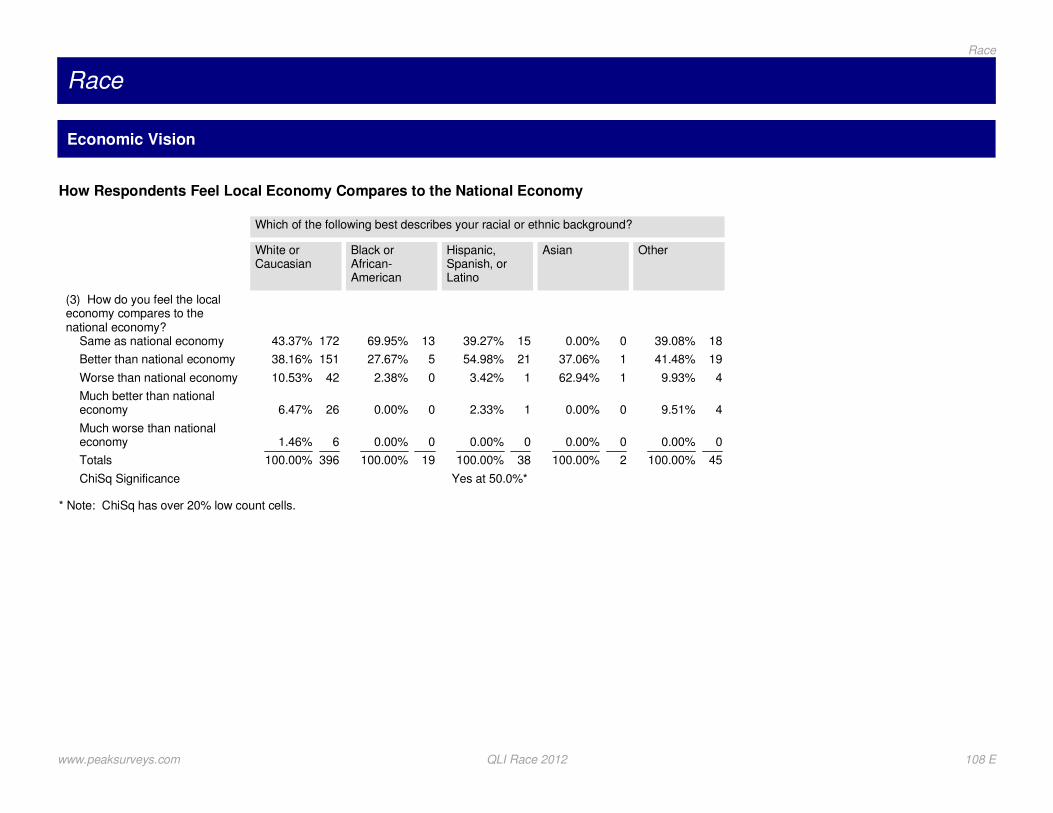
Race
Economic Vision
* Note: ChiSq has over 20% low count cells.
How Respondents Feel Local Economy Compares to the National Economy
(3) How do you feel the localeconomy compares to thenational economy?
Same as national economy
Better than national economy
Worse than national economy
Much better than nationaleconomy
Much worse than nationaleconomy
Totals
ChiSq Significance
White orCaucasian
Which of the following best describes your racial or ethnic background?
17243.37%
15138.16%
4210.53%
266.47%
61.46%
396100.00%
Yes at 50.0%*
Black orAfrican-American
1369.95%
527.67%
02.38%
00.00%
00.00%
19100.00%
Hispanic,Spanish, orLatino
1539.27%
2154.98%
13.42%
12.33%
00.00%
38100.00%
Asian
00.00%
137.06%
162.94%
00.00%
00.00%
2100.00%
Other
1839.08%
1941.48%
49.93%
49.51%
00.00%
45100.00%
www.peaksurveys.com QLI Race 2012 108 E
Race
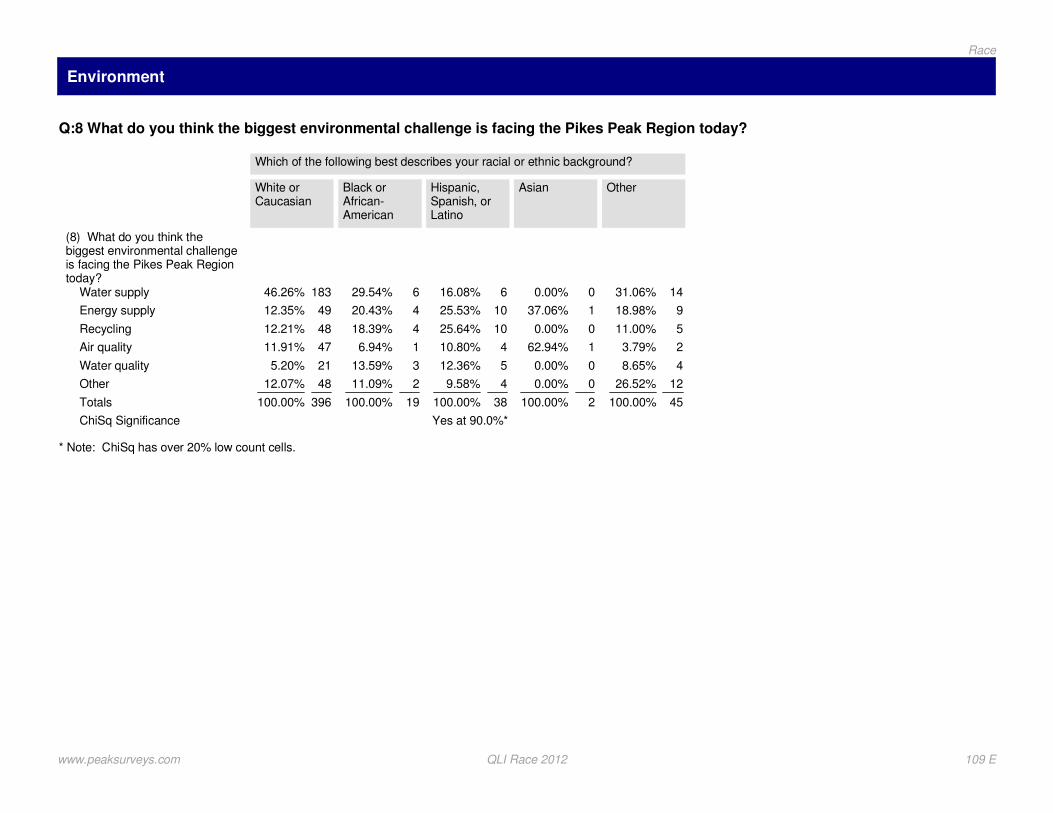
Environment
* Note: ChiSq has over 20% low count cells.
Q:8 What do you think the biggest environmental challenge is facing the Pikes Peak Region today?
(8) What do you think thebiggest environmental challengeis facing the Pikes Peak Regiontoday?
Water supply
Energy supply
Recycling
Air quality
Water quality
Other
Totals
ChiSq Significance
White orCaucasian
Which of the following best describes your racial or ethnic background?
18346.26%
4912.35%
4812.21%
4711.91%
215.20%
4812.07%
396100.00%
Yes at 90.0%*
Black orAfrican-American
629.54%
420.43%
418.39%
16.94%
313.59%
211.09%
19100.00%
Hispanic,Spanish, orLatino
616.08%
1025.53%
1025.64%
410.80%
512.36%
49.58%
38100.00%
Asian
00.00%
137.06%
00.00%
162.94%
00.00%
00.00%
2100.00%
Other
1431.06%
918.98%
511.00%
23.79%
48.65%
1226.52%
45100.00%
www.peaksurveys.com QLI Race 2012 109 E
Race
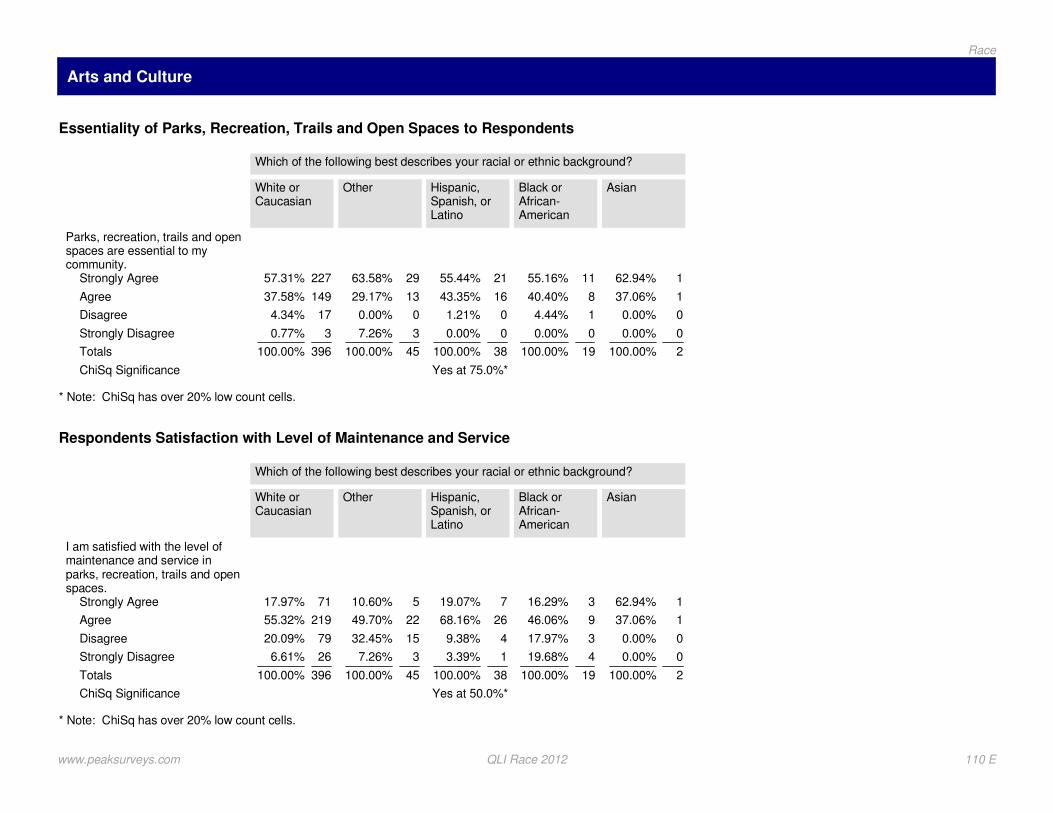
Arts and Culture
* Note: ChiSq has over 20% low count cells.
Essentiality of Parks, Recreation, Trails and Open Spaces to Respondents
Parks, recreation, trails and openspaces are essential to mycommunity.
Strongly Agree
Agree
Disagree
Strongly Disagree
Totals
ChiSq Significance
White orCaucasian
Which of the following best describes your racial or ethnic background?
22757.31%
14937.58%
174.34%
30.77%
396100.00%
Yes at 75.0%*
Other
2963.58%
1329.17%
00.00%
37.26%
45100.00%
Hispanic,Spanish, orLatino
2155.44%
1643.35%
01.21%
00.00%
38100.00%
Black orAfrican-American
1155.16%
840.40%
14.44%
00.00%
19100.00%
Asian
162.94%
137.06%
00.00%
00.00%
2100.00%
* Note: ChiSq has over 20% low count cells.
Respondents Satisfaction with Level of Maintenance and Service
I am satisfied with the level ofmaintenance and service inparks, recreation, trails and openspaces.
Strongly Agree
Agree
Disagree
Strongly Disagree
Totals
ChiSq Significance
White orCaucasian
Which of the following best describes your racial or ethnic background?
7117.97%
21955.32%
7920.09%
266.61%
396100.00%
Yes at 50.0%*
Other
510.60%
2249.70%
1532.45%
37.26%
45100.00%
Hispanic,Spanish, orLatino
719.07%
2668.16%
49.38%
13.39%
38100.00%
Black orAfrican-American
316.29%
946.06%
317.97%
419.68%
19100.00%
Asian
162.94%
137.06%
00.00%
00.00%
2100.00%
www.peaksurveys.com QLI Race 2012 110 E
Race

* Note: ChiSq has over 20% low count cells.
Respondents Agreement Level of Arts and Culture Improve Quality of Life
Arts and Culture improve myquality of life.
Strongly Agree
Agree
Disagree
Strongly Disagree
Totals
ChiSq Significance
White orCaucasian
Which of the following best describes your racial or ethnic background?
9724.55%
22556.76%
6716.88%
71.81%
396100.00%
Yes at 99.0%*
Other
2658.03%
1328.87%
613.10%
00.00%
45100.00%
Hispanic,Spanish, orLatino
614.70%
2462.90%
822.40%
00.00%
38100.00%
Black orAfrican-American
739.06%
736.09%
524.86%
00.00%
19100.00%
Asian
162.94%
137.06%
00.00%
00.00%
2100.00%
* Note: ChiSq has over 20% low count cells.
Reasons Respondents Agree on Arts and Culture Improve Quality of Life
Why do you believe it improves thequality of your life?
Spiritual / Relaxing
Entertaining
Exposure / Growth
Enriches Life
Something To Do
Better Educated / Open Mind
Experience Something New
Exposure to New Cultures
Recreation
Artist / Musician
Nothing / none
Other
Don't Know/refused
Totals
ChiSq Significance
White orCaucasian
Which of the following best describes your racial or ethnic background?
113.33%
257.81%
4413.71%
6219.46%
247.36%
3310.30%
164.84%
319.58%
103.04%
3310.16%
123.64%
30.93%
195.85%
321100.00%
Yes at 50.0%*
Other
00.00%
819.12%
38.80%
37.14%
25.03%
37.30%
511.71%
1026.57%
48.94%
25.38%
00.00%
00.00%
00.00%
39100.00%
Hispanic,Spanish, orLatino
00.00%
00.00%
827.28%
515.74%
14.41%
310.49%
414.71%
38.63%
14.52%
12.89%
12.70%
01.55%
27.07%
29100.00%
Black orAfrican-American
00.00%
00.00%
15.52%
533.18%
19.24%
533.49%
00.00%
215.15%
00.00%
03.42%
00.00%
00.00%
00.00%
14100.00%
Asian
00.00%
00.00%
00.00%
137.06%
00.00%
00.00%
00.00%
162.94%
00.00%
00.00%
00.00%
00.00%
00.00%
2100.00%
www.peaksurveys.com QLI Race 2012 111 E
Race

* Note: ChiSq has over 20% low count cells.
Why Respondent Believes it Does Not Improve the Quality of Their Life
Why do you believe it does notimprove the quality of your life?
No Interest
More Important Things To Do
No effect on my life
Do not participate
Other
Don't Know/refused
Other
Totals
ChiSq Significance
White orCaucasian
Which of the following best describes your racial or ethnic background?
2942.54%
1725.11%
1420.94%
35.14%
11.31%
23.70%
11.26%
67100.00%
Yes at 95.0%*
Black orAfrican-American
237.52%
116.68%
127.94%
00.00%
00.00%
117.86%
00.00%
5100.00%
Hispanic,Spanish, orLatino
110.81%
338.88%
00.00%
00.00%
450.31%
00.00%
00.00%
8100.00%
Asian
0
0
0
0
0
0
0
0%
Other
238.28%
230.77%
00.00%
230.95%
00.00%
00.00%
00.00%
6100.00%
www.peaksurveys.com QLI Race 2012 112 E
Race
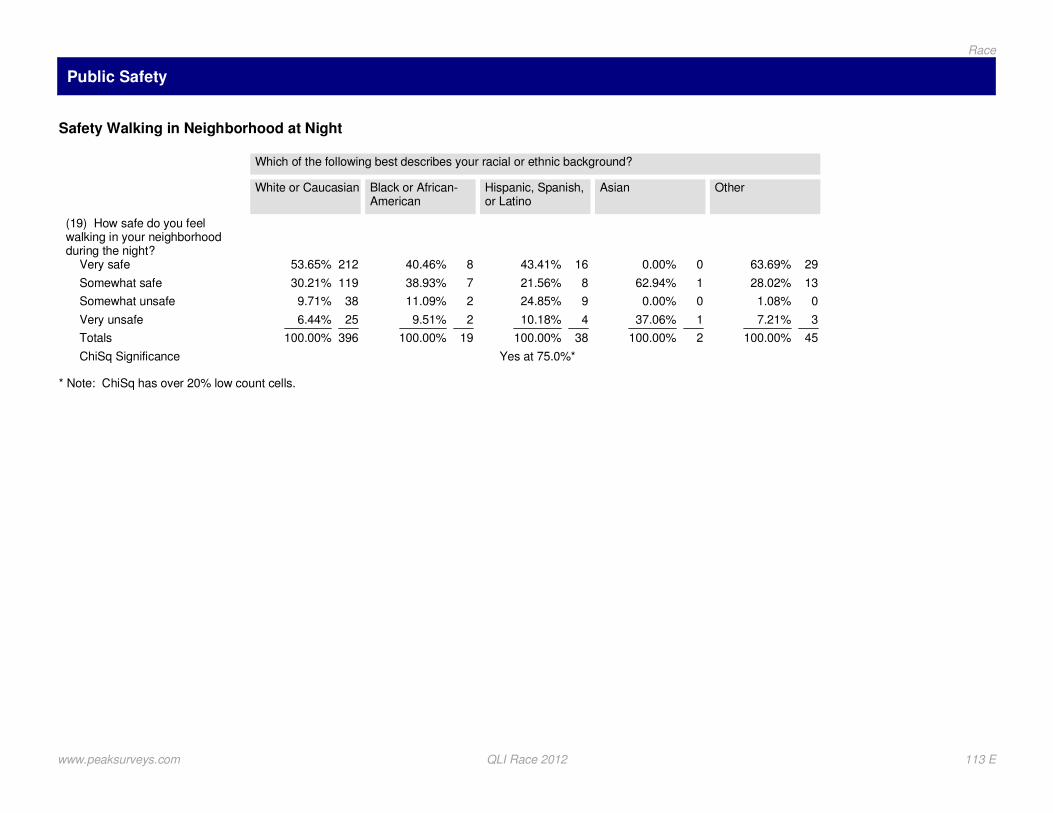
Public Safety
* Note: ChiSq has over 20% low count cells.
Safety Walking in Neighborhood at Night
(19) How safe do you feelwalking in your neighborhoodduring the night?
Very safe
Somewhat safe
Somewhat unsafe
Very unsafe
Totals
ChiSq Significance
White or Caucasian
Which of the following best describes your racial or ethnic background?
21253.65%
11930.21%
389.71%
256.44%
396100.00%
Yes at 75.0%*
Black or African-American
840.46%
738.93%
211.09%
29.51%
19100.00%
Hispanic, Spanish,or Latino
1643.41%
821.56%
924.85%
410.18%
38100.00%
Asian
00.00%
162.94%
00.00%
137.06%
2100.00%
Other
2963.69%
1328.02%
01.08%
37.21%
45100.00%
www.peaksurveys.com QLI Race 2012 113 E
Race

* Note: ChiSq has over 20% low count cells.
Respondent Agreement with the Needs of the Homeless being Adequately Addressed in the Pikes Peak Region
(20) Please tell us your level of agreementwith the following statement: The needs ofthe homeless are being adequatelyaddressed in the Pikes Peak region.
Strongly agree
Agree
Disagree
Strongly disagree
Don't know
Totals
ChiSq Significance
White or Caucasian
Which of the following best describes your racial or ethnic background?
276.80%
16140.67%
11027.71%
5012.66%
4812.17%
396100.00%
Yes at 90.0%*
Black or African-American
00.00%
737.06%
736.32%
422.18%
14.44%
19100.00%
Hispanic, Spanish,or Latino
25.75%
511.99%
1642.29%
821.54%
718.43%
38100.00%
Asian
00.00%
137.06%
162.94%
00.00%
00.00%
2100.00%
Other
817.04%
1429.87%
919.66%
1225.69%
47.74%
45100.00%
www.peaksurveys.com QLI Race 2012 114 E
Race

Community Engagement
* Note: ChiSq has over 20% low count cells.
How Accepting Respondents' feel the Community is of the Differences in Race, Ethnicity, Religious Preference, and GenderOrientation
How accepting of the differences inrace, Ethnicity, religious preference,and gender orientation do youconsider the community to be?
Very accepting
Somewhat accepting
Not very accepting
Not accepting at all
Don't know/NA
Totals
ChiSq Significance
White or Caucasian
Which of the following best describes your racial or ethnic background?
15839.82%
18045.60%
4411.00%
102.54%
41.03%
396100.00%
Yes at 50.0%*
Black or African-American
526.45%
1155.22%
313.89%
14.44%
00.00%
19100.00%
Hispanic, Spanish,or Latino
615.64%
2772.85%
38.00%
00.00%
13.51%
38100.00%
Asian
2100.00%
00.00%
00.00%
00.00%
00.00%
2100.00%
Other
2043.47%
1839.30%
510.50%
36.73%
00.00%
45100.00%
www.peaksurveys.com QLI Race 2012 115 E
Race

* Note: ChiSq has over 20% low count cells.
Importance of Acceptance of Differences in Race, Ethnicity, Religious Preference, and Gender Orientation
How important do you believe it is to have acommunity that is accepting of thedifferences in race, Ethnicity, religiouspreference, and gender orientation?
It is very important
Somewhat important
Not very important
Not important at all
Don't know/NA
Totals
ChiSq Significance
White or Caucasian
Which of the following best describes your racial or ethnic background?
30175.99%
7218.30%
174.34%
20.41%
40.95%
396100.00%
Yes at 99.0%*
Black or African-American
1681.84%
318.16%
00.00%
00.00%
00.00%
19100.00%
Hispanic, Spanish,or Latino
3285.66%
514.34%
00.00%
00.00%
00.00%
38100.00%
Asian
2100.00%
00.00%
00.00%
00.00%
00.00%
2100.00%
Other
3882.87%
23.37%
12.36%
511.41%
00.00%
45100.00%
* Note: ChiSq has over 20% low count cells.
Frequency of Charitable or Voluntary Service in the Last 12 Months
During the last 12 months howoften did you or other members ofyour household spend on charitableor voluntary service activities?
More than once a week
Several times a month
Once a month
Once or twice a quarter
Rarely
Never
Don't know/NA
Totals
ChiSq Significance
White or Caucasian
Which of the following best describes your racial or ethnic background?
5614.21%
7318.37%
7218.23%
6516.47%
7017.57%
5814.58%
20.56%
396100.00%
Under 50%*
Black or African-American
211.38%
422.01%
316.39%
16.77%
422.48%
418.39%
02.57%
19100.00%
Hispanic, Spanish,or Latino
38.81%
1539.71%
24.54%
512.69%
718.72%
615.52%
00.00%
38100.00%
Asian
00.00%
00.00%
00.00%
162.94%
00.00%
137.06%
00.00%
2100.00%
Other
612.54%
919.23%
918.96%
1328.10%
510.67%
48.37%
12.13%
45100.00%
www.peaksurveys.com QLI Race 2012 116 E
Race
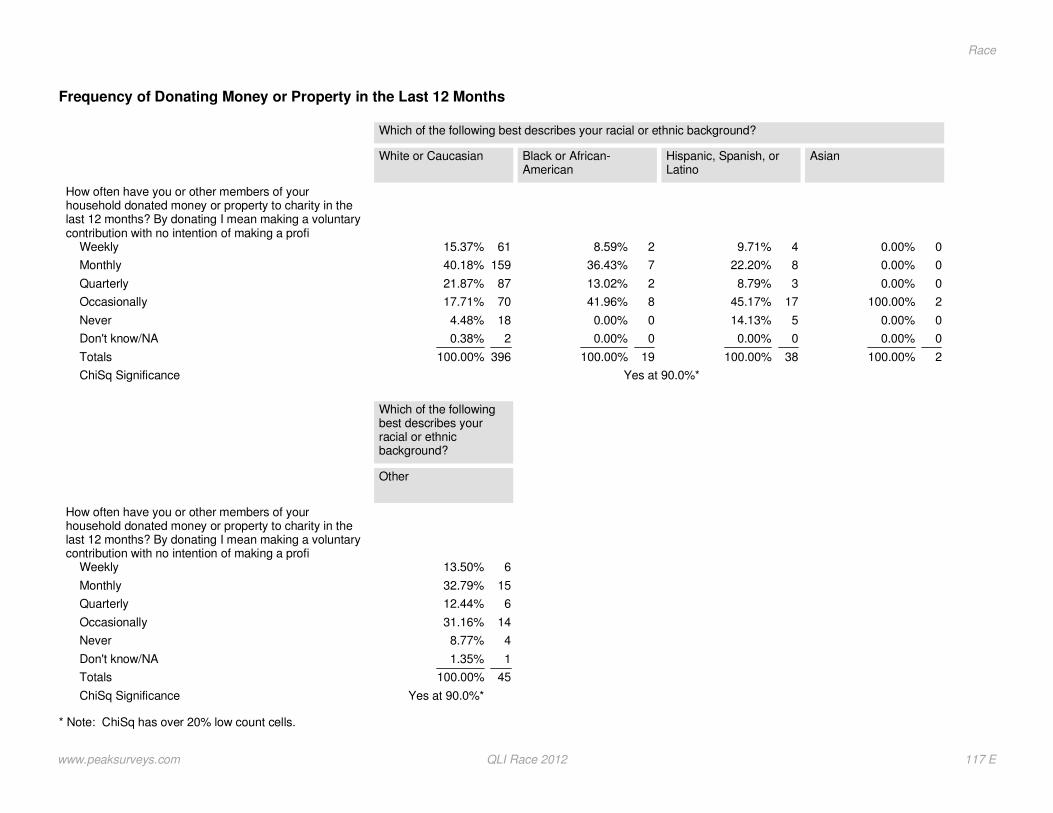
* Note: ChiSq has over 20% low count cells.
Frequency of Donating Money or Property in the Last 12 Months
How often have you or other members of yourhousehold donated money or property to charity in thelast 12 months? By donating I mean making a voluntarycontribution with no intention of making a profi
Weekly
Monthly
Quarterly
Occasionally
Never
Don't know/NA
Totals
ChiSq Significance
White or Caucasian
Which of the following best describes your racial or ethnic background?
6115.37%
15940.18%
8721.87%
7017.71%
184.48%
20.38%
396100.00%
Yes at 90.0%*
Black or African-American
28.59%
736.43%
213.02%
841.96%
00.00%
00.00%
19100.00%
Hispanic, Spanish, orLatino
49.71%
822.20%
38.79%
1745.17%
514.13%
00.00%
38100.00%
Asian
00.00%
00.00%
00.00%
2100.00%
00.00%
00.00%
2100.00%
How often have you or other members of yourhousehold donated money or property to charity in thelast 12 months? By donating I mean making a voluntarycontribution with no intention of making a profi
Weekly
Monthly
Quarterly
Occasionally
Never
Don't know/NA
Totals
ChiSq Significance
Other
Which of the followingbest describes yourracial or ethnicbackground?
613.50%
1532.79%
612.44%
1431.16%
48.77%
11.35%
45100.00%
Yes at 90.0%*
www.peaksurveys.com QLI Race 2012 117 E
Race

* Note: ChiSq has over 20% low count cells.
Attendance at Public Meetings where there was a Discussion on Community Affairs
(25) In the last year, have youattended any public meetings inwhich there was discussion ofcommunity affairs?
Yes
No
Other
Totals
ChiSq Significance
White orCaucasian
Which of the following best describes your racial or ethnic background?
10827.32%
28772.56%
00.12%
396100.00%
Yes at 99.0%*
Black orAfrican-American
947.75%
1052.25%
00.00%
19100.00%
Hispanic,Spanish, orLatino
1231.19%
2668.81%
00.00%
38100.00%
Asian
2100.00%
00.00%
00.00%
2100.00%
Other
2862.06%
1737.94%
00.00%
45100.00%
www.peaksurveys.com QLI Race 2012 118 E
Race

Section F
age & gendercommunity survey
Peak Surveys
www.peaksurveys.com
Community and QLI Survey 2012

Age
Overall Quality of Life in the Community
* Note: ChiSq has over 20% low count cells.
(1) Overall Quality of Life in theCommunity
Excellent
Good
Fair
Poor
DK/NA
Totals
ChiSq Significance
18-29 YearsOld
Age
3731.4%
7463.0%
00.0%
75.6%
00.0%
118100.0%
Yes at 75.0%*
30-39 YearsOld
2224.9%
5764.9%
67.3%
32.9%
00.0%
87100.0%
40-49 YearsOld
3335.4%
5154.4%
88.7%
11.5%
00.0%
93100.0%
50-64 YearsOld
4237.7%
6355.8%
43.9%
21.4%
11.1%
112100.0%
65 Years andOlder
3244.2%
3749.7%
22.4%
22.9%
10.8%
74100.0%
Male
Gender:
9537.3%
13854.6%
103.9%
93.7%
10.5%
253100.0%
Under 50%
Female
7731.4%
15061.2%
124.8%
62.4%
10.2%
246100.0%
Community Headed in Right or Wrong Direction
(2) Community Headed in theRight direction or Wrong direction
Right Direction
Wrong Direction
DK/NA
Totals
ChiSq Significance
18-29 YearsOld
Age
9883.1%
108.4%
108.5%
118100.0%
Yes at 99.0%
30-39 YearsOld
4754.3%
3338.4%
67.4%
87100.0%
40-49 YearsOld
5761.0%
2728.9%
910.1%
93100.0%
50-64 YearsOld
7768.4%
2118.4%
1513.2%
112100.0%
65 Years andOlder
5068.0%
1216.7%
1115.4%
74100.0%
Male
Gender:
17368.3%
5120.2%
2911.5%
253100.0%
Under 50%
Female
16667.5%
5422.0%
2610.5%
246100.0%
www.peaksurveys.com Community Survey Age & Gender 2012 Page 120 F
Age & Gender

Most Important Issue Facing the Community
* Note: ChiSq has over 20% low count cells.
2012 Most Important IssueFacing the Community
Jobs / Unemployment
Economy
Don't know/NA/Refused
Crime
Education / schools
Budget / spending / finances
Presidential election
Growth and development
Child safety / safety
Environment
Homeless
Taxes
Traffic / transportation
Funding for emergencyservices (law enforcement/fire)
Water issues
Road repair / maintenance
Government
Healthcare
None / nothing
Military
Infrastructure
Housing
Other
Totals
ChiSq Significance
18-29 YearsOld
Age
1311.3%
32.8%
2722.9%
1311.1%
1411.7%
75.8%
75.8%
43.0%
75.8%
43.0%
75.6%
00.0%
00.0%
00.0%
00.0%
32.8%
00.0%
32.8%
32.8%
00.0%
00.0%
00.0%
43.0%
118100.0%
Yes at 99.0%*
30-39 YearsOld
1922.1%
910.3%
44.5%
1314.9%
1314.6%
22.8%
11.5%
44.5%
33.0%
11.4%
11.5%
11.5%
11.5%
44.3%
32.9%
11.4%
22.8%
00.0%
00.0%
33.0%
00.0%
00.0%
11.4%
87100.0%
40-49 YearsOld
1718.5%
1718.7%
44.2%
33.0%
77.3%
55.8%
55.6%
44.3%
33.0%
11.5%
11.5%
32.9%
44.1%
44.3%
44.2%
32.8%
32.8%
00.0%
11.4%
00.0%
32.8%
00.0%
11.4%
93100.0%
50-64 YearsOld
2320.2%
1917.2%
87.2%
119.8%
75.9%
43.8%
00.4%
21.9%
32.6%
44.0%
33.1%
65.1%
54.1%
43.8%
10.8%
32.3%
21.4%
21.8%
10.7%
21.5%
10.8%
00.4%
11.1%
112100.0%
65 Years andOlder
1621.2%
1115.4%
912.8%
45.0%
11.9%
22.1%
34.4%
23.3%
00.0%
33.8%
12.0%
45.5%
45.3%
11.9%
34.5%
11.8%
22.7%
22.6%
00.6%
00.0%
00.0%
11.9%
11.5%
74100.0%
Male
Gender:
4919.2%
3212.7%
2710.6%
238.9%
166.3%
93.5%
93.6%
51.8%
51.9%
51.9%
83.2%
83.1%
93.4%
72.8%
62.4%
103.8%
83.0%
62.3%
62.3%
10.3%
31.0%
10.4%
41.7%
253100.0%
Under 50%*
Female
4016.4%
3213.0%
2610.4%
228.9%
2610.7%
145.6%
83.3%
135.1%
104.2%
103.9%
62.5%
62.4%
52.1%
62.5%
62.2%
10.5%
10.4%
31.0%
00.0%
31.4%
10.3%
20.8%
52.1%
246100.0%
www.peaksurveys.com Community Survey Age & Gender 2012 Page 121 F
Age & Gender
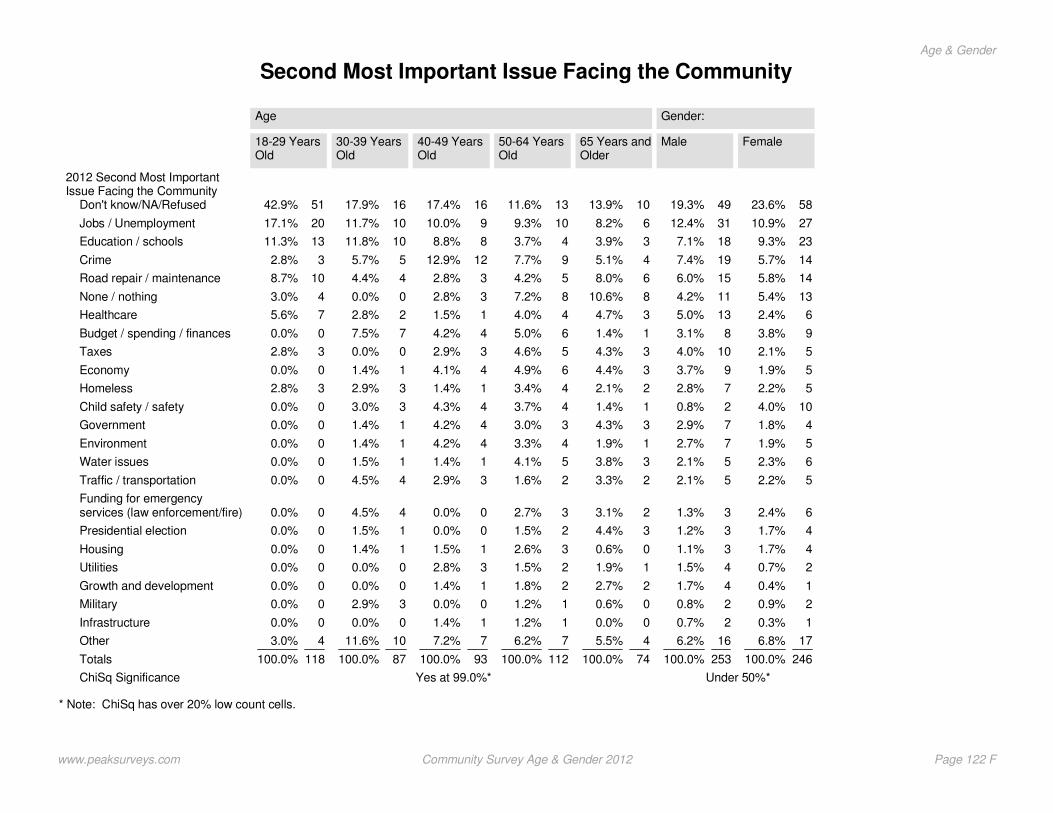
Second Most Important Issue Facing the Community
* Note: ChiSq has over 20% low count cells.
2012 Second Most ImportantIssue Facing the Community
Don't know/NA/Refused
Jobs / Unemployment
Education / schools
Crime
Road repair / maintenance
None / nothing
Healthcare
Budget / spending / finances
Taxes
Economy
Homeless
Child safety / safety
Government
Environment
Water issues
Traffic / transportation
Funding for emergencyservices (law enforcement/fire)
Presidential election
Housing
Utilities
Growth and development
Military
Infrastructure
Other
Totals
ChiSq Significance
18-29 YearsOld
Age
5142.9%
2017.1%
1311.3%
32.8%
108.7%
43.0%
75.6%
00.0%
32.8%
00.0%
32.8%
00.0%
00.0%
00.0%
00.0%
00.0%
00.0%
00.0%
00.0%
00.0%
00.0%
00.0%
00.0%
43.0%
118100.0%
Yes at 99.0%*
30-39 YearsOld
1617.9%
1011.7%
1011.8%
55.7%
44.4%
00.0%
22.8%
77.5%
00.0%
11.4%
32.9%
33.0%
11.4%
11.4%
11.5%
44.5%
44.5%
11.5%
11.4%
00.0%
00.0%
32.9%
00.0%
1011.6%
87100.0%
40-49 YearsOld
1617.4%
910.0%
88.8%
1212.9%
32.8%
32.8%
11.5%
44.2%
32.9%
44.1%
11.4%
44.3%
44.2%
44.2%
11.4%
32.9%
00.0%
00.0%
11.5%
32.8%
11.4%
00.0%
11.4%
77.2%
93100.0%
50-64 YearsOld
1311.6%
109.3%
43.7%
97.7%
54.2%
87.2%
44.0%
65.0%
54.6%
64.9%
43.4%
43.7%
33.0%
43.3%
54.1%
21.6%
32.7%
21.5%
32.6%
21.5%
21.8%
11.2%
11.2%
76.2%
112100.0%
65 Years andOlder
1013.9%
68.2%
33.9%
45.1%
68.0%
810.6%
34.7%
11.4%
34.3%
34.4%
22.1%
11.4%
34.3%
11.9%
33.8%
23.3%
23.1%
34.4%
00.6%
11.9%
22.7%
00.6%
00.0%
45.5%
74100.0%
Male
Gender:
4919.3%
3112.4%
187.1%
197.4%
156.0%
114.2%
135.0%
83.1%
104.0%
93.7%
72.8%
20.8%
72.9%
72.7%
52.1%
52.1%
31.3%
31.2%
31.1%
41.5%
41.7%
20.8%
20.7%
166.2%
253100.0%
Under 50%*
Female
5823.6%
2710.9%
239.3%
145.7%
145.8%
135.4%
62.4%
93.8%
52.1%
51.9%
52.2%
104.0%
41.8%
51.9%
62.3%
52.2%
62.4%
41.7%
41.7%
20.7%
10.4%
20.9%
10.3%
176.8%
246100.0%
www.peaksurveys.com Community Survey Age & Gender 2012 Page 122 F
Age & Gender

Primary Source of Information When Getting Involved or Volunteering
(5) Primary Source ofInformattion when gettingInvolved or Volunteering
Church
Friends or Family
Internet
Local TV News
Newspaper
Local Non- profit organizations
Other
DK/NA
Totals
ChiSq Significance
18-29 YearsOld
Age
4134.4%
2722.5%
2722.7%
75.8%
43.0%
43.0%
108.7%
00.0%
118100.0%
Yes at 75.0%
30-39 YearsOld
1820.2%
2224.9%
2225.3%
1011.6%
33.0%
910.3%
44.6%
00.0%
87100.0%
40-49 YearsOld
1617.4%
1818.8%
1819.6%
1617.2%
910.0%
77.1%
910.0%
00.0%
93100.0%
50-64 YearsOld
2825.2%
2219.7%
108.9%
1311.7%
1210.5%
1715.4%
86.7%
22.0%
112100.0%
65 Years andOlder
1519.9%
1114.7%
67.7%
1418.5%
1824.8%
34.5%
67.9%
12.0%
74100.0%
Male
Gender:
5923.3%
5521.6%
5019.5%
3614.3%
228.7%
145.7%
145.3%
41.4%
253100.0%
Under 50%
Female
6325.8%
4819.5%
3313.5%
2711.2%
249.9%
2510.3%
239.5%
10.4%
246100.0%
Who Respondents Trust When Addressing Community Issues
(6) Who Respondents Trust toAddress Community Issues
Religious organizations
Nonprofit organizations
Local businesses
Someone else
Local government
DK/NA
Totals
ChiSq Significance
18-29 YearsOld
Age
2723.1%
3731.0%
2319.7%
1411.9%
1411.5%
32.8%
118100.0%
Under 50%
30-39 YearsOld
2123.8%
2225.1%
1314.5%
1416.3%
1113.1%
67.3%
87100.0%
40-49 YearsOld
2021.6%
2021.3%
1718.6%
2223.1%
1011.2%
44.2%
93100.0%
50-64 YearsOld
2926.0%
2018.1%
2017.6%
2018.2%
1614.2%
76.0%
112100.0%
65 Years andOlder
1824.8%
1722.7%
1014.2%
1115.0%
810.4%
912.9%
74100.0%
Male
Gender:
4818.9%
6826.9%
5722.4%
2610.4%
3413.3%
208.0%
253100.0%
Yes at 99.0%
Female
7530.4%
4920.0%
2811.2%
5522.3%
2610.6%
145.5%
246100.0%
www.peaksurveys.com Community Survey Age & Gender 2012 Page 123 F
Age & Gender

Favorability of County Commissioners
(7) Favorability of CountyCommissioners
Very favorable
Somewhat favorable
Somewhat unfavorable
Very unfavorable
Never heard of them
DK/NA
Totals
ChiSq Significance
18-29 YearsOld
Age
108.5%
4437.2%
32.8%
75.6%
3831.8%
1714.1%
118100.0%
Yes at 99.0%
30-39 YearsOld
32.9%
3843.7%
1213.5%
55.9%
1314.9%
1719.1%
87100.0%
40-49 YearsOld
77.1%
3840.9%
1111.6%
1314.2%
44.1%
2122.0%
93100.0%
50-64 YearsOld
1311.3%
4641.2%
1614.4%
108.5%
1513.7%
1210.9%
112100.0%
65 Years andOlder
67.7%
3345.1%
1013.7%
67.6%
810.7%
1115.2%
74100.0%
Male
Gender:
239.0%
11746.3%
207.8%
2610.3%
3513.7%
3312.9%
253100.0%
Yes at 90.0%
Female
166.4%
8635.1%
3313.6%
166.5%
4417.9%
5020.5%
246100.0%
Favorability of Colorado Springs Mayor
Favorability of Colorado SpringsMayor
Very favorable
Somewhat favorable
Somewhat unfavorable
Very unfavorable
Never heard of them
DK/NA
Totals
ChiSq Significance
18-29 YearsOld
Age
1010.2%
3030.0%
1010.0%
1010.0%
1313.3%
2726.5%
101100.0%
Yes at 95.0%
30-39 YearsOld
1120.6%
1935.1%
34.7%
1018.3%
711.9%
59.5%
55100.0%
40-49 YearsOld
1118.5%
2035.1%
34.5%
46.9%
46.7%
1628.3%
58100.0%
50-64 YearsOld
2535.6%
2536.8%
69.1%
56.8%
33.7%
57.9%
69100.0%
65 Years andOlder
1428.8%
1836.4%
815.7%
23.8%
01.0%
714.3%
49100.0%
Male
Gender:
3620.6%
5129.1%
2011.5%
2212.5%
179.5%
3016.9%
175100.0%
Yes at 50.0%
Female
3722.2%
6639.8%
127.2%
95.3%
106.2%
3219.3%
167100.0%
www.peaksurveys.com Community Survey Age & Gender 2012 Page 124 F
Age & Gender

Favorability of Colorado Springs City Council
* Note: ChiSq has over 20% low count cells.
(8) Favorability of ColoradoSprings City Council
Very favorable
Somewhat favorable
Somewhat unfavorable
Very unfavorable
Never heard of them
DK/NA
Totals
ChiSq Significance
18-29 YearsOld
Age
76.7%
4040.0%
33.3%
76.5%
1313.3%
3030.2%
101100.0%
Yes at 75.0%*
30-39 YearsOld
12.2%
1935.0%
1425.4%
46.7%
59.5%
1221.2%
55100.0%
40-49 YearsOld
47.0%
1932.4%
1322.7%
47.0%
34.5%
1526.3%
58100.0%
50-64 YearsOld
68.0%
3347.7%
1116.3%
710.8%
57.2%
79.9%
69100.0%
65 Years andOlder
36.3%
2244.5%
1021.4%
48.2%
12.8%
816.9%
49100.0%
Male
Gender:
105.8%
7039.9%
3117.6%
1910.9%
179.9%
2815.8%
175100.0%
Yes at 50.0%
Female
116.9%
6539.1%
2615.8%
84.6%
106.2%
4627.4%
167100.0%
www.peaksurveys.com Community Survey Age & Gender 2012 Page 125 F
Age & Gender

Most Important for Local Government to do that will Strengthen Trust and Build Confidence
* Note: ChiSq has over 20% low count cells.
2012 What is most important forlocal government to do - that willstrengthen trust and buildconfidence?
Don't know/NA/Refused
Be honest / fair / tell the truth
More involvement withcommunity
Balance the budget / debt
Create more jobs
Listen to the people
Communicate
Do what they say they aregoing to do
Improve the economy
Be transparent
Increase emergency services(law enforcement / fire)
Transportation / roads
Keep taxes low / stop raisingtaxes
Work together
Education
Nothing / none
Decrease crime
Infrastructure
Other
Totals
ChiSq Significance
18-29 YearsOld
Age
2019.3%
109.9%
1312.8%
76.3%
1110.1%
76.3%
43.4%
109.4%
33.1%
43.4%
76.7%
00.0%
00.0%
00.0%
33.1%
33.1%
00.0%
00.0%
33.1%
105100.0%
Yes at 99.0%*
30-39 YearsOld
1213.7%
1012.2%
67.6%
22.9%
56.3%
56.0%
11.6%
55.9%
56.2%
89.0%
11.5%
44.5%
33.0%
44.7%
11.5%
00.0%
11.5%
11.5%
910.6%
85100.0%
40-49 YearsOld
910.3%
88.7%
1314.7%
88.8%
32.9%
1111.8%
77.3%
66.1%
88.8%
55.8%
32.9%
11.4%
11.5%
00.0%
11.5%
11.4%
11.4%
32.8%
11.5%
91100.0%
50-64 YearsOld
65.4%
1614.8%
54.7%
1412.7%
109.4%
65.9%
87.1%
54.7%
87.1%
54.6%
43.3%
54.3%
43.5%
32.7%
32.7%
21.5%
33.1%
00.0%
32.4%
108100.0%
65 Years andOlder
913.3%
1115.3%
56.5%
57.1%
56.6%
34.2%
710.3%
45.6%
34.6%
57.1%
11.9%
22.6%
34.7%
22.5%
00.0%
10.8%
00.6%
00.0%
46.3%
69100.0%
Male
Gender:
3213.3%
2510.6%
239.7%
239.6%
83.2%
187.4%
104.0%
177.3%
135.5%
166.9%
52.1%
93.8%
51.9%
31.3%
72.9%
62.5%
41.6%
41.6%
124.9%
237100.0%
Under 50%*
Female
2611.3%
3113.3%
208.5%
156.4%
2611.0%
146.0%
208.5%
125.1%
156.6%
114.6%
114.6%
31.5%
62.7%
72.9%
20.8%
20.8%
31.1%
00.0%
104.3%
234100.0%
www.peaksurveys.com Community Survey Age & Gender 2012 Page 126 F
Age & Gender

Positive or Negative Impact of Tabor in the Community
(10) Positive or Negative Impactof Tabor in the Community
Generally positive impact
Generally negative impact
Really makes no difference
Don't know enough about it
Never heard of TABOR
DK/NA
Totals
ChiSq Significance
18-29 YearsOld
Age
3428.6%
1714.5%
00.0%
2722.5%
3428.6%
75.8%
118100.0%
Yes at 95.0%
30-39 YearsOld
2224.8%
2730.8%
32.9%
1213.4%
1314.9%
1213.3%
87100.0%
40-49 YearsOld
2628.1%
2527.1%
77.1%
910.2%
1515.8%
1111.6%
93100.0%
50-64 YearsOld
3833.8%
3329.6%
76.4%
1412.6%
1311.2%
76.4%
112100.0%
65 Years andOlder
3040.3%
2229.8%
22.7%
1014.0%
45.9%
57.3%
74100.0%
Male
Gender:
9637.8%
6124.0%
83.3%
3815.2%
3614.3%
145.4%
253100.0%
Yes at 90.0%
Female
5723.4%
7128.7%
114.5%
3614.5%
4317.5%
2811.4%
246100.0%
Favorability of Amending Tabor
(11) Favorability of AmendingTABOR?
Strongly favorable
Somewhat favorable
Somewhat unfavorable
Strongly unfavorable
DK/NA
Totals
ChiSq Significance
18-29 YearsOld
Age
108.7%
4134.4%
76.0%
32.8%
5748.1%
118100.0%
Yes at 99.0%
30-39 YearsOld
1921.9%
2225.0%
910.4%
22.8%
3539.9%
87100.0%
40-49 YearsOld
2425.6%
2021.2%
88.5%
11.4%
4043.3%
93100.0%
50-64 YearsOld
2522.4%
2926.2%
86.7%
1210.5%
3834.2%
112100.0%
65 Years andOlder
1216.9%
1621.9%
810.3%
1418.8%
2432.1%
74100.0%
Male
Gender:
5220.4%
6726.5%
155.9%
218.2%
9939.1%
253100.0%
Under 50%
Female
4518.4%
6325.5%
2510.2%
145.7%
9940.2%
246100.0%
www.peaksurveys.com Community Survey Age & Gender 2012 Page 127 F
Age & Gender

For the following questions (12 through 28) the respondents were asked how concerned they are with each issue.
* Note: ChiSq has over 20% low count cells.
Employment and Jobs
(12) Employment and jobsVery Concerned
Somewhat Concerned
Not Very Concerned
Not at all Concerned
DK/NA
Totals
ChiSq Significance
18-29 YearsOld
Age
7159.8%
3428.6%
1411.5%
00.0%
00.0%
118100.0%
Yes at 99.0%*
30-39 YearsOld
6877.9%
1517.6%
44.5%
00.0%
00.0%
87100.0%
40-49 YearsOld
7883.2%
1415.4%
00.0%
11.4%
00.0%
93100.0%
50-64 YearsOld
8172.7%
2421.7%
32.6%
33.0%
00.0%
112100.0%
65 Years andOlder
5068.4%
1621.8%
23.2%
44.9%
11.9%
74100.0%
Male
Gender:
17870.2%
5823.0%
114.3%
62.2%
10.3%
253100.0%
Under 50%*
Female
18173.7%
4819.4%
145.7%
31.0%
00.2%
246100.0%
* Note: ChiSq has over 20% low count cells.
Drugs and Alcohol
(13) Drugs and alcoholVery Concerned
Somewhat Concerned
Not Very Concerned
Not at all Concerned
DK/NA
Totals
ChiSq Significance
18-29 YearsOld
Age
6151.3%
3025.6%
1714.3%
108.7%
00.0%
118100.0%
Under 50%*
30-39 YearsOld
4248.3%
2832.6%
1113.2%
44.5%
11.5%
87100.0%
40-49 YearsOld
4649.2%
2527.0%
2021.1%
32.8%
00.0%
93100.0%
50-64 YearsOld
5549.3%
3934.6%
1311.2%
54.1%
10.7%
112100.0%
65 Years andOlder
4156.1%
2027.7%
811.5%
34.1%
00.6%
74100.0%
Male
Gender:
12448.8%
7429.2%
4316.9%
124.8%
10.3%
253100.0%
Under 50%
Female
13153.5%
7128.9%
2911.9%
125.0%
20.7%
246100.0%
www.peaksurveys.com Community Survey Age & Gender 2012 Page 128 F
Age & Gender

Growth
(14) GrowthVery Concerned
Somewhat Concerned
Not Very Concerned
Not at all Concerned
DK/NA
Totals
ChiSq Significance
18-29 YearsOld
Age
3328.2%
4134.6%
3025.8%
108.5%
32.8%
118100.0%
Yes at 75.0%
30-39 YearsOld
2427.5%
3338.2%
2326.7%
56.1%
11.5%
87100.0%
40-49 YearsOld
3537.0%
4043.0%
910.1%
88.5%
11.4%
93100.0%
50-64 YearsOld
3934.4%
5448.1%
97.9%
75.9%
43.6%
112100.0%
65 Years andOlder
2837.6%
2635.6%
1014.0%
810.7%
12.0%
74100.0%
Male
Gender:
9437.0%
9437.0%
4015.7%
187.1%
83.1%
253100.0%
Under 50%
Female
6928.2%
10944.2%
4417.7%
218.5%
41.4%
246100.0%
Affordable Housing
(15) Affordable housingVery Concerned
Somewhat Concerned
Not Very Concerned
Not at all Concerned
DK/NA
Totals
ChiSq Significance
18-29 YearsOld
Age
5143.1%
4034.2%
1714.1%
108.5%
00.0%
118100.0%
Yes at 75.0%
30-39 YearsOld
4653.1%
2933.7%
88.8%
44.4%
00.0%
87100.0%
40-49 YearsOld
3638.8%
3234.4%
2021.2%
55.5%
00.0%
93100.0%
50-64 YearsOld
4742.0%
3733.3%
1513.3%
1211.0%
00.4%
112100.0%
65 Years andOlder
2534.4%
2635.9%
912.7%
1013.8%
23.3%
74100.0%
Male
Gender:
9437.0%
8332.9%
4417.5%
2811.2%
31.3%
253100.0%
Yes at 75.0%
Female
11848.0%
8434.2%
2911.9%
135.3%
20.6%
246100.0%
www.peaksurveys.com Community Survey Age & Gender 2012 Page 129 F
Age & Gender

* Note: ChiSq has over 20% low count cells.
Health Care Costs
(16) Health care costsVery Concerned
Somewhat Concerned
Not Very Concerned
Not at all Concerned
DK/NA
Totals
ChiSq Significance
18-29 YearsOld
Age
7160.2%
3328.2%
75.8%
75.8%
00.0%
118100.0%
Under 50%*
30-39 YearsOld
5866.4%
2326.4%
22.8%
44.4%
00.0%
87100.0%
40-49 YearsOld
6468.9%
2425.6%
44.1%
11.4%
00.0%
93100.0%
50-64 YearsOld
8374.0%
2219.3%
43.6%
32.7%
00.4%
112100.0%
65 Years andOlder
5270.8%
1621.3%
34.7%
23.2%
00.0%
74100.0%
Male
Gender:
15862.5%
7228.4%
145.5%
93.5%
00.0%
253100.0%
Yes at 50.0%
Female
18173.6%
4819.7%
83.2%
83.4%
00.2%
246100.0%
* Note: ChiSq has over 20% low count cells.
Water Supply and Quality
(17) Water supply and qualityVery Concerned
Somewhat Concerned
Not Very Concerned
Not at all Concerned
DK/NA
Totals
ChiSq Significance
18-29 YearsOld
Age
3025.8%
4740.0%
3025.5%
108.7%
00.0%
118100.0%
Yes at 99.0%*
30-39 YearsOld
5158.7%
2224.9%
88.9%
77.5%
00.0%
87100.0%
40-49 YearsOld
5963.0%
2829.9%
32.9%
32.8%
11.5%
93100.0%
50-64 YearsOld
6760.0%
3026.9%
97.8%
54.9%
00.4%
112100.0%
65 Years andOlder
4358.8%
1926.0%
45.9%
67.5%
11.9%
74100.0%
Male
Gender:
12047.3%
8332.7%
3714.5%
135.2%
10.3%
253100.0%
Yes at 75.0%
Female
14157.4%
6627.0%
187.2%
187.5%
20.9%
246100.0%
www.peaksurveys.com Community Survey Age & Gender 2012 Page 130 F
Age & Gender

* Note: ChiSq has over 20% low count cells.
Effective Community Leadership
(18) Effective communityleadership
Very Concerned
Somewhat Concerned
Not Very Concerned
Not at all Concerned
DK/NA
Totals
ChiSq Significance
18-29 YearsOld
Age
4134.4%
4034.0%
1714.3%
1714.5%
32.8%
118100.0%
Yes at 99.0%*
30-39 YearsOld
4956.0%
2730.8%
910.3%
11.4%
11.5%
87100.0%
40-49 YearsOld
5558.7%
2931.3%
44.2%
32.8%
33.0%
93100.0%
50-64 YearsOld
6154.8%
4035.3%
33.1%
65.7%
11.1%
112100.0%
65 Years andOlder
3445.8%
2330.8%
79.1%
56.9%
67.5%
74100.0%
Male
Gender:
11645.7%
9236.5%
218.5%
166.4%
72.9%
253100.0%
Under 50%
Female
13253.9%
6827.6%
218.4%
177.0%
83.2%
246100.0%
* Note: ChiSq has over 20% low count cells.
Services to Homeless
(19) Services for the homelessVery Concerned
Somewhat Concerned
Not Very Concerned
Not at all Concerned
DK/NA
Totals
ChiSq Significance
18-29 YearsOld
Age
4840.5%
5345.3%
75.8%
75.6%
32.8%
118100.0%
Under 50%*
30-39 YearsOld
3539.8%
3539.7%
1011.7%
55.9%
32.9%
87100.0%
40-49 YearsOld
3133.5%
4649.8%
1212.6%
44.1%
00.0%
93100.0%
50-64 YearsOld
5044.2%
4540.1%
1210.7%
54.1%
10.8%
112100.0%
65 Years andOlder
2939.7%
3243.1%
56.3%
67.6%
23.3%
74100.0%
Male
Gender:
7429.2%
12750.1%
2810.9%
197.3%
72.6%
253100.0%
Yes at 99.0%
Female
12751.5%
8936.3%
208.1%
72.9%
31.1%
246100.0%
www.peaksurveys.com Community Survey Age & Gender 2012 Page 131 F
Age & Gender
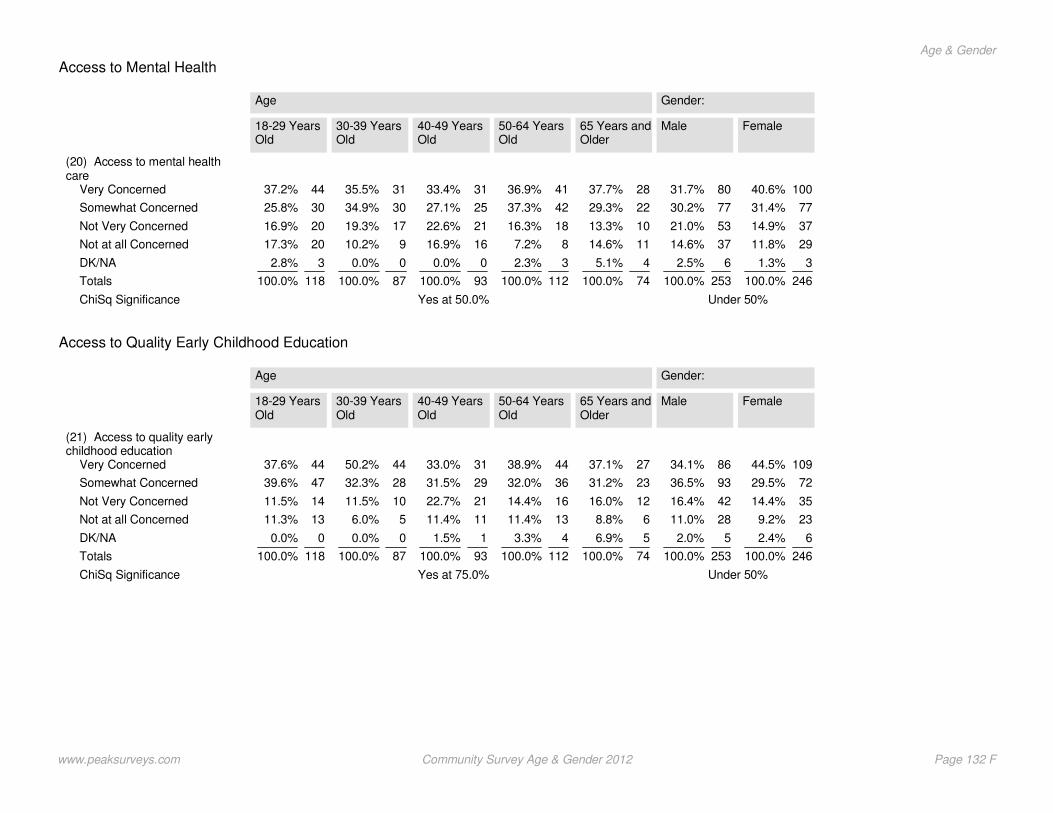
Access to Mental Health
(20) Access to mental healthcare
Very Concerned
Somewhat Concerned
Not Very Concerned
Not at all Concerned
DK/NA
Totals
ChiSq Significance
18-29 YearsOld
Age
4437.2%
3025.8%
2016.9%
2017.3%
32.8%
118100.0%
Yes at 50.0%
30-39 YearsOld
3135.5%
3034.9%
1719.3%
910.2%
00.0%
87100.0%
40-49 YearsOld
3133.4%
2527.1%
2122.6%
1616.9%
00.0%
93100.0%
50-64 YearsOld
4136.9%
4237.3%
1816.3%
87.2%
32.3%
112100.0%
65 Years andOlder
2837.7%
2229.3%
1013.3%
1114.6%
45.1%
74100.0%
Male
Gender:
8031.7%
7730.2%
5321.0%
3714.6%
62.5%
253100.0%
Under 50%
Female
10040.6%
7731.4%
3714.9%
2911.8%
31.3%
246100.0%
Access to Quality Early Childhood Education
(21) Access to quality earlychildhood education
Very Concerned
Somewhat Concerned
Not Very Concerned
Not at all Concerned
DK/NA
Totals
ChiSq Significance
18-29 YearsOld
Age
4437.6%
4739.6%
1411.5%
1311.3%
00.0%
118100.0%
Yes at 75.0%
30-39 YearsOld
4450.2%
2832.3%
1011.5%
56.0%
00.0%
87100.0%
40-49 YearsOld
3133.0%
2931.5%
2122.7%
1111.4%
11.5%
93100.0%
50-64 YearsOld
4438.9%
3632.0%
1614.4%
1311.4%
43.3%
112100.0%
65 Years andOlder
2737.1%
2331.2%
1216.0%
68.8%
56.9%
74100.0%
Male
Gender:
8634.1%
9336.5%
4216.4%
2811.0%
52.0%
253100.0%
Under 50%
Female
10944.5%
7229.5%
3514.4%
239.2%
62.4%
246100.0%
www.peaksurveys.com Community Survey Age & Gender 2012 Page 132 F
Age & Gender
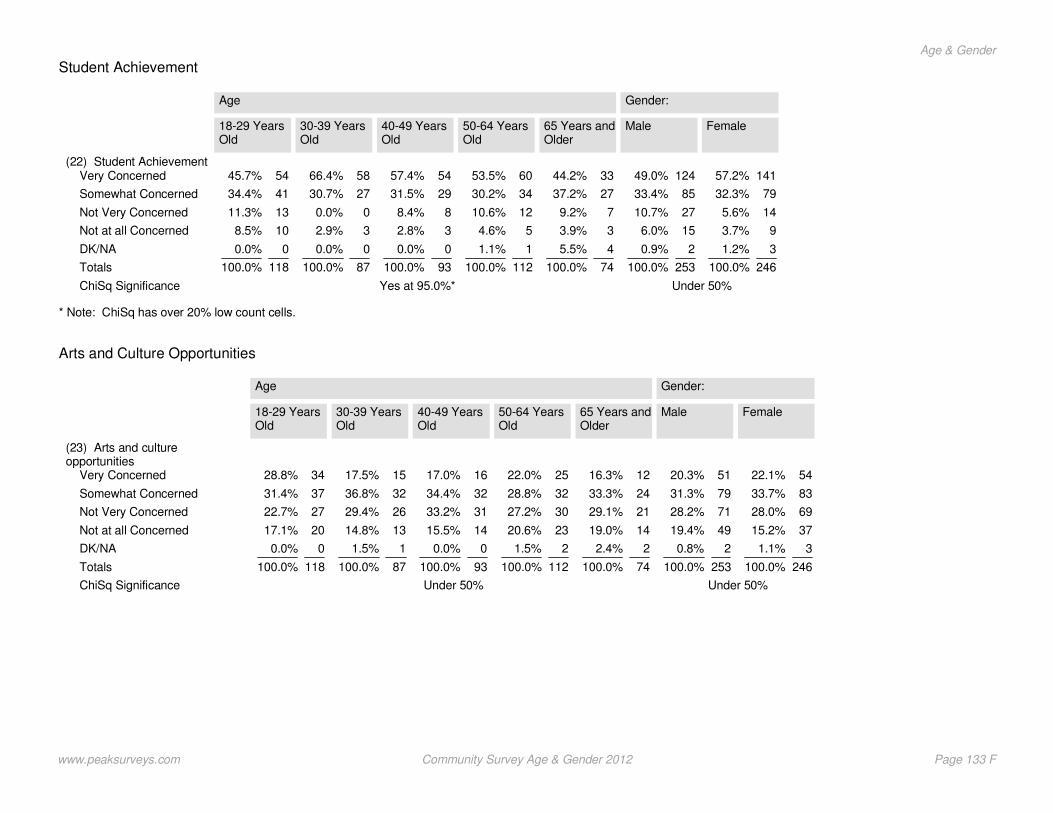
* Note: ChiSq has over 20% low count cells.
Student Achievement
(22) Student AchievementVery Concerned
Somewhat Concerned
Not Very Concerned
Not at all Concerned
DK/NA
Totals
ChiSq Significance
18-29 YearsOld
Age
5445.7%
4134.4%
1311.3%
108.5%
00.0%
118100.0%
Yes at 95.0%*
30-39 YearsOld
5866.4%
2730.7%
00.0%
32.9%
00.0%
87100.0%
40-49 YearsOld
5457.4%
2931.5%
88.4%
32.8%
00.0%
93100.0%
50-64 YearsOld
6053.5%
3430.2%
1210.6%
54.6%
11.1%
112100.0%
65 Years andOlder
3344.2%
2737.2%
79.2%
33.9%
45.5%
74100.0%
Male
Gender:
12449.0%
8533.4%
2710.7%
156.0%
20.9%
253100.0%
Under 50%
Female
14157.2%
7932.3%
145.6%
93.7%
31.2%
246100.0%
Arts and Culture Opportunities
(23) Arts and cultureopportunities
Very Concerned
Somewhat Concerned
Not Very Concerned
Not at all Concerned
DK/NA
Totals
ChiSq Significance
18-29 YearsOld
Age
3428.8%
3731.4%
2722.7%
2017.1%
00.0%
118100.0%
Under 50%
30-39 YearsOld
1517.5%
3236.8%
2629.4%
1314.8%
11.5%
87100.0%
40-49 YearsOld
1617.0%
3234.4%
3133.2%
1415.5%
00.0%
93100.0%
50-64 YearsOld
2522.0%
3228.8%
3027.2%
2320.6%
21.5%
112100.0%
65 Years andOlder
1216.3%
2433.3%
2129.1%
1419.0%
22.4%
74100.0%
Male
Gender:
5120.3%
7931.3%
7128.2%
4919.4%
20.8%
253100.0%
Under 50%
Female
5422.1%
8333.7%
6928.0%
3715.2%
31.1%
246100.0%
www.peaksurveys.com Community Survey Age & Gender 2012 Page 133 F
Age & Gender

* Note: ChiSq has over 20% low count cells.
Crime Rate
(24) Crime rateVery Concerned
Somewhat Concerned
Not Very Concerned
Not at all Concerned
DK/NA
Totals
ChiSq Significance
18-29 YearsOld
Age
5445.5%
3731.6%
2017.1%
75.8%
00.0%
118100.0%
Under 50%*
30-39 YearsOld
4754.3%
2730.9%
1011.9%
11.4%
11.5%
87100.0%
40-49 YearsOld
5660.1%
2425.7%
910.0%
44.2%
00.0%
93100.0%
50-64 YearsOld
6355.9%
2724.5%
1513.3%
76.3%
00.0%
112100.0%
65 Years andOlder
4662.2%
2027.6%
78.9%
00.6%
00.6%
74100.0%
Male
Gender:
13553.4%
7328.7%
3212.6%
124.7%
10.5%
253100.0%
Under 50%
Female
13856.2%
6827.8%
3012.4%
83.1%
10.5%
246100.0%
Voter Participation
(25) Voter participationVery Concerned
Somewhat Concerned
Not Very Concerned
Not at all Concerned
DK/NA
Totals
ChiSq Significance
18-29 YearsOld
Age
5445.5%
4134.4%
108.5%
1411.5%
00.0%
118100.0%
Yes at 75.0%
30-39 YearsOld
4955.8%
2427.8%
1213.5%
32.9%
00.0%
87100.0%
40-49 YearsOld
4447.3%
2425.7%
1314.2%
1111.4%
11.5%
93100.0%
50-64 YearsOld
5852.2%
3329.9%
1210.4%
76.4%
11.2%
112100.0%
65 Years andOlder
4054.0%
1824.1%
79.6%
56.3%
46.1%
74100.0%
Male
Gender:
13151.6%
7429.2%
2610.4%
208.0%
20.8%
253100.0%
Under 50%
Female
12450.4%
7028.4%
2711.2%
197.9%
52.1%
246100.0%
www.peaksurveys.com Community Survey Age & Gender 2012 Page 134 F
Age & Gender

Community Engagement in Local Issues
(26) Community engagement inlocal issues
Very Concerned
Somewhat Concerned
Not Very Concerned
Not at all Concerned
DK/NA
Totals
ChiSq Significance
18-29 YearsOld
Age
3428.6%
3731.4%
2722.9%
1311.3%
75.8%
118100.0%
Yes at 99.0%
30-39 YearsOld
2730.9%
4652.6%
1213.5%
33.0%
00.0%
87100.0%
40-49 YearsOld
1718.7%
5659.8%
1920.1%
11.4%
00.0%
93100.0%
50-64 YearsOld
3531.6%
5548.9%
1211.1%
97.6%
10.8%
112100.0%
65 Years andOlder
2331.7%
2838.0%
1013.7%
810.5%
46.1%
74100.0%
Male
Gender:
6927.4%
12147.8%
4016.0%
166.4%
62.4%
253100.0%
Under 50%
Female
7329.9%
10843.8%
4116.5%
187.4%
62.4%
246100.0%
Public Transit
(27) Public transitVery Concerned
Somewhat Concerned
Not Very Concerned
Not at all Concerned
DK/NA
Totals
ChiSq Significance
18-29 YearsOld
Age
2722.7%
4437.4%
3025.5%
1411.5%
43.0%
118100.0%
Under 50%
30-39 YearsOld
2629.6%
3236.6%
1718.9%
1213.4%
11.5%
87100.0%
40-49 YearsOld
2324.3%
3740.1%
2728.7%
66.9%
00.0%
93100.0%
50-64 YearsOld
3531.4%
3833.7%
2421.1%
1311.2%
32.5%
112100.0%
65 Years andOlder
2533.5%
2634.9%
912.7%
1114.4%
34.5%
74100.0%
Male
Gender:
7027.5%
8633.9%
6425.1%
2911.6%
51.9%
253100.0%
Under 50%
Female
7229.5%
9337.8%
4618.6%
2811.6%
62.6%
246100.0%
www.peaksurveys.com Community Survey Age & Gender 2012 Page 135 F
Age & Gender

* Note: ChiSq has over 20% low count cells.
Land Use
(28) Land useVery Concerned
Somewhat Concerned
Not Very Concerned
Not at all Concerned
DK/NA
Totals
ChiSq Significance
18-29 YearsOld
Age
2017.1%
4134.8%
4336.8%
108.5%
32.8%
118100.0%
Yes at 99.0%*
30-39 YearsOld
2629.4%
3944.2%
1922.1%
44.4%
00.0%
87100.0%
40-49 YearsOld
3234.4%
4548.5%
910.0%
11.4%
55.8%
93100.0%
50-64 YearsOld
4137.1%
5145.9%
108.8%
64.9%
43.3%
112100.0%
65 Years andOlder
2635.3%
2837.6%
1014.0%
56.5%
56.6%
74100.0%
Male
Gender:
7127.9%
10139.9%
5722.6%
145.6%
104.1%
253100.0%
Under 50%
Female
7932.0%
11345.9%
3514.2%
114.6%
83.2%
246100.0%
www.peaksurveys.com Community Survey Age & Gender 2012 Page 136 F
Age & Gender

Section F
age & genderquality of life
Peak Surveys
www.peaksurveys.com
Community and QLI Survey 2012

Age & Gender
Economic Vision
* Note: ChiSq has over 20% low count cells.
How Respondents Feel Local Economy Compares to the National Economy
(3) How do you feel the localeconomy compares to thenational economy?
Same as national economy
Better than national economy
Worse than national economy
Much better than nationaleconomy
Much worse than nationaleconomy
Totals
ChiSq Significance
18-29 YearsOld
2012 Age Group on Q69:Age
3731.61%
6453.88%
32.78%
1411.73%
00.00%
118100.00%
Yes at 95.0%*
30-39 YearsOld
4450.50%
2933.41%
910.32%
44.35%
11.42%
87100.00%
40-49 YearsOld
4749.85%
3132.87%
1314.31%
11.48%
11.48%
93100.00%
50-64 YearsOld
5145.70%
4035.95%
1311.69%
65.09%
21.57%
112100.00%
65 Years andOlder
3244.13%
2736.06%
79.63%
68.28%
11.90%
74100.00%
Male
Gender
10541.35%
11444.89%
218.12%
124.79%
20.85%
253100.00%
Yes at 50.0%
Female
11345.81%
8333.60%
2811.53%
197.59%
41.47%
246100.00%
www.peaksurveys.com QLI Age & Gender 138 F
Age & Gender

Environment
Q:8 What do you think the biggest environmental challenge is facing the Pikes Peak Region today?
(8) What do you think thebiggest environmental challengeis facing the Pikes Peak Regiontoday?
Water supply
Energy supply
Recycling
Air quality
Water quality
Other
Totals
ChiSq Significance
18-29 Years Old
2012 Age Group on Q69:Age
2017.10%
1311.33%
3126.04%
2017.10%
32.78%
3025.65%
118100.00%
Yes at 99.0%
30-39 Years Old
4248.18%
1719.33%
910.22%
55.87%
55.97%
910.42%
87100.00%
40-49 Years Old
4548.67%
1314.31%
88.49%
1314.41%
88.39%
55.73%
93100.00%
50-64 Years Old
5851.49%
1816.12%
1513.23%
43.37%
97.92%
97.87%
112100.00%
65 Years and Older
3750.70%
1013.49%
45.57%
911.81%
56.29%
912.14%
74100.00%
(8) What do you think thebiggest environmental challengeis facing the Pikes Peak Regiontoday?
Water supply
Energy supply
Recycling
Air quality
Water quality
Other
Totals
ChiSq Significance
Male
Gender
10441.13%
3513.66%
3112.24%
3011.84%
207.77%
3413.36%
253100.00%
Under 50%
Female
10542.52%
3715.02%
3514.42%
2510.28%
124.90%
3212.86%
246100.00%
www.peaksurveys.com QLI Age & Gender 139 F
Age & Gender

Arts and Culture
* Note: ChiSq has over 20% low count cells.
Essentiality of Parks, Recreation, Trails and Open Spaces to Respondents
Parks, recreation, trails and openspaces are essential to mycommunity.
Strongly Agree
Agree
Disagree
Strongly Disagree
Totals
ChiSq Significance
18-29 YearsOld
2012 Age Group on Q69:Age
7865.80%
3428.43%
42.98%
32.78%
118100.00%
Yes at 75.0%*
30-39 YearsOld
5461.94%
3236.64%
11.42%
00.00%
87100.00%
40-49 YearsOld
5962.78%
3234.26%
32.96%
00.00%
93100.00%
50-64 YearsOld
5548.88%
4842.93%
76.68%
21.51%
112100.00%
65 Years andOlder
3547.37%
3547.46%
23.31%
11.86%
74100.00%
Male
Gender
14055.09%
10240.19%
83.07%
41.66%
253100.00%
Under 50%*
Female
14860.34%
8534.44%
114.35%
20.87%
246100.00%
Respondents Satisfaction with Level of Maintenance and Service
I am satisfied with the level ofmaintenance and service inparks, recreation, trails and openspaces.
Strongly Agree
Agree
Disagree
Strongly Disagree
Totals
ChiSq Significance
18-29 YearsOld
2012 Age Group on Q69:Age
2319.69%
6151.69%
2420.08%
108.55%
118100.00%
Under 50%
30-39 YearsOld
1314.58%
5057.69%
1921.77%
55.97%
87100.00%
40-49 YearsOld
1920.04%
5659.82%
1515.89%
44.25%
93100.00%
50-64 YearsOld
1815.67%
6154.47%
2522.41%
87.46%
112100.00%
65 Years andOlder
1216.33%
4257.39%
1418.36%
67.92%
74100.00%
Male
Gender
5320.91%
13051.48%
5120.20%
197.41%
253100.00%
Under 50%
Female
3413.92%
14659.38%
5020.32%
166.38%
246100.00%
www.peaksurveys.com QLI Age & Gender 140 F
Age & Gender
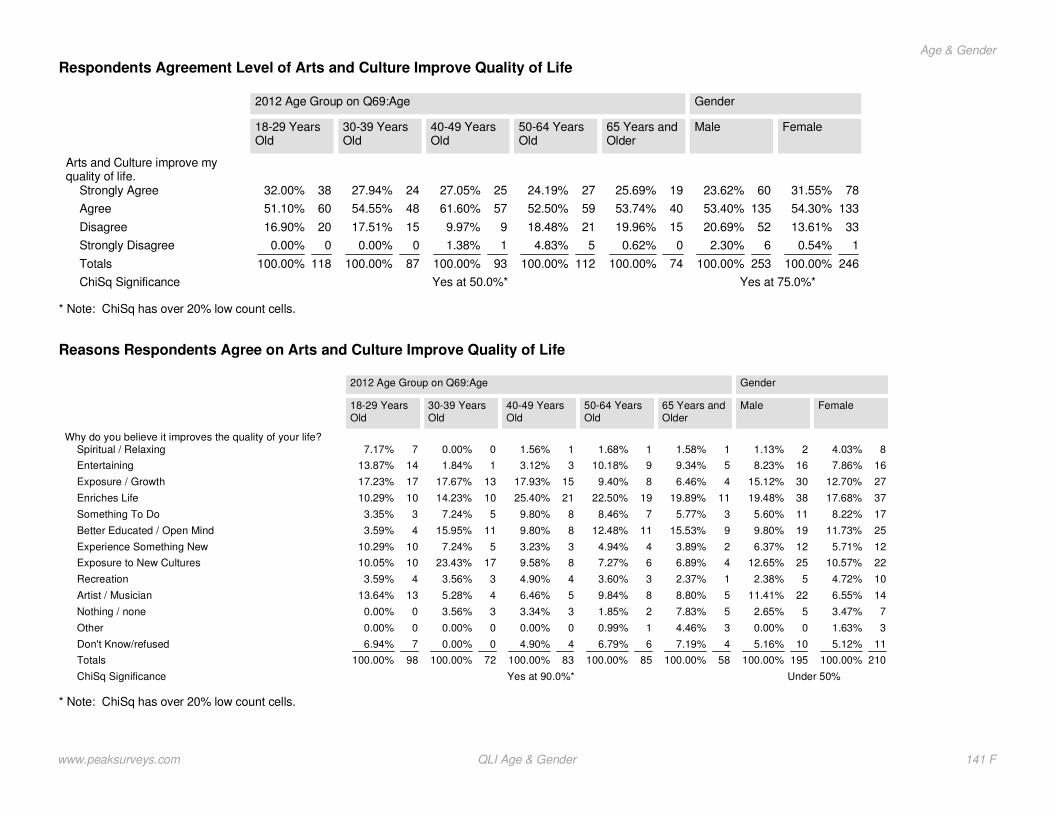
* Note: ChiSq has over 20% low count cells.
Respondents Agreement Level of Arts and Culture Improve Quality of Life
Arts and Culture improve myquality of life.
Strongly Agree
Agree
Disagree
Strongly Disagree
Totals
ChiSq Significance
18-29 YearsOld
2012 Age Group on Q69:Age
3832.00%
6051.10%
2016.90%
00.00%
118100.00%
Yes at 50.0%*
30-39 YearsOld
2427.94%
4854.55%
1517.51%
00.00%
87100.00%
40-49 YearsOld
2527.05%
5761.60%
99.97%
11.38%
93100.00%
50-64 YearsOld
2724.19%
5952.50%
2118.48%
54.83%
112100.00%
65 Years andOlder
1925.69%
4053.74%
1519.96%
00.62%
74100.00%
Male
Gender
6023.62%
13553.40%
5220.69%
62.30%
253100.00%
Yes at 75.0%*
Female
7831.55%
13354.30%
3313.61%
10.54%
246100.00%
* Note: ChiSq has over 20% low count cells.
Reasons Respondents Agree on Arts and Culture Improve Quality of Life
Why do you believe it improves the quality of your life?Spiritual / Relaxing
Entertaining
Exposure / Growth
Enriches Life
Something To Do
Better Educated / Open Mind
Experience Something New
Exposure to New Cultures
Recreation
Artist / Musician
Nothing / none
Other
Don't Know/refused
Totals
ChiSq Significance
18-29 YearsOld
2012 Age Group on Q69:Age
77.17%
1413.87%
1717.23%
1010.29%
33.35%
43.59%
1010.29%
1010.05%
43.59%
1313.64%
00.00%
00.00%
76.94%
98100.00%
Yes at 90.0%*
30-39 YearsOld
00.00%
11.84%
1317.67%
1014.23%
57.24%
1115.95%
57.24%
1723.43%
33.56%
45.28%
33.56%
00.00%
00.00%
72100.00%
40-49 YearsOld
11.56%
33.12%
1517.93%
2125.40%
89.80%
89.80%
33.23%
89.58%
44.90%
56.46%
33.34%
00.00%
44.90%
83100.00%
50-64 YearsOld
11.68%
910.18%
89.40%
1922.50%
78.46%
1112.48%
44.94%
67.27%
33.60%
89.84%
21.85%
10.99%
66.79%
85100.00%
65 Years andOlder
11.58%
59.34%
46.46%
1119.89%
35.77%
915.53%
23.89%
46.89%
12.37%
58.80%
57.83%
34.46%
47.19%
58100.00%
Male
Gender
21.13%
168.23%
3015.12%
3819.48%
115.60%
199.80%
126.37%
2512.65%
52.38%
2211.41%
52.65%
00.00%
105.16%
195100.00%
Under 50%
Female
84.03%
167.86%
2712.70%
3717.68%
178.22%
2511.73%
125.71%
2210.57%
104.72%
146.55%
73.47%
31.63%
115.12%
210100.00%
www.peaksurveys.com QLI Age & Gender 141 F
Age & Gender

* Note: ChiSq has over 20% low count cells.
Why Respondent Believes it Does Not Improve the Quality of Their Life
Why do you believe it does notimprove the quality of your life?
No Interest
More Important Things To Do
No effect on my life
Do not participate
Other
Don't Know/refused
Other
Totals
ChiSq Significance
18-29 YearsOld
2012 Age Group on Q69:Age
319.72%
740.83%
319.72%
00.00%
319.72%
00.00%
00.00%
17100.00%
Under 50%*
30-39 YearsOld
535.86%
318.24%
427.67%
19.43%
00.00%
18.81%
00.00%
14100.00%
40-49 YearsOld
437.39%
325.21%
324.36%
113.04%
00.00%
00.00%
00.00%
11100.00%
50-64 YearsOld
1041.38%
830.91%
312.98%
14.93%
00.00%
26.46%
13.34%
25100.00%
65 Years andOlder
856.69%
213.66%
110.07%
19.78%
16.47%
03.33%
00.00%
14100.00%
Male
Gender
2039.06%
1120.46%
1223.51%
23.21%
59.86%
23.89%
00.00%
52100.00%
Under 50%*
Female
1338.56%
1235.42%
39.17%
410.57%
00.00%
13.80%
12.47%
34100.00%
www.peaksurveys.com QLI Age & Gender 142 F
Age & Gender

Public Safety
Safety Walking in Neighborhood at Night
(19) How safe do you feelwalking in your neighborhoodduring the night?
Very safe
Somewhat safe
Somewhat unsafe
Very unsafe
Totals
ChiSq Significance
18-29 YearsOld
2012 Age Group on Q69:Age
8471.37%
2117.49%
108.35%
32.78%
118100.00%
Yes at 95.0%
30-39 YearsOld
3844.03%
3337.86%
910.62%
77.49%
87100.00%
40-49 YearsOld
4750.85%
2728.53%
1010.26%
1010.36%
93100.00%
50-64 YearsOld
5851.57%
3733.49%
119.81%
65.13%
112100.00%
65 Years andOlder
3243.94%
2432.48%
911.72%
911.86%
74100.00%
Male
Gender
16062.94%
6826.81%
197.61%
72.64%
253100.00%
Yes at 99.0%
Female
10642.97%
8132.88%
3112.64%
2811.51%
246100.00%
Respondent Agreement with the Needs of the Homeless being Adequately Addressed in the Pikes Peak Region
(20) Please tell us your level of agreementwith the following statement: The needs ofthe homeless are being adequatelyaddressed in the Pikes Peak region.
Strongly agree
Agree
Disagree
Strongly disagree
Don't know
Totals
ChiSq Significance
18-29 YearsOld
2012 Age Group on Q69:Age
32.78%
6151.49%
3731.41%
1311.33%
42.98%
118100.00%
Yes at 99.0%
30-39 YearsOld
88.71%
2326.32%
2428.04%
1517.71%
1719.23%
87100.00%
40-49 YearsOld
66.91%
3234.35%
2425.67%
1111.65%
2021.42%
93100.00%
50-64 YearsOld
108.53%
3833.56%
3228.93%
2320.38%
108.60%
112100.00%
65 Years andOlder
810.63%
2939.76%
2129.18%
710.17%
810.26%
74100.00%
Male
Gender
249.35%
10140.02%
6927.14%
3212.61%
2810.88%
253100.00%
Under 50%
Female
135.31%
8534.64%
7429.96%
4217.12%
3212.97%
246100.00%
www.peaksurveys.com QLI Age & Gender 143 F
Age & Gender

Community Engagement
* Note: ChiSq has over 20% low count cells.
How Accepting Respondents' feel the Community is of the Differences in Race, Ethnicity, Religious Preference, and GenderOrientation
How accepting of the differences inrace, Ethnicity, religious preference,and gender orientation do youconsider the community to be?
Very accepting
Somewhat accepting
Not very accepting
Not accepting at all
Don't know/NA
Totals
ChiSq Significance
18-29 YearsOld
2012 Age Group on Q69:Age
6151.49%
5445.53%
42.98%
00.00%
00.00%
118100.00%
Yes at 95.0%*
30-39 YearsOld
2326.32%
4450.00%
1617.81%
44.35%
11.52%
87100.00%
40-49 YearsOld
2728.63%
5054.10%
1111.55%
55.73%
00.00%
93100.00%
50-64 YearsOld
4338.53%
4742.07%
1614.34%
43.14%
21.92%
112100.00%
65 Years andOlder
3142.24%
3243.80%
79.55%
11.77%
22.64%
74100.00%
Male
Gender
9939.25%
12549.49%
207.99%
62.51%
20.75%
253100.00%
Under 50%
Female
9036.74%
11145.04%
3413.70%
83.09%
41.43%
246100.00%
Importance of Acceptance of Differences in Race, Ethnicity, Religious Preference, and Gender Orientation
How important do you believe it is to have acommunity that is accepting of thedifferences in race, Ethnicity, religiouspreference, and gender orientation?
It is very important
Somewhat important
Not very important
Not important at all
Don't know/NA
Totals
ChiSq Significance
18-29 YearsOld
2012 Age Group on Q69:Age
9177.53%
2016.71%
42.98%
32.78%
00.00%
118100.00%
Under 50%*
30-39 YearsOld
7384.11%
1314.48%
11.42%
00.00%
00.00%
87100.00%
40-49 YearsOld
7783.02%
1314.12%
32.86%
00.00%
00.00%
93100.00%
50-64 YearsOld
8575.91%
1815.95%
65.10%
21.46%
21.58%
112100.00%
65 Years andOlder
5169.71%
1622.19%
45.55%
11.15%
11.40%
74100.00%
Male
Gender
18070.89%
5822.70%
93.61%
51.94%
20.86%
253100.00%
Yes at 95.0%*
Female
20884.62%
2510.27%
93.70%
20.76%
20.65%
246100.00%
www.peaksurveys.com QLI Age & Gender 144 F
Age & Gender
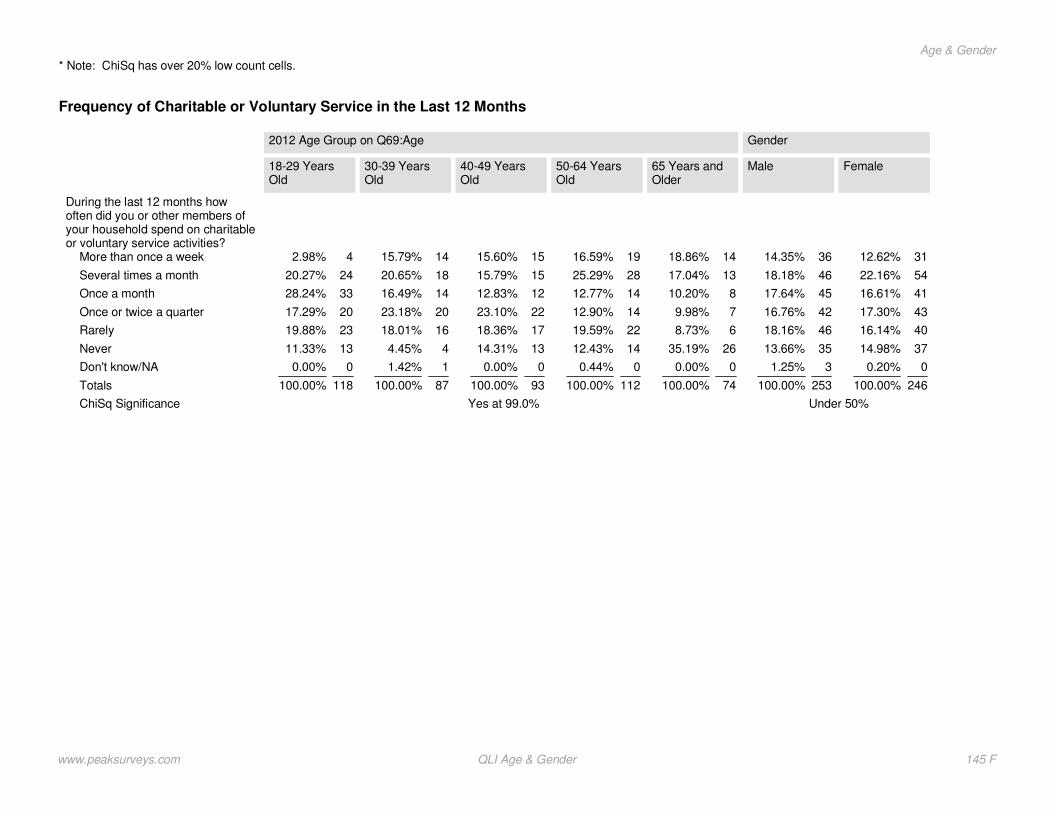
* Note: ChiSq has over 20% low count cells.
Frequency of Charitable or Voluntary Service in the Last 12 Months
During the last 12 months howoften did you or other members ofyour household spend on charitableor voluntary service activities?
More than once a week
Several times a month
Once a month
Once or twice a quarter
Rarely
Never
Don't know/NA
Totals
ChiSq Significance
18-29 YearsOld
2012 Age Group on Q69:Age
42.98%
2420.27%
3328.24%
2017.29%
2319.88%
1311.33%
00.00%
118100.00%
Yes at 99.0%
30-39 YearsOld
1415.79%
1820.65%
1416.49%
2023.18%
1618.01%
44.45%
11.42%
87100.00%
40-49 YearsOld
1515.60%
1515.79%
1212.83%
2223.10%
1718.36%
1314.31%
00.00%
93100.00%
50-64 YearsOld
1916.59%
2825.29%
1412.77%
1412.90%
2219.59%
1412.43%
00.44%
112100.00%
65 Years andOlder
1418.86%
1317.04%
810.20%
79.98%
68.73%
2635.19%
00.00%
74100.00%
Male
Gender
3614.35%
4618.18%
4517.64%
4216.76%
4618.16%
3513.66%
31.25%
253100.00%
Under 50%
Female
3112.62%
5422.16%
4116.61%
4317.30%
4016.14%
3714.98%
00.20%
246100.00%
www.peaksurveys.com QLI Age & Gender 145 F
Age & Gender
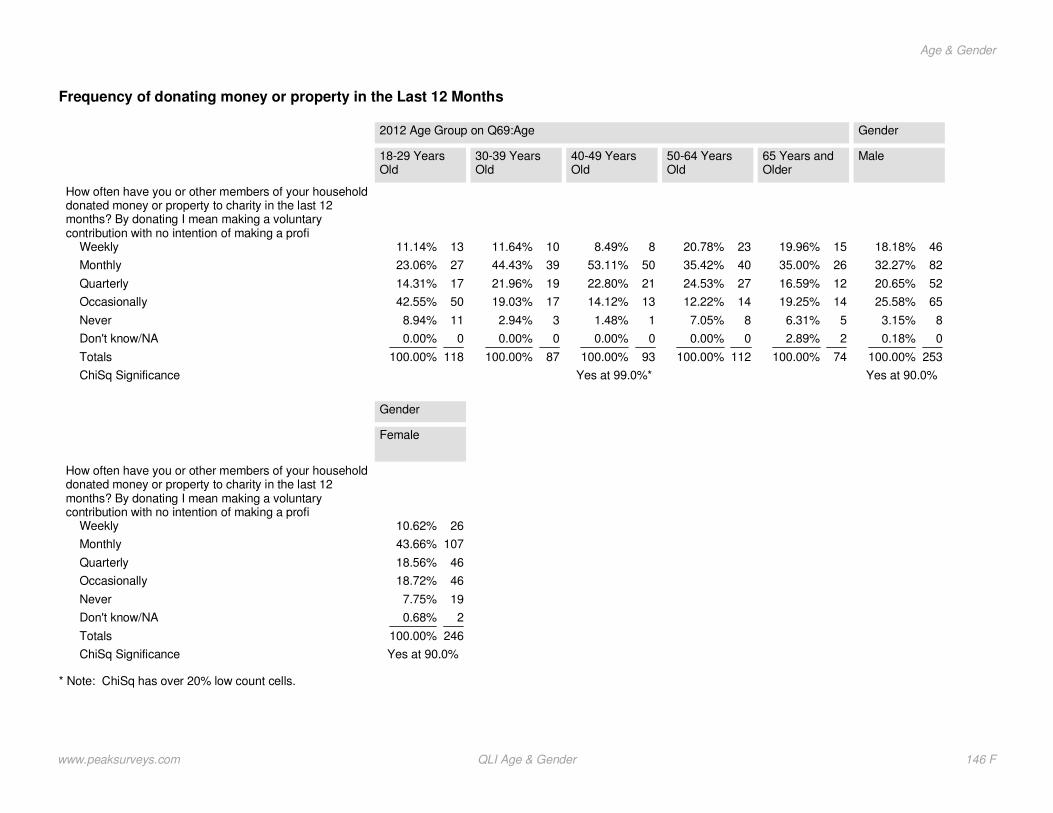
* Note: ChiSq has over 20% low count cells.
Frequency of donating money or property in the Last 12 Months
How often have you or other members of your householddonated money or property to charity in the last 12months? By donating I mean making a voluntarycontribution with no intention of making a profi
Weekly
Monthly
Quarterly
Occasionally
Never
Don't know/NA
Totals
ChiSq Significance
18-29 YearsOld
2012 Age Group on Q69:Age
1311.14%
2723.06%
1714.31%
5042.55%
118.94%
00.00%
118100.00%
Yes at 99.0%*
30-39 YearsOld
1011.64%
3944.43%
1921.96%
1719.03%
32.94%
00.00%
87100.00%
40-49 YearsOld
88.49%
5053.11%
2122.80%
1314.12%
11.48%
00.00%
93100.00%
50-64 YearsOld
2320.78%
4035.42%
2724.53%
1412.22%
87.05%
00.00%
112100.00%
65 Years andOlder
1519.96%
2635.00%
1216.59%
1419.25%
56.31%
22.89%
74100.00%
Male
Gender
4618.18%
8232.27%
5220.65%
6525.58%
83.15%
00.18%
253100.00%
Yes at 90.0%
How often have you or other members of your householddonated money or property to charity in the last 12months? By donating I mean making a voluntarycontribution with no intention of making a profi
Weekly
Monthly
Quarterly
Occasionally
Never
Don't know/NA
Totals
ChiSq Significance
Female
Gender
2610.62%
10743.66%
4618.56%
4618.72%
197.75%
20.68%
246100.00%
Yes at 90.0%
www.peaksurveys.com QLI Age & Gender 146 F
Age & Gender
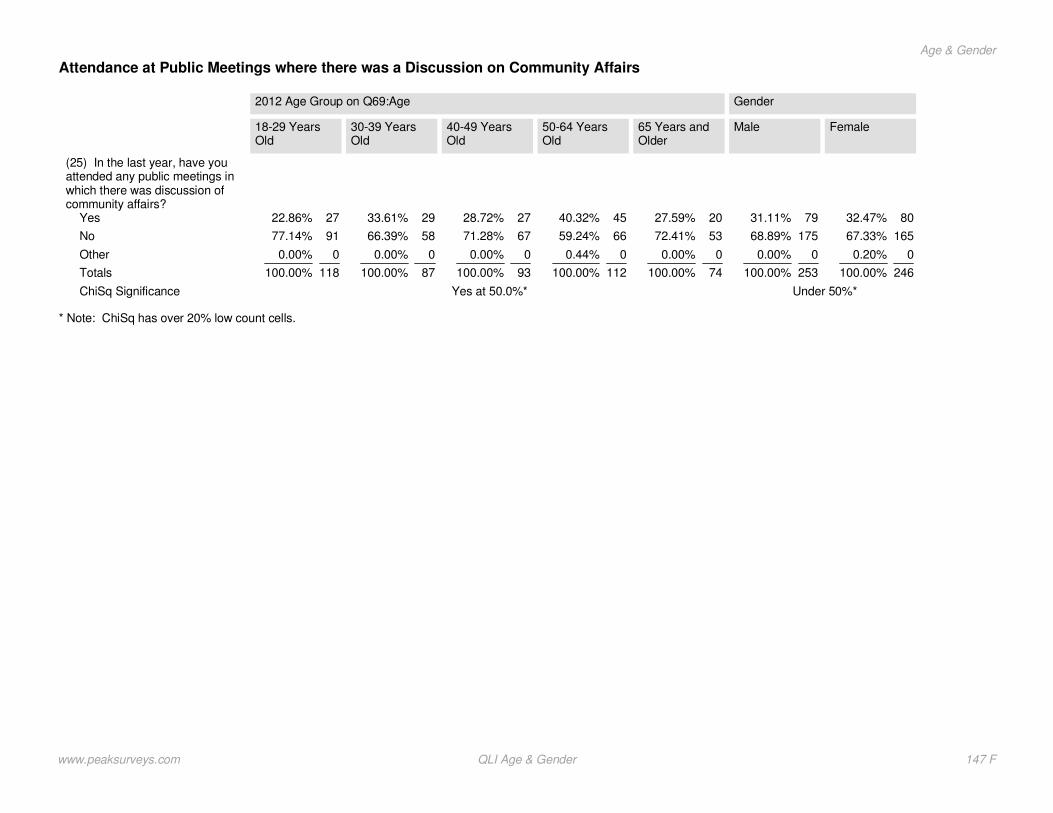
* Note: ChiSq has over 20% low count cells.
Attendance at Public Meetings where there was a Discussion on Community Affairs
(25) In the last year, have youattended any public meetings inwhich there was discussion ofcommunity affairs?
Yes
No
Other
Totals
ChiSq Significance
18-29 YearsOld
2012 Age Group on Q69:Age
2722.86%
9177.14%
00.00%
118100.00%
Yes at 50.0%*
30-39 YearsOld
2933.61%
5866.39%
00.00%
87100.00%
40-49 YearsOld
2728.72%
6771.28%
00.00%
93100.00%
50-64 YearsOld
4540.32%
6659.24%
00.44%
112100.00%
65 Years andOlder
2027.59%
5372.41%
00.00%
74100.00%
Male
Gender
7931.11%
17568.89%
00.00%
253100.00%
Under 50%*
Female
8032.47%
16567.33%
00.20%
246100.00%
www.peaksurveys.com QLI Age & Gender 147 F
Age & Gender

Section G
employmentcommunity survey
Peak Surveys
www.peaksurveys.com
Community and QLI Survey 2012

Employment Status
* Note: ChiSq has over 20% low count cells.
Overall Quality of Life in the Community
(1) Overall Quality ofLife in the Community
Excellent
Good
Fair
Poor
DK/NA
Totals
ChiSq Significance
Em
plo
yed b
y o
ther
org
aniz
ation
What is your current employment status?
8134.0%
14259.6%
94.0%
62.4%
00.0%
239100.0%
Under 50%*
Self e
mplo
yed
2535.4%
4057.4%
11.8%
34.7%
00.7%
70100.0%
Unem
plo
yed
1434.7%
2253.3%
36.7%
13.4%
11.9%
41100.0%
Hom
em
aker/
Keepin
ghouse
727.5%
1872.5%
00.0%
00.0%
00.0%
25100.0%
Stu
dent
327.2%
761.8%
111.0%
00.0%
00.0%
12100.0%
Retire
d
3842.9%
4450.4%
44.1%
21.9%
10.7%
88100.0%
Dis
able
d
318.0%
958.0%
211.5%
212.5%
00.0%
16100.0%
Oth
er
110.0%
663.5%
115.1%
111.3%
00.0%
9100.0%
* Note: ChiSq has over 20% low count cells.
Community Headed in Right or Wrong Direction
(2) Community Headed in theRight direction or Wrong direction
Right Direction
Wrong Direction
DK/NA
Totals
ChiSq Significance
Em
plo
yed b
y o
ther
org
aniz
ation
What is your current employment status?
17272.1%
4418.6%
229.3%
239100.0%
Yes at 75.0%*
Self e
mplo
yed
4768.0%
1521.2%
710.7%
70100.0%
Unem
plo
yed
2767.1%
818.5%
614.4%
41100.0%
Hom
em
aker/
Keepin
ghouse
1352.9%
1143.4%
13.7%
25100.0%
Stu
dent
759.9%
111.0%
429.2%
12100.0%
Retire
d
5664.1%
1719.4%
1416.5%
88100.0%
Dis
able
d
851.6%
848.4%
00.0%
16100.0%
Oth
er
779.8%
115.1%
05.0%
9100.0%
www.peaksurveys.com Community Survey Employment Status2012
Page 149 G
Employment Status

Most Important Issue Facing the Community
2012 Most Important IssueFacing the Community
Jobs / Unemployment
Economy
Don't know/NA/Refused
Crime
Education / schools
Budget / spending / finances
Presidential election
Growth and development
Child safety / safety
Environment
Homeless
Taxes
Traffic / transportation
Funding for emergencyservices (law enforcement/fire)
Water issues
Road repair / maintenance
Government
Healthcare
None / nothing
Military
Infrastructure
Housing
Em
plo
yed b
y o
ther
org
aniz
ation
What is your current employment status?
4820.1%
218.8%
2610.8%
218.7%
229.2%
114.6%
83.2%
93.7%
104.1%
62.7%
83.4%
52.1%
62.5%
62.5%
62.4%
93.7%
51.9%
10.3%
51.9%
31.1%
20.9%
00.2%
Self e
mplo
yed
913.4%
912.5%
33.8%
33.8%
811.1%
46.2%
33.9%
33.8%
11.1%
46.4%
45.4%
34.3%
23.0%
34.3%
11.2%
11.9%
11.8%
34.7%
11.1%
11.2%
00.0%
00.0%
Unem
plo
yed
24.3%
820.5%
922.4%
38.0%
512.9%
49.1%
00.0%
13.2%
410.0%
00.0%
00.0%
25.3%
00.0%
00.0%
00.0%
00.0%
00.0%
00.0%
00.0%
00.0%
00.0%
01.1%
Hom
em
aker/
Keepin
ghouse
518.8%
415.9%
29.1%
310.6%
519.7%
28.9%
00.0%
15.5%
00.0%
00.0%
13.4%
00.0%
00.0%
15.5%
00.0%
00.0%
00.0%
12.4%
00.0%
00.0%
00.0%
00.0%
Stu
dent
321.7%
00.0%
111.0%
327.2%
00.0%
00.0%
429.2%
00.0%
00.0%
00.0%
00.0%
00.0%
00.0%
00.0%
111.0%
00.0%
00.0%
00.0%
00.0%
00.0%
00.0%
00.0%
Retire
d
1719.2%
1921.9%
910.3%
66.4%
22.7%
10.7%
33.7%
33.3%
00.6%
44.2%
11.6%
33.1%
55.8%
11.6%
33.9%
11.0%
33.2%
22.0%
00.5%
00.0%
11.5%
22.2%
Dis
able
d
422.5%
213.3%
03.0%
318.9%
00.0%
15.2%
00.0%
00.0%
00.0%
00.0%
00.0%
14.8%
02.8%
210.6%
02.8%
00.0%
00.0%
14.8%
00.0%
14.8%
00.0%
00.0%
Oth
er
225.2%
18.7%
218.8%
336.0%
00.0%
00.0%
00.0%
00.0%
00.0%
00.0%
00.0%
00.0%
00.0%
00.0%
00.0%
00.0%
00.0%
111.3%
00.0%
00.0%
00.0%
00.0%
www.peaksurveys.com Community Survey Employment Status2012
Page 150 G
Employment Status
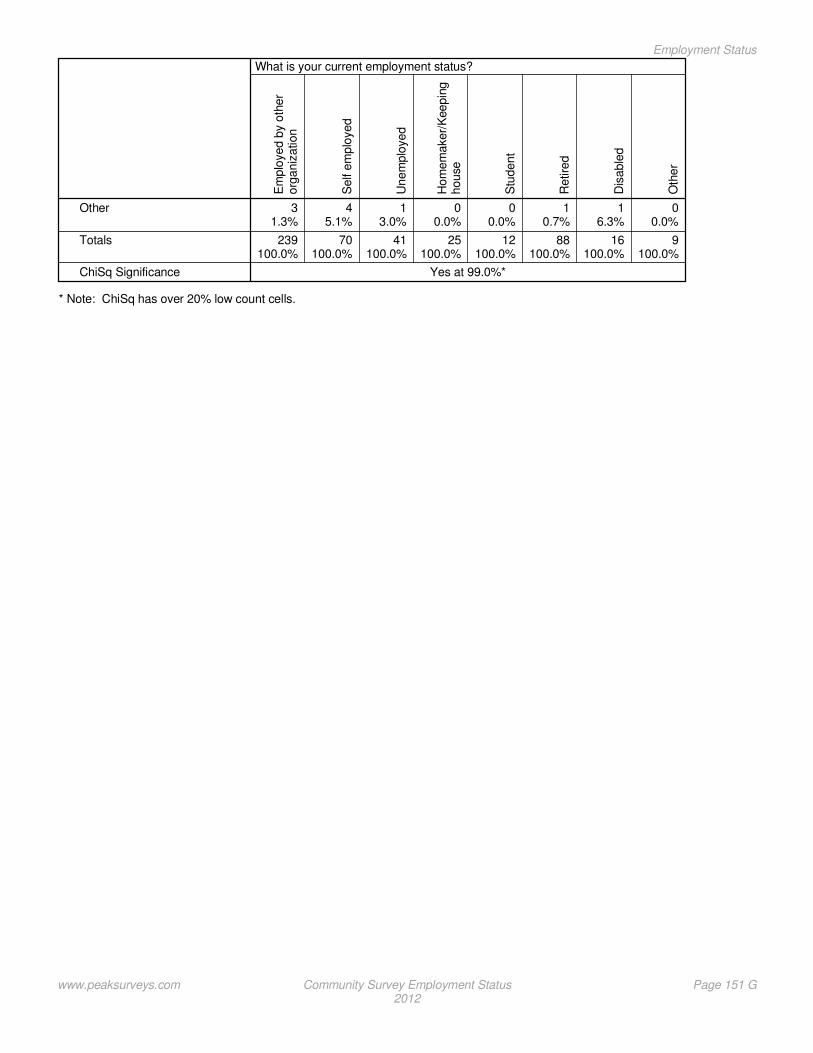
* Note: ChiSq has over 20% low count cells.
Other
Totals
ChiSq SignificanceE
mplo
yed b
y o
ther
org
aniz
ation
What is your current employment status?
31.3%
239100.0%
Yes at 99.0%*
Self e
mplo
yed
45.1%
70100.0%
Unem
plo
yed
13.0%
41100.0%
Hom
em
aker/
Keepin
ghouse
00.0%
25100.0%
Stu
dent
00.0%
12100.0%
Retire
d
10.7%
88100.0%
Dis
able
d
16.3%
16100.0%
Oth
er
00.0%
9100.0%
www.peaksurveys.com Community Survey Employment Status2012
Page 151 G
Employment Status
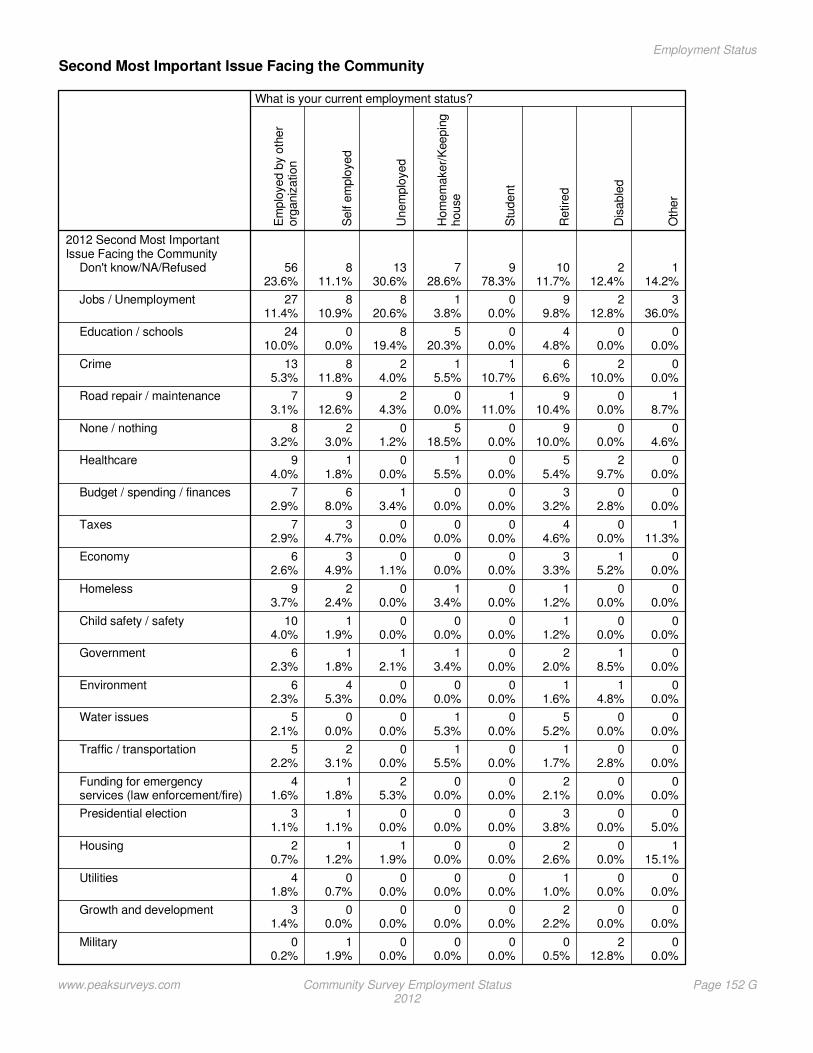
Second Most Important Issue Facing the Community
2012 Second Most ImportantIssue Facing the Community
Don't know/NA/Refused
Jobs / Unemployment
Education / schools
Crime
Road repair / maintenance
None / nothing
Healthcare
Budget / spending / finances
Taxes
Economy
Homeless
Child safety / safety
Government
Environment
Water issues
Traffic / transportation
Funding for emergencyservices (law enforcement/fire)
Presidential election
Housing
Utilities
Growth and development
Military
Em
plo
yed b
y o
ther
org
aniz
ation
What is your current employment status?
5623.6%
2711.4%
2410.0%
135.3%
73.1%
83.2%
94.0%
72.9%
72.9%
62.6%
93.7%
104.0%
62.3%
62.3%
52.1%
52.2%
41.6%
31.1%
20.7%
41.8%
31.4%
00.2%
Self e
mplo
yed
811.1%
810.9%
00.0%
811.8%
912.6%
23.0%
11.8%
68.0%
34.7%
34.9%
22.4%
11.9%
11.8%
45.3%
00.0%
23.1%
11.8%
11.1%
11.2%
00.7%
00.0%
11.9%
Unem
plo
yed
1330.6%
820.6%
819.4%
24.0%
24.3%
01.2%
00.0%
13.4%
00.0%
01.1%
00.0%
00.0%
12.1%
00.0%
00.0%
00.0%
25.3%
00.0%
11.9%
00.0%
00.0%
00.0%
Hom
em
aker/
Keepin
ghouse
728.6%
13.8%
520.3%
15.5%
00.0%
518.5%
15.5%
00.0%
00.0%
00.0%
13.4%
00.0%
13.4%
00.0%
15.3%
15.5%
00.0%
00.0%
00.0%
00.0%
00.0%
00.0%
Stu
dent
978.3%
00.0%
00.0%
110.7%
111.0%
00.0%
00.0%
00.0%
00.0%
00.0%
00.0%
00.0%
00.0%
00.0%
00.0%
00.0%
00.0%
00.0%
00.0%
00.0%
00.0%
00.0%
Retire
d
1011.7%
99.8%
44.8%
66.6%
910.4%
910.0%
55.4%
33.2%
44.6%
33.3%
11.2%
11.2%
22.0%
11.6%
55.2%
11.7%
22.1%
33.8%
22.6%
11.0%
22.2%
00.5%
Dis
able
d
212.4%
212.8%
00.0%
210.0%
00.0%
00.0%
29.7%
02.8%
00.0%
15.2%
00.0%
00.0%
18.5%
14.8%
00.0%
02.8%
00.0%
00.0%
00.0%
00.0%
00.0%
212.8%
Oth
er
114.2%
336.0%
00.0%
00.0%
18.7%
04.6%
00.0%
00.0%
111.3%
00.0%
00.0%
00.0%
00.0%
00.0%
00.0%
00.0%
00.0%
05.0%
115.1%
00.0%
00.0%
00.0%
www.peaksurveys.com Community Survey Employment Status2012
Page 152 G
Employment Status

* Note: ChiSq has over 20% low count cells.
Infrastructure
Other
Totals
ChiSq Significance
Em
plo
yed b
y o
ther
org
aniz
ation
What is your current employment status?
20.9%
166.5%
239100.0%
Yes at 99.0%*
Self e
mplo
yed
00.0%
710.2%
70100.0%
Unem
plo
yed
00.0%
36.1%
41100.0%
Hom
em
aker/
Keepin
ghouse
00.0%
00.0%
25100.0%
Stu
dent
00.0%
00.0%
12100.0%
Retire
d
00.0%
45.0%
88100.0%
Dis
able
d
00.0%
318.2%
16100.0%
Oth
er
05.0%
00.0%
9100.0%
www.peaksurveys.com Community Survey Employment Status2012
Page 153 G
Employment Status

* Note: ChiSq has over 20% low count cells.
Primary Source of Information When Getting Involved or Volunteering
(5) Primary Source ofInformattion when gettingInvolved or Volunteering
Church
Friends or Family
Internet
Local TV News
Newspaper
Local Non- profit organizations
Other
DK/NA
Totals
ChiSq Significance
Em
plo
yed b
y o
ther
org
aniz
ation
What is your current employment status?
5021.1%
5824.4%
4719.8%
3012.7%
114.6%
229.4%
187.6%
10.3%
239100.0%
Yes at 50.0%*
Self e
mplo
yed
1723.9%
1724.2%
912.8%
79.7%
1015.0%
57.4%
46.3%
00.7%
70100.0%
Unem
plo
yed
1434.7%
49.7%
1023.7%
511.4%
26.1%
13.3%
410.1%
01.1%
41100.0%
Hom
em
aker/
Keepin
ghouse
1248.5%
520.7%
27.1%
15.5%
00.0%
310.9%
15.3%
02.0%
25100.0%
Stu
dent
429.2%
327.2%
321.7%
00.0%
00.0%
111.0%
111.0%
00.0%
12100.0%
Retire
d
1820.0%
1315.4%
89.4%
1618.2%
1921.8%
55.3%
67.1%
22.8%
88100.0%
Dis
able
d
638.5%
17.7%
14.8%
317.7%
212.8%
210.0%
18.5%
00.0%
16100.0%
Oth
er
219.8%
05.0%
336.0%
220.0%
114.2%
05.0%
00.0%
00.0%
9100.0%
www.peaksurveys.com Community Survey Employment Status2012
Page 154 G
Employment Status

* Note: ChiSq has over 20% low count cells.
Who Respondents Trust When Addressing Community Issues
(6) Who Respondents Trust toAddress Community Issues
Religious organizations
Nonprofit organizations
Local businesses
Someone else
Local government
DK/NA
Totals
ChiSq Significance
Em
plo
yed b
y o
ther
org
aniz
ation
What is your current employment status?
5322.1%
6426.9%
3514.8%
3715.5%
3715.6%
125.2%
239100.0%
Yes at 50.0%*
Self e
mplo
yed
1724.0%
1725.0%
1420.4%
1217.5%
57.1%
46.0%
70100.0%
Unem
plo
yed
1228.7%
37.6%
1640.3%
615.5%
23.9%
24.0%
41100.0%
Hom
em
aker/
Keepin
ghouse
1350.6%
416.4%
310.6%
312.7%
15.3%
14.4%
25100.0%
Stu
dent
111.0%
327.2%
00.0%
650.8%
00.0%
111.0%
12100.0%
Retire
d
2224.8%
1821.0%
1011.3%
1214.1%
1213.8%
1315.0%
88100.0%
Dis
able
d
318.2%
742.5%
212.5%
317.1%
29.7%
00.0%
16100.0%
Oth
er
331.5%
00.0%
440.7%
113.7%
114.2%
00.0%
9100.0%
www.peaksurveys.com Community Survey Employment Status2012
Page 155 G
Employment Status

* Note: ChiSq has over 20% low count cells.
Favorability of County Commissioners
2410.2%
10845.4%
229.3%
197.8%
3514.7%
3012.7%
239100.0%
Yes at50.0%*
68.5%
3245.8%
69.1%
1013.9%
68.4%
1014.4%
70100.0%
00.0%
1126.0%
716.3%
36.7%
1331.6%
819.3%
41100.0%
00.0%
622.5%
414.3%
313.1%
312.4%
937.7%
25100.0%
00.0%
648.9%
00.0%
111.0%
540.1%
00.0%
12100.0%
88.6%
3338.2%
1113.0%
66.3%
1011.1%
2022.9%
88100.0%
14.8%
636.8%
318.5%
15.6%
315.7%
318.5%
16100.0%
00.0%
221.0%
00.0%
00.0%
550.2%
328.8%
9100.0%
What is your current employmentstatus?
Employed by otherorganization
Self employed
Unemployed
Homemaker/Keeping house
Student
Retired
Disabled
Other
Very
favora
ble
(7) Favorability of County Commissioners
Som
ew
hat
favora
ble
Som
ew
hat
unfa
vora
ble
Very
unfa
vora
ble
Never
heard
of
them
DK
/NA
Tota
ls
ChiS
qS
ignific
ance
* Note: ChiSq has over 20% low count cells.
Favorability of Colorado Springs City Council
(8) Favorability of ColoradoSprings City Council
Very favorable
Somewhat favorable
Somewhat unfavorable
Very unfavorable
Never heard of them
DK/NA
Totals
ChiSq Significance
Em
plo
yed b
y o
ther
org
aniz
ation
What is your current employment status?
138.4%
5837.9%
2416.0%
117.4%
128.1%
3422.2%
153100.0%
Yes at 50.0%*
Self e
mplo
yed
34.7%
2136.9%
1322.3%
711.8%
12.3%
1222.0%
56100.0%
Unem
plo
yed
25.4%
1239.7%
413.4%
00.0%
930.8%
310.8%
30100.0%
Hom
em
aker/
Keepin
ghouse
00.0%
633.6%
212.6%
211.9%
00.0%
841.8%
19100.0%
Stu
dent
00.0%
451.7%
00.0%
00.0%
00.0%
348.3%
7100.0%
Retire
d
47.7%
2542.3%
1119.5%
610.5%
23.2%
1016.8%
58100.0%
Dis
able
d
00.0%
648.5%
110.7%
04.2%
111.0%
325.6%
12100.0%
Oth
er
00.0%
464.2%
115.9%
00.0%
119.9%
00.0%
6100.0%
www.peaksurveys.com Community Survey Employment Status2012
Page 156 G
Employment Status

* Note: ChiSq has over 20% low count cells.
Most Important for Local Government to do that will Strengthen Trust and Build Confidence
2012 What is most important forlocal government to do - that willstrengthen trust and buildconfidence?
Don't know/NA/Refused
Be honest / fair / tell the truth
More involvement withcommunity
Balance the budget / debt
Create more jobs
Listen to the people
Communicate
Do what they say they aregoing to do
Improve the economy
Be transparent
Increase emergency services(law enforcement / fire)
Transportation / roads
Keep taxes low / stop raisingtaxes
Work together
Education
Nothing / none
Decrease crime
Infrastructure
Other
Totals
ChiSq Significance
Em
plo
yed b
y o
ther
org
aniz
ation
What is your current employment status?
2210.1%
2410.6%
219.5%
177.7%
125.5%
208.9%
115.1%
219.3%
73.2%
208.8%
135.9%
41.9%
41.9%
31.6%
41.8%
52.4%
52.1%
31.1%
62.7%
223100.0%
Yes at 99.0%*
Self e
mplo
yed
79.6%
34.5%
57.7%
912.3%
68.7%
23.1%
68.6%
23.3%
1217.0%
23.1%
11.8%
33.8%
00.0%
23.0%
34.9%
00.0%
00.0%
00.0%
68.4%
70100.0%
Unem
plo
yed
821.6%
512.2%
923.4%
37.1%
411.4%
01.3%
00.0%
25.5%
13.5%
00.0%
00.0%
01.2%
24.9%
12.2%
00.0%
00.0%
00.0%
00.0%
25.6%
38100.0%
Hom
em
aker/
Keepin
ghouse
313.7%
834.4%
00.0%
29.6%
29.3%
313.7%
27.9%
00.0%
00.0%
00.0%
00.0%
15.7%
00.0%
00.0%
00.0%
00.0%
00.0%
00.0%
15.7%
23100.0%
Stu
dent
440.1%
00.0%
00.0%
114.7%
00.0%
115.1%
00.0%
00.0%
330.2%
00.0%
00.0%
00.0%
00.0%
00.0%
00.0%
00.0%
00.0%
00.0%
00.0%
9100.0%
Retire
d
910.5%
1316.1%
56.4%
34.1%
78.1%
34.0%
911.0%
44.4%
66.7%
56.4%
11.6%
22.1%
33.3%
33.8%
00.6%
21.9%
22.0%
11.5%
45.2%
84100.0%
Dis
able
d
29.4%
320.1%
213.3%
00.0%
210.0%
00.0%
15.2%
00.0%
00.0%
00.0%
00.0%
212.8%
18.0%
00.0%
14.8%
14.8%
00.0%
00.0%
211.5%
16100.0%
Oth
er
442.8%
00.0%
00.0%
227.9%
00.0%
114.9%
00.0%
05.3%
00.0%
00.0%
00.0%
00.0%
19.1%
00.0%
00.0%
00.0%
00.0%
00.0%
00.0%
9100.0%
www.peaksurveys.com Community Survey Employment Status2012
Page 157 G
Employment Status

* Note: ChiSq has over 20% low count cells.
Positive or Negative Impact of Tabor in the Community
Positive or Negative Impact ofTabor in the Community
Generally positive impact
Generally negative impact
Really makes no difference
Don't know enough about it
Never heard of TABOR
DK/NA
Totals
ChiSq Significance
Em
plo
yed b
y o
ther
org
aniz
ation
What is your current employment status?
8435.1%
6527.1%
31.1%
3715.4%
3213.4%
197.9%
239100.0%
Yes at 75.0%*
Self e
mplo
yed
1825.4%
2535.3%
57.6%
913.5%
57.7%
710.6%
70100.0%
Unem
plo
yed
921.0%
923.2%
13.2%
49.2%
1741.4%
12.1%
41100.0%
Hom
em
aker/
Keepin
ghouse
519.0%
311.1%
310.7%
521.8%
726.8%
310.6%
25100.0%
Stu
dent
111.0%
00.0%
110.7%
538.2%
429.2%
111.0%
12100.0%
Retire
d
3337.9%
2427.9%
44.1%
1213.7%
88.7%
77.6%
88100.0%
Dis
able
d
212.8%
425.3%
316.4%
213.0%
316.3%
316.1%
16100.0%
Oth
er
218.3%
116.4%
00.0%
00.0%
550.2%
115.1%
9100.0%
* Note: ChiSq has over 20% low count cells.
Favorability of Amending Tabor
Favorability of AmendingTABOR?
Strongly favorable
Somewhat favorable
Somewhat unfavorable
Strongly unfavorable
DK/NA
Totals
ChiSq Significance
Em
plo
yed b
y o
ther
org
aniz
ation
What is your current employment status?
4619.2%
7029.3%
208.5%
135.4%
9037.6%
239100.0%
Under 50%*
Self e
mplo
yed
2129.5%
2130.0%
710.1%
22.5%
1927.9%
70100.0%
Unem
plo
yed
818.4%
922.5%
24.0%
25.2%
2049.8%
41100.0%
Hom
em
aker/
Keepin
ghouse
312.3%
519.1%
00.0%
14.2%
1664.4%
25100.0%
Stu
dent
111.0%
110.7%
111.0%
00.0%
867.4%
12100.0%
Retire
d
1416.1%
1921.4%
89.0%
1516.9%
3236.6%
88100.0%
Dis
able
d
527.7%
318.0%
211.5%
14.8%
637.9%
16100.0%
Oth
er
00.0%
220.0%
00.0%
114.7%
665.3%
9100.0%
www.peaksurveys.com Community Survey Employment Status2012
Page 158 G
Employment Status
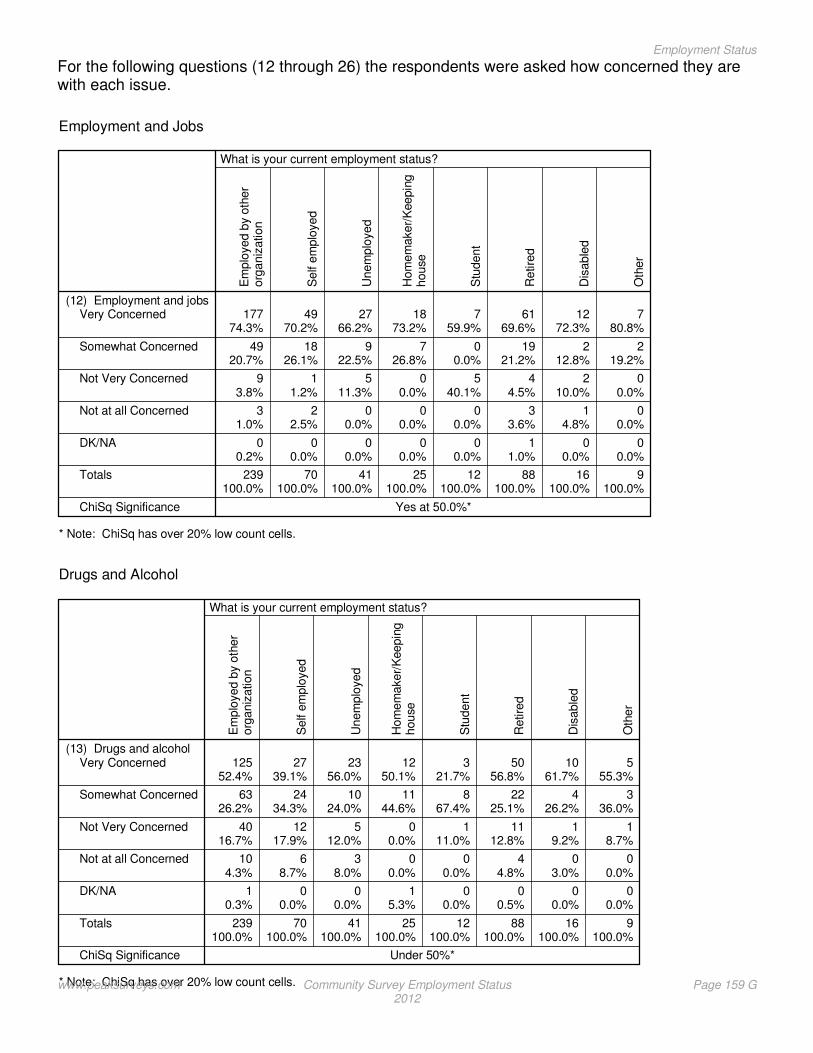
For the following questions (12 through 26) the respondents were asked how concerned they arewith each issue.
* Note: ChiSq has over 20% low count cells.
Employment and Jobs
(12) Employment and jobsVery Concerned
Somewhat Concerned
Not Very Concerned
Not at all Concerned
DK/NA
Totals
ChiSq Significance
Em
plo
yed b
y o
ther
org
aniz
ation
What is your current employment status?
17774.3%
4920.7%
93.8%
31.0%
00.2%
239100.0%
Yes at 50.0%*
Self e
mplo
yed
4970.2%
1826.1%
11.2%
22.5%
00.0%
70100.0%
Unem
plo
yed
2766.2%
922.5%
511.3%
00.0%
00.0%
41100.0%
Hom
em
aker/
Keepin
ghouse
1873.2%
726.8%
00.0%
00.0%
00.0%
25100.0%
Stu
dent
759.9%
00.0%
540.1%
00.0%
00.0%
12100.0%
Retire
d
6169.6%
1921.2%
44.5%
33.6%
11.0%
88100.0%
Dis
able
d
1272.3%
212.8%
210.0%
14.8%
00.0%
16100.0%
Oth
er
780.8%
219.2%
00.0%
00.0%
00.0%
9100.0%
* Note: ChiSq has over 20% low count cells.
Drugs and Alcohol
(13) Drugs and alcoholVery Concerned
Somewhat Concerned
Not Very Concerned
Not at all Concerned
DK/NA
Totals
ChiSq Significance
Em
plo
yed b
y o
ther
org
aniz
ation
What is your current employment status?
12552.4%
6326.2%
4016.7%
104.3%
10.3%
239100.0%
Under 50%*
Self e
mplo
yed
2739.1%
2434.3%
1217.9%
68.7%
00.0%
70100.0%
Unem
plo
yed
2356.0%
1024.0%
512.0%
38.0%
00.0%
41100.0%
Hom
em
aker/
Keepin
ghouse
1250.1%
1144.6%
00.0%
00.0%
15.3%
25100.0%
Stu
dent
321.7%
867.4%
111.0%
00.0%
00.0%
12100.0%
Retire
d
5056.8%
2225.1%
1112.8%
44.8%
00.5%
88100.0%
Dis
able
d
1061.7%
426.2%
19.2%
03.0%
00.0%
16100.0%
Oth
er
555.3%
336.0%
18.7%
00.0%
00.0%
9100.0%
www.peaksurveys.com Community Survey Employment Status2012
Page 159 G
Employment Status

* Note: ChiSq has over 20% low count cells.
Growth
(14) GrowthVery Concerned
Somewhat Concerned
Not Very Concerned
Not at all Concerned
DK/NA
Totals
ChiSq Significance
Em
plo
yed b
y o
ther
org
aniz
ation
What is your current employment status?
7832.6%
10443.4%
3615.0%
198.0%
21.0%
239100.0%
Yes at 75.0%*
Self e
mplo
yed
2637.8%
2637.3%
1217.7%
34.2%
23.0%
70100.0%
Unem
plo
yed
1330.8%
1535.5%
819.2%
614.5%
00.0%
41100.0%
Hom
em
aker/
Keepin
ghouse
624.2%
1145.8%
624.7%
00.0%
15.3%
25100.0%
Stu
dent
111.0%
111.0%
867.4%
110.7%
00.0%
12100.0%
Retire
d
3337.3%
3540.1%
1112.4%
88.6%
11.7%
88100.0%
Dis
able
d
423.3%
957.4%
211.5%
03.0%
14.8%
16100.0%
Oth
er
328.5%
114.2%
05.0%
116.4%
336.0%
9100.0%
* Note: ChiSq has over 20% low count cells.
Affordable Housing
(15) Affordable housingVery Concerned
Somewhat Concerned
Not Very Concerned
Not at all Concerned
DK/NA
Totals
ChiSq Significance
Em
plo
yed b
y o
ther
org
aniz
ation
What is your current employment status?
10443.6%
9037.6%
2811.7%
177.2%
00.0%
239100.0%
Yes at 50.0%*
Self e
mplo
yed
2840.6%
1825.4%
1318.4%
1014.3%
11.3%
70100.0%
Unem
plo
yed
1741.7%
1025.5%
1229.0%
23.9%
00.0%
41100.0%
Hom
em
aker/
Keepin
ghouse
1248.1%
1041.0%
310.9%
00.0%
00.0%
25100.0%
Stu
dent
432.6%
538.2%
429.2%
00.0%
00.0%
12100.0%
Retire
d
2933.2%
3034.6%
1213.1%
1314.7%
44.4%
88100.0%
Dis
able
d
1592.0%
15.2%
02.8%
00.0%
00.0%
16100.0%
Oth
er
327.5%
441.0%
331.5%
00.0%
00.0%
9100.0%
www.peaksurveys.com Community Survey Employment Status2012
Page 160 G
Employment Status
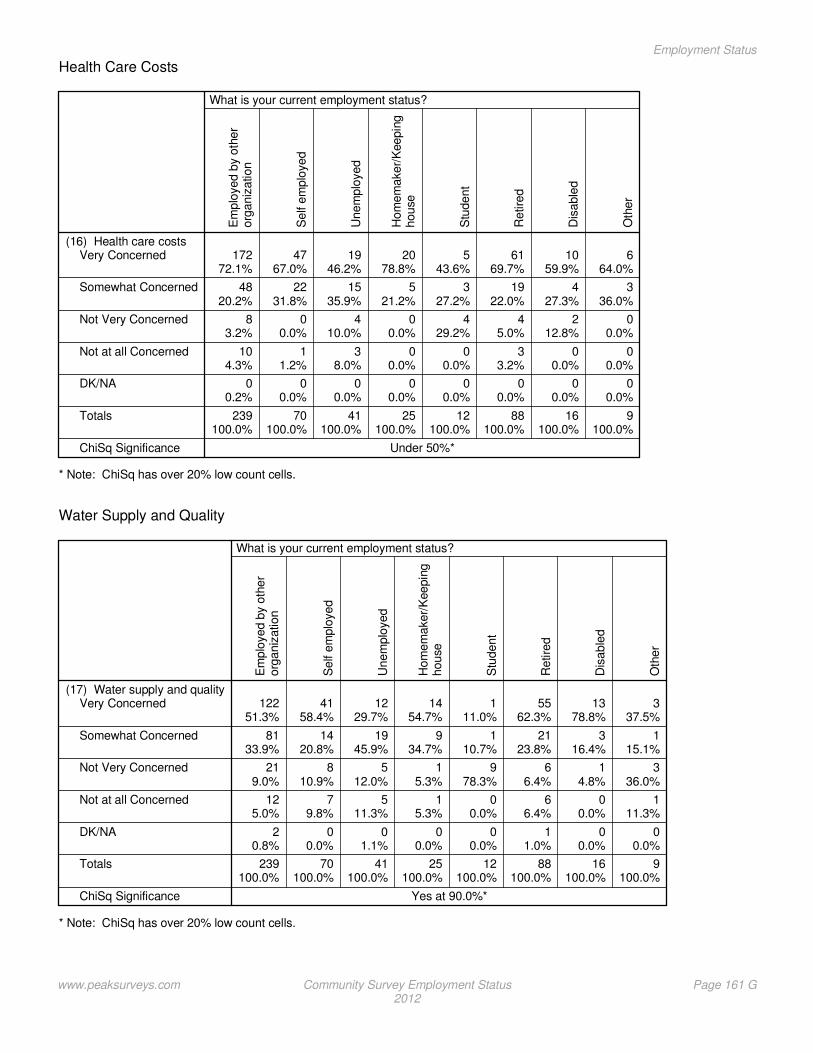
* Note: ChiSq has over 20% low count cells.
Health Care Costs
(16) Health care costsVery Concerned
Somewhat Concerned
Not Very Concerned
Not at all Concerned
DK/NA
Totals
ChiSq Significance
Em
plo
yed b
y o
ther
org
aniz
ation
What is your current employment status?
17272.1%
4820.2%
83.2%
104.3%
00.2%
239100.0%
Under 50%*
Self e
mplo
yed
4767.0%
2231.8%
00.0%
11.2%
00.0%
70100.0%
Unem
plo
yed
1946.2%
1535.9%
410.0%
38.0%
00.0%
41100.0%
Hom
em
aker/
Keepin
ghouse
2078.8%
521.2%
00.0%
00.0%
00.0%
25100.0%
Stu
dent
543.6%
327.2%
429.2%
00.0%
00.0%
12100.0%
Retire
d
6169.7%
1922.0%
45.0%
33.2%
00.0%
88100.0%
Dis
able
d
1059.9%
427.3%
212.8%
00.0%
00.0%
16100.0%
Oth
er
664.0%
336.0%
00.0%
00.0%
00.0%
9100.0%
* Note: ChiSq has over 20% low count cells.
Water Supply and Quality
(17) Water supply and qualityVery Concerned
Somewhat Concerned
Not Very Concerned
Not at all Concerned
DK/NA
Totals
ChiSq Significance
Em
plo
yed b
y o
ther
org
aniz
ation
What is your current employment status?
12251.3%
8133.9%
219.0%
125.0%
20.8%
239100.0%
Yes at 90.0%*
Self e
mplo
yed
4158.4%
1420.8%
810.9%
79.8%
00.0%
70100.0%
Unem
plo
yed
1229.7%
1945.9%
512.0%
511.3%
01.1%
41100.0%
Hom
em
aker/
Keepin
ghouse
1454.7%
934.7%
15.3%
15.3%
00.0%
25100.0%
Stu
dent
111.0%
110.7%
978.3%
00.0%
00.0%
12100.0%
Retire
d
5562.3%
2123.8%
66.4%
66.4%
11.0%
88100.0%
Dis
able
d
1378.8%
316.4%
14.8%
00.0%
00.0%
16100.0%
Oth
er
337.5%
115.1%
336.0%
111.3%
00.0%
9100.0%
www.peaksurveys.com Community Survey Employment Status2012
Page 161 G
Employment Status

* Note: ChiSq has over 20% low count cells.
Effective Community Leadership
Effective community leadershipVery Concerned
Somewhat Concerned
Not Very Concerned
Not at all Concerned
DK/NA
Totals
ChiSq Significance
Em
plo
yed b
y o
ther
org
aniz
ation
What is your current employment status?
11950.0%
8334.9%
198.2%
177.0%
00.0%
239100.0%
Under 50%*
Self e
mplo
yed
4158.7%
1723.9%
57.3%
68.1%
12.0%
70100.0%
Unem
plo
yed
1434.9%
1638.0%
49.1%
38.0%
410.0%
41100.0%
Hom
em
aker/
Keepin
ghouse
1042.1%
1352.6%
00.0%
00.0%
15.3%
25100.0%
Stu
dent
761.8%
327.2%
111.0%
00.0%
00.0%
12100.0%
Retire
d
4450.2%
2326.7%
89.5%
66.8%
66.9%
88100.0%
Dis
able
d
956.9%
320.4%
14.8%
16.3%
211.5%
16100.0%
Oth
er
329.3%
221.0%
336.0%
18.7%
05.0%
9100.0%
* Note: ChiSq has over 20% low count cells.
Services to Homeless
(19) Services for the homelessVery Concerned
Somewhat Concerned
Not Very Concerned
Not at all Concerned
DK/NA
Totals
ChiSq Significance
Em
plo
yed b
y o
ther
org
aniz
ation
What is your current employment status?
8435.1%
10845.3%
2912.3%
156.2%
31.0%
239100.0%
Under 50%*
Self e
mplo
yed
2941.7%
2739.0%
69.2%
45.4%
34.7%
70100.0%
Unem
plo
yed
1435.1%
2459.1%
11.9%
23.9%
00.0%
41100.0%
Hom
em
aker/
Keepin
ghouse
1558.3%
832.2%
29.5%
00.0%
00.0%
25100.0%
Stu
dent
432.6%
327.2%
429.2%
00.0%
111.0%
12100.0%
Retire
d
3641.0%
4045.5%
44.9%
66.4%
22.3%
88100.0%
Dis
able
d
1271.9%
423.2%
14.8%
00.0%
00.0%
16100.0%
Oth
er
779.8%
220.2%
00.0%
00.0%
00.0%
9100.0%
www.peaksurveys.com Community Survey Employment Status2012
Page 162 G
Employment Status
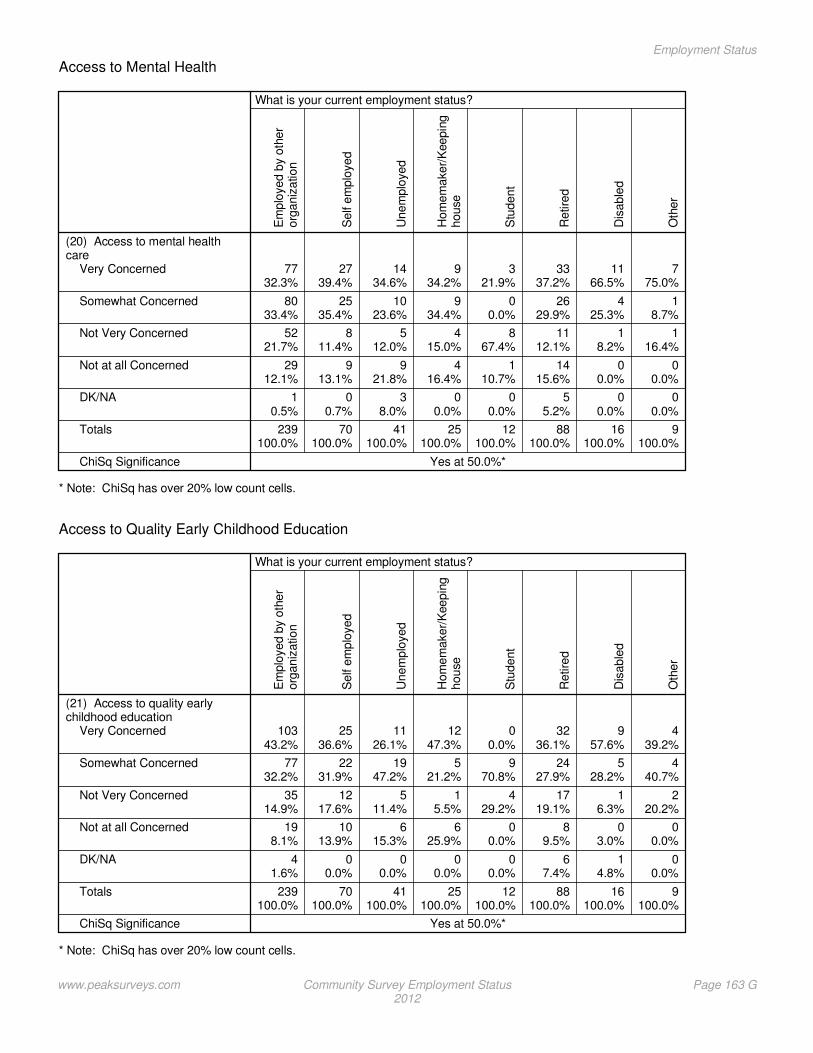
* Note: ChiSq has over 20% low count cells.
Access to Mental Health
(20) Access to mental healthcare
Very Concerned
Somewhat Concerned
Not Very Concerned
Not at all Concerned
DK/NA
Totals
ChiSq Significance
Em
plo
yed b
y o
ther
org
aniz
ation
What is your current employment status?
7732.3%
8033.4%
5221.7%
2912.1%
10.5%
239100.0%
Yes at 50.0%*
Self e
mplo
yed
2739.4%
2535.4%
811.4%
913.1%
00.7%
70100.0%
Unem
plo
yed
1434.6%
1023.6%
512.0%
921.8%
38.0%
41100.0%
Hom
em
aker/
Keepin
ghouse
934.2%
934.4%
415.0%
416.4%
00.0%
25100.0%
Stu
dent
321.9%
00.0%
867.4%
110.7%
00.0%
12100.0%
Retire
d
3337.2%
2629.9%
1112.1%
1415.6%
55.2%
88100.0%
Dis
able
d
1166.5%
425.3%
18.2%
00.0%
00.0%
16100.0%
Oth
er
775.0%
18.7%
116.4%
00.0%
00.0%
9100.0%
* Note: ChiSq has over 20% low count cells.
Access to Quality Early Childhood Education
(21) Access to quality earlychildhood education
Very Concerned
Somewhat Concerned
Not Very Concerned
Not at all Concerned
DK/NA
Totals
ChiSq Significance
Em
plo
yed b
y o
ther
org
aniz
ation
What is your current employment status?
10343.2%
7732.2%
3514.9%
198.1%
41.6%
239100.0%
Yes at 50.0%*
Self e
mplo
yed
2536.6%
2231.9%
1217.6%
1013.9%
00.0%
70100.0%
Unem
plo
yed
1126.1%
1947.2%
511.4%
615.3%
00.0%
41100.0%
Hom
em
aker/
Keepin
ghouse
1247.3%
521.2%
15.5%
625.9%
00.0%
25100.0%
Stu
dent
00.0%
970.8%
429.2%
00.0%
00.0%
12100.0%
Retire
d
3236.1%
2427.9%
1719.1%
89.5%
67.4%
88100.0%
Dis
able
d
957.6%
528.2%
16.3%
03.0%
14.8%
16100.0%
Oth
er
439.2%
440.7%
220.2%
00.0%
00.0%
9100.0%
www.peaksurveys.com Community Survey Employment Status2012
Page 163 G
Employment Status
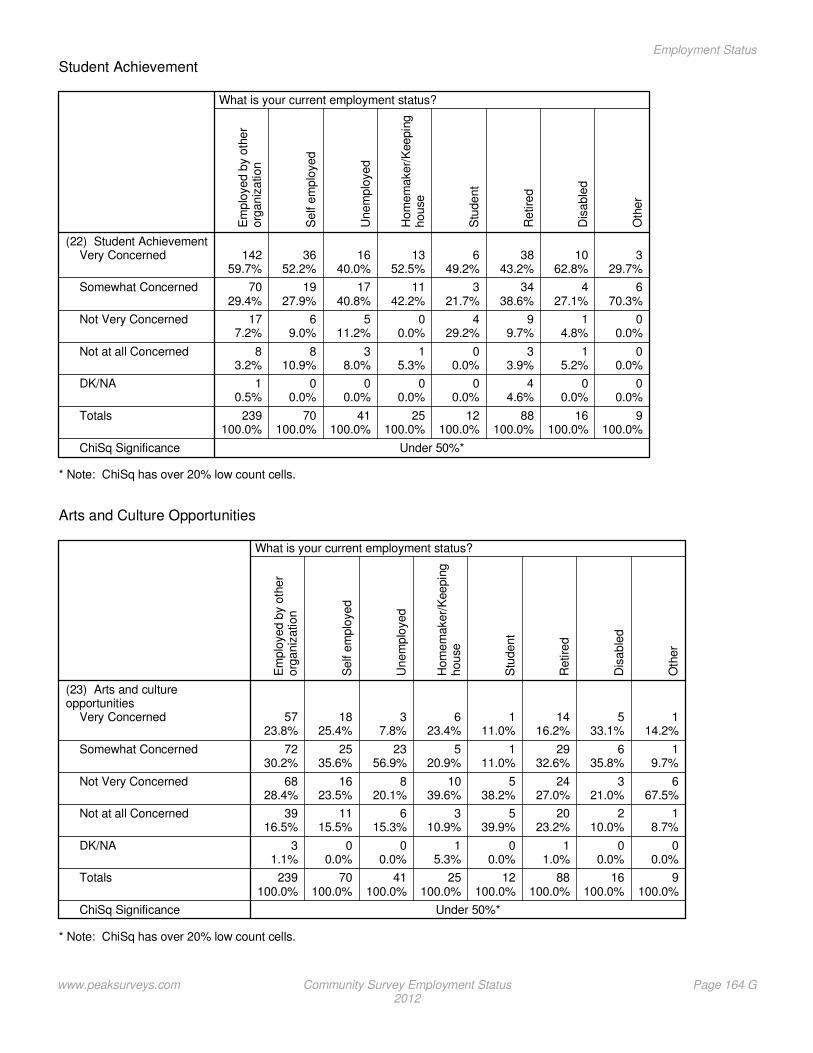
* Note: ChiSq has over 20% low count cells.
Student Achievement
(22) Student AchievementVery Concerned
Somewhat Concerned
Not Very Concerned
Not at all Concerned
DK/NA
Totals
ChiSq Significance
Em
plo
yed b
y o
ther
org
aniz
ation
What is your current employment status?
14259.7%
7029.4%
177.2%
83.2%
10.5%
239100.0%
Under 50%*
Self e
mplo
yed
3652.2%
1927.9%
69.0%
810.9%
00.0%
70100.0%
Unem
plo
yed
1640.0%
1740.8%
511.2%
38.0%
00.0%
41100.0%
Hom
em
aker/
Keepin
ghouse
1352.5%
1142.2%
00.0%
15.3%
00.0%
25100.0%
Stu
dent
649.2%
321.7%
429.2%
00.0%
00.0%
12100.0%
Retire
d
3843.2%
3438.6%
99.7%
33.9%
44.6%
88100.0%
Dis
able
d
1062.8%
427.1%
14.8%
15.2%
00.0%
16100.0%
Oth
er
329.7%
670.3%
00.0%
00.0%
00.0%
9100.0%
* Note: ChiSq has over 20% low count cells.
Arts and Culture Opportunities
(23) Arts and cultureopportunities
Very Concerned
Somewhat Concerned
Not Very Concerned
Not at all Concerned
DK/NA
Totals
ChiSq Significance
Em
plo
yed b
y o
ther
org
aniz
ation
What is your current employment status?
5723.8%
7230.2%
6828.4%
3916.5%
31.1%
239100.0%
Under 50%*
Self e
mplo
yed
1825.4%
2535.6%
1623.5%
1115.5%
00.0%
70100.0%
Unem
plo
yed
37.8%
2356.9%
820.1%
615.3%
00.0%
41100.0%
Hom
em
aker/
Keepin
ghouse
623.4%
520.9%
1039.6%
310.9%
15.3%
25100.0%
Stu
dent
111.0%
111.0%
538.2%
539.9%
00.0%
12100.0%
Retire
d
1416.2%
2932.6%
2427.0%
2023.2%
11.0%
88100.0%
Dis
able
d
533.1%
635.8%
321.0%
210.0%
00.0%
16100.0%
Oth
er
114.2%
19.7%
667.5%
18.7%
00.0%
9100.0%
www.peaksurveys.com Community Survey Employment Status2012
Page 164 G
Employment Status

* Note: ChiSq has over 20% low count cells.
Crime Rate
(24) Crime rateVery Concerned
Somewhat Concerned
Not Very Concerned
Not at all Concerned
DK/NA
Totals
ChiSq Significance
Em
plo
yed b
y o
ther
org
aniz
ation
What is your current employment status?
13355.5%
6828.7%
2510.6%
125.2%
00.0%
239100.0%
Yes at 50.0%*
Self e
mplo
yed
2637.8%
3042.5%
1116.0%
33.7%
00.0%
70100.0%
Unem
plo
yed
2151.0%
1127.6%
513.3%
38.0%
00.0%
41100.0%
Hom
em
aker/
Keepin
ghouse
1974.5%
414.9%
15.3%
00.0%
15.3%
25100.0%
Stu
dent
321.7%
327.2%
651.1%
00.0%
00.0%
12100.0%
Retire
d
5562.2%
2224.6%
910.1%
11.5%
11.6%
88100.0%
Dis
able
d
1378.7%
316.1%
15.2%
00.0%
00.0%
16100.0%
Oth
er
559.0%
05.0%
336.0%
00.0%
00.0%
9100.0%
* Note: ChiSq has over 20% low count cells.
Voter Participation
(25) Voter participationVery Concerned
Somewhat Concerned
Not Very Concerned
Not at all Concerned
DK/NA
Totals
ChiSq Significance
Em
plo
yed b
y o
ther
org
aniz
ation
What is your current employment status?
12251.0%
7431.2%
2610.9%
166.9%
00.0%
239100.0%
Yes at 50.0%*
Self e
mplo
yed
4259.7%
68.9%
1216.7%
1014.7%
00.0%
70100.0%
Unem
plo
yed
1127.1%
2151.1%
25.3%
614.4%
12.1%
41100.0%
Hom
em
aker/
Keepin
ghouse
1142.8%
1144.5%
27.1%
15.5%
00.0%
25100.0%
Stu
dent
978.3%
110.7%
111.0%
00.0%
00.0%
12100.0%
Retire
d
4854.3%
2224.5%
1010.8%
55.2%
45.1%
88100.0%
Dis
able
d
848.1%
532.5%
18.0%
00.0%
211.5%
16100.0%
Oth
er
552.6%
336.0%
00.0%
111.3%
00.0%
9100.0%
www.peaksurveys.com Community Survey Employment Status2012
Page 165 G
Employment Status
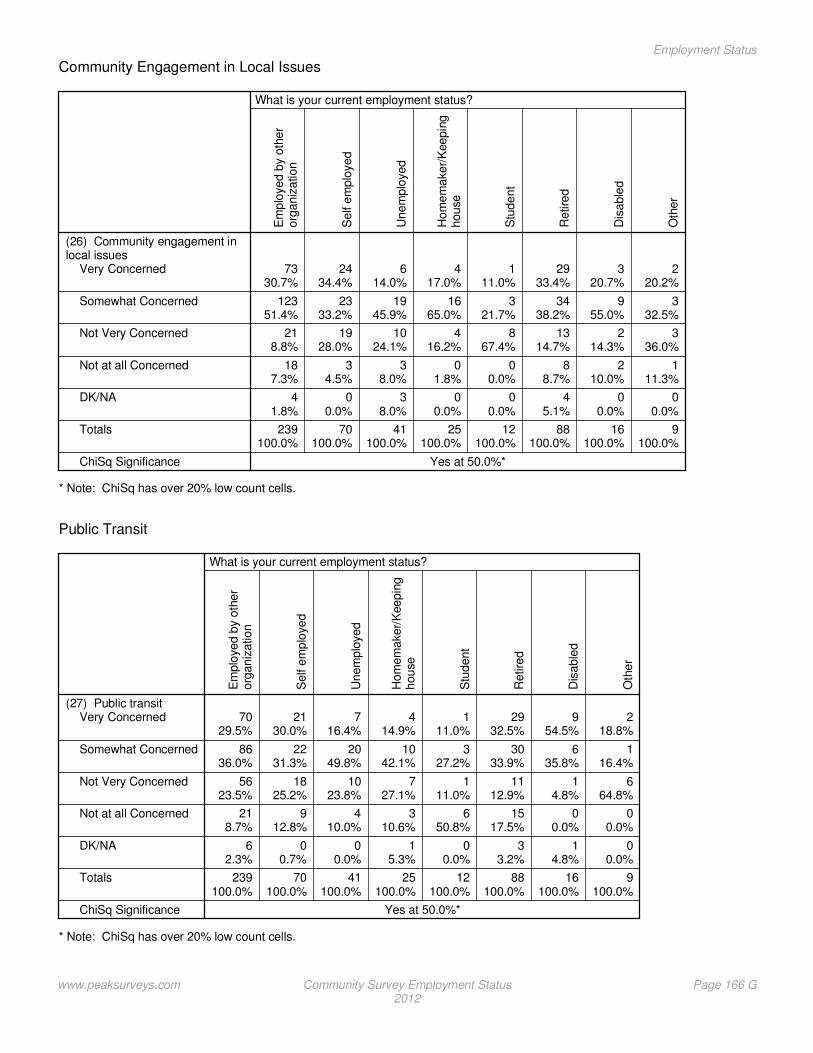
* Note: ChiSq has over 20% low count cells.
Community Engagement in Local Issues
(26) Community engagement inlocal issues
Very Concerned
Somewhat Concerned
Not Very Concerned
Not at all Concerned
DK/NA
Totals
ChiSq Significance
Em
plo
yed b
y o
ther
org
aniz
ation
What is your current employment status?
7330.7%
12351.4%
218.8%
187.3%
41.8%
239100.0%
Yes at 50.0%*
Self e
mplo
yed
2434.4%
2333.2%
1928.0%
34.5%
00.0%
70100.0%
Unem
plo
yed
614.0%
1945.9%
1024.1%
38.0%
38.0%
41100.0%
Hom
em
aker/
Keepin
ghouse
417.0%
1665.0%
416.2%
01.8%
00.0%
25100.0%
Stu
dent
111.0%
321.7%
867.4%
00.0%
00.0%
12100.0%
Retire
d
2933.4%
3438.2%
1314.7%
88.7%
45.1%
88100.0%
Dis
able
d
320.7%
955.0%
214.3%
210.0%
00.0%
16100.0%
Oth
er
220.2%
332.5%
336.0%
111.3%
00.0%
9100.0%
* Note: ChiSq has over 20% low count cells.
Public Transit
(27) Public transitVery Concerned
Somewhat Concerned
Not Very Concerned
Not at all Concerned
DK/NA
Totals
ChiSq Significance
Em
plo
yed b
y o
ther
org
aniz
ation
What is your current employment status?
7029.5%
8636.0%
5623.5%
218.7%
62.3%
239100.0%
Yes at 50.0%*
Self e
mplo
yed
2130.0%
2231.3%
1825.2%
912.8%
00.7%
70100.0%
Unem
plo
yed
716.4%
2049.8%
1023.8%
410.0%
00.0%
41100.0%
Hom
em
aker/
Keepin
ghouse
414.9%
1042.1%
727.1%
310.6%
15.3%
25100.0%
Stu
dent
111.0%
327.2%
111.0%
650.8%
00.0%
12100.0%
Retire
d
2932.5%
3033.9%
1112.9%
1517.5%
33.2%
88100.0%
Dis
able
d
954.5%
635.8%
14.8%
00.0%
14.8%
16100.0%
Oth
er
218.8%
116.4%
664.8%
00.0%
00.0%
9100.0%
www.peaksurveys.com Community Survey Employment Status2012
Page 166 G
Employment Status
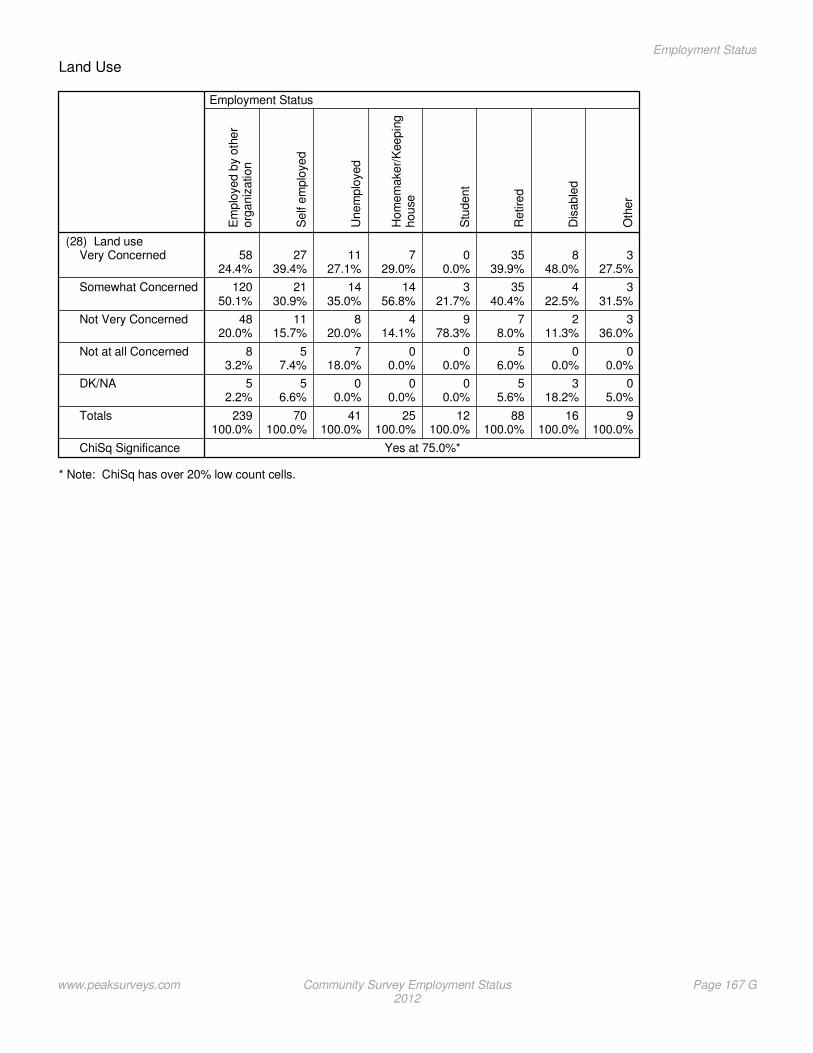
* Note: ChiSq has over 20% low count cells.
Land Use
(28) Land useVery Concerned
Somewhat Concerned
Not Very Concerned
Not at all Concerned
DK/NA
Totals
ChiSq Significance
Em
plo
yed b
y o
ther
org
aniz
ation
Employment Status
5824.4%
12050.1%
4820.0%
83.2%
52.2%
239100.0%
Yes at 75.0%*
Self e
mplo
yed
2739.4%
2130.9%
1115.7%
57.4%
56.6%
70100.0%
Unem
plo
yed
1127.1%
1435.0%
820.0%
718.0%
00.0%
41100.0%
Hom
em
aker/
Keepin
ghouse
729.0%
1456.8%
414.1%
00.0%
00.0%
25100.0%
Stu
dent
00.0%
321.7%
978.3%
00.0%
00.0%
12100.0%
Retire
d
3539.9%
3540.4%
78.0%
56.0%
55.6%
88100.0%
Dis
able
d
848.0%
422.5%
211.3%
00.0%
318.2%
16100.0%
Oth
er
327.5%
331.5%
336.0%
00.0%
05.0%
9100.0%
www.peaksurveys.com Community Survey Employment Status2012
Page 167 G
Employment Status

www.peaksurveys.com Community Survey Employment Status2012
Page 168 G
Employment Status
Section G
employmentquality of life
Peak Surveys
www.peaksurveys.com
Community and QLI Survey 2012
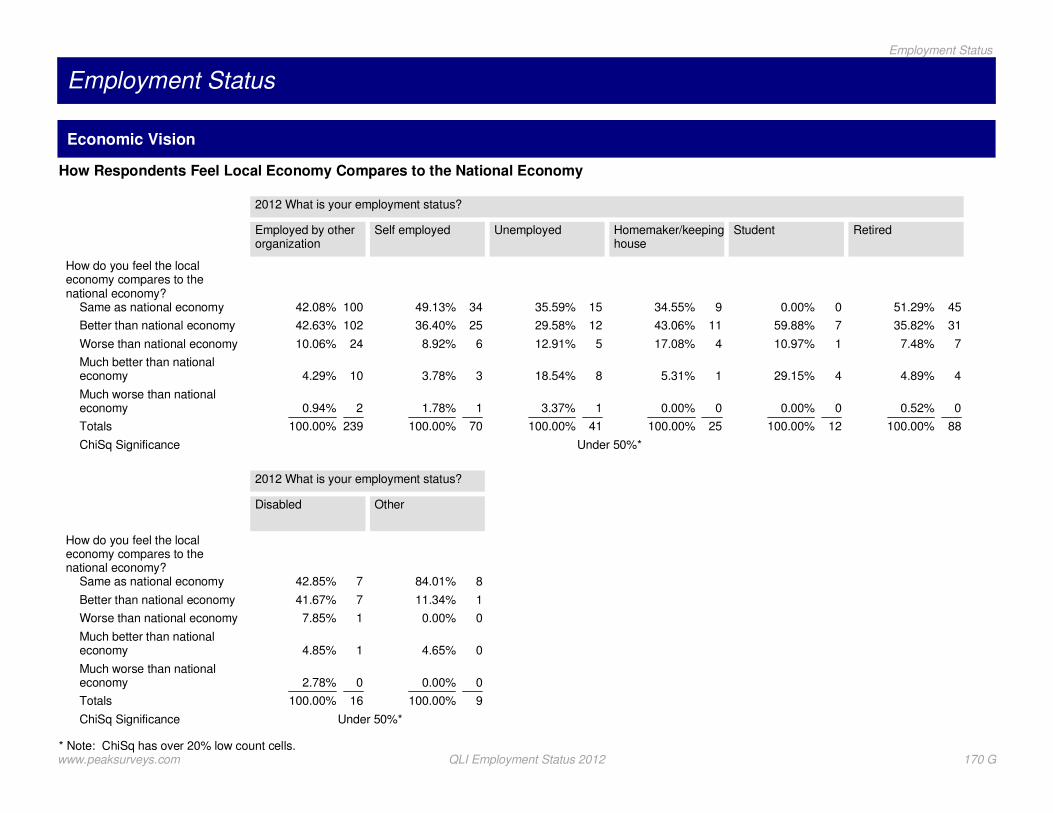
Employment Status
Economic Vision
* Note: ChiSq has over 20% low count cells.
How Respondents Feel Local Economy Compares to the National Economy
How do you feel the localeconomy compares to thenational economy?
Same as national economy
Better than national economy
Worse than national economy
Much better than nationaleconomy
Much worse than nationaleconomy
Totals
ChiSq Significance
Employed by otherorganization
2012 What is your employment status?
10042.08%
10242.63%
2410.06%
104.29%
20.94%
239100.00%
Under 50%*
Self employed
3449.13%
2536.40%
68.92%
33.78%
11.78%
70100.00%
Unemployed
1535.59%
1229.58%
512.91%
818.54%
13.37%
41100.00%
Homemaker/keepinghouse
934.55%
1143.06%
417.08%
15.31%
00.00%
25100.00%
Student
00.00%
759.88%
110.97%
429.15%
00.00%
12100.00%
Retired
4551.29%
3135.82%
77.48%
44.89%
00.52%
88100.00%
How do you feel the localeconomy compares to thenational economy?
Same as national economy
Better than national economy
Worse than national economy
Much better than nationaleconomy
Much worse than nationaleconomy
Totals
ChiSq Significance
Disabled
2012 What is your employment status?
742.85%
741.67%
17.85%
14.85%
02.78%
16100.00%
Under 50%*
Other
884.01%
111.34%
00.00%
04.65%
00.00%
9100.00%
www.peaksurveys.com QLI Employment Status 2012 170 G
Employment Status
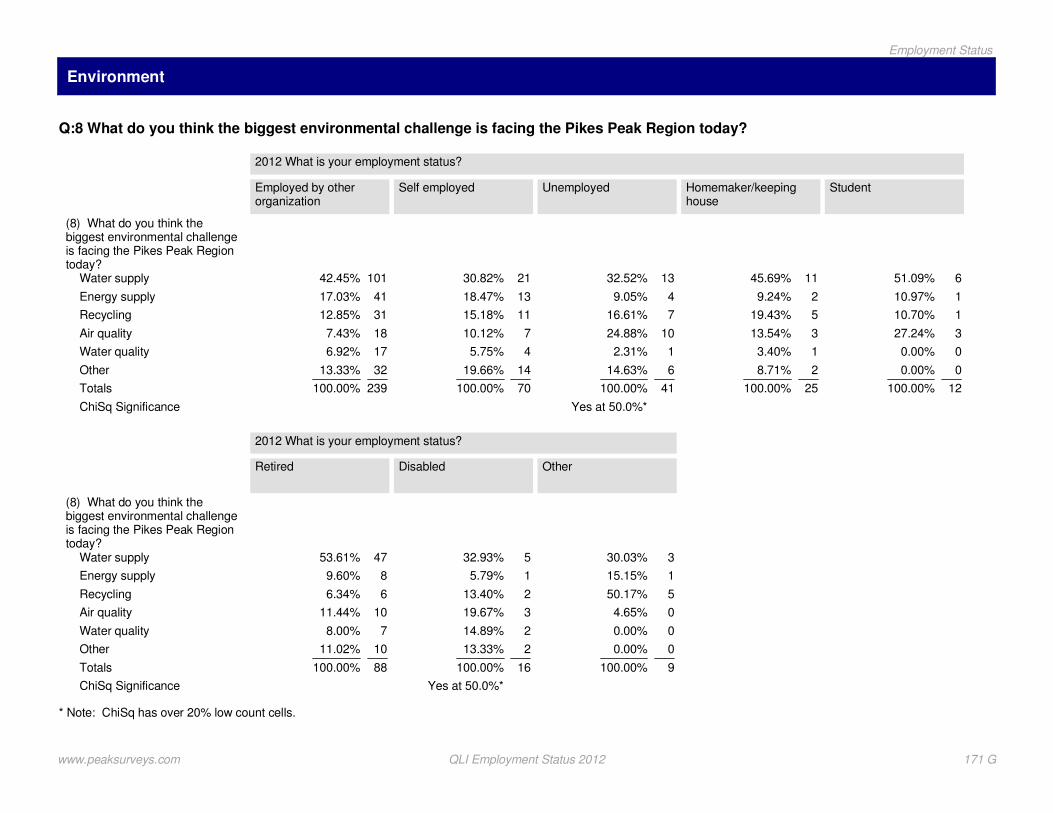
Environment
* Note: ChiSq has over 20% low count cells.
Q:8 What do you think the biggest environmental challenge is facing the Pikes Peak Region today?
(8) What do you think thebiggest environmental challengeis facing the Pikes Peak Regiontoday?
Water supply
Energy supply
Recycling
Air quality
Water quality
Other
Totals
ChiSq Significance
Employed by otherorganization
2012 What is your employment status?
10142.45%
4117.03%
3112.85%
187.43%
176.92%
3213.33%
239100.00%
Yes at 50.0%*
Self employed
2130.82%
1318.47%
1115.18%
710.12%
45.75%
1419.66%
70100.00%
Unemployed
1332.52%
49.05%
716.61%
1024.88%
12.31%
614.63%
41100.00%
Homemaker/keepinghouse
1145.69%
29.24%
519.43%
313.54%
13.40%
28.71%
25100.00%
Student
651.09%
110.97%
110.70%
327.24%
00.00%
00.00%
12100.00%
(8) What do you think thebiggest environmental challengeis facing the Pikes Peak Regiontoday?
Water supply
Energy supply
Recycling
Air quality
Water quality
Other
Totals
ChiSq Significance
Retired
2012 What is your employment status?
4753.61%
89.60%
66.34%
1011.44%
78.00%
1011.02%
88100.00%
Yes at 50.0%*
Disabled
532.93%
15.79%
213.40%
319.67%
214.89%
213.33%
16100.00%
Other
330.03%
115.15%
550.17%
04.65%
00.00%
00.00%
9100.00%
www.peaksurveys.com QLI Employment Status 2012 171 G
Employment Status

Arts and Culture
* Note: ChiSq has over 20% low count cells.
Essentiality of Parks, Recreation, Trails and Open Spaces to Respondents
Parks, recreation, trails and openspaces are essential to mycommunity.
Strongly Agree
Agree
Disagree
Strongly Disagree
Totals
ChiSq Significance
Employed by otherorganization
2012 What is your employment status?
14560.55%
8635.89%
83.55%
00.00%
239100.00%
Yes at 99.0%*
Self employed
4971.10%
1623.52%
00.00%
45.38%
70100.00%
Unemployed
1946.14%
2151.79%
00.00%
12.07%
41100.00%
Homemaker/keepinghouse
1248.87%
1142.19%
15.55%
13.40%
25100.00%
Student
648.91%
321.94%
429.15%
00.00%
12100.00%
Retired
4348.75%
4045.88%
44.33%
11.04%
88100.00%
Parks, recreation, trails and openspaces are essential to mycommunity.
Strongly Agree
Agree
Disagree
Strongly Disagree
Totals
ChiSq Significance
Disabled
2012 What is your employment status?
847.53%
849.46%
03.00%
00.00%
16100.00%
Yes at 99.0%*
Other
771.54%
219.79%
18.66%
00.00%
9100.00%
www.peaksurveys.com QLI Employment Status 2012 172 G
Employment Status

* Note: ChiSq has over 20% low count cells.
Respondents Satisfaction with Level of Maintenance and Service
I am satisfied with the level ofmaintenance and service inparks, recreation, trails and openspaces.
Strongly Agree
Agree
Disagree
Strongly Disagree
Totals
ChiSq Significance
Employed by otherorganization
2012 What is your employment status?
3615.15%
13255.40%
5322.35%
177.11%
239100.00%
Under 50%*
Self employed
2028.61%
3246.01%
1217.02%
68.36%
70100.00%
Unemployed
512.37%
2663.68%
614.17%
49.79%
41100.00%
Homemaker/keepinghouse
416.22%
1561.53%
520.29%
01.96%
25100.00%
Student
538.21%
761.79%
00.00%
00.00%
12100.00%
Retired
1314.79%
4855.13%
2022.40%
77.68%
88100.00%
I am satisfied with the level ofmaintenance and service inparks, recreation, trails and openspaces.
Strongly Agree
Agree
Disagree
Strongly Disagree
Totals
ChiSq Significance
Disabled
2012 What is your employment status?
17.85%
1063.53%
425.81%
02.81%
16100.00%
Under 50%*
Other
335.15%
551.17%
113.68%
00.00%
9100.00%
www.peaksurveys.com QLI Employment Status 2012 173 G
Employment Status

* Note: ChiSq has over 20% low count cells.
Respondents Agreement Level of Arts and Culture Improve Quality of Life
Arts and Culture improve myquality of life.
Strongly Agree
Agree
Disagree
Strongly Disagree
Totals
ChiSq Significance
Employed by otherorganization
2012 What is your employment status?
6929.12%
12150.75%
4518.93%
31.20%
239100.00%
Yes at 75.0%*
Self employed
2839.68%
3550.37%
69.29%
00.66%
70100.00%
Unemployed
49.93%
3278.36%
49.79%
11.93%
41100.00%
Homemaker/keepinghouse
520.33%
1769.68%
26.60%
13.40%
25100.00%
Student
321.94%
321.67%
756.39%
00.00%
12100.00%
Retired
2123.48%
4955.57%
1719.00%
21.94%
88100.00%
Arts and Culture improve myquality of life.
Strongly Agree
Agree
Disagree
Strongly Disagree
Totals
ChiSq Significance
Disabled
2012 What is your employment status?
532.57%
846.25%
318.18%
03.00%
16100.00%
Yes at 75.0%*
Other
328.82%
447.36%
223.81%
00.00%
9100.00%
www.peaksurveys.com QLI Employment Status 2012 174 G
Employment Status
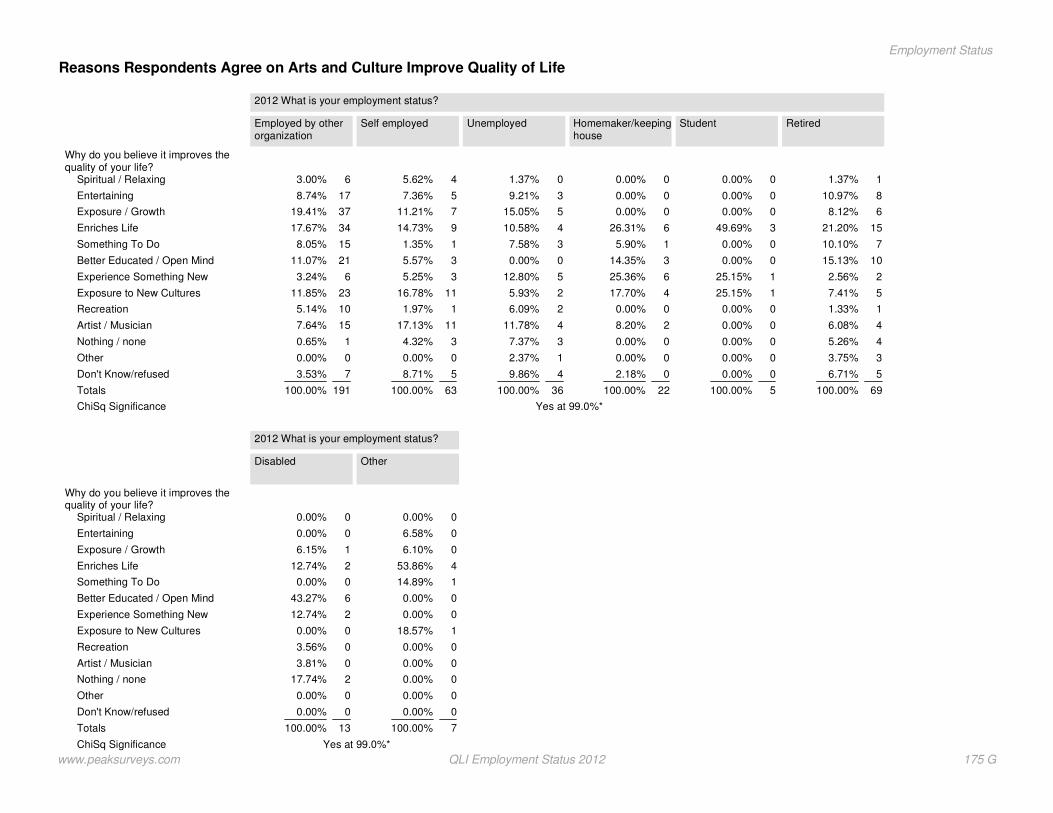
Reasons Respondents Agree on Arts and Culture Improve Quality of Life
Why do you believe it improves thequality of your life?
Spiritual / Relaxing
Entertaining
Exposure / Growth
Enriches Life
Something To Do
Better Educated / Open Mind
Experience Something New
Exposure to New Cultures
Recreation
Artist / Musician
Nothing / none
Other
Don't Know/refused
Totals
ChiSq Significance
Employed by otherorganization
2012 What is your employment status?
63.00%
178.74%
3719.41%
3417.67%
158.05%
2111.07%
63.24%
2311.85%
105.14%
157.64%
10.65%
00.00%
73.53%
191100.00%
Yes at 99.0%*
Self employed
45.62%
57.36%
711.21%
914.73%
11.35%
35.57%
35.25%
1116.78%
11.97%
1117.13%
34.32%
00.00%
58.71%
63100.00%
Unemployed
01.37%
39.21%
515.05%
410.58%
37.58%
00.00%
512.80%
25.93%
26.09%
411.78%
37.37%
12.37%
49.86%
36100.00%
Homemaker/keepinghouse
00.00%
00.00%
00.00%
626.31%
15.90%
314.35%
625.36%
417.70%
00.00%
28.20%
00.00%
00.00%
02.18%
22100.00%
Student
00.00%
00.00%
00.00%
349.69%
00.00%
00.00%
125.15%
125.15%
00.00%
00.00%
00.00%
00.00%
00.00%
5100.00%
Retired
11.37%
810.97%
68.12%
1521.20%
710.10%
1015.13%
22.56%
57.41%
11.33%
46.08%
45.26%
33.75%
56.71%
69100.00%
Why do you believe it improves thequality of your life?
Spiritual / Relaxing
Entertaining
Exposure / Growth
Enriches Life
Something To Do
Better Educated / Open Mind
Experience Something New
Exposure to New Cultures
Recreation
Artist / Musician
Nothing / none
Other
Don't Know/refused
Totals
ChiSq Significance
Disabled
2012 What is your employment status?
00.00%
00.00%
16.15%
212.74%
00.00%
643.27%
212.74%
00.00%
03.56%
03.81%
217.74%
00.00%
00.00%
13100.00%
Yes at 99.0%*
Other
00.00%
06.58%
06.10%
453.86%
114.89%
00.00%
00.00%
118.57%
00.00%
00.00%
00.00%
00.00%
00.00%
7100.00%
www.peaksurveys.com QLI Employment Status 2012 175 G
Employment Status

* Note: ChiSq has over 20% low count cells.
* Note: ChiSq has over 20% low count cells.
Why Respondent Believes it Does Not Improve the Quality of Their Life
Why do you believe it does notimprove the quality of your life?
No Interest
More Important Things To Do
No effect on my life
Do not participate
Other
Don't Know/refused
Other
Totals
ChiSq Significance
Employed by otherorganization
2012 What is your employment status?
1331.49%
1023.41%
1022.71%
36.01%
37.69%
36.72%
11.98%
43100.00%
Yes at 50.0%*
Self employed
336.73%
118.51%
118.04%
00.00%
226.72%
00.00%
00.00%
7100.00%
Unemployed
245.27%
127.83%
126.90%
00.00%
00.00%
00.00%
00.00%
5100.00%
Homemaker/keepinghouse
144.99%
155.01%
00.00%
00.00%
00.00%
00.00%
00.00%
2100.00%
Student
00.00%
7100.00%
00.00%
00.00%
00.00%
00.00%
00.00%
7100.00%
Retired
1373.96%
02.43%
213.39%
17.62%
00.00%
02.60%
00.00%
17100.00%
Why do you believe it does notimprove the quality of your life?
No Interest
More Important Things To Do
No effect on my life
Do not participate
Other
Don't Know/refused
Other
Totals
ChiSq Significance
Disabled
2012 What is your employment status?
122.90%
254.21%
122.90%
00.00%
00.00%
00.00%
00.00%
3100.00%
Yes at 50.0%*
Other
136.39%
00.00%
00.00%
163.61%
00.00%
00.00%
00.00%
2100.00%
www.peaksurveys.com QLI Employment Status 2012 176 G
Employment Status

Public Safety
* Note: ChiSq has over 20% low count cells.
Safety Walking in Neighborhood at Night
(19) How safe do you feelwalking in your neighborhoodduring the night?
Very safe
Somewhat safe
Somewhat unsafe
Very unsafe
Totals
ChiSq Significance
Employed by otherorganization
2012 What is your employment status?
13456.09%
6928.90%
218.82%
156.18%
239100.00%
Yes at 75.0%*
Self employed
4463.57%
1724.52%
68.70%
23.20%
70100.00%
Unemployed
2662.40%
1025.63%
48.59%
13.37%
41100.00%
Homemaker/keepinghouse
1040.28%
830.96%
415.94%
312.82%
25100.00%
Student
760.15%
539.85%
00.00%
00.00%
12100.00%
Retired
3640.70%
3135.61%
1213.71%
99.98%
88100.00%
(19) How safe do you feelwalking in your neighborhoodduring the night?
Very safe
Somewhat safe
Somewhat unsafe
Very unsafe
Totals
ChiSq Significance
Disabled
2012 What is your employment status?
210.04%
744.67%
423.03%
422.26%
16100.00%
Yes at 75.0%*
Other
775.35%
113.31%
00.00%
111.34%
9100.00%
www.peaksurveys.com QLI Employment Status 2012 177 G
Employment Status

* Note: ChiSq has over 20% low count cells.
Respondent Agreement with the Needs of the Homeless being Adequately Addressed in the Pikes Peak Region
(20) Please tell us your level of agreementwith the following statement: The needs ofthe homeless are being adequatelyaddressed in the Pikes Peak region.
Strongly agree
Agree
Disagree
Strongly disagree
Don't know
Totals
ChiSq Significance
Employed by otherorganization
2012 What is your employment status?
187.43%
8234.54%
7832.61%
3715.52%
249.90%
239100.00%
Yes at 50.0%*
Self employed
57.86%
3347.41%
1521.42%
1116.06%
57.24%
70100.00%
Unemployed
23.86%
1742.19%
1536.79%
49.79%
37.37%
41100.00%
Homemaker/keepinghouse
29.46%
728.19%
27.13%
310.91%
1144.30%
25100.00%
Student
00.00%
867.09%
00.00%
110.97%
321.94%
12100.00%
(20) Please tell us your level of agreementwith the following statement: The needs ofthe homeless are being adequatelyaddressed in the Pikes Peak region.
Strongly agree
Agree
Disagree
Strongly disagree
Don't know
Totals
ChiSq Significance
Retired
2012 What is your employment status?
89.05%
3135.81%
2528.36%
1113.07%
1213.71%
88100.00%
Yes at 50.0%*
Disabled
17.59%
527.73%
321.04%
638.79%
14.85%
16100.00%
Other
05.01%
331.13%
549.70%
00.00%
114.15%
9100.00%
www.peaksurveys.com QLI Employment Status 2012 178 G
Employment Status

Community Engagement
* Note: ChiSq has over 20% low count cells.
How Accepting Respondents' feel the Community is of the Differences in Race, Ethnicity, Religious Preference, and GenderOrientation
How accepting of the differences inrace, Ethnicity, religious preference,and gender orientation do youconsider the community to be?
Very accepting
Somewhat accepting
Not very accepting
Not accepting at all
Don't know/NA
Totals
ChiSq Significance
Employed by otherorganization
2012 What is your employment status?
7129.67%
13355.62%
2510.33%
93.67%
20.71%
239100.00%
Under 50%*
Self employed
3651.66%
2332.56%
812.10%
33.68%
00.00%
70100.00%
Unemployed
1947.15%
1536.18%
613.49%
13.18%
00.00%
41100.00%
Homemaker/keepinghouse
1246.18%
1246.69%
01.82%
00.00%
15.31%
25100.00%
Student
978.06%
321.94%
00.00%
00.00%
00.00%
12100.00%
Retired
3641.07%
4045.17%
910.02%
11.52%
22.21%
88100.00%
How accepting of the differences inrace, Ethnicity, religious preference,and gender orientation do youconsider the community to be?
Very accepting
Somewhat accepting
Not very accepting
Not accepting at all
Don't know/NA
Totals
ChiSq Significance
Disabled
2012 What is your employment status?
422.82%
744.60%
532.59%
00.00%
00.00%
16100.00%
Under 50%*
Other
333.95%
552.38%
18.66%
00.00%
05.01%
9100.00%
www.peaksurveys.com QLI Employment Status 2012 179 G
Employment Status

* Note: ChiSq has over 20% low count cells.
Importance of Acceptance of Differences in Race, Ethnicity, Religious Preference, and Gender Orientation
How important do you believe it is to have acommunity that is accepting of thedifferences in race, Ethnicity, religiouspreference, and gender orientation?
It is very important
Somewhat important
Not very important
Not important at all
Don't know/NA
Totals
ChiSq Significance
Employed by otherorganization
2012 What is your employment status?
18979.20%
4318.08%
62.51%
00.00%
00.21%
239100.00%
Yes at 50.0%*
Self employed
5579.34%
811.79%
22.93%
45.94%
00.00%
70100.00%
Unemployed
3379.77%
716.37%
11.93%
11.93%
00.00%
41100.00%
Homemaker/keepinghouse
2290.30%
29.70%
00.00%
00.00%
00.00%
25100.00%
Student
543.61%
327.24%
429.15%
00.00%
00.00%
12100.00%
How important do you believe it is to have acommunity that is accepting of thedifferences in race, Ethnicity, religiouspreference, and gender orientation?
It is very important
Somewhat important
Not very important
Not important at all
Don't know/NA
Totals
ChiSq Significance
Retired
2012 What is your employment status?
6170.11%
1820.26%
55.83%
10.97%
22.84%
88100.00%
Yes at 50.0%*
Disabled
1487.50%
17.66%
14.85%
00.00%
00.00%
16100.00%
Other
780.00%
00.00%
00.00%
111.34%
18.66%
9100.00%
www.peaksurveys.com QLI Employment Status 2012 180 G
Employment Status

* Note: ChiSq has over 20% low count cells.
Charitable or Voluntary Service in the Last 12 Months
During the last 12 months howoften did you or other members ofyour household spend on charitableor voluntary service activities?
More than once a week
Several times a month
Once a month
Once or twice a quarter
Rarely
Never
Don't know/NA
Totals
ChiSq Significance
Employed by otherorganization
2012 What is your employment status?
2711.39%
5221.93%
3715.65%
5523.11%
4619.46%
208.46%
00.00%
239100.00%
Yes at 99.0%*
Self employed
1420.34%
56.95%
2332.74%
1014.74%
1217.08%
46.37%
11.78%
70100.00%
Unemployed
36.63%
819.54%
922.40%
613.71%
613.57%
1024.15%
00.00%
41100.00%
Homemaker/keepinghouse
29.70%
1246.41%
15.31%
27.38%
521.25%
29.96%
00.00%
25100.00%
Student
110.97%
321.67%
429.15%
00.00%
110.97%
327.24%
00.00%
12100.00%
Retired
1618.78%
1617.81%
1113.02%
99.88%
78.43%
2629.88%
22.20%
88100.00%
During the last 12 months howoften did you or other members ofyour household spend on charitableor voluntary service activities?
More than once a week
Several times a month
Once a month
Once or twice a quarter
Rarely
Never
Don't know/NA
Totals
ChiSq Significance
Disabled
2012 What is your employment status?
316.47%
214.55%
00.00%
321.26%
319.19%
425.52%
03.00%
16100.00%
Yes at 99.0%*
Other
05.01%
335.15%
00.00%
00.00%
551.17%
18.66%
00.00%
9100.00%
www.peaksurveys.com QLI Employment Status 2012 181 G
Employment Status

* Note: ChiSq has over 20% low count cells.
Frequency of Donating Money or Property in the Last 12 Months
How often have you or other members of yourhousehold donated money or property to charity in thelast 12 months? By donating I mean making a voluntarycontribution with no intention of making a profi
Weekly
Monthly
Quarterly
Occasionally
Never
Don't know/NA
Totals
ChiSq Significance
Employed by otherorganization
2012 What is your employment status?
2912.03%
9439.57%
5021.06%
5422.51%
124.83%
00.00%
239100.00%
Yes at 50.0%*
Self employed
1115.43%
2941.67%
1420.09%
1522.14%
00.66%
00.00%
70100.00%
Unemployed
1024.99%
1025.24%
1025.55%
923.10%
01.12%
00.00%
41100.00%
Homemaker/keepinghouse
518.81%
832.57%
28.71%
623.83%
416.08%
00.00%
25100.00%
How often have you or other members of yourhousehold donated money or property to charity in thelast 12 months? By donating I mean making a voluntarycontribution with no intention of making a profi
Weekly
Monthly
Quarterly
Occasionally
Never
Don't know/NA
Totals
ChiSq Significance
Student
2012 What is your employment status?
00.00%
432.64%
110.97%
327.24%
429.15%
00.00%
12100.00%
Yes at 50.0%*
Retired
1416.27%
3539.62%
1617.80%
1618.21%
56.19%
21.91%
88100.00%
Disabled
316.39%
637.66%
425.48%
215.29%
15.19%
00.00%
16100.00%
Other
19.66%
226.49%
00.00%
550.17%
18.66%
05.01%
9100.00%
www.peaksurveys.com QLI Employment Status 2012 182 G
Employment Status
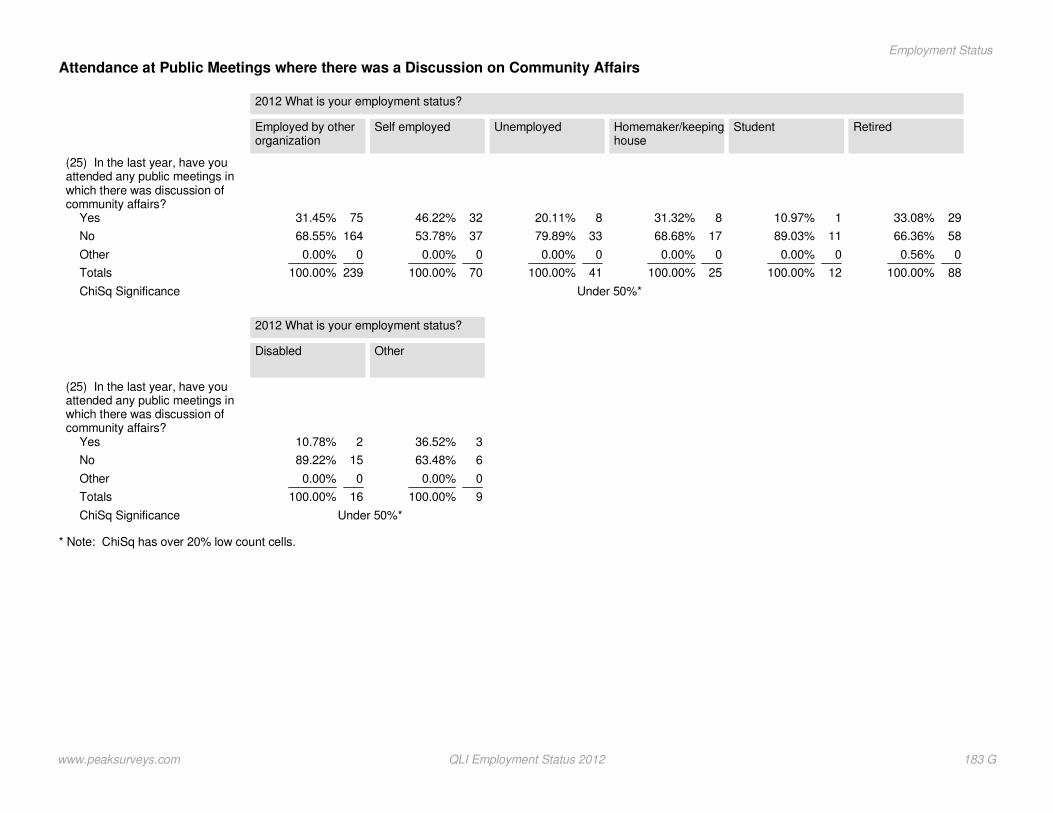
* Note: ChiSq has over 20% low count cells.
Attendance at Public Meetings where there was a Discussion on Community Affairs
(25) In the last year, have youattended any public meetings inwhich there was discussion ofcommunity affairs?
Yes
No
Other
Totals
ChiSq Significance
Employed by otherorganization
2012 What is your employment status?
7531.45%
16468.55%
00.00%
239100.00%
Under 50%*
Self employed
3246.22%
3753.78%
00.00%
70100.00%
Unemployed
820.11%
3379.89%
00.00%
41100.00%
Homemaker/keepinghouse
831.32%
1768.68%
00.00%
25100.00%
Student
110.97%
1189.03%
00.00%
12100.00%
Retired
2933.08%
5866.36%
00.56%
88100.00%
(25) In the last year, have youattended any public meetings inwhich there was discussion ofcommunity affairs?
Yes
No
Other
Totals
ChiSq Significance
Disabled
2012 What is your employment status?
210.78%
1589.22%
00.00%
16100.00%
Under 50%*
Other
336.52%
663.48%
00.00%
9100.00%
www.peaksurveys.com QLI Employment Status 2012 183 G
Employment Status
Section H
educationcommunity survey
Peak Surveys
www.peaksurveys.com
Community and QLI Survey 2012
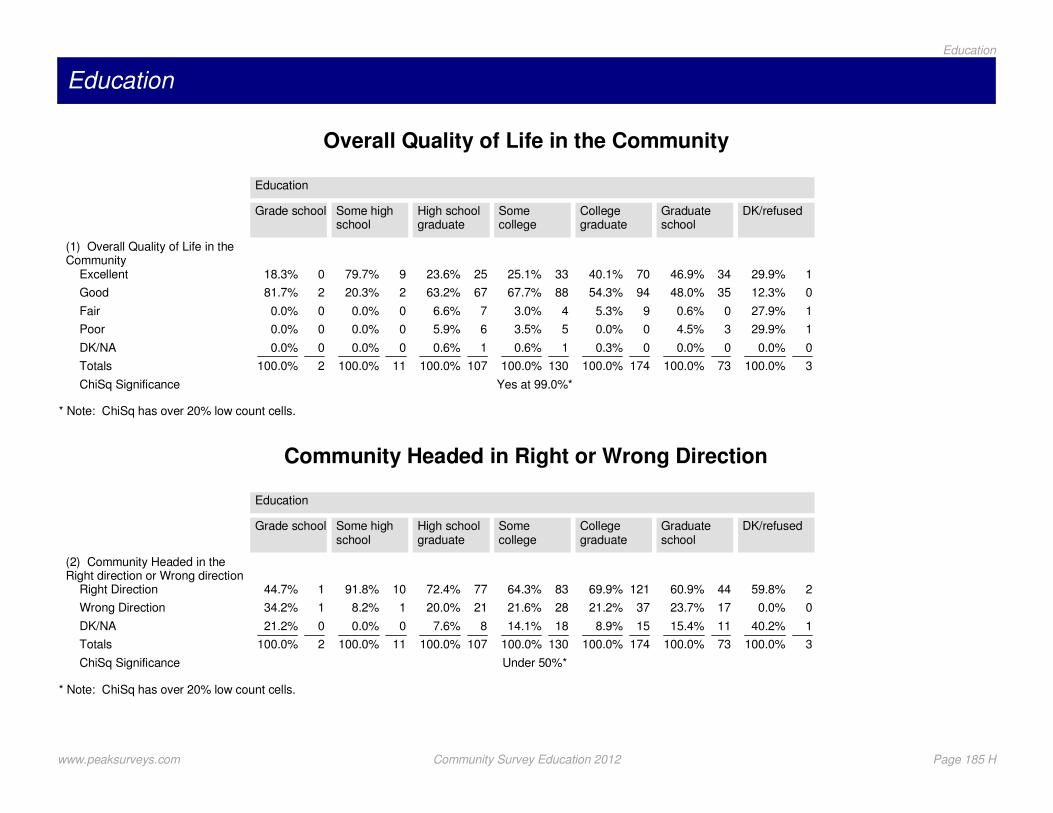
Education
Overall Quality of Life in the Community
* Note: ChiSq has over 20% low count cells.
(1) Overall Quality of Life in theCommunity
Excellent
Good
Fair
Poor
DK/NA
Totals
ChiSq Significance
Grade school
Education
018.3%
281.7%
00.0%
00.0%
00.0%
2100.0%
Yes at 99.0%*
Some highschool
979.7%
220.3%
00.0%
00.0%
00.0%
11100.0%
High schoolgraduate
2523.6%
6763.2%
76.6%
65.9%
10.6%
107100.0%
Somecollege
3325.1%
8867.7%
43.0%
53.5%
10.6%
130100.0%
Collegegraduate
7040.1%
9454.3%
95.3%
00.0%
00.3%
174100.0%
Graduateschool
3446.9%
3548.0%
00.6%
34.5%
00.0%
73100.0%
DK/refused
129.9%
012.3%
127.9%
129.9%
00.0%
3100.0%
Community Headed in Right or Wrong Direction
* Note: ChiSq has over 20% low count cells.
(2) Community Headed in theRight direction or Wrong direction
Right Direction
Wrong Direction
DK/NA
Totals
ChiSq Significance
Grade school
Education
144.7%
134.2%
021.2%
2100.0%
Under 50%*
Some highschool
1091.8%
18.2%
00.0%
11100.0%
High schoolgraduate
7772.4%
2120.0%
87.6%
107100.0%
Somecollege
8364.3%
2821.6%
1814.1%
130100.0%
Collegegraduate
12169.9%
3721.2%
158.9%
174100.0%
Graduateschool
4460.9%
1723.7%
1115.4%
73100.0%
DK/refused
259.8%
00.0%
140.2%
3100.0%
www.peaksurveys.com Community Survey Education 2012 Page 185 H
Education

Most Important Issue Facing the Community
* Note: ChiSq has over 20% low count cells.
2012 Most Important IssueFacing the Community
Jobs / Unemployment
Economy
Don't know/NA/Refused
Crime
Education / schools
Budget / spending / finances
Presidential election
Growth and development
Child safety / safety
Environment
Homeless
Taxes
Traffic / transportation
Funding for emergencyservices (law enforcement/fire)
Water issues
Road repair / maintenance
Government
Healthcare
None / nothing
Military
Infrastructure
Housing
Other
Totals
ChiSq Significance
Grade school
Education
00.0%
00.0%
126.4%
00.0%
00.0%
021.2%
00.0%
00.0%
134.2%
00.0%
00.0%
00.0%
00.0%
00.0%
00.0%
00.0%
00.0%
00.0%
018.3%
00.0%
00.0%
00.0%
00.0%
2100.0%
Yes at 99.0%*
Some highschool
331.3%
04.2%
04.6%
00.0%
220.8%
00.0%
04.2%
04.2%
330.7%
00.0%
00.0%
00.0%
00.0%
00.0%
00.0%
00.0%
00.0%
00.0%
00.0%
00.0%
00.0%
00.0%
00.0%
11100.0%
High schoolgraduate
1211.5%
1312.0%
2624.4%
1614.5%
1412.9%
55.1%
00.4%
00.5%
43.3%
10.6%
32.5%
10.7%
54.5%
00.5%
00.0%
00.0%
22.2%
11.0%
22.0%
00.0%
00.0%
00.0%
21.5%
107100.0%
Somecollege
2418.3%
86.4%
139.7%
1511.4%
118.3%
32.0%
118.7%
21.7%
21.7%
75.2%
54.2%
43.4%
42.7%
32.7%
43.2%
53.5%
11.0%
10.6%
00.0%
21.6%
00.0%
00.4%
43.3%
130100.0%
Collegegraduate
3218.2%
2715.4%
95.2%
116.5%
127.2%
95.3%
52.8%
127.0%
53.1%
52.7%
42.5%
53.0%
42.1%
63.2%
52.7%
53.2%
21.3%
52.6%
31.9%
10.8%
21.2%
21.1%
21.0%
174100.0%
Graduateschool
1824.9%
1520.8%
44.9%
22.4%
34.2%
56.8%
00.0%
22.3%
00.0%
23.2%
22.4%
34.7%
22.4%
45.4%
33.8%
11.3%
34.0%
00.6%
00.0%
11.2%
11.8%
00.6%
22.4%
73100.0%
DK/refused
00.0%
127.9%
00.0%
129.9%
00.0%
00.0%
00.0%
00.0%
00.0%
00.0%
00.0%
00.0%
00.0%
00.0%
00.0%
00.0%
00.0%
142.2%
00.0%
00.0%
00.0%
00.0%
00.0%
3100.0%
www.peaksurveys.com Community Survey Education 2012 Page 186 H
Education
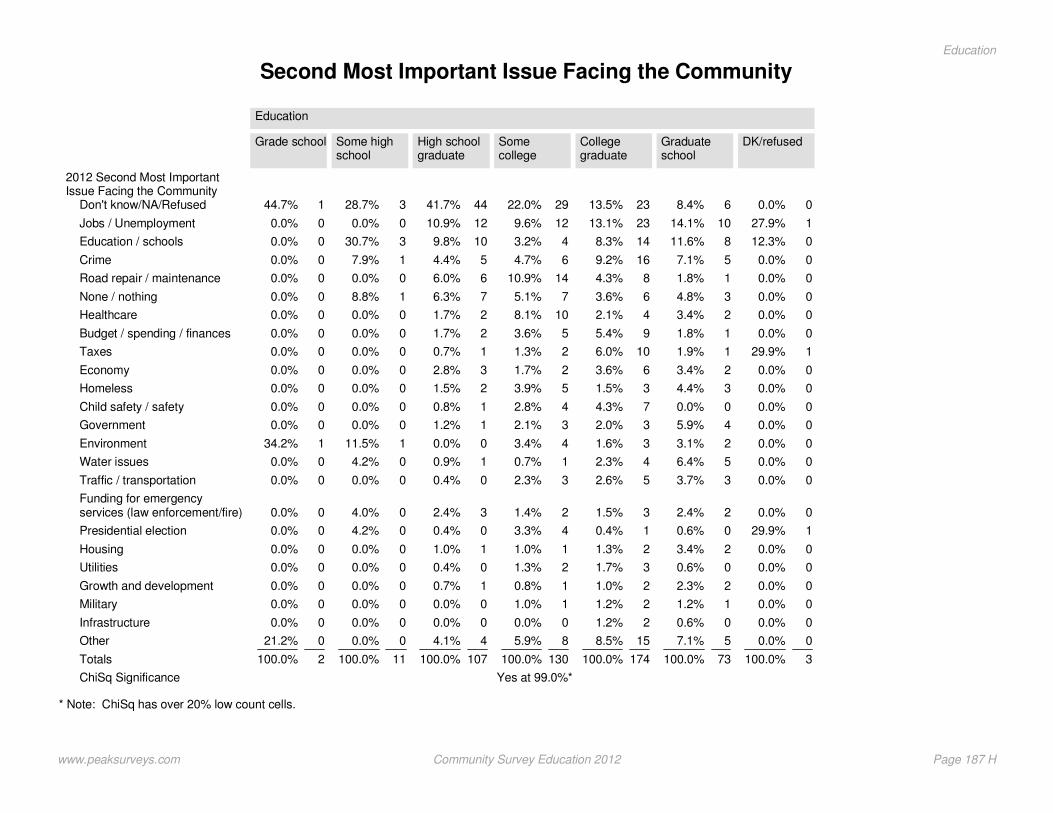
Second Most Important Issue Facing the Community
* Note: ChiSq has over 20% low count cells.
2012 Second Most ImportantIssue Facing the Community
Don't know/NA/Refused
Jobs / Unemployment
Education / schools
Crime
Road repair / maintenance
None / nothing
Healthcare
Budget / spending / finances
Taxes
Economy
Homeless
Child safety / safety
Government
Environment
Water issues
Traffic / transportation
Funding for emergencyservices (law enforcement/fire)
Presidential election
Housing
Utilities
Growth and development
Military
Infrastructure
Other
Totals
ChiSq Significance
Grade school
Education
144.7%
00.0%
00.0%
00.0%
00.0%
00.0%
00.0%
00.0%
00.0%
00.0%
00.0%
00.0%
00.0%
134.2%
00.0%
00.0%
00.0%
00.0%
00.0%
00.0%
00.0%
00.0%
00.0%
021.2%
2100.0%
Yes at 99.0%*
Some highschool
328.7%
00.0%
330.7%
17.9%
00.0%
18.8%
00.0%
00.0%
00.0%
00.0%
00.0%
00.0%
00.0%
111.5%
04.2%
00.0%
04.0%
04.2%
00.0%
00.0%
00.0%
00.0%
00.0%
00.0%
11100.0%
High schoolgraduate
4441.7%
1210.9%
109.8%
54.4%
66.0%
76.3%
21.7%
21.7%
10.7%
32.8%
21.5%
10.8%
11.2%
00.0%
10.9%
00.4%
32.4%
00.4%
11.0%
00.4%
10.7%
00.0%
00.0%
44.1%
107100.0%
Somecollege
2922.0%
129.6%
43.2%
64.7%
1410.9%
75.1%
108.1%
53.6%
21.3%
21.7%
53.9%
42.8%
32.1%
43.4%
10.7%
32.3%
21.4%
43.3%
11.0%
21.3%
10.8%
11.0%
00.0%
85.9%
130100.0%
Collegegraduate
2313.5%
2313.1%
148.3%
169.2%
84.3%
63.6%
42.1%
95.4%
106.0%
63.6%
31.5%
74.3%
32.0%
31.6%
42.3%
52.6%
31.5%
10.4%
21.3%
31.7%
21.0%
21.2%
21.2%
158.5%
174100.0%
Graduateschool
68.4%
1014.1%
811.6%
57.1%
11.8%
34.8%
23.4%
11.8%
11.9%
23.4%
34.4%
00.0%
45.9%
23.1%
56.4%
33.7%
22.4%
00.6%
23.4%
00.6%
22.3%
11.2%
00.6%
57.1%
73100.0%
DK/refused
00.0%
127.9%
012.3%
00.0%
00.0%
00.0%
00.0%
00.0%
129.9%
00.0%
00.0%
00.0%
00.0%
00.0%
00.0%
00.0%
00.0%
129.9%
00.0%
00.0%
00.0%
00.0%
00.0%
00.0%
3100.0%
www.peaksurveys.com Community Survey Education 2012 Page 187 H
Education

Primary Source of Information When Getting Involved or Volunteering
* Note: ChiSq has over 20% low count cells.
(5) Primary Source ofInformattion when gettingInvolved or Volunteering
Church
Friends or Family
Internet
Local TV News
Newspaper
Local Non- profit organizations
Other
DK/NA
Totals
ChiSq Significance
Grade school
Education
281.7%
00.0%
00.0%
00.0%
00.0%
00.0%
00.0%
018.3%
2100.0%
Yes at 50.0%*
Some highschool
436.6%
17.9%
330.7%
112.4%
17.9%
00.0%
00.0%
04.6%
11100.0%
High schoolgraduate
3230.4%
2220.2%
1816.9%
1211.3%
54.6%
43.3%
1312.5%
10.9%
107100.0%
Somecollege
2217.1%
3224.5%
2720.5%
129.4%
1410.8%
129.1%
118.1%
10.6%
130100.0%
Collegegraduate
4325.0%
3118.0%
2514.2%
2514.5%
1911.1%
1910.8%
105.5%
10.8%
174100.0%
Graduateschool
1824.1%
1723.8%
1014.1%
1115.0%
710.3%
67.7%
34.2%
10.8%
73100.0%
DK/refused
129.9%
00.0%
00.0%
257.8%
00.0%
00.0%
012.3%
00.0%
3100.0%
Who Respondents Trust When Addressing Community Issues
* Note: ChiSq has over 20% low count cells.
(6) Who Respondents Trust toAddress Community Issues
Religious organizations
Nonprofit organizations
Local businesses
Someone else
Local government
DK/NA
Totals
ChiSq Significance
Grade school
Education
155.3%
126.4%
00.0%
018.3%
00.0%
00.0%
2100.0%
Under 50%*
Some highschool
217.1%
323.4%
435.2%
112.1%
112.1%
00.0%
11100.0%
High schoolgraduate
3230.1%
2321.8%
1817.0%
1716.1%
1211.4%
43.8%
107100.0%
Somecollege
2620.0%
3325.7%
1411.1%
3123.8%
1612.1%
107.3%
130100.0%
Collegegraduate
5129.5%
3922.6%
2816.2%
2112.2%
2112.3%
127.1%
174100.0%
Graduateschool
811.2%
1825.4%
1926.8%
1014.0%
913.0%
79.5%
73100.0%
DK/refused
259.8%
00.0%
012.3%
00.0%
00.0%
127.9%
3100.0%
www.peaksurveys.com Community Survey Education 2012 Page 188 H
Education

Favorability of County Commissioners
* Note: ChiSq has over 20% low count cells.
(7) Favorability of CountyCommissioners
Very favorable
Somewhat favorable
Somewhat unfavorable
Very unfavorable
Never heard of them
DK/NA
Totals
ChiSq Significance
Grade school
Education
134.2%
00.0%
00.0%
00.0%
265.8%
00.0%
2100.0%
Yes at 50.0%*
Some highschool
04.2%
220.4%
324.7%
00.0%
111.5%
439.1%
11100.0%
High schoolgraduate
65.9%
3835.5%
119.9%
54.7%
3129.1%
1614.8%
107100.0%
Somecollege
118.6%
4837.2%
2015.0%
107.7%
2015.2%
2116.3%
130100.0%
Collegegraduate
169.0%
8046.2%
137.3%
1810.2%
2011.7%
2715.6%
174100.0%
Graduateschool
45.6%
3446.8%
810.6%
1013.1%
56.6%
1317.3%
73100.0%
DK/refused
00.0%
129.9%
00.0%
00.0%
00.0%
270.1%
3100.0%
Favorability of Colorado Springs Mayor
* Note: ChiSq has over 20% low count cells.
Favorability of Colorado SpringsMayor
Very favorable
Somewhat favorable
Somewhat unfavorable
Very unfavorable
Never heard of them
DK/NA
Totals
ChiSq Significance
Grade school
Education
00.0%
00.0%
00.0%
161.8%
00.0%
038.2%
1100.0%
Yes at 50.0%*
Some highschool
378.2%
010.5%
011.3%
00.0%
00.0%
00.0%
4100.0%
High schoolgraduate
1519.3%
1923.8%
810.4%
56.6%
1316.8%
1823.2%
79100.0%
Somecollege
1010.6%
3234.5%
1111.3%
1011.1%
66.3%
2526.2%
94100.0%
Collegegraduate
3228.3%
4641.6%
65.7%
1110.1%
65.1%
109.3%
111100.0%
Graduateschool
1326.2%
1835.8%
611.2%
36.2%
24.2%
816.3%
49100.0%
DK/refused
00.0%
160.1%
139.9%
00.0%
00.0%
00.0%
2100.0%
www.peaksurveys.com Community Survey Education 2012 Page 189 H
Education
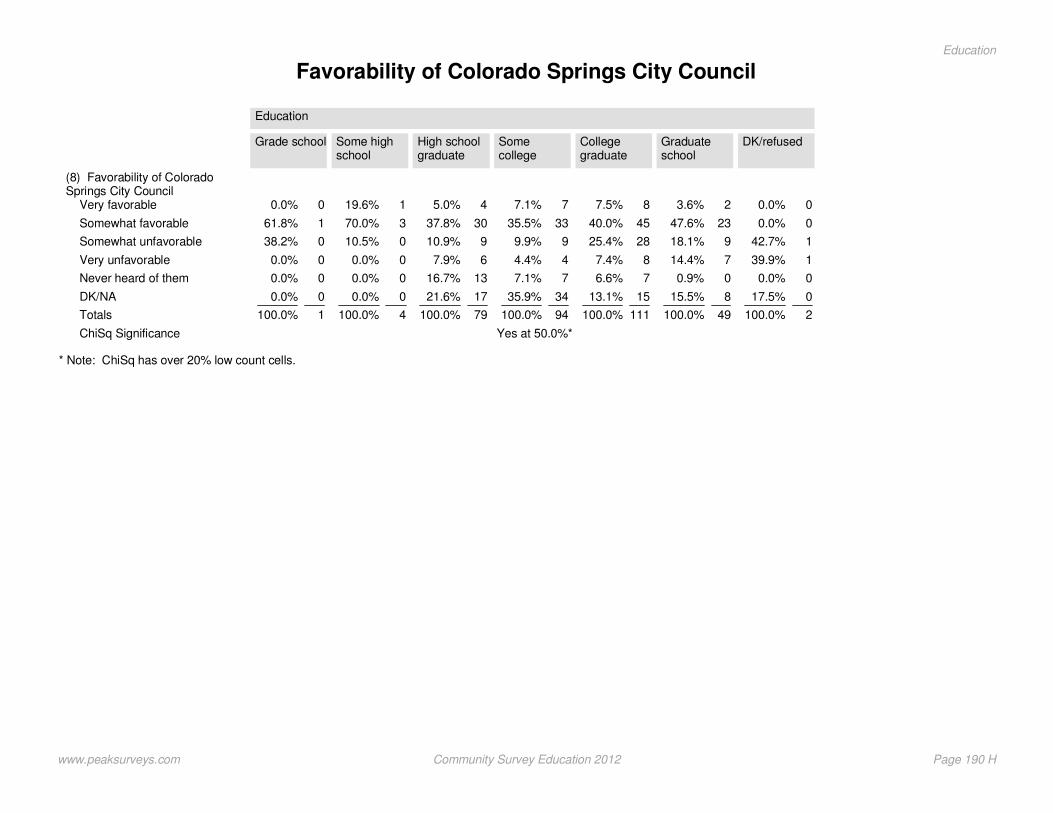
Favorability of Colorado Springs City Council
* Note: ChiSq has over 20% low count cells.
(8) Favorability of ColoradoSprings City Council
Very favorable
Somewhat favorable
Somewhat unfavorable
Very unfavorable
Never heard of them
DK/NA
Totals
ChiSq Significance
Grade school
Education
00.0%
161.8%
038.2%
00.0%
00.0%
00.0%
1100.0%
Yes at 50.0%*
Some highschool
119.6%
370.0%
010.5%
00.0%
00.0%
00.0%
4100.0%
High schoolgraduate
45.0%
3037.8%
910.9%
67.9%
1316.7%
1721.6%
79100.0%
Somecollege
77.1%
3335.5%
99.9%
44.4%
77.1%
3435.9%
94100.0%
Collegegraduate
87.5%
4540.0%
2825.4%
87.4%
76.6%
1513.1%
111100.0%
Graduateschool
23.6%
2347.6%
918.1%
714.4%
00.9%
815.5%
49100.0%
DK/refused
00.0%
00.0%
142.7%
139.9%
00.0%
017.5%
2100.0%
www.peaksurveys.com Community Survey Education 2012 Page 190 H
Education
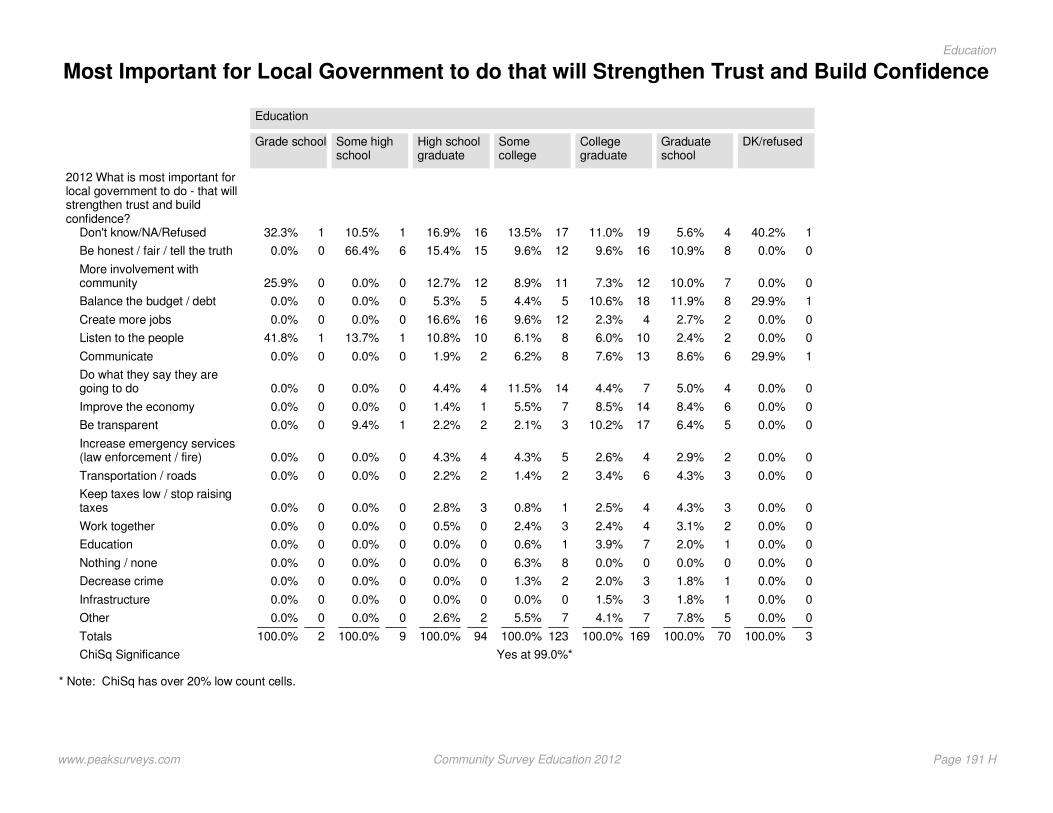
Most Important for Local Government to do that will Strengthen Trust and Build Confidence
* Note: ChiSq has over 20% low count cells.
2012 What is most important forlocal government to do - that willstrengthen trust and buildconfidence?
Don't know/NA/Refused
Be honest / fair / tell the truth
More involvement withcommunity
Balance the budget / debt
Create more jobs
Listen to the people
Communicate
Do what they say they aregoing to do
Improve the economy
Be transparent
Increase emergency services(law enforcement / fire)
Transportation / roads
Keep taxes low / stop raisingtaxes
Work together
Education
Nothing / none
Decrease crime
Infrastructure
Other
Totals
ChiSq Significance
Grade school
Education
132.3%
00.0%
025.9%
00.0%
00.0%
141.8%
00.0%
00.0%
00.0%
00.0%
00.0%
00.0%
00.0%
00.0%
00.0%
00.0%
00.0%
00.0%
00.0%
2100.0%
Yes at 99.0%*
Some highschool
110.5%
666.4%
00.0%
00.0%
00.0%
113.7%
00.0%
00.0%
00.0%
19.4%
00.0%
00.0%
00.0%
00.0%
00.0%
00.0%
00.0%
00.0%
00.0%
9100.0%
High schoolgraduate
1616.9%
1515.4%
1212.7%
55.3%
1616.6%
1010.8%
21.9%
44.4%
11.4%
22.2%
44.3%
22.2%
32.8%
00.5%
00.0%
00.0%
00.0%
00.0%
22.6%
94100.0%
Somecollege
1713.5%
129.6%
118.9%
54.4%
129.6%
86.1%
86.2%
1411.5%
75.5%
32.1%
54.3%
21.4%
10.8%
32.4%
10.6%
86.3%
21.3%
00.0%
75.5%
123100.0%
Collegegraduate
1911.0%
169.6%
127.3%
1810.6%
42.3%
106.0%
137.6%
74.4%
148.5%
1710.2%
42.6%
63.4%
42.5%
42.4%
73.9%
00.0%
32.0%
31.5%
74.1%
169100.0%
Graduateschool
45.6%
810.9%
710.0%
811.9%
22.7%
22.4%
68.6%
45.0%
68.4%
56.4%
22.9%
34.3%
34.3%
23.1%
12.0%
00.0%
11.8%
11.8%
57.8%
70100.0%
DK/refused
140.2%
00.0%
00.0%
129.9%
00.0%
00.0%
129.9%
00.0%
00.0%
00.0%
00.0%
00.0%
00.0%
00.0%
00.0%
00.0%
00.0%
00.0%
00.0%
3100.0%
www.peaksurveys.com Community Survey Education 2012 Page 191 H
Education

Positive or Negative Impact of Tabor in the Community
* Note: ChiSq has over 20% low count cells.
(10) Positive or Negative Impactof Tabor in the Community
Generally positive impact
Generally negative impact
Really makes no difference
Don't know enough about it
Never heard of TABOR
DK/NA
Totals
ChiSq Significance
Grade school
Education
00.0%
155.3%
126.4%
018.3%
00.0%
00.0%
2100.0%
Yes at 50.0%*
Some highschool
216.7%
323.7%
00.0%
547.8%
17.9%
04.0%
11100.0%
High schoolgraduate
3533.3%
2018.4%
11.0%
1110.5%
3027.8%
109.0%
107100.0%
Somecollege
4131.9%
2720.7%
43.0%
2620.1%
2217.3%
96.9%
130100.0%
Collegegraduate
4324.9%
5531.7%
95.3%
2715.5%
2212.5%
1710.0%
174100.0%
Graduateschool
3041.4%
2433.0%
56.4%
45.3%
56.6%
57.2%
73100.0%
DK/refused
127.9%
259.8%
00.0%
012.3%
00.0%
00.0%
3100.0%
Favorability of Amending Tabor
* Note: ChiSq has over 20% low count cells.
(11) Favorability of AmendingTABOR?
Strongly favorable
Somewhat favorable
Somewhat unfavorable
Strongly unfavorable
DK/NA
Totals
ChiSq Significance
Grade school
Education
134.2%
147.5%
00.0%
00.0%
018.3%
2100.0%
Yes at 95.0%*
Some highschool
17.9%
04.6%
323.7%
04.2%
659.6%
11100.0%
High schoolgraduate
109.5%
4037.3%
98.1%
32.9%
4542.3%
107100.0%
Somecollege
2115.8%
2922.7%
97.3%
118.6%
5945.5%
130100.0%
Collegegraduate
3721.5%
3922.6%
137.7%
148.0%
7040.3%
174100.0%
Graduateschool
2636.3%
1925.5%
68.4%
68.4%
1621.4%
73100.0%
DK/refused
129.9%
129.9%
00.0%
00.0%
140.2%
3100.0%
www.peaksurveys.com Community Survey Education 2012 Page 192 H
Education
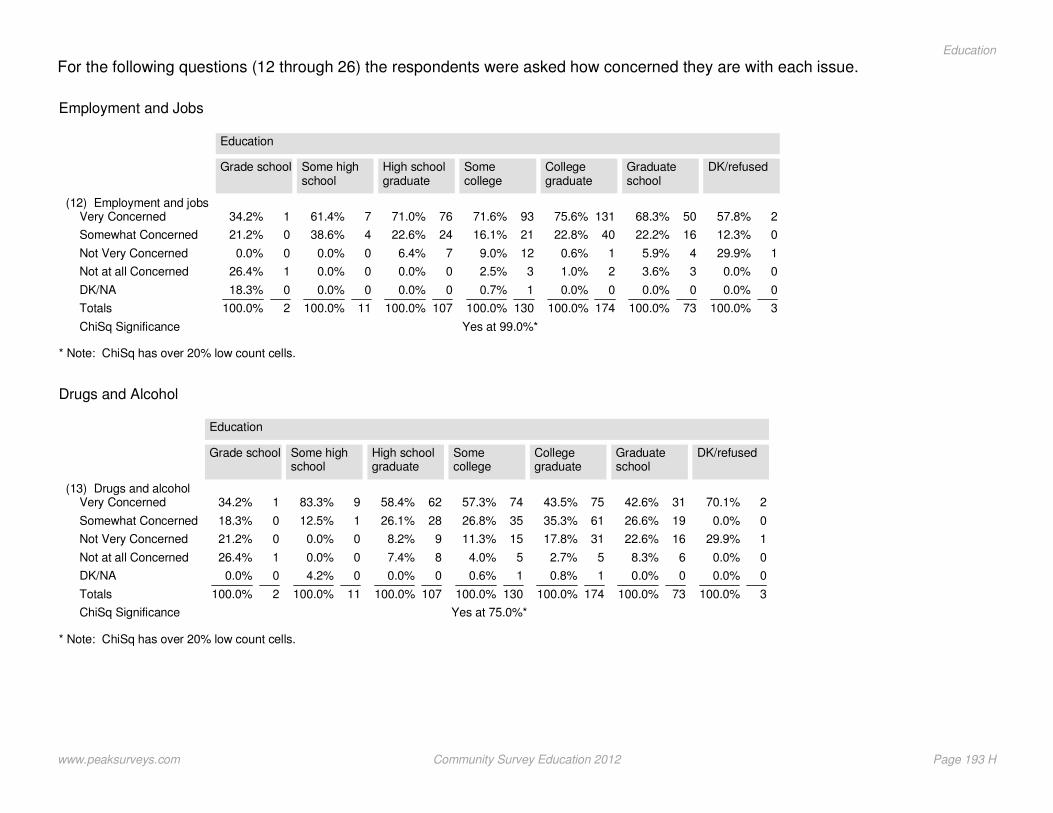
For the following questions (12 through 26) the respondents were asked how concerned they are with each issue.
* Note: ChiSq has over 20% low count cells.
Employment and Jobs
(12) Employment and jobsVery Concerned
Somewhat Concerned
Not Very Concerned
Not at all Concerned
DK/NA
Totals
ChiSq Significance
Grade school
Education
134.2%
021.2%
00.0%
126.4%
018.3%
2100.0%
Yes at 99.0%*
Some highschool
761.4%
438.6%
00.0%
00.0%
00.0%
11100.0%
High schoolgraduate
7671.0%
2422.6%
76.4%
00.0%
00.0%
107100.0%
Somecollege
9371.6%
2116.1%
129.0%
32.5%
10.7%
130100.0%
Collegegraduate
13175.6%
4022.8%
10.6%
21.0%
00.0%
174100.0%
Graduateschool
5068.3%
1622.2%
45.9%
33.6%
00.0%
73100.0%
DK/refused
257.8%
012.3%
129.9%
00.0%
00.0%
3100.0%
* Note: ChiSq has over 20% low count cells.
Drugs and Alcohol
(13) Drugs and alcoholVery Concerned
Somewhat Concerned
Not Very Concerned
Not at all Concerned
DK/NA
Totals
ChiSq Significance
Grade school
Education
134.2%
018.3%
021.2%
126.4%
00.0%
2100.0%
Yes at 75.0%*
Some highschool
983.3%
112.5%
00.0%
00.0%
04.2%
11100.0%
High schoolgraduate
6258.4%
2826.1%
98.2%
87.4%
00.0%
107100.0%
Somecollege
7457.3%
3526.8%
1511.3%
54.0%
10.6%
130100.0%
Collegegraduate
7543.5%
6135.3%
3117.8%
52.7%
10.8%
174100.0%
Graduateschool
3142.6%
1926.6%
1622.6%
68.3%
00.0%
73100.0%
DK/refused
270.1%
00.0%
129.9%
00.0%
00.0%
3100.0%
www.peaksurveys.com Community Survey Education 2012 Page 193 H
Education

* Note: ChiSq has over 20% low count cells.
Growth
(14) GrowthVery Concerned
Somewhat Concerned
Not Very Concerned
Not at all Concerned
DK/NA
Totals
ChiSq Significance
Grade school
Education
00.0%
281.7%
00.0%
00.0%
018.3%
2100.0%
Under 50%*
Some highschool
436.7%
550.4%
00.0%
112.9%
00.0%
11100.0%
High schoolgraduate
3230.3%
4845.5%
1413.4%
1210.8%
00.0%
107100.0%
Somecollege
3728.7%
5240.4%
2720.9%
118.7%
21.3%
130100.0%
Collegegraduate
6235.5%
6537.6%
3017.4%
84.6%
94.9%
174100.0%
Graduateschool
2737.1%
2939.3%
1114.7%
67.7%
11.1%
73100.0%
DK/refused
127.9%
012.3%
129.9%
129.9%
00.0%
3100.0%
* Note: ChiSq has over 20% low count cells.
Affordable Housing
(15) Affordable housingVery Concerned
Somewhat Concerned
Not Very Concerned
Not at all Concerned
DK/NA
Totals
ChiSq Significance
Grade school
Education
134.2%
139.5%
00.0%
00.0%
126.4%
2100.0%
Yes at 99.0%*
Some highschool
870.7%
112.1%
112.9%
00.0%
04.2%
11100.0%
High schoolgraduate
5652.3%
3028.1%
1312.4%
87.3%
00.0%
107100.0%
Somecollege
6549.7%
4534.7%
1511.2%
53.7%
10.7%
130100.0%
Collegegraduate
5933.8%
6839.3%
3017.3%
158.8%
10.8%
174100.0%
Graduateschool
2433.7%
2230.3%
1217.1%
1419.0%
00.0%
73100.0%
DK/refused
00.0%
00.0%
259.8%
00.0%
140.2%
3100.0%
www.peaksurveys.com Community Survey Education 2012 Page 194 H
Education

* Note: ChiSq has over 20% low count cells.
Health Care Costs
(16) Health care costsVery Concerned
Somewhat Concerned
Not Very Concerned
Not at all Concerned
DK/NA
Totals
ChiSq Significance
Grade school
Education
00.0%
273.6%
00.0%
126.4%
00.0%
2100.0%
Under 50%*
Some highschool
653.6%
546.4%
00.0%
00.0%
00.0%
11100.0%
High schoolgraduate
7469.3%
2120.0%
43.5%
87.2%
00.0%
107100.0%
Somecollege
9472.7%
2418.6%
75.7%
43.0%
00.0%
130100.0%
Collegegraduate
11365.3%
4928.4%
84.5%
31.5%
00.3%
174100.0%
Graduateschool
4967.9%
1824.9%
33.7%
33.5%
00.0%
73100.0%
DK/refused
270.1%
129.9%
00.0%
00.0%
00.0%
3100.0%
* Note: ChiSq has over 20% low count cells.
Water Supply and Quality
(17) Water supply and qualityVery Concerned
Somewhat Concerned
Not Very Concerned
Not at all Concerned
DK/NA
Totals
ChiSq Significance
Grade school
Education
134.2%
021.2%
00.0%
126.4%
018.3%
2100.0%
Yes at 95.0%*
Some highschool
870.7%
329.3%
00.0%
00.0%
00.0%
11100.0%
High schoolgraduate
5248.4%
3633.5%
87.5%
109.7%
10.9%
107100.0%
Somecollege
6147.3%
3224.3%
2821.6%
75.4%
21.4%
130100.0%
Collegegraduate
9554.9%
5732.9%
137.4%
84.8%
00.0%
174100.0%
Graduateschool
4359.6%
2026.9%
67.8%
45.8%
00.0%
73100.0%
DK/refused
127.9%
142.2%
00.0%
129.9%
00.0%
3100.0%
www.peaksurveys.com Community Survey Education 2012 Page 195 H
Education
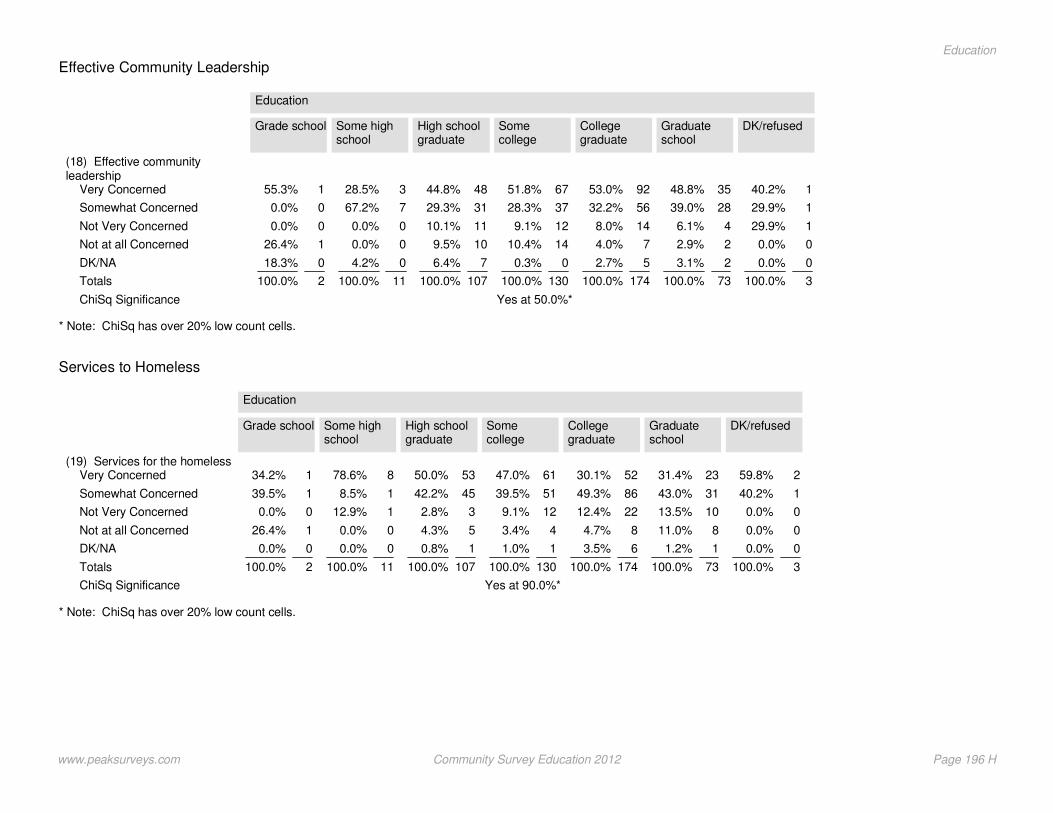
* Note: ChiSq has over 20% low count cells.
Effective Community Leadership
(18) Effective communityleadership
Very Concerned
Somewhat Concerned
Not Very Concerned
Not at all Concerned
DK/NA
Totals
ChiSq Significance
Grade school
Education
155.3%
00.0%
00.0%
126.4%
018.3%
2100.0%
Yes at 50.0%*
Some highschool
328.5%
767.2%
00.0%
00.0%
04.2%
11100.0%
High schoolgraduate
4844.8%
3129.3%
1110.1%
109.5%
76.4%
107100.0%
Somecollege
6751.8%
3728.3%
129.1%
1410.4%
00.3%
130100.0%
Collegegraduate
9253.0%
5632.2%
148.0%
74.0%
52.7%
174100.0%
Graduateschool
3548.8%
2839.0%
46.1%
22.9%
23.1%
73100.0%
DK/refused
140.2%
129.9%
129.9%
00.0%
00.0%
3100.0%
* Note: ChiSq has over 20% low count cells.
Services to Homeless
(19) Services for the homelessVery Concerned
Somewhat Concerned
Not Very Concerned
Not at all Concerned
DK/NA
Totals
ChiSq Significance
Grade school
Education
134.2%
139.5%
00.0%
126.4%
00.0%
2100.0%
Yes at 90.0%*
Some highschool
878.6%
18.5%
112.9%
00.0%
00.0%
11100.0%
High schoolgraduate
5350.0%
4542.2%
32.8%
54.3%
10.8%
107100.0%
Somecollege
6147.0%
5139.5%
129.1%
43.4%
11.0%
130100.0%
Collegegraduate
5230.1%
8649.3%
2212.4%
84.7%
63.5%
174100.0%
Graduateschool
2331.4%
3143.0%
1013.5%
811.0%
11.2%
73100.0%
DK/refused
259.8%
140.2%
00.0%
00.0%
00.0%
3100.0%
www.peaksurveys.com Community Survey Education 2012 Page 196 H
Education

* Note: ChiSq has over 20% low count cells.
Access to Mental Health
(20) Access to mental healthcare
Very Concerned
Somewhat Concerned
Not Very Concerned
Not at all Concerned
DK/NA
Totals
ChiSq Significance
Grade school
Education
134.2%
021.2%
00.0%
126.4%
018.3%
2100.0%
Under 50%*
Some highschool
763.3%
324.6%
17.9%
00.0%
04.2%
11100.0%
High schoolgraduate
3835.7%
3532.9%
1715.5%
1412.8%
33.1%
107100.0%
Somecollege
5542.4%
3425.9%
2519.3%
1511.3%
11.0%
130100.0%
Collegegraduate
5833.2%
5632.3%
3017.5%
2715.3%
31.7%
174100.0%
Graduateschool
2128.3%
2534.9%
1622.1%
912.9%
11.8%
73100.0%
DK/refused
127.9%
012.3%
129.9%
129.9%
00.0%
3100.0%
* Note: ChiSq has over 20% low count cells.
Access to Quality Early Childhood Education
(21) Access to quality earlychildhood education
Very Concerned
Somewhat Concerned
Not Very Concerned
Not at all Concerned
DK/NA
Totals
ChiSq Significance
Grade school
Education
155.3%
00.0%
00.0%
126.4%
018.3%
2100.0%
Yes at 75.0%*
Some highschool
437.2%
550.7%
112.1%
00.0%
00.0%
11100.0%
High schoolgraduate
4441.6%
4037.6%
87.8%
1110.1%
32.9%
107100.0%
Somecollege
6045.8%
4736.2%
1612.3%
54.0%
21.6%
130100.0%
Collegegraduate
6235.9%
5230.1%
3620.6%
1910.7%
52.8%
174100.0%
Graduateschool
2332.1%
1925.8%
1621.5%
1419.5%
11.1%
73100.0%
DK/refused
129.9%
140.2%
00.0%
129.9%
00.0%
3100.0%
www.peaksurveys.com Community Survey Education 2012 Page 197 H
Education
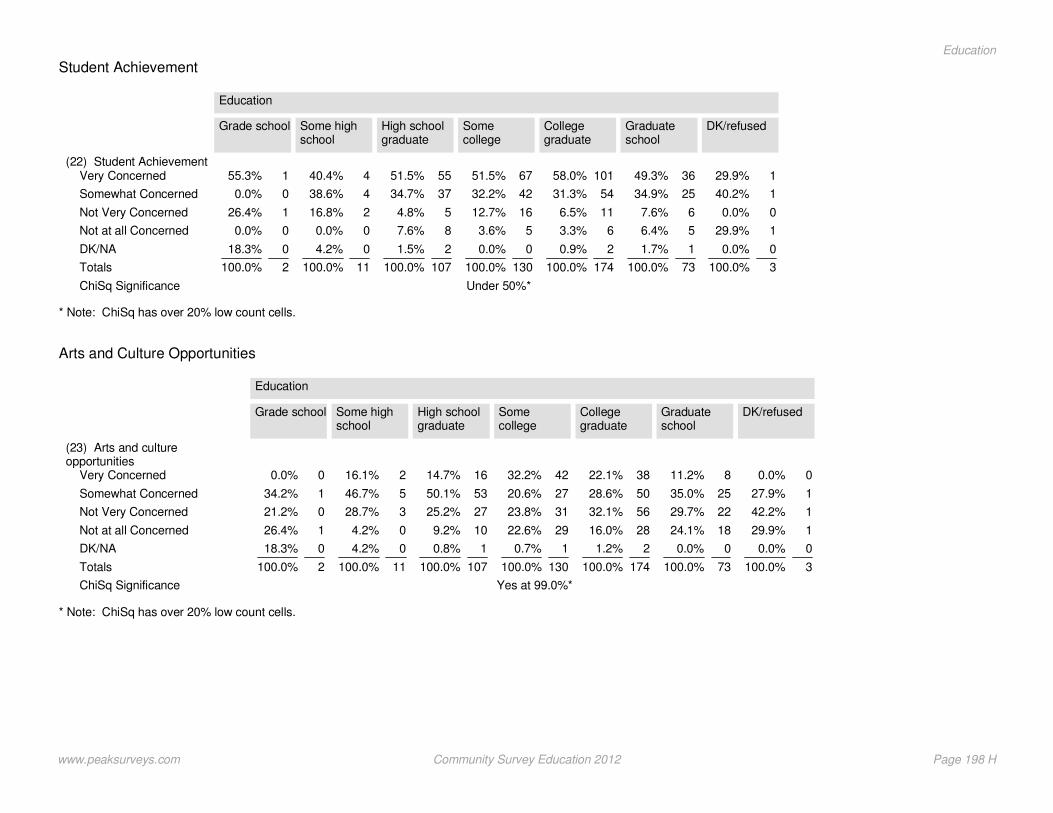
* Note: ChiSq has over 20% low count cells.
Student Achievement
(22) Student AchievementVery Concerned
Somewhat Concerned
Not Very Concerned
Not at all Concerned
DK/NA
Totals
ChiSq Significance
Grade school
Education
155.3%
00.0%
126.4%
00.0%
018.3%
2100.0%
Under 50%*
Some highschool
440.4%
438.6%
216.8%
00.0%
04.2%
11100.0%
High schoolgraduate
5551.5%
3734.7%
54.8%
87.6%
21.5%
107100.0%
Somecollege
6751.5%
4232.2%
1612.7%
53.6%
00.0%
130100.0%
Collegegraduate
10158.0%
5431.3%
116.5%
63.3%
20.9%
174100.0%
Graduateschool
3649.3%
2534.9%
67.6%
56.4%
11.7%
73100.0%
DK/refused
129.9%
140.2%
00.0%
129.9%
00.0%
3100.0%
* Note: ChiSq has over 20% low count cells.
Arts and Culture Opportunities
(23) Arts and cultureopportunities
Very Concerned
Somewhat Concerned
Not Very Concerned
Not at all Concerned
DK/NA
Totals
ChiSq Significance
Grade school
Education
00.0%
134.2%
021.2%
126.4%
018.3%
2100.0%
Yes at 99.0%*
Some highschool
216.1%
546.7%
328.7%
04.2%
04.2%
11100.0%
High schoolgraduate
1614.7%
5350.1%
2725.2%
109.2%
10.8%
107100.0%
Somecollege
4232.2%
2720.6%
3123.8%
2922.6%
10.7%
130100.0%
Collegegraduate
3822.1%
5028.6%
5632.1%
2816.0%
21.2%
174100.0%
Graduateschool
811.2%
2535.0%
2229.7%
1824.1%
00.0%
73100.0%
DK/refused
00.0%
127.9%
142.2%
129.9%
00.0%
3100.0%
www.peaksurveys.com Community Survey Education 2012 Page 198 H
Education

* Note: ChiSq has over 20% low count cells.
Crime Rate
(24) Crime rateVery Concerned
Somewhat Concerned
Not Very Concerned
Not at all Concerned
DK/NA
Totals
ChiSq Significance
Grade school
Education
155.3%
00.0%
126.4%
00.0%
018.3%
2100.0%
Yes at 75.0%*
Some highschool
766.7%
220.4%
00.0%
112.9%
00.0%
11100.0%
High schoolgraduate
6560.7%
2523.9%
87.5%
98.0%
00.0%
107100.0%
Somecollege
7053.9%
4332.8%
1511.7%
21.6%
00.0%
130100.0%
Collegegraduate
9353.7%
4727.1%
2615.0%
52.9%
21.3%
174100.0%
Graduateschool
3547.9%
2331.4%
1217.2%
33.5%
00.0%
73100.0%
DK/refused
272.1%
127.9%
00.0%
00.0%
00.0%
3100.0%
* Note: ChiSq has over 20% low count cells.
Voter Participation
(25) Voter participationVery Concerned
Somewhat Concerned
Not Very Concerned
Not at all Concerned
DK/NA
Totals
ChiSq Significance
Grade school
Education
134.2%
021.2%
126.4%
00.0%
018.3%
2100.0%
Yes at 95.0%*
Some highschool
324.9%
762.2%
00.0%
112.9%
00.0%
11100.0%
High schoolgraduate
3936.3%
4844.6%
76.6%
1110.2%
22.3%
107100.0%
Somecollege
8162.4%
2720.9%
1310.1%
64.7%
31.9%
130100.0%
Collegegraduate
9755.7%
4123.6%
1911.0%
158.6%
21.0%
174100.0%
Graduateschool
3446.8%
2027.6%
1318.5%
57.1%
00.0%
73100.0%
DK/refused
127.9%
129.9%
012.3%
129.9%
00.0%
3100.0%
www.peaksurveys.com Community Survey Education 2012 Page 199 H
Education

* Note: ChiSq has over 20% low count cells.
Community Engagement in Local Issues
(26) Community engagement inlocal issues
Very Concerned
Somewhat Concerned
Not Very Concerned
Not at all Concerned
DK/NA
Totals
ChiSq Significance
Grade school
Education
00.0%
155.3%
00.0%
126.4%
018.3%
2100.0%
Yes at 90.0%*
Some highschool
436.4%
328.7%
330.7%
00.0%
04.2%
11100.0%
High schoolgraduate
2927.6%
5854.1%
76.8%
98.0%
43.5%
107100.0%
Somecollege
3728.4%
5038.2%
2418.7%
1511.2%
53.5%
130100.0%
Collegegraduate
5833.2%
7442.4%
3520.2%
53.0%
21.1%
174100.0%
Graduateschool
1520.5%
4258.4%
1013.9%
56.5%
00.6%
73100.0%
DK/refused
00.0%
127.9%
129.9%
129.9%
012.3%
3100.0%
* Note: ChiSq has over 20% low count cells.
Public Transit
(27) Public transitVery Concerned
Somewhat Concerned
Not Very Concerned
Not at all Concerned
DK/NA
Totals
ChiSq Significance
Grade school
Education
134.2%
021.2%
00.0%
126.4%
018.3%
2100.0%
Yes at 50.0%*
Some highschool
332.5%
216.1%
651.5%
00.0%
00.0%
11100.0%
High schoolgraduate
2826.0%
5248.5%
1816.9%
98.2%
00.5%
107100.0%
Somecollege
3930.0%
3728.4%
2821.2%
2015.8%
64.7%
130100.0%
Collegegraduate
5129.6%
5833.1%
4324.7%
1810.5%
42.1%
174100.0%
Graduateschool
1925.9%
3040.6%
1521.3%
912.2%
00.0%
73100.0%
DK/refused
127.9%
129.9%
00.0%
129.9%
012.3%
3100.0%
www.peaksurveys.com Community Survey Education 2012 Page 200 H
Education

* Note: ChiSq has over 20% low count cells.
Land Use
(28) Land useVery Concerned
Somewhat Concerned
Not Very Concerned
Not at all Concerned
DK/NA
Totals
ChiSq Significance
Grade school
Education
134.2%
021.2%
00.0%
126.4%
018.3%
2100.0%
Yes at 75.0%*
Some highschool
324.6%
432.9%
111.8%
330.7%
00.0%
11100.0%
High schoolgraduate
2826.3%
5248.5%
1917.8%
44.0%
43.4%
107100.0%
Somecollege
3627.6%
4736.4%
3526.6%
86.0%
43.4%
130100.0%
Collegegraduate
5431.2%
7442.4%
3017.2%
74.3%
94.9%
174100.0%
Graduateschool
2737.1%
3548.0%
710.2%
23.0%
11.7%
73100.0%
DK/refused
127.9%
272.1%
00.0%
00.0%
00.0%
3100.0%
www.peaksurveys.com Community Survey Education 2012 Page 201 H
Education
Section H
educationquality of life
Peak Surveys
www.peaksurveys.com
Community and QLI Survey 2012

Education
Economic Vision
* Note: ChiSq has over 20% low count cells.
How Respondents Feel Local Economy Compares to the National Economy
(3) How do you feel the localeconomy compares to thenational economy?
Same as national economy
Better than national economy
Worse than national economy
Much better than nationaleconomy
Much worse than nationaleconomy
Totals
ChiSq Significance
Grade School
What is the last grade you completed?
139.49%
160.51%
00.00%
00.00%
00.00%
2100.00%
Under 50%*
Some high school
654.05%
221.70%
17.89%
18.47%
17.89%
11100.00%
High School Graduate
4037.78%
4340.32%
87.75%
1210.84%
43.31%
107100.00%
Some college
5139.31%
5945.66%
128.96%
75.34%
10.73%
130100.00%
College graduate
8146.64%
6638.06%
1810.48%
84.56%
00.26%
174100.00%
(3) How do you feel the localeconomy compares to thenational economy?
Same as national economy
Better than national economy
Worse than national economy
Much better than nationaleconomy
Much worse than nationaleconomy
Totals
ChiSq Significance
Graduate school
What is the last grade you completed?
3751.51%
2230.56%
1013.14%
34.79%
00.00%
73100.00%
Under 50%*
Don't know/NA/Refused
127.94%
259.81%
012.25%
00.00%
00.00%
3100.00%
www.peaksurveys.com QLI Education 2012 203 H
Education

Environment
* Note: ChiSq has over 20% low count cells.
Q:8 What do you think the biggest environmental challenge is facing the Pikes Peak Region today?
(8) What do you think thebiggest environmental challengeis facing the Pikes Peak Regiontoday?
Water supply
Energy supply
Recycling
Air quality
Water quality
Other
Totals
ChiSq Significance
Grade School
What is the last grade you completed?
00.00%
147.51%
134.17%
00.00%
00.00%
018.32%
2100.00%
Yes at 75.0%*
Some high school
329.25%
04.57%
219.43%
438.85%
00.00%
17.89%
11100.00%
High School Graduate
2826.52%
66.05%
2624.64%
1817.19%
87.15%
2018.44%
107100.00%
Some college
4534.73%
2821.41%
1310.39%
2115.96%
86.52%
1410.99%
130100.00%
College graduate
9252.88%
2413.66%
2011.48%
95.21%
95.07%
2011.70%
174100.00%
(8) What do you think thebiggest environmental challengeis facing the Pikes Peak Regiontoday?
Water supply
Energy supply
Recycling
Air quality
Water quality
Other
Totals
ChiSq Significance
Graduate school
What is the last grade you completed?
3953.59%
1216.51%
45.38%
34.14%
68.10%
912.28%
73100.00%
Yes at 75.0%*
Don't know/NA/Refused
142.16%
00.00%
00.00%
00.00%
127.94%
129.91%
3100.00%
www.peaksurveys.com QLI Education 2012 204 H
Education

Arts and Culture
* Note: ChiSq has over 20% low count cells.
Essentiality of Parks, Recreation, Trails and Open Spaces to Respondents
Parks, recreation, trails and openspaces are essential to mycommunity.
Strongly Agree
Agree
Disagree
Strongly Disagree
Totals
ChiSq Significance
College graduate
What is the last grade you completed?
10862.10%
6135.31%
42.59%
00.00%
174100.00%
Yes at 50.0%*
Some college
7154.50%
4937.54%
96.96%
11.00%
130100.00%
High School Graduate
5955.16%
4542.27%
21.77%
10.79%
107100.00%
Graduate school
4359.23%
2332.23%
22.76%
45.78%
73100.00%
Some high school
652.98%
547.02%
00.00%
00.00%
11100.00%
Parks, recreation, trails and openspaces are essential to mycommunity.
Strongly Agree
Agree
Disagree
Strongly Disagree
Totals
ChiSq Significance
Don't know/NA/Refused
What is the last grade you completed?
129.91%
140.19%
129.91%
00.00%
3100.00%
Yes at 50.0%*
Grade School
134.17%
265.83%
00.00%
00.00%
2100.00%
www.peaksurveys.com QLI Education 2012 205 H
Education

* Note: ChiSq has over 20% low count cells.
Respondents Satisfaction with Level of Maintenance and Service
I am satisfied with the level ofmaintenance and service inparks, recreation, trails and openspaces.
Strongly Agree
Agree
Disagree
Strongly Disagree
Totals
ChiSq Significance
Grade School
What is the last grade you completed?
00.00%
2100.00%
00.00%
00.00%
2100.00%
Under 50%*
Some high school
04.23%
986.97%
04.23%
04.57%
11100.00%
High School Graduate
1312.62%
6258.08%
2220.17%
109.13%
107100.00%
Some college
2720.95%
7255.65%
2519.13%
64.26%
130100.00%
College graduate
3218.70%
8951.47%
3821.94%
147.88%
174100.00%
I am satisfied with the level ofmaintenance and service inparks, recreation, trails and openspaces.
Strongly Agree
Agree
Disagree
Strongly Disagree
Totals
ChiSq Significance
Graduate school
What is the last grade you completed?
1317.35%
4054.85%
1520.91%
56.89%
73100.00%
Under 50%*
Don't know/NA/Refused
129.91%
140.19%
129.91%
00.00%
3100.00%
www.peaksurveys.com QLI Education 2012 206 H
Education

* Note: ChiSq has over 20% low count cells.
Respondents Agreement Level of Arts and Culture Improve Quality of Life
Arts and Culture improve myquality of life.
Strongly Agree
Agree
Disagree
Strongly Disagree
Totals
ChiSq Significance
Grade School
What is the last grade you completed?
00.00%
160.51%
139.49%
00.00%
2100.00%
Under 50%*
Some high school
436.90%
550.98%
112.13%
00.00%
11100.00%
High School Graduate
2321.94%
6560.82%
1715.99%
11.25%
107100.00%
Some college
3627.37%
6348.76%
2922.56%
21.31%
130100.00%
College graduate
4726.86%
9755.70%
2916.53%
20.91%
174100.00%
Arts and Culture improve myquality of life.
Strongly Agree
Agree
Disagree
Strongly Disagree
Totals
ChiSq Significance
Graduate school
What is the last grade you completed?
2838.36%
3547.59%
810.56%
33.49%
73100.00%
Under 50%*
Don't know/NA/Refused
00.00%
272.06%
127.94%
00.00%
3100.00%
www.peaksurveys.com QLI Education 2012 207 H
Education

* Note: ChiSq has over 20% low count cells.
Reasons Respondents Agree on Arts and Culture Improve Quality of Life
Why do you believe it improves thequality of your life?
Spiritual / Relaxing
Entertaining
Exposure / Growth
Enriches Life
Something To Do
Better Educated / Open Mind
Experience Something New
Exposure to New Cultures
Recreation
Artist / Musician
Nothing / none
Other
Don't Know/refused
Totals
ChiSq Significance
Grade School
What is the last grade you completed?
00.00%
00.00%
00.00%
143.53%
00.00%
00.00%
00.00%
00.00%
00.00%
00.00%
00.00%
00.00%
156.47%
1100.00%
Yes at 99.0%*
Some high school
04.82%
04.82%
113.13%
00.00%
18.98%
00.00%
00.00%
00.00%
114.67%
548.38%
00.00%
00.00%
05.20%
9100.00%
High School Graduate
00.00%
89.31%
1820.12%
1517.37%
66.55%
910.28%
78.31%
44.55%
55.53%
56.23%
44.20%
00.52%
67.02%
88100.00%
Some college
77.16%
32.59%
1717.35%
1110.89%
99.33%
109.70%
65.66%
1313.02%
00.43%
1413.98%
54.61%
10.86%
44.43%
98100.00%
College graduate
31.88%
1712.01%
138.75%
3524.18%
117.40%
1812.44%
74.57%
1913.11%
42.55%
85.84%
10.74%
10.85%
85.68%
143100.00%
Graduate school
00.78%
46.68%
812.35%
1320.63%
11.26%
711.80%
58.06%
1118.12%
46.83%
46.21%
35.10%
11.45%
00.73%
62100.00%
Why do you believe it improves thequality of your life?
Spiritual / Relaxing
Entertaining
Exposure / Growth
Enriches Life
Something To Do
Better Educated / Open Mind
Experience Something New
Exposure to New Cultures
Recreation
Artist / Musician
Nothing / none
Other
Don't Know/refused
Totals
ChiSq Significance
Don't know/NA/Refused
What is the last gradeyou completed?
00.00%
00.00%
00.00%
141.50%
141.50%
00.00%
00.00%
00.00%
00.00%
00.00%
00.00%
00.00%
017.00%
2100.00%
Yes at 99.0%*
www.peaksurveys.com QLI Education 2012 208 H
Education

* Note: ChiSq has over 20% low count cells.
Why Respondent Believes it Does Not Improve the Quality of Their Life
Why do you believe it does notimprove the quality of your life?
No Interest
More Important Things To Do
No effect on my life
Do not participate
Other
Don't Know/refused
Other
Totals
ChiSq Significance
Grade School
What is the last grade you completed?
00.00%
1100.00%
00.00%
00.00%
00.00%
00.00%
00.00%
1100.00%
Under 50%*
Some high school
165.10%
00.00%
00.00%
034.90%
00.00%
00.00%
00.00%
1100.00%
High School Graduate
1273.98%
212.52%
00.00%
210.75%
00.00%
02.74%
00.00%
17100.00%
Some college
723.20%
1135.95%
721.67%
00.00%
413.72%
12.73%
12.73%
31100.00%
College graduate
934.24%
726.88%
621.13%
28.52%
01.60%
27.63%
00.00%
27100.00%
Why do you believe it does notimprove the quality of your life?
No Interest
More Important Things To Do
No effect on my life
Do not participate
Other
Don't Know/refused
Other
Totals
ChiSq Significance
Graduate school
What is the last grade you completed?
335.55%
116.62%
333.94%
18.80%
05.09%
00.00%
00.00%
9100.00%
Under 50%*
Don't know/NA/Refused
1100.00%
00.00%
00.00%
00.00%
00.00%
00.00%
00.00%
1100.00%
www.peaksurveys.com QLI Education 2012 209 H
Education
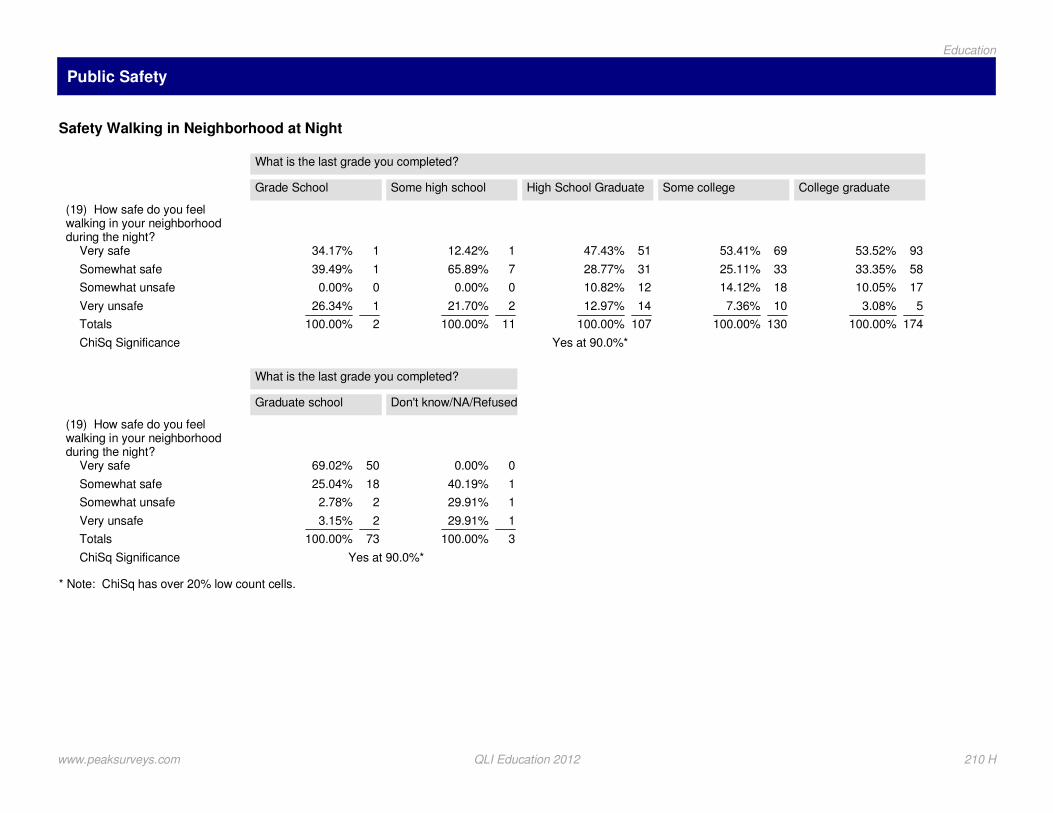
Public Safety
* Note: ChiSq has over 20% low count cells.
Safety Walking in Neighborhood at Night
(19) How safe do you feelwalking in your neighborhoodduring the night?
Very safe
Somewhat safe
Somewhat unsafe
Very unsafe
Totals
ChiSq Significance
Grade School
What is the last grade you completed?
134.17%
139.49%
00.00%
126.34%
2100.00%
Yes at 90.0%*
Some high school
112.42%
765.89%
00.00%
221.70%
11100.00%
High School Graduate
5147.43%
3128.77%
1210.82%
1412.97%
107100.00%
Some college
6953.41%
3325.11%
1814.12%
107.36%
130100.00%
College graduate
9353.52%
5833.35%
1710.05%
53.08%
174100.00%
(19) How safe do you feelwalking in your neighborhoodduring the night?
Very safe
Somewhat safe
Somewhat unsafe
Very unsafe
Totals
ChiSq Significance
Graduate school
What is the last grade you completed?
5069.02%
1825.04%
22.78%
23.15%
73100.00%
Yes at 90.0%*
Don't know/NA/Refused
00.00%
140.19%
129.91%
129.91%
3100.00%
www.peaksurveys.com QLI Education 2012 210 H
Education
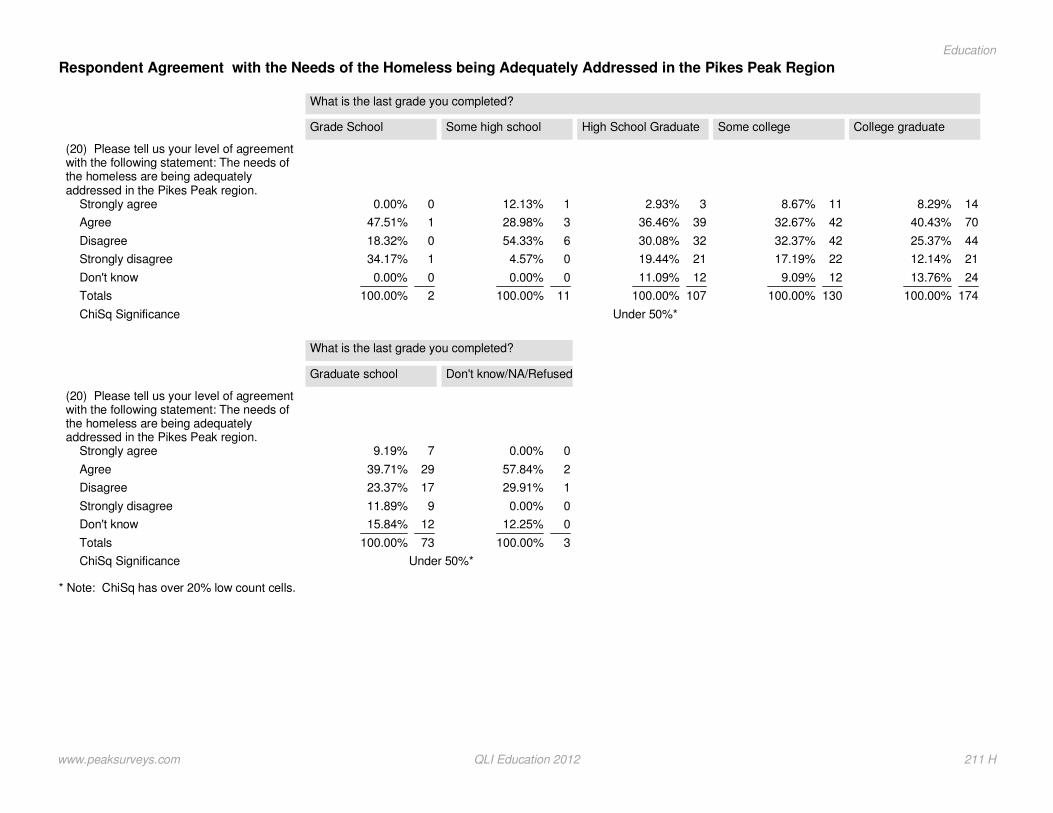
* Note: ChiSq has over 20% low count cells.
Respondent Agreement with the Needs of the Homeless being Adequately Addressed in the Pikes Peak Region
(20) Please tell us your level of agreementwith the following statement: The needs ofthe homeless are being adequatelyaddressed in the Pikes Peak region.
Strongly agree
Agree
Disagree
Strongly disagree
Don't know
Totals
ChiSq Significance
Grade School
What is the last grade you completed?
00.00%
147.51%
018.32%
134.17%
00.00%
2100.00%
Under 50%*
Some high school
112.13%
328.98%
654.33%
04.57%
00.00%
11100.00%
High School Graduate
32.93%
3936.46%
3230.08%
2119.44%
1211.09%
107100.00%
Some college
118.67%
4232.67%
4232.37%
2217.19%
129.09%
130100.00%
College graduate
148.29%
7040.43%
4425.37%
2112.14%
2413.76%
174100.00%
(20) Please tell us your level of agreementwith the following statement: The needs ofthe homeless are being adequatelyaddressed in the Pikes Peak region.
Strongly agree
Agree
Disagree
Strongly disagree
Don't know
Totals
ChiSq Significance
Graduate school
What is the last grade you completed?
79.19%
2939.71%
1723.37%
911.89%
1215.84%
73100.00%
Under 50%*
Don't know/NA/Refused
00.00%
257.84%
129.91%
00.00%
012.25%
3100.00%
www.peaksurveys.com QLI Education 2012 211 H
Education

Community Engagement
* Note: ChiSq has over 20% low count cells.
How Accepting Respondents' feel the Community is of the Differences in Race, Ethnicity, Religious Preference, and GenderOrientation
How accepting of the differences inrace, Ethnicity, religious preference,and gender orientation do youconsider the community to be?
Very accepting
Somewhat accepting
Not very accepting
Not accepting at all
Don't know/NA
Totals
ChiSq Significance
Grade School
What is the last grade you completed?
126.34%
134.17%
021.17%
00.00%
018.32%
2100.00%
Under 50%*
Some high school
547.36%
652.64%
00.00%
00.00%
00.00%
11100.00%
High School Graduate
4441.68%
5047.18%
109.01%
00.46%
21.67%
107100.00%
Some college
4736.57%
6751.96%
118.10%
43.00%
00.38%
130100.00%
College graduate
6235.58%
8347.72%
2111.82%
73.80%
21.08%
174100.00%
How accepting of the differences inrace, Ethnicity, religious preference,and gender orientation do youconsider the community to be?
Very accepting
Somewhat accepting
Not very accepting
Not accepting at all
Don't know/NA
Totals
ChiSq Significance
Graduate school
What is the last grade you completed?
3041.85%
2737.28%
1216.19%
33.52%
11.16%
73100.00%
Under 50%*
Don't know/NA/Refused
00.00%
257.84%
129.91%
012.25%
00.00%
3100.00%
www.peaksurveys.com QLI Education 2012 212 H
Education

* Note: ChiSq has over 20% low count cells.
Importance of Acceptance of Differences in Race, Ethnicity, Religious Preference, and Gender Orientation
How important do you believe it is to have acommunity that is accepting of thedifferences in race, Ethnicity, religiouspreference, and gender orientation?
It is very important
Somewhat important
Not very important
Not important at all
Don't know/NA
Totals
ChiSq Significance
Grade School
What is the last grade you completed?
281.68%
00.00%
00.00%
00.00%
018.32%
2100.00%
Yes at 95.0%*
Some high school
871.32%
220.79%
00.00%
17.89%
00.00%
11100.00%
High School Graduate
8680.28%
1715.82%
32.43%
10.74%
10.74%
107100.00%
Some college
9976.21%
2418.71%
64.70%
00.00%
00.38%
130100.00%
College graduate
13477.15%
3017.12%
74.31%
00.24%
21.19%
174100.00%
How important do you believe it is to have acommunity that is accepting of thedifferences in race, Ethnicity, religiouspreference, and gender orientation?
It is very important
Somewhat important
Not very important
Not important at all
Don't know/NA
Totals
ChiSq Significance
Graduate school
What is the last grade you completed?
5778.71%
1013.32%
22.86%
45.10%
00.00%
73100.00%
Yes at 95.0%*
Don't know/NA/Refused
270.09%
00.00%
00.00%
129.91%
00.00%
3100.00%
www.peaksurveys.com QLI Education 2012 213 H
Education

* Note: ChiSq has over 20% low count cells.
Frequency of Charitable or Voluntary Service in the Last 12 Months
During the last 12 months howoften did you or other members ofyour household spend on charitableor voluntary service activities?
More than once a week
Several times a month
Once a month
Once or twice a quarter
Rarely
Never
Don't know/NA
Totals
ChiSq Significance
Grade School
What is the last grade you completed?
155.34%
00.00%
00.00%
00.00%
00.00%
144.66%
00.00%
2100.00%
Yes at 99.0%*
Some high school
00.00%
327.96%
217.13%
00.00%
546.45%
18.47%
00.00%
11100.00%
High School Graduate
109.08%
2724.96%
1716.33%
1211.71%
109.55%
2826.73%
21.62%
107100.00%
Some college
107.32%
2519.31%
2116.17%
2519.00%
2720.62%
2317.58%
00.00%
130100.00%
College graduate
3017.14%
2614.98%
3117.72%
3821.90%
3520.04%
137.66%
10.56%
174100.00%
During the last 12 months howoften did you or other members ofyour household spend on charitableor voluntary service activities?
More than once a week
Several times a month
Once a month
Once or twice a quarter
Rarely
Never
Don't know/NA
Totals
ChiSq Significance
Graduate school
What is the last grade you completed?
1723.61%
1925.88%
1519.99%
1013.49%
911.74%
45.28%
00.00%
73100.00%
Yes at 99.0%*
Don't know/NA/Refused
00.00%
129.91%
00.00%
00.00%
012.25%
129.91%
127.94%
3100.00%
www.peaksurveys.com QLI Education 2012 214 H
Education

* Note: ChiSq has over 20% low count cells.
Frequency of Donating Money or Property in the Last 12 Months
How often have you or other members of yourhousehold donated money or property to charity in thelast 12 months? By donating I mean making a voluntarycontribution with no intention of making a profi
Weekly
Monthly
Quarterly
Occasionally
Never
Don't know/NA
Totals
ChiSq Significance
Grade School
What is the last grade you completed?
134.17%
021.17%
00.00%
126.34%
018.32%
00.00%
2100.00%
Yes at 50.0%*
Some high school
04.23%
323.67%
03.95%
655.68%
112.46%
00.00%
11100.00%
High School Graduate
1412.86%
3028.29%
2018.49%
3128.86%
119.93%
21.57%
107100.00%
Some college
129.08%
4836.69%
2519.30%
3627.70%
97.23%
00.00%
130100.00%
How often have you or other members of yourhousehold donated money or property to charity in thelast 12 months? By donating I mean making a voluntarycontribution with no intention of making a profi
Weekly
Monthly
Quarterly
Occasionally
Never
Don't know/NA
Totals
ChiSq Significance
College graduate
What is the last grade you completed?
2916.59%
7241.65%
3721.10%
3318.83%
31.57%
00.26%
174100.00%
Yes at 50.0%*
Graduate school
1722.90%
3446.65%
1520.85%
46.08%
33.52%
00.00%
73100.00%
Don't know/NA/Refused
00.00%
259.81%
127.94%
012.25%
00.00%
00.00%
3100.00%
www.peaksurveys.com QLI Education 2012 215 H
Education
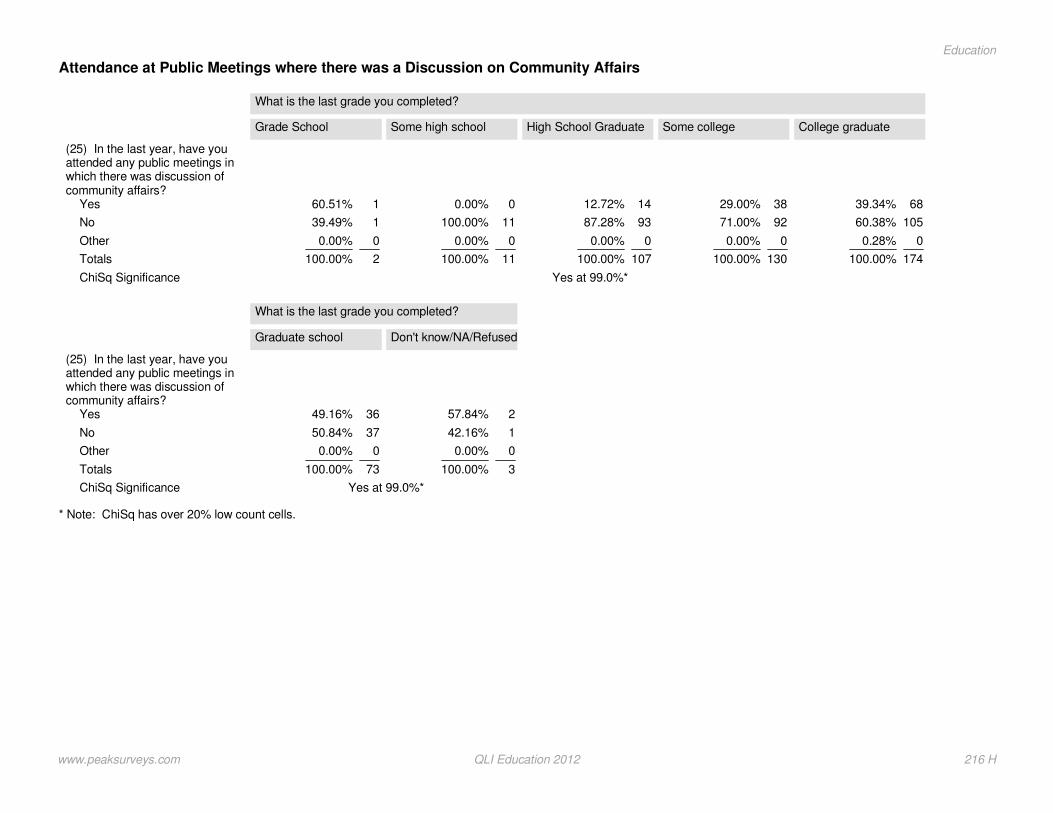
* Note: ChiSq has over 20% low count cells.
Attendance at Public Meetings where there was a Discussion on Community Affairs
(25) In the last year, have youattended any public meetings inwhich there was discussion ofcommunity affairs?
Yes
No
Other
Totals
ChiSq Significance
Grade School
What is the last grade you completed?
160.51%
139.49%
00.00%
2100.00%
Yes at 99.0%*
Some high school
00.00%
11100.00%
00.00%
11100.00%
High School Graduate
1412.72%
9387.28%
00.00%
107100.00%
Some college
3829.00%
9271.00%
00.00%
130100.00%
College graduate
6839.34%
10560.38%
00.28%
174100.00%
(25) In the last year, have youattended any public meetings inwhich there was discussion ofcommunity affairs?
Yes
No
Other
Totals
ChiSq Significance
Graduate school
What is the last grade you completed?
3649.16%
3750.84%
00.00%
73100.00%
Yes at 99.0%*
Don't know/NA/Refused
257.84%
142.16%
00.00%
3100.00%
www.peaksurveys.com QLI Education 2012 216 H
Education
Section I
Political Affiliationcommunity survey
Peak Surveys
www.peaksurveys.com
Community and QLI Survey 2012

Political Affiliation
Overall Quality of Life in the Community
* Note: ChiSq has over 20% low count cells.
(1) Overall Quality of Life in theCommunity
Excellent
Good
Fair
Poor
DK/NA
Totals
ChiSq Significance
Democrat
Political Affiliation
1818.4%
7071.0%
65.8%
43.9%
10.8%
99100.0%
Yes at 50.0%*
Republican
7240.3%
9854.6%
63.2%
31.9%
00.0%
179100.0%
Independent
5736.0%
9157.2%
84.9%
21.5%
10.4%
158100.0%
Other
1844.7%
1846.0%
00.0%
38.2%
01.1%
40100.0%
Unaffiliated
125.2%
359.5%
00.0%
115.4%
00.0%
5100.0%
DK/NA/Refused
529.1%
848.6%
213.6%
18.6%
00.0%
17100.0%
Community Headed in Right or Wrong Direction
* Note: ChiSq has over 20% low count cells.
(2) Community Headed in theRight direction or Wrong direction
Right Direction
Wrong Direction
DK/NA
Totals
ChiSq Significance
Democrat
Political Affiliation
7071.0%
2423.8%
55.2%
99100.0%
Under 50%*
Republican
11765.2%
4122.9%
2111.8%
179100.0%
Independent
11270.4%
3018.8%
1710.8%
158100.0%
Other
2460.3%
615.7%
1024.0%
40100.0%
Unaffiliated
358.4%
241.6%
00.0%
5100.0%
DK/NA/Refused
1376.7%
213.1%
210.2%
17100.0%
www.peaksurveys.com Community Survey Political Affiliation 2012 Page 218 I
Political Affiliation

Most Important Issue Facing the Community
* Note: ChiSq has over 20% low count cells.
2012 Most Important IssueFacing the Community
Jobs / Unemployment
Economy
Don't know/NA/Refused
Crime
Education / schools
Budget / spending / finances
Presidential election
Growth and development
Child safety / safety
Environment
Homeless
Taxes
Traffic / transportation
Funding for emergencyservices (law enforcement/fire)
Water issues
Road repair / maintenance
Government
Healthcare
None / nothing
Military
Infrastructure
Housing
Other
Totals
ChiSq Significance
Democrat
Political Affiliation
1111.3%
1010.5%
22.3%
1514.8%
1312.7%
65.7%
21.8%
55.3%
55.4%
77.1%
21.7%
21.8%
44.5%
22.1%
11.0%
33.4%
21.8%
21.9%
00.0%
22.1%
00.0%
11.5%
11.3%
99100.0%
Yes at 99.0%*
Republican
3318.1%
3218.1%
137.2%
137.1%
179.6%
95.1%
105.8%
31.9%
21.2%
31.7%
63.4%
53.0%
42.0%
42.1%
63.4%
52.6%
21.1%
10.5%
21.2%
00.0%
21.2%
10.5%
63.2%
179100.0%
Independent
3421.2%
148.6%
2012.9%
127.4%
127.9%
42.3%
53.2%
85.3%
63.9%
32.2%
63.8%
42.5%
42.7%
53.4%
42.6%
31.9%
32.0%
00.0%
42.3%
21.4%
10.8%
00.3%
21.5%
158100.0%
Other
820.1%
410.5%
718.3%
410.1%
00.0%
38.2%
00.0%
00.0%
13.3%
12.1%
01.1%
36.6%
00.0%
25.2%
00.0%
00.0%
13.2%
511.3%
00.0%
00.0%
00.0%
00.0%
00.0%
40100.0%
Unaffiliated
240.5%
00.0%
08.9%
125.4%
00.0%
00.0%
00.0%
00.0%
00.0%
00.0%
00.0%
00.0%
125.2%
00.0%
00.0%
00.0%
00.0%
00.0%
00.0%
00.0%
00.0%
00.0%
00.0%
5100.0%
DK/NA/Refused
29.7%
421.2%
951.8%
00.0%
00.0%
16.0%
00.0%
00.0%
00.0%
00.0%
00.0%
00.0%
00.0%
00.0%
02.6%
00.0%
02.6%
16.0%
00.0%
00.0%
00.0%
00.0%
00.0%
17100.0%
www.peaksurveys.com Community Survey Political Affiliation 2012 Page 219 I
Political Affiliation
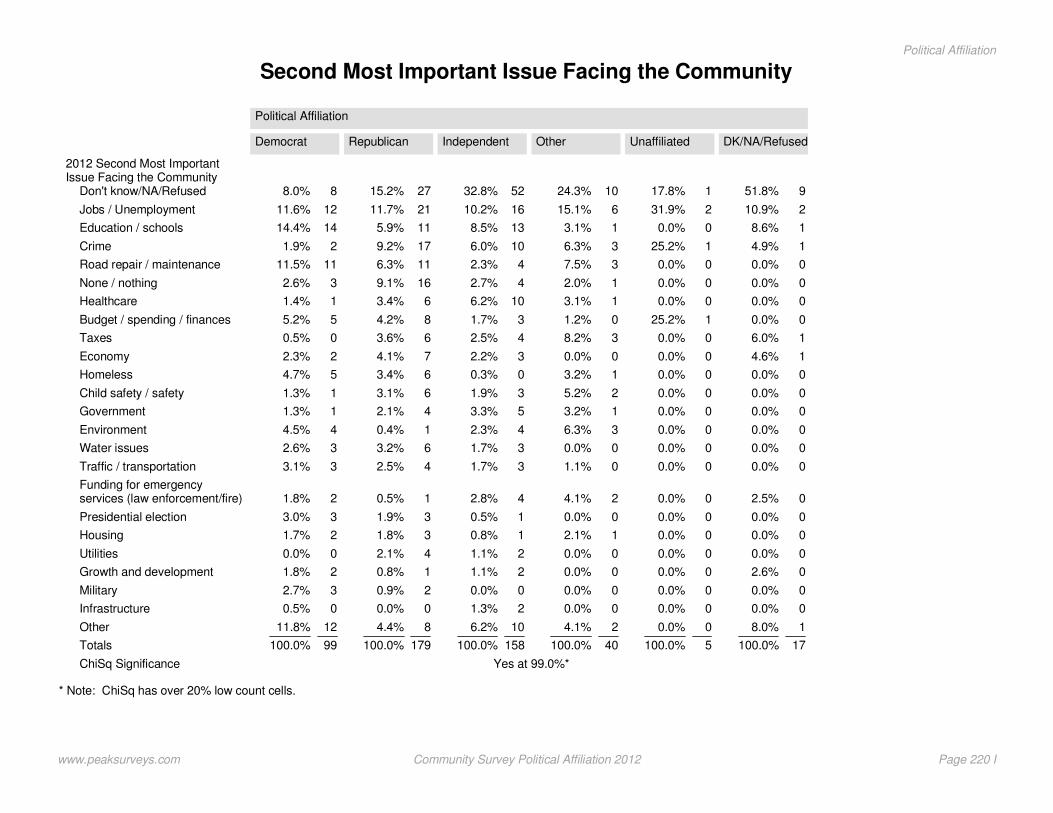
Second Most Important Issue Facing the Community
* Note: ChiSq has over 20% low count cells.
2012 Second Most ImportantIssue Facing the Community
Don't know/NA/Refused
Jobs / Unemployment
Education / schools
Crime
Road repair / maintenance
None / nothing
Healthcare
Budget / spending / finances
Taxes
Economy
Homeless
Child safety / safety
Government
Environment
Water issues
Traffic / transportation
Funding for emergencyservices (law enforcement/fire)
Presidential election
Housing
Utilities
Growth and development
Military
Infrastructure
Other
Totals
ChiSq Significance
Democrat
Political Affiliation
88.0%
1211.6%
1414.4%
21.9%
1111.5%
32.6%
11.4%
55.2%
00.5%
22.3%
54.7%
11.3%
11.3%
44.5%
32.6%
33.1%
21.8%
33.0%
21.7%
00.0%
21.8%
32.7%
00.5%
1211.8%
99100.0%
Yes at 99.0%*
Republican
2715.2%
2111.7%
115.9%
179.2%
116.3%
169.1%
63.4%
84.2%
63.6%
74.1%
63.4%
63.1%
42.1%
10.4%
63.2%
42.5%
10.5%
31.9%
31.8%
42.1%
10.8%
20.9%
00.0%
84.4%
179100.0%
Independent
5232.8%
1610.2%
138.5%
106.0%
42.3%
42.7%
106.2%
31.7%
42.5%
32.2%
00.3%
31.9%
53.3%
42.3%
31.7%
31.7%
42.8%
10.5%
10.8%
21.1%
21.1%
00.0%
21.3%
106.2%
158100.0%
Other
1024.3%
615.1%
13.1%
36.3%
37.5%
12.0%
13.1%
01.2%
38.2%
00.0%
13.2%
25.2%
13.2%
36.3%
00.0%
01.1%
24.1%
00.0%
12.1%
00.0%
00.0%
00.0%
00.0%
24.1%
40100.0%
Unaffiliated
117.8%
231.9%
00.0%
125.2%
00.0%
00.0%
00.0%
125.2%
00.0%
00.0%
00.0%
00.0%
00.0%
00.0%
00.0%
00.0%
00.0%
00.0%
00.0%
00.0%
00.0%
00.0%
00.0%
00.0%
5100.0%
DK/NA/Refused
951.8%
210.9%
18.6%
14.9%
00.0%
00.0%
00.0%
00.0%
16.0%
14.6%
00.0%
00.0%
00.0%
00.0%
00.0%
00.0%
02.5%
00.0%
00.0%
00.0%
02.6%
00.0%
00.0%
18.0%
17100.0%
www.peaksurveys.com Community Survey Political Affiliation 2012 Page 220 I
Political Affiliation
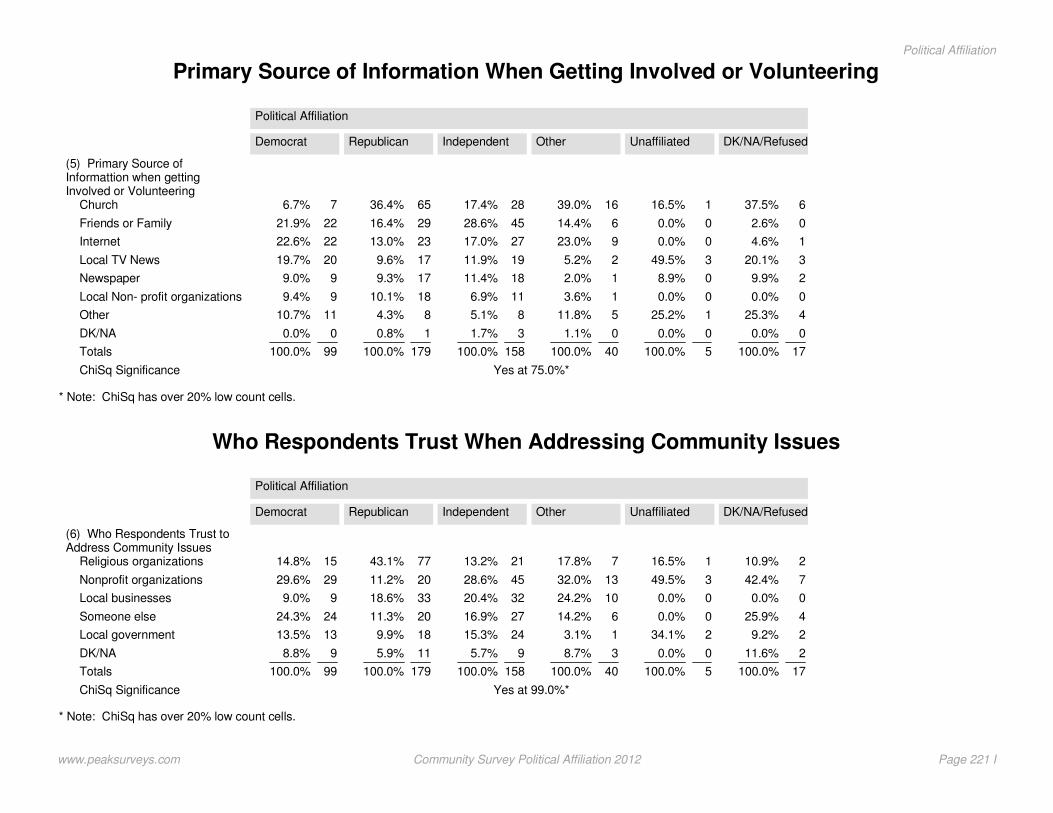
Primary Source of Information When Getting Involved or Volunteering
* Note: ChiSq has over 20% low count cells.
(5) Primary Source ofInformattion when gettingInvolved or Volunteering
Church
Friends or Family
Internet
Local TV News
Newspaper
Local Non- profit organizations
Other
DK/NA
Totals
ChiSq Significance
Democrat
Political Affiliation
76.7%
2221.9%
2222.6%
2019.7%
99.0%
99.4%
1110.7%
00.0%
99100.0%
Yes at 75.0%*
Republican
6536.4%
2916.4%
2313.0%
179.6%
179.3%
1810.1%
84.3%
10.8%
179100.0%
Independent
2817.4%
4528.6%
2717.0%
1911.9%
1811.4%
116.9%
85.1%
31.7%
158100.0%
Other
1639.0%
614.4%
923.0%
25.2%
12.0%
13.6%
511.8%
01.1%
40100.0%
Unaffiliated
116.5%
00.0%
00.0%
349.5%
08.9%
00.0%
125.2%
00.0%
5100.0%
DK/NA/Refused
637.5%
02.6%
14.6%
320.1%
29.9%
00.0%
425.3%
00.0%
17100.0%
Who Respondents Trust When Addressing Community Issues
* Note: ChiSq has over 20% low count cells.
(6) Who Respondents Trust toAddress Community Issues
Religious organizations
Nonprofit organizations
Local businesses
Someone else
Local government
DK/NA
Totals
ChiSq Significance
Democrat
Political Affiliation
1514.8%
2929.6%
99.0%
2424.3%
1313.5%
98.8%
99100.0%
Yes at 99.0%*
Republican
7743.1%
2011.2%
3318.6%
2011.3%
189.9%
115.9%
179100.0%
Independent
2113.2%
4528.6%
3220.4%
2716.9%
2415.3%
95.7%
158100.0%
Other
717.8%
1332.0%
1024.2%
614.2%
13.1%
38.7%
40100.0%
Unaffiliated
116.5%
349.5%
00.0%
00.0%
234.1%
00.0%
5100.0%
DK/NA/Refused
210.9%
742.4%
00.0%
425.9%
29.2%
211.6%
17100.0%
www.peaksurveys.com Community Survey Political Affiliation 2012 Page 221 I
Political Affiliation

Favorability of County Commissioners
* Note: ChiSq has over 20% low count cells.
(7) Favorability of CountyCommissioners
Very favorable
Somewhat favorable
Somewhat unfavorable
Very unfavorable
Never heard of them
DK/NA
Totals
ChiSq Significance
Democrat
Political Affiliation
21.7%
4747.6%
1717.4%
77.2%
1616.2%
1010.0%
99100.0%
Yes at 99.0%*
Republican
2111.5%
7843.7%
148.0%
137.0%
2111.6%
3218.1%
179100.0%
Independent
148.9%
6540.8%
138.3%
1610.1%
2817.6%
2314.3%
158100.0%
Other
12.0%
1025.5%
512.5%
513.3%
49.4%
1537.3%
40100.0%
Unaffiliated
00.0%
234.3%
240.5%
00.0%
125.2%
00.0%
5100.0%
DK/NA/Refused
17.2%
18.6%
17.4%
15.3%
951.8%
319.6%
17100.0%
Favorability of Colorado Springs Mayor
* Note: ChiSq has over 20% low count cells.
Favorability of Colorado SpringsMayor
Very favorable
Somewhat favorable
Somewhat unfavorable
Very unfavorable
Never heard of them
DK/NA
Totals
ChiSq Significance
Democrat
Political Affiliation
46.1%
1928.2%
1726.1%
710.5%
710.6%
1218.6%
67100.0%
Yes at 99.0%*
Republican
4333.2%
5240.5%
42.9%
108.0%
32.5%
1712.8%
129100.0%
Independent
1615.2%
3735.6%
22.2%
1312.5%
1413.4%
2221.0%
104100.0%
Other
621.4%
620.2%
517.4%
01.6%
27.1%
1032.4%
29100.0%
Unaffiliated
234.1%
125.4%
240.5%
00.0%
00.0%
00.0%
5100.0%
DK/NA/Refused
229.6%
225.1%
119.5%
00.0%
06.7%
119.0%
7100.0%
www.peaksurveys.com Community Survey Political Affiliation 2012 Page 222 I
Political Affiliation
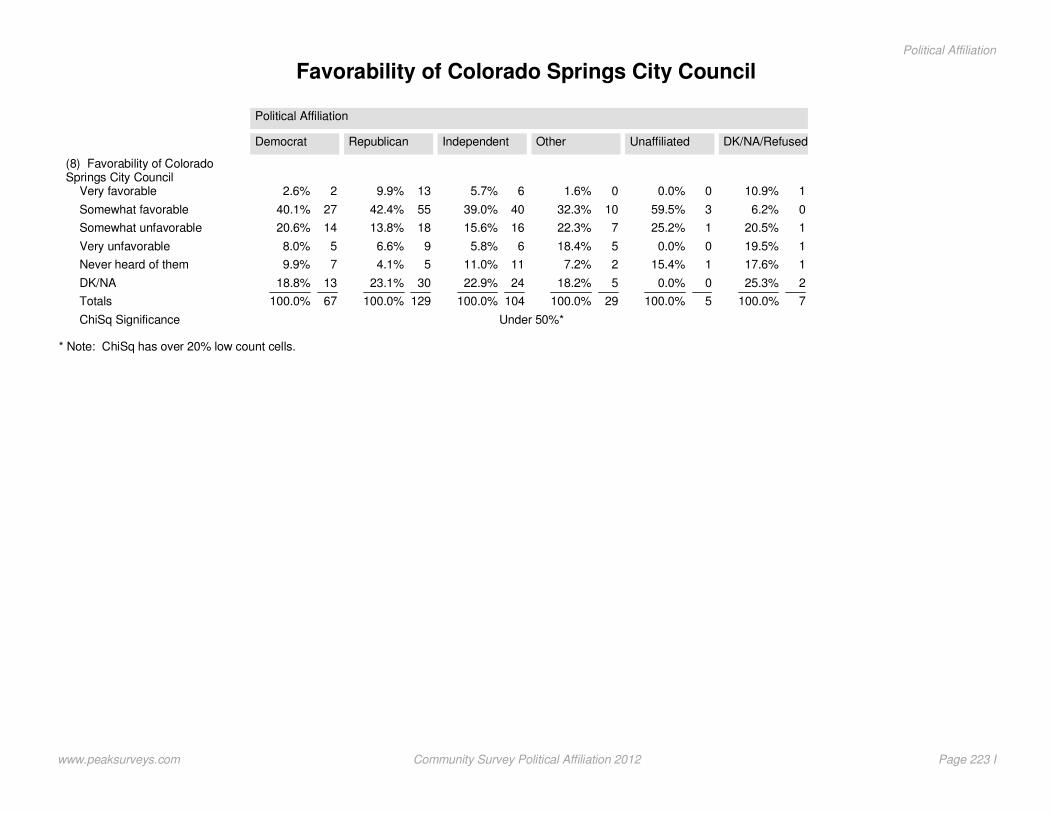
Favorability of Colorado Springs City Council
* Note: ChiSq has over 20% low count cells.
(8) Favorability of ColoradoSprings City Council
Very favorable
Somewhat favorable
Somewhat unfavorable
Very unfavorable
Never heard of them
DK/NA
Totals
ChiSq Significance
Democrat
Political Affiliation
22.6%
2740.1%
1420.6%
58.0%
79.9%
1318.8%
67100.0%
Under 50%*
Republican
139.9%
5542.4%
1813.8%
96.6%
54.1%
3023.1%
129100.0%
Independent
65.7%
4039.0%
1615.6%
65.8%
1111.0%
2422.9%
104100.0%
Other
01.6%
1032.3%
722.3%
518.4%
27.2%
518.2%
29100.0%
Unaffiliated
00.0%
359.5%
125.2%
00.0%
115.4%
00.0%
5100.0%
DK/NA/Refused
110.9%
06.2%
120.5%
119.5%
117.6%
225.3%
7100.0%
www.peaksurveys.com Community Survey Political Affiliation 2012 Page 223 I
Political Affiliation
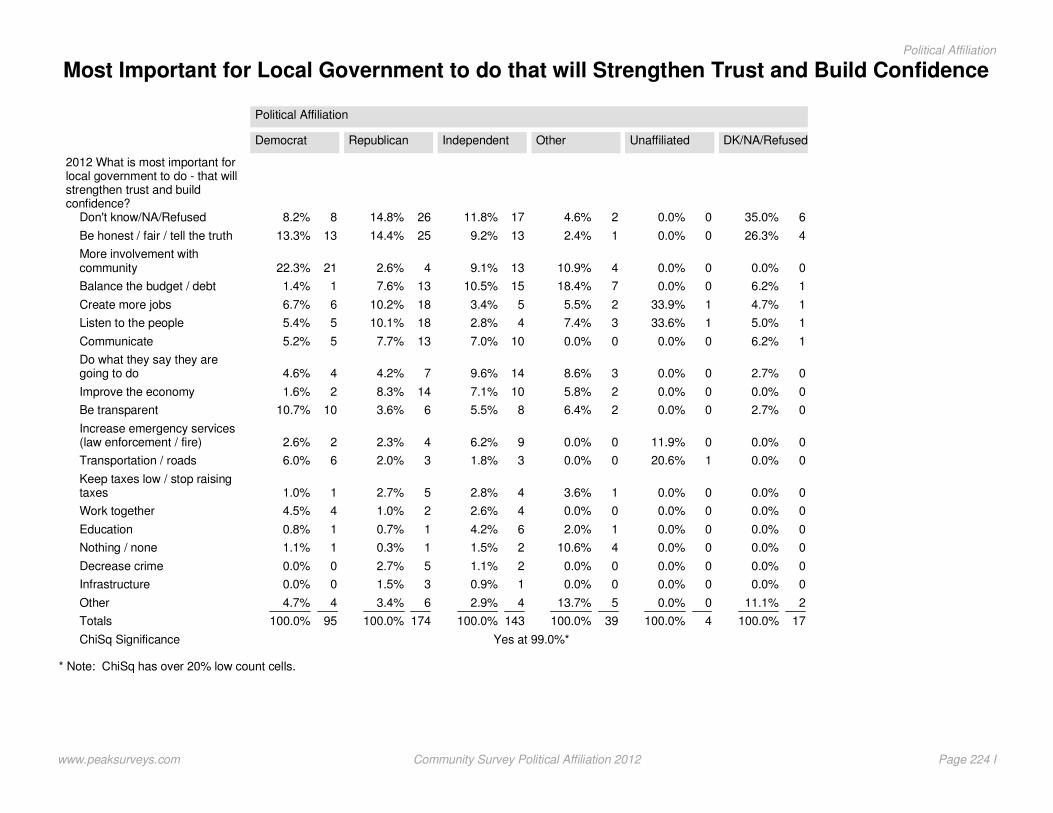
Most Important for Local Government to do that will Strengthen Trust and Build Confidence
* Note: ChiSq has over 20% low count cells.
2012 What is most important forlocal government to do - that willstrengthen trust and buildconfidence?
Don't know/NA/Refused
Be honest / fair / tell the truth
More involvement withcommunity
Balance the budget / debt
Create more jobs
Listen to the people
Communicate
Do what they say they aregoing to do
Improve the economy
Be transparent
Increase emergency services(law enforcement / fire)
Transportation / roads
Keep taxes low / stop raisingtaxes
Work together
Education
Nothing / none
Decrease crime
Infrastructure
Other
Totals
ChiSq Significance
Democrat
Political Affiliation
88.2%
1313.3%
2122.3%
11.4%
66.7%
55.4%
55.2%
44.6%
21.6%
1010.7%
22.6%
66.0%
11.0%
44.5%
10.8%
11.1%
00.0%
00.0%
44.7%
95100.0%
Yes at 99.0%*
Republican
2614.8%
2514.4%
42.6%
137.6%
1810.2%
1810.1%
137.7%
74.2%
148.3%
63.6%
42.3%
32.0%
52.7%
21.0%
10.7%
10.3%
52.7%
31.5%
63.4%
174100.0%
Independent
1711.8%
139.2%
139.1%
1510.5%
53.4%
42.8%
107.0%
149.6%
107.1%
85.5%
96.2%
31.8%
42.8%
42.6%
64.2%
21.5%
21.1%
10.9%
42.9%
143100.0%
Other
24.6%
12.4%
410.9%
718.4%
25.5%
37.4%
00.0%
38.6%
25.8%
26.4%
00.0%
00.0%
13.6%
00.0%
12.0%
410.6%
00.0%
00.0%
513.7%
39100.0%
Unaffiliated
00.0%
00.0%
00.0%
00.0%
133.9%
133.6%
00.0%
00.0%
00.0%
00.0%
011.9%
120.6%
00.0%
00.0%
00.0%
00.0%
00.0%
00.0%
00.0%
4100.0%
DK/NA/Refused
635.0%
426.3%
00.0%
16.2%
14.7%
15.0%
16.2%
02.7%
00.0%
02.7%
00.0%
00.0%
00.0%
00.0%
00.0%
00.0%
00.0%
00.0%
211.1%
17100.0%
www.peaksurveys.com Community Survey Political Affiliation 2012 Page 224 I
Political Affiliation

Positive or Negative Impact of Tabor in the Community
* Note: ChiSq has over 20% low count cells.
(10) Positive or Negative Impactof Tabor in the Community
Generally positive impact
Generally negative impact
Really makes no difference
Don't know enough about it
Never heard of TABOR
DK/NA
Totals
ChiSq Significance
Democrat
Political Affiliation
1717.2%
4545.3%
44.0%
1616.5%
1514.7%
22.3%
99100.0%
Yes at 99.0%*
Republican
6134.2%
4122.7%
74.0%
3016.5%
2212.5%
1810.1%
179100.0%
Independent
5937.4%
3320.7%
42.5%
2314.2%
2918.2%
116.9%
158100.0%
Other
819.7%
717.0%
49.5%
513.6%
1331.8%
38.4%
40100.0%
Unaffiliated
125.2%
240.8%
00.0%
00.0%
08.9%
125.2%
5100.0%
DK/NA/Refused
635.9%
424.2%
13.5%
00.0%
02.8%
633.6%
17100.0%
Favorability of Amending Tabor
* Note: ChiSq has over 20% low count cells.
(11) Favorability of AmendingTABOR?
Strongly favorable
Somewhat favorable
Somewhat unfavorable
Strongly unfavorable
DK/NA
Totals
ChiSq Significance
Democrat
Political Affiliation
3736.9%
2020.7%
22.3%
11.4%
3838.7%
99100.0%
Yes at 95.0%*
Republican
2815.4%
4223.2%
179.5%
179.6%
7642.4%
179100.0%
Independent
2716.9%
4125.9%
1610.4%
117.2%
6339.7%
158100.0%
Other
410.1%
1536.3%
411.0%
36.5%
1436.0%
40100.0%
Unaffiliated
08.9%
241.6%
00.0%
115.4%
234.1%
5100.0%
DK/NA/Refused
18.6%
1057.6%
00.0%
17.5%
526.2%
17100.0%
www.peaksurveys.com Community Survey Political Affiliation 2012 Page 225 I
Political Affiliation
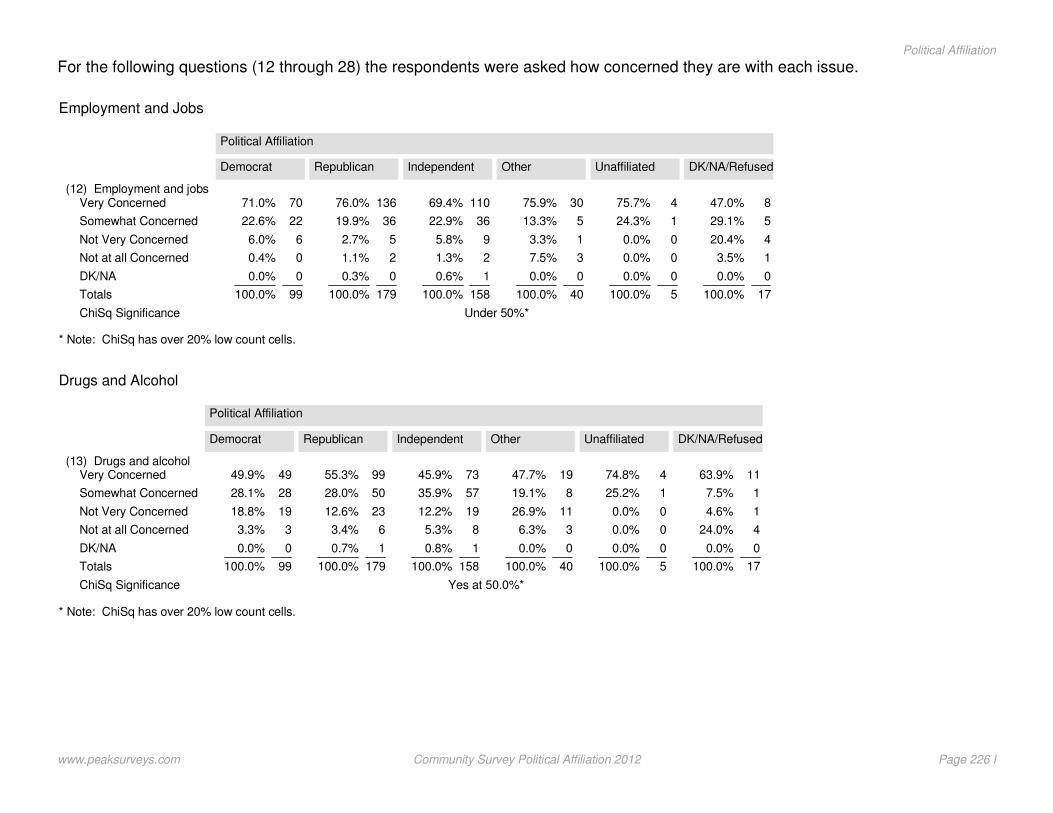
For the following questions (12 through 28) the respondents were asked how concerned they are with each issue.
* Note: ChiSq has over 20% low count cells.
Employment and Jobs
(12) Employment and jobsVery Concerned
Somewhat Concerned
Not Very Concerned
Not at all Concerned
DK/NA
Totals
ChiSq Significance
Democrat
Political Affiliation
7071.0%
2222.6%
66.0%
00.4%
00.0%
99100.0%
Under 50%*
Republican
13676.0%
3619.9%
52.7%
21.1%
00.3%
179100.0%
Independent
11069.4%
3622.9%
95.8%
21.3%
10.6%
158100.0%
Other
3075.9%
513.3%
13.3%
37.5%
00.0%
40100.0%
Unaffiliated
475.7%
124.3%
00.0%
00.0%
00.0%
5100.0%
DK/NA/Refused
847.0%
529.1%
420.4%
13.5%
00.0%
17100.0%
* Note: ChiSq has over 20% low count cells.
Drugs and Alcohol
(13) Drugs and alcoholVery Concerned
Somewhat Concerned
Not Very Concerned
Not at all Concerned
DK/NA
Totals
ChiSq Significance
Democrat
Political Affiliation
4949.9%
2828.1%
1918.8%
33.3%
00.0%
99100.0%
Yes at 50.0%*
Republican
9955.3%
5028.0%
2312.6%
63.4%
10.7%
179100.0%
Independent
7345.9%
5735.9%
1912.2%
85.3%
10.8%
158100.0%
Other
1947.7%
819.1%
1126.9%
36.3%
00.0%
40100.0%
Unaffiliated
474.8%
125.2%
00.0%
00.0%
00.0%
5100.0%
DK/NA/Refused
1163.9%
17.5%
14.6%
424.0%
00.0%
17100.0%
www.peaksurveys.com Community Survey Political Affiliation 2012 Page 226 I
Political Affiliation

* Note: ChiSq has over 20% low count cells.
Growth
(14) GrowthVery Concerned
Somewhat Concerned
Not Very Concerned
Not at all Concerned
DK/NA
Totals
ChiSq Significance
Democrat
Political Affiliation
4040.6%
4039.9%
1313.0%
55.4%
11.1%
99100.0%
Under 50%*
Republican
5329.8%
7642.5%
3117.2%
168.9%
31.7%
179100.0%
Independent
5434.2%
5937.2%
3119.6%
95.6%
53.3%
158100.0%
Other
1024.6%
1843.7%
37.5%
818.9%
25.3%
40100.0%
Unaffiliated
350.5%
349.5%
00.0%
00.0%
00.0%
5100.0%
DK/NA/Refused
316.2%
845.4%
632.5%
16.0%
00.0%
17100.0%
* Note: ChiSq has over 20% low count cells.
Affordable Housing
(15) Affordable housingVery Concerned
Somewhat Concerned
Not Very Concerned
Not at all Concerned
DK/NA
Totals
ChiSq Significance
Democrat
Political Affiliation
6161.2%
2525.3%
1010.4%
33.1%
00.0%
99100.0%
Yes at 99.0%*
Republican
6636.6%
6737.3%
3217.7%
137.2%
21.3%
179100.0%
Independent
6339.8%
5836.4%
2616.6%
106.6%
10.6%
158100.0%
Other
1435.1%
1230.6%
38.4%
1025.8%
00.0%
40100.0%
Unaffiliated
482.2%
08.9%
00.0%
08.9%
00.0%
5100.0%
DK/NA/Refused
424.6%
530.6%
210.6%
425.0%
29.2%
17100.0%
www.peaksurveys.com Community Survey Political Affiliation 2012 Page 227 I
Political Affiliation

* Note: ChiSq has over 20% low count cells.
Health Care Costs
(16) Health care costsVery Concerned
Somewhat Concerned
Not Very Concerned
Not at all Concerned
DK/NA
Totals
ChiSq Significance
Democrat
Political Affiliation
7171.7%
2222.0%
65.7%
10.6%
00.0%
99100.0%
Yes at 75.0%*
Republican
11865.8%
4424.7%
126.7%
52.6%
00.3%
179100.0%
Independent
11270.6%
3723.6%
32.1%
63.7%
00.0%
158100.0%
Other
2868.9%
1026.0%
00.0%
25.0%
00.0%
40100.0%
Unaffiliated
591.1%
08.9%
00.0%
00.0%
00.0%
5100.0%
DK/NA/Refused
635.8%
635.7%
14.6%
424.0%
00.0%
17100.0%
* Note: ChiSq has over 20% low count cells.
Water Supply and Quality
(17) Water supply and qualityVery Concerned
Somewhat Concerned
Not Very Concerned
Not at all Concerned
DK/NA
Totals
ChiSq Significance
Democrat
Political Affiliation
6262.7%
2929.2%
55.0%
33.1%
00.0%
99100.0%
Yes at 95.0%*
Republican
8346.3%
6134.2%
2212.4%
116.3%
10.8%
179100.0%
Independent
9157.2%
4025.1%
1610.3%
106.5%
10.9%
158100.0%
Other
1537.0%
1946.0%
511.5%
24.3%
01.1%
40100.0%
Unaffiliated
475.7%
00.0%
124.3%
00.0%
00.0%
5100.0%
DK/NA/Refused
737.8%
02.6%
529.6%
530.0%
00.0%
17100.0%
www.peaksurveys.com Community Survey Political Affiliation 2012 Page 228 I
Political Affiliation

* Note: ChiSq has over 20% low count cells.
Effective Community Leadership
(18) Effective communityleadership
Very Concerned
Somewhat Concerned
Not Very Concerned
Not at all Concerned
DK/NA
Totals
ChiSq Significance
Democrat
Political Affiliation
6262.3%
2727.6%
77.0%
11.0%
22.1%
99100.0%
Yes at 90.0%*
Republican
8648.2%
6134.1%
115.9%
137.4%
84.5%
179100.0%
Independent
6842.9%
5836.5%
1912.1%
116.7%
31.8%
158100.0%
Other
2357.1%
1128.4%
13.3%
511.3%
00.0%
40100.0%
Unaffiliated
365.9%
125.2%
08.9%
00.0%
00.0%
5100.0%
DK/NA/Refused
634.3%
18.6%
420.4%
424.0%
212.6%
17100.0%
* Note: ChiSq has over 20% low count cells.
Services to Homeless
(19) Services for the homelessVery Concerned
Somewhat Concerned
Not Very Concerned
Not at all Concerned
DK/NA
Totals
ChiSq Significance
Democrat
Political Affiliation
5454.5%
3939.0%
11.3%
44.2%
11.0%
99100.0%
Yes at 99.0%*
Republican
5932.8%
7843.3%
2815.4%
126.5%
32.0%
179100.0%
Independent
6641.7%
7447.0%
1610.3%
21.1%
00.0%
158100.0%
Other
921.8%
1948.3%
12.0%
716.5%
511.5%
40100.0%
Unaffiliated
366.8%
08.9%
115.4%
08.9%
00.0%
5100.0%
DK/NA/Refused
1055.6%
633.6%
14.6%
16.2%
00.0%
17100.0%
www.peaksurveys.com Community Survey Political Affiliation 2012 Page 229 I
Political Affiliation

* Note: ChiSq has over 20% low count cells.
Access to Mental Health
(20) Access to mental healthcare
Very Concerned
Somewhat Concerned
Not Very Concerned
Not at all Concerned
DK/NA
Totals
ChiSq Significance
Democrat
Political Affiliation
5151.1%
3333.1%
1010.2%
55.0%
00.5%
99100.0%
Yes at 75.0%*
Republican
5228.8%
5731.9%
4122.8%
2413.6%
52.9%
179100.0%
Independent
5434.1%
4528.3%
3220.0%
2515.5%
32.1%
158100.0%
Other
1536.9%
1331.7%
410.6%
819.7%
01.1%
40100.0%
Unaffiliated
591.1%
08.9%
00.0%
00.0%
00.0%
5100.0%
DK/NA/Refused
424.2%
634.0%
317.8%
424.0%
00.0%
17100.0%
* Note: ChiSq has over 20% low count cells.
Access to Quality Early Childhood Education
(21) Access to quality earlychildhood education
Very Concerned
Somewhat Concerned
Not Very Concerned
Not at all Concerned
DK/NA
Totals
ChiSq Significance
Democrat
Political Affiliation
5757.1%
2827.9%
99.1%
43.6%
22.3%
99100.0%
Yes at 99.0%*
Republican
6234.5%
6435.5%
3419.1%
169.2%
31.7%
179100.0%
Independent
5333.2%
5836.7%
3018.9%
138.1%
53.1%
158100.0%
Other
1332.7%
1127.9%
38.3%
1229.2%
12.0%
40100.0%
Unaffiliated
350.5%
240.5%
00.0%
08.9%
00.0%
5100.0%
DK/NA/Refused
952.5%
213.6%
02.6%
531.2%
00.0%
17100.0%
www.peaksurveys.com Community Survey Political Affiliation 2012 Page 230 I
Political Affiliation

* Note: ChiSq has over 20% low count cells.
Student Achievement
(22) Student AchievementVery Concerned
Somewhat Concerned
Not Very Concerned
Not at all Concerned
DK/NA
Totals
ChiSq Significance
Democrat
Political Affiliation
6868.7%
2323.3%
54.8%
11.5%
21.7%
99100.0%
Yes at 75.0%*
Republican
8647.9%
7441.3%
105.8%
74.0%
21.0%
179100.0%
Independent
8352.4%
4931.1%
1710.8%
74.5%
21.1%
158100.0%
Other
1948.3%
1024.7%
614.6%
512.4%
00.0%
40100.0%
Unaffiliated
359.2%
125.4%
115.4%
00.0%
00.0%
5100.0%
DK/NA/Refused
632.3%
636.7%
210.6%
420.4%
00.0%
17100.0%
* Note: ChiSq has over 20% low count cells.
Arts and Culture Opportunities
(23) Arts and cultureopportunities
Very Concerned
Somewhat Concerned
Not Very Concerned
Not at all Concerned
DK/NA
Totals
ChiSq Significance
Democrat
Political Affiliation
3534.9%
3636.7%
1717.2%
1111.3%
00.0%
99100.0%
Yes at 90.0%*
Republican
2916.0%
5229.2%
6234.4%
3318.7%
31.7%
179100.0%
Independent
2918.2%
5031.7%
5333.3%
2616.3%
10.6%
158100.0%
Other
613.8%
1435.4%
513.1%
1435.7%
12.0%
40100.0%
Unaffiliated
234.1%
241.6%
115.4%
08.9%
00.0%
5100.0%
DK/NA/Refused
636.5%
739.2%
316.2%
18.1%
00.0%
17100.0%
www.peaksurveys.com Community Survey Political Affiliation 2012 Page 231 I
Political Affiliation

* Note: ChiSq has over 20% low count cells.
Crime Rate
(24) Crime rateVery Concerned
Somewhat Concerned
Not Very Concerned
Not at all Concerned
DK/NA
Totals
ChiSq Significance
Democrat
Political Affiliation
6061.0%
2524.9%
1413.7%
00.5%
00.0%
99100.0%
Yes at 50.0%*
Republican
10257.1%
5128.6%
1810.3%
52.7%
21.3%
179100.0%
Independent
8050.7%
4427.7%
2415.4%
96.0%
00.3%
158100.0%
Other
2253.6%
1433.7%
49.5%
13.1%
00.0%
40100.0%
Unaffiliated
484.6%
115.4%
00.0%
00.0%
00.0%
5100.0%
DK/NA/Refused
527.2%
739.6%
212.7%
420.4%
00.0%
17100.0%
* Note: ChiSq has over 20% low count cells.
Voter Participation
(25) Voter participationVery Concerned
Somewhat Concerned
Not Very Concerned
Not at all Concerned
DK/NA
Totals
ChiSq Significance
Democrat
Political Affiliation
6161.1%
2727.5%
88.4%
21.8%
11.2%
99100.0%
Yes at 99.0%*
Republican
10357.4%
4927.3%
126.4%
158.2%
10.7%
179100.0%
Independent
6742.3%
5132.2%
2817.7%
116.8%
10.9%
158100.0%
Other
1638.6%
1127.1%
512.9%
717.7%
13.6%
40100.0%
Unaffiliated
483.5%
116.5%
00.0%
00.0%
00.0%
5100.0%
DK/NA/Refused
526.9%
529.6%
13.5%
529.1%
210.9%
17100.0%
www.peaksurveys.com Community Survey Political Affiliation 2012 Page 232 I
Political Affiliation

* Note: ChiSq has over 20% low count cells.
Community Engagement in Local Issues
(26) Community engagement inlocal issues
Very Concerned
Somewhat Concerned
Not Very Concerned
Not at all Concerned
DK/NA
Totals
ChiSq Significance
Democrat
Political Affiliation
4040.7%
3939.2%
1615.8%
43.7%
10.6%
99100.0%
Yes at 95.0%*
Republican
5228.9%
8145.3%
3117.1%
95.3%
63.5%
179100.0%
Independent
3119.6%
8553.9%
2515.9%
117.2%
53.4%
158100.0%
Other
1230.2%
1536.9%
921.6%
511.3%
00.0%
40100.0%
Unaffiliated
08.9%
591.1%
00.0%
00.0%
00.0%
5100.0%
DK/NA/Refused
740.5%
422.3%
14.6%
632.6%
00.0%
17100.0%
* Note: ChiSq has over 20% low count cells.
Public Transit
(27) Public transitVery Concerned
Somewhat Concerned
Not Very Concerned
Not at all Concerned
DK/NA
Totals
ChiSq Significance
Democrat
Political Affiliation
4141.1%
3030.3%
2020.5%
76.8%
11.4%
99100.0%
Under 50%*
Republican
3921.9%
7139.6%
4525.0%
2212.3%
21.2%
179100.0%
Independent
4528.5%
5836.9%
2817.5%
2012.8%
74.4%
158100.0%
Other
1126.1%
1126.7%
1126.3%
819.7%
01.1%
40100.0%
Unaffiliated
241.6%
240.5%
08.9%
08.9%
00.0%
5100.0%
DK/NA/Refused
425.1%
739.1%
632.2%
13.5%
00.0%
17100.0%
www.peaksurveys.com Community Survey Political Affiliation 2012 Page 233 I
Political Affiliation

* Note: ChiSq has over 20% low count cells.
Land Use
(28) Land useVery Concerned
Somewhat Concerned
Not Very Concerned
Not at all Concerned
DK/NA
Totals
ChiSq Significance
Democrat
Political Affiliation
3333.2%
4747.0%
1312.6%
55.3%
21.8%
99100.0%
Under 50%*
Republican
4525.0%
8145.1%
3519.5%
126.5%
73.9%
179100.0%
Independent
5132.1%
6340.0%
3521.9%
63.7%
42.3%
158100.0%
Other
1229.6%
1333.6%
922.3%
13.2%
511.4%
40100.0%
Unaffiliated
350.5%
349.5%
00.0%
00.0%
00.0%
5100.0%
DK/NA/Refused
636.4%
742.3%
15.1%
18.1%
18.0%
17100.0%
www.peaksurveys.com Community Survey Political Affiliation 2012 Page 234 I
Political Affiliation

Section I
Political Affiliationquality of life
Peak Surveys
www.peaksurveys.com
Community and QLI Survey 2012

Political Affiliation
Economic Vision
* Note: ChiSq has over 20% low count cells.
How Respondents Feel Local Economy Compares to the National Economy
(3) How do you feel the localeconomy compares to thenational economy?
Same as national economy
Better than national economy
Worse than national economy
Much better than nationaleconomy
Much worse than nationaleconomy
Totals
ChiSq Significance
Democrat
Do you consider yourself a Democrat, Republican, an Independent or something else?
4646.41%
3736.96%
1313.43%
21.80%
11.39%
99100.00%
Under 50%*
Republican
7139.60%
7240.07%
179.62%
1810.20%
10.51%
179100.00%
Independent
7446.52%
5836.88%
148.98%
95.71%
31.91%
158100.00%
Other
1640.42%
2151.97%
24.54%
13.08%
00.00%
40100.00%
Unaffiliated (notread)
240.79%
234.06%
125.15%
00.00%
00.00%
5100.00%
Don't know/NA(not read)
848.88%
739.84%
16.01%
02.63%
02.63%
17100.00%
www.peaksurveys.com QLI Political Affiliation 2012 236 I
Political Affiliation

Environment
* Note: ChiSq has over 20% low count cells.
Q:8 What do you think the biggest environmental challenge is facing the Pikes Peak Region today?
(8) What do you think thebiggest environmental challengeis facing the Pikes Peak Regiontoday?
Water supply
Energy supply
Recycling
Air quality
Water quality
Other
Totals
ChiSq Significance
Democrat
Do you consider yourself a Democrat, Republican, an Independent or something else?
4040.66%
1919.33%
54.83%
1515.47%
99.03%
1110.68%
99100.00%
Yes at 99.0%*
Republican
8648.24%
2514.20%
3016.79%
2111.99%
52.98%
105.80%
179100.00%
Independent
6239.44%
2214.00%
2012.87%
116.84%
137.90%
3018.95%
158100.00%
Other
1538.07%
37.28%
513.57%
49.39%
24.43%
1127.27%
40100.00%
Unaffiliated (notread)
116.48%
00.00%
125.15%
124.31%
234.06%
00.00%
5100.00%
Don't know/NA(not read)
319.57%
210.76%
425.91%
315.08%
18.25%
420.43%
17100.00%
www.peaksurveys.com QLI Political Affiliation 2012 237 I
Political Affiliation

Arts and Culture
* Note: ChiSq has over 20% low count cells.
Essentiality of Parks, Recreation, Trails and Open Spaces to Respondents
Parks, recreation, trails and openspaces are essential to mycommunity.
Strongly Agree
Agree
Disagree
Strongly Disagree
Totals
ChiSq Significance
Democrat
Do you consider yourself a Democrat, Republican, an Independent or something else?
7070.77%
2727.11%
22.12%
00.00%
99100.00%
Yes at 99.0%*
Republican
8647.75%
8245.76%
116.02%
10.47%
179100.00%
Independent
9157.45%
6038.17%
63.52%
10.86%
158100.00%
Other
2459.13%
1230.60%
00.00%
410.28%
40100.00%
Unaffiliated(not read)
475.69%
124.31%
00.00%
00.00%
5100.00%
Don't know/NA(not read)
1479.03%
420.97%
00.00%
00.00%
17100.00%
* Note: ChiSq has over 20% low count cells.
Respondents Satisfaction with Level of Maintenance and Service
I am satisfied with the level ofmaintenance and service inparks, recreation, trails and openspaces.
Strongly Agree
Agree
Disagree
Strongly Disagree
Totals
ChiSq Significance
Democrat
Do you consider yourself a Democrat, Republican, an Independent or something else?
1514.78%
4949.67%
2423.99%
1111.56%
99100.00%
Yes at 50.0%*
Republican
3922.02%
9653.37%
3821.40%
63.21%
179100.00%
Independent
2314.32%
9660.92%
2716.97%
127.79%
158100.00%
Other
819.88%
2254.74%
513.14%
512.24%
40100.00%
Unaffiliated(not read)
08.91%
482.18%
08.91%
00.00%
5100.00%
Don't know/NA(not read)
211.49%
951.41%
637.10%
00.00%
17100.00%
www.peaksurveys.com QLI Political Affiliation 2012 238 I
Political Affiliation
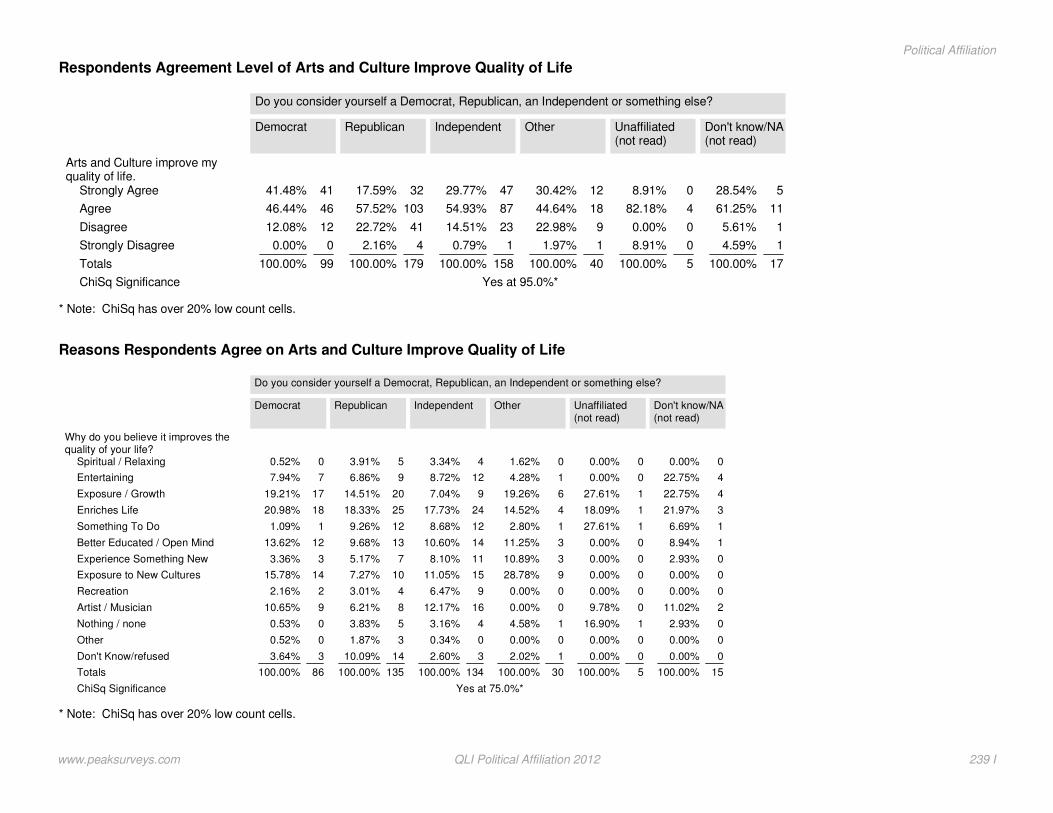
* Note: ChiSq has over 20% low count cells.
Respondents Agreement Level of Arts and Culture Improve Quality of Life
Arts and Culture improve myquality of life.
Strongly Agree
Agree
Disagree
Strongly Disagree
Totals
ChiSq Significance
Democrat
Do you consider yourself a Democrat, Republican, an Independent or something else?
4141.48%
4646.44%
1212.08%
00.00%
99100.00%
Yes at 95.0%*
Republican
3217.59%
10357.52%
4122.72%
42.16%
179100.00%
Independent
4729.77%
8754.93%
2314.51%
10.79%
158100.00%
Other
1230.42%
1844.64%
922.98%
11.97%
40100.00%
Unaffiliated(not read)
08.91%
482.18%
00.00%
08.91%
5100.00%
Don't know/NA(not read)
528.54%
1161.25%
15.61%
14.59%
17100.00%
* Note: ChiSq has over 20% low count cells.
Reasons Respondents Agree on Arts and Culture Improve Quality of Life
Why do you believe it improves thequality of your life?
Spiritual / Relaxing
Entertaining
Exposure / Growth
Enriches Life
Something To Do
Better Educated / Open Mind
Experience Something New
Exposure to New Cultures
Recreation
Artist / Musician
Nothing / none
Other
Don't Know/refused
Totals
ChiSq Significance
Democrat
Do you consider yourself a Democrat, Republican, an Independent or something else?
00.52%
77.94%
1719.21%
1820.98%
11.09%
1213.62%
33.36%
1415.78%
22.16%
910.65%
00.53%
00.52%
33.64%
86100.00%
Yes at 75.0%*
Republican
53.91%
96.86%
2014.51%
2518.33%
129.26%
139.68%
75.17%
107.27%
43.01%
86.21%
53.83%
31.87%
1410.09%
135100.00%
Independent
43.34%
128.72%
97.04%
2417.73%
128.68%
1410.60%
118.10%
1511.05%
96.47%
1612.17%
43.16%
00.34%
32.60%
134100.00%
Other
01.62%
14.28%
619.26%
414.52%
12.80%
311.25%
310.89%
928.78%
00.00%
00.00%
14.58%
00.00%
12.02%
30100.00%
Unaffiliated(not read)
00.00%
00.00%
127.61%
118.09%
127.61%
00.00%
00.00%
00.00%
00.00%
09.78%
116.90%
00.00%
00.00%
5100.00%
Don't know/NA(not read)
00.00%
422.75%
422.75%
321.97%
16.69%
18.94%
02.93%
00.00%
00.00%
211.02%
02.93%
00.00%
00.00%
15100.00%
www.peaksurveys.com QLI Political Affiliation 2012 239 I
Political Affiliation
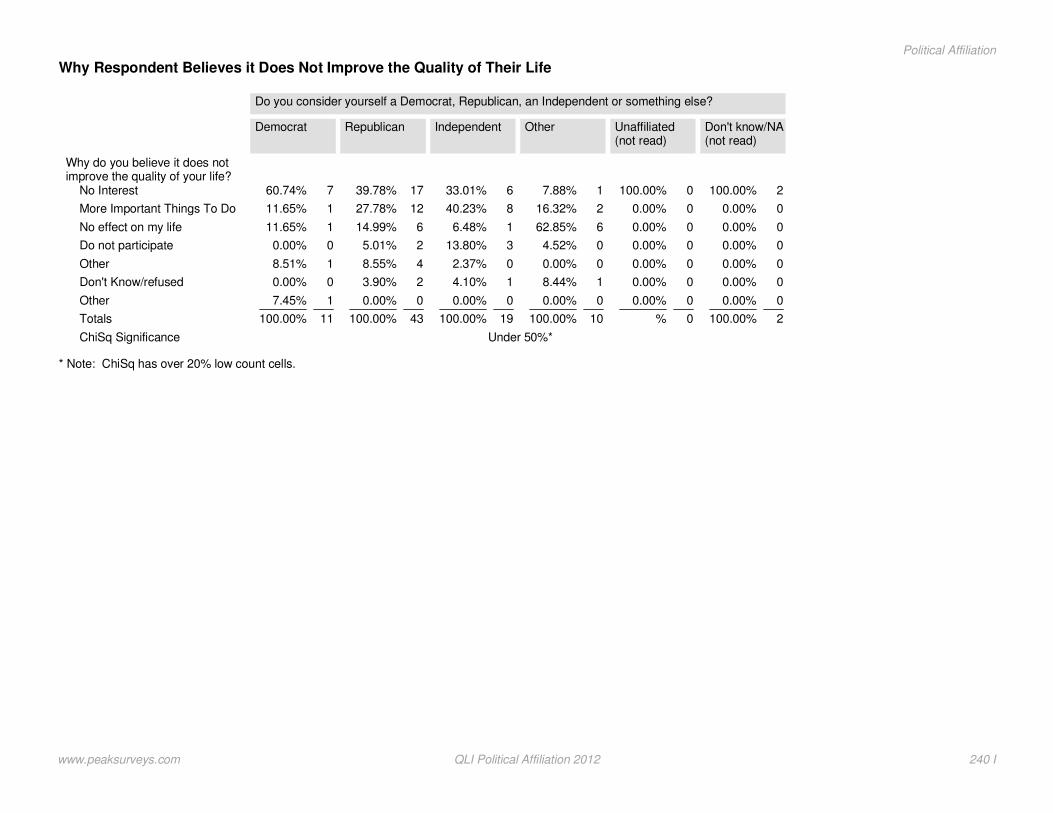
* Note: ChiSq has over 20% low count cells.
Why Respondent Believes it Does Not Improve the Quality of Their Life
Why do you believe it does notimprove the quality of your life?
No Interest
More Important Things To Do
No effect on my life
Do not participate
Other
Don't Know/refused
Other
Totals
ChiSq Significance
Democrat
Do you consider yourself a Democrat, Republican, an Independent or something else?
760.74%
111.65%
111.65%
00.00%
18.51%
00.00%
17.45%
11100.00%
Under 50%*
Republican
1739.78%
1227.78%
614.99%
25.01%
48.55%
23.90%
00.00%
43100.00%
Independent
633.01%
840.23%
16.48%
313.80%
02.37%
14.10%
00.00%
19100.00%
Other
17.88%
216.32%
662.85%
04.52%
00.00%
18.44%
00.00%
10100.00%
Unaffiliated(not read)
0100.00%
00.00%
00.00%
00.00%
00.00%
00.00%
00.00%
0%
Don't know/NA(not read)
2100.00%
00.00%
00.00%
00.00%
00.00%
00.00%
00.00%
2100.00%
www.peaksurveys.com QLI Political Affiliation 2012 240 I
Political Affiliation

Public Safety
* Note: ChiSq has over 20% low count cells.
Safety Walking in Neighborhood at Night
(19) How safe do you feelwalking in your neighborhoodduring the night?
Very safe
Somewhat safe
Somewhat unsafe
Very unsafe
Totals
ChiSq Significance
Democrat
Do you consider yourself a Democrat, Republican, an Independent or something else?
4444.80%
2222.53%
1818.48%
1414.18%
99100.00%
Yes at 99.0%*
Republican
9251.29%
5631.32%
2011.11%
116.27%
179100.00%
Independent
8956.26%
5333.65%
127.66%
42.43%
158100.00%
Other
2869.97%
1127.38%
00.00%
12.64%
40100.00%
Unaffiliated (notread)
240.55%
242.97%
00.00%
116.48%
5100.00%
Don't know/NA (notread)
955.14%
422.02%
00.00%
422.84%
17100.00%
www.peaksurveys.com QLI Political Affiliation 2012 241 I
Political Affiliation
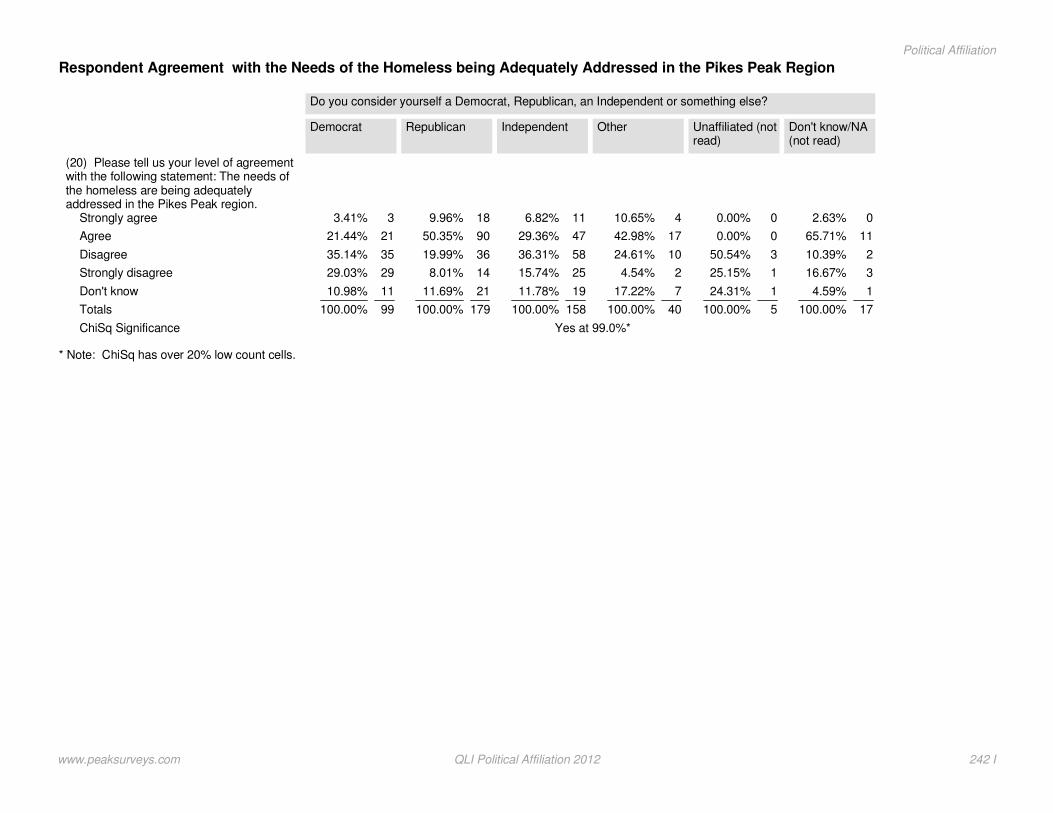
* Note: ChiSq has over 20% low count cells.
Respondent Agreement with the Needs of the Homeless being Adequately Addressed in the Pikes Peak Region
(20) Please tell us your level of agreementwith the following statement: The needs ofthe homeless are being adequatelyaddressed in the Pikes Peak region.
Strongly agree
Agree
Disagree
Strongly disagree
Don't know
Totals
ChiSq Significance
Democrat
Do you consider yourself a Democrat, Republican, an Independent or something else?
33.41%
2121.44%
3535.14%
2929.03%
1110.98%
99100.00%
Yes at 99.0%*
Republican
189.96%
9050.35%
3619.99%
148.01%
2111.69%
179100.00%
Independent
116.82%
4729.36%
5836.31%
2515.74%
1911.78%
158100.00%
Other
410.65%
1742.98%
1024.61%
24.54%
717.22%
40100.00%
Unaffiliated (notread)
00.00%
00.00%
350.54%
125.15%
124.31%
5100.00%
Don't know/NA(not read)
02.63%
1165.71%
210.39%
316.67%
14.59%
17100.00%
www.peaksurveys.com QLI Political Affiliation 2012 242 I
Political Affiliation
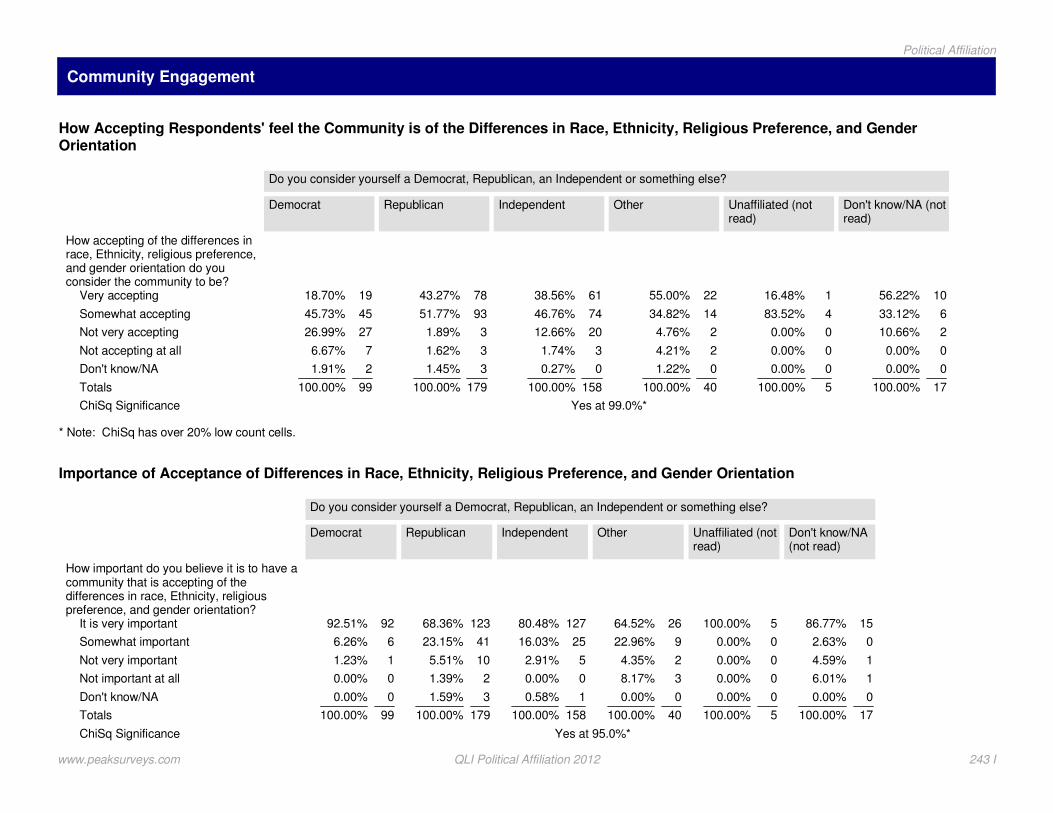
Community Engagement
* Note: ChiSq has over 20% low count cells.
How Accepting Respondents' feel the Community is of the Differences in Race, Ethnicity, Religious Preference, and GenderOrientation
How accepting of the differences inrace, Ethnicity, religious preference,and gender orientation do youconsider the community to be?
Very accepting
Somewhat accepting
Not very accepting
Not accepting at all
Don't know/NA
Totals
ChiSq Significance
Democrat
Do you consider yourself a Democrat, Republican, an Independent or something else?
1918.70%
4545.73%
2726.99%
76.67%
21.91%
99100.00%
Yes at 99.0%*
Republican
7843.27%
9351.77%
31.89%
31.62%
31.45%
179100.00%
Independent
6138.56%
7446.76%
2012.66%
31.74%
00.27%
158100.00%
Other
2255.00%
1434.82%
24.76%
24.21%
01.22%
40100.00%
Unaffiliated (notread)
116.48%
483.52%
00.00%
00.00%
00.00%
5100.00%
Don't know/NA (notread)
1056.22%
633.12%
210.66%
00.00%
00.00%
17100.00%
Importance of Acceptance of Differences in Race, Ethnicity, Religious Preference, and Gender Orientation
How important do you believe it is to have acommunity that is accepting of thedifferences in race, Ethnicity, religiouspreference, and gender orientation?
It is very important
Somewhat important
Not very important
Not important at all
Don't know/NA
Totals
ChiSq Significance
Democrat
Do you consider yourself a Democrat, Republican, an Independent or something else?
9292.51%
66.26%
11.23%
00.00%
00.00%
99100.00%
Yes at 95.0%*
Republican
12368.36%
4123.15%
105.51%
21.39%
31.59%
179100.00%
Independent
12780.48%
2516.03%
52.91%
00.00%
10.58%
158100.00%
Other
2664.52%
922.96%
24.35%
38.17%
00.00%
40100.00%
Unaffiliated (notread)
5100.00%
00.00%
00.00%
00.00%
00.00%
5100.00%
Don't know/NA(not read)
1586.77%
02.63%
14.59%
16.01%
00.00%
17100.00%
www.peaksurveys.com QLI Political Affiliation 2012 243 I
Political Affiliation

* Note: ChiSq has over 20% low count cells.
* Note: ChiSq has over 20% low count cells.
Frequency of Charitable or Voluntary Service in the Last 12 Months
During the last 12 months howoften did you or other members ofyour household spend on charitableor voluntary service activities?
More than once a week
Several times a month
Once a month
Once or twice a quarter
Rarely
Never
Don't know/NA
Totals
ChiSq Significance
Democrat
Do you consider yourself a Democrat, Republican, an Independent or something else?
65.67%
2322.73%
1313.47%
1918.76%
2121.08%
1818.29%
00.00%
99100.00%
Yes at 50.0%*
Republican
3318.19%
3418.99%
2915.96%
2715.06%
2614.55%
3016.72%
10.54%
179100.00%
Independent
2012.40%
3019.04%
3220.01%
3421.71%
2918.12%
137.94%
10.78%
158100.00%
Other
718.16%
511.33%
1023.95%
38.12%
820.59%
717.86%
00.00%
40100.00%
Unaffiliated (notread)
00.00%
00.00%
00.00%
125.39%
234.06%
240.55%
00.00%
5100.00%
Don't know/NA (notread)
212.94%
953.92%
213.23%
02.63%
00.00%
28.81%
18.46%
17100.00%
Frequency of Donating Money or Property in the Last 12 Months
How often have you or other members of yourhousehold donated money or property to charity in thelast 12 months? By donating I mean making a voluntarycontribution with no intention of making a profi
Weekly
Monthly
Quarterly
Occasionally
Never
Don't know/NA
Totals
ChiSq Significance
Democrat
Do you consider yourself a Democrat, Republican, an Independent or something else?
55.23%
3737.11%
2423.81%
3030.36%
33.04%
00.46%
99100.00%
Yes at 75.0%*
Republican
3720.84%
6536.02%
3318.69%
3217.89%
116.30%
00.26%
179100.00%
Independent
2012.64%
6038.03%
3119.36%
3924.47%
84.74%
10.77%
158100.00%
Other
818.77%
1538.48%
921.96%
716.56%
24.23%
00.00%
40100.00%
Unaffiliated (notread)
115.40%
241.63%
00.00%
242.97%
00.00%
00.00%
5100.00%
Don't know/NA(not read)
17.55%
1057.77%
18.08%
16.17%
420.43%
00.00%
17100.00%
www.peaksurveys.com QLI Political Affiliation 2012 244 I
Political Affiliation

* Note: ChiSq has over 20% low count cells.
* Note: ChiSq has over 20% low count cells.
Attendance at Public Meetings where there was a Discussion on Community Affairs
(25) In the last year, have youattended any public meetings inwhich there was discussion ofcommunity affairs?
Yes
No
Other
Totals
ChiSq Significance
Democrat
Do you consider yourself a Democrat, Republican, an Independent or something else?
3736.90%
6262.60%
00.49%
99100.00%
Under 50%*
Republican
5429.99%
12570.01%
00.00%
179100.00%
Independent
4729.75%
11170.25%
00.00%
158100.00%
Other
1538.40%
2561.60%
00.00%
40100.00%
Unaffiliated (notread)
116.48%
483.52%
00.00%
5100.00%
Don't know/NA(not read)
528.72%
1271.28%
00.00%
17100.00%
www.peaksurveys.com QLI Political Affiliation 2012 245 I
Political Affiliation
Section J
regioncommunity survey
Peak Surveys
www.peaksurveys.com
Community and QLI Survey 2012

Region
* Note: ChiSq has over 20% low count cells.
Overall Quality of Life in the Community
(1) Overall Quality of Life in theCommunity
Excellent
Good
Fair
Poor
DK/NA
Totals
ChiSq Significance
North
Regional Zips
5635.8%
9360.4%
53.4%
10.4%
00.0%
155100.0%
Under 50%*
South
3431.9%
6258.3%
66.0%
43.9%
00.0%
106100.0%
East
2832.9%
5058.2%
21.9%
56.0%
10.9%
86100.0%
West
2529.8%
4958.7%
67.6%
22.6%
11.3%
83100.0%
Community Headed in Right or Wrong Direction
(2) Community Headed in theRight direction or Wrong direction
Right Direction
Wrong Direction
DK/NA
Totals
ChiSq Significance
North
Regional Zips
11473.4%
2516.3%
1610.3%
155100.0%
Yes at 50.0%
South
6662.6%
2624.4%
1413.0%
106100.0%
East
5261.2%
2731.3%
67.5%
86100.0%
West
5263.2%
1822.3%
1214.5%
83100.0%
Other/Refused
0
0
0
0%
Most Important Issue Facing the Community
2012 Most Important IssueFacing the Community
Jobs / Unemployment
Economy
Don't know/NA/Refused
Crime
Education / schools
Other
Totals
ChiSq Significance
North
Regional Zips
3925.5%
2113.7%
85.3%
1811.4%
74.7%
6139.4%
155100.0%
Yes at 99.0%
South
87.9%
109.3%
1513.9%
76.9%
109.0%
5653.0%
106100.0%
East
910.3%
77.7%
1416.9%
910.4%
1011.1%
3743.5%
86100.0%
West
1922.5%
1518.5%
56.6%
67.2%
910.6%
2934.6%
83100.0%
www.peaksurveys.com Community Survey Region 2012 Page 247 J
Region
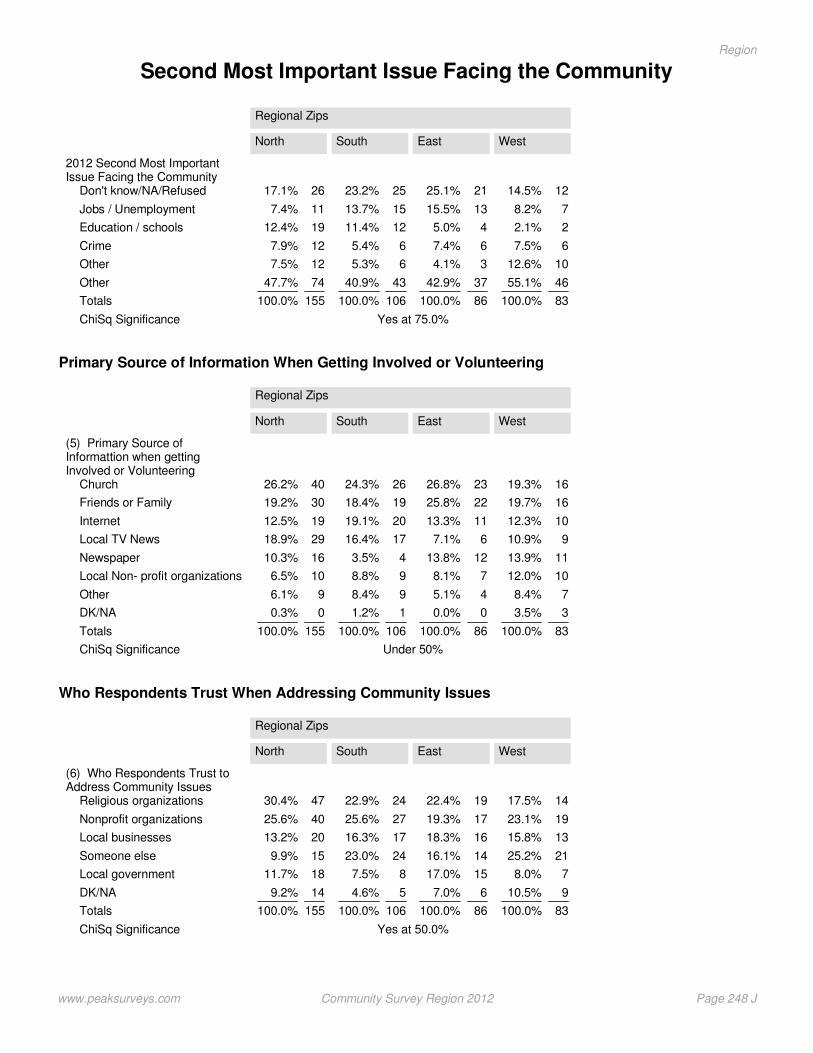
Second Most Important Issue Facing the Community
2012 Second Most ImportantIssue Facing the Community
Don't know/NA/Refused
Jobs / Unemployment
Education / schools
Crime
Other
Other
Totals
ChiSq Significance
North
Regional Zips
2617.1%
117.4%
1912.4%
127.9%
127.5%
7447.7%
155100.0%
Yes at 75.0%
South
2523.2%
1513.7%
1211.4%
65.4%
65.3%
4340.9%
106100.0%
East
2125.1%
1315.5%
45.0%
67.4%
34.1%
3742.9%
86100.0%
West
1214.5%
78.2%
22.1%
67.5%
1012.6%
4655.1%
83100.0%
Primary Source of Information When Getting Involved or Volunteering
(5) Primary Source ofInformattion when gettingInvolved or Volunteering
Church
Friends or Family
Internet
Local TV News
Newspaper
Local Non- profit organizations
Other
DK/NA
Totals
ChiSq Significance
North
Regional Zips
4026.2%
3019.2%
1912.5%
2918.9%
1610.3%
106.5%
96.1%
00.3%
155100.0%
Under 50%
South
2624.3%
1918.4%
2019.1%
1716.4%
43.5%
98.8%
98.4%
11.2%
106100.0%
East
2326.8%
2225.8%
1113.3%
67.1%
1213.8%
78.1%
45.1%
00.0%
86100.0%
West
1619.3%
1619.7%
1012.3%
910.9%
1113.9%
1012.0%
78.4%
33.5%
83100.0%
Who Respondents Trust When Addressing Community Issues
(6) Who Respondents Trust toAddress Community Issues
Religious organizations
Nonprofit organizations
Local businesses
Someone else
Local government
DK/NA
Totals
ChiSq Significance
North
Regional Zips
4730.4%
4025.6%
2013.2%
159.9%
1811.7%
149.2%
155100.0%
Yes at 50.0%
South
2422.9%
2725.6%
1716.3%
2423.0%
87.5%
54.6%
106100.0%
East
1922.4%
1719.3%
1618.3%
1416.1%
1517.0%
67.0%
86100.0%
West
1417.5%
1923.1%
1315.8%
2125.2%
78.0%
910.5%
83100.0%
www.peaksurveys.com Community Survey Region 2012 Page 248 J
Region
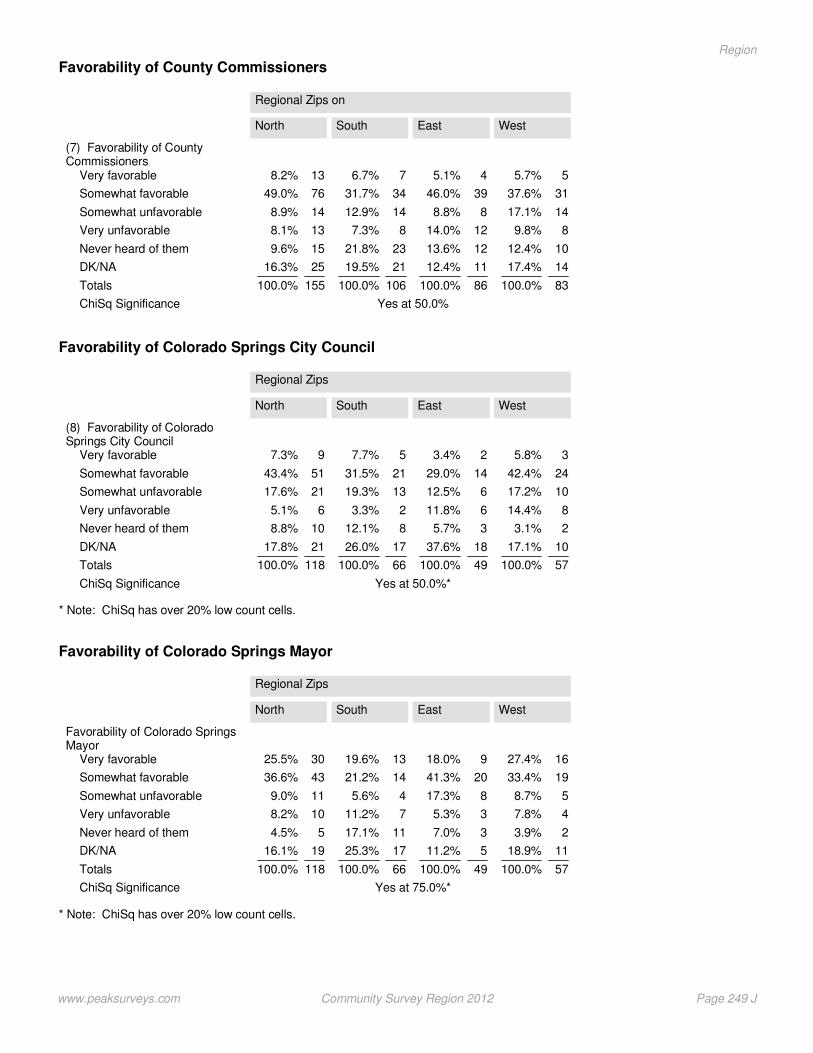
Favorability of County Commissioners
(7) Favorability of CountyCommissioners
Very favorable
Somewhat favorable
Somewhat unfavorable
Very unfavorable
Never heard of them
DK/NA
Totals
ChiSq Significance
North
Regional Zips on
138.2%
7649.0%
148.9%
138.1%
159.6%
2516.3%
155100.0%
Yes at 50.0%
South
76.7%
3431.7%
1412.9%
87.3%
2321.8%
2119.5%
106100.0%
East
45.1%
3946.0%
88.8%
1214.0%
1213.6%
1112.4%
86100.0%
West
55.7%
3137.6%
1417.1%
89.8%
1012.4%
1417.4%
83100.0%
* Note: ChiSq has over 20% low count cells.
Favorability of Colorado Springs City Council
(8) Favorability of ColoradoSprings City Council
Very favorable
Somewhat favorable
Somewhat unfavorable
Very unfavorable
Never heard of them
DK/NA
Totals
ChiSq Significance
North
Regional Zips
97.3%
5143.4%
2117.6%
65.1%
108.8%
2117.8%
118100.0%
Yes at 50.0%*
South
57.7%
2131.5%
1319.3%
23.3%
812.1%
1726.0%
66100.0%
East
23.4%
1429.0%
612.5%
611.8%
35.7%
1837.6%
49100.0%
West
35.8%
2442.4%
1017.2%
814.4%
23.1%
1017.1%
57100.0%
* Note: ChiSq has over 20% low count cells.
Favorability of Colorado Springs Mayor
Favorability of Colorado SpringsMayor
Very favorable
Somewhat favorable
Somewhat unfavorable
Very unfavorable
Never heard of them
DK/NA
Totals
ChiSq Significance
North
Regional Zips
3025.5%
4336.6%
119.0%
108.2%
54.5%
1916.1%
118100.0%
Yes at 75.0%*
South
1319.6%
1421.2%
45.6%
711.2%
1117.1%
1725.3%
66100.0%
East
918.0%
2041.3%
817.3%
35.3%
37.0%
511.2%
49100.0%
West
1627.4%
1933.4%
58.7%
47.8%
23.9%
1118.9%
57100.0%
www.peaksurveys.com Community Survey Region 2012 Page 249 J
Region
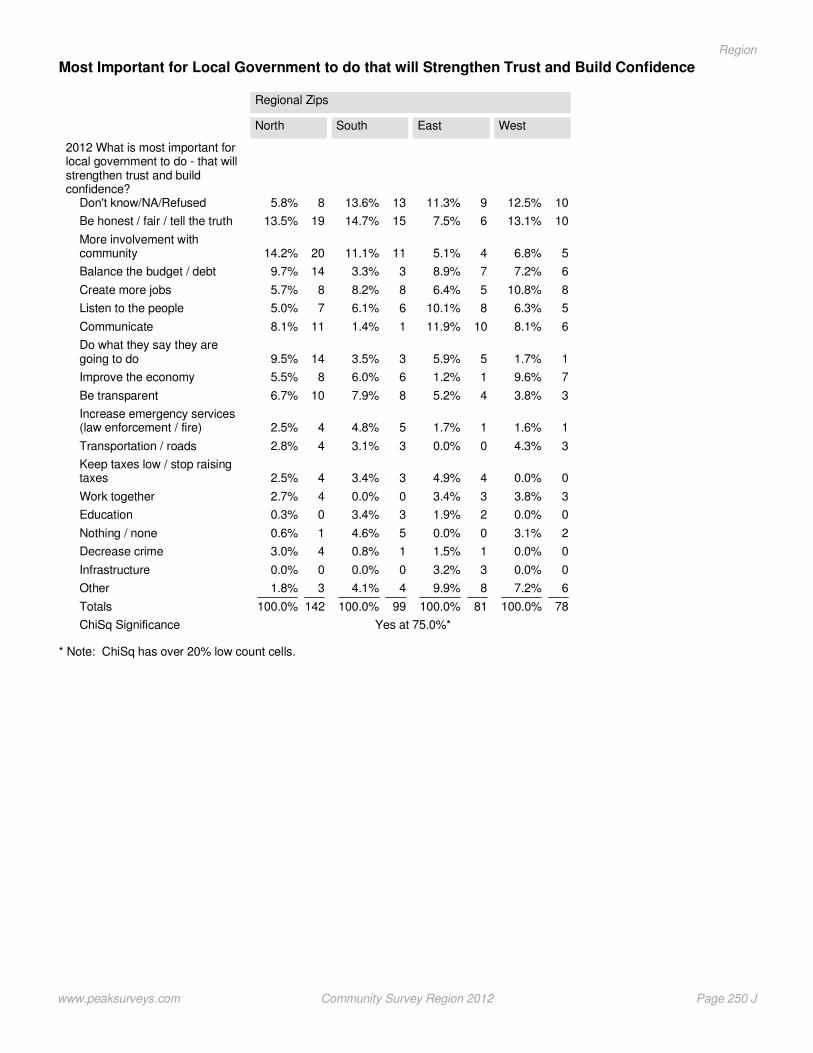
* Note: ChiSq has over 20% low count cells.
Most Important for Local Government to do that will Strengthen Trust and Build Confidence
2012 What is most important forlocal government to do - that willstrengthen trust and buildconfidence?
Don't know/NA/Refused
Be honest / fair / tell the truth
More involvement withcommunity
Balance the budget / debt
Create more jobs
Listen to the people
Communicate
Do what they say they aregoing to do
Improve the economy
Be transparent
Increase emergency services(law enforcement / fire)
Transportation / roads
Keep taxes low / stop raisingtaxes
Work together
Education
Nothing / none
Decrease crime
Infrastructure
Other
Totals
ChiSq Significance
North
Regional Zips
85.8%
1913.5%
2014.2%
149.7%
85.7%
75.0%
118.1%
149.5%
85.5%
106.7%
42.5%
42.8%
42.5%
42.7%
00.3%
10.6%
43.0%
00.0%
31.8%
142100.0%
Yes at 75.0%*
South
1313.6%
1514.7%
1111.1%
33.3%
88.2%
66.1%
11.4%
33.5%
66.0%
87.9%
54.8%
33.1%
33.4%
00.0%
33.4%
54.6%
10.8%
00.0%
44.1%
99100.0%
East
911.3%
67.5%
45.1%
78.9%
56.4%
810.1%
1011.9%
55.9%
11.2%
45.2%
11.7%
00.0%
44.9%
33.4%
21.9%
00.0%
11.5%
33.2%
89.9%
81100.0%
West
1012.5%
1013.1%
56.8%
67.2%
810.8%
56.3%
68.1%
11.7%
79.6%
33.8%
11.6%
34.3%
00.0%
33.8%
00.0%
23.1%
00.0%
00.0%
67.2%
78100.0%
www.peaksurveys.com Community Survey Region 2012 Page 250 J
Region

Positive or Negative Impact of Tabor in the Community
(10) Positive or Negative Impactof Tabor in the Community
Generally positive impact
Generally negative impact
Really makes no difference
Don't know enough about it
Never heard of TABOR
DK/NA
Totals
ChiSq Significance
North
Regional Zips
5435.1%
4226.9%
63.7%
2616.9%
159.6%
127.9%
155100.0%
Yes at 95.0%
South
2119.8%
2725.5%
33.3%
1716.2%
2826.9%
98.4%
106100.0%
East
3541.0%
2124.0%
33.7%
77.8%
1416.8%
66.6%
86100.0%
West
2428.7%
3238.5%
45.2%
1011.6%
67.7%
78.3%
83100.0%
Favorability of Amending Tabor
(11) Favorability of AmendingTABOR?
Strongly favorable
Somewhat favorable
Somewhat unfavorable
Strongly unfavorable
DK/NA
Totals
ChiSq Significance
North
Regional Zips
3522.7%
3623.3%
116.8%
138.3%
6038.9%
155100.0%
Yes at 50.0%
South
2220.7%
2624.6%
43.4%
66.1%
4845.2%
106100.0%
East
1213.9%
2124.8%
1518.1%
78.6%
3034.6%
86100.0%
West
2125.0%
2227.0%
78.6%
78.2%
2631.2%
83100.0%
www.peaksurveys.com Community Survey Region 2012 Page 251 J
Region
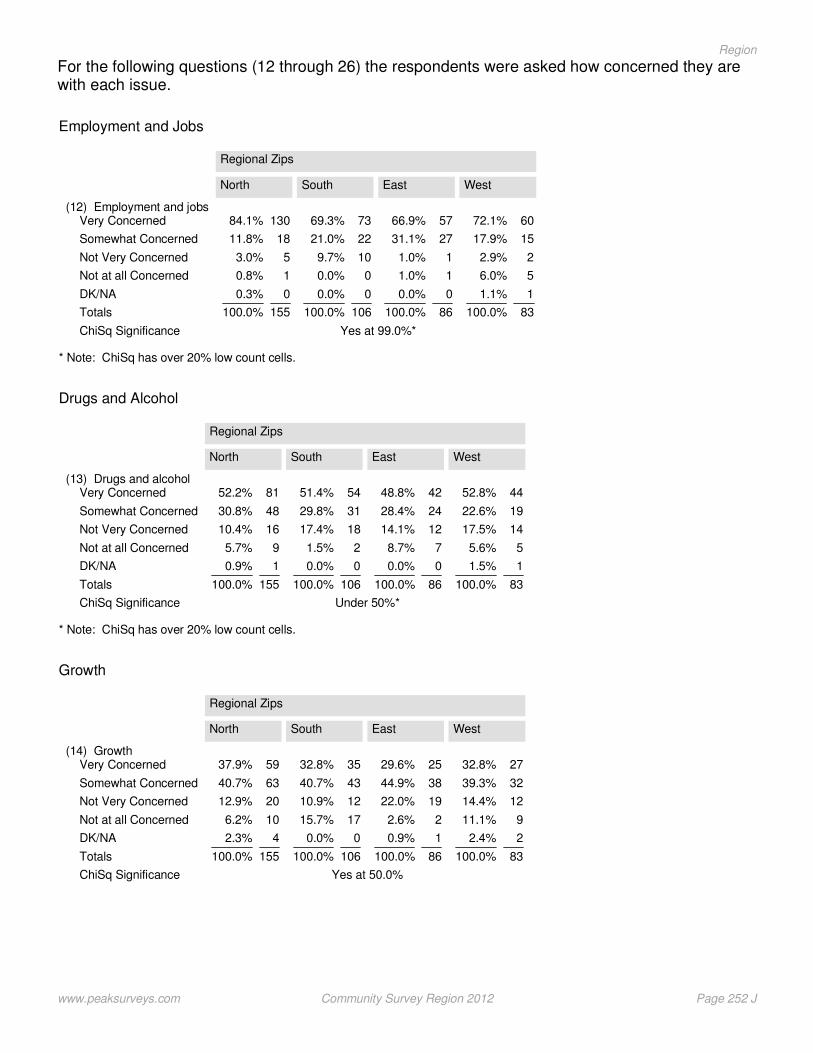
For the following questions (12 through 26) the respondents were asked how concerned they arewith each issue.
* Note: ChiSq has over 20% low count cells.
Employment and Jobs
(12) Employment and jobsVery Concerned
Somewhat Concerned
Not Very Concerned
Not at all Concerned
DK/NA
Totals
ChiSq Significance
North
Regional Zips
13084.1%
1811.8%
53.0%
10.8%
00.3%
155100.0%
Yes at 99.0%*
South
7369.3%
2221.0%
109.7%
00.0%
00.0%
106100.0%
East
5766.9%
2731.1%
11.0%
11.0%
00.0%
86100.0%
West
6072.1%
1517.9%
22.9%
56.0%
11.1%
83100.0%
* Note: ChiSq has over 20% low count cells.
Drugs and Alcohol
(13) Drugs and alcoholVery Concerned
Somewhat Concerned
Not Very Concerned
Not at all Concerned
DK/NA
Totals
ChiSq Significance
North
Regional Zips
8152.2%
4830.8%
1610.4%
95.7%
10.9%
155100.0%
Under 50%*
South
5451.4%
3129.8%
1817.4%
21.5%
00.0%
106100.0%
East
4248.8%
2428.4%
1214.1%
78.7%
00.0%
86100.0%
West
4452.8%
1922.6%
1417.5%
55.6%
11.5%
83100.0%
Growth
(14) GrowthVery Concerned
Somewhat Concerned
Not Very Concerned
Not at all Concerned
DK/NA
Totals
ChiSq Significance
North
Regional Zips
5937.9%
6340.7%
2012.9%
106.2%
42.3%
155100.0%
Yes at 50.0%
South
3532.8%
4340.7%
1210.9%
1715.7%
00.0%
106100.0%
East
2529.6%
3844.9%
1922.0%
22.6%
10.9%
86100.0%
West
2732.8%
3239.3%
1214.4%
911.1%
22.4%
83100.0%
www.peaksurveys.com Community Survey Region 2012 Page 252 J
Region

Affordable Housing
(15) Affordable housingVery Concerned
Somewhat Concerned
Not Very Concerned
Not at all Concerned
DK/NA
Totals
ChiSq Significance
North
Regional Zips
7447.5%
4931.7%
1811.6%
148.9%
00.3%
155100.0%
Yes at 75.0%
South
5248.8%
2826.2%
2119.9%
55.0%
00.0%
106100.0%
East
2529.1%
3844.1%
1113.1%
1113.2%
00.5%
86100.0%
West
3846.4%
2429.1%
1214.1%
56.5%
34.0%
83100.0%
* Note: ChiSq has over 20% low count cells.
Health Care Costs
(16) Health care costsVery Concerned
Somewhat Concerned
Not Very Concerned
Not at all Concerned
DK/NA
Totals
ChiSq Significance
North
Regional Zips
10869.7%
4226.8%
42.6%
10.9%
00.0%
155100.0%
Yes at 50.0%*
South
8277.8%
1514.6%
54.5%
33.1%
00.0%
106100.0%
East
4957.6%
2326.6%
67.4%
77.8%
00.6%
86100.0%
West
5769.4%
1922.9%
22.9%
44.9%
00.0%
83100.0%
Water Supply and Quality
(17) Water supply and qualityVery Concerned
Somewhat Concerned
Not Very Concerned
Not at all Concerned
DK/NA
Totals
ChiSq Significance
North
Regional Zips
9461.0%
3924.9%
1610.5%
63.6%
00.0%
155100.0%
Under 50%
South
5652.7%
3533.4%
76.3%
76.3%
11.3%
106100.0%
East
4249.6%
2529.5%
910.1%
910.8%
00.0%
86100.0%
West
4858.7%
2327.3%
55.8%
56.6%
11.6%
83100.0%
www.peaksurveys.com Community Survey Region 2012 Page 253 J
Region
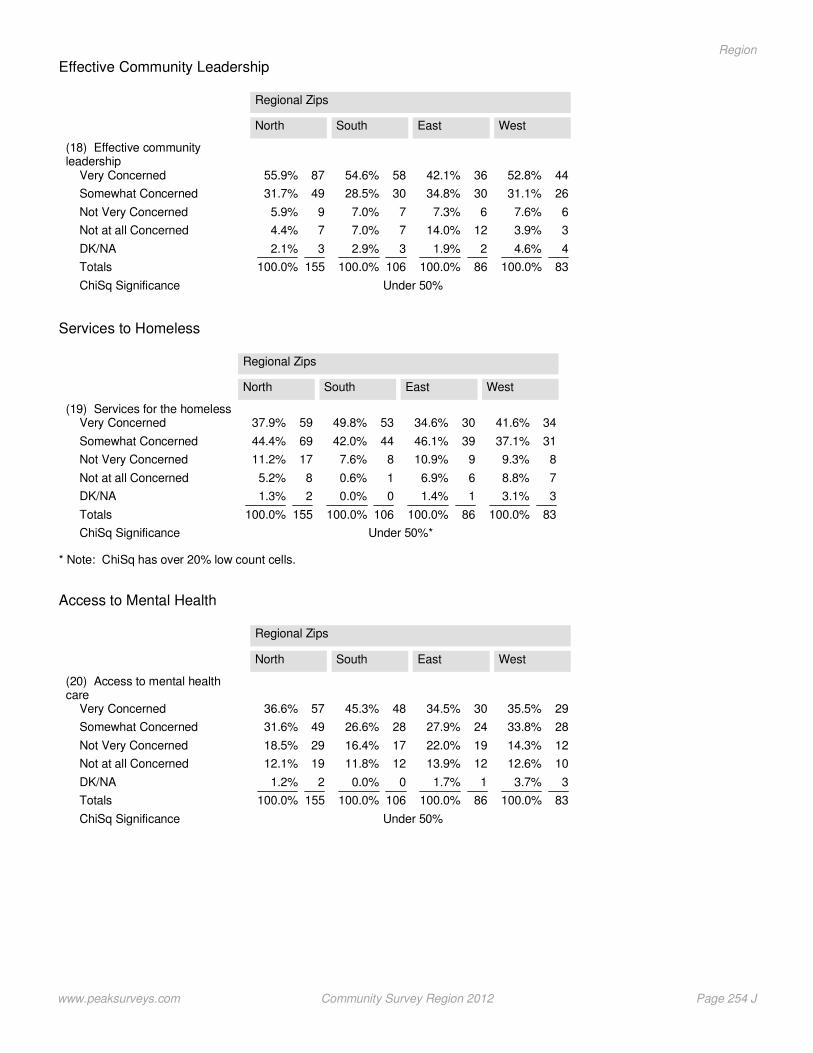
Effective Community Leadership
(18) Effective communityleadership
Very Concerned
Somewhat Concerned
Not Very Concerned
Not at all Concerned
DK/NA
Totals
ChiSq Significance
North
Regional Zips
8755.9%
4931.7%
95.9%
74.4%
32.1%
155100.0%
Under 50%
South
5854.6%
3028.5%
77.0%
77.0%
32.9%
106100.0%
East
3642.1%
3034.8%
67.3%
1214.0%
21.9%
86100.0%
West
4452.8%
2631.1%
67.6%
33.9%
44.6%
83100.0%
* Note: ChiSq has over 20% low count cells.
Services to Homeless
(19) Services for the homelessVery Concerned
Somewhat Concerned
Not Very Concerned
Not at all Concerned
DK/NA
Totals
ChiSq Significance
North
Regional Zips
5937.9%
6944.4%
1711.2%
85.2%
21.3%
155100.0%
Under 50%*
South
5349.8%
4442.0%
87.6%
10.6%
00.0%
106100.0%
East
3034.6%
3946.1%
910.9%
66.9%
11.4%
86100.0%
West
3441.6%
3137.1%
89.3%
78.8%
33.1%
83100.0%
Access to Mental Health
(20) Access to mental healthcare
Very Concerned
Somewhat Concerned
Not Very Concerned
Not at all Concerned
DK/NA
Totals
ChiSq Significance
North
Regional Zips
5736.6%
4931.6%
2918.5%
1912.1%
21.2%
155100.0%
Under 50%
South
4845.3%
2826.6%
1716.4%
1211.8%
00.0%
106100.0%
East
3034.5%
2427.9%
1922.0%
1213.9%
11.7%
86100.0%
West
2935.5%
2833.8%
1214.3%
1012.6%
33.7%
83100.0%
www.peaksurveys.com Community Survey Region 2012 Page 254 J
Region
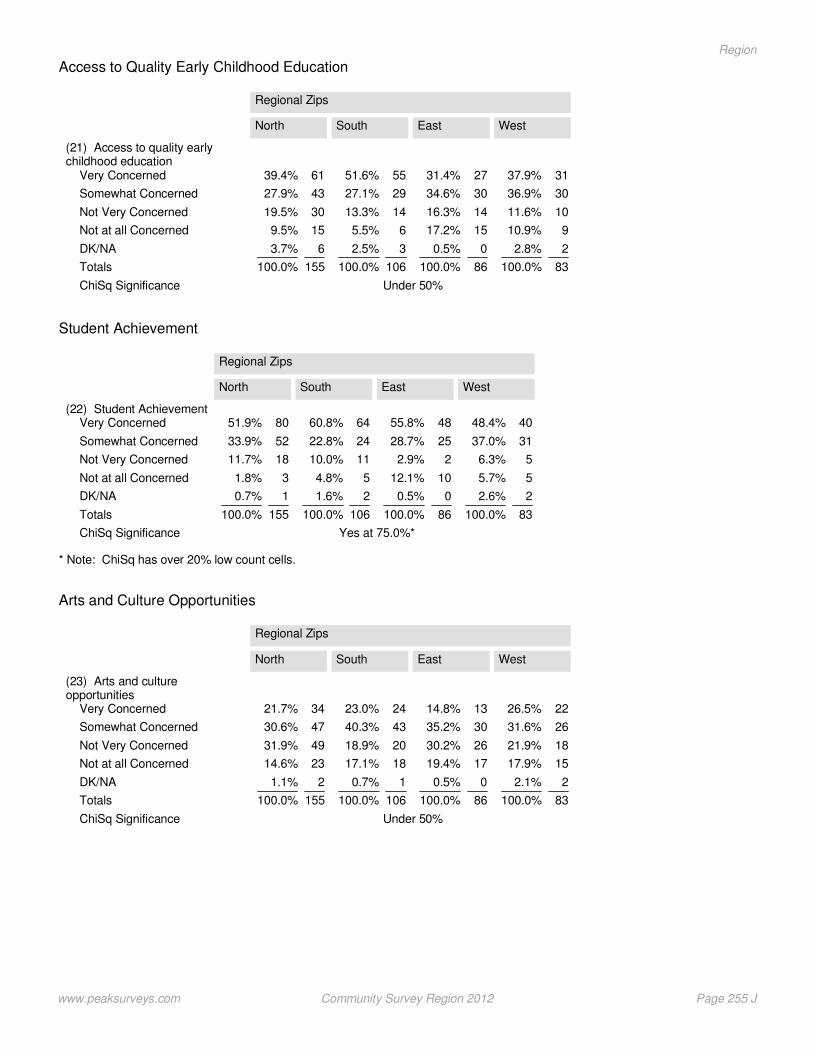
Access to Quality Early Childhood Education
(21) Access to quality earlychildhood education
Very Concerned
Somewhat Concerned
Not Very Concerned
Not at all Concerned
DK/NA
Totals
ChiSq Significance
North
Regional Zips
6139.4%
4327.9%
3019.5%
159.5%
63.7%
155100.0%
Under 50%
South
5551.6%
2927.1%
1413.3%
65.5%
32.5%
106100.0%
East
2731.4%
3034.6%
1416.3%
1517.2%
00.5%
86100.0%
West
3137.9%
3036.9%
1011.6%
910.9%
22.8%
83100.0%
* Note: ChiSq has over 20% low count cells.
Student Achievement
(22) Student AchievementVery Concerned
Somewhat Concerned
Not Very Concerned
Not at all Concerned
DK/NA
Totals
ChiSq Significance
North
Regional Zips
8051.9%
5233.9%
1811.7%
31.8%
10.7%
155100.0%
Yes at 75.0%*
South
6460.8%
2422.8%
1110.0%
54.8%
21.6%
106100.0%
East
4855.8%
2528.7%
22.9%
1012.1%
00.5%
86100.0%
West
4048.4%
3137.0%
56.3%
55.7%
22.6%
83100.0%
Arts and Culture Opportunities
(23) Arts and cultureopportunities
Very Concerned
Somewhat Concerned
Not Very Concerned
Not at all Concerned
DK/NA
Totals
ChiSq Significance
North
Regional Zips
3421.7%
4730.6%
4931.9%
2314.6%
21.1%
155100.0%
Under 50%
South
2423.0%
4340.3%
2018.9%
1817.1%
10.7%
106100.0%
East
1314.8%
3035.2%
2630.2%
1719.4%
00.5%
86100.0%
West
2226.5%
2631.6%
1821.9%
1517.9%
22.1%
83100.0%
www.peaksurveys.com Community Survey Region 2012 Page 255 J
Region

* Note: ChiSq has over 20% low count cells.
Crime Rate
(24) Crime rateVery Concerned
Somewhat Concerned
Not Very Concerned
Not at all Concerned
DK/NA
Totals
ChiSq Significance
North
Regional Zips
9762.6%
3724.0%
1610.6%
42.8%
00.0%
155100.0%
Yes at 75.0%*
South
6359.5%
2725.2%
1211.5%
43.8%
00.0%
106100.0%
East
5361.8%
1517.1%
1011.7%
89.4%
00.0%
86100.0%
West
3644.1%
3137.7%
1214.4%
22.1%
11.7%
83100.0%
Voter Participation
(25) Voter participationVery Concerned
Somewhat Concerned
Not Very Concerned
Not at all Concerned
DK/NA
Totals
ChiSq Significance
North
Regional Zips
8957.7%
4025.9%
148.9%
106.5%
21.1%
155100.0%
Under 50%
South
5552.0%
3331.1%
109.9%
76.6%
00.4%
106100.0%
East
4147.6%
2631.0%
1012.0%
77.7%
11.7%
86100.0%
West
4149.6%
2327.5%
89.2%
89.4%
44.3%
83100.0%
Community Engagement in Local Issues
(26) Community engagement inlocal issues
Very Concerned
Somewhat Concerned
Not Very Concerned
Not at all Concerned
DK/NA
Totals
ChiSq Significance
North
Regional Zips
4126.4%
8454.3%
1711.0%
106.7%
21.6%
155100.0%
Yes at 50.0%
South
4341.1%
3633.6%
1817.0%
98.4%
00.0%
106100.0%
East
2124.4%
4147.6%
1719.4%
78.0%
00.5%
86100.0%
West
2125.0%
3745.3%
1518.7%
78.0%
22.9%
83100.0%
www.peaksurveys.com Community Survey Region 2012 Page 256 J
Region
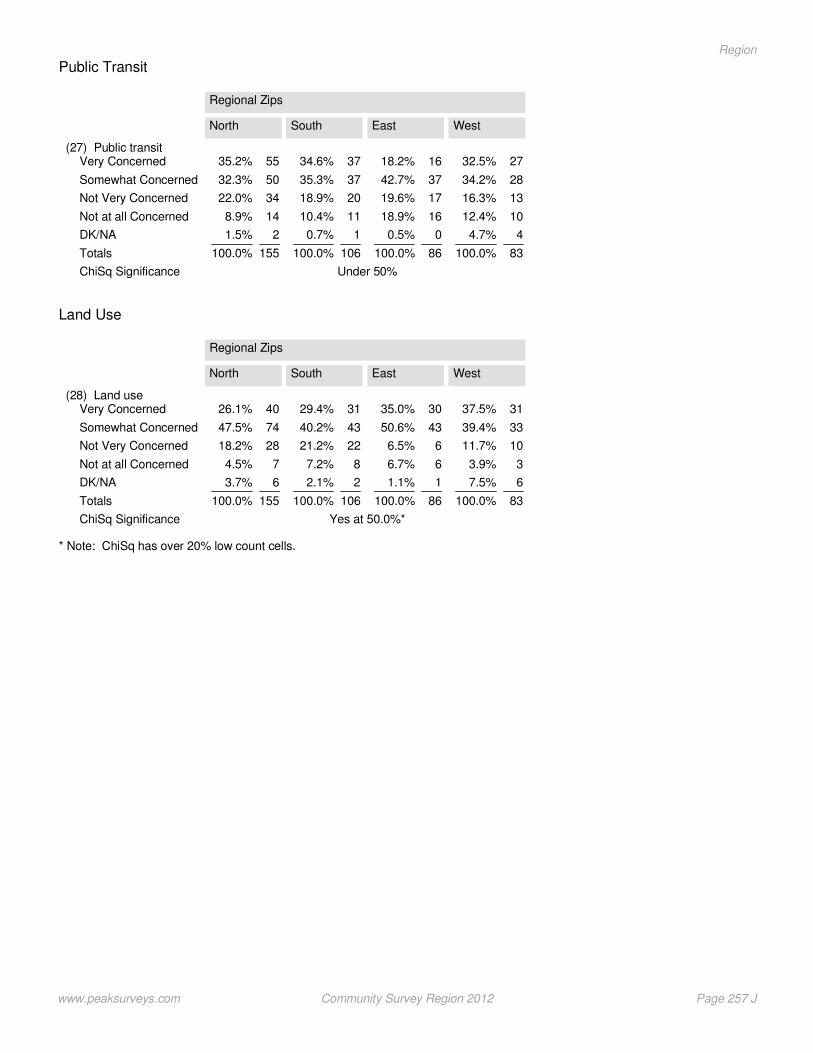
Public Transit
(27) Public transitVery Concerned
Somewhat Concerned
Not Very Concerned
Not at all Concerned
DK/NA
Totals
ChiSq Significance
North
Regional Zips
5535.2%
5032.3%
3422.0%
148.9%
21.5%
155100.0%
Under 50%
South
3734.6%
3735.3%
2018.9%
1110.4%
10.7%
106100.0%
East
1618.2%
3742.7%
1719.6%
1618.9%
00.5%
86100.0%
West
2732.5%
2834.2%
1316.3%
1012.4%
44.7%
83100.0%
* Note: ChiSq has over 20% low count cells.
Land Use
(28) Land useVery Concerned
Somewhat Concerned
Not Very Concerned
Not at all Concerned
DK/NA
Totals
ChiSq Significance
North
Regional Zips
4026.1%
7447.5%
2818.2%
74.5%
63.7%
155100.0%
Yes at 50.0%*
South
3129.4%
4340.2%
2221.2%
87.2%
22.1%
106100.0%
East
3035.0%
4350.6%
66.5%
66.7%
11.1%
86100.0%
West
3137.5%
3339.4%
1011.7%
33.9%
67.5%
83100.0%
www.peaksurveys.com Community Survey Region 2012 Page 257 J
Region

Section J
regionquality of life
Peak Surveys
www.peaksurveys.com
Community and QLI Survey 2012
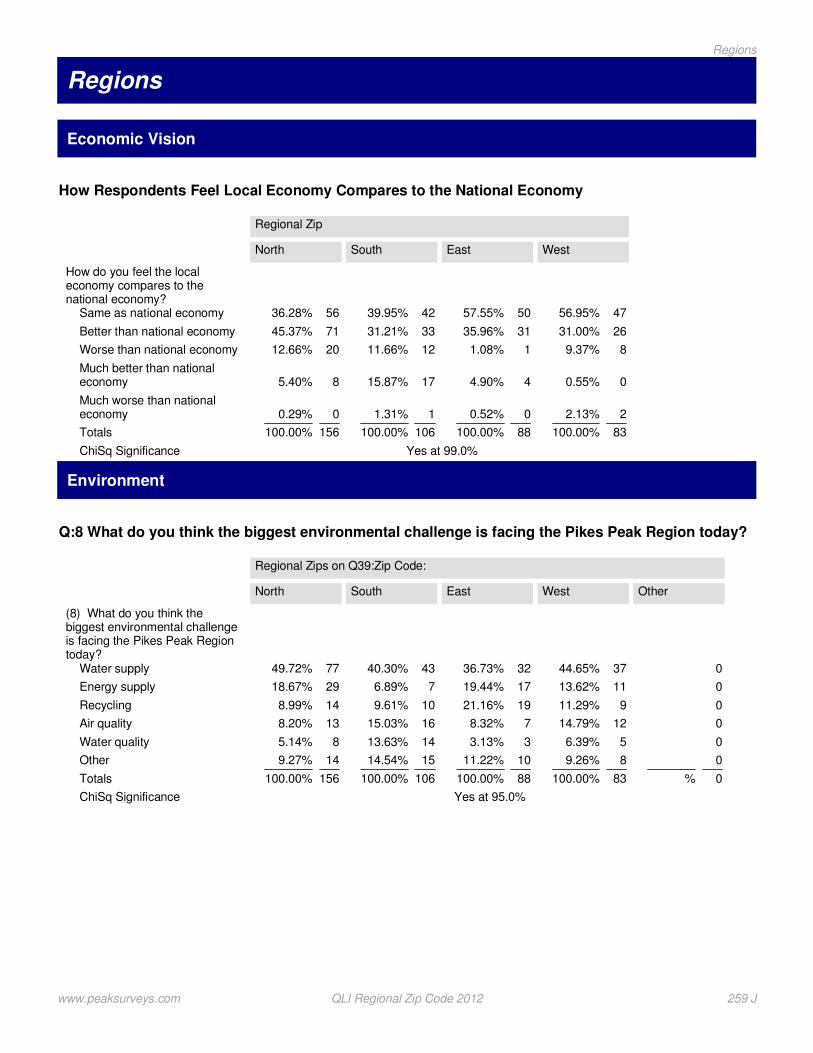
Regions
Economic Vision
How Respondents Feel Local Economy Compares to the National Economy
How do you feel the localeconomy compares to thenational economy?
Same as national economy
Better than national economy
Worse than national economy
Much better than nationaleconomy
Much worse than nationaleconomy
Totals
ChiSq Significance
North
Regional Zip
5636.28%
7145.37%
2012.66%
85.40%
00.29%
156100.00%
Yes at 99.0%
South
4239.95%
3331.21%
1211.66%
1715.87%
11.31%
106100.00%
East
5057.55%
3135.96%
11.08%
44.90%
00.52%
88100.00%
West
4756.95%
2631.00%
89.37%
00.55%
22.13%
83100.00%
Environment
Q:8 What do you think the biggest environmental challenge is facing the Pikes Peak Region today?
(8) What do you think thebiggest environmental challengeis facing the Pikes Peak Regiontoday?
Water supply
Energy supply
Recycling
Air quality
Water quality
Other
Totals
ChiSq Significance
North
Regional Zips on Q39:Zip Code:
7749.72%
2918.67%
148.99%
138.20%
85.14%
149.27%
156100.00%
Yes at 95.0%
South
4340.30%
76.89%
109.61%
1615.03%
1413.63%
1514.54%
106100.00%
East
3236.73%
1719.44%
1921.16%
78.32%
33.13%
1011.22%
88100.00%
West
3744.65%
1113.62%
911.29%
1214.79%
56.39%
89.26%
83100.00%
Other
0
0
0
0
0
0
0%
www.peaksurveys.com QLI Regional Zip Code 2012 259 J
Regions
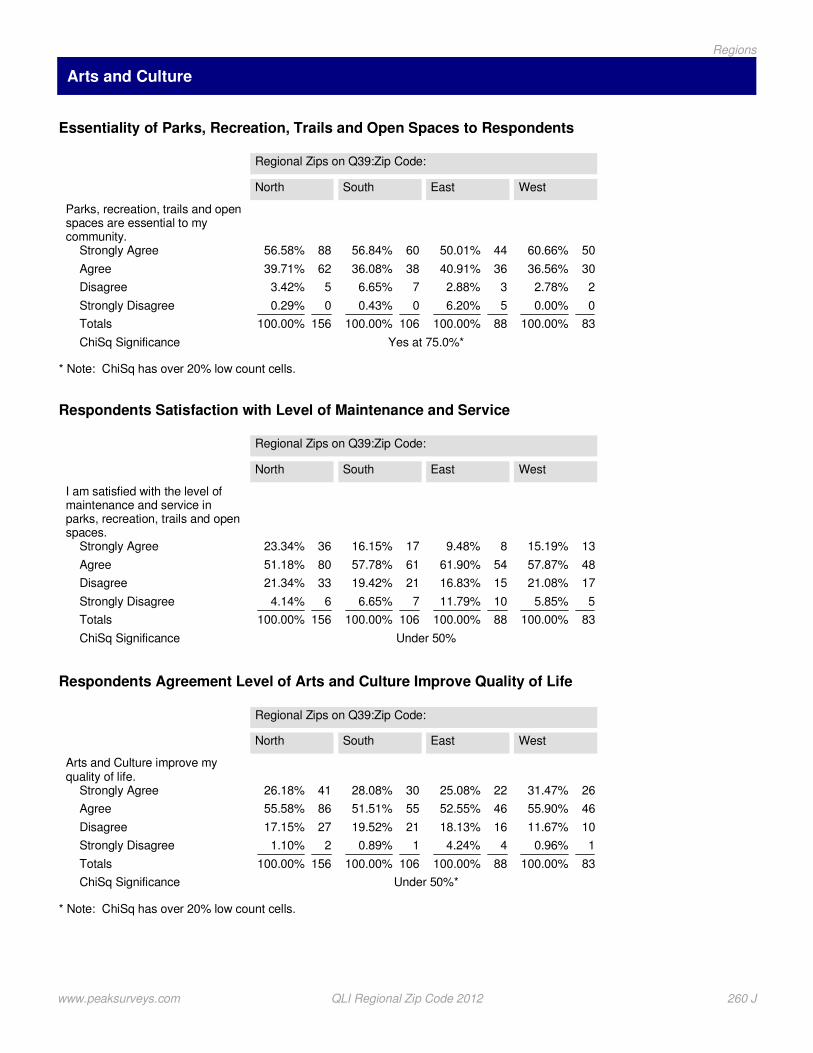
Arts and Culture
* Note: ChiSq has over 20% low count cells.
Essentiality of Parks, Recreation, Trails and Open Spaces to Respondents
Parks, recreation, trails and openspaces are essential to mycommunity.
Strongly Agree
Agree
Disagree
Strongly Disagree
Totals
ChiSq Significance
North
Regional Zips on Q39:Zip Code:
8856.58%
6239.71%
53.42%
00.29%
156100.00%
Yes at 75.0%*
South
6056.84%
3836.08%
76.65%
00.43%
106100.00%
East
4450.01%
3640.91%
32.88%
56.20%
88100.00%
West
5060.66%
3036.56%
22.78%
00.00%
83100.00%
Respondents Satisfaction with Level of Maintenance and Service
I am satisfied with the level ofmaintenance and service inparks, recreation, trails and openspaces.
Strongly Agree
Agree
Disagree
Strongly Disagree
Totals
ChiSq Significance
North
Regional Zips on Q39:Zip Code:
3623.34%
8051.18%
3321.34%
64.14%
156100.00%
Under 50%
South
1716.15%
6157.78%
2119.42%
76.65%
106100.00%
East
89.48%
5461.90%
1516.83%
1011.79%
88100.00%
West
1315.19%
4857.87%
1721.08%
55.85%
83100.00%
* Note: ChiSq has over 20% low count cells.
Respondents Agreement Level of Arts and Culture Improve Quality of Life
Arts and Culture improve myquality of life.
Strongly Agree
Agree
Disagree
Strongly Disagree
Totals
ChiSq Significance
North
Regional Zips on Q39:Zip Code:
4126.18%
8655.58%
2717.15%
21.10%
156100.00%
Under 50%*
South
3028.08%
5551.51%
2119.52%
10.89%
106100.00%
East
2225.08%
4652.55%
1618.13%
44.24%
88100.00%
West
2631.47%
4655.90%
1011.67%
10.96%
83100.00%
www.peaksurveys.com QLI Regional Zip Code 2012 260 J
Regions
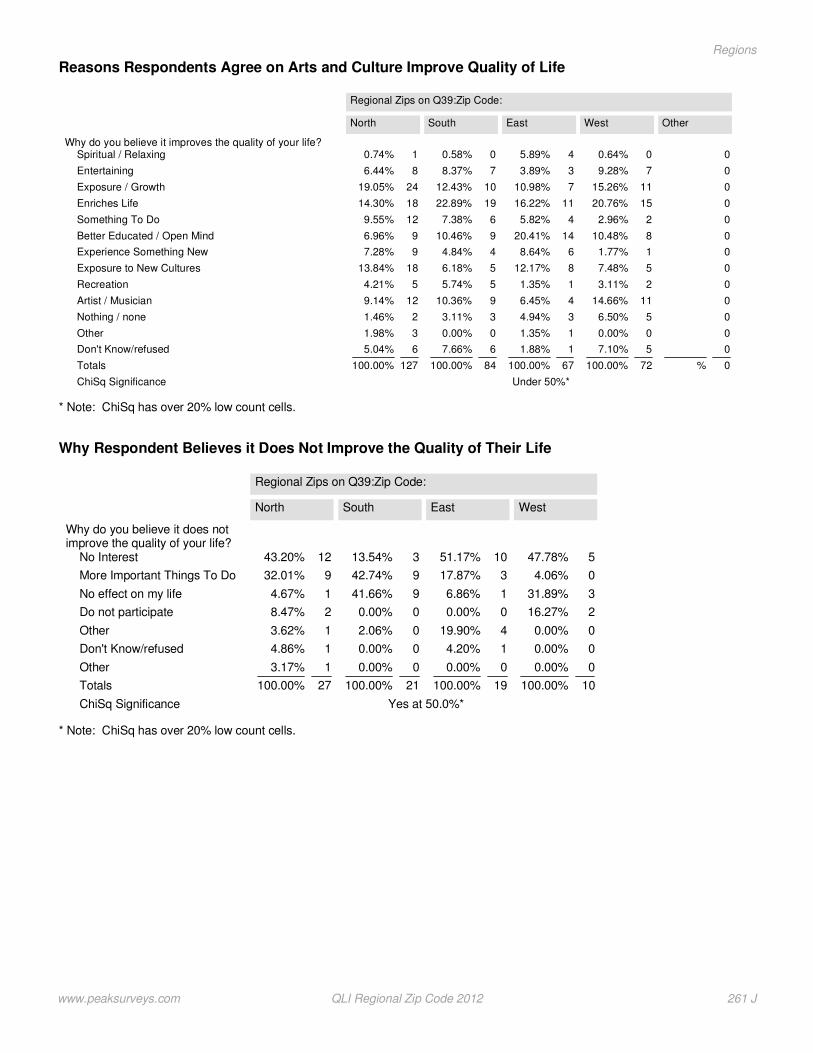
* Note: ChiSq has over 20% low count cells.
Reasons Respondents Agree on Arts and Culture Improve Quality of Life
Why do you believe it improves the quality of your life?Spiritual / Relaxing
Entertaining
Exposure / Growth
Enriches Life
Something To Do
Better Educated / Open Mind
Experience Something New
Exposure to New Cultures
Recreation
Artist / Musician
Nothing / none
Other
Don't Know/refused
Totals
ChiSq Significance
North
Regional Zips on Q39:Zip Code:
10.74%
86.44%
2419.05%
1814.30%
129.55%
96.96%
97.28%
1813.84%
54.21%
129.14%
21.46%
31.98%
65.04%
127100.00%
Under 50%*
South
00.58%
78.37%
1012.43%
1922.89%
67.38%
910.46%
44.84%
56.18%
55.74%
910.36%
33.11%
00.00%
67.66%
84100.00%
East
45.89%
33.89%
710.98%
1116.22%
45.82%
1420.41%
68.64%
812.17%
11.35%
46.45%
34.94%
11.35%
11.88%
67100.00%
West
00.64%
79.28%
1115.26%
1520.76%
22.96%
810.48%
11.77%
57.48%
23.11%
1114.66%
56.50%
00.00%
57.10%
72100.00%
Other
0
0
0
0
0
0
0
0
0
0
0
0
0
0%
* Note: ChiSq has over 20% low count cells.
Why Respondent Believes it Does Not Improve the Quality of Their Life
Why do you believe it does notimprove the quality of your life?
No Interest
More Important Things To Do
No effect on my life
Do not participate
Other
Don't Know/refused
Other
Totals
ChiSq Significance
North
Regional Zips on Q39:Zip Code:
1243.20%
932.01%
14.67%
28.47%
13.62%
14.86%
13.17%
27100.00%
Yes at 50.0%*
South
313.54%
942.74%
941.66%
00.00%
02.06%
00.00%
00.00%
21100.00%
East
1051.17%
317.87%
16.86%
00.00%
419.90%
14.20%
00.00%
19100.00%
West
547.78%
04.06%
331.89%
216.27%
00.00%
00.00%
00.00%
10100.00%
www.peaksurveys.com QLI Regional Zip Code 2012 261 J
Regions
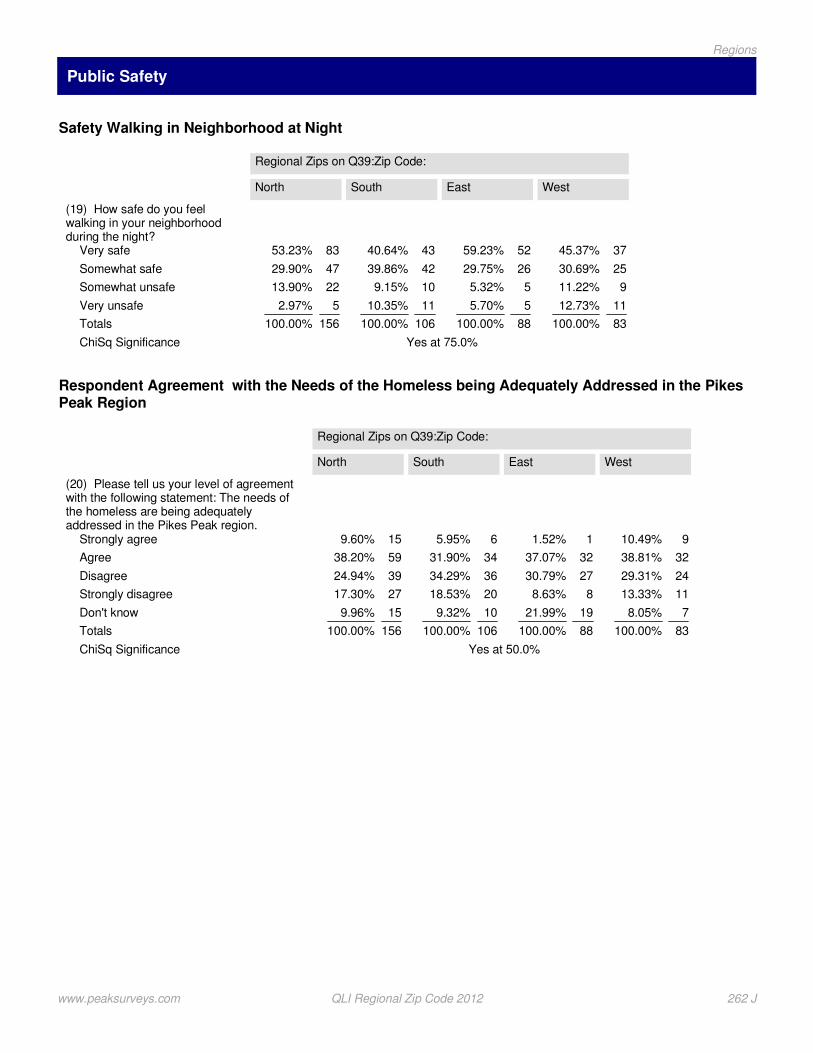
Public Safety
Safety Walking in Neighborhood at Night
(19) How safe do you feelwalking in your neighborhoodduring the night?
Very safe
Somewhat safe
Somewhat unsafe
Very unsafe
Totals
ChiSq Significance
North
Regional Zips on Q39:Zip Code:
8353.23%
4729.90%
2213.90%
52.97%
156100.00%
Yes at 75.0%
South
4340.64%
4239.86%
109.15%
1110.35%
106100.00%
East
5259.23%
2629.75%
55.32%
55.70%
88100.00%
West
3745.37%
2530.69%
911.22%
1112.73%
83100.00%
Respondent Agreement with the Needs of the Homeless being Adequately Addressed in the PikesPeak Region
(20) Please tell us your level of agreementwith the following statement: The needs ofthe homeless are being adequatelyaddressed in the Pikes Peak region.
Strongly agree
Agree
Disagree
Strongly disagree
Don't know
Totals
ChiSq Significance
North
Regional Zips on Q39:Zip Code:
159.60%
5938.20%
3924.94%
2717.30%
159.96%
156100.00%
Yes at 50.0%
South
65.95%
3431.90%
3634.29%
2018.53%
109.32%
106100.00%
East
11.52%
3237.07%
2730.79%
88.63%
1921.99%
88100.00%
West
910.49%
3238.81%
2429.31%
1113.33%
78.05%
83100.00%
www.peaksurveys.com QLI Regional Zip Code 2012 262 J
Regions
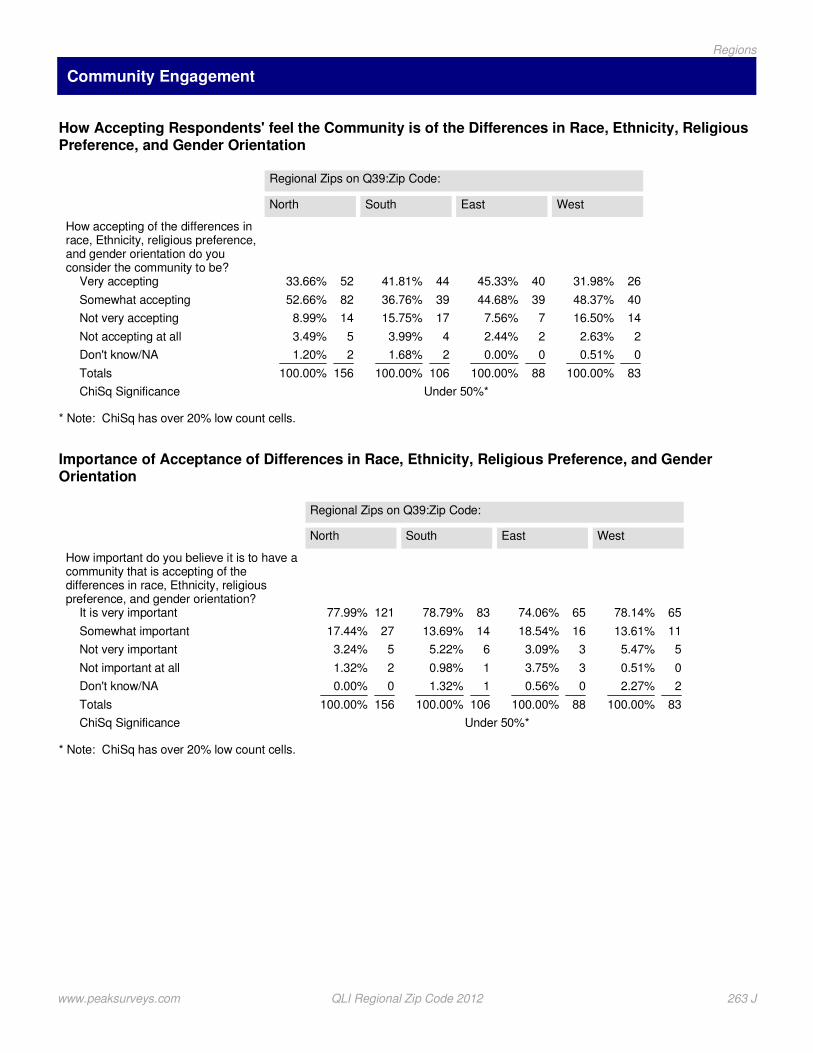
Community Engagement
* Note: ChiSq has over 20% low count cells.
How Accepting Respondents' feel the Community is of the Differences in Race, Ethnicity, ReligiousPreference, and Gender Orientation
How accepting of the differences inrace, Ethnicity, religious preference,and gender orientation do youconsider the community to be?
Very accepting
Somewhat accepting
Not very accepting
Not accepting at all
Don't know/NA
Totals
ChiSq Significance
North
Regional Zips on Q39:Zip Code:
5233.66%
8252.66%
148.99%
53.49%
21.20%
156100.00%
Under 50%*
South
4441.81%
3936.76%
1715.75%
43.99%
21.68%
106100.00%
East
4045.33%
3944.68%
77.56%
22.44%
00.00%
88100.00%
West
2631.98%
4048.37%
1416.50%
22.63%
00.51%
83100.00%
* Note: ChiSq has over 20% low count cells.
Importance of Acceptance of Differences in Race, Ethnicity, Religious Preference, and GenderOrientation
How important do you believe it is to have acommunity that is accepting of thedifferences in race, Ethnicity, religiouspreference, and gender orientation?
It is very important
Somewhat important
Not very important
Not important at all
Don't know/NA
Totals
ChiSq Significance
North
Regional Zips on Q39:Zip Code:
12177.99%
2717.44%
53.24%
21.32%
00.00%
156100.00%
Under 50%*
South
8378.79%
1413.69%
65.22%
10.98%
11.32%
106100.00%
East
6574.06%
1618.54%
33.09%
33.75%
00.56%
88100.00%
West
6578.14%
1113.61%
55.47%
00.51%
22.27%
83100.00%
www.peaksurveys.com QLI Regional Zip Code 2012 263 J
Regions

Frequency of Charitable or Voluntary Service in the Last 12 Months
During the last 12 months howoften did you or other members ofyour household spend on charitableor voluntary service activities?
More than once a week
Several times a month
Once a month
Once or twice a quarter
Rarely
Never
Don't know/NA
Totals
ChiSq Significance
North
Regional Zips on Q39:Zip Code:
2214.22%
3522.28%
2214.25%
2717.65%
2516.33%
2415.27%
00.00%
156100.00%
Under 50%
South
1614.92%
1716.34%
2221.23%
1514.19%
2220.72%
1312.60%
00.00%
106100.00%
East
1415.45%
2427.36%
1011.19%
1314.64%
1315.38%
1314.57%
11.41%
88100.00%
West
1011.86%
1518.52%
1214.27%
1518.39%
1214.74%
1619.29%
22.93%
83100.00%
Other
0
0
0
0
0
0
0
0%
* Note: ChiSq has over 20% low count cells.
Frequency of Donating Money or Property in the Last 12 Months
How often have you or other members of yourhousehold donated money or property to charity in thelast 12 months? By donating I mean making a voluntarycontribution with no intention of making a profi
Weekly
Monthly
Quarterly
Occasionally
Never
Don't know/NA
Totals
ChiSq Significance
North
Regional Zips on Q39:Zip Code:
2415.12%
6642.57%
3522.69%
2616.66%
31.98%
20.98%
156100.00%
Yes at 50.0%*
South
98.43%
4240.12%
2119.69%
2524.07%
87.68%
00.00%
106100.00%
East
1314.46%
3944.44%
1011.66%
2326.61%
22.83%
00.00%
88100.00%
West
1416.89%
2934.71%
2125.80%
1315.73%
56.13%
10.74%
83100.00%
* Note: ChiSq has over 20% low count cells.
Attendance at Public Meetings where there was a Discussion on Community Affairs
(25) In the last year, have youattended any public meetings inwhich there was discussion ofcommunity affairs?
Yes
No
Other
Totals
ChiSq Significance
North
Regional Zips on Q39:Zip Code:
5132.76%
10567.24%
00.00%
156100.00%
Under 50%*
South
3331.06%
7268.48%
00.46%
106100.00%
East
2427.12%
6472.88%
00.00%
88100.00%
West
2934.87%
5465.13%
00.00%
83100.00%
www.peaksurveys.com QLI Regional Zip Code 2012 264 J
Regions
Section K
open-endedresponses
Peak Surveys
www.peaksurveys.com
Community and QLI Survey 2012
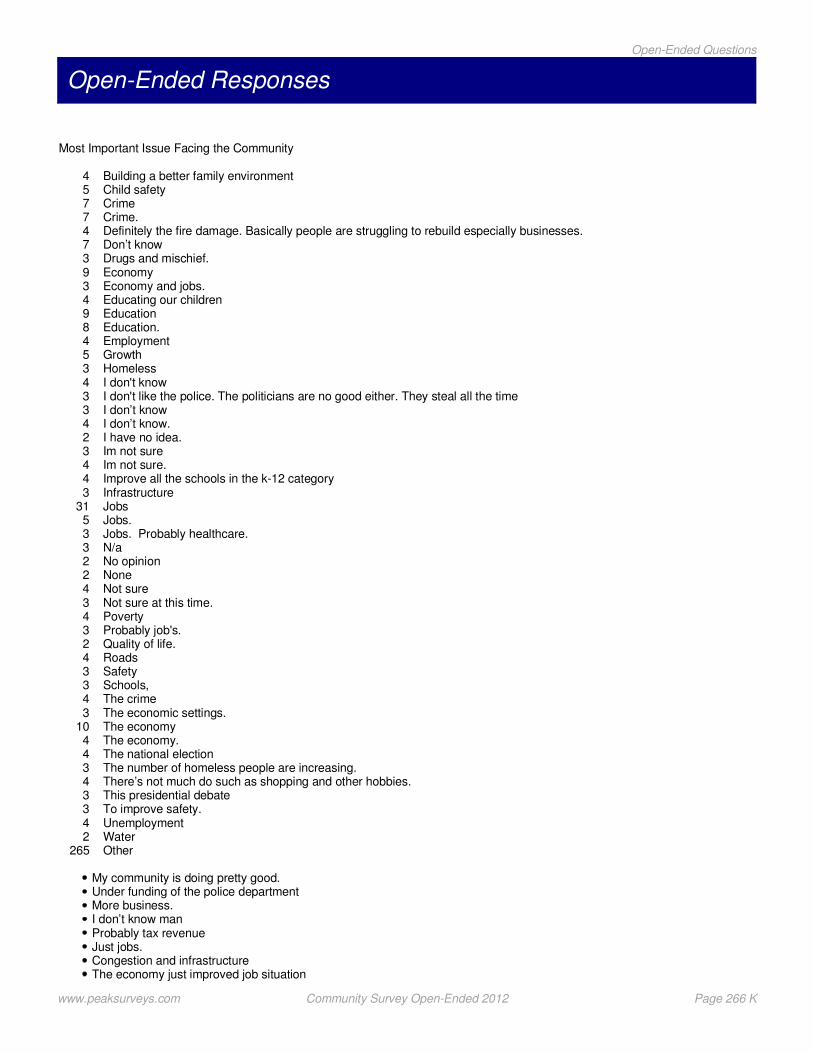
Open-Ended Responses
Most Important Issue Facing the Community
4 Building a better family environment5 Child safety7 Crime7 Crime.4 Definitely the fire damage. Basically people are struggling to rebuild especially businesses.7 Don’t know3 Drugs and mischief.9 Economy3 Economy and jobs.4 Educating our children9 Education8 Education.4 Employment5 Growth3 Homeless4 I don't know3 I don't like the police. The politicians are no good either. They steal all the time3 I don’t know4 I don’t know.2 I have no idea.3 Im not sure4 Im not sure.4 Improve all the schools in the k-12 category3 Infrastructure
31 Jobs5 Jobs.3 Jobs. Probably healthcare.3 N/a2 No opinion2 None4 Not sure3 Not sure at this time.4 Poverty3 Probably job's.2 Quality of life.4 Roads3 Safety3 Schools,4 The crime3 The economic settings.
10 The economy4 The economy.4 The national election3 The number of homeless people are increasing.4 There’s not much do such as shopping and other hobbies.3 This presidential debate3 To improve safety.4 Unemployment2 Water
265 Other
My community is doing pretty good.Under funding of the police departmentMore business.I don’t know manProbably tax revenueJust jobs.Congestion and infrastructureThe economy just improved job situation
www.peaksurveys.com Community Survey Open-Ended 2012 Page 266 K
Open-Ended Questions
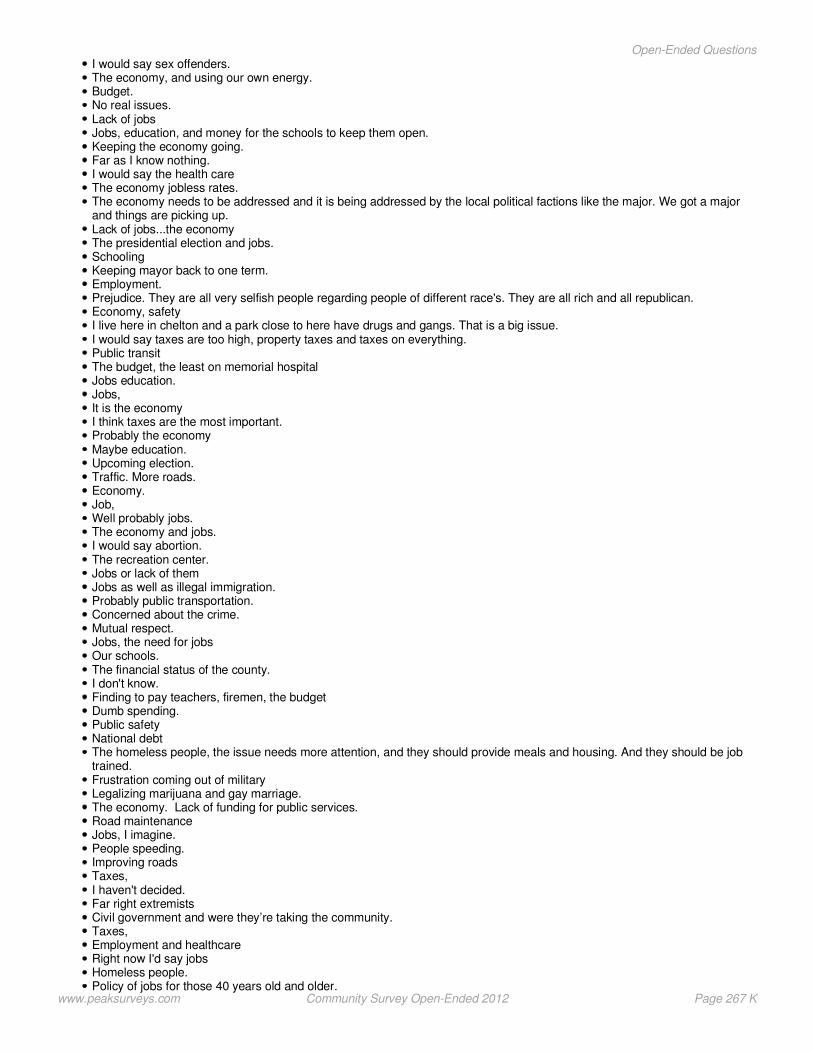
I would say sex offenders.The economy, and using our own energy.Budget.No real issues.Lack of jobsJobs, education, and money for the schools to keep them open.Keeping the economy going.Far as I know nothing.I would say the health careThe economy jobless rates.The economy needs to be addressed and it is being addressed by the local political factions like the major. We got a majorand things are picking up.Lack of jobs...the economyThe presidential election and jobs.SchoolingKeeping mayor back to one term.Employment.Prejudice. They are all very selfish people regarding people of different race's. They are all rich and all republican.Economy, safetyI live here in chelton and a park close to here have drugs and gangs. That is a big issue.I would say taxes are too high, property taxes and taxes on everything.Public transitThe budget, the least on memorial hospitalJobs education.Jobs,It is the economyI think taxes are the most important.Probably the economyMaybe education.Upcoming election.Traffic. More roads.Economy.Job,Well probably jobs.The economy and jobs.I would say abortion.The recreation center.Jobs or lack of themJobs as well as illegal immigration.Probably public transportation.Concerned about the crime.Mutual respect.Jobs, the need for jobsOur schools.The financial status of the county.I don't know.Finding to pay teachers, firemen, the budgetDumb spending.Public safetyNational debtThe homeless people, the issue needs more attention, and they should provide meals and housing. And they should be jobtrained.Frustration coming out of militaryLegalizing marijuana and gay marriage.The economy. Lack of funding for public services.Road maintenanceJobs, I imagine.People speeding.Improving roadsTaxes,I haven't decided.Far right extremistsCivil government and were they’re taking the community.Taxes,Employment and healthcareRight now I'd say jobsHomeless people.Policy of jobs for those 40 years old and older.
www.peaksurveys.com Community Survey Open-Ended 2012 Page 267 K
Open-Ended Questions

Energy,The economy and jobsJobs and the housing market.Probably budgets.Keeping home owners taxes lowProbably local government budgets.Infrastructure because of growthThe economy jobsI would say police protection, security and educationJob developmentSchool and their fundingI probably have to say having a super high in the areaMore fire and police. More jobs.More, more trafficProbably safety and the economySchool fundingQuality of educationDependent on military and lack of funds to do projects.Senior citizensI think jobsThe economy like the rest of the nation.Traffic, mainly better representatives for the community. Lower our taxes for sure, start checking for illegal immigrants.Funding emergency services,ParkingLimiting growth. Improving the school system.No commentWater.Police and fire protectionJobs, the lack there ofTogetherness and unity. Manners, social and traffic etiquette.All of the attempted child abductions. Just in my opinion, a lot of it is happening before and after school. If there was apolice presence then a lot of it wouldn't probably happen.The budget. Just need to look at things not give everyone everything.Crime is the most important issue facing the community.I think the election coming up is very important and it's going to effect us all. I don't like joe Biden, the more he talks the moreof an idiot he becomes.Fire recoveryLonger term waterThe economy,Unemployment, Infrastructure. Public transportationBreakdown of infrastructureLocal economyTax baseThe economy as a whole.The population the size of itWater and delivery of water systemThe most important issue is the increase in crime rate, the issues on the ballot 64Education and schools. We don’t have the facilities to support the population.TaxesThe most important is transpiration.The economic conditionVoting situation getting people out to voteEconomy. More growth and more jobs.Employment.Most important issue is housing and the down town.Missed used government funds and misplaced government prioritiesEducation, poor educationProperty valueParks for our youth.Public service like firemen and things like thatJobs, road conditions.The economy and the number of homes for sale.School.Our schools, just the quality of education seems to be going down.FinancesAdequate police and fire protection, make sure they are properly equipped.Not sure there is a lot of issuesMilitary cutbacks
www.peaksurveys.com Community Survey Open-Ended 2012 Page 268 K
Open-Ended Questions
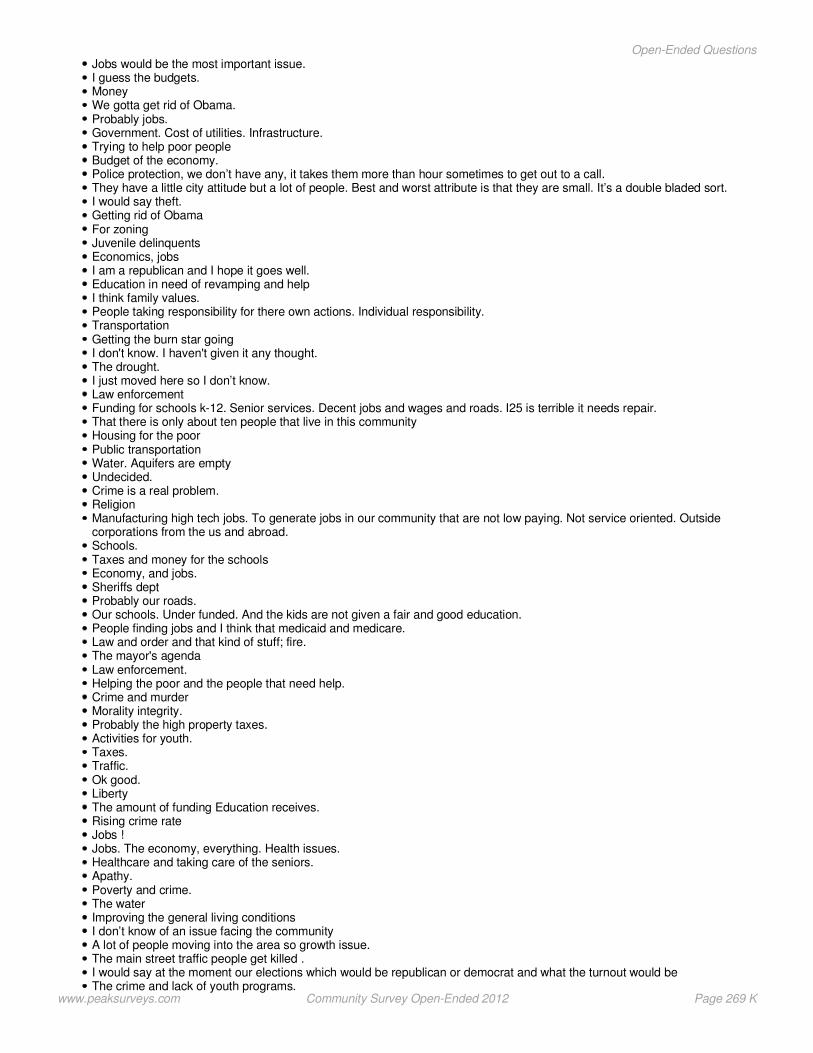
Jobs would be the most important issue.I guess the budgets.MoneyWe gotta get rid of Obama.Probably jobs.Government. Cost of utilities. Infrastructure.Trying to help poor peopleBudget of the economy.Police protection, we don’t have any, it takes them more than hour sometimes to get out to a call.They have a little city attitude but a lot of people. Best and worst attribute is that they are small. It’s a double bladed sort.I would say theft.Getting rid of ObamaFor zoningJuvenile delinquentsEconomics, jobsI am a republican and I hope it goes well.Education in need of revamping and helpI think family values.People taking responsibility for there own actions. Individual responsibility.TransportationGetting the burn star goingI don't know. I haven't given it any thought.The drought.I just moved here so I don’t know.Law enforcementFunding for schools k-12. Senior services. Decent jobs and wages and roads. I25 is terrible it needs repair.That there is only about ten people that live in this communityHousing for the poorPublic transportationWater. Aquifers are emptyUndecided.Crime is a real problem.ReligionManufacturing high tech jobs. To generate jobs in our community that are not low paying. Not service oriented. Outsidecorporations from the us and abroad.Schools.Taxes and money for the schoolsEconomy, and jobs.Sheriffs deptProbably our roads.Our schools. Under funded. And the kids are not given a fair and good education.People finding jobs and I think that medicaid and medicare.Law and order and that kind of stuff; fire.The mayor's agendaLaw enforcement.Helping the poor and the people that need help.Crime and murderMorality integrity.Probably the high property taxes.Activities for youth.Taxes.Traffic.Ok good.LibertyThe amount of funding Education receives.Rising crime rateJobs !Jobs. The economy, everything. Health issues.Healthcare and taking care of the seniors.Apathy.Poverty and crime.The waterImproving the general living conditionsI don’t know of an issue facing the communityA lot of people moving into the area so growth issue.The main street traffic people get killed .I would say at the moment our elections which would be republican or democrat and what the turnout would beThe crime and lack of youth programs.
www.peaksurveys.com Community Survey Open-Ended 2012 Page 269 K
Open-Ended Questions

Government servicesI am not part of the communityThe crime has escalated greatlyLiving a joyful life hereToo many interruptions, too much noise.Low taxesThe presidential election of 2012The safetyMilitary independent jobs.We need to work on lowering the unemployment rate.Jobs and unemploymentI think the most important issue facing the community is making sure the elderly an disabled are taken care of. if they canmodernize the southeastern part of town.I have to say is the unemployment.NothingProbably the presidential election that is going on right now.Expanding on infrastructureSince the fire the quality of the air has gone down.Getting a new president.I would say unemployment.We are in a recession so the most important thing is saving energy. It's hard to find jobs.That question I cant answer for you at this timeThe community having access to resources if they are unemployed or going through some personal issues that have adetrimental effect on their lives.Economics lets get back to work!Hatred and polarization, they are so partisan you cant speak to anybody.Schools and crimeGetting money and getting the economy turned around hereThe most important issue facing the community is the water supply.Business accessibilityHomeless peopleGetting people to work and not just talk about itHire health care costJust the general economy.ElectionsEconomic, and jobs ,The potential job loss for the military.Maybe employment.Growing bigger we need to watch for that and plan for that.Keeping taxes low.Maintaining police, fire services. Just the local government services, police fire, school.Utilities ratesPublic services.I suppose probably jobsProbably economics and the economyBus services no money to pay for themThe question of taxation.No ideaHomeless, and jobs.DkIts still unemployment.Growth and development.Jobs and access to healthcare for people with no insurance .Funding for our educational.I have no ideaCrime rate is going up.Oh I don’t knowLack of money, damage to the environment and extremely biased el paso county commissioner is doing a very poor job.Religious fanatics. Environmental issues.The education and things for the children, watching out for idiots that kidnap children. Set up crossing guards for the childrenfor the schools.Crime, thats about it.Economic situationFunding for roadsEconomy and the cityMore money for firefighters and not enough money to run things.HomelessnessBreak-ins.
www.peaksurveys.com Community Survey Open-Ended 2012 Page 270 K
Open-Ended Questions

Probably crime. The crime rate seems to be going up.City of monument added 80 dollar tax on a 200 dollar gasoline extension permitHomeless population.Crime would be the most important issue facing the community.Young people problems such as gangs, drugs, education, and job opportunities.Education , family , spiritual growth and healthI would think that the crime rate.I don't know.Upcoming electionThe price of gas. Price of food.I would say the budget and services of Colorado springsI think property valueSchools, infrastructure and emergency services.The most important concern for our community would probably be jobs, just like it is everywhere.Depleting are resources, or unregulated growthRoads, and the storm water problems, the utilitiesThe water restrictionsThe roads .Infrastructure.Providing food for the poorSchoolsProbably building back homes that got burnt.I think the schools.BudgetIts getting dangerous around here. Big homeless problem doesn’t make comfort.I would say the economy.The job market, housing market, crime ratePublic transpiration for schoolsJobs or lack ofPresidential electionEconomic issues. Trying to find jobs.Im thinking Peyton not Colorado springs decrease property values. getting harder for every to get everything they need.Getting more job and industryDon't knowThe economy. Probably traffic congestion.Job creation.EnergyJobs, employmentI don’t know I have to think to many, I would like to say crimeRoads. Police. Road conditions need to improve, and police response to crime needs to improve.SchoolingDon’t have oneThe economic status.Jobs and homelessEconomy. Lack of jobs.Un-sure.People calling me on mt call phone which is a business line.Taxes. They are too high.More parks for kids.Storm water.Communication, due to the technology. The fact that people are more individualists, rather than community oriented.Street improvementsRoads and bridgesCity governmentThe federal government is screwing up the community
www.peaksurveys.com Community Survey Open-Ended 2012 Page 271 K
Open-Ended Questions
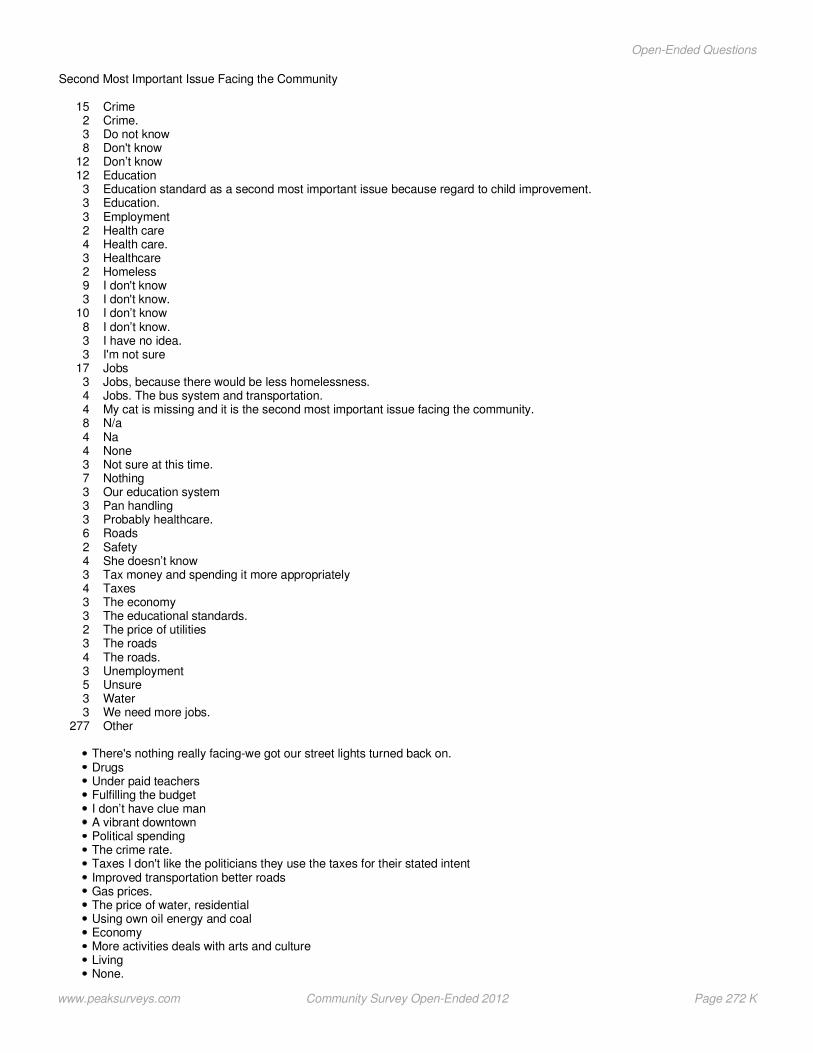
Second Most Important Issue Facing the Community
15 Crime2 Crime.3 Do not know8 Don't know
12 Don’t know12 Education3 Education standard as a second most important issue because regard to child improvement.3 Education.3 Employment2 Health care4 Health care.3 Healthcare2 Homeless9 I don't know3 I don't know.
10 I don’t know8 I don’t know.3 I have no idea.3 I'm not sure
17 Jobs3 Jobs, because there would be less homelessness.4 Jobs. The bus system and transportation.4 My cat is missing and it is the second most important issue facing the community.8 N/a4 Na4 None3 Not sure at this time.7 Nothing3 Our education system3 Pan handling3 Probably healthcare.6 Roads2 Safety4 She doesn’t know3 Tax money and spending it more appropriately4 Taxes3 The economy3 The educational standards.2 The price of utilities3 The roads4 The roads.3 Unemployment5 Unsure3 Water3 We need more jobs.
277 Other
There's nothing really facing-we got our street lights turned back on.DrugsUnder paid teachersFulfilling the budgetI don’t have clue manA vibrant downtownPolitical spendingThe crime rate.Taxes I don't like the politicians they use the taxes for their stated intentImproved transportation better roadsGas prices.The price of water, residentialUsing own oil energy and coalEconomyMore activities deals with arts and cultureLivingNone.
www.peaksurveys.com Community Survey Open-Ended 2012 Page 272 K
Open-Ended Questions
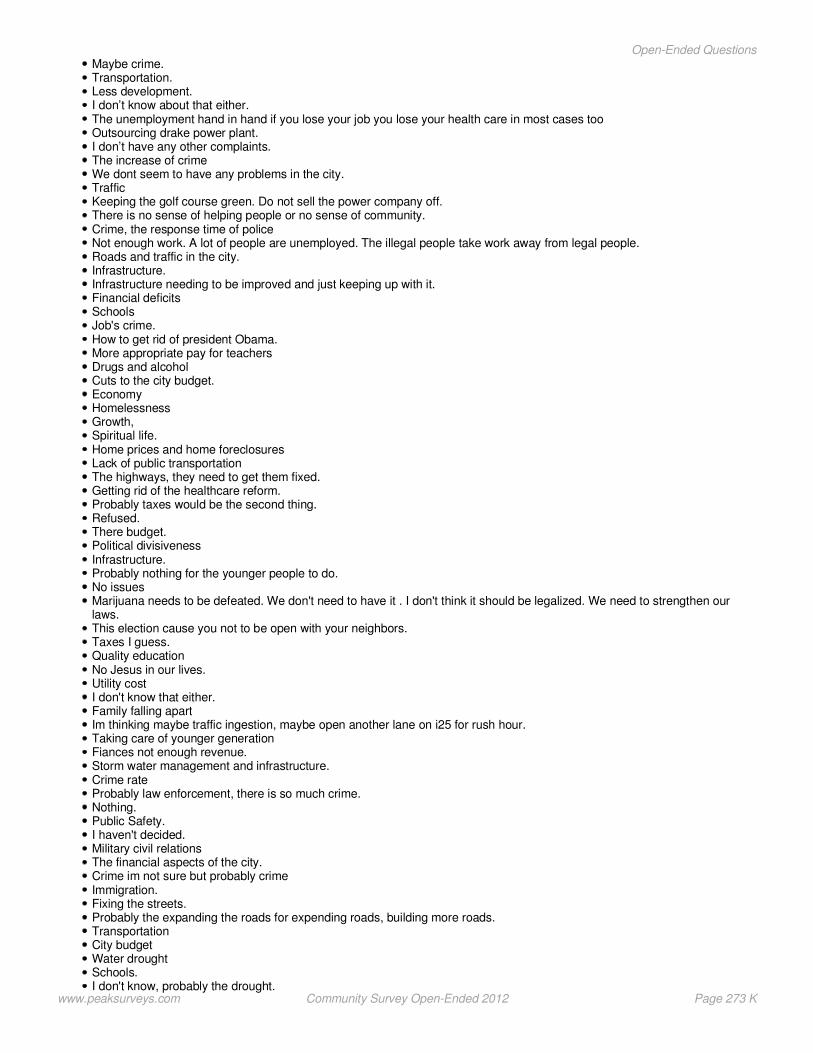
Maybe crime.Transportation.Less development.I don’t know about that either.The unemployment hand in hand if you lose your job you lose your health care in most cases tooOutsourcing drake power plant.I don’t have any other complaints.The increase of crimeWe dont seem to have any problems in the city.TrafficKeeping the golf course green. Do not sell the power company off.There is no sense of helping people or no sense of community.Crime, the response time of policeNot enough work. A lot of people are unemployed. The illegal people take work away from legal people.Roads and traffic in the city.Infrastructure.Infrastructure needing to be improved and just keeping up with it.Financial deficitsSchoolsJob's crime.How to get rid of president Obama.More appropriate pay for teachersDrugs and alcoholCuts to the city budget.EconomyHomelessnessGrowth,Spiritual life.Home prices and home foreclosuresLack of public transportationThe highways, they need to get them fixed.Getting rid of the healthcare reform.Probably taxes would be the second thing.Refused.There budget.Political divisivenessInfrastructure.Probably nothing for the younger people to do.No issuesMarijuana needs to be defeated. We don't need to have it . I don't think it should be legalized. We need to strengthen ourlaws.This election cause you not to be open with your neighbors.Taxes I guess.Quality educationNo Jesus in our lives.Utility costI don't know that either.Family falling apartIm thinking maybe traffic ingestion, maybe open another lane on i25 for rush hour.Taking care of younger generationFiances not enough revenue.Storm water management and infrastructure.Crime rateProbably law enforcement, there is so much crime.Nothing.Public Safety.I haven't decided.Military civil relationsThe financial aspects of the city.Crime im not sure but probably crimeImmigration.Fixing the streets.Probably the expanding the roads for expending roads, building more roads.TransportationCity budgetWater droughtSchools.I don't know, probably the drought.
www.peaksurveys.com Community Survey Open-Ended 2012 Page 273 K
Open-Ended Questions

I would say medicaid also. I have faith in the city council. I am hopefulWater supply.Military cutbacksThe housing marketMore jobs and it would be nice to have better roadsLaw enforcement keeping us safeI would say just services like police, fire roadsLets see probably have to say property taxesEconomySchool over crowdedThe jobsWater and utilities, and growth.Bringing more business to the communityWater waysJobs.Taxes are too low. To support city servicesThey keep taking away from the Safety issues and jobs and the parks are going down.Not having enough money and lack of funding for critical city services.Economics.Well I would say the deficitCommunity services.More things for the teenager's,Road maintenance and utilitiesNone.Lousy streetsNo commentI can't really think of anything else.PotholesCrime, the growth ofFinancial well being. Employment and jobs. I'm working but I have friends that aren'tTransportation for children for school.I think we need to get back down to basic Christianity.Sexual predators would be the second most important issue.Don’t have that problemI just think we all need to stick together and be strong.Public transportationThe political climateOn the otherPublic transportationVeterans affairsFinancial services and the tax base. Decrease in the property value and fixed taxed rates assessmentsNone that I can think ofNo comment.People that ignore the pollutionThe discourse between mayor and local head of utilitiesJobs and the economy.The second most important issue is the economy and fuel pricesExpansion beyond the amount of water we have.Growing bad.I think the second is the businesses and economy.More jobsEconomic problems.Lack of investments in basic city infrastructure including parks and trailsUnemployment, people aren't trained for jobs out there, it goes the the poor education.Employment.Our neighborhood watch.Infrastructure, transportation, hwy 25 needs to be three lanes on each sideRoad conditions.Housing and the turn over of residentsThe roads are not kept up enough I hit a pot hole when I go to workSafety, we need more, public service like police and fire fighters.QualityNot sureThe schools.Good roads for transportation, roads to handle the traffic.Not enough road repair. Repairing. Need to notify residents of pedophiles newly moved into community.Sheriffs office is very short staffedElection
www.peaksurveys.com Community Survey Open-Ended 2012 Page 274 K
Open-Ended Questions
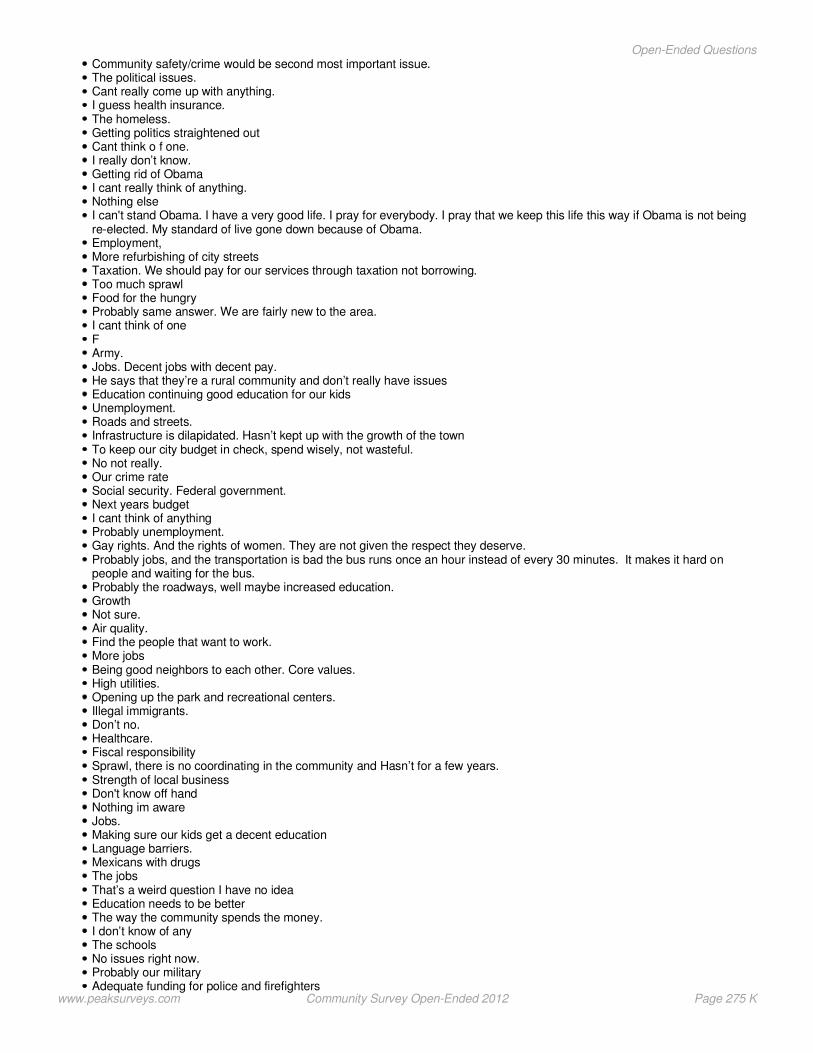
Community safety/crime would be second most important issue.The political issues.Cant really come up with anything.I guess health insurance.The homeless.Getting politics straightened outCant think o f one.I really don’t know.Getting rid of ObamaI cant really think of anything.Nothing elseI can't stand Obama. I have a very good life. I pray for everybody. I pray that we keep this life this way if Obama is not beingre-elected. My standard of live gone down because of Obama.Employment,More refurbishing of city streetsTaxation. We should pay for our services through taxation not borrowing.Too much sprawlFood for the hungryProbably same answer. We are fairly new to the area.I cant think of oneFArmy.Jobs. Decent jobs with decent pay.He says that they’re a rural community and don’t really have issuesEducation continuing good education for our kidsUnemployment.Roads and streets.Infrastructure is dilapidated. Hasn’t kept up with the growth of the townTo keep our city budget in check, spend wisely, not wasteful.No not really.Our crime rateSocial security. Federal government.Next years budgetI cant think of anythingProbably unemployment.Gay rights. And the rights of women. They are not given the respect they deserve.Probably jobs, and the transportation is bad the bus runs once an hour instead of every 30 minutes. It makes it hard onpeople and waiting for the bus.Probably the roadways, well maybe increased education.GrowthNot sure.Air quality.Find the people that want to work.More jobsBeing good neighbors to each other. Core values.High utilities.Opening up the park and recreational centers.Illegal immigrants.Don’t no.Healthcare.Fiscal responsibilitySprawl, there is no coordinating in the community and Hasn’t for a few years.Strength of local businessDon't know off handNothing im awareJobs.Making sure our kids get a decent educationLanguage barriers.Mexicans with drugsThe jobsThat’s a weird question I have no ideaEducation needs to be betterThe way the community spends the money.I don’t know of anyThe schoolsNo issues right now.Probably our militaryAdequate funding for police and firefighters
www.peaksurveys.com Community Survey Open-Ended 2012 Page 275 K
Open-Ended Questions
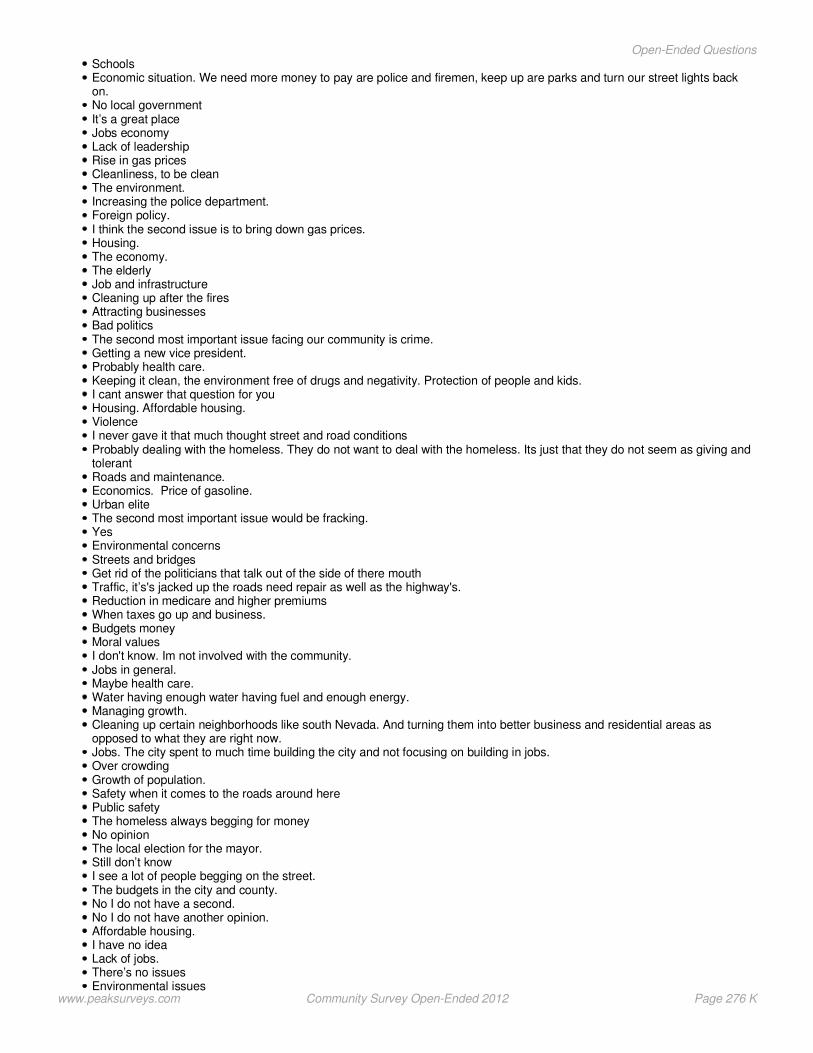
SchoolsEconomic situation. We need more money to pay are police and firemen, keep up are parks and turn our street lights backon.No local governmentIt’s a great placeJobs economyLack of leadershipRise in gas pricesCleanliness, to be cleanThe environment.Increasing the police department.Foreign policy.I think the second issue is to bring down gas prices.Housing.The economy.The elderlyJob and infrastructureCleaning up after the firesAttracting businessesBad politicsThe second most important issue facing our community is crime.Getting a new vice president.Probably health care.Keeping it clean, the environment free of drugs and negativity. Protection of people and kids.I cant answer that question for youHousing. Affordable housing.ViolenceI never gave it that much thought street and road conditionsProbably dealing with the homeless. They do not want to deal with the homeless. Its just that they do not seem as giving andtolerantRoads and maintenance.Economics. Price of gasoline.Urban eliteThe second most important issue would be fracking.YesEnvironmental concernsStreets and bridgesGet rid of the politicians that talk out of the side of there mouthTraffic, it’s's jacked up the roads need repair as well as the highway's.Reduction in medicare and higher premiumsWhen taxes go up and business.Budgets moneyMoral valuesI don't know. Im not involved with the community.Jobs in general.Maybe health care.Water having enough water having fuel and enough energy.Managing growth.Cleaning up certain neighborhoods like south Nevada. And turning them into better business and residential areas asopposed to what they are right now.Jobs. The city spent to much time building the city and not focusing on building in jobs.Over crowdingGrowth of population.Safety when it comes to the roads around herePublic safetyThe homeless always begging for moneyNo opinionThe local election for the mayor.Still don’t knowI see a lot of people begging on the street.The budgets in the city and county.No I do not have a second.No I do not have another opinion.Affordable housing.I have no ideaLack of jobs.There’s no issuesEnvironmental issues
www.peaksurveys.com Community Survey Open-Ended 2012 Page 276 K
Open-Ended Questions
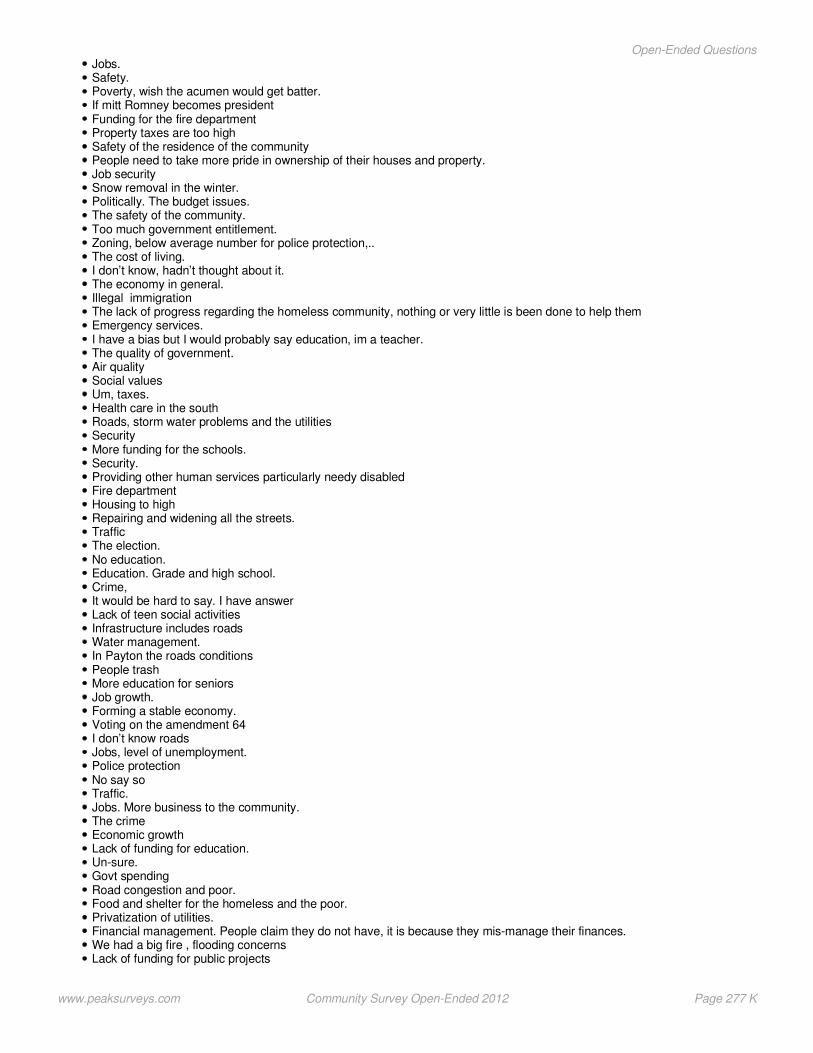
Jobs.Safety.Poverty, wish the acumen would get batter.If mitt Romney becomes presidentFunding for the fire departmentProperty taxes are too highSafety of the residence of the communityPeople need to take more pride in ownership of their houses and property.Job securitySnow removal in the winter.Politically. The budget issues.The safety of the community.Too much government entitlement.Zoning, below average number for police protection,..The cost of living.I don’t know, hadn’t thought about it.The economy in general.Illegal immigrationThe lack of progress regarding the homeless community, nothing or very little is been done to help themEmergency services.I have a bias but I would probably say education, im a teacher.The quality of government.Air qualitySocial valuesUm, taxes.Health care in the southRoads, storm water problems and the utilitiesSecurityMore funding for the schools.Security.Providing other human services particularly needy disabledFire departmentHousing to highRepairing and widening all the streets.TrafficThe election.No education.Education. Grade and high school.Crime,It would be hard to say. I have answerLack of teen social activitiesInfrastructure includes roadsWater management.In Payton the roads conditionsPeople trashMore education for seniorsJob growth.Forming a stable economy.Voting on the amendment 64I don’t know roadsJobs, level of unemployment.Police protectionNo say soTraffic.Jobs. More business to the community.The crimeEconomic growthLack of funding for education.Un-sure.Govt spendingRoad congestion and poor.Food and shelter for the homeless and the poor.Privatization of utilities.Financial management. People claim they do not have, it is because they mis-manage their finances.We had a big fire , flooding concernsLack of funding for public projects
www.peaksurveys.com Community Survey Open-Ended 2012 Page 277 K
Open-Ended Questions
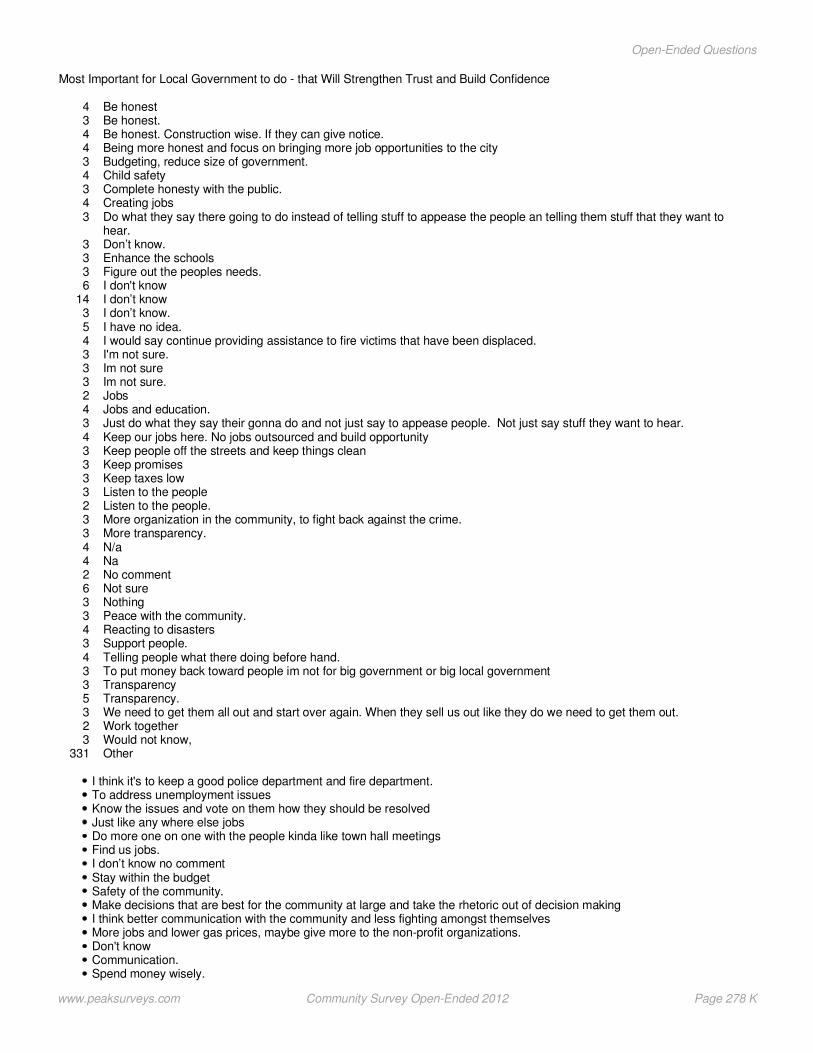
Most Important for Local Government to do - that Will Strengthen Trust and Build Confidence
4 Be honest3 Be honest.4 Be honest. Construction wise. If they can give notice.4 Being more honest and focus on bringing more job opportunities to the city3 Budgeting, reduce size of government.4 Child safety3 Complete honesty with the public.4 Creating jobs3 Do what they say there going to do instead of telling stuff to appease the people an telling them stuff that they want to
hear.3 Don’t know.3 Enhance the schools3 Figure out the peoples needs.6 I don't know
14 I don’t know3 I don’t know.5 I have no idea.4 I would say continue providing assistance to fire victims that have been displaced.3 I'm not sure.3 Im not sure3 Im not sure.2 Jobs4 Jobs and education.3 Just do what they say their gonna do and not just say to appease people. Not just say stuff they want to hear.4 Keep our jobs here. No jobs outsourced and build opportunity3 Keep people off the streets and keep things clean3 Keep promises3 Keep taxes low3 Listen to the people2 Listen to the people.3 More organization in the community, to fight back against the crime.3 More transparency.4 N/a4 Na2 No comment6 Not sure3 Nothing3 Peace with the community.4 Reacting to disasters3 Support people.4 Telling people what there doing before hand.3 To put money back toward people im not for big government or big local government3 Transparency5 Transparency.3 We need to get them all out and start over again. When they sell us out like they do we need to get them out.2 Work together3 Would not know,
331 Other
I think it's to keep a good police department and fire department.To address unemployment issuesKnow the issues and vote on them how they should be resolvedJust like any where else jobsDo more one on one with the people kinda like town hall meetingsFind us jobs.I don’t know no commentStay within the budgetSafety of the community.Make decisions that are best for the community at large and take the rhetoric out of decision makingI think better communication with the community and less fighting amongst themselvesMore jobs and lower gas prices, maybe give more to the non-profit organizations.Don't knowCommunication.Spend money wisely.
www.peaksurveys.com Community Survey Open-Ended 2012 Page 278 K
Open-Ended Questions

Work together become more positive to solve issuesGetting a handle on crime in the area.More jobs and more payAdvocate for the people they represent.Build highways they promised, widen them, bring a lot of construction jobsBe honest and open.Go for what the majority of the people want not to fit there personal needs represent the people like they're supposed toCommunicate.Be transparent.InfrastructureBe transparentThe city government does not seem to put up road blocks for jobs. It is easier to set up jobs here.Work on crime, reducing crimeCommunicationStop showing self interest, and start showing citizen interestToo many things. They are not doing enough for illegal people. They don’t have the right papers but they take jobs. Theytake American jobs.Keep open communication between residence and city council.Not sure of answer.Reaching out and communicating with the community.Restore public transit to reasonable levelsCompetenceCommunicateStay in there lane, take care of things government needs to take.Be honest,Make sure that their presence is know to the entire community and where they stand on certain issuesThey should be more truthfulTake care of safety and the roads.Work on improving the economyNo opinion.Improve social servicesBe responsible with taxpayers moneyKeep things going the way they are.Support local businesses. Lower taxes.Be aware of public opinions.Spend tax payers wisely, live within our means as a communityBe honest with the peopleProbably open there meetings more, and get the stuff out in the news papers more. I like to see them and the mayor gettogether and stop bickering.Take care of the infrastructure and make sure the roads are goodGet more jobs and listen to the public.Mostly to get out of debt.TaxesHonesty would be a good start.Improving the job market and making it easy for businesses to make money.Honesty is a good place to startLimit spending.To be honest, quit taking payoffs.They need to work with the people and be good neighbors with residence. Partyism are too selfish. They don't think aboutthe people.Better communication.I have to think about that.Attract employers to the areaPut Jesus back into the schools.TransparenceBe honest and open.Quit spending so much money.Finding money in budget to insure safety of communityWorking on communication.Have integrity and the financial budgetI think just having the right people in the job, if you have the right people, they do there job better.Keep community together and listen to elected officials. Democracy that is run by the peopleTake care of the safety of the communityTalk to the peopleGet rid of the straw mayor system.Hire trustworthy peopleDon’t knowBe honest and fair.
www.peaksurveys.com Community Survey Open-Ended 2012 Page 279 K
Open-Ended Questions

Maintain a balance budget.More involvement with the population.I haven't decided.Transparency in govDo What’s right for the community even if it means raising taxes.To do what they say they are going to doBe honest for4 oneWell I think first of all they need to be a little more transparent it should be the truth the whole truth and nothing but the truthSpend my money wisely.I really don’t know.Communication with publicInvest into the community and not worry about legislating moralityDevastate that they using tax dollars wiselyProbably transparency and communication.Help small business owners so they can create more jobsBe accessible to citizens via meetings and media help as far as keeping track in the papers. I think, my big thing is we needan alternative newspaper, besides the gazette.Be truthful about budget numbers.Try to find jobs for people and promote tourismCommunication open and honest communication with the peoplePolice protection #1.Being honest with voters.Balanced budgetTo continue openness and communication with publicBe more open.They need to work together and have complete or total clarity; disclosureProbably say roads improvements,Tell the truthFor them to be honest & trustworthy of the peopleDoing all rightTo come togetherGetting things on track. consider all parts of the city.Fiscal conservativeBe open and honest.Repair waterways.Clean up the areas that are on Nevada going towards south gate.They could make utilities private. City council should stop running it. They could turn the street lights back on. Hire morepolice and fire dept personal and train them betterSpend my tax dollars more wiselyThere’s to many people with there hands out and looking out for themselves.Figure out how to spend money more wisely. The communities money.Gas prices.I think to be more transparent .To be open and honest in their actions.Stop doing everything for a buck and start doing things for the people living here.Be honest with the people, and uphold the promises made to the people.TransparentI really don’t know the answer to that.Damn if I know, I wish they would stop calling cause im going to start hanging.I think they do a pretty good job.Not just one ,city leaders take a pay cut so our first responders pay and equipment they need.Listen to the people, what they want or need.I say make their presence known. Get out in the community.Stand up for the Christian beliefs. We need to get more involved in the community and get off our lazy butts.Do what they say they'll do.I think if the mayor keeps doing what he's doing, he could become governor, really like talking about united states issues?Get rid of the convicts in comcorThey are gonna have to keep taxes downFind a way to solve the economic problems, it would nice if they were open minded and if they all got along, and put politicalagenda asideEconomic development. Bringing jobs to c/s. Maintaining quality of life, things like our parksBe more open about how they are spending there money and listen to people more.Roads are horribleMayor and city counsel to come to an agreement of how they are going to operateMaintain and balance the budgetBecome anti business.Limit terms..The local community needs more community programs, jobs, and get kids off the street job creation needs work
www.peaksurveys.com Community Survey Open-Ended 2012 Page 280 K
Open-Ended Questions

Actually talk to the people in the community about that there making decisions about.I think they have to be more honest- quit being politicians and be more honest.I think its an issue of transparency.ComanutionI cant answer that.Job situation, schools, educationWork together and stop blaming each other for things that don't go right.Report accurately conditions, rely on the good judgements. Explain thoroughly and accurately.Parks and lighting.Don’t know too many problemsDo their job.Moor open form with citizen. Like town meetings.Some of the things on the ballot this fall, just being responsible with our tax money.I would say the economy.To keep a balanced budget, keeping the community awareI want the busses to run better.Putting fiances in important places and keeping their wordAttract businessHonesty, you can act like leaders and not politicians.Start hearing our complaints. Increase notifications of possible abductions, rather in single city location, make it statewideinstead. Stranger danger and rapists.The local government should do what they say they will doLeave us aloneSupport militaryIn my political beliefs, local government should stay out of the way.They just need to start making the right decisions. The large payout to the CEO of memorial hospital was unacceptable.More jobs for people that don’t have workI'd like them to finish the woodmen corridor project.Honesty, be honest with people and stay out of our way.Reduce their employee base. They can reduce the cost of our utilities. Expand the airport service.Look and act honestThe truth is I don’t no.I don’t know what that means.Maintain open pathways of communication with the public.Create more jobs.Use money wiselyCant answerGot the information out to the peopleFind out what important to the city.Improve the economy and more jobsI think they are not involved in the community overall enough.Be truthful with people. Be honest and truthful.Raise taxes and take better care of the parks.Getting company to come and offer jobsStop making stupid decisions.Stop lyingImprove public transportation. Improve public safety (police and fire).No secret meetingsTransparency and more involvementJobs, people going back to work again.They need to be honest with the people.Concentrate on locals and not too much on tourism.Manage our city like a business, not like a non profit organization. To develop our budget around the majority of our citizensand not around the minority.Increase school funding and lower class sizes.Create more jobsTell the truthStrength and trust, honest government, that’s all, and fair.I9 have no ideaHold elected official accountableStay out of my businessI think public safety, improve public safety, fire, roads.We need to kick religion out of law. Any kind of religion.Trying to put money in the streets my streets and sidewalks are falling apart and they haven’t done anything about it.sidewalks are lifting and the city hasn’t done anything.Be open with their meetings and that kind of stuff.I would like them not to -- cronyism. I think the mayor is giving a deal to his best friends, ex: the YMCAI don not know.
www.peaksurveys.com Community Survey Open-Ended 2012 Page 281 K
Open-Ended Questions

For them to tell the truth.Take care of citizens in need of help.The government needs help from the people.Cut our strength lights back onBe honestyDo what they say they are going to do , be a man or a woman of their word.I really don't know how to answer that right now.They did a good job during the fire and should have community meetings.Police and fire protection.Lower taxes.Healthcare issues.I think stop allowing fear allowing fracking. Stop selling out to corporationsTaxes for services needed.Be honest with peopleCut taxes and bring gas prices downListen to the all concernedDo what they say and be honestThe city council to stop their in fighting and get along.Quit telling lies. Be truthful with the people.Get public works going and don’t cut the funding again.I look towards god's government.Freeze there wages.Be transparent and to tell the truthGet our police department back up to strength.Direct resources to education.Sure of the honesty and integrity of leadersI think education is number one,I guess I don’t really have an answer for thatIncrease communication on situations at handDon't lie to the people.Help the elderly and poor folksBasically for the democrats to win the electionSpend money wiselyDo a good jobPublic safetyJust keep learning about the issues that are plaguing our city so that they can make informed decisions.The most important is for them to do something while in office.Listen to the public questions and answer as best they canIncrease law enforcement and the fire departmentTake care of themselvesPay attention to waterLess politics and do more for the communityUnable to answerRaise taxes to pay for things that make a communityThey need to do something about gas pricesNothing they can doStop privatizing our civic resources.Follow through on what voters vote for instead of twisting and doing what they want in the end.Actually listening to the constituents, it seems like when people come to talk they only listen for a few minutes. In one ear outthe other.The economy.The local government has to keep the schools doing well, streets clean, and keep property value high.Hire more police.I am unsure.Go to workGood communicationReach out to all residents not just a select few. Involving more stake holders in decision makingHave a better political people in your officesNot to be persuaded by big business.Become followers of god.For any position in government to get out there and say what needs to be said and actually do what needs to be done onevery level.Not cut any jobs.Listen to the people and what they have to say and stop running how they believe it should be, because it's the people thatmatterTurn to the heavenly father because he is the only one that can get us out of the mess that were in.Focus on the betterment of life! Whatever issues crop up i.e. unemployment, children issues, school problem, supplies, food,utilities, etc.
www.peaksurveys.com Community Survey Open-Ended 2012 Page 282 K
Open-Ended Questions

Quit lying to us.I would say quit taxing businessesTo be more open minded to bring business to Colorado springs and not to be so difficult with extreme taxes and regulationaccept with in oil and gas, they need to be regulated.Open communicationIm not sure how to answer that question,.Address the problem of increasing crime.Get rid of there closed door meetingsGovernment needs to improve on communicating with community regarding taxes and what they do with the money.Show better use of funds.Follow thru with what they say they are going to do.Honesty in advertisements. Stop the drama.They all need to get on the same pageI think they need to be more clear honest and objectiveStart telling the truthNot sure.CommunicateNot be so political and being so divided.I have no answerKeep their word and do what they say they will do.New people voted in.Keep us posted on what’s going on.Live within the budget that taxes provide for and don’t continuously ask for more taxes. balance the budget.Follow through with promises.Just be straight with people, and they don’t try to push revenue. Just don’t repeat the storm water enterprise.Keep cost under controlBe honest and forthright on the issues community facing.The best thing they could do is tell the truthBring in more businessBeing more transparentSo you don’t believe that they lie to us n then I live outside the city limits so I can only vote for county commissionerI wouldn’t be able to guess.Keep in touch with the voters.Build community,Provide more jobs for the community.Commun icationQuit playing politics and getting things done and quit playing party line politics and get the job done.I haven't thought about it that muchBetter planning g of development and economic responsibility.Be transparent on the issues and bring everything before the public.Be more transparent on what is going on.Work on the roads.Create more jobs for Colorado springs which will make more taxes which will bring more police officers which will bring downthe crime rate.Be much more environmentally aware.The most important is to take care of there city, take care of the roads and cities, take care of the education, and do whatthey say there are going to do. Take care of the crime.Using tax dollars properlyTell the truth don't white wash.I don’t have an answer for that one.I have no ideaI think they all need to be on the same pageCommunication with the leadersDoing things more for residence rather than business.EducationTo be honest with us and not say something and next week we are doing something elseThat they would spend tax money wisely instead of wasting it.Equal rights.Be trustworthyLevel the playing field.Balance the budget.Be supportive of small businessMake the right choices. People in charge. The best interest of all the people of the community.Eliminating entitlements.Rely more upon the public, instead of the college league professors,Be honest and loyal to the peopleKeep taxes down.To do what they are elected for and serve the people.
www.peaksurveys.com Community Survey Open-Ended 2012 Page 283 K
Open-Ended Questions
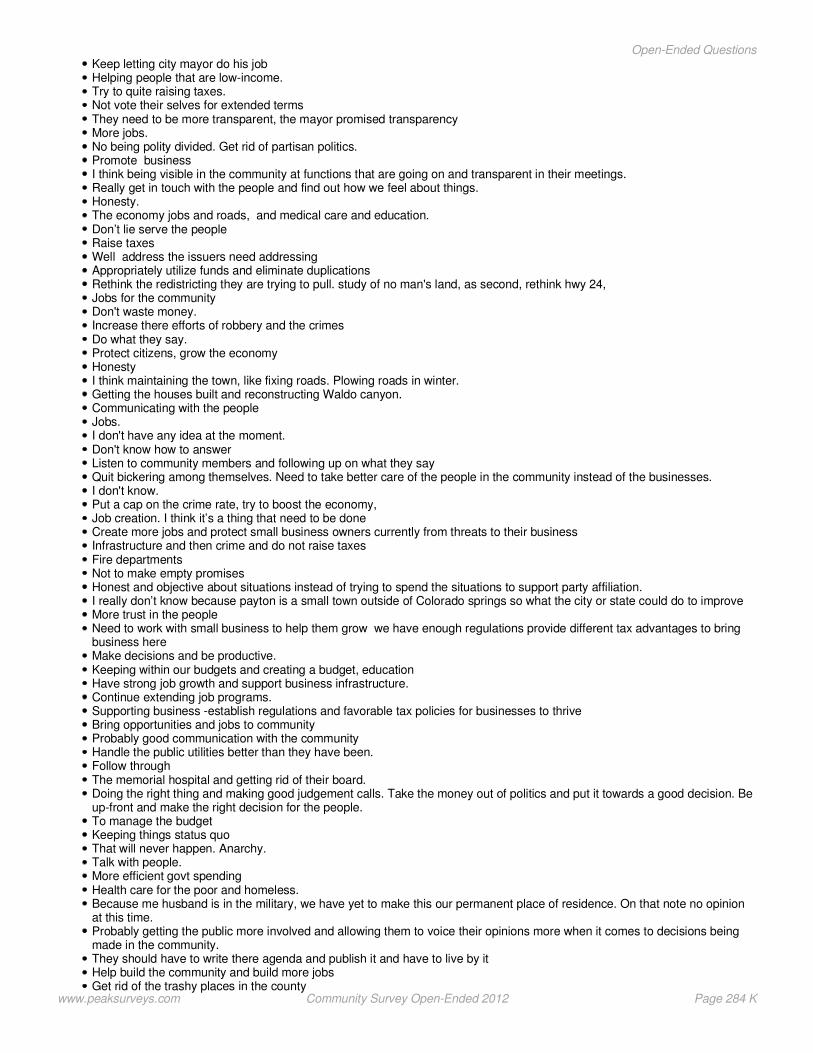
Keep letting city mayor do his jobHelping people that are low-income.Try to quite raising taxes.Not vote their selves for extended termsThey need to be more transparent, the mayor promised transparencyMore jobs.No being polity divided. Get rid of partisan politics.Promote businessI think being visible in the community at functions that are going on and transparent in their meetings.Really get in touch with the people and find out how we feel about things.Honesty.The economy jobs and roads, and medical care and education.Don’t lie serve the peopleRaise taxesWell address the issuers need addressingAppropriately utilize funds and eliminate duplicationsRethink the redistricting they are trying to pull. study of no man's land, as second, rethink hwy 24,Jobs for the communityDon't waste money.Increase there efforts of robbery and the crimesDo what they say.Protect citizens, grow the economyHonestyI think maintaining the town, like fixing roads. Plowing roads in winter.Getting the houses built and reconstructing Waldo canyon.Communicating with the peopleJobs.I don't have any idea at the moment.Don't know how to answerListen to community members and following up on what they sayQuit bickering among themselves. Need to take better care of the people in the community instead of the businesses.I don't know.Put a cap on the crime rate, try to boost the economy,Job creation. I think it’s a thing that need to be doneCreate more jobs and protect small business owners currently from threats to their businessInfrastructure and then crime and do not raise taxesFire departmentsNot to make empty promisesHonest and objective about situations instead of trying to spend the situations to support party affiliation.I really don’t know because payton is a small town outside of Colorado springs so what the city or state could do to improveMore trust in the peopleNeed to work with small business to help them grow we have enough regulations provide different tax advantages to bringbusiness hereMake decisions and be productive.Keeping within our budgets and creating a budget, educationHave strong job growth and support business infrastructure.Continue extending job programs.Supporting business -establish regulations and favorable tax policies for businesses to thriveBring opportunities and jobs to communityProbably good communication with the communityHandle the public utilities better than they have been.Follow throughThe memorial hospital and getting rid of their board.Doing the right thing and making good judgement calls. Take the money out of politics and put it towards a good decision. Beup-front and make the right decision for the people.To manage the budgetKeeping things status quoThat will never happen. Anarchy.Talk with people.More efficient govt spendingHealth care for the poor and homeless.Because me husband is in the military, we have yet to make this our permanent place of residence. On that note no opinionat this time.Probably getting the public more involved and allowing them to voice their opinions more when it comes to decisions beingmade in the community.They should have to write there agenda and publish it and have to live by itHelp build the community and build more jobsGet rid of the trashy places in the county
www.peaksurveys.com Community Survey Open-Ended 2012 Page 284 K
Open-Ended Questions
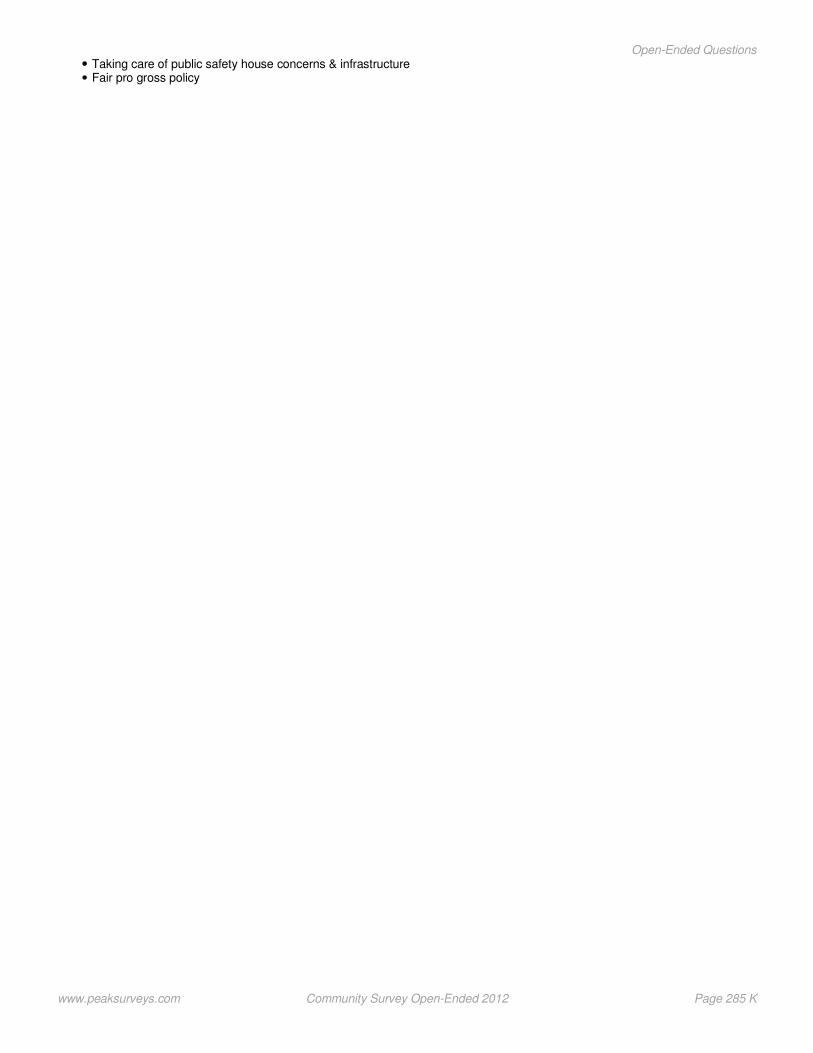
Taking care of public safety house concerns & infrastructureFair pro gross policy
www.peaksurveys.com Community Survey Open-Ended 2012 Page 285 K
Open-Ended Questions

Open-Ended Responses
Arts and Culture
Why do you believe it improves the quality of your life?
2 Because it does 2 Educational 8 I don't know 2 I just do 2 Not sure2 Cultural diversity 2 Enjoyment 6 I don’t know 2 It just does 849 Other4 Don't know 2 Family n friends 2 I enjoy it 2 Musician2 Don’t know 2 I do not know. 2 I enjoy it. 2 No
Could be anythingBecause it is very helpful,Getting out seeing different thingsIt opens our minds, it good for history and cultureDon't want to say spiritual but relaxationGives me an extra brain cell, I don't know, it just does cause I enjoy itImportant more important the professional sports it feed the souls makes our community viable brings people in and it's animportant part of the communityWell its part of humanity it's what were all about joy compassion beautyIt helps create an open mind for the childrenCause it is a good source of entertainment, stress relief, and educational.Because it provides opportunity for getting out and seeing new things and learning new things.Just makes you feel free and grateful. The scenery the greenery and the company.It's a getaway, one part of culture we learn about historyAdds variety to your life with more opportunitiesWithout there is nothing to doTo me they are essential my life, because I love all kinds of musicHas been a part of her life for 4 generations.Because it is relaxing been an artist his whole life.Because I think it gives enjoyment and teaches you about other cultures it benefits the quality of lifeBecause it brings about a lot of happiness and enjoyment. I have an all most five year old and I feel that it kind of gives heran education outside of the class roomIt allows me to get out in the openOpens my children's eyes, the creativityI feel better after going to something like that, it improves my mentality/moodI don't know availabilityIt exposes you to different things and ideas. It's good for the kids to see and know different things.Keeps residence in the area attracts touristStimulate your mindWithout culture or any heritage there would not be any type of community.Simply because it does I don't know what else to say without arts we would be pretty poor music particularly.Save moneyWell, I'm an artist.Because it give you an appreciation the talents of othersBecause I enjoy itI don't know it's got great entertainment value there is something to be learned I don't know there is just so many thingsabout itIt gives an outlet for recreationMakes everybody's life a little betterUm, I'm an artist and I do a lot of different things. I just enjoy it. For myself and othersFor entertainmentIt is more for my family and grandkidsEducational and entertainment valueI think it opens our minds and touches our hearts,It gets me out there I always go run those trails and everything.I think that we ought to be aware of good music, plays and culture that are available in the city.I used to have a dog and I would take him to the dog park and it was important for his exercise and my exercise and good forthe environmentYesHelps me to believe the future is bright like the sun like the sunI think that there has to be that kind of outlet for people to appreciate themselves
www.peaksurveys.com QLI Open-Ended Responses Page 286 K
Open-Ended Responses
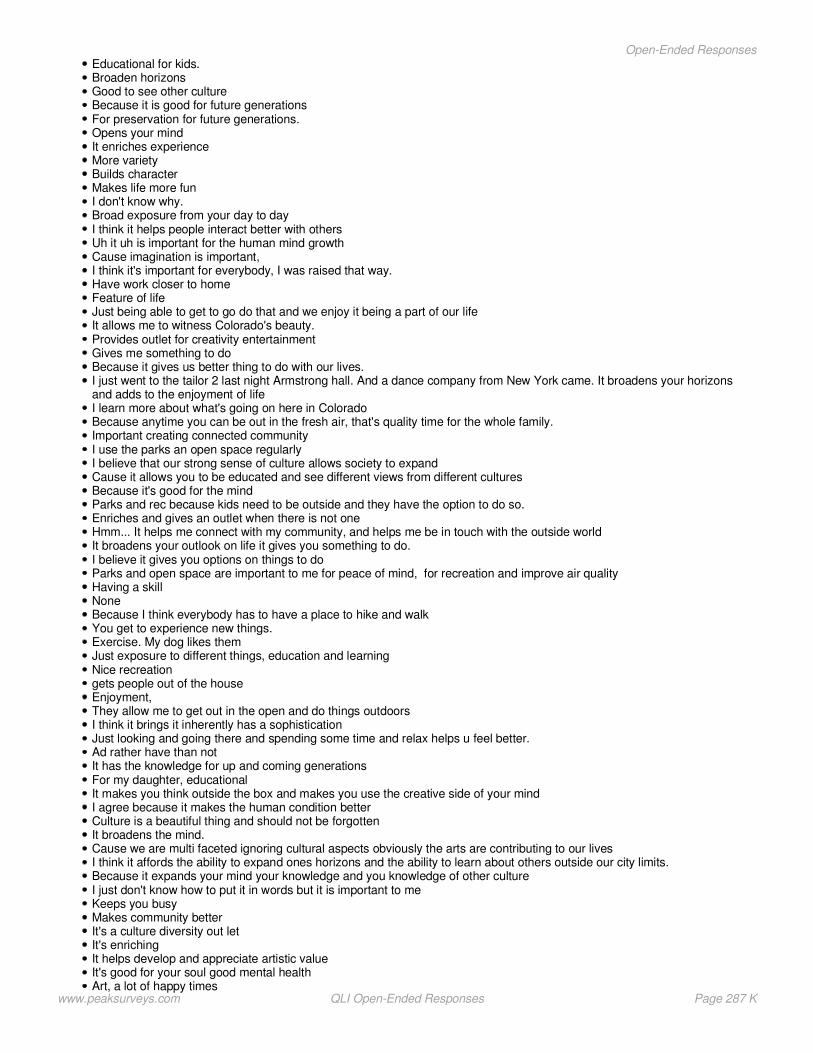
Educational for kids.Broaden horizonsGood to see other cultureBecause it is good for future generationsFor preservation for future generations.Opens your mindIt enriches experienceMore varietyBuilds characterMakes life more funI don't know why.Broad exposure from your day to dayI think it helps people interact better with othersUh it uh is important for the human mind growthCause imagination is important,I think it's important for everybody, I was raised that way.Have work closer to homeFeature of lifeJust being able to get to go do that and we enjoy it being a part of our lifeIt allows me to witness Colorado's beauty.Provides outlet for creativity entertainmentGives me something to doBecause it gives us better thing to do with our lives.I just went to the tailor 2 last night Armstrong hall. And a dance company from New York came. It broadens your horizonsand adds to the enjoyment of lifeI learn more about what's going on here in ColoradoBecause anytime you can be out in the fresh air, that's quality time for the whole family.Important creating connected communityI use the parks an open space regularlyI believe that our strong sense of culture allows society to expandCause it allows you to be educated and see different views from different culturesBecause it's good for the mindParks and rec because kids need to be outside and they have the option to do so.Enriches and gives an outlet when there is not oneHmm... It helps me connect with my community, and helps me be in touch with the outside worldIt broadens your outlook on life it gives you something to do.I believe it gives you options on things to doParks and open space are important to me for peace of mind, for recreation and improve air qualityHaving a skillNoneBecause I think everybody has to have a place to hike and walkYou get to experience new things.Exercise. My dog likes themJust exposure to different things, education and learningNice recreationgets people out of the houseEnjoyment,They allow me to get out in the open and do things outdoorsI think it brings it inherently has a sophisticationJust looking and going there and spending some time and relax helps u feel better.Ad rather have than notIt has the knowledge for up and coming generationsFor my daughter, educationalIt makes you think outside the box and makes you use the creative side of your mindI agree because it makes the human condition betterCulture is a beautiful thing and should not be forgottenIt broadens the mind.Cause we are multi faceted ignoring cultural aspects obviously the arts are contributing to our livesI think it affords the ability to expand ones horizons and the ability to learn about others outside our city limits.Because it expands your mind your knowledge and you knowledge of other cultureI just don't know how to put it in words but it is important to meKeeps you busyMakes community betterIt's a culture diversity out letIt's enrichingIt helps develop and appreciate artistic valueIt's good for your soul good mental healthArt, a lot of happy times
www.peaksurveys.com QLI Open-Ended Responses Page 287 K
Open-Ended Responses

It gives you something as little bit differentI don't have an answer for thatRelieves stress nice to get involvedIt's just good stuff, broadens your mind, and helps you think outside the box.I gives me mileageBecause it gives us something to look at some place to go and it just enriches lifeI enjoy it and it enhances the communityIt enriches my lifeI traveled the world to find culture art and so on.Just don't knowWell just personal experiences I know it enhances my life. Art and music... I don't know what life would b w out itI have a 4 year old and it gives us things to do.Things that enjoy to do on my off timeJust looks good for environmentThere different things to look atYou need something besides work its make more rounded peopleI come from New York and we have theater and arts and dance and it makes life more enjoyableThere are certain things I enjoy doing, a couple weeks ago there was concert and enjoyed it.Not stuck indoorsIt make me a better rounded personIt makes life richerBecause they are beautiful.Because it just makes me happier, good for your healthMusic oriented and the music of artsCreative person and makes her happyI can sit on my front porch and look at the mountains the air here is fresher than a lot of other places and the water is great.It makes me more cultured it provides more things to do with the familyGives me something alternate to do besides drinking & stuff - keeps me pre occupied as wellUmm... I don't know I just feel that it does.I feel it is essential if I were to use themIt's good to be around nature and to not develop the whole cityWell we r trying to teach our family that there is more to life then the TV and games , we need to appreciate the arts as awholeIt makes you live bigger, broadens how you look at life and the worldIt keeps you well balanced with different culturesCreativityIts stimulatingKeeps our children safe something to doImproves learning skills and keeps me activeGives you something to do to take your mind off the hum drumIt brings more knowledge of people history and cultureUm it's just an essential part of being a human being.Lets us enjoy nature that is provided to usDifferent fun educationalIt's just we're all creative people so it's just fun, it's enjoyable and entertainmentIt helps you to broaden your horizonsHelps me to be open mindedLike to get out and go see the activities that the community puts on and the different things that it brings.I don't know why arts give you and educationHelps improve everybody's quality of life.I just think they overall make you a better personDepending on the artwork or whatever it is can make you happy, or give you a different perspective on life.Gives me more avenues for recreation and diversity to get out and enjoy the communityGood for the kids. Good learning experienceToo many things to put us in a pigeon holeLive betterDistractionIt makes me a better person over allIt improves me in generalBecause it keeps your mind and heart activeBecause of my heritage.Mother coming from CA. Her belief systemWe are all still livingBrightens your knowledgeI think the arts are an essential part of any communityIt enriches the individual which enriches the communityImportant for kids and familyJust for a variety of things and also to help my grandchildren to understand the importance of it.
www.peaksurveys.com QLI Open-Ended Responses Page 288 K
Open-Ended Responses
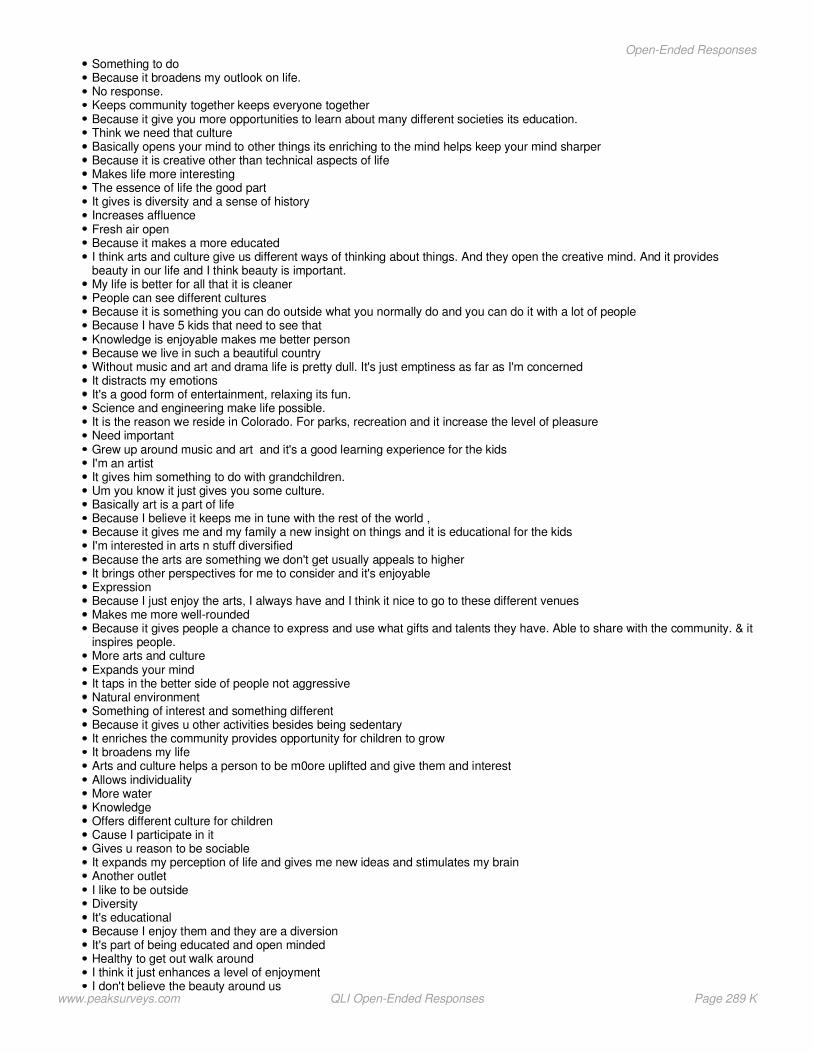
Something to doBecause it broadens my outlook on life.No response.Keeps community together keeps everyone togetherBecause it give you more opportunities to learn about many different societies its education.Think we need that cultureBasically opens your mind to other things its enriching to the mind helps keep your mind sharperBecause it is creative other than technical aspects of lifeMakes life more interestingThe essence of life the good partIt gives is diversity and a sense of historyIncreases affluenceFresh air openBecause it makes a more educatedI think arts and culture give us different ways of thinking about things. And they open the creative mind. And it providesbeauty in our life and I think beauty is important.My life is better for all that it is cleanerPeople can see different culturesBecause it is something you can do outside what you normally do and you can do it with a lot of peopleBecause I have 5 kids that need to see thatKnowledge is enjoyable makes me better personBecause we live in such a beautiful countryWithout music and art and drama life is pretty dull. It's just emptiness as far as I'm concernedIt distracts my emotionsIt's a good form of entertainment, relaxing its fun.Science and engineering make life possible.It is the reason we reside in Colorado. For parks, recreation and it increase the level of pleasureNeed importantGrew up around music and art and it's a good learning experience for the kidsI'm an artistIt gives him something to do with grandchildren.Um you know it just gives you some culture.Basically art is a part of lifeBecause I believe it keeps me in tune with the rest of the world ,Because it gives me and my family a new insight on things and it is educational for the kidsI'm interested in arts n stuff diversifiedBecause the arts are something we don't get usually appeals to higherIt brings other perspectives for me to consider and it's enjoyableExpressionBecause I just enjoy the arts, I always have and I think it nice to go to these different venuesMakes me more well-roundedBecause it gives people a chance to express and use what gifts and talents they have. Able to share with the community. & itinspires people.More arts and cultureExpands your mindIt taps in the better side of people not aggressiveNatural environmentSomething of interest and something differentBecause it gives u other activities besides being sedentaryIt enriches the community provides opportunity for children to growIt broadens my lifeArts and culture helps a person to be m0ore uplifted and give them and interestAllows individualityMore waterKnowledgeOffers different culture for childrenCause I participate in itGives u reason to be sociableIt expands my perception of life and gives me new ideas and stimulates my brainAnother outletI like to be outsideDiversityIt's educationalBecause I enjoy them and they are a diversionIt's part of being educated and open mindedHealthy to get out walk aroundI think it just enhances a level of enjoymentI don't believe the beauty around us
www.peaksurveys.com QLI Open-Ended Responses Page 289 K
Open-Ended Responses

Creates a better atmosphere in the communityPeace of mind ,relaxation, enjoymentIt broadens your mind gets you out and helps you to socializeFor childrenBecause there has to be something better to do other than drinking, hunting, and shootingEntertainmentYou learn new thing and it gives you a different outlook on thingsGives you a chance to experience something new. Sometimes to entertain.Can't live without artMostly for my children and grandchildrenBecause its society's greatest accomplishmentFreedom of lifeArts give u something to do different cultures it's good to the human condition, just like the hiking it get you involvedCannot sayMusician very important to help you grow moreGives you something to think about and appreciateBecause it's a beauty.It's my job and passionBecause I'm pretty artistic and I get inspiration from other art and cultureIt makes you a well rounded person and brings beauty into your life, very enjoyable to be involvedFor recreation & education.It helps expand the mindBecause there's a lot of activities in town going on all the time in the fine arts center and places like that.I'm a cultural personIt builds cultureExposes you to different thingsI have no ideaInformation and history and its enjoyable.Expands knowledge of things other than math and scienceI grown up around cultural activityI like to go to concerts, I like the musicBeneficial intellectually to peopleLeads to a broader view of thingsI'm a music teacherMakes life more enjoyableBecause of the learning experience and what you can share and the pure enjoyment of itBecause it makes a well rounded individual and gives people a look into things outside themselvesEnriching ,fulfilling and brings awarenessBecause we need to preserve that for future generations so they can be enriched too.It pleases me.It makes life interestingI do what doIt helps with depressionGives you variety,Just the fact that it exists and other people that aren't disabled have the advantage of going to different functions andparticipating in the arts.Love going to itIt's a feeling of having self controlThink it provides peace and self gratificationBecause it provides a diverse experience it broadens ones horizons.It makes me look at things differently. Makes me appreciate things that I may have never appreciated before. Makes me feelglad I'm alive.I think that everyone needs to learn something new in their lifeHelps define who we are, enjoy and can afford itEnjoyment of lifeIt's important for everyone to know their historyEntertain improve quality of every ones livesPresents different ideasentertainment valueToo many people have things to complain about so if they more they might have less to complain aboutBecause its educational and culturalIt allows you to expand your knowledge about things other than making money.Someplace to go sometimeI like to live free and wish it for everyone elseIt makes aware, good for future generationsNeed more of the beauty, enjoy it a lot moreIt gets you an appreciation for diversity it broadens your horizonsIt gives me a better understanding of the world from other people's views
www.peaksurveys.com QLI Open-Ended Responses Page 290 K
Open-Ended Responses
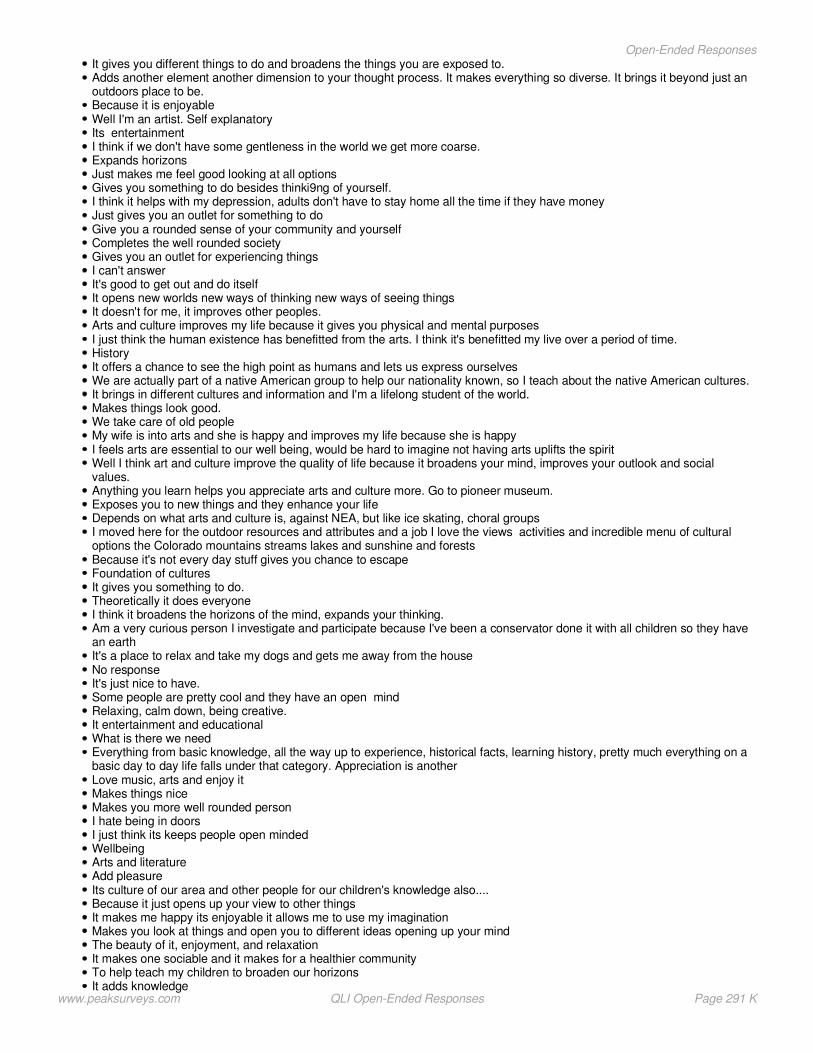
It gives you different things to do and broadens the things you are exposed to.Adds another element another dimension to your thought process. It makes everything so diverse. It brings it beyond just anoutdoors place to be.Because it is enjoyableWell I'm an artist. Self explanatoryIts entertainmentI think if we don't have some gentleness in the world we get more coarse.Expands horizonsJust makes me feel good looking at all optionsGives you something to do besides thinki9ng of yourself.I think it helps with my depression, adults don't have to stay home all the time if they have moneyJust gives you an outlet for something to doGive you a rounded sense of your community and yourselfCompletes the well rounded societyGives you an outlet for experiencing thingsI can't answerIt's good to get out and do itselfIt opens new worlds new ways of thinking new ways of seeing thingsIt doesn't for me, it improves other peoples.Arts and culture improves my life because it gives you physical and mental purposesI just think the human existence has benefitted from the arts. I think it's benefitted my live over a period of time.HistoryIt offers a chance to see the high point as humans and lets us express ourselvesWe are actually part of a native American group to help our nationality known, so I teach about the native American cultures.It brings in different cultures and information and I'm a lifelong student of the world.Makes things look good.We take care of old peopleMy wife is into arts and she is happy and improves my life because she is happyI feels arts are essential to our well being, would be hard to imagine not having arts uplifts the spiritWell I think art and culture improve the quality of life because it broadens your mind, improves your outlook and socialvalues.Anything you learn helps you appreciate arts and culture more. Go to pioneer museum.Exposes you to new things and they enhance your lifeDepends on what arts and culture is, against NEA, but like ice skating, choral groupsI moved here for the outdoor resources and attributes and a job I love the views activities and incredible menu of culturaloptions the Colorado mountains streams lakes and sunshine and forestsBecause it's not every day stuff gives you chance to escapeFoundation of culturesIt gives you something to do.Theoretically it does everyoneI think it broadens the horizons of the mind, expands your thinking.Am a very curious person I investigate and participate because I've been a conservator done it with all children so they havean earthIt's a place to relax and take my dogs and gets me away from the houseNo responseIt's just nice to have.Some people are pretty cool and they have an open mindRelaxing, calm down, being creative.It entertainment and educationalWhat is there we needEverything from basic knowledge, all the way up to experience, historical facts, learning history, pretty much everything on abasic day to day life falls under that category. Appreciation is anotherLove music, arts and enjoy itMakes things niceMakes you more well rounded personI hate being in doorsI just think its keeps people open mindedWellbeingArts and literatureAdd pleasureIts culture of our area and other people for our children's knowledge also....Because it just opens up your view to other thingsIt makes me happy its enjoyable it allows me to use my imaginationMakes you look at things and open you to different ideas opening up your mindThe beauty of it, enjoyment, and relaxationIt makes one sociable and it makes for a healthier communityTo help teach my children to broaden our horizonsIt adds knowledge
www.peaksurveys.com QLI Open-Ended Responses Page 291 K
Open-Ended Responses
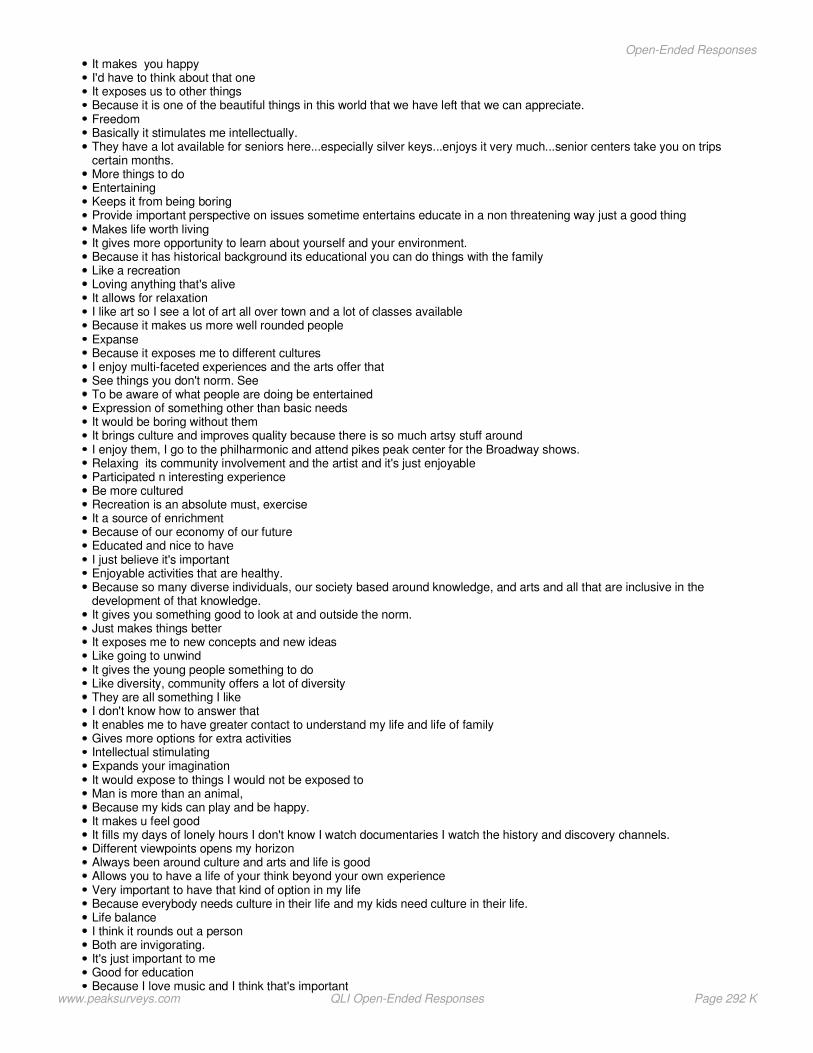
It makes you happyI'd have to think about that oneIt exposes us to other thingsBecause it is one of the beautiful things in this world that we have left that we can appreciate.FreedomBasically it stimulates me intellectually.They have a lot available for seniors here...especially silver keys...enjoys it very much...senior centers take you on tripscertain months.More things to doEntertainingKeeps it from being boringProvide important perspective on issues sometime entertains educate in a non threatening way just a good thingMakes life worth livingIt gives more opportunity to learn about yourself and your environment.Because it has historical background its educational you can do things with the familyLike a recreationLoving anything that's aliveIt allows for relaxationI like art so I see a lot of art all over town and a lot of classes availableBecause it makes us more well rounded peopleExpanseBecause it exposes me to different culturesI enjoy multi-faceted experiences and the arts offer thatSee things you don't norm. SeeTo be aware of what people are doing be entertainedExpression of something other than basic needsIt would be boring without themIt brings culture and improves quality because there is so much artsy stuff aroundI enjoy them, I go to the philharmonic and attend pikes peak center for the Broadway shows.Relaxing its community involvement and the artist and it's just enjoyableParticipated n interesting experienceBe more culturedRecreation is an absolute must, exerciseIt a source of enrichmentBecause of our economy of our futureEducated and nice to haveI just believe it's importantEnjoyable activities that are healthy.Because so many diverse individuals, our society based around knowledge, and arts and all that are inclusive in thedevelopment of that knowledge.It gives you something good to look at and outside the norm.Just makes things betterIt exposes me to new concepts and new ideasLike going to unwindIt gives the young people something to doLike diversity, community offers a lot of diversityThey are all something I likeI don't know how to answer thatIt enables me to have greater contact to understand my life and life of familyGives more options for extra activitiesIntellectual stimulatingExpands your imaginationIt would expose to things I would not be exposed toMan is more than an animal,Because my kids can play and be happy.It makes u feel goodIt fills my days of lonely hours I don't know I watch documentaries I watch the history and discovery channels.Different viewpoints opens my horizonAlways been around culture and arts and life is goodAllows you to have a life of your think beyond your own experienceVery important to have that kind of option in my lifeBecause everybody needs culture in their life and my kids need culture in their life.Life balanceI think it rounds out a personBoth are invigorating.It's just important to meGood for educationBecause I love music and I think that's important
www.peaksurveys.com QLI Open-Ended Responses Page 292 K
Open-Ended Responses
Some place to goIt is complicated I don't know the answerCouldn't imagine living without itIt's a source of exercise an community, it's beautifulUm because without that you wouldn't be able to understand people and it's a just big part of my life.It's something to do other than drugs or alcohol.It shows the goodness in lifeAdds recreation gives u something to do free entertainmentIt depends on how your raisedOpens my mind, exposes me to different ideas, creativity, new ways of thinking, it enhances our life. Live theatre isexceptionally wonderful. We go to musical performanceswe belong to the fine arts center. Lots of thingsFeeds the soulTo me it's because of the beauty of it. And it makes the environment look better. And your home is worth more.Help to release and have funUm just because it is a creative aspect.It keeps people, healthy, sane, balancedIt expands my knowledgeEducationAnything that is enjoyable and rounds out your overall understanding of lifeGets away from the technicalIt's how we make moneyGets you to think differently develops empathy to humanityI think it elevates the level of my quality of lifeBecause I learn different thingsIt gives us a perspective of a lot of things.Appreciate the arts, something that we pass on that improves our culture, a certain joy in a work of art. Took 4 years of finearts, and has an artist in the familyKeep us more healthyGives u escapeI don't think it didEnriches and broadens your life. An important part or the community.Be practicalI think arts you have to more than everyday life it brings joy.Both of my kids with ms work on art projects and music to keep eye/hand coordination.I think its good for everyone to experience itMy wife told me so.You have to be exposed to good culture and good care to have enjoyable life in Colorado springsI play guitarBecause it gives everybody something fun and productive to doBecause it's something nice to go do.Give something to do when not workingMakes for a more well rounded person.Because it gives me mental stimulation and broaden my horizonJust having access to the outdoors and the parks having those helps give the community identityIts entertainmentIt is an option.Gives a better perspective and good for the communityIt opens your horizons to other things in your own small worldThe economy.I'm not sure how to answer that.Well, it make it more interesting.Add's another dimension.I don’t participate very much I cant answer itNot sure.Because that’s the way I was raised.Because it give you an inside of other ways of thinking and improves peoples lives. And it makes them less likely to getinvolved in crimeBecause it opens your mind to other things and expands your mind and appreciate things.Artist myselfMore visual entertainmentIt not only improves my life, it improves life to come.Gives opportunity for culture.Because art is a world wide wonderful tool. Everybody in the world should know art. A way to get to know others anddifferent cultures. It is gods will that confects everybody to get along.Expands horizons, and good for kidsIt’s a big education. I take my kids downtown. They make stuff with paint. They learn and have a good time. I take them twicea month and they love it.
www.peaksurveys.com QLI Open-Ended Responses Page 293 K
Open-Ended Responses

It is good for community both for children and adults.It sponsors creativity and thinking skills.It just helps people appreciate arts and culture.Because it gives me a more rounded experience of lifeAn essential part of civilized countryBrings things to doIt extends enriches and educates, needs to be there for our childrenPhysical and mental well being.Like Orchestras.It is important to make a well rounded community.I'm not sureBecause it is good to have arts in the communityBecause it enhances being.I think it makes you grateful for your surroundings and it adds pleasure to your life.Important aspect that helps learn and respect other cultures.Basic part of humanityGives us things to do in our communityI sure don't know ,I’m over 90 years old-world war veteran, legally blind and losing your hearing.Just as a sense of entertainment and something to do outside my job and everyday life.It expands your knowledge. It should be promoted and participated with.Multiple opportunities.Because it broadens your horizonsBecause it gives me another viewpoint.It gives me more things to doGives you a different outlook on life.I guess, that it maybe just gives you something to do.You can get out and do things it just depends on if they are maintaining it or notIt should improve everybody's quality of life to be educated.Helps the kids and stuff to learn and there is places to go and enjoy the artIt enhances my global view, its good for my soulYou have to have balance in your life and some of these things do helpTo be satisfied.It makes you more mature and tells you about other people.I think it necessary part of life to create balance and beautyIt improves my kid which includes mine.Fun to see the culture for educational purposes. Fun and brings people together from different cultures.Basic to a well rounded individualOpens the mind and soul.Just because we can all express what we all want to believe in.Not much because it is good.Culture is the way you were brought up, like if you grew up in Hispanic family, being catholic is important in your life.Its like a coffee break to beauty.It gives the kids something to doWe all need to have areas to show our naturesBecause im a big fan of the arts, and we have a big venue for arts painting and dance, and symphony im strongly in supportof that.Generally humans are naturally creativeBecause it makes you more roundedBroader your horizonsIt opens a person to diff things they m9ight not be used to.I believe it is essential in culture and youths mindsAgreeIf nobody every got to see a Michelangelo painting their missing it out its history, if they never heard of Wyatt Earp they’remissing out, its history. History has moved the world.Its good for the community.More exposure improves the quality of lifeI haven't thought about it really.It expands your mindTo purpose happinessArts helps u to explore different ave. Of you r life to make it betterMakes me a broader person, and knowledgeable.Something to do such as plays.Expands our minds and knowledge about What’s around us.It allows for different perspectives and opinions to be expressed and formulated that allows and individual to make a morewell rounded decision about an value or ideaBecause adds fulfillmentIt provides enjoyment it could be thought provoking, entertaining.Well it's nice to have.
www.peaksurveys.com QLI Open-Ended Responses Page 294 K
Open-Ended Responses
Helps with creating confidence in peopleBecause I have family and friends who are artists and I keep track of the events and exhibits. I try to participate.Opportunities for entertainment, and learning.Gives you a chance to get out and see something different and it is better than sitting around watching tv every night.Broadens my horizons to other ways of thinkingGives pleasure makes people feel better forget about problemsI think arts are good for the spirit and mind.Because it broadens my experience and gives alternate opinions and alternate entertainment, not just mainstream mediaBecause I think it gives us and idea of what the rest of the world is all about. Also gives us and understanding of differentcultures.Its encourage creativityEverybody needs it there lifeNothingForgot.Broadens my horizonsIt gives me the opportunity to expand my arts and culture knowledgeIt does not improve the quality of your life.I think when you’re exposed to the arts, your mind is open to a lot of things. It opens your mind to everything else.By exposing me to new ideas in different waysIt keeps my wife happyI grew up around it and it’s a form of education.It gives you a different perspective of life. Makes you appreciate perspective in community and life.Some where for our children to go.Because it opportunity for the kids to learn.Well because I think it teaches us about who we are. And teaches children to be creative and to create.It gives us something better to do other then sit around and watch t.v., gives time to socialize with other people. enjoyableand get to learn different things, and different cultures.It's available if I want to use itBecause I'm an artist. I think it helps develop people and broadens peoples perspective. It enhances the experiences ofevery day life.Because it allows you to explore.Just the availability of it for people who enjoy that kind of stuff. It's important for people to have access to it.Opens the window of opportunityIt opens your world to a whole new perspective.Helps with education.It gets you out and about and participating the community. To get to know the community and participate.It's important to know all about that stuff.You have a freedom of choice.Because im an artistIt helps recreation and the amusement of peopleI think arts and culture is incredibly important and it takes us out of the boxBroadening perspectiveIt’s a part of the human whole that needs to be developed and respected.It’s a diversion, educational for kidsBecause im a human being. It is part of being a whole personNo commentYou have to think.Life is about options the more you have the betterI have an artist in the family and I know she takes pride in that. It's also an education thing, we all need art and music in ourlives to give us some perspective. Art can be every where you see.I can't think of it right now.Its improves quality by having a lot of historic sites, its so diverseProvides some substance.I think it improves quality of life because it allows us to understand other cultures. Less we have the more we stay uniform toa culture.It adds change and intimal growthGreat for kidsBecause I love the theater but there’s a lot of people who don't . I would rather feed and cloth the homeless but if everythingis going well and we could have it I want it.It presents a variety of perspectives and different ways of seeing the world, it is a different way of knowing the world. Its anbalanced life.Connection between history and cultural and the next generation. Communicates to next generation.Its important for a well rounded communityIt increases tourism and makes people want to move here.Because that’s what we about.Because it's like education - it opens up your life to other things.Gets people outdoorsIts always been apart of me.
www.peaksurveys.com QLI Open-Ended Responses Page 295 K
Open-Ended Responses

Something going on.It important that people experience itI enjoy the outside.It helps expand my sons diversity in his education and expands artistic and creative ability to express himself emotionally.It is by far the best way to express yourself.Beneficial.Enjoy itArts and culture are vital to understanding the community and human nature.It gives me a window into What’s going on, what's available for entertainment and opportunities to educate yourself.Because I enjoy.I just like the entertainmentIts entertaining.We all love artNeeded in peoples to improve day to day activity.My wife was an artist before a major stroke. We have a lot of artwork. I think artwork eases mental stress.Why wouldn’t I.For people to be kinder obey the law trusty the lordExpands your mind and the communityBecause people seem to enjoy it here. I enjoy it.It exposes me to thing I don’t know about.Necessary and stimulating for the use and the economy makes quality of life betterN/aBecause I enjoy the symphony and good music and I can't do it by myself.It enriches my life. It adds to it. Its part of my education and part of my pleasure.Broadens one's experiences.Because it makes the community look nicer. And it gives the community more appeal.It makes life more interestingBetter than tv and educationalIt's good for kids to be exposed to that. More of it should be free to the public.Well it adds to the perspective of thingsKeeps us connected to our humanity and it educatesI just like the arts.It gives us a break from the constant stress from the crime and politics. It's a relief.Increases diversityIt’s a method which we can communicate with each other on a personal level. It’s a great form of entertainment.Its good for diversity.I don't follow the artsThat is easily accessibleMaintenance for what we have now.Its who we are.I don’t know it just does.I guess I like good police protection n fire protection if it was good wouldn’t have the problems we haveI think it gives people places to go and things to do, live a healthier life.Im an artist. It basically is every part of my life.It really has no effect on my life.It improves your quality of life.I believe it's because that if people are cultured and there's more opportunity for culture, then people grow. Bettercommunity, and better community members.Because I am part of it.There are more things to do.Options to attend events locallyEverything around us starts with artBecause your are exposed to new things.Well it broadens the mind. A person ought to be open to new things.Cause it enhances your background knowledge. and opens your mind.You should be well rounded. Arts are an important part of life.People are getting older at a young age.Because things are not just plain and boring it creates individualismIts necessary for healthy life.For kids to playIt shows people different things you can create that are enjoyable to others.Give you a different aspect, different point of view, broadens horizonsThat's a hard one. I really can't answer that question.I just feel better that it does.Gives me something to do.De-stresses and opens the mind to other avenues and creativity.It adds another dimension in my life.It makes for a more broad based and better educated community.
www.peaksurveys.com QLI Open-Ended Responses Page 296 K
Open-Ended Responses

There’s not one thing there are manyI like music and movies things like that.I think it exposes my children and us to the alternative cultures around usCan't think right now. Just woke up.Because it gives me the opportunities to keep my mind sharp I appreciate the beauty around me.We have so many difference genres for people to be involved with artisticallyBecause you learn a lot from diversity.Need arts and culture to be more of a rounded lifeIt makes me happy when I'm creating. I'm a very creative person. I love when people look at what I do. They like what I doand it makes me happy when people approve.It gives relief and pleasure in our lives and beauty is essential for peace of mind.Because it ads something that you don’t get in everyday situationGives a balance to everything else going on in the worldBecause I just live it and enjoy it the way it isIt makes things nice.Exchange of point of views and sharing of positive ideasSpiritually educationally emotionally all kinds of ways it improvesArts and culture is absolutely essential to provide our kids with an outlet.Good for the childrenThey basically add feeling and culture itself to the life.When it comes to art and music it shows people other cultures and various forms of music. Art appreciation modern art, awhole new light of What’s out there besides what we have right now.I think it is important to see all the options available.I believe it improves because it gives you the chance to go out and do something.It's just part of life.The art helps takes your mind off of What’s going on ,and makes you feel better in general.I don’t know I just said thatMake us more well rounded as a society.Because it gives people the chance to learn about past.I think it challenges the human race as a whole.I would say that its kind of a window into humanity. Considering a very large portion of the American public is self-medicatingIts something that’s not a bad thing. Its just something I enjoy.Activities and entertainment are good for people as a community and individually. It helps bring out peoples talents and helpsthe soul.Arts there are so many thing that are art, the views, the music. Here in Colorado springs we have so many views and artistacts that we can appreciate I think that is appreciable to even the children.It gives an outlet or an out to deal with the challenges facing the Colorado springs area.Because everyone needs diverse opportunity, to grow mentally. It helps your physical well being and gives you theopportunity to understand people and culture.It exposes us to other things . it has a positive effectCause im a artist and I appreciate good art and music and theater.To have a broader view of the worldIt is important to me because it gives me something more to enjoy each day.Variety exposure to different things.Outlets that reduces stress that connects to our family and others.It’s a well rounded education you can obtain.No answer givenIt uh wow guess it opens up new culturesIt doesn’t.Places we can go walking and is fun to do.Makes people happyIt gives my grandchildren a place to go and play and someplace to go. They enjoy going to the park. Since I take care ofthem it helps me to.Its more diverse and more stuff to come in contact with.Helps us think beyond ourselves, brings the community together in different ways.Opens broadens interests, entertainment, opens awareness to outside thoughts opinions, beliefs.Gives you more varied optionsIt broadens your outlook on things. enjoyment.Exposes people to new thingsIt improves over all life in general. Gives you a better feelingOutdoor activity I hike a lot inexpensive and good for my healthBecause me personally music and art allows me to be who I want to be .Because it enriches us, get to see and experience different things. It helps the children with learning.Necessary for well rounded education and lifeGives me a chance to go out and do something instead of being home, it broadens use on different cultures and makes youappreciate life better.It's essential for happy good living I think.
www.peaksurveys.com QLI Open-Ended Responses Page 297 K
Open-Ended Responses
It gives people something to do and takes the stress away from your job.It gives people, it adds to our culture. It’s a step up, people look out side of themselves, and increases enjoyment.Because it gives you something to focus on.I just feel like it enriches your life.Are very important to mental health.The way some art make you feel and so forthMore opportunities and more things to do in the communityBecause gives you more rounded education .I don’t know.Were going back to imaginationBecause we have diversity. Living a life without diversity is boring.We use it every dayI think it makes our city better and it broadens our horizonsI think it adds joy and the quality and dimension of lifeDoesn’t pertain to me personally. Its good for other people who are interested in it.Not very muchBecause the arts make you feel good, keeps people happyNew experiences, and different things.Enhances community socialness . community involvement and learningBecause it pretty much expands your mind. Is an adventurous thing.It's educational.Niece who is involved.Enjoyable. Exposing my kids to the opera.It promotes community involvement.Because I would want myself and my family to have some well rounded opportunity.Expands my horizons to different aspects of lifeI think they motivate people to improve their life. Encourage people to get more education.No comment.Um culture is a good thingYes I believe it strengthens the quality of life.Exposure is important to everyoneIt provides escape of the pressures of daily life.Cultural heritage is very important to preserve and recognize.Exposure to other culture through arts helps us understand ourselves and the world around us. It educates us and makes usless ignorant.It just does.I just enjoy it.It enriches are culture,Offers varietyExpands my point of viewKeeps the mind busy keeps u interested in lifeIt opens your ability to visit different thingsBecause we enjoy it.It's better for people to see the different types of culture.Give us culture experienceCause its part of my life I need it and im an artist and good for your mind. I have been an artist for many years.Gives you stuff to doIt gives people something to do and broadens their horizonsThe different outlooks on life and to enjoy the benefits of itWhat I learned it is important to our children. Sharing the arts with others.Because I get the information.So far so goodBecause I enjoy the arts.Opens other thought processesIt makes you a better person and it helps your communityIt gives you a different perspective and opens up your mind.Because it exposes us to the art and gives us variety.It's enjoyable, helps relieves ve stressIt introduces us to areas of life that we might not otherwise experienceProvides us with beauty and creativity.Because the culture is what we teach kids that it is all about. Very important to teach our kids what the city is all aboutIt gives you the opportunity to view new cultures and experience new things.I don’t know Christ improves of quality of lifeIts makes a more well rounded person to go along with everything we do everydayThe more we learn about different cultures the more accepting and understanding we could be towards each other. Wewould be more of a team as a whole instead of in general.Because it is creative and stimulating.Always important, uplifting
www.peaksurveys.com QLI Open-Ended Responses Page 298 K
Open-Ended Responses

It gives different points of view to kids so that it expands their mindsHelps keep different things coming into townTwo children are artists, life is more than workI think its important for education and growth and appreciate the arts and culture of the community and it provides a balancefor an academic education.Arts are very important because if you learn nothing but mechanics then you have no balance in life.It provides options for recreationBecause it not only gives knowledge and creativityBecause... I don’t know need more than just work need cultureIt's what you live for. Without arts, there's no quality of life.Opens up to other things in lifeIm satisfiedBecause its what were all about.Because I think it’s a part of the education program.FulfillingCultural and nice to have.Having a job.Having the options to things normally not having an initial interest inThe beauty in the world is reveal thru the artsIt further expand for the mental instead of just sitting around.The open spaces arts air quality outdoors.Because it teaches you about other things, such as past history.It helps develop the history and background of a community.Balance.Being able to have access to information, being able to pass it on to friends, family, and community. To be more involved.It gives people an opportunity to express their feelings & emotion and the ability to createI think its important that everybody has access and learns about arts and cultureIts everything that makes life worth livingI like it
Why do you believe it does not improve the quality of your life?
2 Don't participate 2 N/a 2 No interest 188 Other3 I don't know 2 Na 2 Not interested
No interest in them.Normally I don't go to art stuffMost of the art and entertainment is memorial and I won't give them my money and blastfamousProbably does, but it doesn't for me. I don't feel the need and the city shouldn't be responsible 4 paying for itThere are billions of people around the world that life without it.I just do not pay attention to art and stuff like that.Not sureBecause I have little interest in itCause there are things much more important such as food medical careI don't participate in artsI do not participate in arts and culture activitiesI don't go to balletIn the eyes of the beholderDepends on what it isDon't think there is culture in springsI don't go to those I'm more scientifically orientedI don't use themIt's not essential.Does nothing for meUmm I don't have an answer. It doesn't.Because I really do not take part in that type of thingBecause it's all about work and a paycheck. And art and culture don't get things doneI don't participate in it I know they collect tax money for those who do enjoy itThey don't care about the people here the business closing resources suckI just don't believe that they have anything to do with my quality of life , I believe in the arts but I don't think that they shouldbe publicly fundedI don't care to much for the arts or anything like thatI am disabled so there is not a lot I can doI don't know how to answer your questionCan't affordIt's not a high priority for me
www.peaksurveys.com QLI Open-Ended Responses Page 299 K
Open-Ended Responses
Just don't partakeCause it doesn't effect my lifeI just don't involve myselfI don't think there's enoughBecause I'm not into arts & culturesUninterestedDon't go to museums don't go out to muchNo personal interestI don't really go to observe art,Has no effect on my lifeIt has no effect on what I do on a daily basisMostly because I do not have the time to participate in most of it.Because we subsidies a lot of our equality. And the schools focus too much on arts and things not required for our nation'sfutureNot something I really likeOutside influences don't have that big an influence on my lifeI barely leave the houseNot a artsy guyI don't think it improve my life one way or the otherDo not participateBecause family comes first if a family does not have a good mother and father there is no reason pursue other endeavorsDoesn't further my education. I'm not going to gain anything from it financiallyI really don't have much to do with itI don't see how it affects my life whatsoeverLittle to do with artsIt doesn't matter, we already have it so it doesn't matter we have one in Colorado Springs and it's just fineI don't use itNo use for itEnjoy other things such as golfing traveling and playing cards as well volunteer workJust totally unnecessaryI don't go to the parks n so on that r here I go to churches I'm upset that the bathrooms were closed at the parksBecause it doesn't put anything in my bank accountI have more education than 3 peopleDon't go to any of those thingsI don't know anything it does for meJust never been a really big impact in my lifeDon't use itI don't think we have a lot of truthful understanding, what we are told is not completely honestIt's always run by people who use public money and don't careI guess because I just am not interestedCity has spent tons of money downtown on arts that no one visits or pays attention to.Don't needBecause I have no interest in it.I can't remember last time I was involvedI just don't attendno interest.Because I don't want to pay taxes on themThat just doesn't interest meIt's all publically funded...They don't matterI don't do itI don't have anything to do with itUnnecessaryNever interestedI think it does but I don't really see a lot of it in the springs. That's why I don't think it does, because I don't see it.I'm just not in to that kind of stuffNot into artI don't participate in artBecause I don't go to movies, and I don't do that so what do I get out of it.I think it to me has very little meaning in my life low priority to meI really don't knowWell what they generally put something on the side of the road, they don't do anything useful. It is a piece of steel crap notart.Don't go out muchHas nothing to do with thatNever been into art I guess, and there is not much around this town.Doesn’t feed me, not essential for life!Because I'm not an artsy person, and art is not a big part of my life, I like pictures and such but it's not a big part of my life.
www.peaksurveys.com QLI Open-Ended Responses Page 300 K
Open-Ended Responses

I don't really participate in those events.I do not get involved with it, so it doesn’t change my quality of life.I am not into art stuffIm happy the way I am and that’s all I care about.Don’t careDoesn’t effect me either wayWe can provide that ourselvesIf it is government funded I don not approveRefusedJust not a very big issue to me.It's not that important to me. I am not apart of the arty community.Because it doesn’t do anything for my life or any one I know.Because I do not need itBecause I could care less.I'm a technical person.Because it's not something im interested in.Because we have bigger issues for the community that could improve the quality of life.I think we have plenty of opportunity the percentage of utilizationNo time to participate outside of the home.Im not much into arts and culture because I lead more toward a spiritual lifeIts not area of interest to meI live in a rural area don’t have the optionIt just doesn’t have anything to do with what I doDon’t knowI think we have a lot more to worry about than just the arts.It has no effect on my lifeI do not partake of itBecause it emphasizes the wrong things.Doesn't matterDon’t use itDon’t participateBecause I do my own thing.Because im not associated in that fieldI don't care about it.When u drive to Denver the rest area is closed it used to be open now its notI don’t use it a lot.How much art in the family is good but education is more importantArt is important , but activities are more importantI don't participate in it. It has never been an interred to me.Because I don’t get out to see any of it.I just feel that there’s not a place in politics for that it should be a public affair.Because my life is already fulfillingJust not interestedNot very into artNot involved arts and cultureI don’t pay much attention to it, I do my own thing.I wish I had it to give to people.I really enjoy math and scienceNo interest in itHas no impact on my lifeDoes not improve my quality of life.There is other pressing issues.I have nothing to do with itI really have any contact with arts and craftsIt doesn’t affect me in any way.I just don’t care for art with the exception of musicNo access to themDoesn’t help me at allJust haven’t been involved with most it.Other things more important rite nowDon't really care or heard about it.Im just not interested in itBecause it has not done anything for me.I just don't encounter it at all.I'm not , I’ve never been someone whose really been into art. I don’t consider myself a very cultured individual.I just don’t see many applications.There’s plenty of parks and culture through out the world its my job to find not the government job to provide it.I would actually be somewhat inclined to agree because younger generations need it.
www.peaksurveys.com QLI Open-Ended Responses Page 301 K
Open-Ended Responses

I don’t depend on it. I don’t think they need to put money there. We have a lot of shortages in that.It does but do not engage in the communityMy personal perceptive I disagree.Mainly because I'm not too much into the arts or cultural activities.Because im not interested in it.There are other things that are more important to me it has not personally impacted me.I don't think the government should be involved.I don’t have much cultureArts are of no interest.Because I don't have time to engage in it.Because I don't go any where. I don't take advantage of them.Well I don’t participate.Only god improves the quality of my lifeBecause I am not interested in neither of the two.Don’t really have the money to afford it.Uncertain exactlyBecause they do not do anything for me.Because of where I live in payton its all in Colorado springs, lack of art and cultureI'd rather be outside than inside.Doesn’t effect me I don’t do anything with parksI don’t really participate in itIts not for me its for my kidsNever have a chance to enjoy itBecause I'm not into it and it's too expensive and these opportunities aren't available to my kids.There’s no value in it
www.peaksurveys.com QLI Open-Ended Responses Page 302 K
Open-Ended Responses

Survey Script
Peak Surveys
www.peaksurveys.com
Community and QLI Survey 2012

Community Survey
Hello, my name is __________ and I am calling from______________. We are conducting a survey concerning your local community which we define as including your City and County. We are not selling anything and it will take only a few minutes. SCREEN: Are you over 18 and a resident of El Paso County? Yes CONTINUE No TERMINATE RECORD: Teller or El Paso County (5% Teller, 95% El Paso) RECORD: Gender 1. How would you rate the overall quality of life in the Community?
Excellent 1 Good 2 Not so good 3
Poor 4 DK/NA 5 2. Would you say things in the Community are headed in the right direction, or wrong direction?
Right direction 1 Wrong Direction 2 DK/NA 3
3. In your opinion, what is the most important issue facing the Community? (OPEN ENDED with PRECODES) 4.In your opinion, what is the SECOND most important issue facing the Community? (OPEN ENDED with PRECODES) 5. What primary source of information do you utilize when considering getting involved with your community or volunteering?
Friends or Family Church Newspaper Local TV news Internet Local Non-profit organizations Other DK/NA
6. In general, when it comes to addressing important community issues, who are you most likely to trust? (READ AND ROTATE)
Local government 1 Local businesses 2 Nonprofit organizations 3

Religious organizations 4 Someone else 5 DK/NA 6
For the following people or organizations, please tell me if you have a favorable or unfavorable
opinion of them. If you have never heard of them, please feel free to say so.
7. The County Commissioners
Very favorable 1 Somewhat favorable 2 Somewhat unfavorable 3 Very favorable 4 Never heard of them 5 DK/NA 6
8. Do you live within the city limits of Colorado Springs?
Yes – proceed, NO – SKIP QUESITONS 9&10
9. The Mayor (Colorado springs only)
Very favorable 1 Somewhat favorable 2 Somewhat unfavorable 3 Very favorable 4 Never heard of them 5 DK/NA 6
10. Colorado Springs City Council
Very favorable 1 Somewhat favorable 2 Somewhat unfavorable 3 Very favorable 4 Never heard of them 5 DK/NA 6
11. What is most important for local government to do – that will strengthen trust and build confidence?
Open ended 12. Would you say that TABOR, the taxpayer’s bill of rights, has had a positive or negative impact on the community?
Generally positive impact 1 Generally negative impact 2 Really makes no difference 3 Don’t know enough about it 4 Never heard of TABOR 5 DK/NA 6

13. How favorable are you to considering amending TABOR? Strongly favorable 1 Somewhat favorable 2 Somewhat unfavorable 3 Strongly unfavorable 4 DK/NA 5 I’m going to read you a list of issues. For each one, please tell me how concerned you are about
that issue.
Very Somewhat Not very Not at all DK/NA Concerned Concerned Concerned Concerned
14. Employment and jobs
1 2 3 4 5
15. Drugs and alcohol 1 2 3 4 5
16. Growth 1 2 3 4 5
17. Affordable housing
1 2 3 4 5
18. Health care costs 1 2 3 4 5 19. Water supply and quality
1 2 3 4 5
20. Effective community leadership
1 2 3 4 5
21. Services for the homeless
22. Access to mental health care
1 2 3 4 5
23. Access to quality early childhood education
1 2 3 4 5
24. Student achievement
1 2 3 4 5
25. Arts and culture opportunities
1 2 3 4 5
26. Crime rate 1 2 3 4 5
27. Voter participation 1 2 3 4 5 28. Community engagement in local issues
1 2 3 4 5
29. Public Transit 1 2 3 5
30. Land use

QLI
Q30: How do you feel the local economy compares to the national economy?
Choices Much better than national economy 1 Better than national economy 2 Same as national economy 3 Worse than national economy 4 Much worse than national economy 5
Q31: What do you think the biggest environmental challenge is facing the Pikes Peak Region today?
Choices Air quality 1 Water quality 2 Water supply 3 Energy supply 4 Recycling 5 Other 6
On the following questions, please tell me your level of agreement with the statement.
Q32: Parks, recreation, trails and open spaces are essential to my community.
Choices Strongly agree 1
Agree 2
Disagree 3
Strongly Disagree 4
Q33: I am satisfied with the level of maintenance and service in parks, recreation, trails and open spaces.
Choices Strongly agree 1
Agree 2
Disagree 3
Strongly Disagree 4
Q34: Arts and Culture improves my quality of life. Choices
Strongly agree 1
Agree 2
Disagree 3
Strongly Disagree 4
(IF 1 OR 2 GO TO 20A, IF 3 OR 4 GO TO 20B)
Q34A: Why do you believe it improves the quality of your life?
Verbatim
Q34B: Why do you believe it does not improve the quality of your life?
Verbatim

Q35: How safe do you feel walking in your neighborhood during the night? PROBE: Is that
very/somewhat safe/unsafe? Choices Very safe1 Somewhat safe2 Somewhat unsafe3 Very unsafe4
Q36: Please tell us your level of agreement with the following statement: The needs of the homeless are
being adequately addressed in the Pikes Peak region?
PROBE: Is that strongly agree/disagree? Choices Strongly agree1 Agree2 Disagree3 Strongly disagree4 Don't know5
Q37: How accepting of the differences in race, ethnicity, religious preference, and gender orientation do
you consider the community to be?
Choices Very accepting1 Somewhat accepting2 Not very accepting3 Not accepting at all4 Don't know / NA5
Q38: How important do you believe it is to have a community that is accepting of the differences in race,
ethnicity, religious preference, and gender orientation?
Choices It is very important1 Somewhat important2 Not very important3 Not important at all4 Don't know / NA5
Q39: I would like to ask you about any voluntary activity you or other members of your household may or
may not have done in the past year. By this I mean not just belonging to a service organization or donating
money, but actually working in some way to help others for no monetary pay.
During the last 12 months how often did you or other household members of your household spend on
charitable or voluntary service activities?
Choices More than once a week Several times a month Once a month Once or twice a quarter Rarely Never Don’t know/NA

Q40: How often have you or other members of your household donated money or property to charity in the
last 12 months? By donating I mean making a voluntary contribution with no intention of making a profit
or obtaining goods or services for yourself? Choices Weekly Monthly Quarterly Occasionally Never Don't know / NA3
Q41: In the last year, have you attended any public meetings in which there was discussion of community
affairs?
Choices Yes1 No2 Don't know / NA3
Demographics
I have just a few final questions that are for statistical purposes only.
43. In what year were you born?
44. Do you consider yourself a Democrat, Republican, an Independent or something else? Democrat 1 Republican 2 Independent 3 Other 4 Unaffiliated 5 DK/NA/REFUSED 6
45.. What is that last grade that you completed?
Grade school 1 Some high school 2 High school graduate 3 Some college 4 College graduate 5 Graduate school 6
Don’t know/refused ( DO NOT READ) 7 46. What was your approximate household income?
Under $25,000 1 $25,001 to $49,999 2 $50,000 to $74,999 3 $75,000 to $150,000 4
Over $150,000 5 DK/NA/Refused 6
47. Which of the following best describes your racial or ethnic background?
White of Caucasian Black or African American Hispanic, Spanish, or Latino Asian Other 31a. Are you of Hispanic origin? Yes No Refused
48. What is your current employment status?
Employed by other organization Self employed Unemployed Homemaker/keeping house Student Retired Disabled Other
49. Zip Code: