2012-15 road policing programme - nz transport agency · 2012–15 road policing programme page | 6...
TRANSCRIPT
2012-15 Road Policing
Programme
ISSN 2230-4002 (electronic)
The 2012–15 Road Policing Programme (RPP) was prepared by the NZTA, and approved by the Minister of Transport in
consultation with the Minister of Police, in accordance with section 18 of the Land Transport Management Act 2003.
2012–15 Road Policing Programme
Page | 3
2012–15 Road Policing Programme
18B18BContents
1 Introduction ............................................................................................................................................................ 5
2 Strategic context .................................................................................................................................................. 6
2.1 Safer Journeys Road Safety Strategy 2010–20 ......................................................... 6
2.2 Government Policy Statement on Land Transport Funding ..................................... 6
2.3 NZTA’s Road Policing Investment Framework – investing for outcomes ............... 7
3 Investment .............................................................................................................................................................. 9
3.1 Total investment ....................................................................................................... 9
3.2 Long-term financial forecast ..................................................................................... 9
3.3 Investing for outcomes ............................................................................................. 9
3.4 Investment by road policing activity ........................................................................ 9
4 Delivery of road policing activities ....................................................................................................... 11
4.1 Overview .................................................................................................................. 11
4.2 Improvement initiatives .......................................................................................... 12
5 Monitoring and reporting ........................................................................................................................... 13
5.1 Overview .................................................................................................................. 13
5.2 Formal reporting requirements .............................................................................. 13
6 2012–15 RPP Work Programme ............................................................................................................... 14
Appendix A: Baseline data for result indicators ......................................................................................... 17

2012–15 Road Policing Programme
Page | 4
2012–15 Road Policing Programme
Page | 5
1 0B0BIntroduction
The 2012–15 Road Policing Programme (RPP) sets out the three-year programme of road policing activities
to be delivered by Police, in accordance with sections 18 and 102 of the Land Transport Management Act
2003 (LTMA).
The 2012–15 RPP builds on a new outcome investment approach that was developed by the NZTA for
national land transport funded activities and piloted on road policing investment in 2011/12.
In line with this approach, and the government’s investment priorities for the transport sector, the 2012–
15 RPP gives emphasis to the achievement of desired road safety and economic productivity outcomes,
value for money and the efficient delivery of Police activities.
The 2012–15 RPP comprises an outline of the strategic context; an overview of road policing investment,
delivery, and monitoring and reporting arrangements; and the road policing work programme to be
delivered over the three-year period.
2012–15 Road Policing Programme
Page | 6
2 1B1BStrategic context
2.1 7B7BSafer Journeys Road Safety Strategy 2010–20
Safer Journeys is the government’s strategy to guide the improvement of road safety over the period
2010–20. The strategy is based on a vision of a ‘safe road system increasingly free of death and serious
injury’, and recognises that a Safe System approach to road safety is needed if New Zealand is to make
real progress in reducing the number of road deaths and serious injuries.
The Safe System approach acknowledges:
people make mistakes and crashes are therefore inevitable
the body has limited ability to withstand crash forces
system designers and system users must all share responsibility for managing crash forces to a level
that does not result in death or serious injury
it will take a system-wide approach – safe roads and roadsides, vehicles, speeds and road users – to
improve road safety in New Zealand.
The Safer Journeys strategy identifies 13 areas where current road safety performance needs to be
strengthened over the period 2010–20. Implementation of this strategy is supported by a series of action
plans, the first of which was released in 2011 0F0F
1. Additional plans are scheduled for release over the
remaining term of the strategy.
Police actions identified in these plans, together with the Safe System approach and priority areas of road
safety concern, have informed and will continue to inform the priorities and activities Police will deliver
over the term of the 2012–15 RPP.
2.2 8B8BGovernment Policy Statement on Land Transport Funding
The Government Policy Statement on Land Transport Funding 2012/13 – 2022/23 (GPS 2012) outlines the
government’s expenditure priorities for the National Land Transport Fund, from which road policing
investment is drawn.
The GPS 2012 identifies the following priorities for transport investment:
encouraging economic growth and productivity
obtaining value for money
improving road safety.
In signalling these priorities the government recognises that economically strategic investment in land
transport, combined with better use of existing infrastructure, can boost New Zealand’s long-term growth
prospects. The government has also signalled that a focus on value for money is critical to ensure road
user money is carefully invested to get maximum benefit. The road safety priority acknowledges that
reducing the social cost of road deaths and injuries is important not only to the economy but in its own
right.
1 The Safer Journeys strategy and action plans are available at www.transport.govt.nz/saferjourneys/
2012–15 Road Policing Programme
Page | 7
2.3 9B9BNZTA’s Road Policing Investment Framework – investing for outcomes
The NZTA’s Road Policing Investment Framework 2012–15 outlines the investment expectations and
desired outcomes to which road policing activities should contribute, as well as the assessment criteria the
NZTA applies to the 2012–15 RPP. The framework gives effect to the government’s strategic direction for
road policing investment, as outlined in Safer Journeys and the GPS 2012, by identifying:
the desired road safety and economic outcomes that road policing activities in the 2012–15 RPP
should contribute to, in line with Safer Journeys and the GPS 2012 priorities
the strategic priorities of road policing activities, reflecting the potential contribution of road
policing to the desired investment outcomes and identified areas of concern from Safer Journeys.
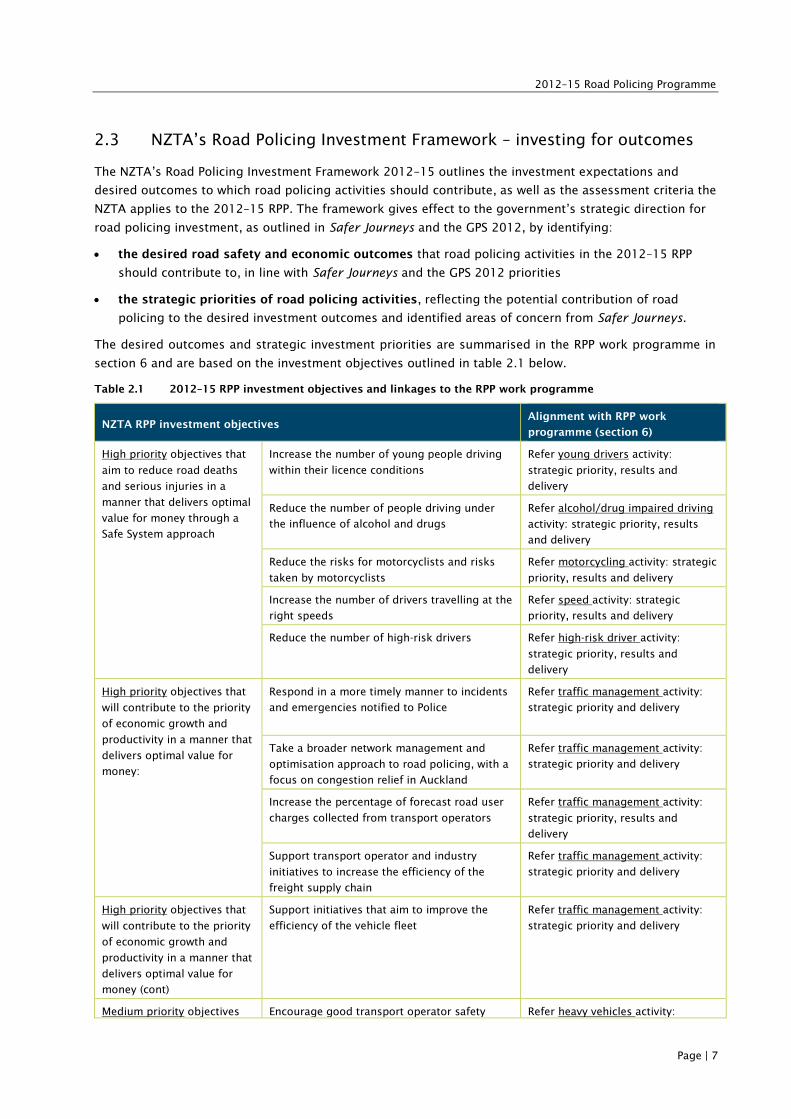
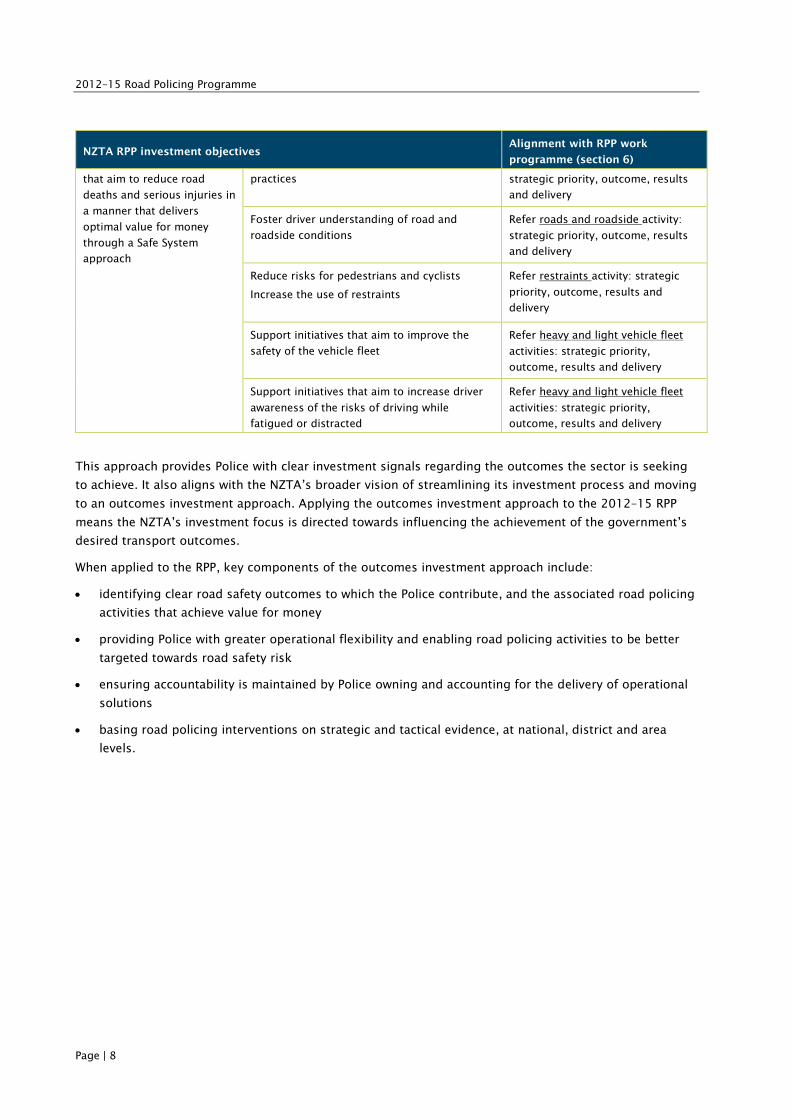
The desired outcomes and strategic investment priorities are summarised in the RPP work programme in
section 6 and are based on the investment objectives outlined in table 2.1 below.
Table 2.1 2012–15 RPP investment objectives and linkages to the RPP work programme
NZTA RPP investment objectives
Alignment with RPP work
programme (section 6)
High priority objectives that
aim to reduce road deaths
and serious injuries in a
manner that delivers optimal
value for money through a
Safe System approach
Increase the number of young people driving
within their licence conditions
Refer young drivers activity:
strategic priority, results and
delivery
Reduce the number of people driving under
the influence of alcohol and drugs
Refer alcohol/drug impaired driving
activity: strategic priority, results
and delivery
Reduce the risks for motorcyclists and risks
taken by motorcyclists
Refer motorcycling activity: strategic
priority, results and delivery
Increase the number of drivers travelling at the
right speeds
Refer speed activity: strategic
priority, results and delivery
Reduce the number of high-risk drivers Refer high-risk driver activity:
strategic priority, results and
delivery
High priority objectives that
will contribute to the priority
of economic growth and
productivity in a manner that
delivers optimal value for
money:
Respond in a more timely manner to incidents
and emergencies notified to Police
Refer traffic management activity:
strategic priority and delivery
Take a broader network management and
optimisation approach to road policing, with a
focus on congestion relief in Auckland
Refer traffic management activity:
strategic priority and delivery
Increase the percentage of forecast road user
charges collected from transport operators
Refer traffic management activity:
strategic priority, results and
delivery
Support transport operator and industry
initiatives to increase the efficiency of the
freight supply chain
Refer traffic management activity:
strategic priority and delivery
High priority objectives that
will contribute to the priority
of economic growth and
productivity in a manner that
delivers optimal value for
money (cont)
Support initiatives that aim to improve the
efficiency of the vehicle fleet
Refer traffic management activity:
strategic priority and delivery
Medium priority objectives Encourage good transport operator safety Refer heavy vehicles activity:
2012–15 Road Policing Programme
Page | 8
NZTA RPP investment objectives
Alignment with RPP work
programme (section 6)
that aim to reduce road
deaths and serious injuries in
a manner that delivers
optimal value for money
through a Safe System
approach
practices
strategic priority, outcome, results
and delivery
Foster driver understanding of road and
roadside conditions
Refer roads and roadside activity:
strategic priority, outcome, results
and delivery
Reduce risks for pedestrians and cyclists
Increase the use of restraints
Refer restraints activity: strategic
priority, outcome, results and
delivery
Support initiatives that aim to improve the
safety of the vehicle fleet
Refer heavy and light vehicle fleet
activities: strategic priority,
outcome, results and delivery
Support initiatives that aim to increase driver
awareness of the risks of driving while
fatigued or distracted
Refer heavy and light vehicle fleet
activities: strategic priority,
outcome, results and delivery
This approach provides Police with clear investment signals regarding the outcomes the sector is seeking
to achieve. It also aligns with the NZTA’s broader vision of streamlining its investment process and moving
to an outcomes investment approach. Applying the outcomes investment approach to the 2012–15 RPP
means the NZTA’s investment focus is directed towards influencing the achievement of the government’s
desired transport outcomes.
When applied to the RPP, key components of the outcomes investment approach include:
identifying clear road safety outcomes to which the Police contribute, and the associated road policing
activities that achieve value for money
providing Police with greater operational flexibility and enabling road policing activities to be better
targeted towards road safety risk
ensuring accountability is maintained by Police owning and accounting for the delivery of operational
solutions
basing road policing interventions on strategic and tactical evidence, at national, district and area
levels.
2012–15 Road Policing Programme
Page | 9
3 2B2BInvestment
3.1 10B10BTotal investment
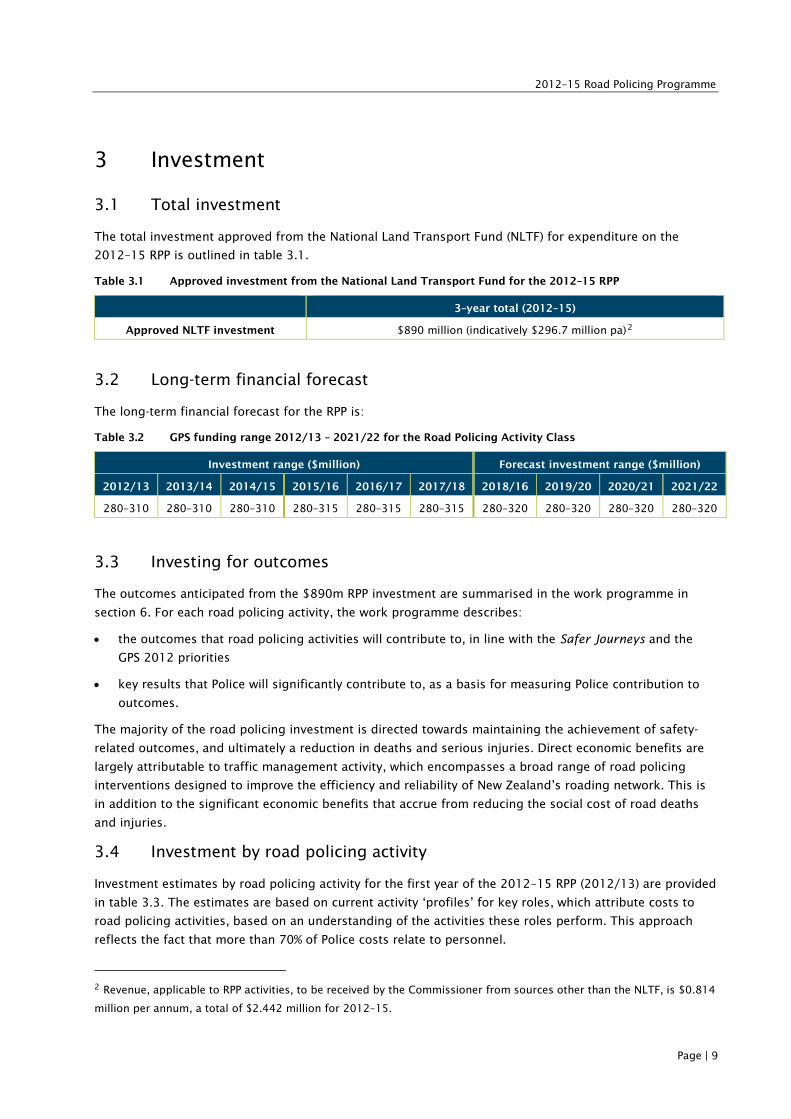
The total investment approved from the National Land Transport Fund (NLTF) for expenditure on the
2012–15 RPP is outlined in table 3.1.
Table 3.1 Approved investment from the National Land Transport Fund for the 2012–15 RPP
3–year total (2012–15)
Approved NLTF investment $890 million (indicatively $296.7 million pa)1F1F
2
3.2 11B11BLong-term financial forecast
The long-term financial forecast for the RPP is:
Table 3.2 GPS funding range 2012/13 – 2021/22 for the Road Policing Activity Class
Investment range ($million) Forecast investment range ($million)
2012/13 2013/14 2014/15 2015/16 2016/17 2017/18 2018/16 2019/20 2020/21 2021/22
280–310 280–310 280–310 280–315 280–315 280–315 280–320 280–320 280–320 280–320
3.3 12B12BInvesting for outcomes
The outcomes anticipated from the $890m RPP investment are summarised in the work programme in
section 6. For each road policing activity, the work programme describes:
the outcomes that road policing activities will contribute to, in line with the Safer Journeys and the
GPS 2012 priorities
key results that Police will significantly contribute to, as a basis for measuring Police contribution to
outcomes.
The majority of the road policing investment is directed towards maintaining the achievement of safety-
related outcomes, and ultimately a reduction in deaths and serious injuries. Direct economic benefits are
largely attributable to traffic management activity, which encompasses a broad range of road policing
interventions designed to improve the efficiency and reliability of New Zealand’s roading network. This is
in addition to the significant economic benefits that accrue from reducing the social cost of road deaths
and injuries.
3.4 13B13BInvestment by road policing activity
Investment estimates by road policing activity for the first year of the 2012–15 RPP (2012/13) are provided
in table 3.3. The estimates are based on current activity ‘profiles’ for key roles, which attribute costs to
road policing activities, based on an understanding of the activities these roles perform. This approach
reflects the fact that more than 70% of Police costs relate to personnel.
2 Revenue, applicable to RPP activities, to be received by the Commissioner from sources other than the NLTF, is $0.814
million per annum, a total of $2.442 million for 2012–15.
2012–15 Road Policing Programme
Page | 10
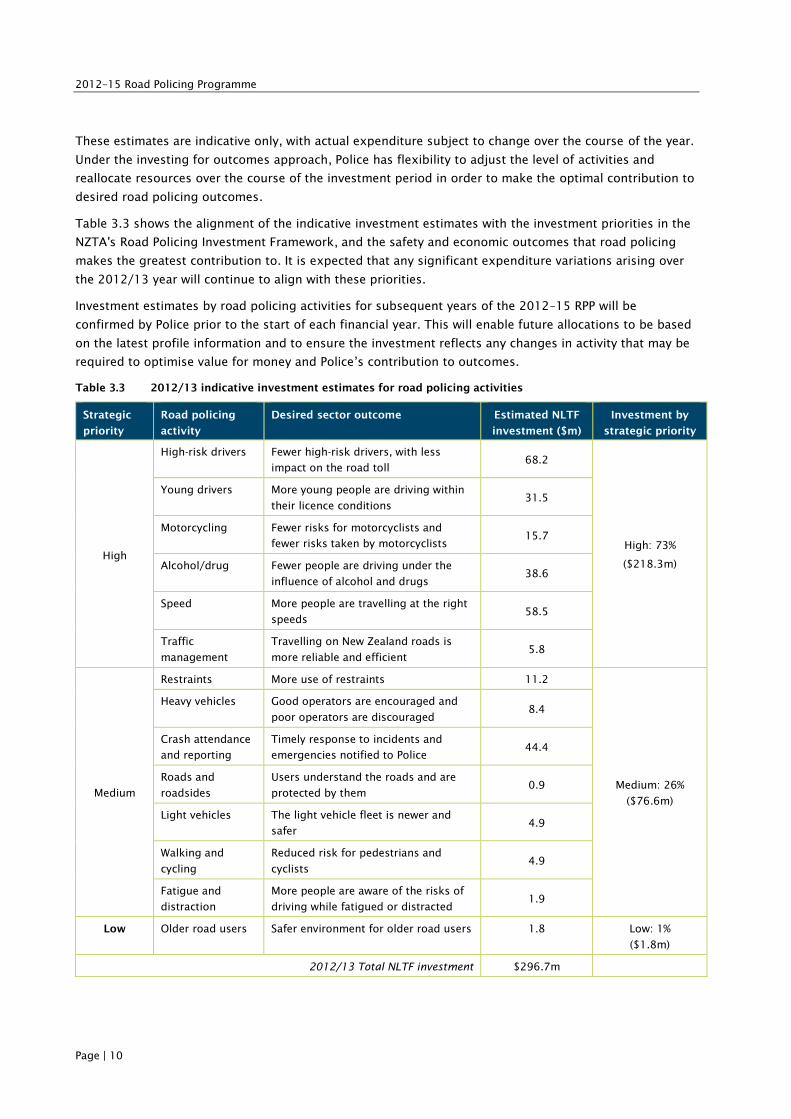
These estimates are indicative only, with actual expenditure subject to change over the course of the year.
Under the investing for outcomes approach, Police has flexibility to adjust the level of activities and
reallocate resources over the course of the investment period in order to make the optimal contribution to
desired road policing outcomes.
Table 3.3 shows the alignment of the indicative investment estimates with the investment priorities in the
NZTA's Road Policing Investment Framework, and the safety and economic outcomes that road policing
makes the greatest contribution to. It is expected that any significant expenditure variations arising over
the 2012/13 year will continue to align with these priorities.
Investment estimates by road policing activities for subsequent years of the 2012–15 RPP will be
confirmed by Police prior to the start of each financial year. This will enable future allocations to be based
on the latest profile information and to ensure the investment reflects any changes in activity that may be
required to optimise value for money and Police’s contribution to outcomes.
Table 3.3 2012/13 indicative investment estimates for road policing activities
Strategic
priority
Road policing
activity
Desired sector outcome Estimated NLTF
investment ($m)
Investment by
strategic priority
High
High-risk drivers Fewer high-risk drivers, with less
impact on the road toll
68.2
High: 73%
($218.3m)
Young drivers More young people are driving within
their licence conditions
31.5
Motorcycling Fewer risks for motorcyclists and
fewer risks taken by motorcyclists
15.7
Alcohol/drug Fewer people are driving under the
influence of alcohol and drugs
38.6
Speed More people are travelling at the right
speeds
58.5
Traffic
management
Travelling on New Zealand roads is
more reliable and efficient
5.8
Medium
Restraints More use of restraints 11.2
Medium: 26%
($76.6m)
Heavy vehicles Good operators are encouraged and
poor operators are discouraged
8.4
Crash attendance
and reporting
Timely response to incidents and
emergencies notified to Police
44.4
Roads and
roadsides
Users understand the roads and are
protected by them
0.9
Light vehicles The light vehicle fleet is newer and
safer
4.9
Walking and
cycling
Reduced risk for pedestrians and
cyclists
4.9
Fatigue and
distraction
More people are aware of the risks of
driving while fatigued or distracted
1.9
Low Older road users Safer environment for older road users 1.8 Low: 1%
($1.8m)
2012/13 Total NLTF investment $296.7m
2012–15 Road Policing Programme
Page | 11
4 3B3BDelivery of road policing activities
4.1 14B14BOverview
Effective road policing has the potential to save many lives every year, reduce the number and extent of
injuries sustained by road users, and improve the efficiency and reliability of travel on New Zealand’s roads.
In 2011 New Zealand had a road toll of 284, the lowest on record since 1952. Police has contributed to
this outcome by:
focusing on a general deterrence approach to road safety
increasing the focus on high-priority road policing activities such as deterring high-risk driving, in line
with the government's road safety priorities identified in Safer Journeys
influencing and changing driver behaviour
working with communities.
However, to achieve Safer Journey’s vision of a safe road system increasingly free of death and serious injury
and to deliver against economic productivity outcomes, further sustained efforts need to be made. In
alignment with NZTA’s investment priorities, Police aims to deliver improved results in each of the 14 road
policing activities by:
increasing the efficiency and effectiveness of its workforce by ensuring staff are undertaking the right
activities at the right times to help prevent road trauma
lifting productivity by automating some activities and using technology to streamline processes, thus
freeing up staff to focus on other high-priority road policing activities
continuously improving its understanding of the road policing environment, leading to enhanced
effectiveness and accountability
embedding the Safe System approach in road policing.
Key aspects of the Police model that will support achievement of these objectives, and delivery of the
2012–15 RPP work programme, are Police’s Prevention First strategy and strategic change programme,
Policing Excellence.
Prevention First is Police’s national operating strategy, which recognises a strong focus on prevention is
required to achieve a sustainable reduction in road trauma, crime and anti-social behaviour. It is a holistic
approach to policing that puts prevention at the forefront of all policing activities, and is a cornerstone of
Police’s commitment to Safer Journeys.
A number of organisation-wide initiatives are geared towards the adoption of the Prevention First strategy
and are being driven by the Policing Excellence programme. This is a collection of wider organisational
improvement processes that will improve the delivery of road policing by:
improving Police resource efficiency
focusing on high-priority road policing activities
targeting Police resources to road safety risk
working with other agencies to provide complementary road safety activities.
2012–15 Road Policing Programme
Page | 12
4.2 15B15BImprovement initiatives
In addition to the wider improvement processes associated with the Prevention First strategy and Policing
Excellence, Police will deliver a number of initiatives over the course of the 2012–15 RPP to support the
efficient and effective delivery of road policing activities outlined in section 6. These include:
Benchmarking and intervention logic (RPP Improvement Programme)
Police will develop and implement benchmarking and intervention logic frameworks for agreed high- and
medium-priority road policing activities over the period of this RPP. Benchmarking costs associated with
key road policing activities will enable an improved understanding of cost drivers and provide a quality
assurance tool for reviewing the efficiency of Police delivery. Developing and implementing an intervention
logic framework will improve transparency around Police decision-making processes and support the
continuous review of road policing activities.
Investment in technology
In addition to Policing Excellence initiatives, a number of technology proposals will be advanced over the
term of the 2012–15 RPP. These include the increased use of speed cameras across the roading network,
together with multi-agency investigations into options for expanding the use and optimising investment in
red light cameras, automatic number plate recognition cameras and point-to-point cameras.
It is expected that Police will give high priority to progressing speed camera investigations, in line with
commitments under the Safer Journeys action plan 2011/12. This will include the preparation of a
business case for additional fixed speed cameras to be completed in 2012/13. Further investment will
depend on the outcome of these investigations.
Planned intelligence products
Intelligence is critical to targeting the delivery of road policing activities to risk. Police’s National
Intelligence Centre and the multi-agency Centre for Road Safety Intelligence will deliver a number of
products over the term of this RPP to inform risk identification and the Police tasking and coordination
model. Examples of products for the 2012/13 year include:
Analysis of speed enforcement: Analysing the effects of local speed reduction interventions,
enforcement of reduced tolerances over holiday weekends, the February 2012 operation, and the
possible impact of inaccurate speedometers on crash risk
Drink-drivers: Developing a revised knowledge profile, particularly with respect to recent and
upcoming changes, eg zero limit and alcohol interlocks
Centre-line crossing: Completing an analysis of crash data to determine the role of centre-line crossing
in crashes and options for road policing.
2012–15 Road Policing Programme
Page | 13
5 4B4BMonitoring and reporting
5.1 16B16BOverview
The monitoring and reporting framework for the 2012–15 RPP is designed to:
maintain investment confidence in Police by demonstrating the delivery of activities that maximise
the contribution to desired road policing outcomes and provide value for money
enable monitoring of the efficiency and effectiveness of the NLTF investment in the RPP over time
improve future delivery of road policing outcomes through a robust evaluation of Police
performance.
The framework is structured around a number of formal reporting requirements, together with a joint
agency senior management forum that maintains strategic oversight and provides direction across the
2012–15 RPP. In addition, a number of informal mechanisms provide both parties with the opportunity
to assess the delivery of road policing activities and to provide feedback about what is working, what is
not and what needs to change.
These formal and informal mechanisms are supported by a number of internal Police systems and
processes that monitor Police delivery of RPP activities.
5.2 17B17BFormal reporting requirements
The NZTA reports quarterly to the Minister of Transport on the performance of Police in delivering the
2012–15 RPP, in accordance with the LTMA. To support this process, Police provides a quarterly
performance report to the NZTA and other stakeholders.
The quarterly reports of both agencies include an assessment of Police delivery in the context of:
targeting to risk and outcome trends (delivery rationale)
road policing activities delivered
expenditure against the approved programme.
The reports also include an overall assessment of performance, including progress against the RPP
Improvement Programme.
2012–15 Road Policing Programme
Glossary of abbreviations used in the table
ACC Accident Compensation Corporation CVIU Commercial Vehicle Investigation Unit ION infringement offence notice TCR traffic crash report
CBT compulsory breath test GDL Graduated Driver Licence MoT Ministry of Transport TON traffic offence notice
CIT compulsory impairment test (drug) GDLS Graduated Driver Licensing Scheme RUC road user charges WoF warrant of fitness
CoF certificate of fitness HMV heavy motor vehicle STST school traffic safety team
Page | 14
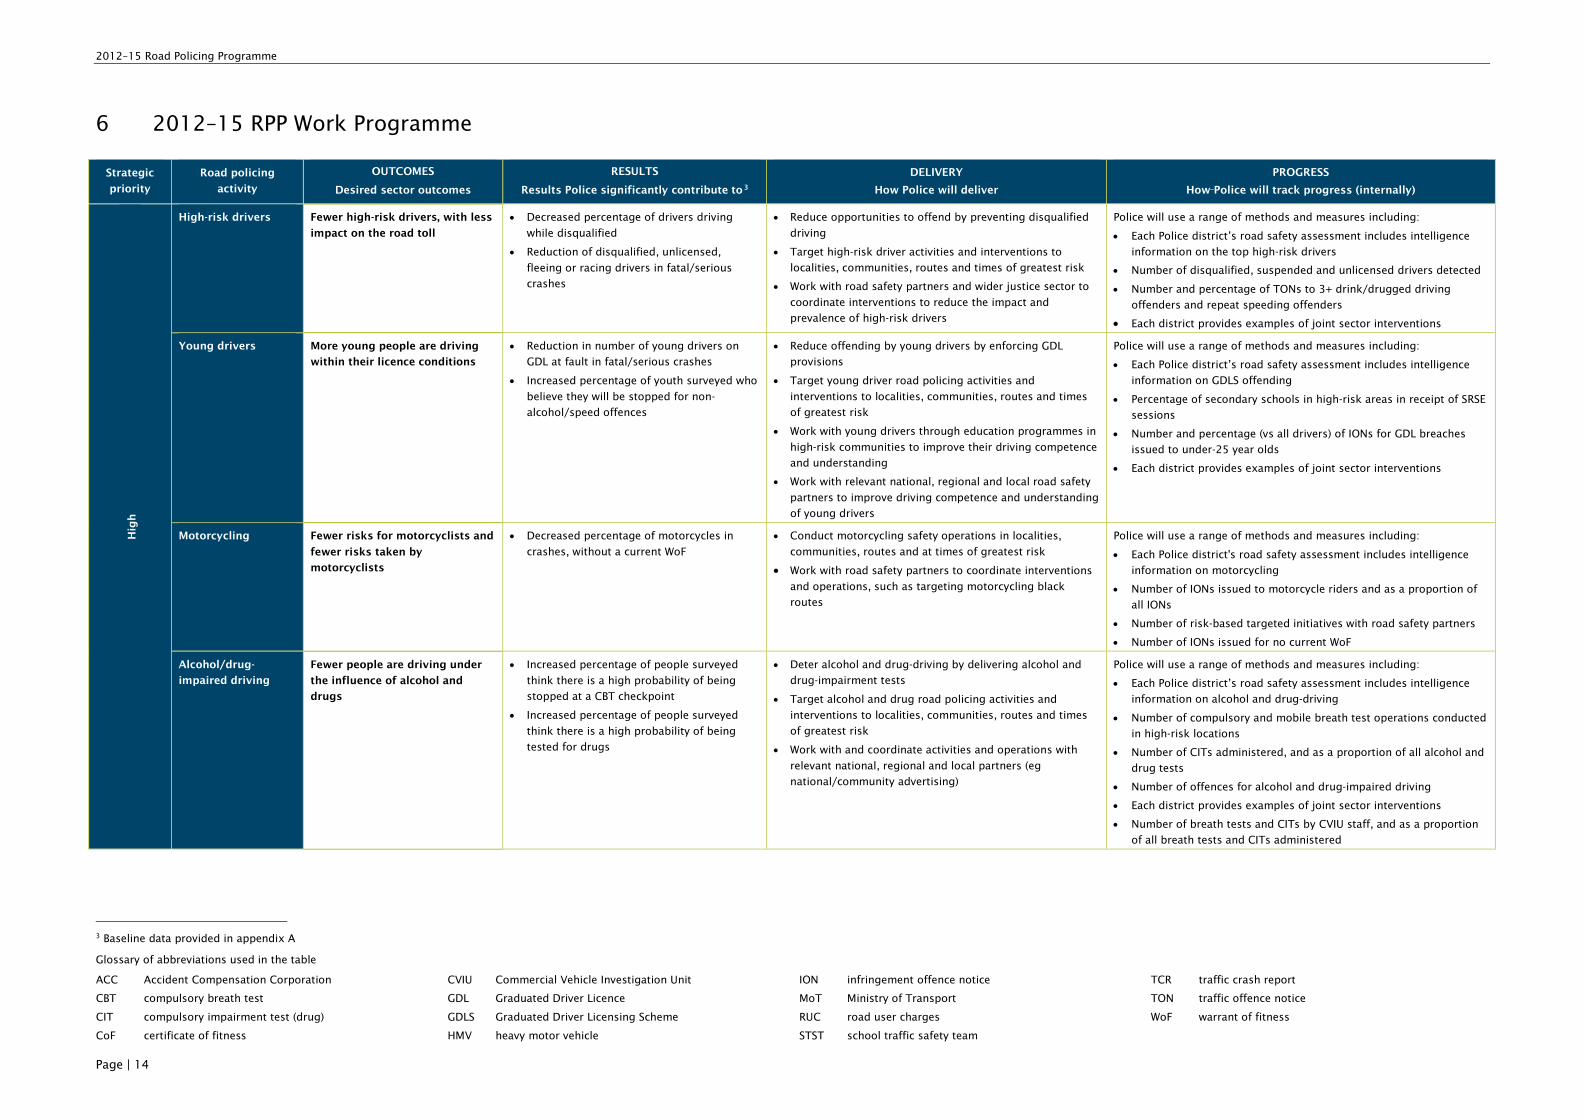
6 5B5B2012–15 RPP Work Programme
Strategic
priority
Road policing
activity
OUTCOMES
Desired sector outcomes
RESULTS
Results Police significantly contribute to 2F2F
3
DELIVERY
How Police will deliver
PROGRESS
How Police will track progress (internally)
Hig
h
High-risk drivers Fewer high-risk drivers, with less
impact on the road toll
Decreased percentage of drivers driving
while disqualified
Reduction of disqualified, unlicensed,
fleeing or racing drivers in fatal/serious
crashes
Reduce opportunities to offend by preventing disqualified
driving
Target high-risk driver activities and interventions to
localities, communities, routes and times of greatest risk
Work with road safety partners and wider justice sector to
coordinate interventions to reduce the impact and
prevalence of high-risk drivers
Police will use a range of methods and measures including:
Each Police district’s road safety assessment includes intelligence
information on the top high-risk drivers
Number of disqualified, suspended and unlicensed drivers detected
Number and percentage of TONs to 3+ drink/drugged driving
offenders and repeat speeding offenders
Each district provides examples of joint sector interventions
Young drivers More young people are driving
within their licence conditions
Reduction in number of young drivers on
GDL at fault in fatal/serious crashes
Increased percentage of youth surveyed who
believe they will be stopped for non-
alcohol/speed offences
Reduce offending by young drivers by enforcing GDL
provisions
Target young driver road policing activities and
interventions to localities, communities, routes and times
of greatest risk
Work with young drivers through education programmes in
high-risk communities to improve their driving competence
and understanding
Work with relevant national, regional and local road safety
partners to improve driving competence and understanding
of young drivers
Police will use a range of methods and measures including:
Each Police district’s road safety assessment includes intelligence
information on GDLS offending
Percentage of secondary schools in high-risk areas in receipt of SRSE
sessions
Number and percentage (vs all drivers) of IONs for GDL breaches
issued to under-25 year olds
Each district provides examples of joint sector interventions
Motorcycling Fewer risks for motorcyclists and
fewer risks taken by
motorcyclists
Decreased percentage of motorcycles in
crashes, without a current WoF
Conduct motorcycling safety operations in localities,
communities, routes and at times of greatest risk
Work with road safety partners to coordinate interventions
and operations, such as targeting motorcycling black
routes
Police will use a range of methods and measures including:
Each Police district's road safety assessment includes intelligence
information on motorcycling
Number of IONs issued to motorcycle riders and as a proportion of
all IONs
Number of risk-based targeted initiatives with road safety partners
Number of IONs issued for no current WoF
Alcohol/drug-
impaired driving
Fewer people are driving under
the influence of alcohol and
drugs
Increased percentage of people surveyed
think there is a high probability of being
stopped at a CBT checkpoint
Increased percentage of people surveyed
think there is a high probability of being
tested for drugs
Deter alcohol and drug-driving by delivering alcohol and
drug-impairment tests
Target alcohol and drug road policing activities and
interventions to localities, communities, routes and times
of greatest risk
Work with and coordinate activities and operations with
relevant national, regional and local partners (eg
national/community advertising)
Police will use a range of methods and measures including:
Each Police district’s road safety assessment includes intelligence
information on alcohol and drug-driving
Number of compulsory and mobile breath test operations conducted
in high-risk locations
Number of CITs administered, and as a proportion of all alcohol and
drug tests
Number of offences for alcohol and drug-impaired driving
Each district provides examples of joint sector interventions
Number of breath tests and CITs by CVIU staff, and as a proportion
of all breath tests and CITs administered
3 Baseline data provided in appendix A
2012–15 Road Policing Programme
Glossary of abbreviations used in the table
ACC Accident Compensation Corporation CVIU Commercial Vehicle Investigation Unit ION infringement offence notice STST school traffic safety team
CBT compulsory breath test GDL Graduated Driver Licence MoT Ministry of Transport TCR traffic crash report
CIT compulsory impairment test (drug) GDLS Graduated Driver Licensing Scheme RUC road user charges TON traffic offence notice
CoF certificate of fitness HMV heavy motor vehicle SRSE school road safety education WoF warrant of fitness
Page | 15
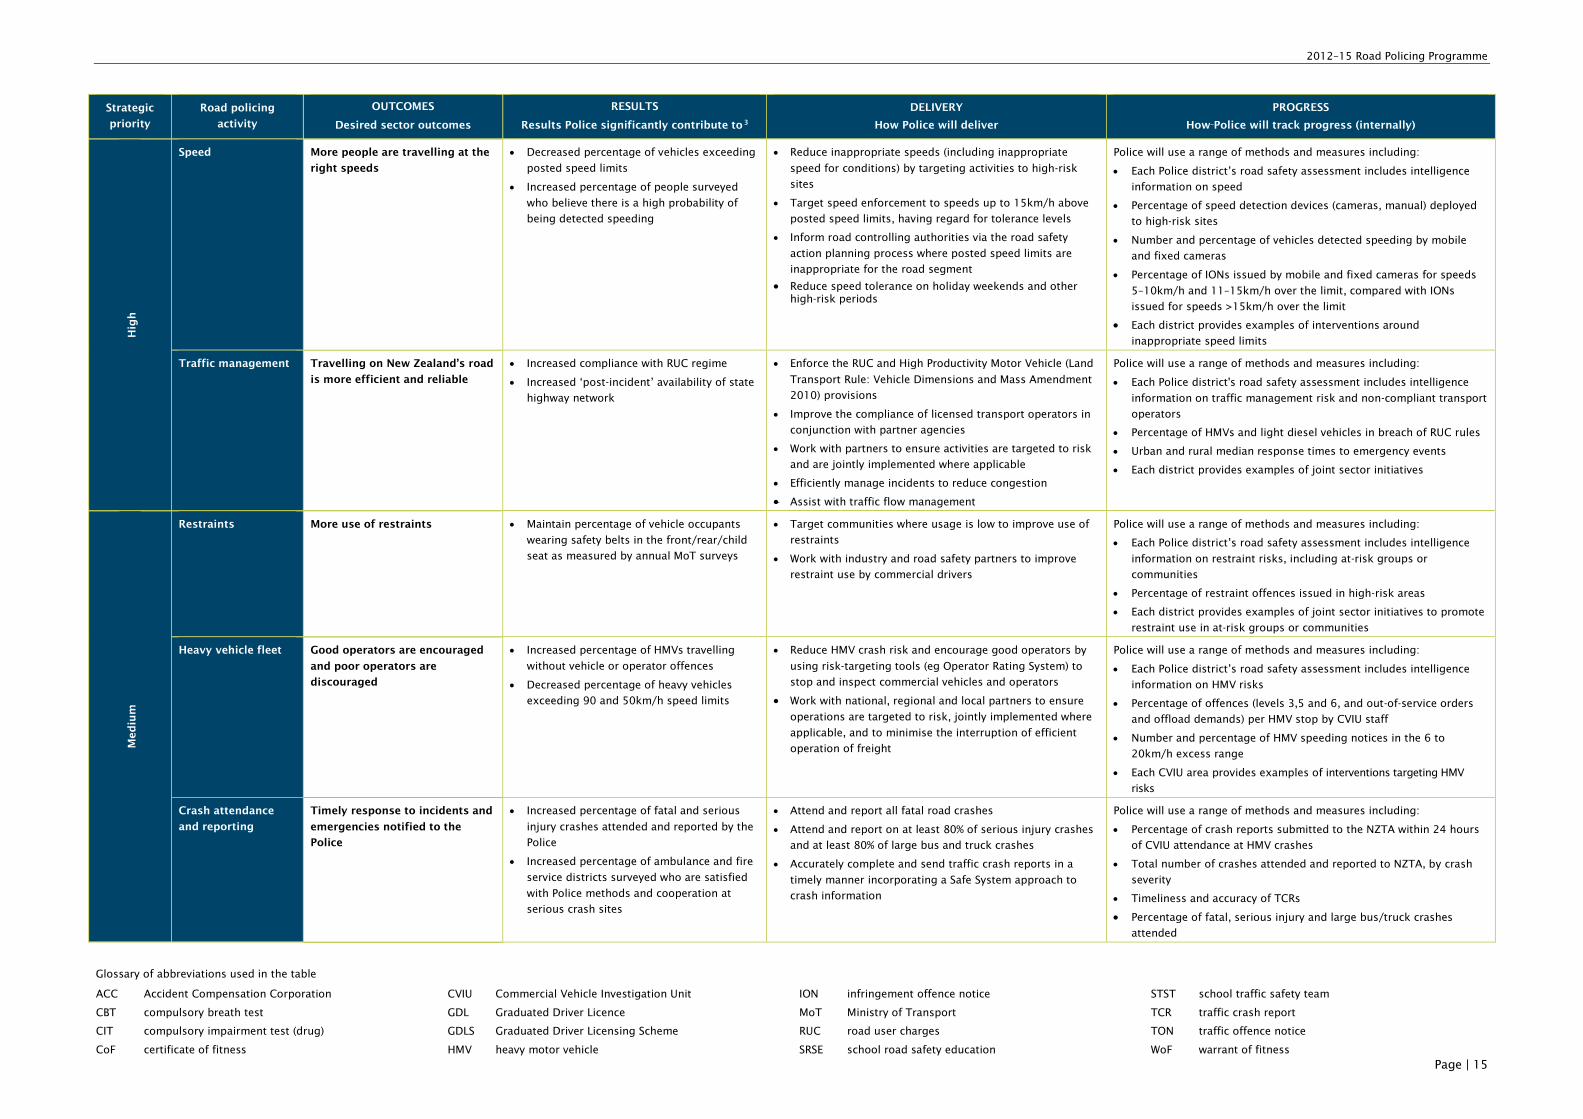
Strategic
priority
Road policing
activity
OUTCOMES
Desired sector outcomes
RESULTS
Results Police significantly contribute to 2F2F
3
DELIVERY
How Police will deliver
PROGRESS
How Police will track progress (internally) H
ig
h
Speed More people are travelling at the
right speeds
Decreased percentage of vehicles exceeding
posted speed limits
Increased percentage of people surveyed
who believe there is a high probability of
being detected speeding
Reduce inappropriate speeds (including inappropriate
speed for conditions) by targeting activities to high-risk
sites
Target speed enforcement to speeds up to 15km/h above
posted speed limits, having regard for tolerance levels
Inform road controlling authorities via the road safety
action planning process where posted speed limits are
inappropriate for the road segment
Reduce speed tolerance on holiday weekends and other
high-risk periods
Police will use a range of methods and measures including:
Each Police district’s road safety assessment includes intelligence
information on speed
Percentage of speed detection devices (cameras, manual) deployed
to high-risk sites
Number and percentage of vehicles detected speeding by mobile
and fixed cameras
Percentage of IONs issued by mobile and fixed cameras for speeds
5–10km/h and 11–15km/h over the limit, compared with IONs
issued for speeds >15km/h over the limit
Each district provides examples of interventions around
inappropriate speed limits
Traffic management
Travelling on New Zealand’s road
is more efficient and reliable
Increased compliance with RUC regime
Increased ‘post-incident’ availability of state
highway network
Enforce the RUC and High Productivity Motor Vehicle (Land
Transport Rule: Vehicle Dimensions and Mass Amendment
2010) provisions
Improve the compliance of licensed transport operators in
conjunction with partner agencies
Work with partners to ensure activities are targeted to risk
and are jointly implemented where applicable
Efficiently manage incidents to reduce congestion
Assist with traffic flow management
Police will use a range of methods and measures including:
Each Police district's road safety assessment includes intelligence
information on traffic management risk and non-compliant transport
operators
Percentage of HMVs and light diesel vehicles in breach of RUC rules
Urban and rural median response times to emergency events
Each district provides examples of joint sector initiatives
Med
iu
m
Restraints More use of restraints Maintain percentage of vehicle occupants
wearing safety belts in the front/rear/child
seat as measured by annual MoT surveys
Target communities where usage is low to improve use of
restraints
Work with industry and road safety partners to improve
restraint use by commercial drivers
Police will use a range of methods and measures including:
Each Police district’s road safety assessment includes intelligence
information on restraint risks, including at-risk groups or
communities
Percentage of restraint offences issued in high-risk areas
Each district provides examples of joint sector initiatives to promote
restraint use in at-risk groups or communities
Heavy vehicle fleet Good operators are encouraged
and poor operators are
discouraged
Increased percentage of HMVs travelling
without vehicle or operator offences
Decreased percentage of heavy vehicles
exceeding 90 and 50km/h speed limits
Reduce HMV crash risk and encourage good operators by
using risk-targeting tools (eg Operator Rating System) to
stop and inspect commercial vehicles and operators
Work with national, regional and local partners to ensure
operations are targeted to risk, jointly implemented where
applicable, and to minimise the interruption of efficient
operation of freight
Police will use a range of methods and measures including:
Each Police district’s road safety assessment includes intelligence
information on HMV risks
Percentage of offences (levels 3,5 and 6, and out-of-service orders
and offload demands) per HMV stop by CVIU staff
Number and percentage of HMV speeding notices in the 6 to
20km/h excess range
Each CVIU area provides examples of interventions targeting HMV
risks
Crash attendance
and reporting
Timely response to incidents and
emergencies notified to the
Police
Increased percentage of fatal and serious
injury crashes attended and reported by the
Police
Increased percentage of ambulance and fire
service districts surveyed who are satisfied
with Police methods and cooperation at
serious crash sites
Attend and report all fatal road crashes
Attend and report on at least 80% of serious injury crashes
and at least 80% of large bus and truck crashes
Accurately complete and send traffic crash reports in a
timely manner incorporating a Safe System approach to
crash information
Police will use a range of methods and measures including:
Percentage of crash reports submitted to the NZTA within 24 hours
of CVIU attendance at HMV crashes
Total number of crashes attended and reported to NZTA, by crash
severity
Timeliness and accuracy of TCRs
Percentage of fatal, serious injury and large bus/truck crashes
attended
2012–15 Road Policing Programme
Glossary of abbreviations used in the table
ACC Accident Compensation Corporation CVIU Commercial Vehicle Investigation Unit ION infringement offence notice TCR traffic crash report
CBT compulsory breath test GDL Graduated Driver Licence MoT Ministry of Transport TON traffic offence notice
CIT compulsory impairment test (drug) GDLS Graduated Driver Licensing Scheme RUC road user charges WoF warrant of fitness
CoF certificate of fitness HMV heavy motor vehicle STST school traffic safety team
Page | 16
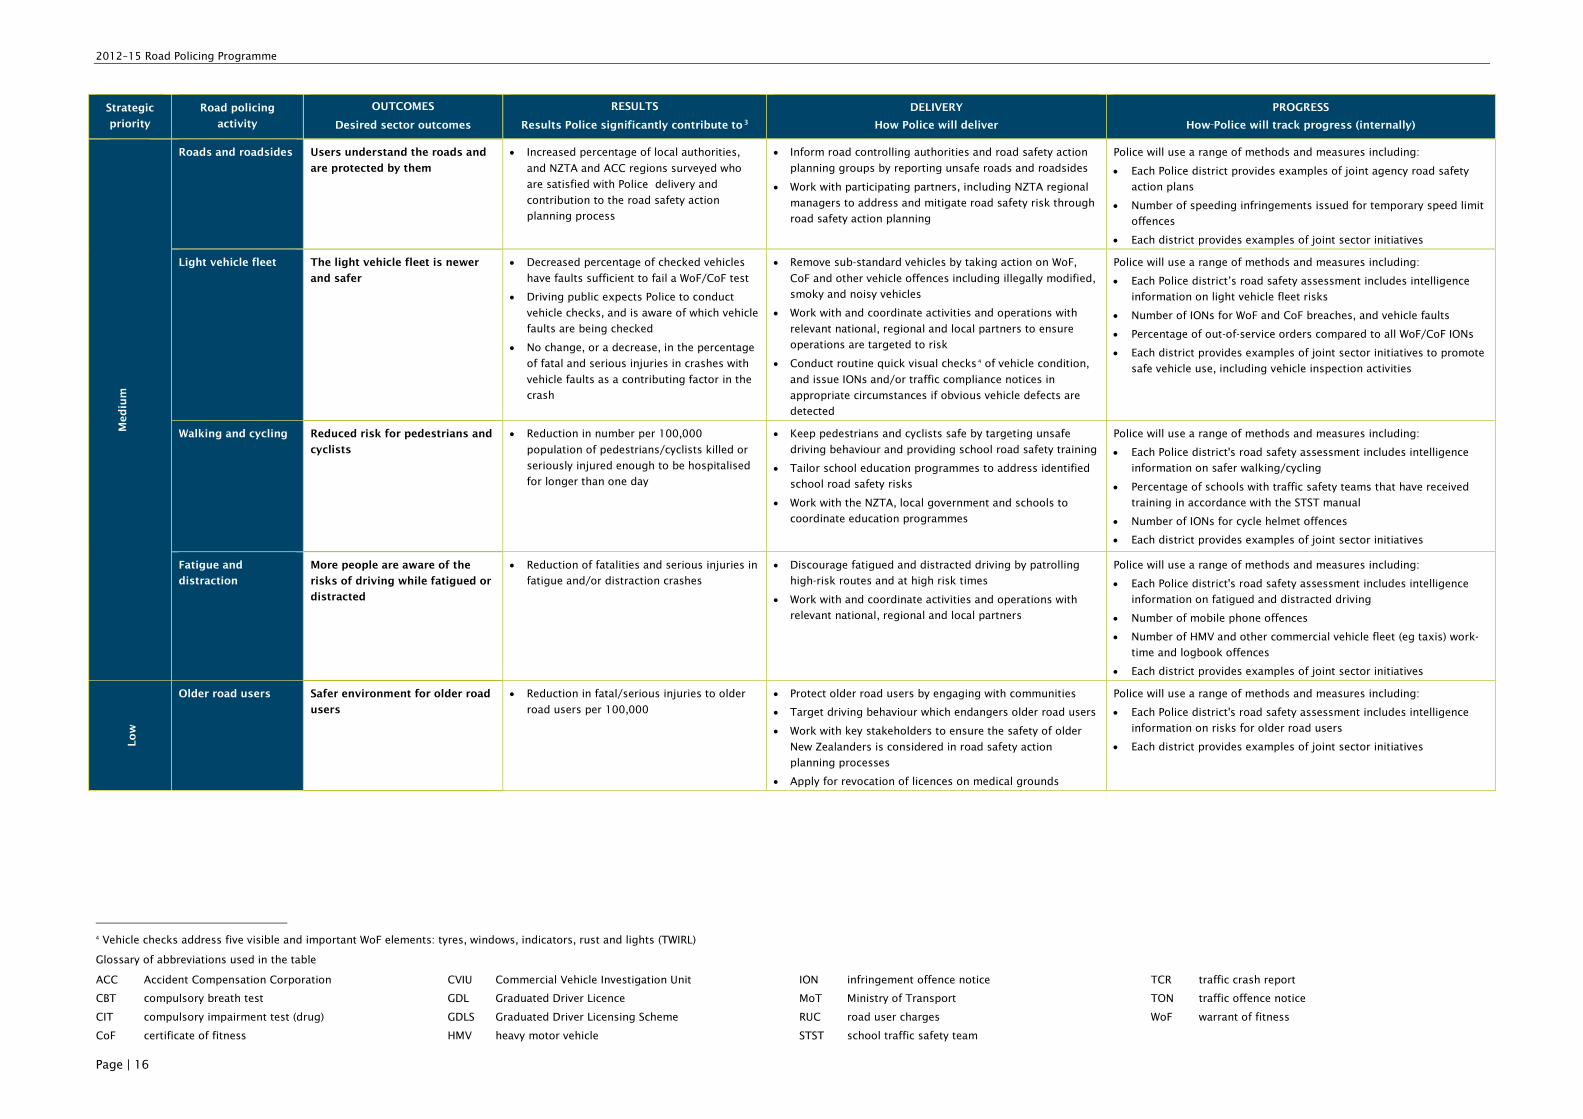
Strategic
priority
Road policing
activity
OUTCOMES
Desired sector outcomes
RESULTS
Results Police significantly contribute to 2F2F
3
DELIVERY
How Police will deliver
PROGRESS
How Police will track progress (internally) M
ed
iu
m
Roads and roadsides Users understand the roads and
are protected by them
Increased percentage of local authorities,
and NZTA and ACC regions surveyed who
are satisfied with Police delivery and
contribution to the road safety action
planning process
Inform road controlling authorities and road safety action
planning groups by reporting unsafe roads and roadsides
Work with participating partners, including NZTA regional
managers to address and mitigate road safety risk through
road safety action planning
Police will use a range of methods and measures including:
Each Police district provides examples of joint agency road safety
action plans
Number of speeding infringements issued for temporary speed limit
offences
Each district provides examples of joint sector initiatives
Light vehicle fleet The light vehicle fleet is newer
and safer
Decreased percentage of checked vehicles
have faults sufficient to fail a WoF/CoF test
Driving public expects Police to conduct
vehicle checks, and is aware of which vehicle
faults are being checked
No change, or a decrease, in the percentage
of fatal and serious injuries in crashes with
vehicle faults as a contributing factor in the
crash
Remove sub-standard vehicles by taking action on WoF,
CoF and other vehicle offences including illegally modified,
smoky and noisy vehicles
Work with and coordinate activities and operations with
relevant national, regional and local partners to ensure
operations are targeted to risk
Conduct routine quick visual checks 3F3F
4
of vehicle condition,
and issue IONs and/or traffic compliance notices in
appropriate circumstances if obvious vehicle defects are
detected
Police will use a range of methods and measures including:
Each Police district’s road safety assessment includes intelligence
information on light vehicle fleet risks
Number of IONs for WoF and CoF breaches, and vehicle faults
Percentage of out-of-service orders compared to all WoF/CoF IONs
Each district provides examples of joint sector initiatives to promote
safe vehicle use, including vehicle inspection activities
Walking and cycling Reduced risk for pedestrians and
cyclists
Reduction in number per 100,000
population of pedestrians/cyclists killed or
seriously injured enough to be hospitalised
for longer than one day
Keep pedestrians and cyclists safe by targeting unsafe
driving behaviour and providing school road safety training
Tailor school education programmes to address identified
school road safety risks
Work with the NZTA, local government and schools to
coordinate education programmes
Police will use a range of methods and measures including:
Each Police district's road safety assessment includes intelligence
information on safer walking/cycling
Percentage of schools with traffic safety teams that have received
training in accordance with the STST manual
Number of IONs for cycle helmet offences
Each district provides examples of joint sector initiatives
Fatigue and
distraction
More people are aware of the
risks of driving while fatigued or
distracted
Reduction of fatalities and serious injuries in
fatigue and/or distraction crashes
Discourage fatigued and distracted driving by patrolling
high-risk routes and at high risk times
Work with and coordinate activities and operations with
relevant national, regional and local partners
Police will use a range of methods and measures including:
Each Police district's road safety assessment includes intelligence
information on fatigued and distracted driving
Number of mobile phone offences
Number of HMV and other commercial vehicle fleet (eg taxis) work-
time and logbook offences
Each district provides examples of joint sector initiatives
Lo
w
Older road users Safer environment for older road
users
Reduction in fatal/serious injuries to older
road users per 100,000
Protect older road users by engaging with communities
Target driving behaviour which endangers older road users
Work with key stakeholders to ensure the safety of older
New Zealanders is considered in road safety action
planning processes
Apply for revocation of licences on medical grounds
Police will use a range of methods and measures including:
Each Police district's road safety assessment includes intelligence
information on risks for older road users
Each district provides examples of joint sector initiatives
4
Vehicle checks address five visible and important WoF elements: tyres, windows, indicators, rust and lights (TWIRL)
2012–15 Road Policing Programme
Page | 17
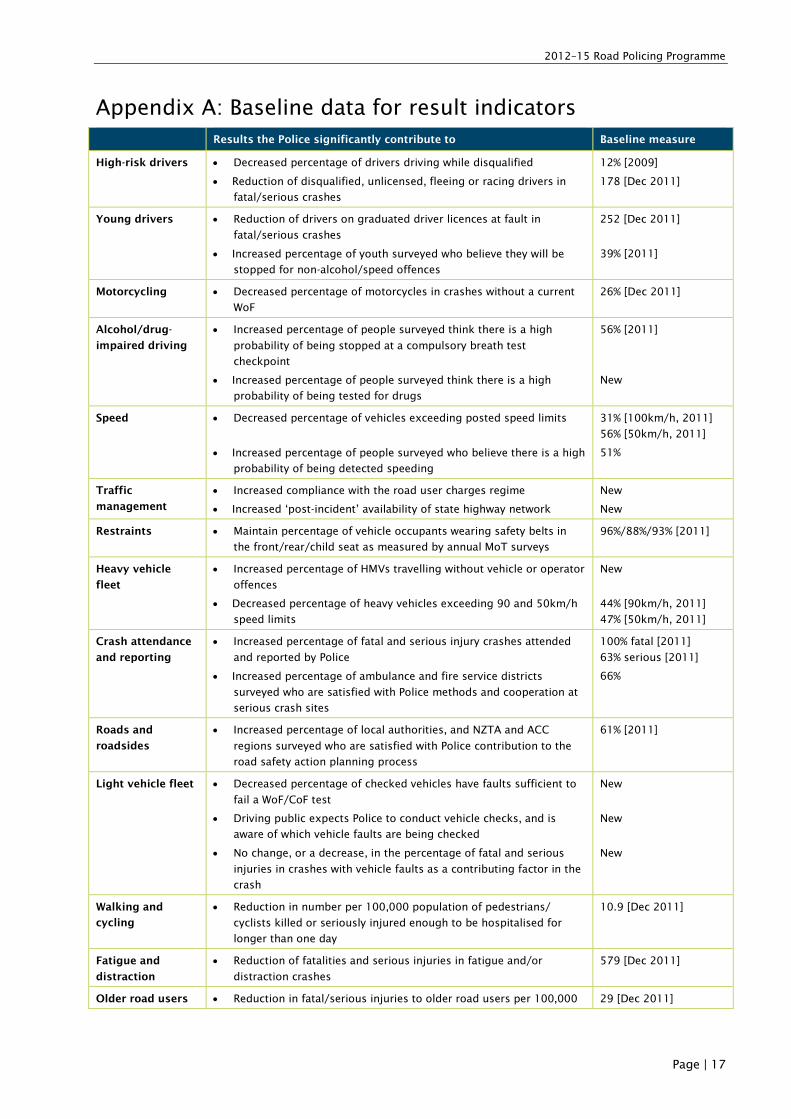
6B6BAppendix A: Baseline data for result indicators
Results the Police significantly contribute to Baseline measure
High-risk drivers Decreased percentage of drivers driving while disqualified
Reduction of disqualified, unlicensed, fleeing or racing drivers in
fatal/serious crashes
12% [2009]
178 [Dec 2011]
Young drivers Reduction of drivers on graduated driver licences at fault in
fatal/serious crashes
Increased percentage of youth surveyed who believe they will be
stopped for non-alcohol/speed offences
252 [Dec 2011]
39% [2011]
Motorcycling Decreased percentage of motorcycles in crashes without a current
WoF
26% [Dec 2011]
Alcohol/drug-
impaired driving
Increased percentage of people surveyed think there is a high
probability of being stopped at a compulsory breath test
checkpoint
Increased percentage of people surveyed think there is a high
probability of being tested for drugs
56% [2011]
New
Speed Decreased percentage of vehicles exceeding posted speed limits
Increased percentage of people surveyed who believe there is a high
probability of being detected speeding
31% [100km/h, 2011]
56% [50km/h, 2011]
51%
Traffic
management
Increased compliance with the road user charges regime
Increased ‘post-incident’ availability of state highway network
New
New
Restraints Maintain percentage of vehicle occupants wearing safety belts in
the front/rear/child seat as measured by annual MoT surveys
96%/88%/93% [2011]
Heavy vehicle
fleet
Increased percentage of HMVs travelling without vehicle or operator
offences
Decreased percentage of heavy vehicles exceeding 90 and 50km/h
speed limits
New
44% [90km/h, 2011]
47% [50km/h, 2011]
Crash attendance
and reporting
Increased percentage of fatal and serious injury crashes attended
and reported by Police
Increased percentage of ambulance and fire service districts
surveyed who are satisfied with Police methods and cooperation at
serious crash sites
100% fatal [2011]
63% serious [2011]
66%
Roads and
roadsides
Increased percentage of local authorities, and NZTA and ACC
regions surveyed who are satisfied with Police contribution to the
road safety action planning process
61% [2011]
Light vehicle fleet Decreased percentage of checked vehicles have faults sufficient to
fail a WoF/CoF test
Driving public expects Police to conduct vehicle checks, and is
aware of which vehicle faults are being checked
No change, or a decrease, in the percentage of fatal and serious
injuries in crashes with vehicle faults as a contributing factor in the
crash
New
New
New
Walking and
cycling
Reduction in number per 100,000 population of pedestrians/
cyclists killed or seriously injured enough to be hospitalised for
longer than one day
10.9 [Dec 2011]
Fatigue and
distraction
Reduction of fatalities and serious injuries in fatigue and/or
distraction crashes
579 [Dec 2011]
Older road users Reduction in fatal/serious injuries to older road users per 100,000 29 [Dec 2011]