2011 q2 report · 2012-01-18 · interim report q2 2011 ... conjunction with canfor’s unaudited...
TRANSCRIPT

CANFOR CORPORATION 2011 SECOND QUARTERINTERIM REPORT
Q2 2011For the three months ended June 30, 2011

1
2 Message to Shareholders 4 Management’s Discussion and Analysis 17 Condensed Consolidated Balance Sheets 18 Condensed Consolidated Statements of Income
19 Condensed Consolidated Statements of Other Comprehensive Income (Loss) and Changes in Equity
20 Condensed Consolidated Cash Flow Statements
21 Notes to the Condensed Consolidated Financial Statements

2
To Our Shareholders
Canfor Corporation reported net income of $26.2 million for the second quarter of 2011, compared to $32.3 million for the first quarter of 2011 and $43.7 million for the second quarter of 2010. For the six months ended June 30, 2011, the Company’s net income was $58.5 million, compared to $79.2 million for the comparable period in 2010.
The Company’s net income attributable to shareholders (“shareholder net income”) for the second quarter of 2011 was $2.1 million, or $0.01 per share, down from $7.0 million, or $0.05 per share, for the first quarter of 2011, and $21.1 million, or $0.15 per share, for the second quarter of 2010. For the first six months of 2011, shareholder net income was $9.1 million, or $0.06 per share, compared to $39.4 million, or $0.28 per share, for the first half of 2010.
Shareholder net income for the second quarter of 2011 included several items affecting comparability with prior periods, which had an overall net negative impact of $0.5 million, or $0.01 per share. After adjusting for material items affecting comparability, the Company’s adjusted shareholder net income in the second quarter of 2011 was $2.6 million, or $0.02 per share, compared to break even for the first quarter and $31.2 million, or $0.22 per share for the second quarter of 2010.
Reported EBITDA for the second quarter of 2011 was $66.8 million, down $6.1 million from the first quarter. Lower EBITDA in the lumber segment, which was down $8.4 million to $9.6 million, was partially offset by a lower reported loss for panels operations and lower corporate costs. EBITDA in the pulp and paper segment was in line with the previous quarter.
The second quarter of 2011 saw little change in the underlying factors constraining the recovery of North American lumber markets. The U.S. economy continued its painfully slow recovery, with no significant improvement in the housing sector. In addition to poor demand levels, increased lumber market inventories, in part due to weather-related overhang from the first quarter, contributed to a steep drop in North American lumber prices early in the second quarter. Prices bottomed out in May and were followed by a modest recovery before the end of the quarter in response to more balanced inventory levels. The average Western SPF 2x4 #2&Btr benchmark price for the quarter was US$240 per Mfbm, down US$56, or 19%, from the previous quarter, although decreases for wider dimensions were less significant. Lumber sales realizations from offshore markets, where prices are negotiated monthly or quarterly in advance, saw relatively minor decreases. Northern Bleached Softwood Kraft (“NBSK”) pulp markets remained strong in the second quarter, with list prices continuing their upward trend, averaging over US$1,000 per tonne for the quarter in both North America and Europe. Canadian dollar sales realizations for all products were negatively impacted by the stronger average Canadian dollar compared to the US dollar, up 2% over the previous quarter and 6% over the second quarter of 2010.
Canfor’s lumber shipment volumes rebounded after weather-related transportation constraints in the first quarter, increasing by 14% to just under a billion board feet for the quarter, with increased demand from China also a major contributing factor. Lumber production levels were up 4% from the previous quarter, with second quarter productivity improvements at various mills having a positive impact. Shipments of pulp declined as inventory levels were increased in advance of an extended scheduled maintenance shut at Canfor Pulp’s Northwood pulp mill in the third quarter.
Lumber unit manufacturing costs were down 3% from the previous quarter, in part due to the productivity improvements, as well as seasonally lower energy costs. Unit manufacturing costs for pulp products were up slightly reflecting higher maintenance, fibre and chemical fibre costs, offset in part by seasonally lower energy costs.
The Company’s $300 million, three-year strategic capital investment program at its lumber operations saw the completion of several significant capital projects during the quarter, and solid progress on numerous other projects scheduled for completion in the second half of the year. Ongoing projects include upgrades at the Vavenby sawmill in advance of its reopening in the fall and a major planer rebuild at the Polar sawmill, as well as energy systems at the Plateau and Chetwynd sawmills. Canfor will be commencing several additional high return major upgrades in the second half of the year, which will enhance the Company’s cost competitiveness and improve product profiles for the Company’s customers.
Looking forward, U.S. lumber demand is forecast to show a modest recovery in the third quarter of 2011 as home building and renovation markets see a seasonal increase in activity. However, no significant recovery is projected
3
through the balance of the year. The Canadian housing market is projected to level off, despite a stronger first half of 2011. Strong offshore demand is forecast to continue through the balance of the year. From an operational point of view, unseasonably extreme wet weather conditions in many parts of the BC Interior in recent months have been hampering log harvesting activities. Should the adverse weather conditions persist, some mill operations may be forced to take downtime in the coming weeks.
The global softwood pulp market is projected to soften during the third quarter of 2011, with demand in North America and Europe anticipated to weaken slightly over the seasonally slow summer months. China’s demand for pulp is forecast to slow in the third quarter of 2011 due to an overhang of inventories after higher than normal shipments in the second quarter of 2011.
Ronald L. Cliff Don B. Kayne Chairman President and Chief Executive Officer

4
Canfor Corporation Second Quarter 2011 Management’s Discussion and Analysis
This interim Management’s Discussion and Analysis (“MD&A”) provides a review of Canfor Corporation’s (“Canfor” or “the Company”) financial performance for the quarter ended June 30, 2011 relative to the quarters ended March 31, 2011 and June 30, 2010, and the financial position of the Company at June 30, 2011. It should be read in conjunction with Canfor’s unaudited interim consolidated financial statements and accompanying notes for the quarters ended June 30, 2011 and 2010, as well as the 2010 annual MD&A and the 2010 audited consolidated financial statements and notes thereto, which are included in Canfor’s Annual Report for the year ended December 31, 2010 (available at www.canfor.com). The financial information in this interim MD&A has been prepared in accordance with International Financial Reporting Standards (“IFRS”), which as of January 1, 2011 is the required reporting framework for Canadian publicly accountable enterprises.
Throughout this discussion, reference is made to EBITDA (calculated as operating income before amortization) which Canfor considers to be a relevant indicator for measuring trends in the performance of each of its operating segments and the Company’s ability to generate funds to meet its debt repayment and capital expenditure requirements. Reference is also made to Adjusted Shareholder Net Income (Loss) (calculated as Shareholder Net income (loss) less specific items affecting comparability with prior periods – for the full calculation, see reconciliation included in the section “Analysis of Specific Items Affecting Comparability of Shareholder Net Income”) and Adjusted Shareholder Net Income (Loss) per Share (calculated as Adjusted Shareholder Net Income (Loss) divided by the weighted average number of shares outstanding during the period). EBITDA, Adjusted Shareholder Net Income (Loss) and Adjusted Shareholder Net Income (Loss) per Share are not generally accepted earnings measures and should not be considered as an alternative to net income or cash flows as determined in accordance with IFRS. As there is no standardized method of calculating these measures, Canfor’s EBITDA, Adjusted Shareholder Net Income (Loss) and Adjusted Shareholder Net Income (Loss) per Share may not be directly comparable with similarly titled measures used by other companies. Reconciliations of EBITDA and Adjusted Shareholder Net Income (Loss) to net income (loss) reported in accordance with IFRS are included in this MD&A.
Factors that could impact future operations are also discussed. These factors may be influenced by both known and unknown risks and uncertainties that could cause the actual results to be materially different from those stated in this discussion. Factors that could have a material impact on any future oriented statements made herein include, but are not limited to: general economic, market and business conditions; product selling prices; raw material and operating costs; currency exchange rates; interest rates; changes in law and public policy; the outcome of labour and trade disputes; and opportunities available to or pursued by Canfor.
2010 prior period comparative financial information throughout this report has been restated, and is shown in accordance with IFRS. All financial references are in millions of Canadian dollars unless otherwise noted. The information in this report is as at July 28, 2011.
Forward Looking Statements
Certain statements in this MD&A constitute “forward-looking statements” which involve known and unknown risks, uncertainties and other factors that may cause actual results to be materially different from any future results, performance or achievements expressed or implied by such statements. Words such as “expects”, “anticipates”, “projects”, “intends”, “plans”, “will”, “believes”, “seeks”, “estimates”, “should”, “may”, “could”, and variations of such words and similar expressions are intended to identify such forward-looking statements. These statements are based on management’s current expectations and beliefs and actual events or results may differ materially. There are many factors that could cause such actual events or results expressed or implied by such forward-looking statements to differ materially from any future results expressed or implied by such statements. Forward-looking statements are based on current expectations and the Company assumes no obligation to update such information to reflect later events or developments, except as required by law.

5
SECOND QUARTER 2011 EARNINGS OVERVIEW
Selected Financial Information and Statistics1
Q2 Q1 YTD Q2 YTD (millions of dollars, except for per share amounts) 2011 2011 2011 2010 2010
Sales $ 619.1 $ 624.0 $ 1,243.1 $ 634.7 $ 1,212.6
EBITDA $ 66.8 $ 72.9 $ 139.7 $ 111.0 $ 196.7
Operating income $ 26.5 $ 31.4 $ 57.9 $ 69.1 $ 113.0
Foreign exchange gain (loss) on long-term debt and investments, net $ 2.0 $ 4.7 $ 6.7 $ (12.8) $ (4.0)
Gain (loss) on derivative financial instruments2 $ 1.3 $ 4.7 $ 6.0 $ (3.3) $ (4.5)
Net income $ 26.2 $ 32.3 $ 58.5 $ 43.7 $ 79.2
Net income attributable to equity shareholders of Company $ 2.1 $ 7.0 $ 9.1 $ 21.1 $ 39.4
Net income per share attributable to equity shareholders of Company, basic and diluted $ 0.01 $ 0.05 $ 0.06 $ 0.15 $ 0.28
Average exchange rate (US$/CDN$)3 $ 1.033 $ 1.014 $ 1.024 $ 0.973 $ 0.967 1 Prior period amounts have been restated, and are shown in accordance with International Financial Reporting Standards (“IFRS”). 2 Includes gains (losses) from natural gas, diesel, foreign exchange and lumber future derivative financial instruments (see “Unallocated and Other” section for more details). 3 Source – Bank of Canada (average noon rate for the period).
The Company’s shareholder net income and adjusted shareholder net income, together with the related adjustments, are detailed in the table below:
Analysis of Specific Material Items Affecting Comparability of Shareholder Net Income
After-tax impact, net of non-controlling interests Q2 Q1 YTD Q2 YTD (millions of dollars, except for per share amounts) 2011 2011 2011 2010 2010
Shareholder Net Income $ 2.1 $ 7.0 $ 9.1 $ 21.1 $ 39.4
Foreign exchange (gain) loss on long-term debt and investments, net $ (1.4) $ (3.0) $ (4.4) $ 9.0 $ 2.8
(Gain) loss on derivative financial instruments $ (0.7) $ (2.9) $ (3.6) $ 1.1 $ 2.1
Restructuring costs related to changes in management group $ 2.6 $ - $ 2.6 $ - $ -
Increase in fair value of asset-backed commercial paper $ - $ (1.0) $ (1.0) $ - $ -
Net impact of above items $ 0.5 $ (6.9) $ (6.4) $ 10.1 $ 4.9
Adjusted Shareholder Net Income $ 2.6 $ 0.1 $ 2.7 $ 31.2 $ 44.3
Shareholder net income per share (EPS), as reported $ 0.01 $ 0.05 $ 0.06 $ 0.15 $ 0.28
Net impact of above items per share $ 0.01 $ (0.05) $ (0.04) $ 0.07 $ 0.03
Adjusted Shareholder Net Income per share $ 0.02 $ 0.00 $ 0.02 $ 0.22 $ 0.31

6
EBITDA The following table reconciles the Company’s net income, as reported in accordance with IFRS, to EBITDA:
Q2 Q1 YTD Q2 YTD (millions of dollars) 2011 2011 2011 2010 2010
Net income, as reported $ 26.2 $ 32.3 $ 58.5 $ 43.7 $ 79.2
Add (subtract):
Amortization $ 40.3 $ 41.5 $ 81.8 $ 41.9 $ 83.7
Finance expense, net $ 4.9 $ 6.3 $ 11.2 $ 7.6 $ 15.3
Foreign exchange (gain) loss on long-term debt and investments, net $ (2.0) $ (4.7) $ (6.7) $ 12.8 $ 4.0
(Gain) loss on derivative financial instruments $ (1.3) $ (4.7) $ (6.0) $ 3.3 $ 4.5
Other expense (income) $ (1.1) $ 1.7 $ 0.6 $ (3.3) $ (0.4)
Income tax expense (recovery) $ (0.2) $ 0.5 $ 0.3 $ 5.0 $ 10.4
EBITDA, as reported $ 66.8 $ 72.9 $ 139.7 $ 111.0 $ 196.7
Included in above:
Negative (positive) impact of inventory valuation adjustments4 $ (1.6) $ 2.9 $ 1.3 $ 5.5 $ (17.5)
EBITDA excluding impact of inventory valuation adjustments $ 65.2 $ 75.8 $ 141.0 $ 116.5 $ 179.2 4 In accordance with IFRS, Canfor records its log and finished product inventories at the lower of cost and net realizable value (“NRV”). Significant movements in inventory volumes occur due to the seasonal build and drawdown of logs in the first and second quarters each year, respectively. In periods where market prices are depressed and NRVs are below cost, this movement in log inventory volumes can result in large swings in inventory write-down amounts recorded in those periods. In addition, changes in market prices, foreign exchange rates, and costs over the respective reporting periods affect inventory write-downs.
Reported EBITDA for the second quarter of 2011 was $66.8 million, down $6.1 million from the first quarter. Lower EBITDA in the lumber segment, which was down $8.4 million to $9.6 million, was partially offset by a lower reported loss for panels operations and lower corporate costs. EBITDA in the pulp and paper segment was in line with the previous quarter.
The second quarter of 2011 saw little change in the underlying factors constraining the recovery of North American lumber markets. The U.S. economy continued its painfully slow recovery, with no significant improvement in the housing sector. In addition to poor demand levels, increased lumber market inventories, in part due to weather-related overhang from the first quarter, contributed to a steep drop in North American lumber prices early in the second quarter. Prices bottomed out in May and were followed by a modest recovery before the end of the quarter in response to more balanced inventory levels. The average Western SPF (Spruce / Pine / Fir) 2x4 #2&Btr benchmark price for the quarter was US$240 per thousand board feet (“Mfbm”), down US$56, or 19%, from the previous quarter, although decreases for wider dimensions were less significant. Lumber sales realizations from offshore markets, where prices are negotiated monthly or quarterly in advance, saw relatively minor decreases. Northern Bleached Softwood Kraft (“NBSK”) pulp markets remained strong in the second quarter, with list prices continuing their upward trend, averaging over US$1,000 per tonne for the quarter in both North America and Europe. Sales realizations for all products were negatively impacted by the stronger average Canadian dollar compared to the US dollar, up 2% over the previous quarter.
Canfor’s lumber shipment volumes rebounded after weather-related transportation constraints in the first quarter, increasing by 14% to just under a billion board feet for the quarter, with increased demand from China also a major contributing factor. Lumber production levels were up 4% from the previous quarter, with second quarter productivity improvements at various mills having a positive impact. Shipments of pulp declined as inventory levels were increased in advance of an extended scheduled maintenance shut at Canfor Pulp’s Northwood pulp mill in the third quarter.
Lumber unit manufacturing costs were down 3% from the previous quarter, in part due to the productivity improvements, as well as seasonally lower energy costs. Unit manufacturing costs for pulp products were up slightly reflecting higher maintenance, fibre and chemical fibre costs, offset in part by seasonally lower energy costs.

7
Compared to the second quarter of 2010, EBITDA was down $44.2 million, reflecting in large part lower lumber market prices and the impact of a 6% stronger Canadian dollar on sales realizations across all products. In addition, results in the lumber segment in the second quarter of 2010 included the benefit of a lower average export tax rate on shipments to the U.S. related to higher market prices in the early part of 2010. Lumber production in the second quarter of 2011 was up compared to the same quarter in 2010 when the Chetwynd and Quesnel sawmills operated for part of the quarter (restarting in May and June of 2010, respectively), which more than offset the closure of the Clear Lake operations and higher capital project related downtime in the current period. Lower shipments of NBSK pulp and higher pulp unit manufacturing costs were also a contributing factor to the lower EBITDA.
OPERATING RESULTS BY BUSINESS SEGMENT
Lumber
Selected Financial Information and Statistics - Lumber
Q2 Q1 YTD Q2 YTD (millions of dollars unless otherwise noted) 2011 2011 2011 2010 2010
Sales $ 331.2 $ 328.6 $ 659.8 $ 336.9 $ 628.9
Operating income (loss) $ (11.1) $ (2.3) $ (13.4) $ 21.0 $ 36.8
EBITDA, as reported $ 9.6 $ 18.0 27.6 $ 41.1 $ 77.4
Negative (positive) impact of inventory valuation adjustments $ 1.1 $ 0.1 1.2 $ 2.2 $ (20.2)
EBITDA excluding impact of inventory valuation adjustments $ 10.7 $ 18.1 28.8 $ 43.3 $ 57.2
Average SPF 2x4 #2&Btr lumber price in US$5 $ 240 $ 296 $ 268 $ 266 $ 267
Average SPF price in Cdn$ $ 232 $ 292 $ 262 $ 273 $ 276
Average SYP 2x4 #2 lumber price in US$6 $ 251 $ 302 $ 276 $ 379 $ 354
Average SYP price in Cdn$ $ 243 $ 298 $ 270 $ 390 $ 366
U.S. housing starts (million units SAAR) 7 0.576 0.582 0.579 0.602 0.610
Production – SPF lumber (MMfbm) 787.6 772.3 1,559.9 724.7 1,420.7
Production – SYP lumber (MMfbm) 112.8 94.8 207.6 92.8 177.8
Shipments – SPF lumber (MMfbm)8 821.6 715.3 1,536.9 736.9 1,409.6
Shipments – SYP lumber (MMfbm)8 123.6 90.9 214.5 98.3 183.9
Shipments – wholesale lumber (MMfbm) 39.5 59.2 98.7 39.9 78.7 5 Western Spruce/Pine/Fir, per thousand board feet (Source – Random Lengths Publications, Inc.) 6 Southern Yellow Pine, Eastside, per thousand board feet (Source – Random Lengths Publications, Inc.) 7 Source – U.S. Census Bureau, seasonally adjusted annual rate (“SAAR”) 8 Canfor-produced lumber, including lumber purchased for remanufacture.
Overview
Reported EBITDA for the lumber segment was $9.6 million for the second quarter of 2011, down from $18.0 million in the previous quarter and $41.1 million in the second quarter of 2010. For the six months ended June 30, 2011, EBITDA was $27.6 million, down $49.8 million from the same period in 2010. Excluding the impact of inventory write-down adjustments, which were significant in the first quarter of 2010, EBITDA was $28.8 million for the first half of 2011, down $28.4 million from the first half of 2010.
Compared to the previous quarter, sales revenues in the lumber segment increased slightly to $331.2 million, with higher revenues from shipments of Canfor-produced lumber being partially offset by seasonally lower log sales and lower wholesale lumber sales. Overall shipments of Canfor-produced lumber for the second quarter of 2011 were up 17% from the previous quarter, for the most part reflecting the improvement in transportation networks after weather-related constraints in the first quarter and increased demand from China.
Significant reductions were seen in North American US dollar benchmark 2x4 prices for Western SPF and SYP products which were both down by approximately 18% quarter over quarter, though reductions for other grades and dimensions were less marked. Lumber sales realizations from offshore markets, which are negotiated monthly or quarterly in advance, saw relatively minor decreases. Canadian dollar sales realizations were negatively impacted by the 2% strengthening of the Canadian dollar.

8
Unit conversion costs were down from the previous quarter, reflecting improved sawmill and planer productivity and lumber recoveries and seasonally lower energy costs.
Compared to the second quarter of 2010, reported EBITDA for the lumber segment was down $31.5 million. This reflected in large part lower market prices and the stronger Canadian dollar in the current period. Benchmark prices were down US$26 per Mfbm for 2x4 Western SPF products and down US$128 for 2x4 SYP products. Total unit manufacturing costs were comparable between the periods as lower cash conversion costs in the current period were largely offset by higher log costs, which in part reflected higher diesel costs.
Markets
During the second quarter of 2011, the U.S. housing market continued to be pressured by the large inventory of foreclosed homes and delinquent mortgages. In addition, the struggling job market weighed heavily on consumer confidence. U.S. housing starts averaged 576,000 units9 SAAR for the second quarter, down slightly from the first quarter. Single family starts were 426,000 units SAAR, up 3% from the first quarter, while multi-family starts were down 11% at 150,000 units SAAR. Compared to the second quarter of 2010, total housing starts were 4% lower, with single family starts down 13% and multi-family starts up 36%.
In addition to the struggling markets, the overhang of high market inventory levels from weather-related transportation disruption in the first quarter contributed to falling lumber prices through the early part of the second quarter. Prices bottomed out in May but saw a modest increase towards the end of the quarter as inventories returned to more normal levels.
In Canada, lumber consumption increased slightly as seasonal improvement in housing activity pushed starts higher than the previous quarter. Housing starts in Canada averaged 195,000 units10 SAAR, up 12% compared to the first quarter but down slightly from the second quarter of 2010.
Offshore markets remained strong. In China, the concrete forming, remanufacture and wood frame construction sectors continued to increase their consumption of BC lumber. In Japan, rebuilding efforts in the aftermath of the March 11, 2011 earthquake and tsunami are progressing slowly as a result of the sheer scale of the damage caused. However, Japanese lumber demand has remained quite resilient, with housing starts in the first half of 2011 ahead of last year’s levels.
Sales
Sales for the lumber segment in the second quarter of 2011 were $331.2 million, in line with both the previous quarter and the second quarter of 2010.
Total shipments for the second quarter of 2011 were 985 million board feet, up 14% from the previous quarter reflecting higher seasonal demand, increased demand from China and a return to normal transportation operations after severe winter weather conditions in the first quarter. Shipments to Asia experienced a 14% increase over the previous quarter and were 71% higher than for the same quarter in 2010; China continued to lead all offshore shipment volumes. Compared to the same quarter in 2010, lumber shipments were up almost 13%, with lower shipments into North America being more than offset by significantly larger volumes to China.
With U.S. housing markets remaining stagnant and excess North American supply well into the second quarter, North American benchmark prices retreated from the peaks seen in the first quarter. The benchmark Random Lengths prices for Western SPF 2x4 #2&Btr and SYP 2x4 products were both down by approximately 18%, averaging US$240 per Mfbm and US$251 per Mfbm, respectively, in the second quarter. Benchmark prices were down for all wider dimensions as well, though less significantly than 2x4 for most dimensions. Sales realizations from offshore markets, where prices are negotiated monthly or quarterly in advance, saw relatively minor decreases.
As well as the lower market prices, Canadian dollar sales realizations were also negatively impacted by the higher average value of the Canadian dollar compared to the US dollar in the second quarter (up almost 2 cents, or 2%, from the previous quarter), and higher freight costs, reflecting increased fuel surcharges and tight container availability.
9 U.S. Census Bureau 10 CMHC – Canada Mortgage and Housing Corporation

9
Compared to the second quarter of 2010, prices were also well down, with benchmark Western SPF 2x4 #2&Btr and SYP 2X4 prices down 10% and 34%, respectively, from the previous quarter. Similar price movements were seen across most other widths of lumber. The fall in market prices was compounded by a higher Canadian dollar and higher freight costs in the second quarter of 2011.
Under the Softwood Lumber Agreement (“SLA”) implemented by the federal governments of Canada and the U.S. in 2006, Canadian softwood lumber exporters pay an export tax on lumber shipped to the U.S. when the price of lumber is at or below US$355 per Mfbm, as determined by the Random Lengths Framing Lumber Composite Price (“RLCP”). The export tax rate is determined monthly, with the rate being based on the following trigger prices:
Trigger RLCP Tax Rate
Over US$355 0 %
US$336-$355 5 %
US$316-$335 10 %
US$315 and under 15 %
The RLCP averaged US$264 per Mfbm for the second quarter of 2011, well below the trigger price required to reduce the export tax rate from 15%. During the second quarter of 2010, however, the RLCP exceeded certain trigger levels, resulting in the export tax rate on all U.S. bound shipments for May 2010 and June 2010 dropping from 15% to 10% and 0%, respectively.
Total residual fibre revenue was up from the first quarter of 2011, reflecting higher production volumes and residual chip prices related to improved NBSK pulp sales realizations in the quarter. Compared to the second quarter of 2010, residual fibre revenue was well up, again reflecting higher production volumes and residual chip prices.
Operations
The Company operated at 72% of lumber capacity in the second quarter, with production of approximately 900 million board feet, up 4% from the previous quarter. The increase principally reflected productivity improvements and less capital downtime taken in the current quarter. Compared to the second quarter of 2010, lumber production was up 10%, reflecting improved productivity in the current period, and market curtailment at the Chetwynd and Quesnel sawmills during the second quarter of 2010, with these sawmills reopening in May and June of 2010 respectively. This was offset in part by the Clear Lake closure in early 2011.
Overall, the Company’s lumber unit manufacturing costs were down 3% from the previous quarter, reflecting decreases in both unit cash conversion and consumed log costs. The improvement in unit cash conversion costs reflected the improved productivity levels, as well as seasonally lower energy usage. Log costs were down principally as a result of improving log-to-lumber recoveries, reflecting the impact of various recent capital improvements.
Compared to the second quarter of 2010, unit manufacturing costs were at similar levels, with lower cash conversion costs being offset by increased log costs. The improved conversion costs again reflected the improved productivity levels, as well as the closure of the higher-cost Clear Lake sawmill and the fact that Chetwynd and Quesnel re-started part way through the second quarter of 2010. The higher log costs reflected higher diesel costs.
Restructuring, mill closure and severance costs in the current quarter were $3.7 million, up $2.2 million from the previous quarter, with the majority of the increase relating to severance expenses following the change in Company management announced in early May. Restructuring costs were down $1.1 million from the second quarter of 2010, when the Quesnel and Chetwynd sawmills were curtailed for part of the quarter.

10
Pulp and Paper
Selected Financial Information and Statistics – Pulp and Paper11
Q2 Q1 YTD Q2 YTD (millions of dollars unless otherwise noted) 2011 2011 2011 2010 2010
Sales $ 277.0 $ 283.0 $ 560.0 $ 280.1 $ 549.8
Operating income $ 48.1 $ 47.2 $ 95.3 $ 55.0 $ 89.4
EBITDA $ 63.4 $ 64.0 $ 127.4 $ 72.5 $ 123.5
Average pulp price delivered to U.S. – US$12 $ 1,025 $ 970 $ 998 $ 993 $ 937
Average price in Cdn$ $ 992 $ 957 $ 975 $ 1,021 $ 969
Production – pulp (000 mt) 314.7 316.9 631.6 315.6 622.7
Production – paper (000 mt) 31.8 34.5 66.3 36.3 67.3
Shipments – Canfor-produced pulp (000 mt) 303.7 318.4 622.1 301.4 617.0
Pulp marketed on behalf of HSLP (000 mt)13 - - - 95.2 186.7
Shipments – paper (000 mt) 32.7 32.6 65.3 34.4 72.1 11 Includes the Taylor pulp mill and 100% of Canfor Pulp Limited Partnership (“CPLP”), which is consolidated in Canfor’s results. Pulp production and shipment volumes presented are for both northern bleached softwood kraft (“NBSK”) and bleached chemi-thermo mechanical pulp (“BCTMP”). 12 Per tonne, NBSK pulp list price delivered to U.S. (Resource Information Systems, Inc.). 13 Howe Sound Pulp and Paper Limited Partnership pulp mill.
Overview
EBITDA for the pulp and paper segment for the second quarter of 2011 was $63.4 million, in line with the prior quarter and down $9.1 million from the second quarter of 2010. For the six months ended June 30, 2011 EBITDA was $127.4 million, a slight improvement from the comparable period in 2010.
Compared to the previous quarter, US dollar pulp prices saw solid increases from the previous quarter, though this was tempered by the impact of the stronger Canadian dollar. The positive impact of the higher sales realizations was mostly offset by lower shipment volumes in the quarter and higher unit manufacturing costs, the latter reflecting an increase in both conversion and fibre costs.
The lower EBITDA compared to the second quarter of 2010 principally reflected lower shipments of NBSK pulp, higher unit manufacturing costs and lower BCTMP prices. The higher unit manufacturing costs reflected higher fibre and maintenance costs, as well as increased chemical prices. Realized NBSK pulp Canadian dollar sales realizations increased slightly as a 3% increase in US dollar list prices and a higher proportion of sales into higher margin business, were partially offset by a strengthening of the Canadian dollar.
Markets
Global softwood pulp markets remained balanced through the second quarter of 2011 led by continued strong demand in China. According to the latest published World 2014 report, global bleached softwood pulp shipments for June were 2% higher when compared to the same period in 2010, and for June year-to-date 2011 were 7% higher than the same period in 2010. PPPC15 statistics reported an increase in global demand for printing and writing papers of 1% for May 2011 year-to-date as compared to the same period in 2010.
Global softwood pulp producer inventories remained balanced due to steady global demand and reduced supply as the industry completed annual spring maintenance in the second quarter of 2011. World 20 Producers’ bleached softwood pulp inventories increased 4 days during the quarter to 28 days of supply, with a balanced market generally considered to be in the 27-30 day range.
Sales
Shipments of Canfor-produced pulp in the second quarter of 2011 were 304,000 tonnes, down 15,000, or 5%, from the previous quarter as Canfor Pulp Limited Partnership (“CPLP”) increased its inventory levels in advance of an extended scheduled maintenance shut at the Northwood pulp mill in the third quarter. Shipments were up marginally compared to the second quarter of 2010.
14 World 20 data is based on twenty producing countries representing 80% of world chemical market pulp capacity and is based on information compiled and prepared by the PPPC. 15 Pulp and Paper Products Council (“PPPC”).

11
As a result of continued tight market conditions, average NBSK pulp list prices saw solid increases compared to the previous quarter, up US$55 per tonne for North America to US$1,025 and US$57 per tonne for Europe to US$1,017. CPLP’s NBSK pulp list price for China increased from an average of US$870 per tonne in the previous quarter to US$930 in the second quarter, driven by continued strong demand from that region. These price improvements were partially offset by a 2% strengthening of the Canadian dollar. BCTMP sales realizations were down slightly from the previous quarter.
Compared to the second quarter of 2010, NBSK pulp list prices to the U.S. were up US$32 per tonne, reflecting the tight markets in the current quarter. Average NBSK pulp list prices to Europe were up US$60 per tonne, with the China price up US$67. Sales realizations were also positively impacted by a higher proportion of sales into higher margin business. However, a 6% increase in the value of the Canadian dollar partially offset these benefits. BCTMP Canadian dollar sales realizations were well down from the comparative quarter in 2010 reflecting both weaker market conditions and prices, as well as the stronger Canadian dollar.
Operations
Pulp production in the second quarter of 2011 was 315,000 tonnes, in line with the previous quarter and the second quarter of 2010, with the impact of scheduled maintenance shuts being largely offset by improved productivity as CPLP’s facilities set a record for average daily production during the second quarter of 2011. Annual scheduled maintenance was carried out at CPLP’s Prince George and Intercontinental NBSK pulp mills in the quarter, as well as at the Taylor BCTMP mill.
Unit manufacturing costs were up compared to the previous quarter, reflecting increased cash conversion and fibre costs. The increased conversion costs reflected higher maintenance spending and increased prices for chemicals, partially offset by seasonally lower energy usage. Higher fibre costs reflected an increase in the price of sawmill residual chips, which are linked to NBSK pulp market prices.
Compared to the second quarter of 2010, unit manufacturing costs were up slightly. Higher conversion costs were the result of increased maintenance costs and higher chemical prices; fibre costs were also up due to higher sawmill residual chip costs, partially offset by a reduction in the cost of whole log chips.
Unallocated and Other Items Q2 Q1 YTD Q2 YTD (millions of dollars) 2011 2011 2011 2010 2010
Operating loss of Panels operations16 $ (4.2) $ (5.7) $ (9.9) $ (2.7) $ (3.2)
Corporate costs $ (6.3) $ (7.8) $ (14.1) $ (4.2) $ (10.0)
Finance expense, net $ (4.9) $ (6.3) $ (11.2) $ (7.6) $ (15.3)
Foreign exchange gain (loss) on long-term debt and investments, net $ 2.0 $ 4.7 $ 6.7 $ (12.8) $ (4.0)
Gain (loss) on derivative financial instruments $ 1.3 $ 4.7 $ 6.0 $ (3.3) $ (4.5)
Other income (expense), net $ 1.1 $ (1.7) $ (0.6) $ 3.3 $ 0.4 16 The Panels operations include the Peace Valley OSB (Oriented Strand Board) joint venture, the only facility currently operating, and the Company’s Tackama plywood and PolarBoard OSB plants, both of which are currently indefinitely idled.
The panels operations reported an operating loss of $4.2 million for the second quarter of 2011, compared to a loss of $5.7 million for the previous quarter. Excluding the impact of inventory valuation adjustments, which were significant in both quarters, the operating loss of panels operations increased by $3.1 million in the second quarter compared to the first quarter. The higher loss principally related to depressed market conditions. Compared to the second quarter of 2010, excluding inventory valuation adjustments, the operating loss worsened by $7.3 million, largely reflecting the considerably weaker market prices, as evidenced by a decline of US$125 per thousand square feet17, or 42%, in OSB prices. Prices are expected to remain weak through the next quarter.
Corporate costs were $6.3 million for the second quarter of 2011, down $1.5 million from the previous quarter, with a significant positive adjustment relating to share-based compensation being partially offset by severance costs following changes to the Company’s management team announced in May. Compared to the second quarter of 2010, corporate costs were up $2.1 million, reflecting the severance costs in the current quarter and the reclassification of certain pension and other costs, offset in part by lower share based compensation costs. 17 Oriented Strand Board, North Central price, 7/16” (Source – Random Lengths Publications, Inc.)

12
Net finance expense of $4.9 million for the second quarter of 2011 was down $1.4 million from the previous quarter and $2.7 million from the second quarter of 2010, largely as a result of lower long-term debt balances and the positive impact from the stronger Canadian dollar on US dollar interest.
The Company recorded a foreign exchange translation gain on its US dollar denominated debt, net of investments, of $2.0 million for the second quarter of 2011 as a result of the strengthening of the Canadian dollar against the US dollar by almost 1% at the respective quarter ends. The $4.7 million gain in the first quarter of 2011 reflected a 2% increase in the value of the Canadian dollar over the period, and the $12.8 million loss in the second quarter of 2010 resulted from a 4% decrease in its value.
The Company uses a variety of derivative financial instruments as partial economic hedges against unfavourable changes in natural gas and diesel costs, foreign exchange rates and lumber prices. For the second quarter of 2011, the Company recorded a net gain of $1.3 million on its derivative instruments, principally reflecting gains attributable to the stronger Canadian dollar and falling lumber market prices. The following table summarizes the gains (losses) on derivative financial instruments for the comparable periods.
Q2 Q1 YTD Q2 YTD (millions of dollars) 2011 2011 2011 2010 2010
Foreign exchange collars and forward contracts $ 1.0 $ 1.9 $ 2.9 $ (9.5) $ (3.7)
Natural gas swaps $ (0.1) $ (0.1) $ (0.2) $ 0.2 $ (3.5)
Diesel options and swaps $ (0.2) $ 1.0 $ 0.8 $ (1.0) $ (0.6)
Lumber futures $ 0.6 $ 1.9 $ 2.5 $ 7.0 $ 3.3 $ 1.3 $ 4.7 $ 6.0 $ (3.3) $ (4.5)
SUMMARY OF FINANCIAL POSITION
The following table summarizes Canfor’s cash flow and selected ratios for and as at the end of the following periods:
Q2 Q1 YTD Q2 YTD (millions of dollars) 2011 2011 2011 2010 2010
Increase (decrease) in cash and cash equivalents $ (42.5) $ (87.8) $ (130.3) $ 132.8 $ 93.5
Operating activities $ 69.8 $ (5.7) $ 64.1 $ 186.6 $ 214.4
Financing activities $ (80.1) $ (75.0) $ (155.1) $ (21.9) $ (74.5)
Investing activities $ (32.2) $ (6.8) $ (39.0) $ (32.2) $ (46.5)
Ratio of current assets to current liabilities 2.2 : 1 2.2 : 1
Net debt to capitalization 6.2% 7.3%
ROCE – Consolidated18 0.3% 0.9% 1.2% 1.9% 3.6%
ROCE - Canfor solid wood business19 (1.3)% (0.3)% (1.6)% 0.5% 1.5% 18 Consolidated Return on Capital Employed (“ROCE”) is equal to shareholder net income for the period plus finance expense, after tax, divided by the average capital employed during the period. Capital employed consists of current bank loans, current portion of long-term debt, long-term debt and shareholders’ equity, less cash and cash equivalents and temporary investments. 19 ROCE for the Canfor solid wood business represents consolidated ROCE adjusted to remove the results and capital employed of the Company’s interest in the Peace Valley OSB Joint Venture and pulp and paper operations, including CPLP and the Taylor pulp mill.
Changes in Financial Position
Cash generated from operating activities was $69.8 million in the second quarter of 2011, compared to cash used of $5.7 million in the previous quarter. The significant drawdown of logs during the Canadian spring break-up period had a significant positive cash flow impact in the second quarter, in contrast to the cash used in the previous quarter in the related inventory build-up. This positive impact was partially offset by reduced accounts payable balances over the period, as well as lower cash earnings compared to the first quarter. Compared to the second quarter of 2010, cash generated from operating activities was down by over $115 million reflecting lower cash earnings, a less positive swing in working capital balances, a $16.9 million income tax refund in the second quarter of 2010 and higher pension contributions in the current quarter.

13
Financing activities used cash of $80.1 million in the second quarter of 2011, compared to $75.0 million in the previous quarter and $21.9 million in the second quarter of 2010. The current quarter’s cash flows included the repayment of long term debt of $48.1 million (Q1 2011: $33.8 million; Q2 2010: nil) and cash distributions to non-controlling interests of $25.9 million (Q1 2011: $38.0 million; Q2 2010: $16.1 million). Interest payments in the current quarter were $6.1 million up $2.6 million from the previous quarter, due to timing of payments, and were in line with the second quarter of 2010.
Investing activities used net cash of $32.2 million in the second quarter of 2011, compared to $6.8 million in the first quarter (when the Company received cash of $29.7 million from the redemption/sale of its certain asset backed commercial paper assets) and $32.2 million in the second quarter of 2010. Cash used for capital additions was $55.6 million in the current quarter, up $6.7 million from the previous quarter. Capital additions for lumber operations in the current quarter included payments related to a major planer upgrade at the Company’s Polar sawmill, an upgrade of the Vavenby sawmill in advance of its restart in the fall, two new energy systems and two planer optimization installations.
Capital expenditures for the second quarter of 2011 for the pulp and paper segment were $30.8 million, with $20.2 million of this for projects related to the government funded Green Transformation Program (the “Program”). CPLP received cash of $21.6 million in the second quarter as reimbursement for capital additions under the Program. CPLP has received Program approval to proceed with four projects totaling $157.4 million, of which $122.2 million will be funded under the Program. As of June 30, 2011 CPLP had incurred expenditures of $79.0 million and received reimbursements totaling $51.4 million.
Liquidity and Financial Requirements
At June 30, 2011, the Company on a consolidated basis had cash and cash equivalents of $130.0 million and $446.6 million of bank operating lines of credit, which were undrawn, with $30.8 million reserved for several standby letters of credit. The Company and CPLP remained in compliance with the covenants relating to their operating lines of credit and long-term debt during the quarter, and expect to remain so for the foreseeable future.
The Company’s consolidated net debt to total capitalization at the end of the second quarter of 2011 was 6.2%. Scheduled debt repayments in the first half of 2011 included US$32.3 million, which was paid on March 1, and US$50.0 million, which was paid on April 1. There are no further long-term debt repayments due over the balance of 2011.
Softwood Lumber Agreement (“SLA”) Update
On January 18, 2011, the U.S. triggered the arbitration provision of the 2006 SLA by delivering a Request for Arbitration. The U.S. claims that BC has not properly applied the timber pricing system grandparented in the SLA. The U.S. also claims that subsequent to 2006, BC made additional changes to the timber pricing system which had the effect of reducing timber prices. The claim focuses on substantial increases in Grade 4 (non sawlog or low grade) volumes commencing in 2007. It is alleged that timber was scaled and graded as Grade 4 that did not meet the criteria for that grade, and was accordingly priced too low.
As the arbitration is a state-to-state international dispute under the SLA, Canada is preparing a defence to the claim with the assistance of the BC provincial government and the BC lumber industry. The U.S. is anticipated to file a detailed statement of claim with the arbitration panel in August 2011. It is not possible at this time to predict the outcome or the value of the claim, and accordingly no provision has been recorded by the Company.
OUTLOOK
Lumber
Looking forward, U.S. lumber demand is forecast to show a modest recovery in the third quarter of 2011 as home building and renovation markets see a seasonal increase in activity. However, no significant recovery is projected through the balance of the year. The Canadian housing market is projected to level off, despite a stronger first half of 2011. Strong offshore demand is forecast to continue through the balance of the year.
From an operational point of view, unseasonably extreme wet weather conditions in many parts of the BC Interior in recent months have been hampering log harvesting activities. Should the adverse weather conditions persist, several mill operations may be forced to take downtime in the coming weeks.

14
Pulp and Paper
The global softwood pulp market is projected to soften during the third quarter of 2011. Price decreases were announced in July of US$20 per tonne for North America and US$60 per tonne for China. Demand is projected to weaken slightly as may typically occur in North America and Europe during the summer months. China’s demand for pulp is forecast to slow in the third quarter of 2011 due to higher than normal shipments in the second quarter of 2011 resulting in higher consumer inventories entering the third quarter of 2011.
OUTSTANDING SHARES
At July 28, 2011, there were 142,705,764 common shares outstanding.
CRITICAL ACCOUNTING ESTIMATES
The preparation of financial statements in conformity with International Financial Reporting Standards requires management to make estimates and assumptions that affect the amounts recorded in the financial statements. On an ongoing basis, management reviews its estimates, including those related to useful lives for amortization, impairment of long-lived assets, certain accounts receivable, pension and other employee future benefit plans and asset retirement and deferred reforestation obligations based upon currently available information. While it is reasonably possible that circumstances may arise which cause actual results to differ from these estimates, management does not believe it is likely that any such differences will materially affect the Company’s financial condition.
CONVERSION TO INTERNATIONAL FINANCIAL REPORTING STANDARDS
For interim and annual periods in 2011 and beyond, Canfor is required to prepare financial statements in accordance with International Financial Reporting Standards (“IFRS”). The Company’s financial statements for the first quarter of 2011 were the first to be prepared in accordance with IFRS, and a number of additional disclosures were included in those financial statements in relation to the impact of transition. Certain disclosures have been included in the financial statements for the current period to reconcile comparative financial information for the second quarter of 2010 under IFRS to the information presented under previous Canadian generally accepted accounting principles (“GAAP”). These disclosures are included in note 12 to the financial statements.
Reporting in accordance with IFRS has now been embedded into the Company’s systems and procedures.
NEW ACCOUNTING PRONOUNCEMENTS
In the first half of 2011, the International Accounting Standards Board (“IASB”) issued a number of new and revised accounting standards which are effective for annual periods beginning on or after January 1, 2013, with early adoption permitted. These standards include the following:
IFRS 9, Financial Instruments; IFRS 10, Consolidated Financial Statements; IFRS 11, Joint Arrangements; IFRS 12, Disclosure of Interests in Other Entities; IAS 27, Separate Financial Statements; IFRS 13, Fair Value Measurement; Amended IAS 19, Employee Benefits; and Amended IAS 28, Investments in Associates and Joint Ventures.
In June 2011, the IASB also issued amended IAS 1, Presentation of Financial Statements, which is effective for annual periods beginning on or after July 1, 2012.
These new and revised accounting standards have not yet been adopted by Canfor, and the Company has not yet completed the process of assessing the impact that they will have on its financial statements or whether to early adopt any of the new requirements.

15
INTERNAL CONTROLS OVER FINANCIAL REPORTING
During the quarter ended June 30, 2011, there were no changes in the Company’s internal controls over financial reporting that materially affected, or would be reasonably likely to materially affect, such controls.
RISKS AND UNCERTAINTIES
A comprehensive discussion of risks and uncertainties is included in the Company’s 2010 annual statutory reports which are available on www.canfor.com or www.sedar.com.
SELECTED QUARTERLY FINANCIAL INFORMATION
International Financial Reporting Standards19 Previous Canadian
GAAP19
Q2
2011 Q1
2011 Q4
2010 Q3
2010 Q2
2010 Q1
2010 Q4
2009 Q3
2009
Sales and income (millions of dollars)
Sales $ 619.1 $ 624.0 $ 629.1 $ 588.7 $ 634.7 $ 577.9 $ 549.6 $ 521.3
Operating income (loss) $ 26.5 $ 31.4 $ 41.7 $ 32.0 $ 69.1 $ 43.9 $ (23.6) $ (31.4)
Net income (loss) $ 26.2 $ 32.3 $ 55.4 $ 37.2 $ 43.7 $ 35.5 $ (9.1) $ 4.1
Shareholder net income (loss) $ 2.1 $ 7.0 $ 31.4 $ 9.1 $ 21.1 $ 18.3 $ (17.0) $ (5.2)
Per common share (dollars)
Shareholder net income (loss) – basic and diluted $ 0.01 $ 0.05 $ 0.22 $ 0.06 $ 0.15 $ 0.13 $ (0.12) $ (0.04)
Statistics
Lumber shipments (MMfbm) 985 865 895 877 875 797 887 837
OSB shipments (MMsf 3/8”) 69 63 57 58 72 72 63 69
Pulp shipments (000 mt) 303 318 331 277 301 316 315 307
Average exchange rate – US$/Cdn$ $ 1.033 $ 1.014 $ 0.987 $ 0.962 $ 0.973 $ 0.961 $ 0.947 $ 0.912
Average Western SPF 2x4 #2&Btr lumber price (US$) $ 240 $ 296 $ 269 $ 223 $ 266 $ 268 $ 205 $ 191
Average SYP (East) 2x4 #2 lumber price (US$) $ 251 $ 302 $ 256 $ 243 $ 379 $ 329 $ 231 $ 230
Average OSB price – North Central (US$) $ 172 $ 199 $ 191 $ 178 $ 295 $ 214 $ 172 $ 178
Average NBSK pulp list price delivered to U.S. (US$) $
1,025 $ 970 $ 967 $ 1,000 $ 993 $ 880 $ 820 $ 733
19 Financial information for 2010 has been restated to be shown in accordance with IFRS. Financial information for 2009 has not been restated, and is shown above in accordance with previous Canadian GAAP.
In addition to exposure to changes in product prices and foreign exchange, the Company’s financial results are impacted by seasonal factors such as weather and building activity. Adverse weather conditions can cause logging curtailments, which can affect the supply of raw materials to manufacturing facilities. Market demand also varies seasonally to some degree. For example, building activity and repair and renovation work, which affects demand for lumber products, is generally stronger in the spring and summer months. These factors, along with global supply and demand conditions, affect the Company’s shipment volumes. Also, operating losses for the quarters in 2009 reflect the impact of a global economic slowdown.

16
Other material factors that impact the comparability of the quarters are noted below:
After-tax impact, net of non-controlling interests International Financial Reporting Standards20
Previous Canadian GAAP20
(millions of dollars, except for per share amounts)
Q22011
Q12011
Q42010
Q32010
Q22010
Q1 2010
Q42009
Q32009
Shareholder net income (loss), as reported $ 2.1 $ 7.0 $ 31.4 $ 9.1 $ 21.1 $ 18.3 $ (17.0) $ (5.2)
Foreign exchange (gain) loss on long-term debt and investments, net $ (1.4) $ (3.0) $ (6.9) $ (6.3) $ 9.0 $ (6.2) $ (5.8) $ (19.6)
(Gain) loss on derivative financial instruments $ (0.7) $ (2.9) $ (0.5) $ (1.1) $ 1.1 $ 1.0 $ (1.4) $ (12.7)
Restructuring costs related to changes in management group $ 2.6 $ - $ - $ - $ - $ - $ - $ -
Gain on sale of operating assets of Howe Sound Pulp and Paper Limited Partnership $ - $ - $ (4.9) $ - $ - $ - $ - $ -
Increase in fair value of asset-backed commercial paper $ - $ (1.0) $ (5.5) $ - $ - $ - $ - $ -
Clear Lake permanent closure provision $ - $ - $ - $ 13.4 $ - $ - $ - $ -
Net impact of above items $ 0.5 $ (6.9) $ (17.8) $ 6.0 $ 10.1 $ (5.2) $ (7.2) $ (32.3)
Adjusted shareholder net income (loss) $ 2.6 $ 0.1 $ 13.6 $ 15.1 $ 31.2 $ 13.1 $ (24.2) $ (37.5)
Shareholder net income (loss) per share (EPS), as reported $
0.01 $
0.05 $ 0.22 $
0.06 $ 0.15 $
0.13 $ (0.12) $ (0.04)
Net impact of above items per share $ 0.01 $ (0.05) $ (0.12) $ 0.04 $ 0.07 $ (0.04) $ (0.05) $ (0.22)
Adjusted shareholder net income (loss) per share $
0.02 $ 0.00 $ 0.10 $ 0.10 $ 0.22 $ 0.09 $ (0.17) $ (0.26)
20 Financial information for 2010 has been restated to be shown in accordance with IFRS. Financial information for 2009 has not been restated, and is shown above in accordance with previous Canadian GAAP.

17
Canfor Corporation Condensed Consolidated Balance Sheets
(millions of dollars, unaudited)
As at June 30,
2011
As at December 31,
2010
ASSETS Current assets Cash and cash equivalents $ 130.0 $ 260.3 Accounts receivable - Trade 177.6 146.9 - Other 61.1 54.2 Inventories (Note 2) 318.8 325.8 Prepaid expenses 39.2 28.1
Total current assets 726.7 815.3
Property, plant and equipment 1,040.0 1,049.1 Timber licenses 538.3 546.7 Goodwill and other intangible assets 80.6 84.5 Long-term investments and other (Note 3) 60.7 89.1
Total assets $ 2,446.3 $ 2,584.7 LIABILITIES Current liabilities Accounts payable and accrued liabilities $ 257.2 $ 292.9 Current portion of long-term debt (Note (4(b)) 48.2 82.5 Current portion of deferred reforestation obligation 31.5 31.6
Total current liabilities 336.9 407.0
Long-term debt (Note 4(b)) 178.5 235.6 Retirement benefit obligations 260.8 272.2 Deferred reforestation obligation 61.6 54.3 Other long-term liabilities 14.6 16.4 Deferred income taxes, net 122.5 123.7
Total liabilities $ 974.9 $ 1,109.2 EQUITY Share capital $ 1,125.7 $ 1,125.4 Contributed surplus 31.9 31.9 Retained earnings 84.3 79.0 Accumulated foreign exchange translation differences (16.2) (10.3)
Total equity attributable to equity holders of the Company 1,225.7 1,226.0
Non-controlling interests 245.7 249.5
Total equity $ 1,471.4 $ 1,475.5
Total liabilities and equity $ 2,446.3 $ 2,584.7
Contingency (Note 11)
The accompanying notes are an integral part of these condensed consolidated financial statements.
APPROVED BY THE BOARD
Director, R.S. Smith Director, R.L. Cliff

18
Canfor Corporation Condensed Consolidated Statements of Income
3 months ended June 30, 6 months ended June 30,(millions of dollars, unaudited) 2011 2010 2011 2010
Sales $ 619.1 $ 634.7 $ 1,243.1 $ 1,212.6
Costs and expenses
Manufacturing and product costs 399.0 384.1 808.1 742.3 Freight and other distribution costs 123.8 109.3 236.4 210.5 Export taxes 9.4 8.4 20.2 20.0 Amortization 40.3 41.9 81.8 83.7 Selling and administration costs 13.2 16.1 29.0 31.7 Restructuring, mill closure and severance costs 6.9 5.8 9.7 11.4
592.6 565.6 1,185.2 1,099.6
Operating income 26.5 69.1 57.9 113.0 Finance expense, net (4.9) (7.6) (11.2) (15.3)Foreign exchange gain (loss) on long-term debt and investments, net 2.0 (12.8) 6.7 (4.0)Gain (loss) on derivative financial instruments (Note 6) 1.3 (3.3) 6.0 (4.5)Other income (expense), net 1.1 3.3 (0.6) 0.4
Net income before income taxes 26.0 48.7 58.8 89.6 Income tax (expense) recovery (Note 7) 0.2 (5.0) (0.3) (10.4)
Net income $ 26.2 $ 43.7 $ 58.5 $ 79.2
Net income attributable to:
Equity shareholders of Company $ 2.1 $ 21.1 $ 9.1 $ 39.4 Non-controlling interests 24.1 22.6 49.4 39.8
Net income $ 26.2 $ 43.7 $ 58.5 $ 79.2
Net income per common share: (in dollars)
Attributable to equity shareholders of Company - Basic and diluted (Note 8) $ 0.01 $ 0.15 $ 0.06 $ 0.28
The accompanying notes are an integral part of these condensed consolidated financial statements.

19
Canfor Corporation Condensed Consolidated Statements of Other Comprehensive Income (Loss) 3 months ended June 30, 6 months ended June 30, (millions of dollars, unaudited) 2011 2010 2011 2010
Net income $ 26.2 $ 43.7 $ 58.5 $ 79.2
Other comprehensive income (loss)
Foreign exchange translation differences for foreign operations 0.3 11.7 (5.9) 3.7
Defined benefit plan actuarial losses (Note 5) (8.8) (47.6) (5.8) (94.9) Income tax recovery on defined benefit plan actuarial losses
(Note 7)
2.2
10.9 1.4 21.5
Other comprehensive income (loss), net of tax (6.3) (25.0) (10.3) (69.7)
Total comprehensive income $ 19.9 $ 18.7 $ 48.2 $ 9.5
Total comprehensive income (loss) attributable to:
Equity shareholders of Company $ (3.7) $ 0.1 $ (0.6) $ (21.6)Non-controlling interests 23.6 18.6 48.8 31.1
Total comprehensive income $ 19.9 $ 18.7 $ 48.2 $ 9.5
Condensed Consolidated Statements of Changes in Equity 3 months ended June 30, 6 months ended June 30, (millions of dollars, unaudited) 2011 2010 2011 2010
Share capital Balance at beginning of period $ 1,125.7 $ 1,124.7 $ 1,125.4 $ 1,124.7 Common shares issued on exercise of stock options - 0.3 0.3 0.3
Balance at end of period $ 1,125.7 $ 1,125.0 $ 1,125.7 $ 1,125.0
Contributed surplus
Balance at beginning and end of period $ 31.9 $ 31.9 $ 31.9 $ 31.9
Retained earnings Balance at beginning of period $ 88.3 $ 26.5 $ 79.0 $ 40.2 Net income attributable to equity shareholders of Company 2.1 21.1 9.1 39.4 Defined benefit plan actuarial gains (losses), net of tax (6.1) (32.7) (3.8) (64.7)
Balance at end of period $ 84.3 $ 14.9 $ 84.3 $ 14.9
Accumulated foreign exchange translation differences Balance at beginning of period $ (16.5) $ (8.0) $ (10.3) $ - Foreign exchange translation differences for foreign operations 0.3 11.7 (5.9) 3.7
Balance at end of period $ (16.2) $ 3.7 $ (16.2) $ 3.7
Total equity attributable to equity holders of Company $ 1,225.7 $ 1,175.5 $ 1,225.7 $ 1,175.5
Non-controlling interests Balance at beginning of period $ 247.0 $ 260.1 $ 249.5 $ 259.3 Net income attributable to non-controlling interests 24.1 22.6 49.4 39.8 Defined benefit plan actuarial losses attributable to non-controlling
interests
(0.5)
(4.0)
(0.6)
(8.7)Distributions to non-controlling interests (24.9) (18.9) (52.6) (30.6)
Balance at end of period $ 245.7 $ 259.8 $ 245.7 $ 259.8
Total equity $ 1,471.4 $ 1,435.3 $ 1,471.4 $ 1,435.3
The accompanying notes are an integral part of these condensed consolidated financial statements.
20
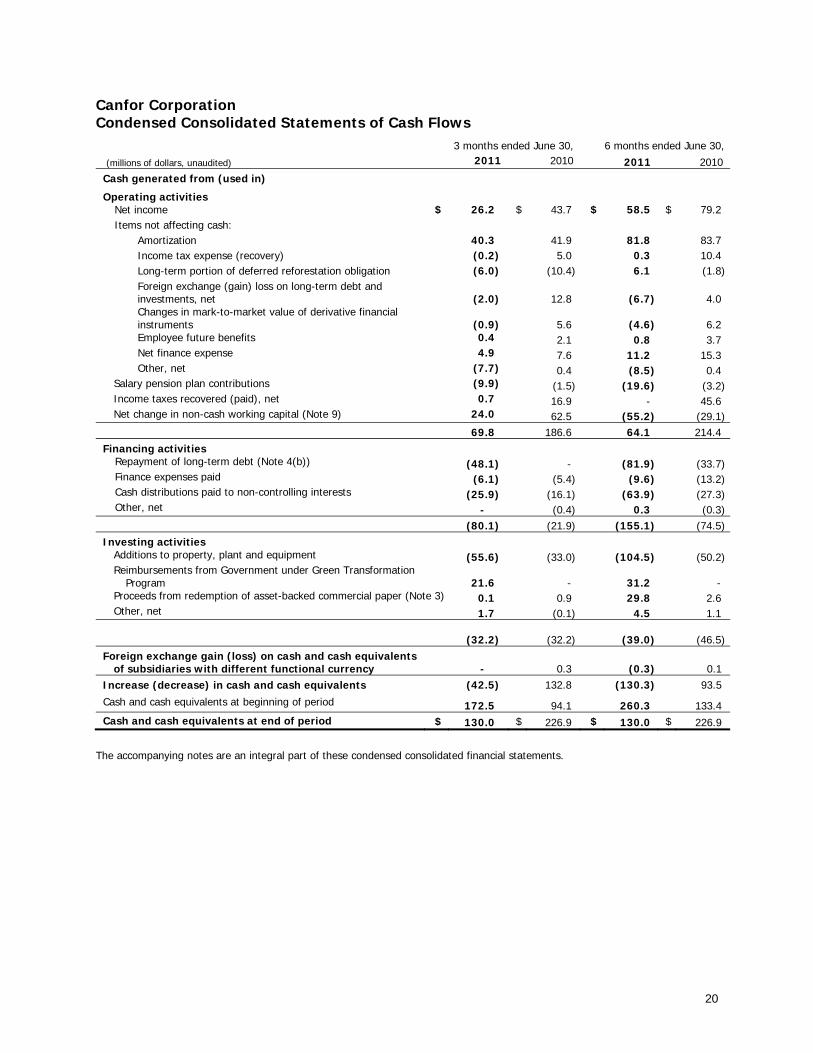
Canfor Corporation Condensed Consolidated Statements of Cash Flows
3 months ended June 30, 6 months ended June 30,
(millions of dollars, unaudited) 2011 2010 2011 2010 Cash generated from (used in)
Operating activities Net income $ 26.2 $ 43.7 $ 58.5 $ 79.2 Items not affecting cash: Amortization 40.3 41.9 81.8 83.7 Income tax expense (recovery) (0.2) 5.0 0.3 10.4 Long-term portion of deferred reforestation obligation (6.0) (10.4) 6.1 (1.8) Foreign exchange (gain) loss on long-term debt and
investments, net
(2.0)
12.8
(6.7)
4.0 Changes in mark-to-market value of derivative financial
instruments
(0.9)
5.6
(4.6)
6.2 Employee future benefits 0.4 2.1 0.8 3.7 Net finance expense 4.9 7.6 11.2 15.3 Other, net (7.7) 0.4 (8.5) 0.4 Salary pension plan contributions (9.9) (1.5) (19.6) (3.2) Income taxes recovered (paid), net 0.7 16.9 - 45.6 Net change in non-cash working capital (Note 9) 24.0 62.5 (55.2) (29.1) 69.8 186.6 64.1 214.4 Financing activities Repayment of long-term debt (Note 4(b)) (48.1) - (81.9) (33.7)
Finance expenses paid (6.1) (5.4) (9.6) (13.2) Cash distributions paid to non-controlling interests (25.9) (16.1) (63.9) (27.3) Other, net - (0.4) 0.3 (0.3) (80.1) (21.9) (155.1) (74.5)Investing activities Additions to property, plant and equipment (55.6) (33.0) (104.5) (50.2) Reimbursements from Government under Green Transformation
Program 21.6 - 31.2 - Proceeds from redemption of asset-backed commercial paper (Note 3) 0.1 0.9 29.8 2.6
Other, net 1.7 (0.1) 4.5 1.1 (32.2) (32.2) (39.0) (46.5)Foreign exchange gain (loss) on cash and cash equivalents
of subsidiaries with different functional currency
-
0.3
(0.3)
0.1 Increase (decrease) in cash and cash equivalents (42.5) 132.8 (130.3) 93.5
Cash and cash equivalents at beginning of period 172.5
94.1 260.3 133.4
Cash and cash equivalents at end of period $ 130.0 $ 226.9 $ 130.0 $ 226.9
The accompanying notes are an integral part of these condensed consolidated financial statements.

21
Canfor Corporation Notes to the Condensed Consolidated Financial Statements (unaudited, millions of dollars unless otherwise noted)
1. Basis of preparation and transition to International Financial Reporting Standards (“IFRS”)
These condensed consolidated interim financial statements have been prepared in accordance with International Accounting Standard 34 Interim financial reporting, and include the accounts of Canfor Corporation and its subsidiary entities, hereinafter referred to as “Canfor” or “the Company”.
Canfor’s transition date to IFRS was January 1, 2010. Various reconciliations between previous Canadian generally accepted accounting principles (“previous GAAP”) and IFRS related to the transition and subsequent reporting periods are set out in note 12, together with explanatory notes.
These interim financial statements do not include all of the disclosures required by IFRS for annual financial statements. Additional disclosures relevant to the understanding of these interim financial statements, including the accounting policies applied, can be found in Canfor’s first quarter 2011 interim financial statements and notes, as well as in the Company’s Annual Report for the year ended December 31, 2010, prepared in accordance with previous GAAP, available at www.canfor.com or www.sedar.com.
Canfor’s financial results are impacted by seasonal factors such as weather and building activity. Adverse weather conditions can cause logging curtailments, which can affect the supply of raw materials to sawmills and pulp mills. Market demand also varies seasonally to some degree. For example, building activity and repair and renovation work, which affects demand for solid wood products, is generally stronger in the spring and summer months. Shipment volumes are affected by these factors as well as by global supply and demand conditions.
The currency of presentation for these financial statements is the Canadian dollar.
Accounting standards issued and not applied
In the first half of 2011, the International Accounting Standards Board (“IASB”) issued a number of new and revised accounting standards which are effective for annual periods beginning on or after January 1, 2013, with early adoption permitted. These standards include the following:
IFRS 9, Financial Instruments; IFRS 10, Consolidated Financial Statements; IFRS 11, Joint Arrangements; IFRS 12, Disclosure of Interests in Other Entities; IAS 27, Separate Financial Statements; IFRS 13, Fair Value Measurement; Amended IAS 19, Employee Benefits; and Amended IAS 28, Investments in Associates and Joint Ventures.
In June 2011, the IASB also issued amended IAS 1, Presentation of Financial Statements, which is effective for annual periods beginning on or after July 1, 2012.
These new and revised accounting standards have not yet been adopted by Canfor, and the Company has not yet completed the process of assessing the impact that they will have on its financial statements, or whether to early adopt any of the new requirements.
22
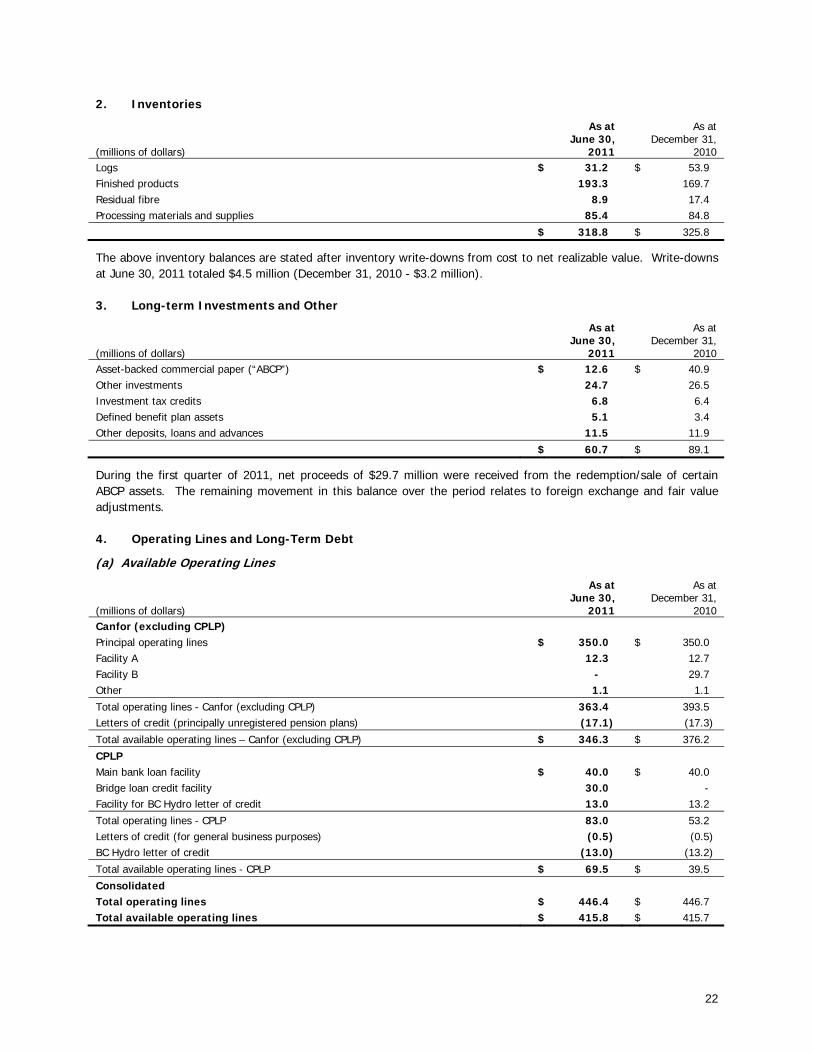
2. Inventories
(millions of dollars)
As at June 30,
2011
As at December 31,
2010 Logs $ 31.2 $ 53.9 Finished products 193.3 169.7 Residual fibre 8.9 17.4 Processing materials and supplies 85.4 84.8
$ 318.8 $ 325.8
The above inventory balances are stated after inventory write-downs from cost to net realizable value. Write-downs at June 30, 2011 totaled $4.5 million (December 31, 2010 - $3.2 million).
3. Long-term Investments and Other
(millions of dollars)
As at June 30,
2011
As at December 31,
2010 Asset-backed commercial paper (“ABCP”) $ 12.6 $ 40.9 Other investments 24.7 26.5 Investment tax credits 6.8 6.4 Defined benefit plan assets 5.1 3.4 Other deposits, loans and advances 11.5 11.9
$ 60.7 $ 89.1
During the first quarter of 2011, net proceeds of $29.7 million were received from the redemption/sale of certain ABCP assets. The remaining movement in this balance over the period relates to foreign exchange and fair value adjustments.
4. Operating Lines and Long-Term Debt
(a) Available Operating Lines
(millions of dollars)
As at June 30,
2011
As at December 31,
2010 Canfor (excluding CPLP) Principal operating lines $ 350.0 $ 350.0 Facility A 12.3 12.7 Facility B - 29.7 Other 1.1 1.1
Total operating lines - Canfor (excluding CPLP) 363.4 393.5 Letters of credit (principally unregistered pension plans) (17.1) (17.3)
Total available operating lines – Canfor (excluding CPLP) $ 346.3 $ 376.2
CPLP Main bank loan facility $ 40.0 $ 40.0 Bridge loan credit facility 30.0 - Facility for BC Hydro letter of credit 13.0 13.2
Total operating lines - CPLP 83.0 53.2 Letters of credit (for general business purposes) (0.5) (0.5) BC Hydro letter of credit (13.0) (13.2)
Total available operating lines - CPLP $ 69.5 $ 39.5
Consolidated Total operating lines $ 446.4 $ 446.7 Total available operating lines $ 415.8 $ 415.7

23
For Canfor, excluding CPLP, the principal operating lines mature on October 31, 2013 with interest payable at floating rates based on lenders’ Canadian prime rate, bankers acceptances, US dollar base rate or US dollar LIBOR rate, plus a margin that varies with the Company’s net debt to total capitalization ratio.
Facility A, which was for US$12.8 million at June 30, 2011, expires in January 2012, and is non-recourse to the Company under normal circumstances, except for an amount of US$6.7 million. The ABCP assets of the Company have been pledged as security to support this credit facility. Facility A has similar terms to the other operating lines, except that the interest rate is plus or minus a margin.
The terms of CPLP’s principal bank loan facility include interest payable at floating rates that vary depending on the ratio of net debt to operating earnings before interest, taxes, depreciation, amortization and certain other non-cash items, and is based on lenders’ Canadian prime rate, bankers acceptances, US dollar base rate or US dollar LIBOR rate, plus a margin. The maturity date of this facility is November 30, 2013.
CPLP also has a $30.0 million bridge loan credit facility to fund capital projects that are being funded by the Canadian Federal Government Green Transformation Program. The bridge facility terms are similar to CPLP’s main facility, with interest and other costs at prevailing market rates. CPLP also has a separate facility with a maturity date of November 30, 2013 to cover a $13.0 million standby letter of credit issued to BC Hydro.
As at June 30, 2011, the Company and CPLP were in compliance with all covenants relating to their operating lines of credit and no significant amounts were drawn on the Company or CPLP’s available operating lines.
All borrowings of CPLP (operating lines and long-term debt) are non-recourse to other entities within the Company.
(b) Long-Term Debt
On April 1, 2011, the Company repaid $48.1 million (US$50.0 million) of 6.18% interest rate privately placed senior notes. In the first quarter of 2011, the Company repaid $31.5 million (US$32.3 million) of 8.03% interest rate privately placed senior notes, as well as $2.3 million of other long-term debt obligations.
At June 30, 2011, the fair value of the Company’s long-term debt, which was measured at its amortized cost of $226.7 million, was $239.4 million. The fair value of long-term debt was determined based on prevailing market rates for long-term debt with similar characteristics and risk profile.
5. Employee Future Benefits
Canfor measures its accrued benefit obligations and the fair value of plan assets for accounting purposes as at December 31 of each year. At the end of each interim reporting period, the Company estimates movements in its accrued benefit liabilities based upon movements in discount rates and the rates of return on plan assets, as well as any significant changes to the plans. Adjustments are also made for payments made and current service and interest costs.
For the six months ended June 30, 2011, $5.8 million (before tax) was charged to other comprehensive income relating to a rate of return on plan assets of 1.80%, which is 1.95% lower than the expected rate of 3.75%, partially offset by the impact of the merging of two of the Company’s smaller defined benefit pension plans in the first quarter. For the three months ended June 30, 2011, the amount was $8.8 million (before tax). For the six months ended June 30, 2010 a pre-tax amount of $94.9 million was charged to other comprehensive income, reflecting a 0.75% reduction in the discount rate used to value the accrued benefit obligations during the period, and a loss on plan assets for the period. For the three months ended June 30, 2010 the pre-tax charge was $47.6 million.

24
The assumptions used to estimate the changes in net accrued benefit liabilities were as follows:
(weighted average assumptions) Pension Benefit Plans Discount rate June 30, 2011 5.50% March 31, 2011 5.50% December 31, 2010 5.50%
June 30, 2010 5.50% March 31, 2010 5.75% January 1, 2010 6.25% Rate of return on plan assets 6 months ended June 30, 2011 1.80% 3 months ended March 31, 2011 1.65%
6 months ended June 30, 2010 (2.20)% 3 months ended March 31, 2010 1.50%
Other Benefit Plans Discount rate June 30, 2011 5.75% March 31, 2011 5.75% December 31, 2010 5.75%
June 30, 2010 5.75% March 31, 2010 6.00% January 1, 2010 6.75%
6. Derivative Financial Instruments The Company uses a variety of derivative financial instruments to reduce its exposure to risks associated with fluctuations in foreign exchange rates, lumber prices and energy costs. At June 30, 2011, the fair value of derivative financial instruments was a net asset of $0.4 million (December 31, 2010 – net liability of $4.1 million). The fair value of these financial instruments was determined based on prevailing market rates for instruments with similar characteristics.
The following table summarizes the gain (loss) on derivative financial instruments for the three and six month periods ended June 30, 2011 and 2010: 3 months ended June 30, 6 months ended June 30, (millions of dollars) 2011 2010 2011 2010
Foreign exchange collars and forward contracts $ 1.0 $ (9.5) $ 2.9 $ (3.7) Natural gas swaps (0.1) 0.2 (0.2) (3.5) Diesel options and swaps (0.2) (1.0) 0.8 (0.6) Lumber futures 0.6 7.0 2.5 3.3
$ 1.3 $ (3.3) $ 6.0 $ (4.5)
The following table summarizes the fair value of the derivative financial instruments included in the balance sheet at June 30, 2011 and December 31, 2010:
(millions of dollars)
As at June 30,
2011
As at December 31,
2010 Foreign exchange collars and forward contracts $ 1.3 $ 1.6 Natural gas swaps (1.6) (4.7)Diesel options and swaps 0.5 1.0 Lumber futures 0.2 (2.0)
Total current asset (liability) $ 0.4 $ (4.1)
25
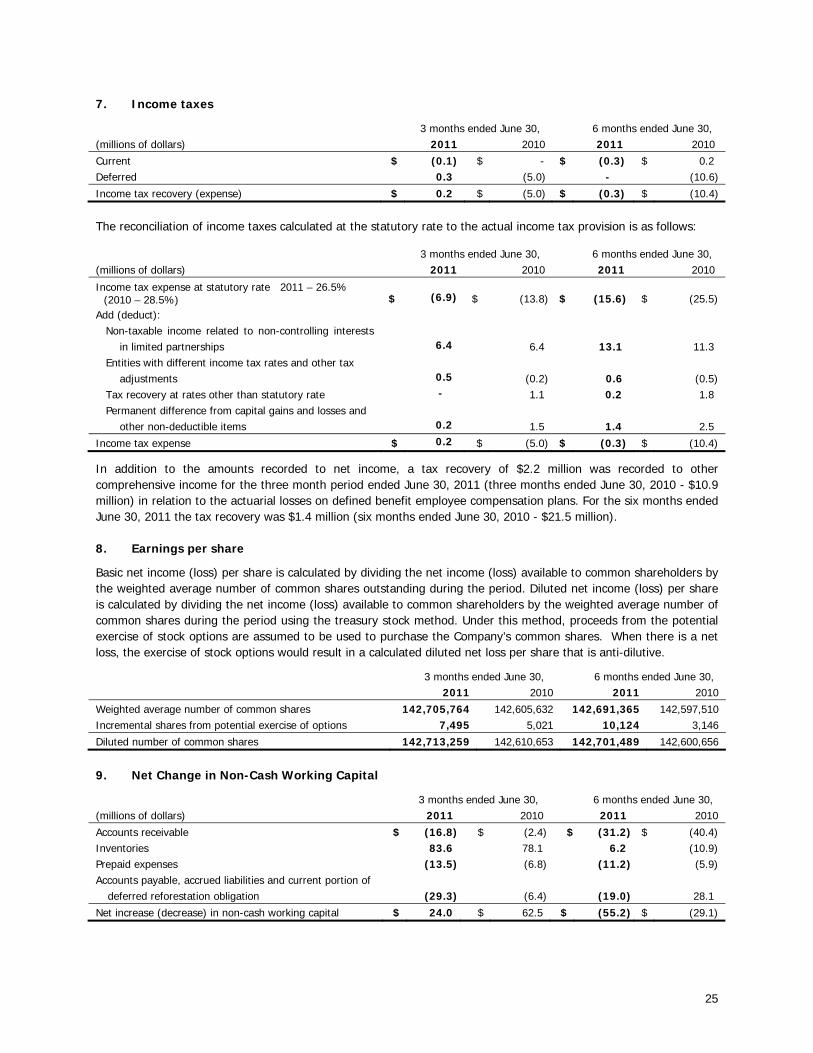
7. Income taxes
3 months ended June 30, 6 months ended June 30, (millions of dollars) 2011 2010 2011 2010
Current $ (0.1) $ - $ (0.3) $ 0.2 Deferred 0.3 (5.0) - (10.6)
Income tax recovery (expense) $ 0.2 $ (5.0) $ (0.3) $ (10.4)
The reconciliation of income taxes calculated at the statutory rate to the actual income tax provision is as follows:
3 months ended June 30, 6 months ended June 30, (millions of dollars) 2011 2010 2011 2010
Income tax expense at statutory rate 2011 – 26.5% (2010 – 28.5%) $ (6.9) $ (13.8) $ (15.6) $ (25.5)
Add (deduct): Non-taxable income related to non-controlling interests
in limited partnerships
6.4
6.4
13.1 11.3 Entities with different income tax rates and other tax
adjustments
0.5
(0.2) 0.6 (0.5) Tax recovery at rates other than statutory rate - 1.1 0.2 1.8 Permanent difference from capital gains and losses and
other non-deductible items 0.2 1.5 1.4 2.5
Income tax expense $ 0.2 $ (5.0) $ (0.3) $ (10.4)
In addition to the amounts recorded to net income, a tax recovery of $2.2 million was recorded to other comprehensive income for the three month period ended June 30, 2011 (three months ended June 30, 2010 - $10.9 million) in relation to the actuarial losses on defined benefit employee compensation plans. For the six months ended June 30, 2011 the tax recovery was $1.4 million (six months ended June 30, 2010 - $21.5 million).
8. Earnings per share
Basic net income (loss) per share is calculated by dividing the net income (loss) available to common shareholders by the weighted average number of common shares outstanding during the period. Diluted net income (loss) per share is calculated by dividing the net income (loss) available to common shareholders by the weighted average number of common shares during the period using the treasury stock method. Under this method, proceeds from the potential exercise of stock options are assumed to be used to purchase the Company’s common shares. When there is a net loss, the exercise of stock options would result in a calculated diluted net loss per share that is anti-dilutive.
3 months ended June 30, 6 months ended June 30, 2011 2010 2011 2010
Weighted average number of common shares 142,705,764 142,605,632 142,691,365 142,597,510 Incremental shares from potential exercise of options 7,495 5,021 10,124 3,146
Diluted number of common shares 142,713,259 142,610,653 142,701,489 142,600,656
9. Net Change in Non-Cash Working Capital
3 months ended June 30, 6 months ended June 30, (millions of dollars) 2011 2010 2011 2010
Accounts receivable $ (16.8) $ (2.4) $ (31.2) $ (40.4) Inventories 83.6 78.1 6.2 (10.9) Prepaid expenses (13.5) (6.8) (11.2) (5.9) Accounts payable, accrued liabilities and current portion of
deferred reforestation obligation (29.3) (6.4) (19.0) 28.1
Net increase (decrease) in non-cash working capital $ 24.0 $ 62.5 $ (55.2) $ (29.1)

26
10. Segment information
Canfor has two reportable segments, as described below, which offer different products and are managed separately because they require different production processes and marketing strategies. The following summary describes the operations of each of the Company’s reportable segments:
Lumber - Includes logging operations, and manufacture and sale of various grades, widths and lengths of lumber products.
Pulp and paper – Includes purchase of residual fibre, and production and sale of pulp and paper products, including northern bleached softwood kraft (“NBSK”) and bleached chemi-thermo mechanical pulp (“BCTMP”). This segment includes 100% of Canfor Pulp Limited Partnership and the Taylor Pulp mill.
Sales between segments are accounted for at prices that approximate fair value. These include sales of residual fibre from the lumber segment to the pulp and paper segment for use in the pulp production process.
The Company’s panels business does not meet the criteria to be reported fully as a separate segment. Sales for panels operations for the three months ended June 30, 2011 were $10.9 million (three months ended June 30, 2010 - $17.7 million) and $23.3 million for the six months ended June 30, 3011 (six months ended June 30, 2010 - $33.9 million).
(millions of dollars)
Lumber Pulp & Paper
Unallocated & Other
Elimination Adjustment Consolidated
3 months ended June 30, 2011
Sales to external customers $ 331.2 277.0 10.9 - $ 619.1 Sales to other segments $ 32.4 - - (32.4) $ - Operating income (loss) $ (11.1) 48.1 (10.5) - $ 26.5 Amortization $ 20.7 15.3 4.3 - $ 40.3 Capital expenditures* $ 24.4 30.8 0.4 - $ 55.6 3 months ended June 30, 2010
Sales to external customers $ 336.9 280.1 17.7 - $ 634.7 Sales to other segments $ 34.3 - - (34.3) $ - Operating income (loss) $ 21.0 55.0 (6.9) - $ 69.1 Amortization $ 20.1 17.5 4.3 - $ 41.9 Capital expenditures $ 18.7 14.3 - - $ 33.0
6 months ended June 30, 2011
Sales to external customers $ 659.8 560.0 23.3 - $ 1,243.1 Sales to other segments $ 61.9 - - (61.9) $ - Operating income (loss) $ (13.4) 95.3 (24.0) - $ 57.9 Amortization $ 41.0 32.1 8.7 - $ 81.8 Capital expenditures* $ 50.0 54.1 0.4 - $ 104.5 Identifiable assets $ 1,347.0 842.7 256.6 - $ 2,446.3 6 months ended June 30, 2010
Sales to external customers $ 628.9 549.8 33.9 - $ 1,212.6 Sales to other segments $ 69.8 - - (69.8) $ - Operating income (loss) $ 36.8 89.4 (13.2) - $ 113.0 Amortization $ 40.6 34.1 9.0 - $ 83.7 Capital expenditures $ 29.5 20.7 - - $ 50.2 Identifiable assets $ 1,329.4 900.4 348.4 - $ 2,578.2
* Includes capital expenditures made by CPLP that are financed by the government-funded Green Transformation Program.

27
11. Contingency
On January 18, 2011, the U.S. triggered the arbitration provision of the 2006 Softwood Lumber Agreement (“SLA”) by delivering a Request for Arbitration. The U.S. claims that BC has not properly applied the timber pricing system grandparented in the SLA. The U.S. also claims that subsequent to 2006, BC made additional changes to the timber pricing system which had the effect of reducing timber prices. The claim focuses on substantial increases in Grade 4 (non sawlog or low grade) volumes commencing in 2007. It is alleged that timber was scaled and graded as Grade 4 that did not meet the criteria for that grade, and was accordingly priced too low.
As the arbitration is a state-to-state international dispute under the SLA, Canada is preparing a defence to the claim with the assistance of the BC provincial government and the BC lumber industry. The U.S. is anticipated to file a detailed statement of claim with the arbitration panel in August 2011. It is not possible at this time to predict the outcome or the value of the claim, and accordingly no provision has been recorded by the Company.
12. Transition to International Financial Reporting Standards (“IFRS”)
For 2011, the Company is preparing its financial statements in accordance with IFRS for the first time. In preparing comparative information for 2010, the Company has adjusted amounts previously reported in financial statements prepared in accordance with previous Canadian GAAP (“previous GAAP”).
The Company’s transition date to IFRS was January 1, 2010 and a provisional opening IFRS balance sheet was prepared as at that date. A full reconciliation of the opening balance sheet to amounts reported under previous GAAP can be found in the Company’s condensed consolidated interim financial statements for the first quarter of 2011, along with the balance sheet as at December 31, 2010.
Certain of the differences are also summarized in the following sections, which include reconciliations of total comprehensive income from previous GAAP to IFRS for the three month and six month periods ending June 30, 2010, and a reconciliation of equity as at June 30, 2010.
The accounting changes resulting from the transition to IFRS do not impact the Company’s compliance with any of its financial covenants with respect to its debt obligations.
(i) Reconciliation of comprehensive income for three and six month periods ended June 30, 2010
Note 3 months ended 6 months ended
(millions of Canadian dollars, unaudited) (section iii) June 30, 2010 June 30, 2010 Net income Previous Canadian GAAP $ 40.4 $ 72.9 Lower amortization of property, plant and equipment and timber licenses
in period, net of tax a 1.3 2.4 Lower pension expense for period, net of tax b 2.0 3.9
Net income under IFRS $ 43.7 $ 79.2
Other comprehensive income (loss) Previous Canadian GAAP $ 11.7 $ 3.7 Actuarial gains (losses) on defined benefit plans during the period,
net of tax b (36.7) (73.4)
Other comprehensive income (loss) under IFRS $ (25.0) $ (69.7)
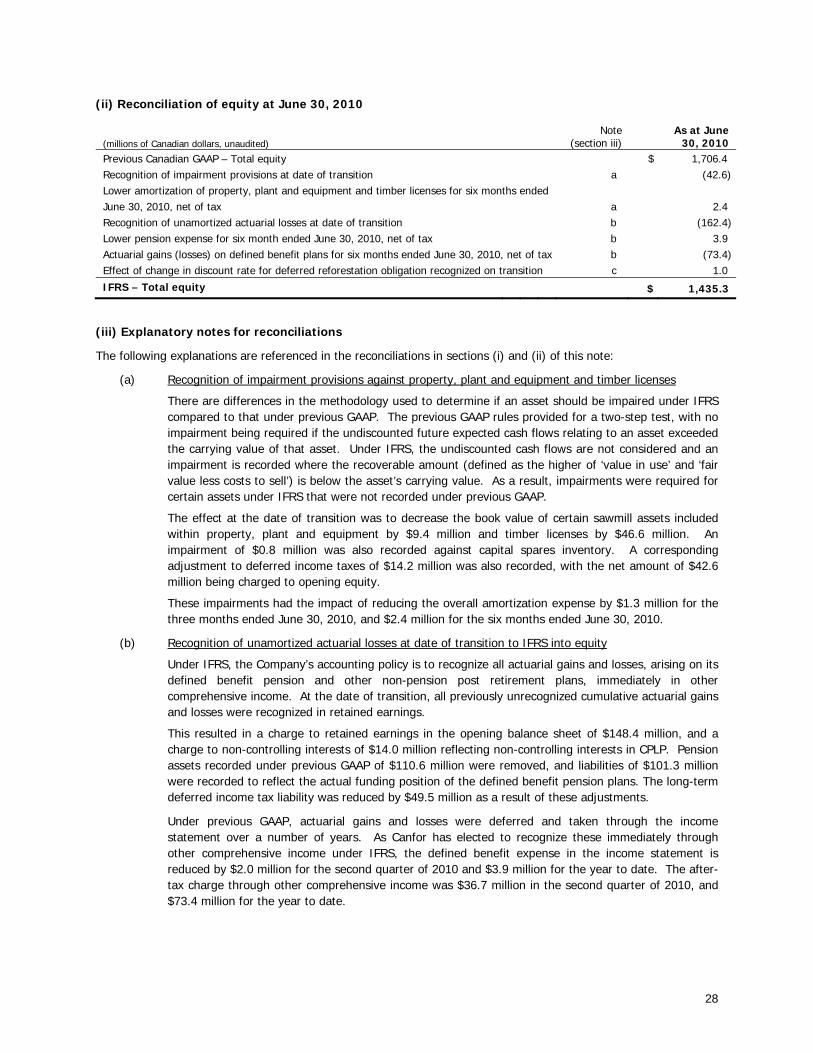
28
(ii) Reconciliation of equity at June 30, 2010
(millions of Canadian dollars, unaudited) Note
(section iii) As at June
30, 2010 Previous Canadian GAAP – Total equity $ 1,706.4 Recognition of impairment provisions at date of transition a (42.6)Lower amortization of property, plant and equipment and timber licenses for six months ended June 30, 2010, net of tax a 2.4 Recognition of unamortized actuarial losses at date of transition b (162.4)Lower pension expense for six month ended June 30, 2010, net of tax b 3.9 Actuarial gains (losses) on defined benefit plans for six months ended June 30, 2010, net of tax b (73.4)Effect of change in discount rate for deferred reforestation obligation recognized on transition c 1.0
IFRS – Total equity $ 1,435.3
(iii) Explanatory notes for reconciliations
The following explanations are referenced in the reconciliations in sections (i) and (ii) of this note:
(a) Recognition of impairment provisions against property, plant and equipment and timber licenses
There are differences in the methodology used to determine if an asset should be impaired under IFRS compared to that under previous GAAP. The previous GAAP rules provided for a two-step test, with no impairment being required if the undiscounted future expected cash flows relating to an asset exceeded the carrying value of that asset. Under IFRS, the undiscounted cash flows are not considered and an impairment is recorded where the recoverable amount (defined as the higher of ‘value in use’ and ‘fair value less costs to sell’) is below the asset’s carrying value. As a result, impairments were required for certain assets under IFRS that were not recorded under previous GAAP.
The effect at the date of transition was to decrease the book value of certain sawmill assets included within property, plant and equipment by $9.4 million and timber licenses by $46.6 million. An impairment of $0.8 million was also recorded against capital spares inventory. A corresponding adjustment to deferred income taxes of $14.2 million was also recorded, with the net amount of $42.6 million being charged to opening equity.
These impairments had the impact of reducing the overall amortization expense by $1.3 million for the three months ended June 30, 2010, and $2.4 million for the six months ended June 30, 2010.
(b) Recognition of unamortized actuarial losses at date of transition to IFRS into equity
Under IFRS, the Company’s accounting policy is to recognize all actuarial gains and losses, arising on its defined benefit pension and other non-pension post retirement plans, immediately in other comprehensive income. At the date of transition, all previously unrecognized cumulative actuarial gains and losses were recognized in retained earnings.
This resulted in a charge to retained earnings in the opening balance sheet of $148.4 million, and a charge to non-controlling interests of $14.0 million reflecting non-controlling interests in CPLP. Pension assets recorded under previous GAAP of $110.6 million were removed, and liabilities of $101.3 million were recorded to reflect the actual funding position of the defined benefit pension plans. The long-term deferred income tax liability was reduced by $49.5 million as a result of these adjustments.
Under previous GAAP, actuarial gains and losses were deferred and taken through the income statement over a number of years. As Canfor has elected to recognize these immediately through other comprehensive income under IFRS, the defined benefit expense in the income statement is reduced by $2.0 million for the second quarter of 2010 and $3.9 million for the year to date. The after-tax charge through other comprehensive income was $36.7 million in the second quarter of 2010, and $73.4 million for the year to date.

29
(c) Change in discount rate for deferred reforestation obligation
The amount of this provision of $60.3 million at January 1, 2010 was reduced in the opening balance sheet by $1.3 million (pre-tax) due to a change in discount rate required to value the obligation under IFRS as compared to previous GAAP.
(iv) Explanation of material adjustments to the statement of cash flows
The impact of the transition to IFRS on the statement of cash flows is to reclassify certain items between cash flow categories. One of the main reclassifications relates to interest payments and receipts which were classified as operating activities under previous GAAP, but are shown as financing and investing activities, respectively, under IFRS.
In addition, the reclassification of certain of CPLP’s major maintenance costs to property, plant and equipment under IFRS has an impact on the statement of cash flows. Under previous GAAP these costs were shown under operating activities as deferred maintenance spending, whereas under IFRS they are included in additions to property, plant and equipment under investing activities.