2011 global aerospace & defense industry performance wrap...
TRANSCRIPT
2011 Global Aerospace & Defense Industry performance wrap-upWidening gap between commercial versus defense; United States versus Europe
July 2012

2
Summary discussion 3
Summary of key financial measures 4
Study scope 5
2011 Global A&D Industry performance in detail 7
U.S. versus European companies 20
Commercial versus defense segment 22
Subsector performance 23
Study methodology 29
Contact 35
Contents
2011 Global Aerospace & Defense Industry performance wrap-up 3
Summary discussionSigns of growth due to the commercial aerospace rebound — Global aerospace and defense (A&D) Industry revenues grew overall by 2.3 percent in 20111, driven largely by increased production levels of large commercial aircraft. The commercial aircraft segment in 2011 set an annual production record of 1,011 deliveries by Boeing and Airbus2. Indeed, commercial aircraft segment revenues increased by 10.1 percent in 20113. Commercial aircraft production levels are anticipated to continue to set new records in 2012, building on the strong growth between 2005 and 2011 when over 12,500 large commercial aircrafts were ordered4. Demand for production is being driven by lightweight aircraft requiring less maintenance and more fuel-efficient jet engines that reduce the fuel costs for airlines. Also, sales of new aircrafts are being supported by increasing travel demand, especially in geographies such as China, India, Brazil, and the Middle East, where more people can afford to travel for business and leisure.
Defense is shrinking overall, with selected regional increases — Global defense revenues decreased by 3.3 percent in 20115, primarily due to affordability, competing domestic priorities, weak economies in the western world, and the drawdown of forces in Iraq and Afghanistan. As the largest defense marketplace globally, accounting for a major portion of defense spending, the United States (U.S.) is undergoing a cyclical downturn, starting with an announced US$487 billion defense budget cut over the next 10 years, followed by potentially another US$500 billion sequestration driven defense budget cut6.
1 Deloitte Touche Tohmatsu Limited (DTTL) Global Manufacturing Industry group analysis, February 2012. See methodology section for further information and definitions of financial metrics.2 Boeing, Order and deliveries, http://active.boeing.com/commercial/orders/index.cfm?content=timeperiodselection.cfm&pageid=m15523 (accessed 14 February 2012); Airbus, “Summary results 1989-2011,” http://www.airbus.com/presscentre/corporate-information/key-documents/(accessed 14 February 2012).3 See the methodology section for further information and definitions of financial metrics related to the commercial versus defense calculations. Refer to Figure 3 in report.4 Boeing, Annual orders summary, http://active.boeing.com/commercial/orders/index.cfm?content=displaystandardreport.cfm&RequestTimeout=500&optReportType=AnnOrd&pageid=m15521 (accessed 14 February 2012); Airbus, “Airbus summary results 1989-2011,” http://www.airbus.com/presscentre/corporate-information/key-documents/(accessed 14 February 2012).5 DTTL Global Manufacturing Industry group analysis, February 2012. See methodology section for further information and definitions of financial metrics6 NBC News, ”Panetta: Military cuts to hit all 50 states,” 26 January 2012, http://usnews.msnbc.msn.com/_news/2012/01/26/10244240-panetta-military-cuts-to-hit-all-50-states?lite.
Alternatively, defense spending is increasing in geographies such as India, China, Japan, the United Arab Emirates (UAE), Saudi Arabia, and Brazil. For example, India has a major defense recapitalization program7 as their economy expands, while other countries are increasing their defense spending as their wealth increases and in light of growing national security concerns.
Industry financial performance generally fell in 2011 — Even with the increasing fortunes in the commercial aircraft segment, many financial performance metrics for the global Industry as a whole generally decreased in 2011, likely because of the predominant weighting of the defense sub-segment. Reported operating earnings, a key financial metric, decreased 3.1 percent. In addition, reported operating margins decreased 5.3 percent, free cash flow (FCF) decreased 13.3 percent, and reported operating earnings per employee decreased 5.2 percent8. However, on the positive side, the book to bill (BTB) ratio, an indicator of future revenue growth, increased 17.4 percent9, likely as a result of the sales bookings at Airbus and Boeing and their suppliers for new fuel-efficient commercial aircraft, as mentioned above10.
Increased one-time charges, but not a pattern — Non-recurring exceptions, or one-time charges, increased in 2011 to US$4.8 billion, compared to one-time charges in 2010 of US$2.3 billion11. In prior years, one-time charges were largely attributable to programs experiencing difficulties with cost and schedule performance, but this does not seem to be the case in 2010 nor 2011. Finmeccanica’s US$2.1 billion charges (part of its total one-time charges), accounted for a majority of the US$2.5 billion increase in industry’s one time charges in 2011. Most of the remaining charges were attributable to corporate repositioning and restructuring charges. Absent these charges, core12 operating earnings for the Industry 7 Defense media network, “Indian navy force structure development is driven by blue water maritime strategy,” 1 June 2012, http://www.defensemedianetwork.com/stories/indian-navy-force-structure-development-is-driven-by-blue-water-maritime-strategy/2/.8 DTTL Global Manufacturing Industry group analysis, February 2012. See methodology section for further information and definitions of financial metrics.9 Ibid.10 Ibid.11 Ibid.12 Comparison of 2011 to 2010 core earnings is frequently referred to in this report to reflect realistic operating performance, which adjusts for the effect of non-recurring A&D related company charges year to year. One-time A&D related company charges refers to program write-offs (such as cancellations, terminations), restructuring charges, asset impairment charges, acquisition-
4
actually grew 1.2 percent, while operating margins fell slightly to 8.9 percent from 9.0 percent in 201013.
Europe continues to lag the U.S. — Financial performance differences between A&D companies based in the U.S. and Europe continue to diverge, as described in the 2010 Global Aerospace & Defense Industry Performance Wrap-up report14. Global regional divergence in the 2011 performance of A&D companies is indicative of different incentives, management philosophies, and work force practices in the U.S. and Europe. The European A&D Industry grew only by 0.8 percent and U.S. Industry grew revenue 3.3 percent. Reported operating earnings in Europe fell 21.6 percent, while U.S. operating earnings grew 2.9 percent, with reported operating margin declining 22.2 percent and 0.4 percent, respectively. Free cash flow (FCF) declined 0.7 percent in the U.S., while it fell 43.4 percent in Europe. Furthermore, European A&D companies continue to lag in employee productivity, with Europe reporting operating earnings per employee down 25.0 percent, while their U.S. peers improved 1.9 percent in that important metric. Reported operating margin in the U.S. was 10.5 percent and 4.7 percent in Europe in 2011. Reported return on invested capital was 20.7 percent in the U.S. while in Europe it was 8.7 percent15.
Suppliers performed better than original equipment manufacturers (OEMs) — Tier one, two, three suppliers, many of which have significant participation in the commercial aerospace segment had reported revenue increases of 5.1, 11.1 and 29.1 percent respectively16. This compares with revenue growth of 0.1 percent for OEM’s, many of which are defense segment companies. A more stark comparison is operating earnings growth between these suppliers and their customer, the OEM companies. Tier one, two, and three suppliers had reported operating earnings growth of 15.9, 12.3, and 34.8 percent respectively. This compares to operating earnings growth of 2.5 percent for OEM’s. Finally, suppliers had reported
related expenses, loss on disposal of businesses, and litigation charges13 DTTL Global Manufacturing Industry group analysis, February 2012. See methodology section for further information and definitions of financial metrics.14 Deloitte Development LLC, “2010 Global Aerospace & Defense Industry Performance Wrap-up,” 7 July 2011.15 DTTL Global Manufacturing Industry group analysis, February 2012. See methodology section for further information and definitions of financial metrics16 Ibid.
operating margins of between 12.1 and 14.2 percent, while OEM’s had reported operating margins of 7.6 percent17.
Summary of key financial measures • The global A&D Industry as a whole grew to US$681
billion in 2011, posting a revenue gain of 2.3 percent, compared to revenue growth of 2.5 percent in 2010 and 4.5 percent in 200918.
– In 2011, U.S. A&D companies’ revenue grew by 3.3 percent, as compared to 0.8 percent for European companies, reversing a two-year trend of lower U.S. companies’ revenue growth. U.S. Industry revenue growth was largely driven by higher commercial aircraft deliveries and a stronger aftermarket business19
– OEM subsector revenue grew by 0.1 percent and reported operating earnings increased by 2.5 percent in 2011, as commercial aircraft production more than offset weakness in the defense segment. In contrast, the defense electronics subsector—which posted declines of 2.4 percent and 67.5 percent in revenue and reported operating earnings in 2011, respectively—was impacted from a slowdown in U.S. defense spending.
• Reported Industry operating earnings decreased 3.1 percent to US$56.1 billion, largely due to one-time A&D related company charges of US$4.8 billion in 2011 compared to US$2.3 billion in 2010.
– U.S. companies’ reported operating earnings increased by 2.9 percent compared to a decline of 21.6 percent for European companies in 2011, as the impact of non-recurring A&D related charges was greater in European than in the United States. Excluding charges, U.S. companies’ core operating earnings increased 4.6 percent, and the European core operating earnings fell by 7.1 percent.
– Five companies accounted for the majority of the global A&D Industry’s US$4.8 billion non-recurring A&D related charges in 2011: Finmeccanica, URS Federal Services, Hawker Beechcraft, BAE Systems, and Huntington Ingalls. Excluding these one-time charges, Industry core operating earnings increased by 1.2 percent to US$60.9 billion in 2011
17 Ibid.18 Ibid.19 Ibid.
2011 Global Aerospace & Defense Industry performance wrap-up 5
• Reported Industry operating margin decreased by 46 basis points (bps) to 8.2 percent in 2011, largely due to an increase in non-recurring A&D related company charges. Core operating margin declined marginally by 9 bps to 8.9 percent in 201120.
– U.S. A&D companies reported a 10.5 percent operating margin in 2011, compared to 4.7 percent for European A&D companies. This difference suggests the likely impact on European companies’ performance of costs associated with operating in countries with higher government intervention. In terms of 2011 core operating margin, U.S. companies outperformed the European companies, 11.0 percent versus 6.0 percent, respectively21.
• The book-to-bill (BTB) ratio22 grew to 1.32x in 2011 from 1.12x in 2010, or by 17.4 percent. A large portion of this increase benefitted from US$154.4 billion in incremental backlog at EADS and Boeing23. Excluding EADS’ 2.88x and Boeing’s 1.50x BTB performance, the Industry BTB equaled 1.07x, a 10.0 percent increase versus 201024.
– Led by Boeing and EADS, the OEM group produced the highest BTB ratio of 1.46x, in contrast to the defense electronics subsector BTB of 0.97x, the weakest performing subsector.
– Defense companies remain challenged to maintain revenue, let alone grow, based on the BTB ratios calculated for the Industry. Underscoring this point, in 2011, the top five defense companies’ revenue-weighted BTB ratio was 0.93x, a sharp contrast to the 3.16x average revenue-weighted BTB ratio of Boeing’s and EADS’ commercial aircraft business, led by EADS’ Airbus commercial BTB ratio of 4.10x.
• The total level of global A&D Industry employment increased by 2.3 percent to over 2.1 million employees in 201125, as compared to the 3.0 percent growth in employment for the larger index group.
20 Ibid.21 Ibid.22 Book-to-bill ratio: See methodology section for further information and definitions of financial metrics.23 DTTL Global Manufacturing Industry group analysis, February 2012. See methodology section for further information and definitions of financial metrics.24 Ibid.25 Ibid.
A more detailed analysis of the financial metrics is described in the upcoming sections in this report.
Study scopeThe Deloitte Touche Tohmatsu Limited (DTTL) Global Manufacturing Industry group’s 2011 Global Aerospace and Defense Industry performance wrap-up includes analysis of 110 A&D companies or segments of industrial conglomerates with A&D businesses that recorded revenue greater than US$500 million in 2011. The study scope, however, does not include A&D organizations such as government controlled entities, private companies that do not release public filings, and companies that identify the A&D Industry as an end market. Due to the need for consistent and standardized comparisons, the study included companies and divisions with publicly reported financial filings and for-profit entities.
The DTTL Global Manufacturing Industry group conducted the study of the 2011 financial performance of the Industry by assessing key nominal and growth metrics, including revenue, operating earnings, operating margin, return on invested capital (ROIC), free cash flow (FCF), free cash margin (FCM), book-to-bill (BTB) ratio, employee productivity, and equity market performance. All financial metrics in the study are based on constant currency conversion method (unless otherwise stated as “differential method”) to eliminate the impact of foreign exchange fluctuations on companies’ or Industry’s performance. For more information on the conversion method, refer to the Methodology section of this report.
The global A&D Industry is highly concentrated with revenues for the top 10 companies comprising 53.4 percent of overall Industry revenue in 201126. Thus, the combined performance of these top 10 companies significantly impacted the performance of the Industry as a whole.
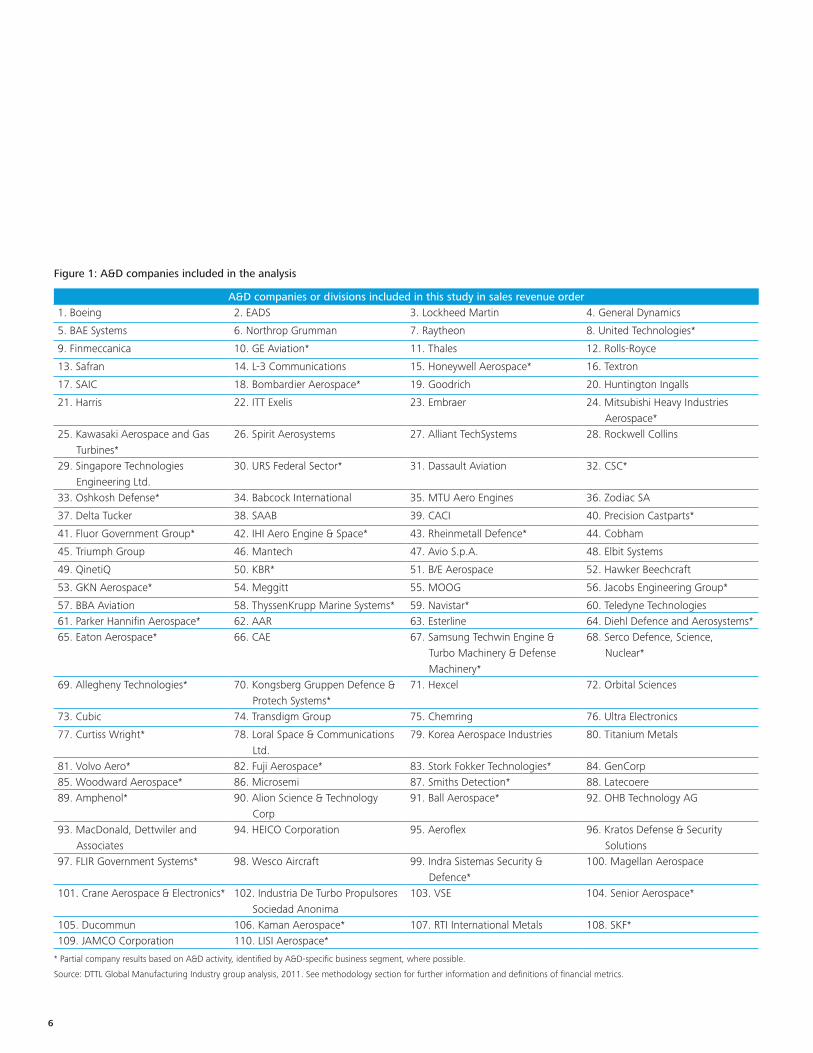
Figure 1 includes the 110 companies and divisions that are included in this study. These companies combined accounted for approximately 92 percent of the overall global A&D Industry revenue in 2011. The remainder, an estimated 160 organizations, comprising close to US$60 billion in revenues, were excluded from the study, as described above.
26 DTTL Global Manufacturing Industry group observation based on the analysis of the companies in Figure 1.
6
Figure 1: A&D companies included in the analysis
A&D companies or divisions included in this study in sales revenue order1. Boeing 2. EADS 3. Lockheed Martin 4. General Dynamics
5. BAE Systems 6. Northrop Grumman 7. Raytheon 8. United Technologies*
9. Finmeccanica 10. GE Aviation* 11. Thales 12. Rolls-Royce
13. Safran 14. L-3 Communications 15. Honeywell Aerospace* 16. Textron
17. SAIC 18. Bombardier Aerospace* 19. Goodrich 20. Huntington Ingalls
21. Harris 22. ITT Exelis 23. Embraer 24. Mitsubishi Heavy Industries Aerospace*
25. Kawasaki Aerospace and Gas Turbines*
26. Spirit Aerosystems 27. Alliant TechSystems 28. Rockwell Collins
29. Singapore Technologies Engineering Ltd.
30. URS Federal Sector* 31. Dassault Aviation 32. CSC*
33. Oshkosh Defense* 34. Babcock International 35. MTU Aero Engines 36. Zodiac SA
37. Delta Tucker 38. SAAB 39. CACI 40. Precision Castparts*
41. Fluor Government Group* 42. IHI Aero Engine & Space* 43. Rheinmetall Defence* 44. Cobham
45. Triumph Group 46. Mantech 47. Avio S.p.A. 48. Elbit Systems
49. QinetiQ 50. KBR* 51. B/E Aerospace 52. Hawker Beechcraft
53. GKN Aerospace* 54. Meggitt 55. MOOG 56. Jacobs Engineering Group*
57. BBA Aviation 58. ThyssenKrupp Marine Systems* 59. Navistar* 60. Teledyne Technologies61. Parker Hannifin Aerospace* 62. AAR 63. Esterline 64. Diehl Defence and Aerosystems*65. Eaton Aerospace* 66. CAE 67. Samsung Techwin Engine &
Turbo Machinery & Defense Machinery*
68. Serco Defence, Science, Nuclear*
69. Allegheny Technologies* 70. Kongsberg Gruppen Defence & Protech Systems*
71. Hexcel 72. Orbital Sciences
73. Cubic 74. Transdigm Group 75. Chemring 76. Ultra Electronics
77. Curtiss Wright* 78. Loral Space & Communications Ltd.
79. Korea Aerospace Industries 80. Titanium Metals
81. Volvo Aero* 82. Fuji Aerospace* 83. Stork Fokker Technologies* 84. GenCorp85. Woodward Aerospace* 86. Microsemi 87. Smiths Detection* 88. Latecoere89. Amphenol* 90. Alion Science & Technology
Corp91. Ball Aerospace* 92. OHB Technology AG
93. MacDonald, Dettwiler and Associates
94. HEICO Corporation 95. Aeroflex 96. Kratos Defense & Security Solutions
97. FLIR Government Systems* 98. Wesco Aircraft 99. Indra Sistemas Security & Defence*
100. Magellan Aerospace
101. Crane Aerospace & Electronics* 102. Industria De Turbo Propulsores Sociedad Anonima
103. VSE 104. Senior Aerospace*
105. Ducommun 106. Kaman Aerospace* 107. RTI International Metals 108. SKF*109. JAMCO Corporation 110. LISI Aerospace*
* Partial company results based on A&D activity, identified by A&D-specific business segment, where possible.
Source: DTTL Global Manufacturing Industry group analysis, 2011. See methodology section for further information and definitions of financial metrics.
2011 Global Aerospace & Defense Industry performance wrap-up 7
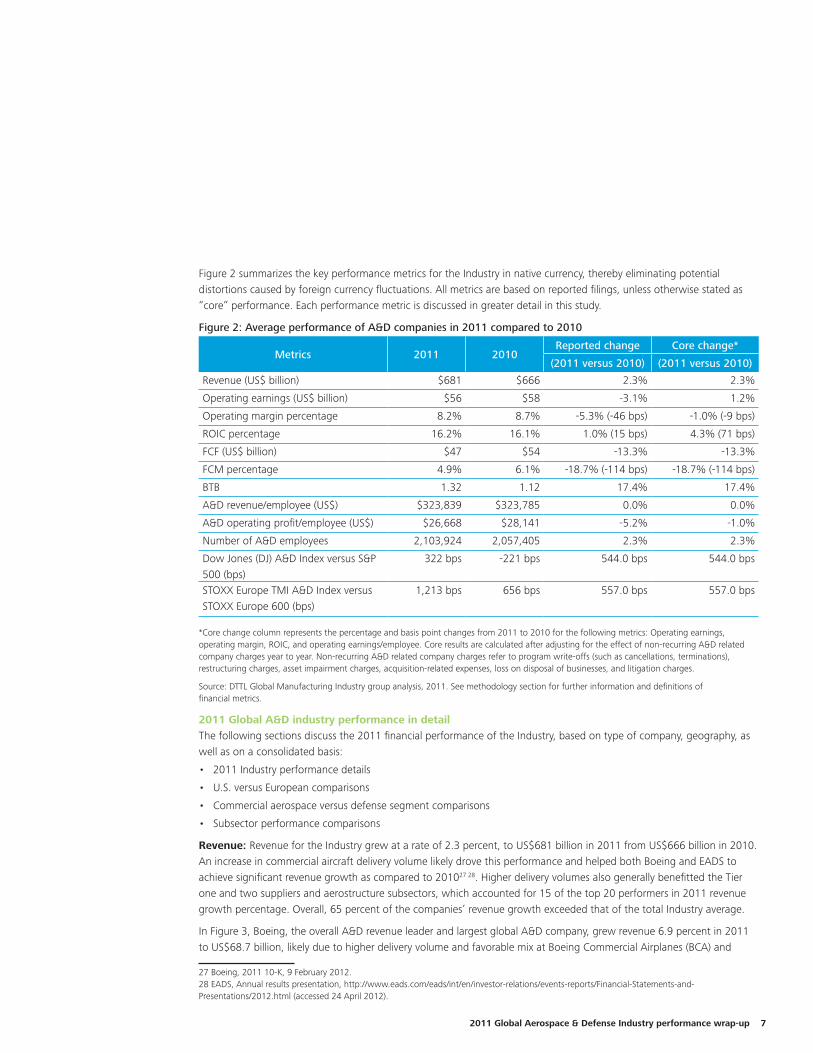
Figure 2 summarizes the key performance metrics for the Industry in native currency, thereby eliminating potential distortions caused by foreign currency fluctuations. All metrics are based on reported filings, unless otherwise stated as “core” performance. Each performance metric is discussed in greater detail in this study.
Figure 2: Average performance of A&D companies in 2011 compared to 2010
Metrics 2011 2010Reported change Core change*
(2011 versus 2010) (2011 versus 2010)
Revenue (US$ billion) $681 $666 2.3% 2.3%
Operating earnings (US$ billion) $56 $58 -3.1% 1.2%
Operating margin percentage 8.2% 8.7% -5.3% (-46 bps) -1.0% (-9 bps)
ROIC percentage 16.2% 16.1% 1.0% (15 bps) 4.3% (71 bps)
FCF (US$ billion) $47 $54 -13.3% -13.3%
FCM percentage 4.9% 6.1% -18.7% (-114 bps) -18.7% (-114 bps)
BTB 1.32 1.12 17.4% 17.4%
A&D revenue/employee (US$) $323,839 $323,785 0.0% 0.0%
A&D operating profit/employee (US$) $26,668 $28,141 -5.2% -1.0%
Number of A&D employees 2,103,924 2,057,405 2.3% 2.3%
Dow Jones (DJ) A&D Index versus S&P 500 (bps)
322 bps -221 bps 544.0 bps 544.0 bps
STOXX Europe TMI A&D Index versus STOXX Europe 600 (bps)
1,213 bps 656 bps 557.0 bps 557.0 bps
*Core change column represents the percentage and basis point changes from 2011 to 2010 for the following metrics: Operating earnings, operating margin, ROIC, and operating earnings/employee. Core results are calculated after adjusting for the effect of non-recurring A&D related company charges year to year. Non-recurring A&D related company charges refer to program write-offs (such as cancellations, terminations), restructuring charges, asset impairment charges, acquisition-related expenses, loss on disposal of businesses, and litigation charges.
Source: DTTL Global Manufacturing Industry group analysis, 2011. See methodology section for further information and definitions of financial metrics.
2011 Global A&D industry performance in detailThe following sections discuss the 2011 financial performance of the Industry, based on type of company, geography, as well as on a consolidated basis:
• 2011 Industry performance details
• U.S. versus European comparisons
• Commercial aerospace versus defense segment comparisons
• Subsector performance comparisons
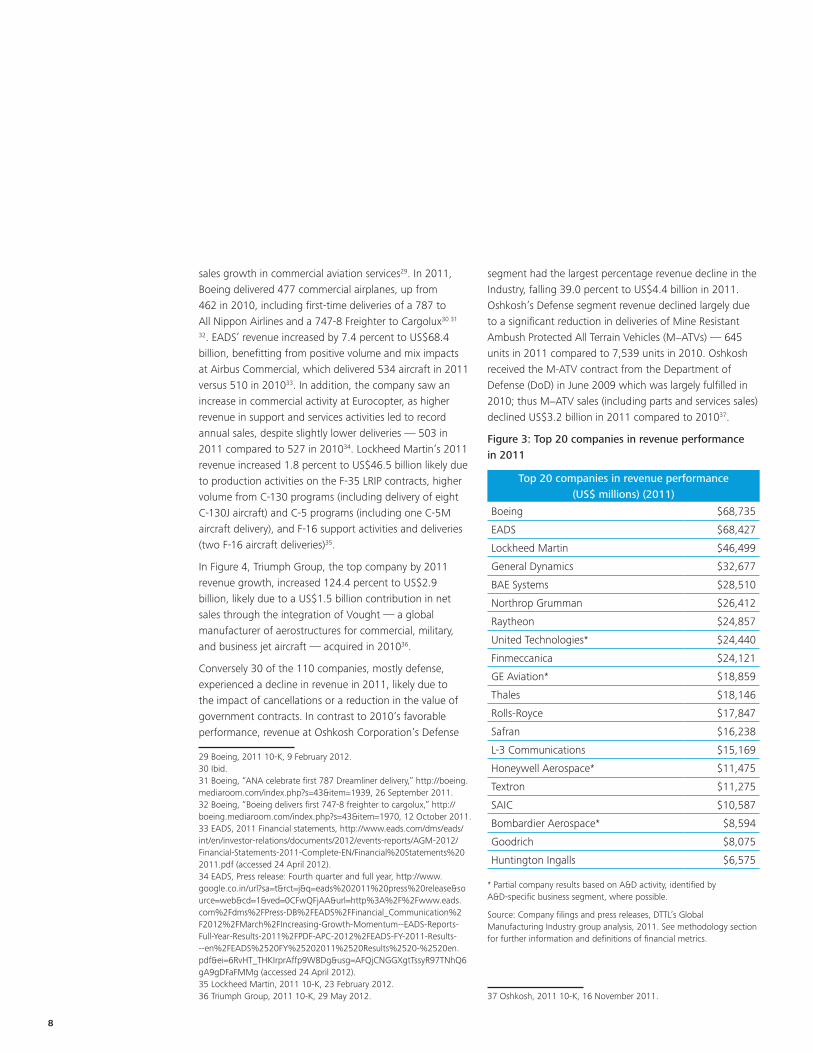
Revenue: Revenue for the Industry grew at a rate of 2.3 percent, to US$681 billion in 2011 from US$666 billion in 2010. An increase in commercial aircraft delivery volume likely drove this performance and helped both Boeing and EADS to achieve significant revenue growth as compared to 201027 28. Higher delivery volumes also generally benefitted the Tier one and two suppliers and aerostructure subsectors, which accounted for 15 of the top 20 performers in 2011 revenue growth percentage. Overall, 65 percent of the companies’ revenue growth exceeded that of the total Industry average.
In Figure 3, Boeing, the overall A&D revenue leader and largest global A&D company, grew revenue 6.9 percent in 2011 to US$68.7 billion, likely due to higher delivery volume and favorable mix at Boeing Commercial Airplanes (BCA) and
27 Boeing, 2011 10-K, 9 February 2012.28 EADS, Annual results presentation, http://www.eads.com/eads/int/en/investor-relations/events-reports/Financial-Statements-and-Presentations/2012.html (accessed 24 April 2012).
8
sales growth in commercial aviation services29. In 2011, Boeing delivered 477 commercial airplanes, up from 462 in 2010, including first-time deliveries of a 787 to All Nippon Airlines and a 747-8 Freighter to Cargolux30 31
32. EADS’ revenue increased by 7.4 percent to US$68.4 billion, benefitting from positive volume and mix impacts at Airbus Commercial, which delivered 534 aircraft in 2011 versus 510 in 201033. In addition, the company saw an increase in commercial activity at Eurocopter, as higher revenue in support and services activities led to record annual sales, despite slightly lower deliveries — 503 in 2011 compared to 527 in 201034. Lockheed Martin’s 2011 revenue increased 1.8 percent to US$46.5 billion likely due to production activities on the F-35 LRIP contracts, higher volume from C-130 programs (including delivery of eight C-130J aircraft) and C-5 programs (including one C-5M aircraft delivery), and F-16 support activities and deliveries (two F-16 aircraft deliveries)35.
In Figure 4, Triumph Group, the top company by 2011 revenue growth, increased 124.4 percent to US$2.9 billion, likely due to a US$1.5 billion contribution in net sales through the integration of Vought — a global manufacturer of aerostructures for commercial, military, and business jet aircraft — acquired in 201036.
Conversely 30 of the 110 companies, mostly defense, experienced a decline in revenue in 2011, likely due to the impact of cancellations or a reduction in the value of government contracts. In contrast to 2010’s favorable performance, revenue at Oshkosh Corporation’s Defense
29 Boeing, 2011 10-K, 9 February 2012.30 Ibid.31 Boeing, “ANA celebrate first 787 Dreamliner delivery,” http://boeing.mediaroom.com/index.php?s=43&item=1939, 26 September 2011.32 Boeing, “Boeing delivers first 747-8 freighter to cargolux,” http://boeing.mediaroom.com/index.php?s=43&item=1970, 12 October 2011.33 EADS, 2011 Financial statements, http://www.eads.com/dms/eads/int/en/investor-relations/documents/2012/events-reports/AGM-2012/Financial-Statements-2011-Complete-EN/Financial%20Statements%202011.pdf (accessed 24 April 2012).34 EADS, Press release: Fourth quarter and full year, http://www.google.co.in/url?sa=t&rct=j&q=eads%202011%20press%20release&source=web&cd=1&ved=0CFwQFjAA&url=http%3A%2F%2Fwww.eads.com%2Fdms%2FPress-DB%2FEADS%2FFinancial_Communication%2F2012%2FMarch%2FIncreasing-Growth-Momentum--EADS-Reports-Full-Year-Results-2011%2FPDF-APC-2012%2FEADS-FY-2011-Results---en%2FEADS%2520FY%25202011%2520Results%2520-%2520en.pdf&ei=6RvHT_THKIrprAffp9W8Dg&usg=AFQjCNGGXgtTssyR97TNhQ6gA9gDFaFMMg (accessed 24 April 2012).35 Lockheed Martin, 2011 10-K, 23 February 2012.36 Triumph Group, 2011 10-K, 29 May 2012.
segment had the largest percentage revenue decline in the Industry, falling 39.0 percent to US$4.4 billion in 2011. Oshkosh’s Defense segment revenue declined largely due to a significant reduction in deliveries of Mine Resistant Ambush Protected All Terrain Vehicles (M−ATVs) — 645 units in 2011 compared to 7,539 units in 2010. Oshkosh received the M-ATV contract from the Department of Defense (DoD) in June 2009 which was largely fulfilled in 2010; thus M−ATV sales (including parts and services sales) declined US$3.2 billion in 2011 compared to 201037.
Figure 3: Top 20 companies in revenue performance in 2011
Top 20 companies in revenue performance (US$ millions) (2011)
Boeing $68,735
EADS $68,427
Lockheed Martin $46,499
General Dynamics $32,677
BAE Systems $28,510
Northrop Grumman $26,412
Raytheon $24,857
United Technologies* $24,440
Finmeccanica $24,121
GE Aviation* $18,859
Thales $18,146
Rolls-Royce $17,847
Safran $16,238
L-3 Communications $15,169
Honeywell Aerospace* $11,475
Textron $11,275
SAIC $10,587
Bombardier Aerospace* $8,594
Goodrich $8,075
Huntington Ingalls $6,575 * Partial company results based on A&D activity, identified by A&D-specific business segment, where possible.
Source: Company filings and press releases, DTTL’s Global Manufacturing Industry group analysis, 2011. See methodology section for further information and definitions of financial metrics.
37 Oshkosh, 2011 10-K, 16 November 2011.

2011 Global Aerospace & Defense Industry performance wrap-up 9
Figure 4: Top 20 companies in revenue growth in 2011
Top 20 companies in revenue growth (2011)
Triumph Group 124.4%
Kratos Defense & Security Solutions 77.0%
Microsemi 61.3%
Transdigm Group 45.7%
Babcock International 45.4%
Allegheny Technologies* 44.1%
Ducommun 42.2%
AAR 34.9%
OHB Technology AG 30.6%
Zodiac SA 28.0%
B/E Aerospace 26.0%
Meggitt 25.2%
Chemring 24.8%
HEICO Corporation 24.0%
Latecoere 23.9%
ThyssenKrupp Marine Systems* 23.3%
RTI International 22.7%
Titanium Metals 21.9%
Precision Castparts* 19.4%
Hexcel 18.6% * Partial company results based on A&D activity, identified by A&D-specific business segment, where possible.
Source: Company filings and press releases, DTTL’s Global Manufacturing Industry group analysis, 2011. See methodology section for further information and definitions of financial metrics.
Operating earnings: The Industry’s reported operating earnings decreased by 3.1 percent to US$56.1 billion in 2011 from US$57.9 billion, as combined non-recurring A&D related company charges increased 111.9 percent to US$4.8 billion from US$2.3 billion in 2010. Within this study, 64 percent of the companies reported positive year over year (YoY) operating earnings growth; however, charges from a small set of companies in 2011, magnified by Finmeccanica’s US$2.1 billion in non-recurring A&D related charges, impacted overall Industry profitability38. Overall core Industry operating earnings increased by 1.2 percent to US$60.9 billion in 2011 from US$60.1 billion in 2010.
38 Finmeccanica, Consolidated financial statements, http://www.finmeccanica.com/EN/Common/files/Corporate/Bilanci_Presentazioni/Bilanci_e_Presentazioni_2012/Bilanci_2011_final/BILANCIO_CONSOLIDATO_2011_ENG.pdf (accessed 24 April 2012).
The same group of companies which accounted for 66 percent of 2010 non-recurring A&D related company charges (i.e. Raytheon, Finmeccanica, Lockheed Martin, United Technologies, BAE Systems, and QinetiQ) continued to represent 62 percent of write-offs in 2011. Four additional companies contributed 24 percent to the total US$4.8 billion in non-recurring A&D related company charges, or US$1.2 billion, in 2011(i.e. URS Federal Services, Hawker Beechcraft, Huntington Ingalls, and Thales).
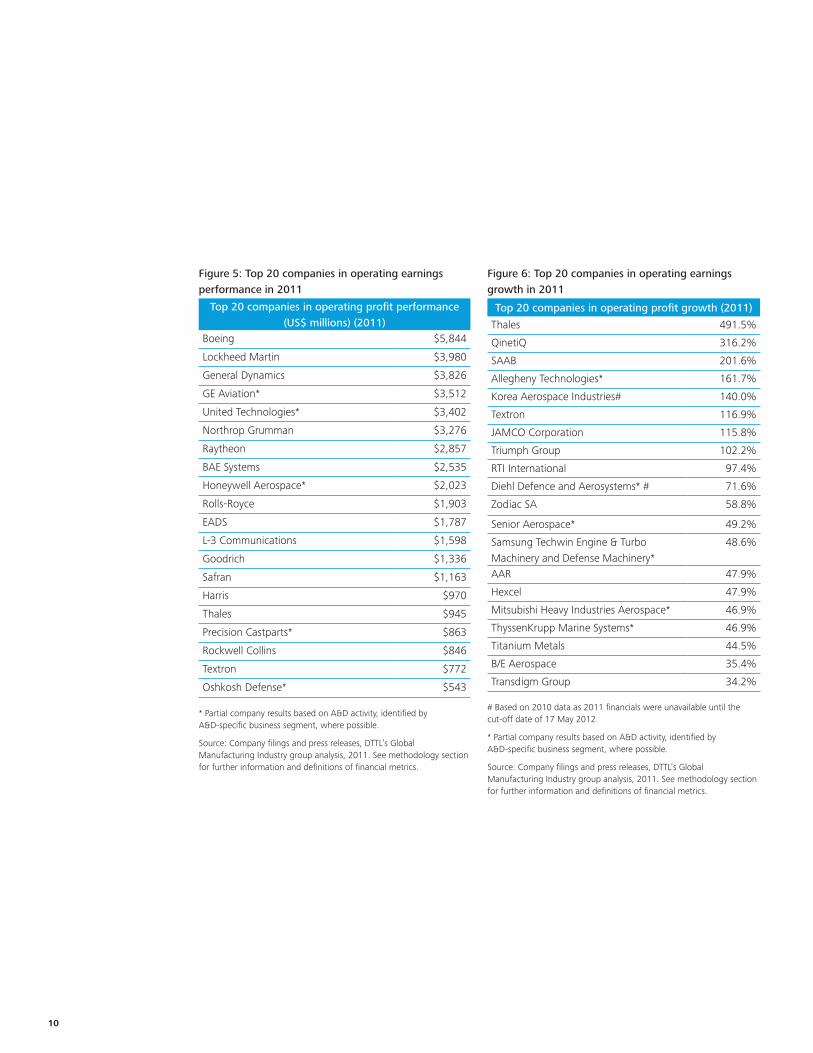
In Figure 5, Boeing ranks as the top company by operating earnings with a 17.6 percent increase to US$5.8 billion in 2011, benefiting from higher sales and lower research and development (R&D) spending at BCA39. Although second in absolute operating earnings performance, Lockheed Martin’s operating earnings decreased 1.7 percent to US$4.0 billion as higher non-cash pension adjustments offset earnings increases in all business segments40. Similarly, General Dynamics’ operating earnings fell 3.0 percent to US$3.8 billion, due to higher R&D expenses and selling expenses associated with increased order activity in the aerospace segment41. In Figure 6, Thales generated the highest operating earnings growth — a 491.5 percent jump to US$945 million from — US$241.4 million in 2010 — primarily due to the absence of US$1.0 billion in charges related to program supply contracts, which diluted Thales’s 2010 operating earnings42.
Forty of the 110 companies in the study registered declines in reported operating earnings in 2011. As mentioned previously, 2011 Industry operating earnings decreased due to significant company losses from non-recurring A&D-specific write-offs and defense contract losses at Finmeccanica, Oshkosh Defense, and L-3 Communications, among others. With the highest operating earnings decline in 2011, Finmeccanica registered an operating loss of US$3.3 billion, a 293.7 percent decrease from 2010 due to one-time charges and business restructuring of its Aeronautics and Defence Electronics businesses43.
39 Boeing, 2011 10-K, 9 February 2012.40 Lockheed Martin, 2011 10-K, 23 February 2012.41 General Dynamics, 2011 10-K, 7 February 2012.42 Thales, Registration document, http://www.google.co.in/url?sa=t&rct=j&q=thales%202011%20registration%20document&source=web&cd=1&ved=0CE8QFjAA&url=http%3A%2F%2Fcms.thalesgroup.com%2FWorkarea%2FDownloadAsset.aspx%3Fid%3D6442451499%26LangType%3D2057&ei=IxzHT4e7DdHorQeKzNziDg&usg=AFQjCNEBVNBlTvp4GfOJSal9RXnmM4ieRw (accessed 24 April 2012).43 Finmeccanica, Full year press release, http://www.finmeccanica.it/EN/Common/files/Corporate/Comunicati_stampa/2012/Marzo_2012/ComFin_Bilancio_2011_27_03_2012_ING.pdf (accessed 24 April 2012).
10
Figure 5: Top 20 companies in operating earnings performance in 2011
Top 20 companies in operating profit performance(US$ millions) (2011)
Boeing $5,844
Lockheed Martin $3,980
General Dynamics $3,826
GE Aviation* $3,512
United Technologies* $3,402
Northrop Grumman $3,276
Raytheon $2,857
BAE Systems $2,535
Honeywell Aerospace* $2,023
Rolls-Royce $1,903
EADS $1,787
L-3 Communications $1,598
Goodrich $1,336
Safran $1,163
Harris $970
Thales $945
Precision Castparts* $863
Rockwell Collins $846
Textron $772
Oshkosh Defense* $543 * Partial company results based on A&D activity, identified by A&D-specific business segment, where possible.
Source: Company filings and press releases, DTTL’s Global Manufacturing Industry group analysis, 2011. See methodology section for further information and definitions of financial metrics.
Figure 6: Top 20 companies in operating earnings growth in 2011
Top 20 companies in operating profit growth (2011)
Thales 491.5%
QinetiQ 316.2%
SAAB 201.6%
Allegheny Technologies* 161.7%
Korea Aerospace Industries# 140.0%
Textron 116.9%
JAMCO Corporation 115.8%
Triumph Group 102.2%
RTI International 97.4%
Diehl Defence and Aerosystems* # 71.6%
Zodiac SA 58.8%
Senior Aerospace* 49.2%
Samsung Techwin Engine & Turbo Machinery and Defense Machinery*
48.6%
AAR 47.9%
Hexcel 47.9%
Mitsubishi Heavy Industries Aerospace* 46.9%
ThyssenKrupp Marine Systems* 46.9%
Titanium Metals 44.5%
B/E Aerospace 35.4%
Transdigm Group 34.2% # Based on 2010 data as 2011 financials were unavailable until the cut-off date of 17 May 2012.
* Partial company results based on A&D activity, identified by A&D-specific business segment, where possible.
Source: Company filings and press releases, DTTL’s Global Manufacturing Industry group analysis, 2011. See methodology section for further information and definitions of financial metrics.
2011 Global Aerospace & Defense Industry performance wrap-up 11
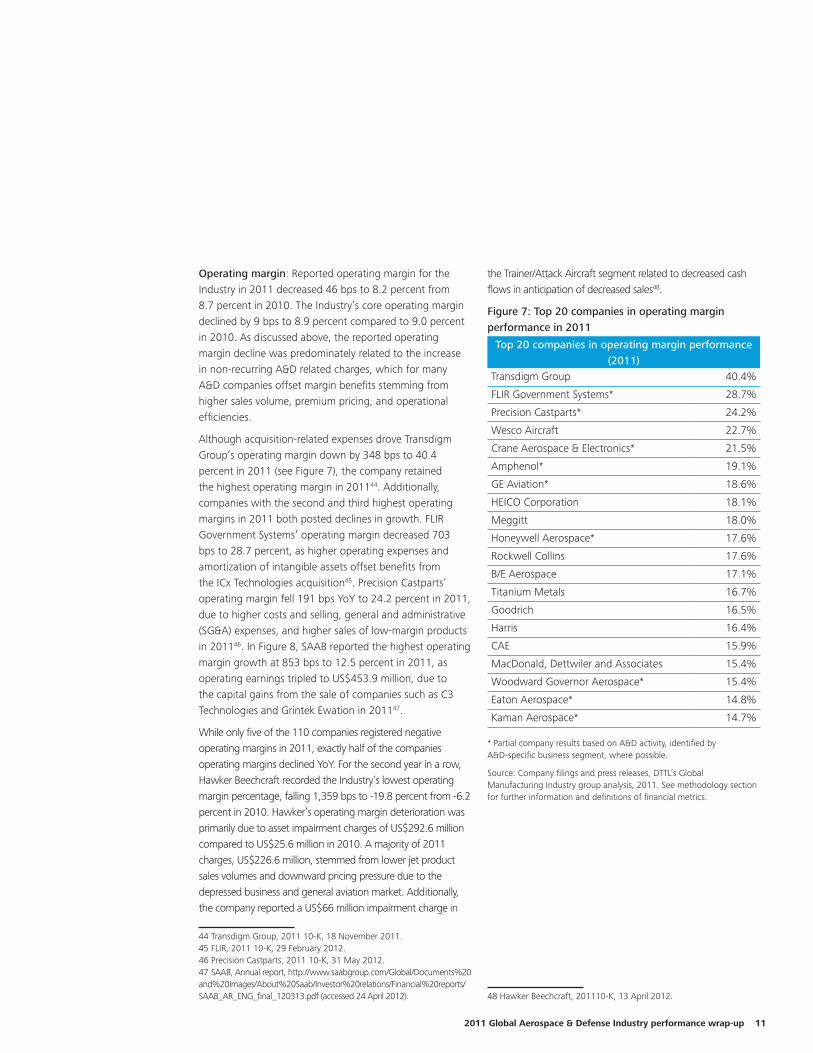
Operating margin: Reported operating margin for the Industry in 2011 decreased 46 bps to 8.2 percent from 8.7 percent in 2010. The Industry’s core operating margin declined by 9 bps to 8.9 percent compared to 9.0 percent in 2010. As discussed above, the reported operating margin decline was predominately related to the increase in non-recurring A&D related charges, which for many A&D companies offset margin benefits stemming from higher sales volume, premium pricing, and operational efficiencies.
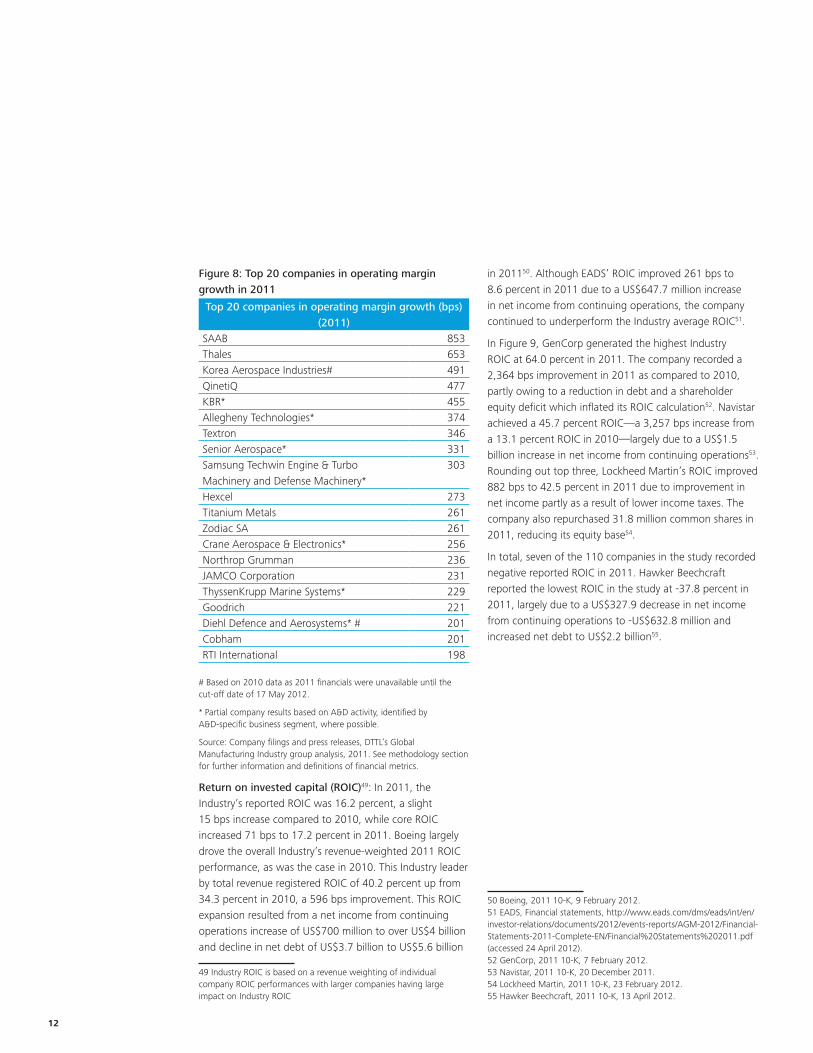
Although acquisition-related expenses drove Transdigm Group’s operating margin down by 348 bps to 40.4 percent in 2011 (see Figure 7), the company retained the highest operating margin in 201144. Additionally, companies with the second and third highest operating margins in 2011 both posted declines in growth. FLIR Government Systems’ operating margin decreased 703 bps to 28.7 percent, as higher operating expenses and amortization of intangible assets offset benefits from the ICx Technologies acquisition45. Precision Castparts’ operating margin fell 191 bps YoY to 24.2 percent in 2011, due to higher costs and selling, general and administrative (SG&A) expenses, and higher sales of low-margin products in 201146. In Figure 8, SAAB reported the highest operating margin growth at 853 bps to 12.5 percent in 2011, as operating earnings tripled to US$453.9 million, due to the capital gains from the sale of companies such as C3 Technologies and Grintek Ewation in 201147.
While only five of the 110 companies registered negative operating margins in 2011, exactly half of the companies operating margins declined YoY. For the second year in a row, Hawker Beechcraft recorded the Industry’s lowest operating margin percentage, falling 1,359 bps to -19.8 percent from -6.2 percent in 2010. Hawker’s operating margin deterioration was primarily due to asset impairment charges of US$292.6 million compared to US$25.6 million in 2010. A majority of 2011 charges, US$226.6 million, stemmed from lower jet product sales volumes and downward pricing pressure due to the depressed business and general aviation market. Additionally, the company reported a US$66 million impairment charge in
44 Transdigm Group, 2011 10-K, 18 November 2011.45 FLIR, 2011 10-K, 29 February 2012.46 Precision Castparts, 2011 10-K, 31 May 2012.47 SAAB, Annual report, http://www.saabgroup.com/Global/Documents%20and%20Images/About%20Saab/Investor%20relations/Financial%20reports/SAAB_AR_ENG_final_120313.pdf (accessed 24 April 2012).
the Trainer/Attack Aircraft segment related to decreased cash flows in anticipation of decreased sales48.
Figure 7: Top 20 companies in operating margin performance in 2011
Top 20 companies in operating margin performance (2011)
Transdigm Group 40.4%
FLIR Government Systems* 28.7%
Precision Castparts* 24.2%
Wesco Aircraft 22.7%
Crane Aerospace & Electronics* 21.5%
Amphenol* 19.1%
GE Aviation* 18.6%
HEICO Corporation 18.1%
Meggitt 18.0%
Honeywell Aerospace* 17.6%
Rockwell Collins 17.6%
B/E Aerospace 17.1%
Titanium Metals 16.7%
Goodrich 16.5%
Harris 16.4%
CAE 15.9%
MacDonald, Dettwiler and Associates 15.4%
Woodward Governor Aerospace* 15.4%
Eaton Aerospace* 14.8%
Kaman Aerospace* 14.7% * Partial company results based on A&D activity, identified by A&D-specific business segment, where possible.
Source: Company filings and press releases, DTTL’s Global Manufacturing Industry group analysis, 2011. See methodology section for further information and definitions of financial metrics.
48 Hawker Beechcraft, 201110-K, 13 April 2012.
12
Figure 8: Top 20 companies in operating margin growth in 2011
Top 20 companies in operating margin growth (bps) (2011)
SAAB 853Thales 653Korea Aerospace Industries# 491QinetiQ 477KBR* 455Allegheny Technologies* 374Textron 346Senior Aerospace* 331Samsung Techwin Engine & Turbo Machinery and Defense Machinery*
303
Hexcel 273Titanium Metals 261Zodiac SA 261Crane Aerospace & Electronics* 256Northrop Grumman 236JAMCO Corporation 231ThyssenKrupp Marine Systems* 229Goodrich 221Diehl Defence and Aerosystems* # 201Cobham 201RTI International 198
# Based on 2010 data as 2011 financials were unavailable until the cut-off date of 17 May 2012.
* Partial company results based on A&D activity, identified by A&D-specific business segment, where possible.
Source: Company filings and press releases, DTTL’s Global Manufacturing Industry group analysis, 2011. See methodology section for further information and definitions of financial metrics.
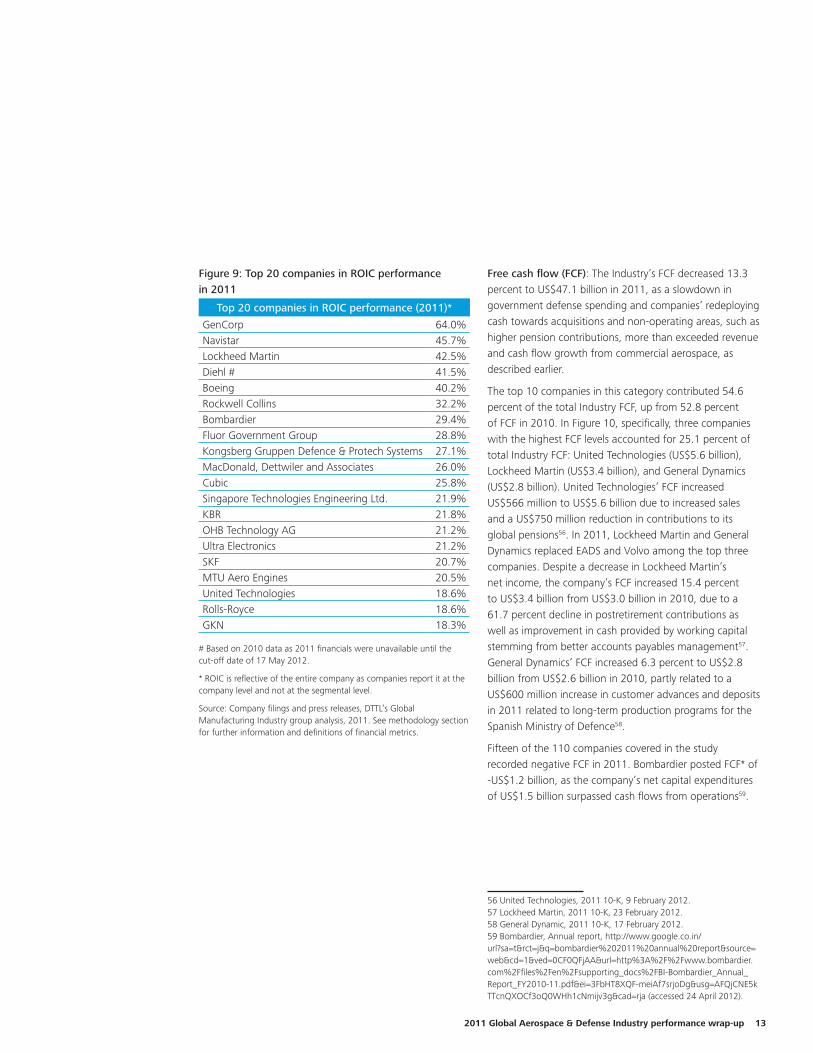
Return on invested capital (ROIC)49: In 2011, the Industry’s reported ROIC was 16.2 percent, a slight 15 bps increase compared to 2010, while core ROIC increased 71 bps to 17.2 percent in 2011. Boeing largely drove the overall Industry’s revenue-weighted 2011 ROIC performance, as was the case in 2010. This Industry leader by total revenue registered ROIC of 40.2 percent up from 34.3 percent in 2010, a 596 bps improvement. This ROIC expansion resulted from a net income from continuing operations increase of US$700 million to over US$4 billion and decline in net debt of US$3.7 billion to US$5.6 billion
49 Industry ROIC is based on a revenue weighting of individual company ROIC performances with larger companies having large impact on Industry ROIC
in 201150. Although EADS’ ROIC improved 261 bps to 8.6 percent in 2011 due to a US$647.7 million increase in net income from continuing operations, the company continued to underperform the Industry average ROIC51.
In Figure 9, GenCorp generated the highest Industry ROIC at 64.0 percent in 2011. The company recorded a 2,364 bps improvement in 2011 as compared to 2010, partly owing to a reduction in debt and a shareholder equity deficit which inflated its ROIC calculation52. Navistar achieved a 45.7 percent ROIC—a 3,257 bps increase from a 13.1 percent ROIC in 2010—largely due to a US$1.5 billion increase in net income from continuing operations53. Rounding out top three, Lockheed Martin’s ROIC improved 882 bps to 42.5 percent in 2011 due to improvement in net income partly as a result of lower income taxes. The company also repurchased 31.8 million common shares in 2011, reducing its equity base54.
In total, seven of the 110 companies in the study recorded negative reported ROIC in 2011. Hawker Beechcraft reported the lowest ROIC in the study at -37.8 percent in 2011, largely due to a US$327.9 decrease in net income from continuing operations to -US$632.8 million and increased net debt to US$2.2 billion55.
50 Boeing, 2011 10-K, 9 February 2012.51 EADS, Financial statements, http://www.eads.com/dms/eads/int/en/investor-relations/documents/2012/events-reports/AGM-2012/Financial-Statements-2011-Complete-EN/Financial%20Statements%202011.pdf (accessed 24 April 2012).52 GenCorp, 2011 10-K, 7 February 2012.53 Navistar, 2011 10-K, 20 December 2011.54 Lockheed Martin, 2011 10-K, 23 February 2012.55 Hawker Beechcraft, 2011 10-K, 13 April 2012.
2011 Global Aerospace & Defense Industry performance wrap-up 13
Figure 9: Top 20 companies in ROIC performance in 2011
Top 20 companies in ROIC performance (2011)*
GenCorp 64.0%Navistar 45.7%Lockheed Martin 42.5%Diehl # 41.5%Boeing 40.2%Rockwell Collins 32.2%Bombardier 29.4%Fluor Government Group 28.8%Kongsberg Gruppen Defence & Protech Systems 27.1%MacDonald, Dettwiler and Associates 26.0%Cubic 25.8%Singapore Technologies Engineering Ltd. 21.9%KBR 21.8%OHB Technology AG 21.2%Ultra Electronics 21.2%SKF 20.7%MTU Aero Engines 20.5%United Technologies 18.6%Rolls-Royce 18.6%GKN 18.3%
# Based on 2010 data as 2011 financials were unavailable until the cut-off date of 17 May 2012.
* ROIC is reflective of the entire company as companies report it at the company level and not at the segmental level.
Source: Company filings and press releases, DTTL’s Global Manufacturing Industry group analysis, 2011. See methodology section for further information and definitions of financial metrics.
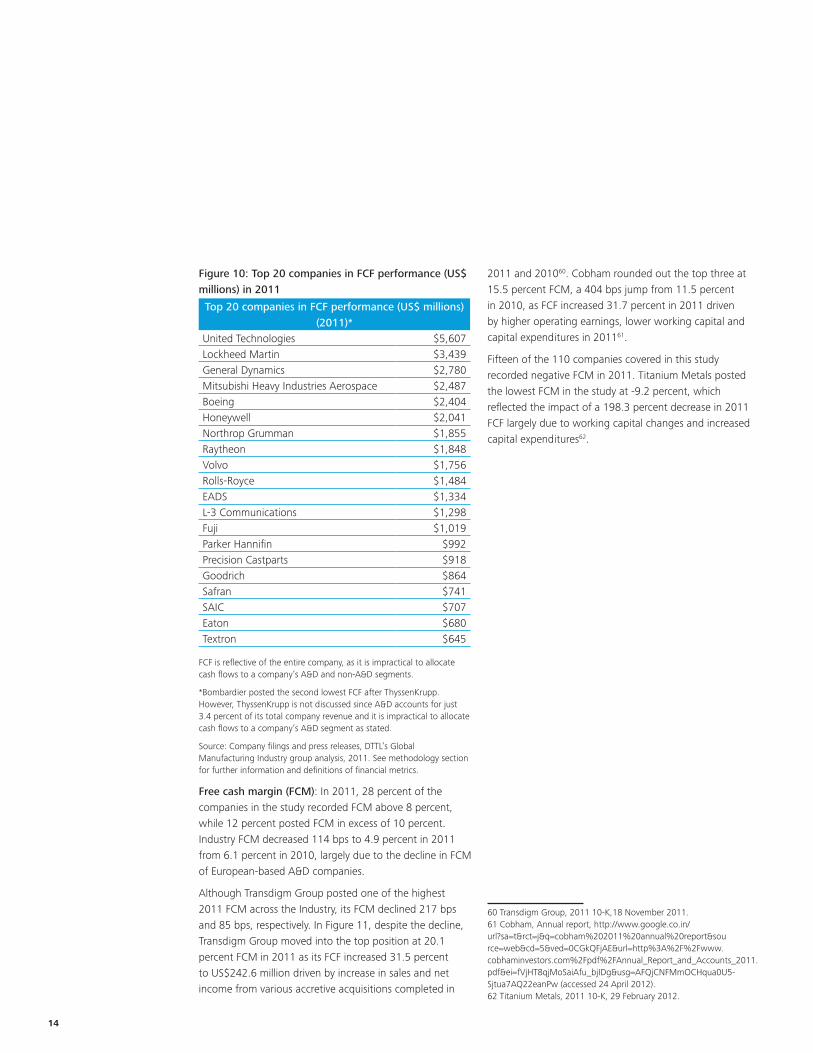
Free cash flow (FCF): The Industry’s FCF decreased 13.3 percent to US$47.1 billion in 2011, as a slowdown in government defense spending and companies’ redeploying cash towards acquisitions and non-operating areas, such as higher pension contributions, more than exceeded revenue and cash flow growth from commercial aerospace, as described earlier.
The top 10 companies in this category contributed 54.6 percent of the total Industry FCF, up from 52.8 percent of FCF in 2010. In Figure 10, specifically, three companies with the highest FCF levels accounted for 25.1 percent of total Industry FCF: United Technologies (US$5.6 billion), Lockheed Martin (US$3.4 billion), and General Dynamics (US$2.8 billion). United Technologies’ FCF increased US$566 million to US$5.6 billion due to increased sales and a US$750 million reduction in contributions to its global pensions56. In 2011, Lockheed Martin and General Dynamics replaced EADS and Volvo among the top three companies. Despite a decrease in Lockheed Martin’s net income, the company’s FCF increased 15.4 percent to US$3.4 billion from US$3.0 billion in 2010, due to a 61.7 percent decline in postretirement contributions as well as improvement in cash provided by working capital stemming from better accounts payables management57. General Dynamics’ FCF increased 6.3 percent to US$2.8 billion from US$2.6 billion in 2010, partly related to a US$600 million increase in customer advances and deposits in 2011 related to long-term production programs for the Spanish Ministry of Defence58.
Fifteen of the 110 companies covered in the study recorded negative FCF in 2011. Bombardier posted FCF* of -US$1.2 billion, as the company’s net capital expenditures of US$1.5 billion surpassed cash flows from operations59.
56 United Technologies, 2011 10-K, 9 February 2012.57 Lockheed Martin, 2011 10-K, 23 February 2012.58 General Dynamic, 2011 10-K, 17 February 2012.59 Bombardier, Annual report, http://www.google.co.in/url?sa=t&rct=j&q=bombardier%202011%20annual%20report&source=web&cd=1&ved=0CF0QFjAA&url=http%3A%2F%2Fwww.bombardier.com%2Ffiles%2Fen%2Fsupporting_docs%2FBI-Bombardier_Annual_Report_FY2010-11.pdf&ei=3FbHT8XQF-meiAf7srjoDg&usg=AFQjCNE5kTTcnQXOCf3oQ0WHh1cNmijv3g&cad=rja (accessed 24 April 2012).
14
Figure 10: Top 20 companies in FCF performance (US$ millions) in 2011
Top 20 companies in FCF performance (US$ millions) (2011)*
United Technologies $5,607 Lockheed Martin $3,439 General Dynamics $2,780 Mitsubishi Heavy Industries Aerospace $2,487 Boeing $2,404 Honeywell $2,041 Northrop Grumman $1,855 Raytheon $1,848 Volvo $1,756 Rolls-Royce $1,484 EADS $1,334 L-3 Communications $1,298 Fuji $1,019 Parker Hannifin $992 Precision Castparts $918 Goodrich $864 Safran $741 SAIC $707 Eaton $680 Textron $645
FCF is reflective of the entire company, as it is impractical to allocate cash flows to a company’s A&D and non-A&D segments.
*Bombardier posted the second lowest FCF after ThyssenKrupp. However, ThyssenKrupp is not discussed since A&D accounts for just 3.4 percent of its total company revenue and it is impractical to allocate cash flows to a company’s A&D segment as stated.
Source: Company filings and press releases, DTTL’s Global Manufacturing Industry group analysis, 2011. See methodology section for further information and definitions of financial metrics.
Free cash margin (FCM): In 2011, 28 percent of the companies in the study recorded FCM above 8 percent, while 12 percent posted FCM in excess of 10 percent. Industry FCM decreased 114 bps to 4.9 percent in 2011 from 6.1 percent in 2010, largely due to the decline in FCM of European-based A&D companies.
Although Transdigm Group posted one of the highest 2011 FCM across the Industry, its FCM declined 217 bps and 85 bps, respectively. In Figure 11, despite the decline, Transdigm Group moved into the top position at 20.1 percent FCM in 2011 as its FCF increased 31.5 percent to US$242.6 million driven by increase in sales and net income from various accretive acquisitions completed in
2011 and 201060. Cobham rounded out the top three at 15.5 percent FCM, a 404 bps jump from 11.5 percent in 2010, as FCF increased 31.7 percent in 2011 driven by higher operating earnings, lower working capital and capital expenditures in 201161.
Fifteen of the 110 companies covered in this study recorded negative FCM in 2011. Titanium Metals posted the lowest FCM in the study at -9.2 percent, which reflected the impact of a 198.3 percent decrease in 2011 FCF largely due to working capital changes and increased capital expenditures62.
60 Transdigm Group, 2011 10-K,18 November 2011.61 Cobham, Annual report, http://www.google.co.in/url?sa=t&rct=j&q=cobham%202011%20annual%20report&source=web&cd=5&ved=0CGkQFjAE&url=http%3A%2F%2Fwww.cobhaminvestors.com%2Fpdf%2FAnnual_Report_and_Accounts_2011.pdf&ei=fVjHT8qjMoSaiAfu_bjIDg&usg=AFQjCNFMmOCHqua0U5-Sjtua7AQ22eanPw (accessed 24 April 2012).62 Titanium Metals, 2011 10-K, 29 February 2012.
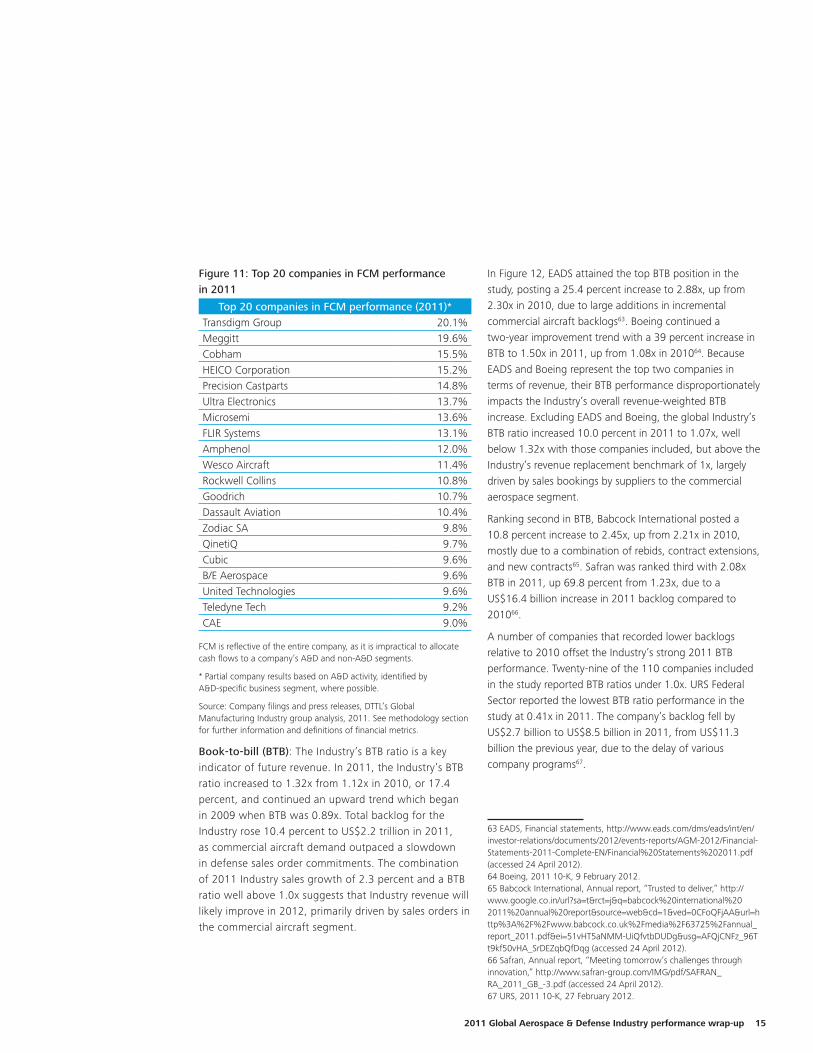
2011 Global Aerospace & Defense Industry performance wrap-up 15
Figure 11: Top 20 companies in FCM performance in 2011
Top 20 companies in FCM performance (2011)*Transdigm Group 20.1%Meggitt 19.6%Cobham 15.5%HEICO Corporation 15.2%Precision Castparts 14.8%Ultra Electronics 13.7%Microsemi 13.6%FLIR Systems 13.1%Amphenol 12.0%Wesco Aircraft 11.4%Rockwell Collins 10.8%Goodrich 10.7%Dassault Aviation 10.4%Zodiac SA 9.8%QinetiQ 9.7%Cubic 9.6%B/E Aerospace 9.6%United Technologies 9.6%Teledyne Tech 9.2%CAE 9.0%
FCM is reflective of the entire company, as it is impractical to allocate cash flows to a company’s A&D and non-A&D segments.
* Partial company results based on A&D activity, identified by A&D-specific business segment, where possible.
Source: Company filings and press releases, DTTL’s Global Manufacturing Industry group analysis, 2011. See methodology section for further information and definitions of financial metrics.
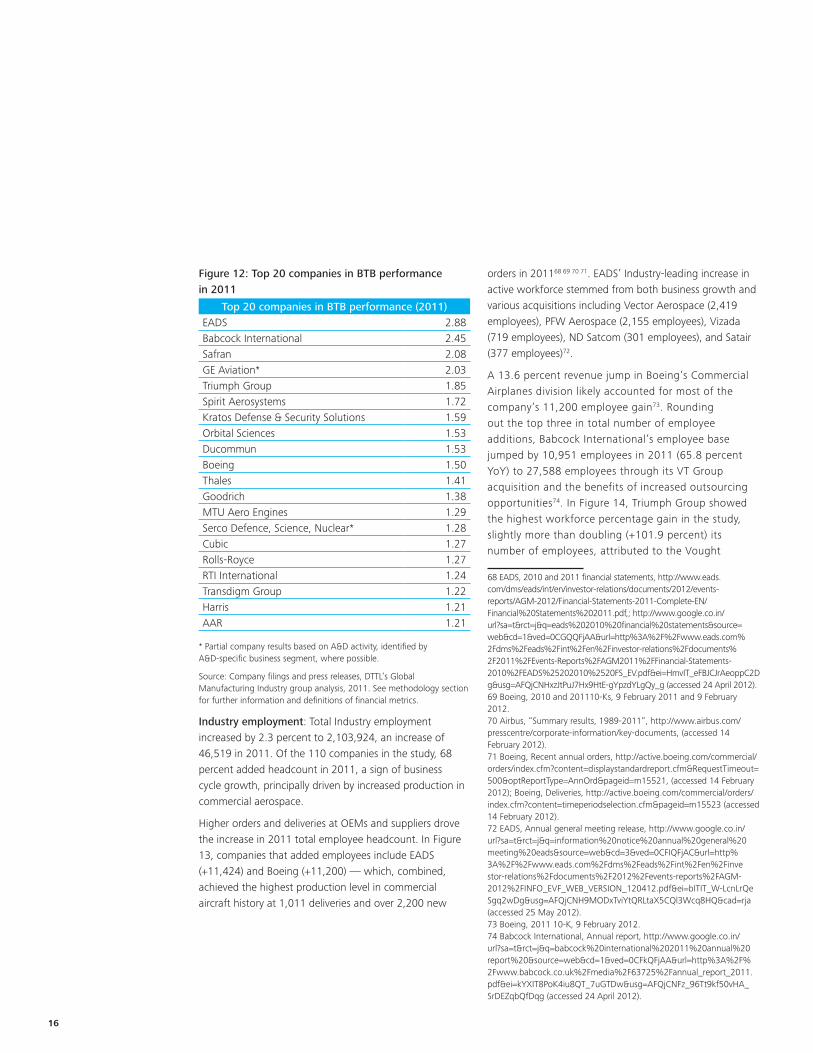
Book-to-bill (BTB): The Industry’s BTB ratio is a key indicator of future revenue. In 2011, the Industry’s BTB ratio increased to 1.32x from 1.12x in 2010, or 17.4 percent, and continued an upward trend which began in 2009 when BTB was 0.89x. Total backlog for the Industry rose 10.4 percent to US$2.2 trillion in 2011, as commercial aircraft demand outpaced a slowdown in defense sales order commitments. The combination of 2011 Industry sales growth of 2.3 percent and a BTB ratio well above 1.0x suggests that Industry revenue will likely improve in 2012, primarily driven by sales orders in the commercial aircraft segment.
In Figure 12, EADS attained the top BTB position in the study, posting a 25.4 percent increase to 2.88x, up from 2.30x in 2010, due to large additions in incremental commercial aircraft backlogs63. Boeing continued a two-year improvement trend with a 39 percent increase in BTB to 1.50x in 2011, up from 1.08x in 201064. Because EADS and Boeing represent the top two companies in terms of revenue, their BTB performance disproportionately impacts the Industry’s overall revenue-weighted BTB increase. Excluding EADS and Boeing, the global Industry’s BTB ratio increased 10.0 percent in 2011 to 1.07x, well below 1.32x with those companies included, but above the Industry’s revenue replacement benchmark of 1x, largely driven by sales bookings by suppliers to the commercial aerospace segment.
Ranking second in BTB, Babcock International posted a 10.8 percent increase to 2.45x, up from 2.21x in 2010, mostly due to a combination of rebids, contract extensions, and new contracts65. Safran was ranked third with 2.08x BTB in 2011, up 69.8 percent from 1.23x, due to a US$16.4 billion increase in 2011 backlog compared to 201066.
A number of companies that recorded lower backlogs relative to 2010 offset the Industry’s strong 2011 BTB performance. Twenty-nine of the 110 companies included in the study reported BTB ratios under 1.0x. URS Federal Sector reported the lowest BTB ratio performance in the study at 0.41x in 2011. The company’s backlog fell by US$2.7 billion to US$8.5 billion in 2011, from US$11.3 billion the previous year, due to the delay of various company programs67.
63 EADS, Financial statements, http://www.eads.com/dms/eads/int/en/ investor-relations/documents/2012/events-reports/AGM-2012/Financial-Statements-2011-Complete-EN/Financial%20Statements%202011.pdf (accessed 24 April 2012).64 Boeing, 2011 10-K, 9 February 2012.65 Babcock International, Annual report, “Trusted to deliver,” http://www.google.co.in/url?sa=t&rct=j&q=babcock%20international%202011%20annual%20report&source=web&cd=1&ved=0CFoQFjAA&url=http%3A%2F%2Fwww.babcock.co.uk%2Fmedia%2F63725%2Fannual_report_2011.pdf&ei=51vHT5aNMM-UiQfvtbDUDg&usg=AFQjCNFz_96Tt9kf50vHA_SrDEZqbQfDqg (accessed 24 April 2012).66 Safran, Annual report, “Meeting tomorrow’s challenges through innovation,” http://www.safran-group.com/IMG/pdf/SAFRAN_RA_2011_GB_-3.pdf (accessed 24 April 2012).67 URS, 2011 10-K, 27 February 2012.
16
Figure 12: Top 20 companies in BTB performance in 2011
Top 20 companies in BTB performance (2011)EADS 2.88Babcock International 2.45Safran 2.08GE Aviation* 2.03Triumph Group 1.85Spirit Aerosystems 1.72Kratos Defense & Security Solutions 1.59Orbital Sciences 1.53Ducommun 1.53Boeing 1.50Thales 1.41Goodrich 1.38MTU Aero Engines 1.29Serco Defence, Science, Nuclear* 1.28Cubic 1.27Rolls-Royce 1.27RTI International 1.24Transdigm Group 1.22Harris 1.21AAR 1.21
* Partial company results based on A&D activity, identified by A&D-specific business segment, where possible.
Source: Company filings and press releases, DTTL’s Global Manufacturing Industry group analysis, 2011. See methodology section for further information and definitions of financial metrics.
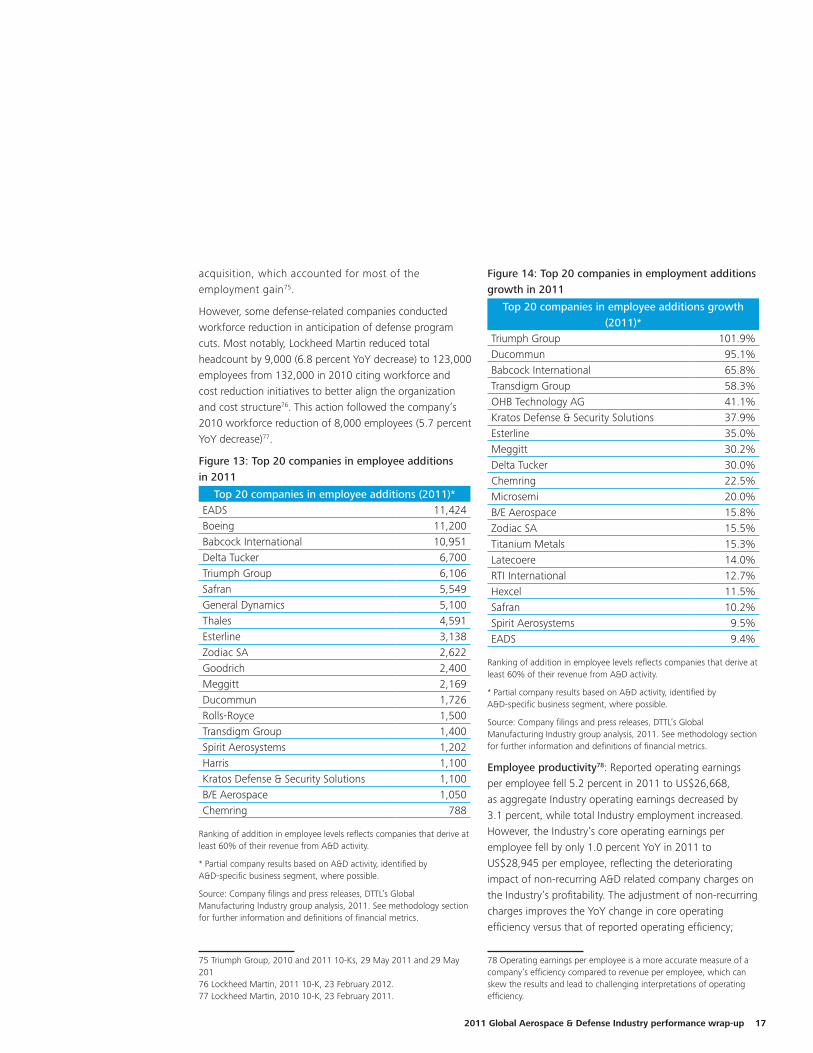
Industry employment: Total Industry employment increased by 2.3 percent to 2,103,924, an increase of 46,519 in 2011. Of the 110 companies in the study, 68 percent added headcount in 2011, a sign of business cycle growth, principally driven by increased production in commercial aerospace.
Higher orders and deliveries at OEMs and suppliers drove the increase in 2011 total employee headcount. In Figure 13, companies that added employees include EADS (+11,424) and Boeing (+11,200) — which, combined, achieved the highest production level in commercial aircraft history at 1,011 deliveries and over 2,200 new
orders in 201168 69 70 71. EADS’ Industry-leading increase in active workforce stemmed from both business growth and various acquisitions including Vector Aerospace (2,419 employees), PFW Aerospace (2,155 employees), Vizada (719 employees), ND Satcom (301 employees), and Satair (377 employees)72.
A 13.6 percent revenue jump in Boeing’s Commercial Airplanes division likely accounted for most of the company’s 11,200 employee gain73. Rounding out the top three in total number of employee additions, Babcock International’s employee base jumped by 10,951 employees in 2011 (65.8 percent YoY) to 27,588 employees through its VT Group acquisition and the benefits of increased outsourcing opportunities74. In Figure 14, Triumph Group showed the highest workforce percentage gain in the study, slightly more than doubling (+101.9 percent) its number of employees, attributed to the Vought
68 EADS, 2010 and 2011 financial statements, http://www.eads.com/dms/eads/int/en/investor-relations/documents/2012/events-reports/AGM-2012/Financial-Statements-2011-Complete-EN/Financial%20Statements%202011.pdf,; http://www.google.co.in/url?sa=t&rct=j&q=eads%202010%20financial%20statements&source=web&cd=1&ved=0CGQQFjAA&url=http%3A%2F%2Fwww.eads.com%2Fdms%2Feads%2Fint%2Fen%2Finvestor-relations%2Fdocuments%2F2011%2FEvents-Reports%2FAGM2011%2FFinancial-Statements-2010%2FEADS%25202010%2520FS_EV.pdf&ei=HmvIT_eFBJCJrAeoppC2Dg&usg=AFQjCNHxzJtPuJ7Hx9HtE-gYpzdYLgQy_g (accessed 24 April 2012).69 Boeing, 2010 and 201110-Ks, 9 February 2011 and 9 February 2012.70 Airbus, “Summary results, 1989-2011”, http://www.airbus.com/presscentre/corporate-information/key-documents, (accessed 14 February 2012).71 Boeing, Recent annual orders, http://active.boeing.com/commercial/orders/index.cfm?content=displaystandardreport.cfm&RequestTimeout=500&optReportType=AnnOrd&pageid=m15521, (accessed 14 February 2012); Boeing, Deliveries, http://active.boeing.com/commercial/orders/index.cfm?content=timeperiodselection.cfm&pageid=m15523 (accessed 14 February 2012).72 EADS, Annual general meeting release, http://www.google.co.in/url?sa=t&rct=j&q=information%20notice%20annual%20general%20meeting%20eads&source=web&cd=3&ved=0CFIQFjAC&url=http%3A%2F%2Fwww.eads.com%2Fdms%2Feads%2Fint%2Fen%2Finvestor-relations%2Fdocuments%2F2012%2Fevents-reports%2FAGM-2012%2FINFO_EVF_WEB_VERSION_120412.pdf&ei=bITIT_W-LcnLrQeSgq2wDg&usg=AFQjCNH9MODxTviYtQRLtaX5CQl3Wcq8HQ&cad=rja (accessed 25 May 2012).73 Boeing, 2011 10-K, 9 February 2012.74 Babcock International, Annual report, http://www.google.co.in/url?sa=t&rct=j&q=babcock%20international%202011%20annual%20report%20&source=web&cd=1&ved=0CFkQFjAA&url=http%3A%2F%2Fwww.babcock.co.uk%2Fmedia%2F63725%2Fannual_report_2011.pdf&ei=kYXIT8PoK4iu8QT_7uGTDw&usg=AFQjCNFz_96Tt9kf50vHA_SrDEZqbQfDqg (accessed 24 April 2012).
2011 Global Aerospace & Defense Industry performance wrap-up 17
acquisition, which accounted for most of the employment gain75.
However, some defense-related companies conducted workforce reduction in anticipation of defense program cuts. Most notably, Lockheed Martin reduced total headcount by 9,000 (6.8 percent YoY decrease) to 123,000 employees from 132,000 in 2010 citing workforce and cost reduction initiatives to better align the organization and cost structure76. This action followed the company’s 2010 workforce reduction of 8,000 employees (5.7 percent YoY decrease)77.
Figure 13: Top 20 companies in employee additions in 2011
Top 20 companies in employee additions (2011)*EADS 11,424Boeing 11,200Babcock International 10,951Delta Tucker 6,700Triumph Group 6,106Safran 5,549General Dynamics 5,100Thales 4,591Esterline 3,138Zodiac SA 2,622Goodrich 2,400Meggitt 2,169Ducommun 1,726Rolls-Royce 1,500Transdigm Group 1,400Spirit Aerosystems 1,202Harris 1,100Kratos Defense & Security Solutions 1,100B/E Aerospace 1,050Chemring 788
Ranking of addition in employee levels reflects companies that derive at least 60% of their revenue from A&D activity.
* Partial company results based on A&D activity, identified by A&D-specific business segment, where possible.
Source: Company filings and press releases, DTTL’s Global Manufacturing Industry group analysis, 2011. See methodology section for further information and definitions of financial metrics.
75 Triumph Group, 2010 and 2011 10-Ks, 29 May 2011 and 29 May 20176 Lockheed Martin, 2011 10-K, 23 February 2012.77 Lockheed Martin, 2010 10-K, 23 February 2011.
Figure 14: Top 20 companies in employment additions growth in 2011
Top 20 companies in employee additions growth (2011)*
Triumph Group 101.9%Ducommun 95.1%Babcock International 65.8%Transdigm Group 58.3%OHB Technology AG 41.1%Kratos Defense & Security Solutions 37.9%Esterline 35.0%Meggitt 30.2%Delta Tucker 30.0%Chemring 22.5%Microsemi 20.0%B/E Aerospace 15.8%Zodiac SA 15.5%Titanium Metals 15.3%Latecoere 14.0%RTI International 12.7%Hexcel 11.5%Safran 10.2%Spirit Aerosystems 9.5%EADS 9.4%
Ranking of addition in employee levels reflects companies that derive at least 60% of their revenue from A&D activity.
* Partial company results based on A&D activity, identified by A&D-specific business segment, where possible.
Source: Company filings and press releases, DTTL’s Global Manufacturing Industry group analysis, 2011. See methodology section for further information and definitions of financial metrics.
Employee productivity78: Reported operating earnings per employee fell 5.2 percent in 2011 to US$26,668, as aggregate Industry operating earnings decreased by 3.1 percent, while total Industry employment increased. However, the Industry’s core operating earnings per employee fell by only 1.0 percent YoY in 2011 to US$28,945 per employee, reflecting the deteriorating impact of non-recurring A&D related company charges on the Industry’s profitability. The adjustment of non-recurring charges improves the YoY change in core operating efficiency versus that of reported operating efficiency;
78 Operating earnings per employee is a more accurate measure of a company’s efficiency compared to revenue per employee, which can skew the results and lead to challenging interpretations of operating efficiency.
18
however, despite this adjustment, the change continues to be negative as elimination of charges alone is not enough to offset the increased Industry headcount in general.
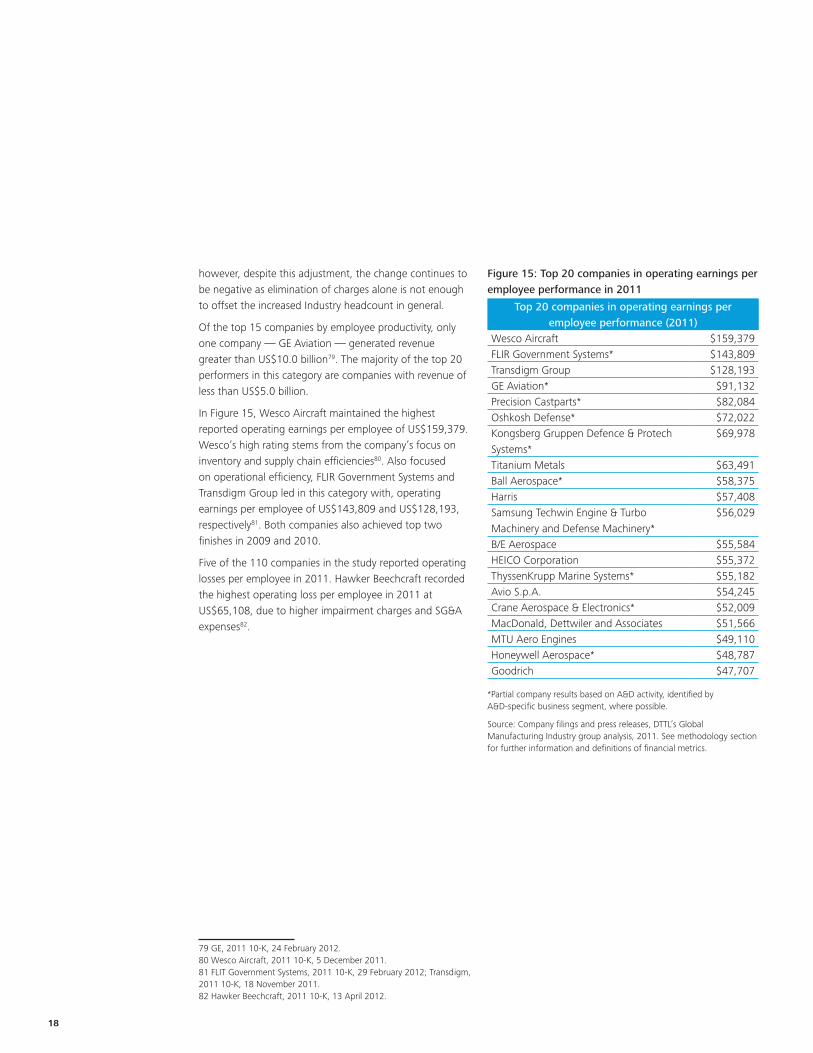
Of the top 15 companies by employee productivity, only one company — GE Aviation — generated revenue greater than US$10.0 billion79. The majority of the top 20 performers in this category are companies with revenue of less than US$5.0 billion.
In Figure 15, Wesco Aircraft maintained the highest reported operating earnings per employee of US$159,379. Wesco’s high rating stems from the company’s focus on inventory and supply chain efficiencies80. Also focused on operational efficiency, FLIR Government Systems and Transdigm Group led in this category with, operating earnings per employee of US$143,809 and US$128,193, respectively81. Both companies also achieved top two finishes in 2009 and 2010.
Five of the 110 companies in the study reported operating losses per employee in 2011. Hawker Beechcraft recorded the highest operating loss per employee in 2011 at US$65,108, due to higher impairment charges and SG&A expenses82.
79 GE, 2011 10-K, 24 February 2012.80 Wesco Aircraft, 2011 10-K, 5 December 2011.81 FLIT Government Systems, 2011 10-K, 29 February 2012; Transdigm, 2011 10-K, 18 November 2011. 82 Hawker Beechcraft, 2011 10-K, 13 April 2012.
Figure 15: Top 20 companies in operating earnings per employee performance in 2011
Top 20 companies in operating earnings per employee performance (2011)
Wesco Aircraft $159,379 FLIR Government Systems* $143,809 Transdigm Group $128,193 GE Aviation* $91,132 Precision Castparts* $82,084 Oshkosh Defense* $72,022 Kongsberg Gruppen Defence & Protech Systems*
$69,978
Titanium Metals $63,491 Ball Aerospace* $58,375 Harris $57,408 Samsung Techwin Engine & Turbo Machinery and Defense Machinery*
$56,029
B/E Aerospace $55,584 HEICO Corporation $55,372 ThyssenKrupp Marine Systems* $55,182 Avio S.p.A. $54,245 Crane Aerospace & Electronics* $52,009 MacDonald, Dettwiler and Associates $51,566 MTU Aero Engines $49,110 Honeywell Aerospace* $48,787 Goodrich $47,707
*Partial company results based on A&D activity, identified by A&D-specific business segment, where possible.
Source: Company filings and press releases, DTTL’s Global Manufacturing Industry group analysis, 2011. See methodology section for further information and definitions of financial metrics.
2011 Global Aerospace & Defense Industry performance wrap-up 19
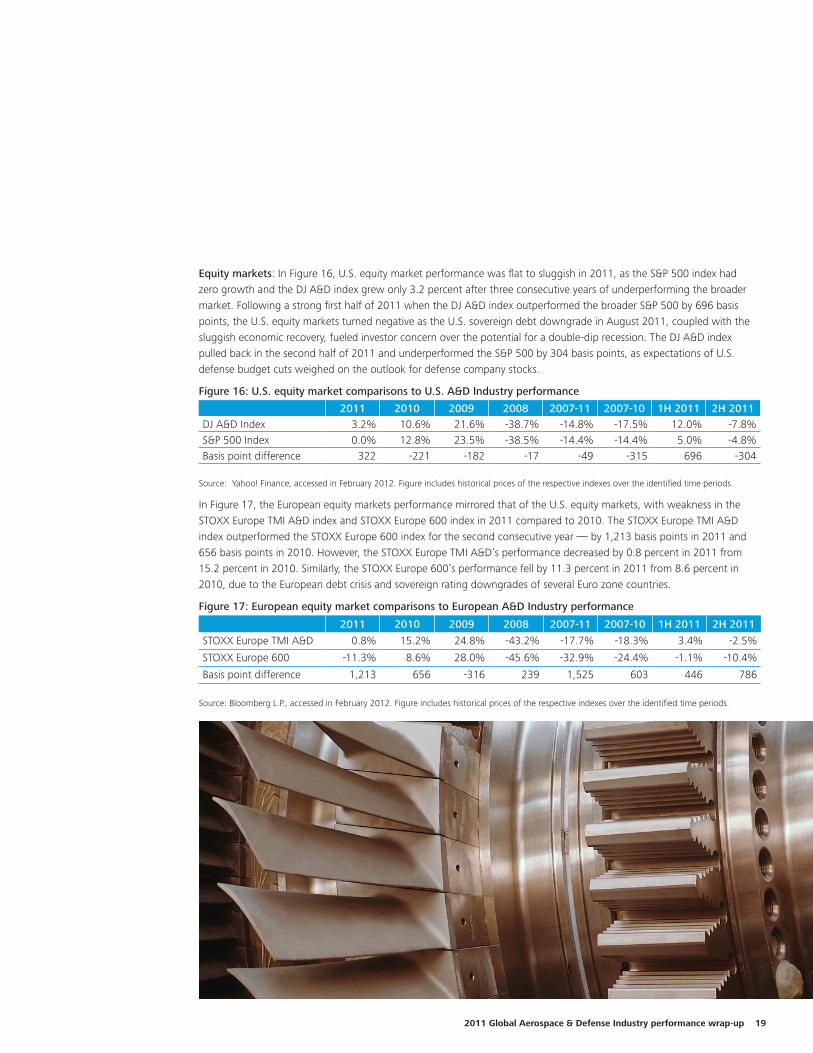
Equity markets: In Figure 16, U.S. equity market performance was flat to sluggish in 2011, as the S&P 500 index had zero growth and the DJ A&D index grew only 3.2 percent after three consecutive years of underperforming the broader market. Following a strong first half of 2011 when the DJ A&D index outperformed the broader S&P 500 by 696 basis points, the U.S. equity markets turned negative as the U.S. sovereign debt downgrade in August 2011, coupled with the sluggish economic recovery, fueled investor concern over the potential for a double-dip recession. The DJ A&D index pulled back in the second half of 2011 and underperformed the S&P 500 by 304 basis points, as expectations of U.S. defense budget cuts weighed on the outlook for defense company stocks.
Figure 16: U.S. equity market comparisons to U.S. A&D Industry performance
2011 2010 2009 2008 2007-11 2007-10 1H 2011 2H 2011DJ A&D Index 3.2% 10.6% 21.6% -38.7% -14.8% -17.5% 12.0% -7.8%S&P 500 Index 0.0% 12.8% 23.5% -38.5% -14.4% -14.4% 5.0% -4.8%Basis point difference 322 -221 -182 -17 -49 -315 696 -304
Source: Yahoo! Finance, accessed in February 2012. Figure includes historical prices of the respective indexes over the identified time periods.
In Figure 17, the European equity markets performance mirrored that of the U.S. equity markets, with weakness in the STOXX Europe TMI A&D index and STOXX Europe 600 index in 2011 compared to 2010. The STOXX Europe TMI A&D index outperformed the STOXX Europe 600 index for the second consecutive year — by 1,213 basis points in 2011 and 656 basis points in 2010. However, the STOXX Europe TMI A&D’s performance decreased by 0.8 percent in 2011 from 15.2 percent in 2010. Similarly, the STOXX Europe 600’s performance fell by 11.3 percent in 2011 from 8.6 percent in 2010, due to the European debt crisis and sovereign rating downgrades of several Euro zone countries.
Figure 17: European equity market comparisons to European A&D Industry performance
2011 2010 2009 2008 2007-11 2007-10 1H 2011 2H 2011
STOXX Europe TMI A&D 0.8% 15.2% 24.8% -43.2% -17.7% -18.3% 3.4% -2.5%
STOXX Europe 600 -11.3% 8.6% 28.0% -45.6% -32.9% -24.4% -1.1% -10.4%
Basis point difference 1,213 656 -316 239 1,525 603 446 786
Source: Bloomberg L.P., accessed in February 2012. Figure includes historical prices of the respective indexes over the identified time periods.
20
U.S. versus European companies Global regional divergence in the 2011 performance of A&D companies is indicative of different incentives, management philosophies, and work force practices in the U.S. and Europe. Other than book-to-bill and employment growth, U.S. companies outperformed European peers across all of the financial performance categories. Generally, this was consistent when comparing U.S. A&D firms with European peers as outlined in the 2009 and 2010 Global Aerospace & Defense Industry performance wrap-up reports83.
As mentioned earlier, the following analysis of U.S. compared to European companies uses the constant conversion approach to eliminate the effect of any foreign currency fluctuations from year to year.
A&D companies headquartered in the U.S. accounted for 60.2 percent, or US$410.2 billion, of the global Industry’s US$681 billion 2011 revenue. European companies accounted for 34 percent, or US$228.3 billion, of the 2011 Industry revenue. Companies from other countries including Japan, Israel, Canada, Brazil, Singapore, and South Korea accounted for the remainder of the revenue reported in the study.
Revenue: U.S. companies’ revenue increased 3.3 percent, while European companies’ revenue grew 0.8 percent in 2011. The A&D commercial aircraft segment drove growth both in Europe and the U.S., while defense companies recorded lower revenue compared to their commercial counterparts.
As discussed above, Boeing led all U.S. companies in total revenue and some of that is attributable to the growth in the commercial aircraft business, while aerostructures company Triumph Group’s revenue increased the fastest at 124.4 percent driven by a US$1.6 billion increase in revenue to US$2.9 billion mainly due to the Vought acquisition in 201084 85. Another significant performer was GE Aviation, which saw revenue growth of 7.0 percent, or US$1.2 billion, to US$18.9 billion on higher volume and prices primarily driven by increased services and equipment sales86. Northrop
83 Deloitte Development LLC, “2010 Global Aerospace & Defense Industry Performance Wrap-up,” 7 July 2011; Deloitte Development LLC, “2009 Global Aerospace & Defense Industry Performance Wrap-up,” 11 May 2010.84 Boeing, 2011 10-K, 9 February 2012.85 Triumph Group, 2011 10-K, 29 May 2012.86 GE, 2011 10-K, 24 February 2012.
Grumman’s revenue decreased 6.2 percent, adjusted YoY for its divestitures, mostly due to lower sales volume on space and manned aircraft programs in its Aerospace Systems segment and lower sales volume in Land and Self Protection Systems in the Electronic Systems segment87.
EADS, also discussed above, contributed 30.0 percent of total European Industry revenue in 2011 due to increased aircraft production and orders88. In addition to strong revenue growth at Babcock International, as highlighted earlier, Safran’s revenue increased 5.7 percent, driven by higher OEM volumes and improved aftermarket trends in its Aerospace and Security business89. Although 68.0 percent of European A&D companies generated incremental revenue growth in 2011, cumulative revenue at BAE Systems, Finmeccanica, and Dassault Aviation decreased US$8.3 billion in 2011, muting the region’s growth. Coupled with the declines of Finmeccanica and BAE Systems mentioned above, Dassault Aviation’s revenue decreased 21.1 percent due to a reduction in new aircraft deliveries to 63 from 95 in 201090.
Operating earnings/Operating margin: U.S. companies’ reported operating earnings performance increased by 2.9 percent, and reported operating margin remained flat at 10.5 percent. Yet, this increase was offset as U.S. companies recorded one-time A&D related company charges of US$1.9 billion in 2011 versus US$1.1 billion in 2010. Excluding one-time A&D related company charges, the U.S. Industry’s core operating earnings grew by 4.6 percent and core operating margin expanded by 14 bps in 2011.
In addition to Boeing and Lockheed Martin recording the highest operating earnings as discussed earlier, Northrop Grumman’s operating earnings increased by 15.9 percent or US$449 million to US$3.3 billion in 2011, as the company
87 Northrop Grumman, 2011 10-K, 8 February 2012.88 EADS, Fourth quarter and full year press release, http://www.google.co.in/url?sa=t&rct=j&q=eads%202011%20press%20release&source=web&cd=1&ved=0CFwQFjAA&url=http%3A%2F%2Fwww.eads.com%2Fdms%2FPress-DB%2FEADS%2FFinancial_Communication%2F2012%2FMarch%2FIncreasing-Growth-Momentum--EADS-Reports-Full-Year-Results-2011%2FPDF-APC-2012%2FEADS-FY-2011-Results---en%2FEADS%2520FY%25202011%2520Results%2520-%2520en.pdf&ei=6RvHT_THKIrprAffp9W8Dg&usg=AFQjCNGGXgtTssyR97TNhQ6gA9gDFaFMMg (24 April 2012).89 Safran, Registration document, http://www.safran-group.com/IMG/pdf/SAFRAN_RA_2011_GB_-3.pdf (24 April 2012).90 Dassault Aviation, Annual report, http://www.dassault-aviation.com/fileadmin/user_upload/redacteur/finance/publications_2012/VA_2011.pdf (accessed 24 April 2012).
2011 Global Aerospace & Defense Industry performance wrap-up 21
benefitted from higher profits across each segment as well as a net pension adjustment of US$400 million91.
The European companies recorded a more pronounced drop in reported operating earnings and operating margin than their U.S. counterparts in 2011. Collectively, the reported operating earnings of the European companies decreased 21.6 percent and the reported operating margin contracted by 133 bps to 4.7 percent in 2011. European companies as a whole recorded non-recurring A&D related company charges of US$3.0 billion in 2011 versus US$1.1 billion in 2010 primarily associated with Finmeccanica’s 2011 US$2.1 billion charge discussed above. Excluding one-time charges, the European Industry’s core operating earnings decreased by 7.1 percent and core operating margin contracted 51 bps in 2011. Higher sales in Airbus Commercial and Eurocopter drove strong operating earnings improvement at EADS92. Other companies such as SAAB recorded improved operating margin partly due to one-time gains in 201193. Thales operating earnings benefitted from strong improvement across all Defense & Security divisions as well as the absence of charges discussed earlier94.
Return on invested capital (ROIC): U.S. companies’ reported ROIC improved 82 basis points to 20.7 percent in 2011. As mentioned earlier, Boeing, with a weighted average contribution of 17.0 percent to the total U.S. group, achieved the highest ROIC95. Lockheed Martin also posted significant ROIC growth of 882 bps to 42.5 percent in 2011, up from 33.7 percent in 2010.
In contrast, European companies’ ROIC fell 127 bps to 8.7 percent in 2011. Although the region underperformed the overall A&D ROIC average of 16.2 percent, EADS—European ROIC leader on a weighted revenue basis—improved by 261 bps to 8.6 percent in 201196. Other top
91 Northrop Grumman, 2011 10-K, 8 February 2012.92 EADS, Financial statements, http://www.eads.com/dms/eads/int/en/investor-relations/documents/2012/events-reports/AGM-2012/Financial-Statements-2011-Complete-EN/Financial%20Statements%202011.pdf (accessed 24 April 2012).93 SAAB, Annual report, http://www.saabgroup.com/Global/Documents%20and%20Images/About%20Saab/Investor%20relations/Financial%20reports/SAAB_AR_ENG_final_120313.pdf (accessed 24 April 2012).94 Thales, Financial statements, http://cms.thalesgroup.com/Workarea/DownloadAsset.aspx?id=6442451499&LangType=2057 (24 April 2012).95 The Boeing Company, 201110-K, 9 February 2012.96 EADS, Financial statements, http://www.eads.com/dms/eads/int/en/investor-relations/documents/2012/events-reports/AGM-2012/Financial-Statements-2011-Complete-EN/Financial%20Statements%202011.pdf (accessed 24 April 2012).
European ROIC companies included BAE Systems at 17.9 percent and Rolls-Royce at 18.6 percent both above the Industry average. Only two European companies in the study — ThyssenKrupp and Finmeccanica — recorded negative ROIC in 2011 due to net losses97 98.
Free cash flow (FCF)/Free cash margin (FCM): U.S. companies outperformed their European counterparts in terms of FCF and FCM, despite a slight decline in the U.S. group’s FCF in 2011. The U.S. companies’ FCF of US$34.1 billion (0.7 percent decline YoY) was a stark contrast to the European group’s FCF of US$9.8 billion (43.4 percent decline YoY), with similar results for FCM at 6.2 percent (5 bps decline YoY) and 3.5 percent (270 bps decline YoY) for the U.S. Industry and the European Industry, respectively.
Book-to-bill (BTB): Boeing’s ongoing BTB improvement, up 39 percent to 1.50x, helped to drive the 2011 U.S. BTB to 1.10x in 2011. Excluding Boeing, the U.S. group posted 2011 BTB of 1.01x, lower than overall U.S. BTB and minimally above the benchmark of the 1.00x threshold for future revenue replacement.
The European Industry BTB ratio of 1.75x (24.1 percent growth YoY) outperformed the U.S. Industry in 2011. The 2011 European performance was largely derived from EADS’ very significant BTB of 2.88x driven by historic order levels99. Excluding EADS, the European group BTB was 1.20x, 31 percent below the overall group BTB in 2011.
Employment productivity: Overall Industry employment increased 2.3 percent in 2011 as compared to 2010. U.S. companies registered a modest increase in the level of employment of 0.9 percent to 1,295,533 in 2011, while the European companies recorded an increase of 4.6 percent to 669,984 (+29,437) in 2011. Employment in regions other than U.S. and Europe grew by 3.9 percent to 138,408 in 2011.
97 ThyssenKrupp, Annual report, http://www.thyssenkrupp.com/documents/investor/Finanzberichte/eng/ThyssenKrupp_2010_2011_AR.pdf (accessed 24 April 2012).98 Finmeccanica, Financial statements, http://www.finmeccanica.com/EN/Common/files/Corporate/Bilanci_Presentazioni/Bilanci_e_Presentazioni_2012/Bilanci_2011_final/BILANCIO_CONSOLIDATO_2011_ENG.pdf (accessed 24 April 2012).99 EADS, Results presentation, http://www.google.co.in/url?sa=t&rct=j&q=eads%202011%20results%20presentation%20&source=web&cd=3&ved=0CE8QFjAC&url=http%3A%2F%2Fwww.eads.com%2Fdms%2Feads%2Fint%2Fen%2Fpress%2Fdocuments%2FAPC%2FEADS_FY2011-Annual-Results.pdf&ei=BIrIT_mEBojlrAej-uycDg&usg=AFQjCNGIzZNuVVX9JwRW-gXhRLW762E8og&cad=rja (accessed 16 April 2012).
22
U.S. companies’ reported operating earnings per employee continued to outpace European counterparts. Of the U.S. companies, 60.0 percent achieved positive operating earnings per employee growth in 2011 YoY compared to 53.0 percent of European companies. Reported profit per employee decreased by 25.0 percent to US$15,926 in Europe for 2011, compared to a 1.9 percent increase for the U.S. companies to US$33,264. Core operating earnings per employee for U.S. companies increased 3.7 percent to US$34,721, while European companies fell 11.2 percent to US$20,362.
Commercial versus defense segmentAlthough the global A&D Industry revenue in total grew by 2.3 percent in 2011, all of that growth and more was attributable to increased production levels of large commercial aircraft. Demand for production is being driven by lightweight aircraft requiring less maintenance and more fuel-efficient jet engines that reduce the fuel costs for airlines. Also, sales of new aircraft are being driven by increasing travel demand, especially in geographies such as China, India, Brazil, and the Middle East, where more people can afford to travel for business and leisure.
On the other hand, global defense revenues decreased in 2011, primarily due to affordability, competing domestic priorities, weak economies in the western world, and the drawdown of forces in Iraq and Afghanistan. The U.S. is the largest defense marketplace globally, accounting for a major portion of defense spending, and is undergoing a cyclical downturn, starting with an announced US$487 billion defense budget cut over the next 10 years, followed by potentially another US$500 billion sequestration driven defense budget cut100.
Employee productivity as measured by operating earnings per employee, although down for the entire global Industry, were improved for commercial aerospace and decreased for the defense segment.
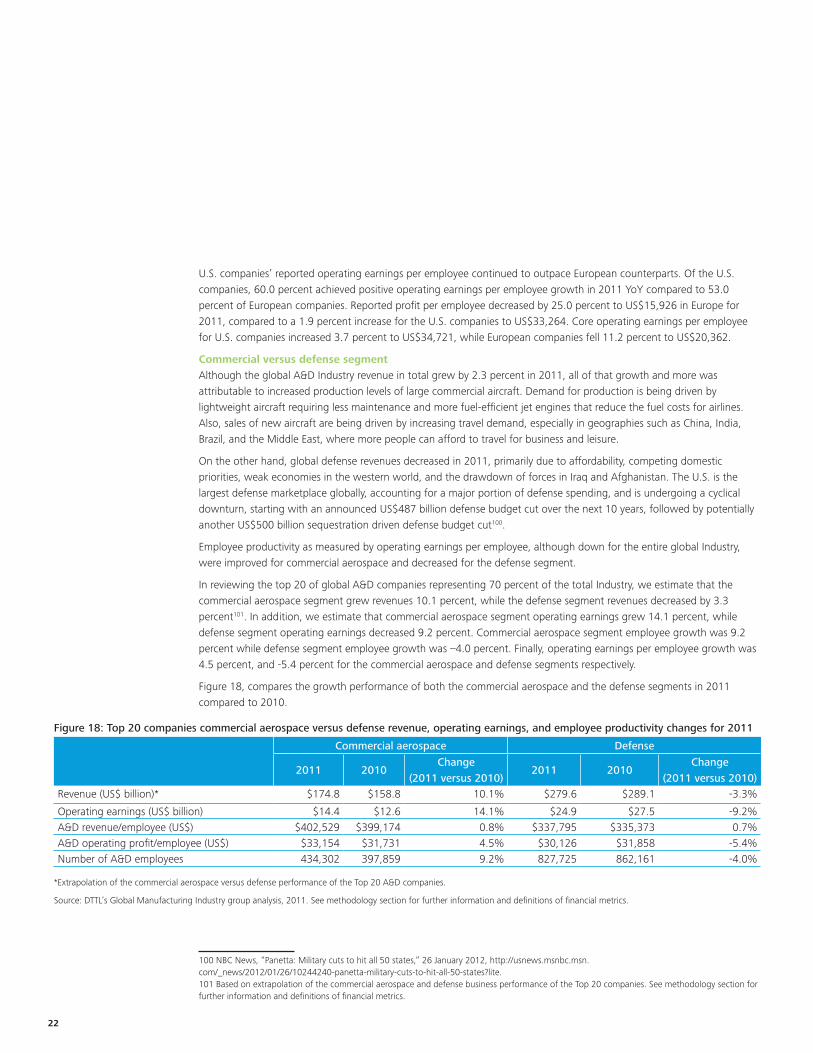
In reviewing the top 20 of global A&D companies representing 70 percent of the total Industry, we estimate that the commercial aerospace segment grew revenues 10.1 percent, while the defense segment revenues decreased by 3.3 percent101. In addition, we estimate that commercial aerospace segment operating earnings grew 14.1 percent, while defense segment operating earnings decreased 9.2 percent. Commercial aerospace segment employee growth was 9.2 percent while defense segment employee growth was –4.0 percent. Finally, operating earnings per employee growth was 4.5 percent, and -5.4 percent for the commercial aerospace and defense segments respectively.
Figure 18, compares the growth performance of both the commercial aerospace and the defense segments in 2011 compared to 2010.
100 NBC News, “Panetta: Military cuts to hit all 50 states,” 26 January 2012, http://usnews.msnbc.msn.com/_news/2012/01/26/10244240-panetta-military-cuts-to-hit-all-50-states?lite.101 Based on extrapolation of the commercial aerospace and defense business performance of the Top 20 companies. See methodology section for further information and definitions of financial metrics.
Figure 18: Top 20 companies commercial aerospace versus defense revenue, operating earnings, and employee productivity changes for 2011
Commercial aerospace Defense
2011 2010Change
(2011 versus 2010)2011 2010
Change (2011 versus 2010)
Revenue (US$ billion)* $174.8 $158.8 10.1% $279.6 $289.1 -3.3%
Operating earnings (US$ billion) $14.4 $12.6 14.1% $24.9 $27.5 -9.2%A&D revenue/employee (US$) $402,529 $399,174 0.8% $337,795 $335,373 0.7%A&D operating profit/employee (US$) $33,154 $31,731 4.5% $30,126 $31,858 -5.4%Number of A&D employees 434,302 397,859 9.2% 827,725 862,161 -4.0%
*Extrapolation of the commercial aerospace versus defense performance of the Top 20 A&D companies.
Source: DTTL’s Global Manufacturing Industry group analysis, 2011. See methodology section for further information and definitions of financial metrics.
2011 Global Aerospace & Defense Industry performance wrap-up 23
Subsector performanceOEM and supplier companiesThe 2011 OEM subsector revenue reported in this year’s study increased marginally by 0.1 percent to US$335.0 billion, up from US$334.5 billion in 2010, well below the overall Industry revenue growth of 2.3 percent (see Figures 23 and 22). Boeing and EADS contributed significant revenue growth compared to the Industry, while others, particularly those companies in the defense sector, weighed more heavily on the OEM group average. Driven by strength in commercial aircraft, the Tier one, two, and three supplier subsectors each reported positive revenue growth, which exceeded that of the overall Industry. In Figure 19, tier three suppliers’ revenue grew by 29.1 percent compared to Tier two at 11.1 percent and Tier one at 5.1 percent. Aerostructures revenue grew by 9.8 percent—also faster than the Industry average of 2.3 percent—in 2011. Meanwhile, the defense electronics subsector underperformed Industry revenue growth, contracting 2.4 percent in 2011, due to tightened defense spending, particularly in the United States (see Figure 19).
The OEM subsector reported operating earnings increased 2.5 percent to US$25.5 billion in 2011 from US$24.9 billion in 2010, outperforming the 3.1 percent decrease in average Industry earnings (see Figures 23 and 21), due to strength in commercial aircraft which more than offset weakness in defense. In Figure 20, OEM core operating earnings increased by 4.2 percent in 2011, above the Industry core average of 1.2 percent. Defense electronics companies were hardest hit among the Industry subsectors with a 2011 reported operating earnings decrease of 67.5 percent (see Figure 19), largely the result of losses at Finmeccanica due to defense program cuts and non-recurring write-offs as mentioned earlier102. Defense electronics 2011 core operating earnings strengthened somewhat, but remained in negative territory at -40.4 percent in 2011 (see Figure 20), suggesting the impact of a slowdown in defense spending on company profitability.
The Industry average for reported operating margin declined 5.3 percent, or 46 bps to 8.2 percent, skewed by negative performance in defense electronics, which fell by 66.7 percent, or 648 bps, in 2011 (see Figure 19). The Industry core operating margin declined 9 bps to 8.9 percent in 2011, with defense 102 Finmeccanica, Financial statements, http://www.finmeccanica.com/EN/Common/files/Corporate/Bilanci_Presentazioni/Bilanci_e_Presentazioni_2012/Bilanci_2011_final/BILANCIO_CONSOLIDATO_2011_ENG.pdf (accessed 24 April 2012).
electronics decreasing 413 bps to 6.5 percent from 2010 (see figure 20). Tier two recorded the highest reported and core operating margin among the Industry subsectors at 14.2 percent (see Figure 21) largely due to strong operating margin at Transdigm Group, FLIR Government Systems, and Precision Castparts in 2011.
In Figure 19, reported ROIC performance for the OEM subsector rose 11.9 percent, or 236 bps (239 bps core), in 2011, higher than reported Industry average growth of 1.0 percent, or 15 bps (71 bps core). Tier three suppliers and aerostructures also showed improved reported ROIC growth of 15.3 percent or 119 bps (151 bps core) and 32.7 percent or 190 bps (233 bps percent core), respectively, offset by an 82.9 percent decrease in defense electronics reported ROIC growth or a 923 bps decline (509 bps core decline) in 2011 (see Figure 19).
OEM total FCF decreased 31.6 percent to US$12.2 billion in 2011 from US$17.8 billion in 2010 as compared to an Industry FCF decline of 13.3 percent (see Figures 19, 21 and 23). The OEM group recorded a 27.3 percent decline in FCM growth compared to an 18.7 percent decline for the overall Industry (see Figure 19). Lower OEM FCFs were largely attributed to EADS, BAE Systems, and Bombardier. Mitsubishi Heavy Industries and Kawasaki Heavy Industries were large contributors to the Aerostructures subsector posting the top FCF and FCM among the Industry subsectors with growth of 270.1 percent and 360.8 percent, respectively (see Figure 19).
The OEM average BTB in 2011 was 1.46x versus 1.32x for the Industry. In Figure 19, the BTB ratio for OEMs increased by 24.1 percent in 2011, as compared to the average Industry growth rate of 17.4 percent. Boeing’s and EADS’ impact on the BTB ratio for the subsector was significant given the relatively high-revenue weighting and strong individual BTB performance improvement of these two companies. Aerostructures achieved 43.4 percent BTB growth in 2011(see Figure 19), highest percentage increase among the subsectors due to increased bookings at Triumph Group, Ducommun, and Spirit Aerosystems. The defense electronics subsector BTB ratio decreased by 6.7 percent to 0.97x in 2011(see Figure 19), due to lower BTB ratios at Finmeccanica and L-3 Communications.
24
Services focused companiesServices companies’ revenue grew by 3.7 percent to US$62.7 billion (see Figures 19 and 21), exceeding total Industry growth of 2.3 percent, driven by the contribution of larger services companies such as Babcock International, AAR, and CACI. In particular, government services companies tend to be a “people” focused business, charging labor hours, which is highly competitive, and results in lower margins typically. Similar to last year, services companies registered lower reported operating earnings growth performance than the reported Industry average, -20.9 percent versus -5.3 percent (see Figure 19), likely due to commoditization and labor-intensive dynamics. Overall, 68.0 percent of services companies reported positive operating earnings growth in 2011. However, operating earnings declines at Delta Tucker (-92.8 percent), and SAIC (-67.2 percent) negatively skewed the services subsector 2011 operating earnings growth103 104 105. Reported ROIC for the services subsector was 8.9 percent in 2011, off 30.5 percent (a 391 bps decline) from 2010 (see Figures 21 and 23), however higher than Industry average growth of 1.0 percent or 15 bps (71 bps core). Despite the decline, only URS posted negative ROIC of 6.7 percent among companies in the subsector in 2011. Services FCF fell 5.5 percent to US$5,413 million in 2011 from US$5,679 million in 2010 (see Figures 21 and 23). A 1.12x BTB ratio was marginally higher than the 1.08x reported in 2010 and above the Industry benchmark of 1x, but still below the overall Industry rate of 1.32x in 2011.
Summary: The following charts compare and contrast the reported and core growth rate for each of the key performance metrics used in this study.
103 SAIC, 2011 10-K, 27 March 2012.104 Delta Tucker, 2011 10-K, 9 April 2012.105 URS Corporation, 2011 10-K, 27 February 2012.
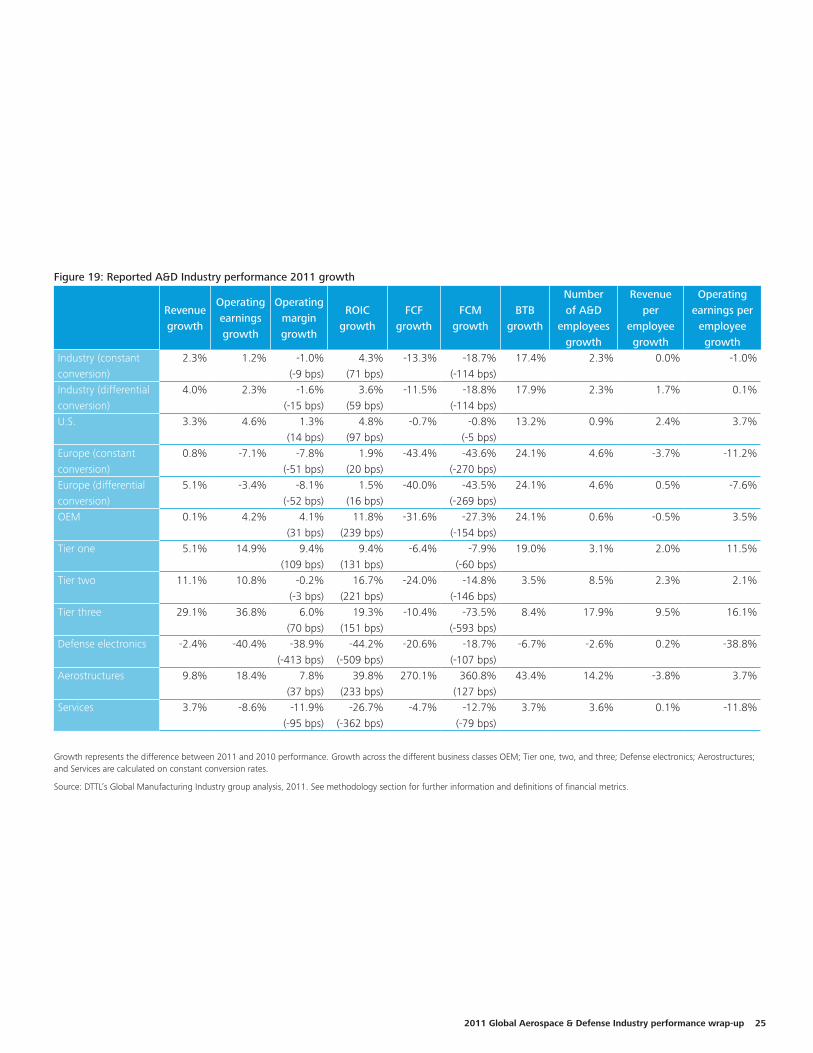
2011 Global Aerospace & Defense Industry performance wrap-up 25
Figure 19: Reported A&D Industry performance 2011 growth
Revenue growth
Operating earnings growth
Operating margin growth
ROIC growth
FCF growth
FCM growth
BTB growth
Number of A&D
employees growth
Revenue per
employee growth
Operating earnings per
employee growth
Industry (constant conversion)
2.3% 1.2% -1.0% (-9 bps)
4.3% (71 bps)
-13.3% -18.7% (-114 bps)
17.4% 2.3% 0.0% -1.0%
Industry (differential conversion)
4.0% 2.3% -1.6% (-15 bps)
3.6% (59 bps)
-11.5% -18.8% (-114 bps)
17.9% 2.3% 1.7% 0.1%
U.S. 3.3% 4.6% 1.3% (14 bps)
4.8% (97 bps)
-0.7% -0.8% (-5 bps)
13.2% 0.9% 2.4% 3.7%
Europe (constant conversion)
0.8% -7.1% -7.8% (-51 bps)
1.9% (20 bps)
-43.4% -43.6% (-270 bps)
24.1% 4.6% -3.7% -11.2%
Europe (differential conversion)
5.1% -3.4% -8.1% (-52 bps)
1.5% (16 bps)
-40.0% -43.5% (-269 bps)
24.1% 4.6% 0.5% -7.6%
OEM 0.1% 4.2% 4.1% (31 bps)
11.8% (239 bps)
-31.6% -27.3% (-154 bps)
24.1% 0.6% -0.5% 3.5%
Tier one 5.1% 14.9% 9.4% (109 bps)
9.4% (131 bps)
-6.4% -7.9% (-60 bps)
19.0% 3.1% 2.0% 11.5%
Tier two 11.1% 10.8% -0.2% (-3 bps)
16.7% (221 bps)
-24.0% -14.8% (-146 bps)
3.5% 8.5% 2.3% 2.1%
Tier three 29.1% 36.8% 6.0% (70 bps)
19.3% (151 bps)
-10.4% -73.5% (-593 bps)
8.4% 17.9% 9.5% 16.1%
Defense electronics -2.4% -40.4% -38.9% (-413 bps)
-44.2% (-509 bps)
-20.6% -18.7% (-107 bps)
-6.7% -2.6% 0.2% -38.8%
Aerostructures 9.8% 18.4% 7.8% (37 bps)
39.8% (233 bps)
270.1% 360.8% (127 bps)
43.4% 14.2% -3.8% 3.7%
Services 3.7% -8.6% -11.9% (-95 bps)
-26.7% (-362 bps)
-4.7% -12.7% (-79 bps)
3.7% 3.6% 0.1% -11.8%
Growth represents the difference between 2011 and 2010 performance. Growth across the different business classes OEM; Tier one, two, and three; Defense electronics; Aerostructures; and Services are calculated on constant conversion rates.
Source: DTTL’s Global Manufacturing Industry group analysis, 2011. See methodology section for further information and definitions of financial metrics.
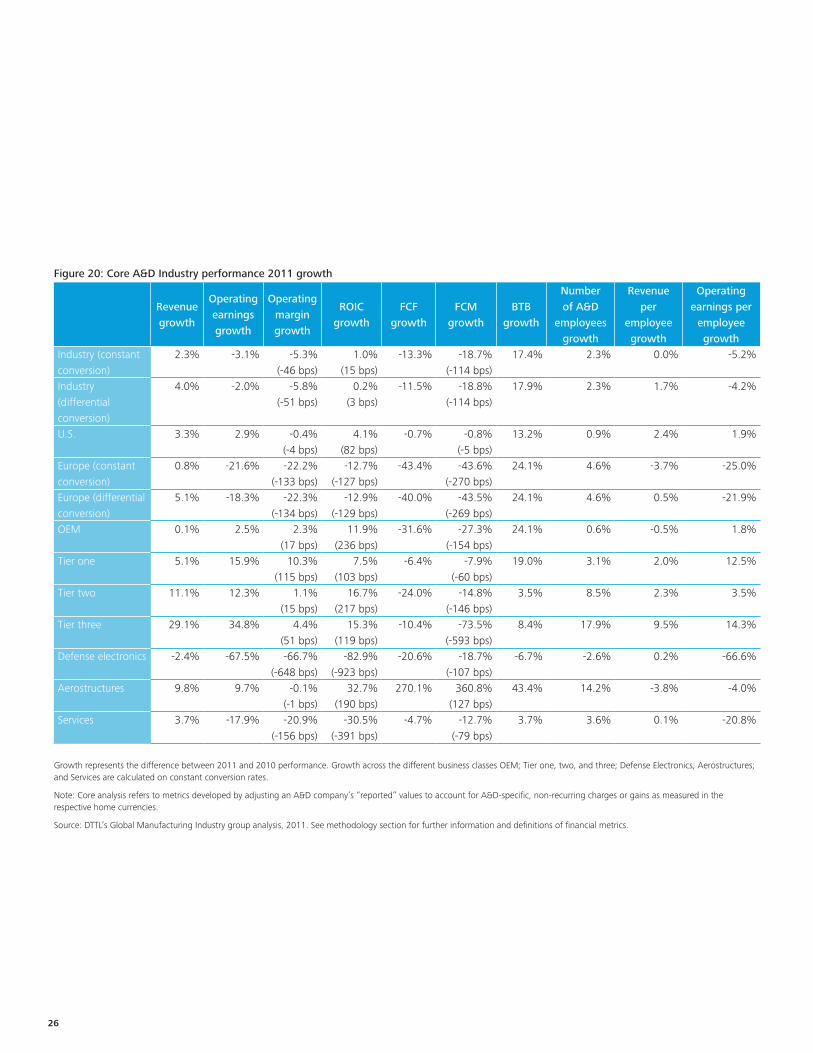
26
Figure 20: Core A&D Industry performance 2011 growth
Revenue growth
Operating earnings growth
Operating margin growth
ROIC growth
FCF growth
FCM growth
BTB growth
Number of A&D
employees growth
Revenue per
employee growth
Operating earnings per
employee growth
Industry (constant conversion)
2.3% -3.1% -5.3% (-46 bps)
1.0% (15 bps)
-13.3% -18.7% (-114 bps)
17.4% 2.3% 0.0% -5.2%
Industry (differential conversion)
4.0% -2.0% -5.8% (-51 bps)
0.2% (3 bps)
-11.5% -18.8% (-114 bps)
17.9% 2.3% 1.7% -4.2%
U.S. 3.3% 2.9% -0.4% (-4 bps)
4.1% (82 bps)
-0.7% -0.8% (-5 bps)
13.2% 0.9% 2.4% 1.9%
Europe (constant conversion)
0.8% -21.6% -22.2% (-133 bps)
-12.7% (-127 bps)
-43.4% -43.6% (-270 bps)
24.1% 4.6% -3.7% -25.0%
Europe (differential conversion)
5.1% -18.3% -22.3% (-134 bps)
-12.9% (-129 bps)
-40.0% -43.5% (-269 bps)
24.1% 4.6% 0.5% -21.9%
OEM 0.1% 2.5% 2.3% (17 bps)
11.9% (236 bps)
-31.6% -27.3% (-154 bps)
24.1% 0.6% -0.5% 1.8%
Tier one 5.1% 15.9% 10.3% (115 bps)
7.5% (103 bps)
-6.4% -7.9% (-60 bps)
19.0% 3.1% 2.0% 12.5%
Tier two 11.1% 12.3% 1.1% (15 bps)
16.7% (217 bps)
-24.0% -14.8% (-146 bps)
3.5% 8.5% 2.3% 3.5%
Tier three 29.1% 34.8% 4.4% (51 bps)
15.3% (119 bps)
-10.4% -73.5% (-593 bps)
8.4% 17.9% 9.5% 14.3%
Defense electronics -2.4% -67.5% -66.7% (-648 bps)
-82.9% (-923 bps)
-20.6% -18.7% (-107 bps)
-6.7% -2.6% 0.2% -66.6%
Aerostructures 9.8% 9.7% -0.1% (-1 bps)
32.7% (190 bps)
270.1% 360.8% (127 bps)
43.4% 14.2% -3.8% -4.0%
Services 3.7% -17.9% -20.9% (-156 bps)
-30.5% (-391 bps)
-4.7% -12.7% (-79 bps)
3.7% 3.6% 0.1% -20.8%
Growth represents the difference between 2011 and 2010 performance. Growth across the different business classes OEM; Tier one, two, and three; Defense Electronics; Aerostructures; and Services are calculated on constant conversion rates.
Note: Core analysis refers to metrics developed by adjusting an A&D company’s “reported” values to account for A&D-specific, non-recurring charges or gains as measured in the respective home currencies.
Source: DTTL’s Global Manufacturing Industry group analysis, 2011. See methodology section for further information and definitions of financial metrics.
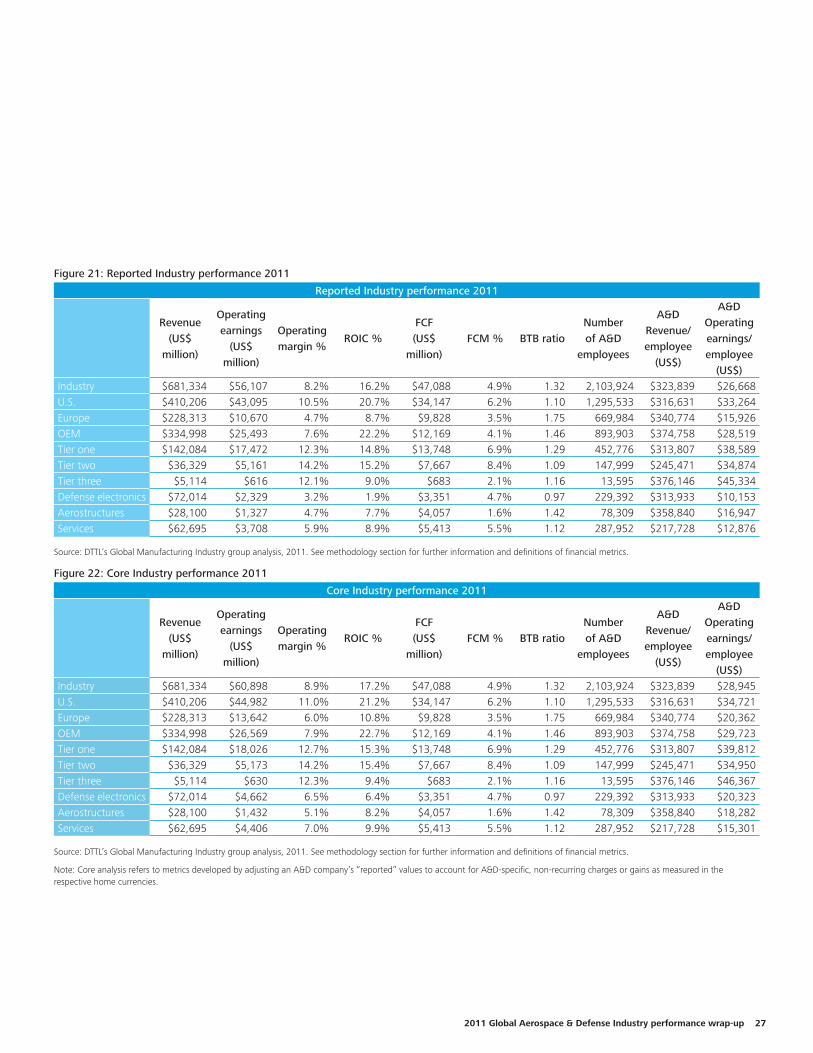
2011 Global Aerospace & Defense Industry performance wrap-up 27
Figure 21: Reported Industry performance 2011
Reported Industry performance 2011
Revenue
(US$ million)
Operating earnings
(US$ million)
Operating margin %
ROIC %FCF (US$
million)FCM % BTB ratio
Number of A&D
employees
A&D Revenue/ employee
(US$)
A&D Operating earnings/ employee
(US$)Industry $681,334 $56,107 8.2% 16.2% $47,088 4.9% 1.32 2,103,924 $323,839 $26,668U.S. $410,206 $43,095 10.5% 20.7% $34,147 6.2% 1.10 1,295,533 $316,631 $33,264Europe $228,313 $10,670 4.7% 8.7% $9,828 3.5% 1.75 669,984 $340,774 $15,926OEM $334,998 $25,493 7.6% 22.2% $12,169 4.1% 1.46 893,903 $374,758 $28,519Tier one $142,084 $17,472 12.3% 14.8% $13,748 6.9% 1.29 452,776 $313,807 $38,589Tier two $36,329 $5,161 14.2% 15.2% $7,667 8.4% 1.09 147,999 $245,471 $34,874Tier three $5,114 $616 12.1% 9.0% $683 2.1% 1.16 13,595 $376,146 $45,334Defense electronics $72,014 $2,329 3.2% 1.9% $3,351 4.7% 0.97 229,392 $313,933 $10,153Aerostructures $28,100 $1,327 4.7% 7.7% $4,057 1.6% 1.42 78,309 $358,840 $16,947Services $62,695 $3,708 5.9% 8.9% $5,413 5.5% 1.12 287,952 $217,728 $12,876
Source: DTTL’s Global Manufacturing Industry group analysis, 2011. See methodology section for further information and definitions of financial metrics.
Figure 22: Core Industry performance 2011
Core Industry performance 2011
Revenue
(US$ million)
Operating earnings
(US$ million)
Operating margin %
ROIC %FCF (US$
million)FCM % BTB ratio
Number of A&D
employees
A&D Revenue/ employee
(US$)
A&D Operating earnings/ employee
(US$)Industry $681,334 $60,898 8.9% 17.2% $47,088 4.9% 1.32 2,103,924 $323,839 $28,945U.S. $410,206 $44,982 11.0% 21.2% $34,147 6.2% 1.10 1,295,533 $316,631 $34,721Europe $228,313 $13,642 6.0% 10.8% $9,828 3.5% 1.75 669,984 $340,774 $20,362OEM $334,998 $26,569 7.9% 22.7% $12,169 4.1% 1.46 893,903 $374,758 $29,723Tier one $142,084 $18,026 12.7% 15.3% $13,748 6.9% 1.29 452,776 $313,807 $39,812Tier two $36,329 $5,173 14.2% 15.4% $7,667 8.4% 1.09 147,999 $245,471 $34,950Tier three $5,114 $630 12.3% 9.4% $683 2.1% 1.16 13,595 $376,146 $46,367Defense electronics $72,014 $4,662 6.5% 6.4% $3,351 4.7% 0.97 229,392 $313,933 $20,323Aerostructures $28,100 $1,432 5.1% 8.2% $4,057 1.6% 1.42 78,309 $358,840 $18,282Services $62,695 $4,406 7.0% 9.9% $5,413 5.5% 1.12 287,952 $217,728 $15,301
Source: DTTL’s Global Manufacturing Industry group analysis, 2011. See methodology section for further information and definitions of financial metrics.
Note: Core analysis refers to metrics developed by adjusting an A&D company’s “reported” values to account for A&D-specific, non-recurring charges or gains as measured in the respective home currencies.
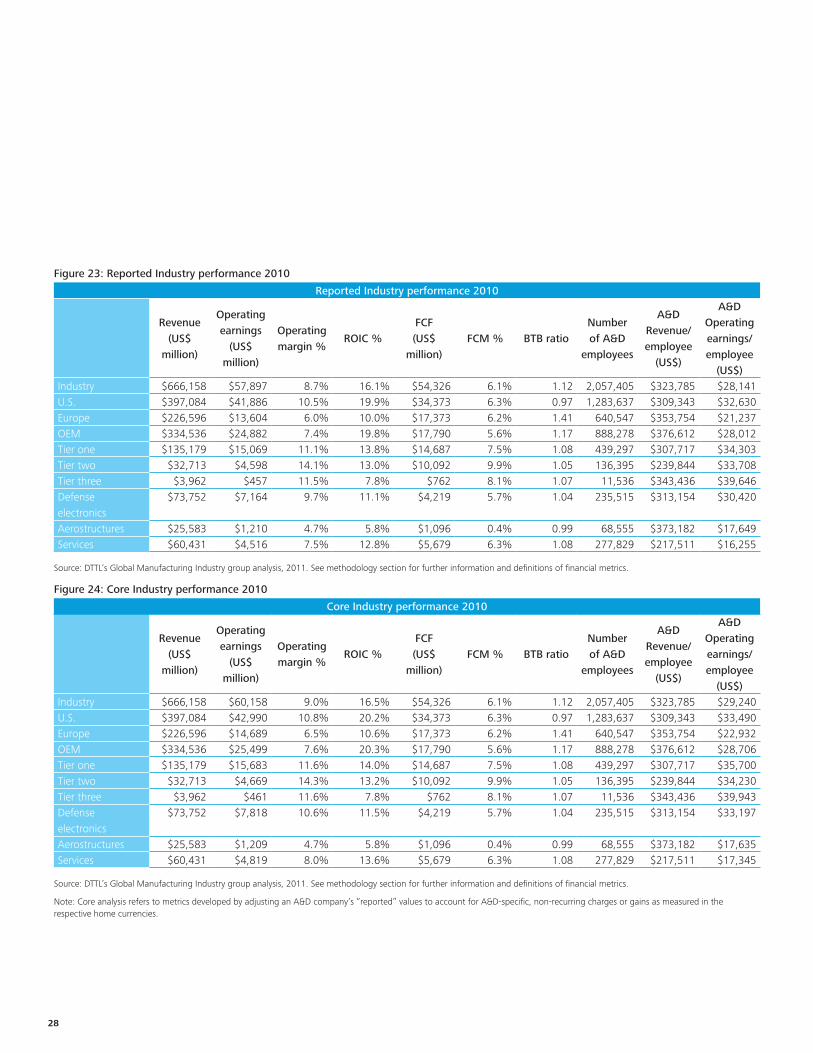
28
Figure 23: Reported Industry performance 2010
Reported Industry performance 2010
Revenue
(US$ million)
Operating earnings
(US$ million)
Operating margin %
ROIC %FCF (US$
million)FCM % BTB ratio
Number of A&D
employees
A&D Revenue/ employee
(US$)
A&D Operating earnings/ employee
(US$)Industry $666,158 $57,897 8.7% 16.1% $54,326 6.1% 1.12 2,057,405 $323,785 $28,141U.S. $397,084 $41,886 10.5% 19.9% $34,373 6.3% 0.97 1,283,637 $309,343 $32,630Europe $226,596 $13,604 6.0% 10.0% $17,373 6.2% 1.41 640,547 $353,754 $21,237OEM $334,536 $24,882 7.4% 19.8% $17,790 5.6% 1.17 888,278 $376,612 $28,012Tier one $135,179 $15,069 11.1% 13.8% $14,687 7.5% 1.08 439,297 $307,717 $34,303Tier two $32,713 $4,598 14.1% 13.0% $10,092 9.9% 1.05 136,395 $239,844 $33,708Tier three $3,962 $457 11.5% 7.8% $762 8.1% 1.07 11,536 $343,436 $39,646Defense electronics
$73,752 $7,164 9.7% 11.1% $4,219 5.7% 1.04 235,515 $313,154 $30,420
Aerostructures $25,583 $1,210 4.7% 5.8% $1,096 0.4% 0.99 68,555 $373,182 $17,649Services $60,431 $4,516 7.5% 12.8% $5,679 6.3% 1.08 277,829 $217,511 $16,255
Source: DTTL’s Global Manufacturing Industry group analysis, 2011. See methodology section for further information and definitions of financial metrics.
Figure 24: Core Industry performance 2010
Core Industry performance 2010
Revenue
(US$ million)
Operating earnings
(US$ million)
Operating margin %
ROIC %FCF (US$
million)FCM % BTB ratio
Number of A&D
employees
A&D Revenue/ employee
(US$)
A&D Operating earnings/ employee
(US$)Industry $666,158 $60,158 9.0% 16.5% $54,326 6.1% 1.12 2,057,405 $323,785 $29,240 U.S. $397,084 $42,990 10.8% 20.2% $34,373 6.3% 0.97 1,283,637 $309,343 $33,490 Europe $226,596 $14,689 6.5% 10.6% $17,373 6.2% 1.41 640,547 $353,754 $22,932 OEM $334,536 $25,499 7.6% 20.3% $17,790 5.6% 1.17 888,278 $376,612 $28,706 Tier one $135,179 $15,683 11.6% 14.0% $14,687 7.5% 1.08 439,297 $307,717 $35,700 Tier two $32,713 $4,669 14.3% 13.2% $10,092 9.9% 1.05 136,395 $239,844 $34,230 Tier three $3,962 $461 11.6% 7.8% $762 8.1% 1.07 11,536 $343,436 $39,943 Defense electronics
$73,752 $7,818 10.6% 11.5% $4,219 5.7% 1.04 235,515 $313,154 $33,197
Aerostructures $25,583 $1,209 4.7% 5.8% $1,096 0.4% 0.99 68,555 $373,182 $17,635 Services $60,431 $4,819 8.0% 13.6% $5,679 6.3% 1.08 277,829 $217,511 $17,345
Source: DTTL’s Global Manufacturing Industry group analysis, 2011. See methodology section for further information and definitions of financial metrics.
Note: Core analysis refers to metrics developed by adjusting an A&D company’s “reported” values to account for A&D-specific, non-recurring charges or gains as measured in the respective home currencies.
2011 Global Aerospace & Defense Industry performance wrap-up 29
Study methodologyThis analysis is based on the key financial performance metrics for 110 global A&D companies, which generated A&D revenue greater than US$500 million in 2011. By using the data from the companies’ respective 10-Ks, annual reports, and other official financial releases into the calculation framework, The DTTL Global Manufacturing Industry Group analyzed the Industry’s performance in 2011. The study used audited results for all companies, except three companies for which unaudited data was used as the audited results of such companies were not available until after the cut-off date (17th May 2012) for final stage of data collection and analysis. The study highlighted specific companies that had positive or negative impact on the Industry’s performance and also analyzed categorical performance on the basis of business types and geographical identifications. The presentation of the companies’ 2011 financial performance data is based on the companies’ respective 2011 fiscal year (ending between 1st February 2011 and 31st January 2012). Analogous treatment applies to the presentation of the companies’ 2010 financial performance data. In 2011, Bombardier changed its fiscal year from February 2010 — January 2011 to January 2011 — December 2011. Hence, its fiscal year ending December 2011 comprises 11 months of Bombardier Aerospace results. For four companies, the study took their 2010 data as 2011 results were unavailable till the cut-off date. Results for Delta Tucker are based on FY11 ending December 2011 and FY10 ending March 2010 for DynCorp International, its predecessor, as Delta Tucker does not report its results for a comparable period in 2010.
Where metrics were referenced as “reported”, the analysis included metrics using the standard methodology discussed below. Where it was referred to metrics as “core”, the analysis included metrics by adjusting their “reported” values to account for A&D-specific, non-recurring charges or gains as measured in the respective home currencies. In the study, “charges” is an umbrella term to reflect non-recurring program-related A&D related write-offs (such as cancellations, terminations), restructuring charges, asset impairment charges, acquisition-related expenses, loss on disposal of businesses, and litigation charges. Similarly, “gains” is an umbrella term to reflect non-recurring business disposal-related gains, pension curtailment gains,
etc. The treatment for calculating core performance across the affected metrics (operating earnings, operating margin, operating earnings/employee, and ROIC) is detailed below.
Certain companies were excluded from the analysis either because they failed to exceed the US$500 million threshold, were government controlled, were companies that identified A&D as an end market, but did not otherwise provide a basis on which analysis could derive a reasonable estimate of 2011 A&D revenue, or were acquired in 2011. The discernible cumulative 2011 A&D revenue of these excluded companies was US$61.7 billion.
All data in this study is presented in U.S. dollar currency. Approximately 44 percent of the 110 companies under analysis in this study are headquartered in countries other than the United States. For such companies, the study applied a dual foreign currency conversion method to calculate Industry aggregate figures in U.S. dollar. On the one hand, the study applied the appropriate fiscal year end conversion rate to a non-U.S. company’s “static” data such as backlogs. On the other hand, for “flow” data, such as revenue and earnings, a 365-days daily average conversion rate was applied corresponding to the company’s fiscal year. Embraer, Elbit Systems, BBA Aviation, and Bombardier Aerospace are four non-U.S. companies that report in U.S. dollar; hence their financials were taken without the need of currency conversions. When referring to the growth rate of the European group of companies. The study used the standard constant approach to eliminate the effect of significant currency fluctuations from year to year. Where the study explicitly refer to the growth rate of a non-U.S. company’s “flow” data, such as revenue, the growth rate stated is based on home currency data values, so as to assess the pure performance of the company and mitigate the impact of currency conversions.
In the commercial versus defense segment section, the study compare and contrast the performance of the top 20 global A&D companies on metrics such as: revenue, operating earnings, revenue per employee, operating earnings per employee, and number of employees. The commercial/defense split of all the Top 20 companies is available for all companies except Safran. Although not in the Top 20 companies, Rockwell Collins has been included in place of Safran, due to its mix of commercial and defense businesses.
30
All the Top 20 companies provided their commercial versus defense revenues. However, there were only few companies which explicitly stated commercial versus defense operating earnings and headcount. These companies are: Boeing, Thales, Rolls-Royce, Bombardier Aerospace, Huntington Ingalls, and Rockwell Collins. For the remaining companies, the study used the commercial and defense percentage of revenue as a proxy to estimate the respective operating earnings and employee figures. In case of Finmeccanica's segments, there is a mix of commercial and defense businesses, and the respective shares are not publicly available, so the analysis assumed it to be an equal split between commercial and defense.
1. Industry revenue:• To calculate the A&D revenue for a company, it was
necessary to determine the percentage of revenue associated with A&D activities. In calculating such percentage, the study first checked to see whether the company explicitly stated an A&D revenue figure. In such a case, the study used that explicitly stated percentage directly. If such percentage was not explicitly stated, the company’s various business segments or end-markets were analyzed and considered those which were related to A&D in estimating its revenue percentage.
• Once A&D revenue percentages were assigned to all companies, the study put them into two categories: those companies that derived less than 60 percent of their respective revenue from A&D and those companies that derived equal to or greater than 60 percent of their respective revenue from A&D. If a company derived less than 60 percent of its revenue from A&D, the study included only the revenue generated by the A&D part. However, if the company derived equal to or greater than 60 percent of its revenue from A&D, the analysis used total revenue for the company.
• Oshkosh Corporation is the only company in the study which changed revenue category in 2011. The company’s A&D revenue was more than 60 percent in 2010, but fell below 60 percent in 2011. The study used Oshkosh’s revenue from the A&D segment for 2011 and 2010 to ensure a fair comparison of its performance in both of the years.
• In determining Industry revenue, the study calculated
a summation of the revenue of all the constituent 110 companies.
2. Operating earnings/margin:• In calculating the A&D operating earnings, the study
took a two-pronged approach (same as above), which states that if a company derived less than 60 percent of its revenue from A&D, the analysis factored only the operating earnings clearly associated with the A&D part. However, if the company derived equal to or more than 60 percent of its revenue from A&D, the study took the total operating earnings for the company.
• In the cases of companies, such as United Technologies, URS Federal Sector, CSC, and Precision Castparts (these companies derive less than 60 percent of their respective revenues from A&D), it was not possible to clearly assign operating earnings to the A&D part. In these cases, the companies’ respective A&D operating earnings were derived by multiplying the companies’ respective A&D revenue by the companies’ respective total operating margin percentages.
• The study examined the operating earnings as stated, if reported by the company. If the operating earnings were not published by the company, it was calculated as:
– Operating earnings = Sales — Cost of goods sold — SG&A expenses — R&D expenses — Restructuring/acquisition costs — Impairments/amortizations.
• Core operating earnings/margin for a company is calculated by adding back the company’s A&D related charges or subtracting the non-recurring A&D related gains in home currencies to the reported operating earnings of the company for 2010 and 2011, as applicable. In cases where the companies do not clearly assign any charges/gains to their A&D businesses, the study estimated that the company’s A&D related charges/gains as a percentage of total company charges/gains would be the same as the company’s A&D revenue percentage of total revenue. This was done for companies such as Navistar, ThyssenKrupp Marine Systems, Volvo Aero, etc.
2011 Global Aerospace & Defense Industry performance wrap-up 31
• The companies’ respective A&D operating margins were calculated by dividing their respective A&D operating earnings by their respective A&D revenues.
• Operating earnings for the Industry (reported and core) is a summation of operating earnings of all constituent companies.
• Operating margin for the Industry (reported and core) was calculated as the total industry operating earnings as a percentage of total Industry revenue.
3. ROIC:• ROIC was calculated for the entire company, as
companies report it at the company level and not at the segmental level. Hence, all the components in the ROIC calculation were reflective of the entire company.
• ROIC was calculated based on component values in home currencies to eliminate the impact of currency conversion.
• The study took the ROIC value as stated, if reported by the company. Raytheon, GE, Textron, GKN, General Dynamics, Kawasaki Heavy Industries, BBA Aviation, and Babcock International, among other companies, published their ROIC values and the same were incorporated into the study. GE states that ROIC excluding GECS (General Electric Capital Services). The study analyzed GE’s ROIC excluding GECS, as inclusion of GECS would have had a distorting effect on GE’s ROIC performance.
• If the ROIC value was not published by the company, it was calculated as:
– ROIC = (Net operating earnings after tax)/(average shareholder equity + average net financial debt).
• Net operating earnings after tax (NOPAT) is calculated as:
– NOPAT = Net income from continuing operations + ((1– country’s prevailing tax rate)*(non-operating expenses)).
• A company’s 2011 average shareholder equity is calculated as the simple averages of its 2011 and 2010 fiscal year end shareholder equity values. A company’s 2010 average shareholder equity is calculated as the simple averages of its 2010 and 2009 fiscal year end shareholder equity values. Analogous treatment applies
to the calculation of a company’s 2011 and 2010 average net financial debt values.
• All shareholder equity values include equity from non-controlling interests, except in the case of Latecoere where the analysis took shareholder equity excluding minority interest due to lack of data.
• Net financial debt is calculated as:
– Net financial debt = Short-term interest-bearing liabilities + long-term interest-bearing liabilities — ((0.8*(cash and cash equivalents)).
– 80 percent of cash and cash equivalents is used in the calculation of net financial debt as the study assumed that 20 percent of a company’s cash is reserved for running the operations of the company and, thus, not available for investment.
• In the case of Latecoere and Indra Sistemas Security & Defense, the study used the net financial debt figures explicitly stated by the companies in their press releases since these companies did not publish their audited results by the cut-off date.
• In the case of companies such as Huntington Ingalls and Wesco Aircraft, the study used only 2011 fiscal year end shareholder equity and net financial debt values to calculate 2011 ROIC and, similarly, only 2010 fiscal year end shareholder equity and net financial debt values to calculate 2010 ROIC. As the companies’ interest-bearing liabilities for 2009 are not available, calculation of 2010 average net financial debt was not possible.
• In order to calculate the core ROIC for a company, the study adjusted certain ROIC components depending on the nature of the one-time A&D related charges/gains for 2010 and 2011, as applicable.
• ROIC for the Industry (reported and core) is a revenue — weighted average. It was calculated as:
– Industry ROIC = ∑ (Company ROIC*Company A&D revenue)/Total industry A&D revenue.
– ROIC stated in the study differs from ROCE (Return on capital employed).
32
• Some companies — such as Rolls-Royce, SAAB, and Rheinmettal — publish their ROCE. Despite this fact, for purposes of this study, a calculation of these companies’ ROIC was made. A company’s ROCE should not be compared with its ROIC.
4. FCF/FCM:• FCF was calculated for the entire company, as it is
impractical to allocate cash flows to a company’s A&D and non-A&D segments.
• If the FCF value was published by the company, the study used it directly as in the cases of Northrop Grumman, Safran, Huntington Ingalls, Embraer, Kawasaki Heavy Industries, Singapore Technologies Engineering, Babcock International, MTU Aero Engines, IHI, Rheinmetall, Cobham, Teledyne Technologies, Hexcel, Chemring, Ultra Electronics, Fuji, GenCorp, Woodward, Ball Aerospace, Kaman, Bombardier, EADS, BAE Systems, Serco, BBA Aviation, Smiths Group, CSC, CAE, Senior plc, ThyssenKrupp, GKN, and General Dynamics, among others.
• If the FCF value was not published by the company, it was calculated as:
– FCF = Operating cash flow — net capital expenditures.
• Net capital expenditures are calculated as:
– Net capital expenditure = purchases of plant, property, and equipment — proceeds from the sale of plant, property, and equipment.
• The study calculated the industry FCF as a summation of the FCFs of all constituent companies.
• FCM is calculated for the entire company, analogous to FCF. FCM for a company was calculated as:
– Company FCM = Company FCF/Company revenue.
• FCM for the Industry is a revenue-weighted average. It was calculated as:
• Industry FCM = ∑ (Company FCM*Company A&D revenue)/total Industry A&D revenue.
• FCF and FCM for four companies — such as Latecoere and Stork — were not included in the analysis because of data unavailability. In addition, the FCF and FCM of GE were excluded as their inclusion would have had a
distorting effect on the calculation of Industry FCF and FCM, respectively.
5. BTB• The study took the BTB ratio as stated if reported by the
company, such as in cases of Bombardier Aerospace, Cobham, Kongsberg Gruppen, Indra Sistemas Security & Defence, and CAE
• If the BTB ratio was not published by the company, it was calculated as follows:
– BTB = 1+((Current fiscal year total backlog — previous fiscal year total backlog)/(current fiscal year revenue)).
• In calculating BTB ratio, the study used a two-pronged approach, which states that if a company derived less than 60 percent of its revenue from A&D, taking a look at the backlog and revenue of the A&D part. However, if the company derived equal to or more than 60 percent of its revenue from A&D, the study took backlog and revenue for the entire company.
• There were cases in which the company derived less than 60 percent of its revenue from A&D, but the study based calculations of BTB ratio on backlog and revenue for the entire company. Such was made necessary by the lack of A&D segmental backlog information. Examples of such companies include Precision Castparts, United Technologies, Honeywell Aerospace, Kawasaki Heavy Industries, and Indra Sistemas Security & Defense.
• The BTB ratio for the Industry is a revenue-weighted average. It was calculated as:
– Industry BTB = ∑ (Company BTB*Company A&D revenue)/total Industry A&D revenue.
• BTB ratio was calculated based on component values as reported in home currencies to eliminate the impact of currency conversion.
• BTB ratios for services firms, such as QinetiQ and BBA Aviation were not included in the calculation of the industry BTB ratio for lack of backlog data. The 2011 and/or 2010 BTB of certain other companies could not be calculated for lack of backlog data. Examples of such companies include GKN Aerospace, ThyssenKrupp Marine Systems, Hexcel, Volvo Aero, Fuji Aerospace, Microsemi, Smiths Detection, etc.
2011 Global Aerospace & Defense Industry performance wrap-up 33
6. Number of A&D employees:• The study applied the 60 percent approach in assessing
A&D employees of companies, such that if a company derives 60 percent or more of its total revenue from A&D, the analysis took its total number of employees. However, if the company derives less than 60 percent of its total revenue from A&D, the study considered only the employees associated specifically with the A&D business of a company.
• If a company derives less than 60 percent revenue from A&D, and it explicitly states the number of employees associated with its A&D activities, the study took it as stated. Examples of such companies include Rheinmetall Defence, ThyssenKrupp Marine Systems, Serco Defence, Science & Nuclear, GKN Aerospace, Kongsberg Gruppen, Volvo Aero, Smiths Detection, Bombardier Aerospace, etc.
• If a company derives less than 60 percent revenue from A&D, however, and it does not explicitly state the number of employees associated with its A&D business, the study estimates that the company’s A&D employees as a percentage of total employees would be the same as the company’s A&D revenue percentage of total revenue. The study used this approach for companies, such as United Technologies, GE Aviation, Honeywell Aerospace, FLIR Government Systems, Kawasaki Aerospace & Gas Turbines, URS Federal Sector, among others, as they do not explicitly state the workforce aligned to their A&D-related businesses and all derive less than 60 percent of their total revenue from A&D.
• Where stated, the study took the average employee numbers for the respective fiscal years. If average employee numbers were not available, factored in the employee figures as of the end of the respective fiscal years.
• Wesco Aircraft’s all employment figures are based on the March 31, 2011 information.
7. Employee productivity:• The study considered two parameters in order to
measure employee productivity for individual companies and the industry — A&D revenue per employee and A&D operating earnings per employee.
• If a company derives more than 60 percent of its
revenue from A&D, the metrics are calculated as:
– A&D revenue per employee = Company’s total revenue/Total number of employees.
– A&D operating earnings per employee = Company’s total operating earnings/Total number of employees.
• If, however, the company derives less than 60 percent from A&D, the metrics are calculated as:
– A&D revenue per employee = Company’s A&D revenue/Estimated employees associated with the A&D business.
– A&D operating earnings per employee = Company’s A&D operating earnings/Estimated employees associated with the A&D business.
• The study used the number of employees associated with the A&D business as reported by the company if so stated explicitly. However, if the same is not explicitly stated, the number of employees associated with the A&D business is estimated as described above.
• Core A&D operating earnings per employee for a company are calculated by adding back the one-time A&D related charges or subtracting the one-time A&D related gains to the reported operating earnings of the company, divided by the company’s A&D number of employees, for 2010 and 2011, as applicable.
• Revenue per employee and operating earnings per employee (reported and core) for the Industry are calculated as:
– Revenue per employee in the A&D Industry = Total revenue of the Industry/Total number of employees in the industry.
– Operating earnings per employee in the A&D industry = Total operating earnings of the industry/Total number of employees in the industry.

34

2011 Global Aerospace & Defense Industry performance wrap-up 35
Contact
Tom CaptainGlobal A&D Sector LeaderDeloitte Touche Tohmatsu Limited (DTTL) +1 206 716 6452 [email protected]

About Deloitte
Deloitte refers to one or more of Deloitte Touche Tohmatsu Limited, a UK private company limited by guarantee, and its network of member firms, each of which is a legally separate and independent entity. Please see www.deloitte.com/about for a detailed description of the legal structure of Deloitte Touche Tohmatsu Limited and its member firms.
Deloitte provides audit, tax, consulting, and financial advisory services to public and private clients spanning multiple industries. With a globally connected network of member firms in more than 150 countries, Deloitte brings world-class capabilities and high-quality service to clients, delivering the insights they need to address their most complex business challenges. Deloitte’s more than 195,000 professionals are committed to becoming the standard of excellence.
Deloitte Touche Tohmatsu Limited Global Manufacturing Industry group
The Deloitte Touche Tohmatsu Limited Global Manufacturing Industry group is comprised of around 2,000 member firm partners and over 13,000 member firm Industry professionals in over 45 countries. The group’s deep Industry knowledge, service line experience, and thought leadership allows them to solve complex business issues with member firm clients in every corner of the globe. Deloitte member firms attract, develop, and retain the very best professionals and instill a set of shared values centered on integrity, value to clients, and commitment to each other and strength from diversity. Deloitte member firms provide professional services to 80 percent of the manufacturing Industry companies on the Fortune Global 500®. For more information about the Global Manufacturing Industry group, please visit www.deloitte.com/manufacturing.
This publication contains general information only, and none of Deloitte Touche Tohmatsu Limited, its member firms, or their related entities (collectively, the “Deloitte Network”) is, by means of this publication, rendering professional advice or services. Before making any decision or taking any action that may affect your finances or your business, you should consult a qualified professional adviser. No entity in the Deloitte Network shall be responsible for any loss whatsoever sustained by any person who relies on this publication.
© 2012 Deloitte Global Services Limited