2009annrep draft 20100324 1
TRANSCRIPT

2010
ANNUAL STATISTICAL REPORT
TORONTO POLICE SERVICE


GLOSSARY ...........................................................................................................................................1
INTRODUCTION AND HIGHLIGHTS ............................................................................................3
STATISTICS AT A GLANCE .............................................................................................................4
PERSONNEL AND BUDGET
UNIFORM STRENGTH, EXPENDITURES & DISTRIBUTION ......................................................................... 5
GROSS OPERATING BUDGET. ....................................................................................................................5
POLICE PERSONNEL BY RANK AND CLASSIFICATION ...............................................................................6
POLICE PERSONNEL BY DIVISION AND FIELD COMMAND ........................................................................7
COMMUNICATIONS
CALLS RECEIVED AT COMMUNICATIONS CENTRE......................................................................................8
CLASSIFICATIONS OF INCOMING CALLS (CALLS FOR SERVICE)............................................................... 8
AT&T LANGUAGE LINE SERVICE.............................................................................................................8
ALARM CALLS ..........................................................................................................................................8
MISCELLANEOUS STATS
COMMUNITY BASED POLICING..................................................................................................................9
MAJOR CULTURAL AND OTHER EVENTS...................................................................................................9
INDUSTRIAL LIAISONS...............................................................................................................................9
HATE/BIAS...............................................................................................................................................10 CRIME STOPPERS.....................................................................................................................................10
TRANSGENDER SEARCHES........................................................................................................................10
WOMEN PARTIALLY/COMPLETE UNDRESS.................................................................................................10
FLEET .....................................................................................................................................................10
COMPLAINTS AGAINST POLICE
COMPLAINTS INVESTIGATED....................................................................................................................11
ALLEGATION TYPE...................................................................................................................................11
INVESTIGATION OUTCOME.......................................................................................................................11
GENERAL DATA BY DIVISION AND COMMAND
POPULATION/EXPENDITURE/SIZE............................................................................................................12
DISPATCHED CALLS FOR SERVICE...........................................................................................................12
STOLEN/RECOVERED VEHICLES..............................................................................................................12
STOLEN BICYCLES...................................................................................................................................12
GENERAL CRIME INFORMATION
OFFENCE TOTALS
Overall Crime.........................................................................................................................................13
Homicides...............................................................................................................................................13
Robberies (Financial Institutions)...........................................................................................................13
Break and Enters ....................................................................................................................................14
Sexual Assaults.......................................................................................................................................15
NonSexual Assaults................................................................................................................................15
All Robberies .....................................................................................................................................15
CRIMES REPORTED BY CATEGORY OVER LAST FIVE YEARS.....................................................................16
CRIMES REPORTED BY CATEGORY BY UNIT............................................................................................17
OFFENCE TOTALS BY VICTIM AGE AND GENDER
Sexual Assaults...................................................................................................................................18
Nonsexual Assaults.............................................................................................................................18
All Robberies......................................................................................................................................18
All Violent Offences...........................................................................................................................19
SELECTED OFFENCES AGAINST POLICE ...................................................................................................19
PERSONS CHARGED BY ACCUSED AGE AND GENDER
All Violent Offences...............................................................................................................................19
TABLE OF CONTENTS
2010 ANNUAL STATISTICAL REPORT
Break and Enter...................................................................................................................................20
Nonsexual Assaults.............................................................................................................................20
Sexual Assaults ..................................................................................................................................20
Robbery...............................................................................................................................................21
Controlled Drugs and Substances Act.................................................................................................21
Drinking and Driving .........................................................................................................................21
CRIMINAL CODE OFFENCES REPORTED AND CLEARED
COMMAND AND SERVICE TOTALS............................................................................................................22
CENTRAL FIELD
11-14 Division ....................................................................................................................................23
51-55 Division ....................................................................................................................................24
AREA FIELD
22-23 Division ....................................................................................................................................25
31-33 Division ....................................................................................................................................25
41-43 Division ....................................................................................................................................26
TRAFFIC COLLISIONS AND OFFENCES
COLLISIONS
Fatalities..............................................................................................................................................27
Persons Injured ...................................................................................................................................27
Property Damage ................................................................................................................................27
PERSONS CHARGED AND R.I.D.E. DATA
Criminal Code Driving Offences By Unit...........................................................................................28
R.I.D.E. Information............................................................................................................................28
Criminal Code Driving Offences By Accused Age and Gender.........................................................29
PERSONS CHARGED/CHARGES LAID
CRIMINAL CODE/ FEDERAL STATUTE CHARGES LAID BY UNIT...............................................................30
PROVINCIAL OFFENCE AND BYLAWS CHARGES LAID BY UNIT ...............................................................31
FIREARM SEIZURES AND THEFTS
SEIZURES..................................................................................................................................................32
REPORTED STOLEN...................................................................................................................................32
THEFTS BY PREMISE TYPE .......................................................................................................................32
CRIME GUN FIREARM TYPE .....................................................................................................................33
CRIME GUN FIREARM CLASSIFICATION ...................................................................................................33
STOLEN FIREARMS – RECOVERED BY TORONTO POLICE SERVICE ..........................................................33
TOP 10 MANUFACTURERS BY FIREARM TYPE .........................................................................................34
TOP 5 CALIBRES BY FIREARM TYPE ........................................................................................................34
TYPES OF FIREARMS STOLEN AND RECOVERED IN TORONTO..................................................................34
TOP 20 OFFENCES RELATED TO FIREARMS SEIZED..................................................................................35
SHOOTING LOCATIONS ............................................................................................................................35
FIREARMS CLASSIFICATION DEFINITIONS…..………………….………………….APPENDIX A (Refers to Crime Gun Firearms Classification on page 32)
TABLE OF CONTENTS
2010 ANNUAL STATISTICAL REPORT

% CHANGE: The percent increase or decrease from the previous year.
% CLEAR:
The percentage of offences reported in a given year which have been cleared.
Adult: A person who is 18 years of age or greater.
A.F.C.: Area Field Command
C.F.C.: Central Field Command
Cleared: An offence can be considered cleared when a charge is laid, recommended or the person(s) who
committed the offence has been identified and no charge has been laid for some reason.
Criminal Code Traffic Offences:
Includes dangerous driving, impaired driving, refuse breath/blood sample and failure to remain at
the scene of an accident.
Crime Gun:
The National Weapons Enforcement Support Team (NWEST) defines a crime gun as “any firearm that
is illegally possessed, used in crime or suspected to have been used in a crime, or has an obliterated
serial number”
Drug Offences:
Involves offenders under the Controlled Drugs and Substances Act. These offences include
possession, trafficking, import/export, and production of various illicit, controlled and restricted drugs.
Municipal Bylaws: Includes violations under the City of Toronto Municipal By-Laws.
NSA:
Not Specified Area. Generally these relate to offences that have been reported to the Service but
occurred outside Toronto or at an undetermined location.
Offence:
An offence is categorized as a violation against any Federal, Provincial or Municipal statute/by-law.
Other Criminal Code Offences: Any other Criminal Code offences. For example bail violations, arson, and disturbing the peace are
included in other Criminal Code Offences.
Other Federal Statutes: Any Federal statute other than the Criminal Code and Controlled Drugs and Substances Act..
Persons Charged: A person that is arrested and/or charged with an offence.
Property Offences:
Property crime includes unlawful acts committed for the purpose of attaining or interfering with the use
of property, but does not involve the use or threat of violence against an individual. Property crime
includes actual and attempted motor vehicle theft, other theft, actual and attempted break and enter,
possession of stolen property, mischief and fraud.
GLOSSARY OF TERMS
1 2010 ANNUAL STATISTICAL REPORT

Provincial Acts:
Includes all violations under Provincial statutes with the exception of traffic related statutes. Some
examples include the Coroner’s Act, Environmental Protection Act, Mental Health Act and the Liquor
Licence Act.
Rate:
Rate of crime per 100,000 population.
Reported:
Number of Offences Reported.
Violent Offences:
Crimes involving the application or threat of application of force to a person. They include homicide,
attempted murder, sexual assault, non-sexual assault, other sexual offences, abduction and robbery.
Young Offender:
A Person who is between 12 and 17 years of age.
GLOSSARY OF TERMS
2 2010 ANNUAL STATISTICAL REPORT

Source Data: The crime related data contained in this report are derived from a number of computer sources. These systems include, but are not limited to: eCOPS - Enterprise Case Occurrence Processing System COPS - Computerized Occurrence Processing System CIPS - Criminal Information Processing System These systems are continuously being updated and as a result some changes to statistics published in previous statistical reports should be expected. Crime statistics contained in this report are based on the date that the information was reported or became known to police. This is done to minimize changes in reported statistics year over year and to enable some degree of comparability with statistics reported by Statistics Canada. Other data comes from a mixture of automated and manual systems maintained by the individual units responsible.
Comparing Crime Statistics: The statistics in this report count all offences reported to the police. As a result, a single incident reported to police may generate more than one offence. It is not recommended that the crime statistics in this report be compared to crime statistics prepared by other agencies due to the fact that different methods of categorization, geographic, technical, data and time constraints may affect the outcome. Although comparing exact numbers is not recommended, the general trends and magnitude of change should be similar regardless of the counting method. Detailed information pertaining to Statistics Canada crime reporting method can be found in the Uniform Crime Reporting Survey documents posted on the Statistics Canada website, http://www.statcan.gc.ca.
Highlights:
• Total reported crime has decreased by 9% (approximately 16,214 offences) in 2010 (169,878 offences) when compared to 2009 (186,092 offences).
• Murders in 2010 (61) have decreased slightly when compared to 2009 (62).
• Violent crime against person has decreased by 1.3% (424 offences) in 2010 (31,593 offences) when compared to 2009 (32,017 offences).
• Sexual Assaults have increased by 6% (158 offences) in 2010 (2,841 offences) when compared to 2009 (2,683 offences).
• Stolen vehicles reported stolen have decreased by 18% (983 autos) in 2010 (4,479 autos) when compared to 2009 (5,462 autos).
• Charges laid by RIDE have decreased by 17% (84 charges) in 2010 (406 charges) when compared to 2009 (490 charges).
• Crime Stoppers arrests have decreased by 7% (27 arrests) in 2010 (374 arrests) when compared to 2009 (401 arrests).
• The gross operating budget has increased by 4% ($39,836,500) in 2010 ($956,903,200) when compared to 2009 ($917,066,700).
INTRODUCTION AND HIGHLIGHTS
2010 ANNUAL STATISTICAL REPORT3
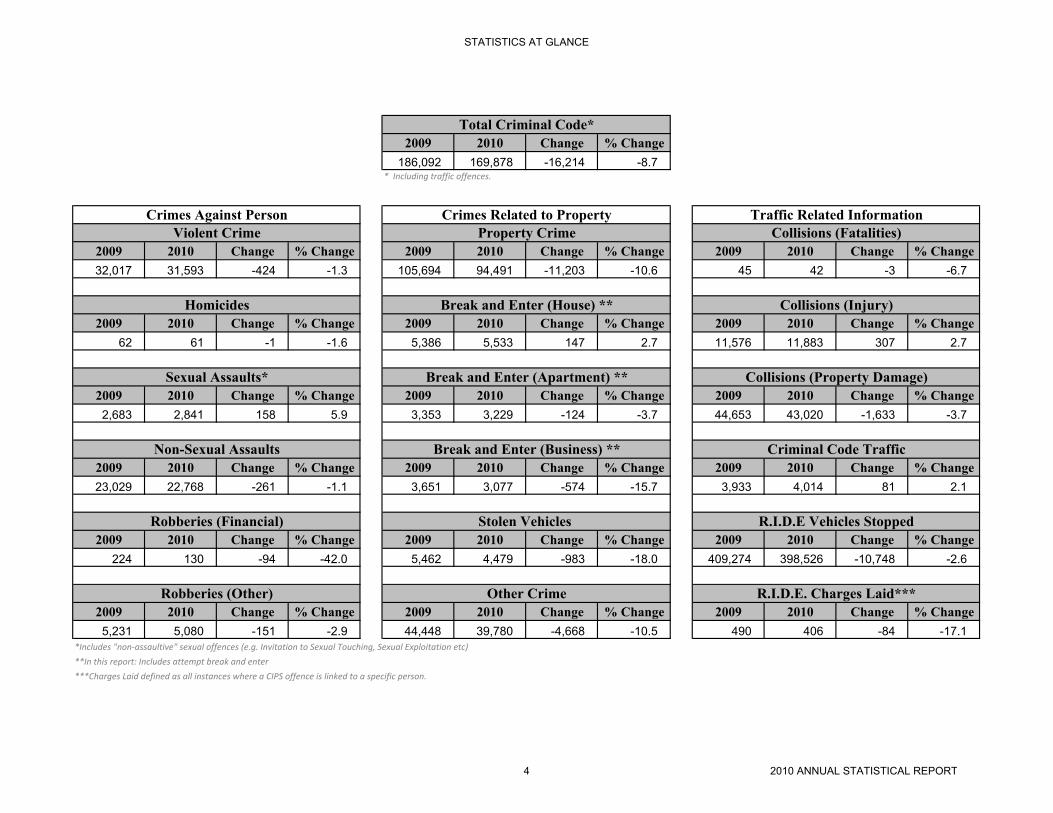
2009 2010 Change % Change
186,092 169,878 -16,214 -8.7
2009 2010 Change % Change 2009 2010 Change % Change 2009 2010 Change % Change
32,017 31,593 -424 -1.3 105,694 94,491 -11,203 -10.6 45 42 -3 -6.7
2009 2010 Change % Change 2009 2010 Change % Change 2009 2010 Change % Change
62 61 -1 -1.6 5,386 5,533 147 2.7 11,576 11,883 307 2.7
2009 2010 Change % Change 2009 2010 Change % Change 2009 2010 Change % Change
2,683 2,841 158 5.9 3,353 3,229 -124 -3.7 44,653 43,020 -1,633 -3.7
2009 2010 Change % Change 2009 2010 Change % Change 2009 2010 Change % Change
23,029 22,768 -261 -1.1 3,651 3,077 -574 -15.7 3,933 4,014 81 2.1
2009 2010 Change % Change 2009 2010 Change % Change 2009 2010 Change % Change
224 130 -94 -42.0 5,462 4,479 -983 -18.0 409,274 398,526 -10,748 -2.6
2009 2010 Change % Change 2009 2010 Change % Change 2009 2010 Change % Change
5,231 5,080 -151 -2.9 44,448 39,780 -4,668 -10.5 490 406 -84 -17.1
*Includes "non-assaultive" sexual offences (e.g. Invitation to Sexual Touching, Sexual Exploitation etc)
**In this report: Includes attempt break and enter
***Charges Laid defined as all instances where a CIPS offence is linked to a specific person.
Traffic Related Information
Collisions (Fatalities)
Total Criminal Code*
Violent Crime Property Crime
Crimes Against Person Crimes Related to Property
* Including traffic offences.
R.I.D.E. Charges Laid***
Collisions (Injury)
Collisions (Property Damage)Break and Enter (Apartment) **
Criminal Code Traffic
R.I.D.E Vehicles Stopped
Robberies (Other)
Homicides
Other Crime
Stolen Vehicles
Break and Enter (Business) **
Break and Enter (House) **
Non-Sexual Assaults
Robberies (Financial)
Sexual Assaults*
STATISTICS AT GLANCE
2010 ANNUAL STATISTICAL REPORT4

2006 2007 2008 2009 2010
2,724,784 2,750,360 2,776,175 2,802,233 2,828,537
5,376 5,557 5,457 5,651 5,636
1:507 1:495 1:509 1:496 1:502
807,718,098 829,038,200 881,825,300 924,443,954 956,903,200
296.4 301.4 317.6 330.3 338.3
* Estimate (based on projected expenditures).
Year Budget ($) Change ($) % Change
2006 790,965,700 37,108,900.0 4.9
2007 829,038,200 38,072,500 4.8
2008 881,825,300 52,787,100 6.4
2009 917,066,700 35,241,400 4.0
2010 956,903,200 39,836,500 4.3
Per Capita Cost*
Uniform Strength
Percent of Gross Operating Budget by Distribution
Uniform Strength and Expentitures
Gross Operating Budget
Population Served
Uniform Strength:Population
Actual Expenditures
Feature
Salaries And
Benefits
88.4%
Services And
Rent
9.3%
Material
2.1% Equipment
0.2%
Appropriation
Chief
0.2%Specialized
Operation
Command
29.0%
Divisional
Policing
Command
55.9%
Administrative
Command
6.1%
Executive
Command
4.4%
Human
Resources
Command
4.4%
PERSONNEL AND BUDGET
2010 ANNUAL STATISTICAL REPORT5

2006 2007 2008 2009 2010
1 1 1 1 1
4 4 4 4 4
6 6 6 6 6
22 24 23 24 23
24 23 21 20 22
40 41 43 46 45
262 275 268 274 269
925 948 959 986 998
4,092 4,235 4,132 4,290 4,268
5,376 5,557 5,457 5,651 5,636
2006 2007 2008 2009 2010
1 1 1 1 1
6 6 6 5 5
375 401 402 407 409
373 457 458 452 459
17 17 15 12 16
227 231 237 228 220
289 124 276 196 202
5 5 5 5 5
1,224 1,198 1,193 1,215 1,248
2,517 2,440 2,593 2,521 2,565
7,893 7,997 8,050 8,172 8,201
2006 2007 2008 2009 2010
690 605 613 712 742
68 66 73 90 78
708 730 734 738 739
185 147 138 183 176
73 78 85 78 81
1,724 1,626 1,643 1,801 1,816
*Includes other adult volunteers **Includes spares *** Includes other volunteers
****As of December 31, 2010, excludes those members in HRUGS/GA
Director
Distribution of Personnel by Branches of the Service
Total Other
Other Staff
Classification
Temporary Employee**
School Crossing Guard***
Part-time Court Officer
Part-time Employee - other
Auxiliary Personnel*
Parking Enforcement Officer
Chief Administrative Officer- Policing
Grand Total
Court Officer
Document Server
Communications Operator
Cadets-in-Training
Custodial Officer
Other Civilians
Total Civilian Strength
Total Uniform Strength
Chief
Deputy Chief
Staff Superintendent
Superintendent
Staff Inspector
Inspector
Staff Sergeant/Detective Sergeant
Classification
Uniform Staff
Civilian Staff
Sergeant/Detective
Police Constable
Rank
Board & Chief
0.33%
Human Resources
Command
5.90%
Administrative
Command
4.33%
Executive Command
4.99%
Divisional Policing
Command
49.46%
Specialized
Operations
Command
35.00%
PERSONNEL AND BUDGET
2010 ANNUAL STATISTICAL REPORT6

Superintendent
and Above
Staff
InspectorInspector
Staff/Det.
Sergeant
Sergeant/
DetectiveConstable
Uniform
Strength
Civilian
Strength*
Total
Strength
School
Crossing
Guard
CENTRAL FIELD COMMAND HQ 1 1 2 2 6 1 7
11 Division 1 1 7 34 135 178 10 188 36
12 Division 1 1 7 35 147 191 15 206 46
13 Division 1 1 7 35 140 184 9 193 54
14 Division 1 2 8 48 257 316 16 332 44
51 Division 1 1 8 40 225 275 12 287 29
52 Division 1 2 9 46 194 252 18 270 0
53 Division 1 1 7 33 143 185 10 195 69
54 Division 1 1 7 34 161 204 9 213 42
55 Division 1 1 9 36 170 217 16 233 64
Central Field Total 6 4 11 70 343 1,574 2,008 116 2,124 384
AREA FIELD COMMAND HQ** 1 1 4 8 22 36 5 41
22 Division 1 1 7 34 181 224 14 238 63
23 Division 1 1 7 34 186 229 11 240 54
31 Division 1 1 8 39 245 294 13 307 37
32 Division 1 1 7 34 183 226 12 238 52
33 Division 1 1 7 32 132 173 11 184 35
41 Division 1 1 7 40 204 253 13 266 39
42 Division 1 1 7 36 179 224 11 235 39
43 Division 1 1 7 38 213 260 14 274 36
Area Field Total 8 2 8 61 295 1,545 1,919 104 2,023 355
Policing Operations Command*** 1 1 1 8 64 75 2 77
Grand Total 15 6 20 132 646 3,183 4,002 222 4,224 739
* Does not include temporary and part-time civilian members. **AFC includes members assigned to IMPART ***POC includes members assigned to TAVIS
****As of December 31,2010 - Central Field, Area Field and Policing Operations Command staff only
Area Field**
Central Field
PERSONNEL AND BUDGET
2010 ANNUAL STATISTICAL REPORT7

Year Emergency Non-Emergency TotalDispatched
Calls
2006 917,675 873,639 1,791,314 835,091
2007 928,955 861,090 1,790,045 853,933
2008 945,559 868,960 1,814,519 876,669
2009 966,939 840,838 1,807,777 875,031
2010 1,089,570 837,007 1,926,577 902,355
Status 2006 2007 2008 2009 2010
Valid Alarms 954 667 571 474 394
False Alarms 25,712 25,475 24,509 22,244 21,408
Total 26,666 26,142 25,080 22,718 21,802
Language 2006 2007 2008 2009 2010
Chinese 1933(1)** 1999(1) 1996(1) 1852(1) 1878(1)
Spanish 452(2) 576(2) 786(2) 767(2) 697(2)
Vietnamese 195(4) 162(6) 214(3) 151(6) 161(6)
Italian 166(6) 227(3) 142(9) 115(9) 109
Portuguese 204(3) 219(4) 199(4) 191(5) 192(4)
Tamil 165(7) 170(5) 173(6) 134(7) 144(7)
Korean 156(8) 123(9) 157(7) 194(4) 182(5)
Russian 192(5) 134(7) 192(5) 203(3) 221(3)
French 116(9) 127(8) 155(8) 132(8) 130(9)
Polish 104(10) 80 88 62 94
Punjabi 76 65 59 60 61
Farsi 99 112(10) 90(10) 112(10) 138(8)
Greek 17 22 22 14 30
Hungarian 10 14 9 39 118(10)
Arabic 21 22 28 36 63
Somali 17 27 20 26 29
Japanese 25 22 22 24 30
Hindi 33 29 30 33 27
Urdu 26 31 21 20 27
Turkish 20 26 32 22 13
German 10 5 0 3 7
Croatian 8 3 1 5 7
Total** 4,045 4,195 4,436 4,195 4,358
**Top Ten ranking shown in bracket
*Numbers provided respresent calls received at Communications via 9-1-1 or the non-emergency number that utilized Language Line Services.
AT&T Language Line Service (other than English)*
Calls Received at Communications Centre
Alarm Calls
COMMUNICATIONS
8 2010 ANNUAL STATISTICAL REPORT

Attendance*
Community Liaison Presentations**
Police Liasion Committee Meetings held - Divisional 239
50
1,543
2,039
5,658
1,628
73
9
14
15
Gay Pride 15
54
684
558
225
312
169
2,361
255
*(estimated audience)
2006 2007 2008 2009 2010
Hours Volunteered 85,000 73,386 51,200 88,152 69,141
2006 2007 2008* 2009 2010
Total Incidents 8,324 8,753 9,709 9,932 10,154
Telephone Assisted 15,214 14,644 14,397 15,261 15,038
On Scene 2,301 1,878 2,370 3,147 3,932
Domestic Related 3,422 4,160 5,224 6,568 5,992
2006 2007 2008 2009 2010
Labour disputes attended 27 23 27 24 18
Potential dispute contacts 20 18 25 16 20
**Community Liaision presentations doesn't include data from 52 Division
Victim Services
Industrial Liaison
Volunteer Resources
Crime Prevention Through Envioronmental Design (CPTED) audits and community safety audits conducted
Caribana
Total number of lectures/presentations given on crime prevention topics (including those listed above).
Lectures/presentations given regarding elder abuse and senior citizen safety
Lectures/presentations given regarding child abuse/child protection (includes internet safety)
Other cultural events planned, coordinated or attended
National Aboriginal Day
Crime prevention lectures/presentations given dealing with personal safety (excluding family/relationship violence)
Events related to the following major cultural occasions planned, coordinated, assisted or attended
Khalsa Day
Police Liasion Committee Meetings held - Divisional
Police Consultative Committee Meetings held - Community Mobilization only
School lectures / presentation given
Lectures/presentations given to platooons, divisions or units
Presentations to community members, organizations, agencies or groups
Community meetings attended (excluding CPLC and CPCC)
Lectures/presentaions given regarding family/relationship violence
Black History Month
U.N.Day for the Elimination of Racial Discrimination
MISCELLANEOUS STATISTICS
2010 ANNUAL STATISTICAL REPORT9

2006 2007 2008 2009 2010
Occurrences* 162 130 153 174 132
2006 2007 2008 2009 2010
Arrests 530 518 649 401 374
Charges Laid 2,994 1,959 2,531 2,000 1,909
2006 2007 2008 2009 2010
Transgender Searches* Not Available Not Available Not Available Not Available 186
Women Partially/Complete Undress** Not Available Not Available 13 13 11
Vehicles 2006 2007 2008 2009 2010
Cars 1,344 1,349 1,385 1,421 1,470
Motorcycles 97 92 75 73 69
Other 119 120 127 123 125
Total Vehicles 1,560 1,561 1,587 1,617 1,664
Boats 23 23 21 22 22
Horses 28 28 27 27 28
Hate/Bias Crime
Detailed Information on TPS hate bias crime can be found at www.torontopolice.on.ca/publications
Kilometers Driven
Fleet
Miscellaneous
Crime Stoppers
*Number of searches and detention of self-identified transgender people.
**Number of times police attended at locations occupied solely by women in a state of partial or complete undress.
2006
2007
2008
2009
2010
KM Driven 32,490,557 36,200,000 36,162,868 33,729,133 36,527,953
2006 2007 2008 2009 2010
MISCELLANEOUS STATISTICS
10 2010 ANNUAL STATISTICAL REPORT
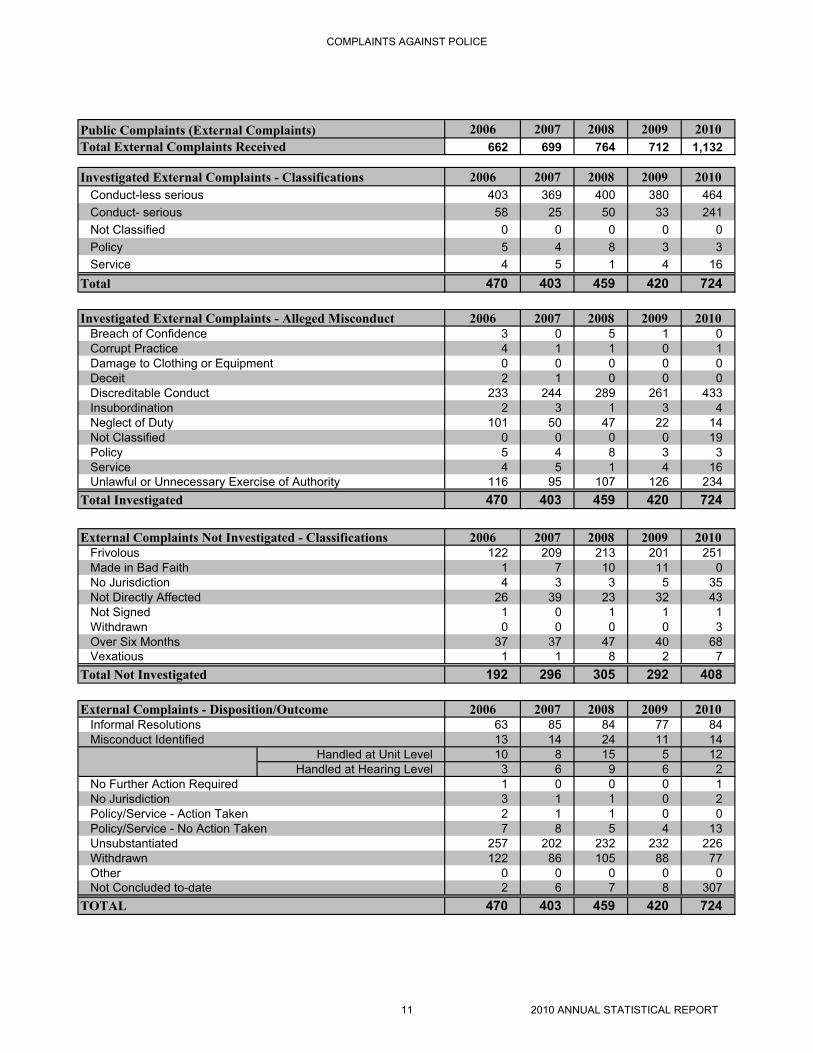
2006 2007 2008 2009 2010
662 699 764 712 1,132
2006 2007 2008 2009 2010
403 369 400 380 464
58 25 50 33 241
0 0 0 0 0
5 4 8 3 3
4 5 1 4 16
470 403 459 420 724
2006 2007 2008 2009 2010
3 0 5 1 0
4 1 1 0 1
0 0 0 0 0
2 1 0 0 0
233 244 289 261 433
2 3 1 3 4
101 50 47 22 14
0 0 0 0 19
5 4 8 3 3
4 5 1 4 16
116 95 107 126 234
470 403 459 420 724
2006 2007 2008 2009 2010
122 209 213 201 251
1 7 10 11 0
4 3 3 5 35
26 39 23 32 43
1 0 1 1 1
Withdrawn 0 0 0 0 3
37 37 47 40 68
1 1 8 2 7
192 296 305 292 408
2006 2007 2008 2009 2010
63 85 84 77 84
13 14 24 11 14
Handled at Unit Level 10 8 15 5 12
Handled at Hearing Level 3 6 9 6 2
1 0 0 0 1
3 1 1 0 2
2 1 1 0 0
7 8 5 4 13
257 202 232 232 226
122 86 105 88 77
0 0 0 0 0
2 6 7 8 307
470 403 459 420 724
Policy
Not Classified
External Complaints Not Investigated - Classifications
Unlawful or Unnecessary Exercise of Authority
Not Classified
Conduct- serious
Policy
Investigated External Complaints - Alleged Misconduct
Informal Resolutions
Not Directly Affected
Neglect of Duty
Public Complaints (External Complaints)
Total External Complaints Received
Investigated External Complaints - Classifications
No Jurisdiction
Service
Conduct-less serious
Total
Corrupt Practice
Over Six Months
Frivolous
Made in Bad Faith
Not Signed
Total Investigated
Service
Insubordination
Breach of Confidence
No Jurisdiction
Deceit
Damage to Clothing or Equipment
Discreditable Conduct
External Complaints - Disposition/Outcome
No Further Action Required
Vexatious
Misconduct Identified
Total Not Investigated
TOTAL
Not Concluded to-date
Unsubstantiated
Policy/Service - Action Taken
Other
Policy/Service - No Action Taken
Withdrawn
COMPLAINTS AGAINST POLICE
11 2010 ANNUAL STATISTICAL REPORT

Stolen Recovered
11 Division 104,390 15.2 18,968,537 32,092 116 62 169
12 Division 103,817 17.9 20,737,840 36,914 224 137 39
13 Division 145,116 18.6 19,912,203 32,920 178 108 95
14 Division 156,432 16.0 33,808,414 64,199 191 126 533
51 Division 95,628 8.6 28,092,984 51,673 168 130 368
52 Division 42,926 9.2 28,379,786 37,018 69 45 506
53 Division 189,668 31.3 19,781,109 36,642 173 130 266
54 Division 141,881 20.2 21,882,448 39,661 119 84 211
55 Division 123,325 20.3 23,745,689 38,442 123 91 259
Central Total 1,103,183 157.4 215,309,010 369,561 1,361 913 2,446
22 Division 209,787 68.0 24,195,787 44,431 405 254 159
23 Division 169,792 57.6 25,302,408 38,862 533 324 89
31 Division 197,675 51.1 31,861,600 52,778 517 298 74
32 Division 252,964 61.0 24,776,352 40,660 503 291 136
33 Division 206,521 52.8 19,137,924 35,943 203 147 59
41 Division 181,282 44.5 27,153,590 48,127 321 298 99
42 Division 288,262 84.6 23,988,513 40,914 333 179 76
43 Division 219,071 59.2 28,576,581 44,872 303 209 109
Area Total 1,725,354 478.8 204,992,755 346,587 3,118 2,000 801
Field Totals 2,828,537 636.2 420,301,765 716,148 4,479 2,913 3,247
*Does not include attempts
Recovered is the number of vehicles recovered which were stolen in 2010
2,605
69,474
114,128
186,207
902,355
Other Calls Total
Other Dispatched Calls
CARU
UnitsEstimated Gross
Expenditures($)
Area
(sqkm)
TAG
Other Unit
Grand Dispatched Calls Total
Estimated
Population
Motor Vehicles* Bicycles
Stolen
Dispatched
calls
Central Field
Area Field
GENERAL DATA BY DIVISION AND COMMAND
2010 ANNUAL STATISTICAL REPORT12

Year Reported%
ChangeRate Cleared %Clear
2006 206,283 0.9 7,570.6 111,537 54.1
2007 198,166 -3.9 7,205.1 104,220 52.6
2008 186,482 -5.9 6,717.2 99,065 53.1
2009 182,159 -2.3 6,500.5 94,333 51.8
2010 165,864 -8.9 5864.0 84,354 50.9
*Excluding Criminal Code traffic offences.
Year Reported%
ChangeRate Cleared %Clear
2006 70 25.0 2.6 50 71.4
2007 86 22.9 3.1 59 68.6
2008 70 -18.6 2.5 42 60.0
2009 62 -11.4 2.2 36 58.1
2010 61 -1.6 2.2 29 47.5*Homicide Case List
Year Reported%
ChangeRate Cleared %Clear
2006 182 -9.6 6.7 102 56.0
2007 167 -8.2 6.1 107 64.1
2008 205 22.8 7.4 113 55.1
2009 224 9.3 8.0 154 68.8
2010 130 -42.0 4.6 79 60.8
Total Criminal Code Offences*
Homicides*
Robberies (Financial Institutions only)
0
50,000
100,000
150,000
200,000
250,000
2006 2007 2008 2009 2010
Reported Cleared
0
10
20
30
40
50
60
70
80
90
100
2006 2007 2008 2009 2010
Reported Cleared
0
50
100
150
200
250
2006 2007 2008 2009 2010
Reported Cleared
GENERAL CRIME INFORMATION OFFENCE TOTALS
2010 ANNUAL STATISTICAL REPORT13

Year Reported%
ChangeRate Cleared %Clear
2006 4,647 -42.6 170.5 941 20.2
2007 4,892 5.3 177.9 1,044 21.3
2008 5,073 3.7 182.7 943 18.6
2009 5,386 6.2 192.2 1,147 21.3
2010 5,533 2.7 195.6 1,502 27.1
Year Reported%
ChangeRate Cleared %Clear
2006 4,978 37.6 182.7 886 17.8
2007 4,405 -11.5 160.2 821 18.6
2008 3,889 -11.7 140.1 821 21.1
2009 3,353 -13.8 119.7 851 25.4
2010 3,229 -3.7 114.2 847 26.2
Year Reported%
ChangeRate Cleared %Clear
2006 5,963 -15.8 218.8 1,304 21.9
2007 5,010 -16.0 182.2 1,210 24.2
2008 3,955 -21.1 142.5 1,007 25.5
2009 3,651 -7.7 130.3 1,024 28.0
2010 3,077 -15.7 108.8 888 28.9
Note: 67 B&Es occurred at other premises in 2010
Break and Enter - Houses
Break and Enter - Apartments
Break and Enter - Business Premises
0
1,000
2,000
3,000
4,000
5,000
6,000
2006 2007 2008 2009 2010
Reported Cleared
0
1,000
2,000
3,000
4,000
5,000
6,000
2006 2007 2008 2009 2010
Reported Cleared
0
1,000
2,000
3,000
4,000
5,000
6,000
7,000
2006 2007 2008 2009 2010
Reported Cleared
GENERAL CRIME INFORMATION OFFENCE TOTALS
2010 ANNUAL STATISTICAL REPORT14

Year Reported%
ChangeRate Cleared %Clear
2006 2,707 9.6 99.3 2,177 80.4
2007 2,539 -6.2 92.3 1,969 77.6
2008 2,562 0.9 92.3 2,006 78.3
2009 2,683 4.7 95.7 2,059 76.7
2010 2,841 5.9 100.4 2,130 75.0
* Includes "non-assaultive" sexual offences(e.g. Invitation to Sexual Touching; Sexual Exploitation etc.)
Year Reported%
ChangeRate Cleared %Clear
2006 25,178 4.1 924.0 19,557 77.7
2007 24,744 -1.7 899.7 18,998 76.8
2008 23,677 -4.3 852.9 17,792 75.1
2009 23,029 -2.7 821.8 17,537 76.2
2010 22,768 -1.1 804.9 17,644 77.5
Year Reported%
ChangeRate Cleared %Clear
2006 5,916 5.8 217.1 2,268 38.3
2007 5,709 -3.5 207.6 2,395 42.0
2008 5,480 -4.0 197.4 2,207 40.3
2009 5,455 -0.5 194.7 2,229 40.9
2010 5,210 -4.5 184.2 2,141 41.1
Sexual Assaults*
Non-Sexual Assaults
Robberies (Including financial institution)
0
500
1,000
1,500
2,000
2,500
3,000
2006 2007 2008 2009 2010
Reported Cleared
0
5,000
10,000
15,000
20,000
25,000
30,000
2006 2007 2008 2009 2010
Reported Cleared
0
1,000
2,000
3,000
4,000
5,000
6,000
7,000
2006 2007 2008 2009 2010
Reported Cleared
GENERAL CRIME INFORMATION OFFENCE TOTALS
2010 ANNUAL STATISTICAL REPORT15

TOTAL %CHANGE %CLEAR TOTAL %CHANGE %CLEAR TOTAL %CHANGE %CLEAR TOTAL %CHANGE %CLEAR TOTAL %CHANGE %CLEAR
2006 34,671 5.1 71.3 118,691 -2.7 34.5 52,921 6.6 86.6 4,337 -4.3 99.2 210,620 0.8 55.0
2007 33,819 -2.5 71.1 115,124 -3.0 33.1 49,223 -7.0 85.5 4,157 -4.2 98.0 202,323 -3.9 53.5
2008 32,519 -3.8 69.7 107,273 -6.8 34.2 46,690 -5.1 85.2 4,161 0.1 98.1 190,643 -5.8 54.1
2009 32,017 -1.5 70.3 105,694 -1.5 32.4 44,448 -4.8 84.4 3,933 -5.5 98.1 186,092 -2.4 52.8
2010 31,593 -1.3 71.3 94,491 -10.6 29.9 39,780 -10.5 84.3 4,014 2.1 97.6 169,878 -8.7 52.0
*Violent Offences involve the use or threatened use of violence against a person, including homicide, attempted murder, assault, sexual assault and robbery. Robbery is considered a violent offence because, unlike other theft offences, it involves the use or threat of violence.
**Property offences involve unlawful acts to gain property, but do not involve the use or threat of violence against the person. They include offences such as break and enter, theft, mischief, fraud etc.
***'Other' Criminal Code offences include crimes such as disturbing the peace, arson, offensive weapon use, bail violations, prostitution, counterfeiting currency etc.
!Criminal Code traffic offences category includes, but is not limited to the following offences: impaired driving, failure or refusal to provide sample (breath or blood), failure to stop at the scene of an accident and dangerous operation of a motor vehicle.
VIOLENT CRIME, PROPERTY CRIME, OTHER CRIME AND CRIMINAL CODE TRAFFIC OFFENCES
VIOLENT CRIME* PROPERTY CRIME** OTHER CRIME*** CRIMINAL CODE TRAFFIC! TOTAL CRIMINAL CODE
GENERAL CRIME INFORMATION CRIMES REPORTED BY CATEGORY
2010 ANNUAL STATISTICAL REPORT16

TOTAL Rate %CLEAR TOTAL Rate %CLEAR TOTAL Rate %CLEAR TOTAL Rate %CLEAR TOTAL Rate %CLEAR
D11 1,011 969 73.9 3,294 3,156 24.0 1,387 1,329 84.7 246 236 97.2 5,938 5,690 49.7
D12 1,388 1,378 76.1 3,234 3,210 33.4 1,913 1,899 88.8 215 213 98.1 6,750 6,699 59.9
D13 1,189 813 75.5 3,192 2,184 31.9 1,321 904 83.6 117 80 96.6 5,819 3,981 53.9
D14 2,676 1,686 67.0 8,413 5,302 25.7 2,895 1,824 84.6 461 291 98.0 14,445 9,104 47.4
D51 1,997 2,154 63.5 6,569 7,084 35.7 2,197 2,369 83.5 157 169 96.2 10,920 11,776 51.3
D52 1,607 4,806 63.8 7,568 22,631 29.0 3,166 9,468 87.2 152 455 99.3 12,493 37,359 49.1
D53 1,202 669 66.9 5,911 3,291 24.5 1,313 731 68.9 95 53 95.8 8,521 4,745 38.1
D54 1,632 1,127 76.7 3,949 2,728 26.9 2,191 1,513 86.2 192 133 99.5 7,964 5,501 55.2
D55 1,760 1,422 70.8 5,142 4,156 33.6 2,231 1,803 90.5 187 151 98.4 9,320 7,532 55.6
C. F. C. 14,462 1,334 69.8 47,272 4,360 29.3 18,614 1,717 85.1 1,822 168 97.9 82,170 7,578 50.6
D22 1,853 924 75.3 6,395 3,190 33.7 2,461 1,228 80.9 369 184 97.8 11,078 5,526 53.3
D23 1,963 1,158 78.9 5,006 2,954 29.7 2,121 1,252 87.2 229 135 98.3 9,319 5,499 54.8
D31 2,729 1,368 71.1 5,601 2,808 32.2 3,292 1,650 81.8 234 117 94.4 11,856 5,944 56.1
D32 2,152 971 67.9 8,560 3,864 23.5 2,243 1,012 80.8 235 106 97.0 13,190 5,953 41.8
D33 1,246 627 73.3 4,477 2,254 29.7 1,440 725 83.4 122 61 95.1 7,285 3,668 48.9
D41 2,292 1,280 74.7 5,624 3,141 31.6 3,068 1,714 86.6 293 164 97.6 11,277 6,299 57.0
D42 1,777 680 62.2 4,608 1,763 27.6 1,952 747 76.4 281 108 98.9 8,618 3,297 48.1
D43 2,567 1,219 77.1 5,567 2,644 37.7 3,344 1,588 87.0 340 161 97.6 11,818 5,612 62.0
A. F. C. 16,579 1,011 72.7 45,838 2,794 30.4 19,921 1,214 83.4 2,103 128 97.3 84,441 5,147 52.9
NSA 552 N/A 71.2 1,381 N/A 37.7 1,245 N/A 88.3 89 N/A 100.0 3,267 N/A 64.3
Toronto 31,593 1,159 71.3 94,491 3,468 29.9 39,780 1,460 84.3 4,014 147 97.6 169,878 6,235 52.0* 'Mischief' offences are included under 'Property Crime'. For the purposes of other reports, 'mischief' offences may be included under 'Other Criminal Code'.
UNITVIOLENT CRIME* PROPERTY CRIME** OTHER CRIME*** CRIMINAL CODE TRAFFIC! TOTAL CRIMINAL CODE
VIOLENT CRIME, PROPERTY CRIME, OTHER CRIME AND CRIMINAL CODE TRAFFIC OFFENCES
GENERAL CRIME INFORMATION CRIMES REPORTED BY CATEGORY BY UNIT
2010 ANNUAL STATISTICAL REPORT17

Age Males Females Unk. Total % Total
0 to 11 81 264 0 345 12.1
12 to 17 94 688 2 784 27.6
18 to 24 41 570 0 611 21.5
25 to 34 45 411 1 457 16.1
35 to 44 48 271 0 319 11.2
45+ 35 241 1 277 9.8
Unk. 2 37 9 48 1.7
Total 346 2,482 13 2,841 100.0
* Includes "non-assaultive" sexual offences(e.g. Invitation to Sexual Touching; Sexual Exploitation etc.)
Age Males Females Unk. Total % Total
0 to 11 615 375 3 993 4.4
12 to 17 1,006 955 4 1,965 8.6
18 to 24 1,760 2,655 10 4,425 19.4
25 to 34 2,085 2,835 18 4,938 21.7
35 to 44 1,831 2,082 17 3,930 17.3
45+ 2,391 1,922 12 4,325 19.0
Unk. 1,143 385 664 2,192 9.6
Total 10,831 11,209 728 22,768 100.0
Age Males Females Unk. Total % Total
0 to 11 23 8 0 31 0.6
12 to 17 1,305 168 2 1,475 28.3
18 to 24 993 366 2 1,361 26.1
25 to 34 514 296 4 814 15.6
35 to 44 344 195 1 540 10.4
45+ 552 318 3 873 16.8
Unk. 55 34 27 116 2.2
Total 3,786 1,385 39 5,210 100.0
Sexual Assaults*
Non-Sexual Assaults
Robberies
0
200
400
600
800
1,000
1,200
1,400
1,600
0 to 11 12 to 17 18 to 24 25 to 34 35 to 44 45+ Unk.
0
1,000
2,000
3,000
4,000
5,000
6,000
0 to 11 12 to 17 18 to 24 25 to 34 35 to 44 45+ Unk.
0
100
200
300
400
500
600
700
800
900
0 to 11 12 to 17 18 to 24 25 to 34 35 to 44 45+ Unk.
OFFENCE TOTALS BY VICTIM AGE AND GENDER
2010 ANNUAL STATISTICAL REPORT18

Age Males Females Unknown Total % Total
0 to 11 739 669 3 1,411 4.5
12 to 17 2,443 1,856 9 4,308 13.6
18 to 24 2,885 3,732 12 6,629 21.0
25 to 34 2,699 3,650 25 6,374 20.2
35 to 44 2,251 2,627 18 4,896 15.5
45+ 3,027 2,541 17 5,585 17.7
Unk. 1,213 472 705 2,393 7.6
Total 15,257 15,547 789 31,593 100.0
* Violent crime includes homicide and homicide related offences, sexual assaults, sexual offences, non-sexual assaults, abduction, and robberies.
Age Males Females Total % Total
12 to 17 1,865 432 2,297 14.0
18 to 24 3,141 631 3,772 23.0
25 to 34 3,521 615 4,136 25.2
35 to 44 2,669 485 3,154 19.2
45+ 2,654 390 3,044 18.6
Total 13,850 2,553 16,403 100.0
OFFENCES 2006 2007 2008 2009 2010
Attempted Murder 10 11 5 9 5
Aggravated Assault 8 4 6 1 7
Assault With Weapon or Causing Bodily Harm 109 126 109 134 63
Assault 173 159 156 75 73
Assault Police Officer 733 888 883 889 937
Assault to Resist Arrest 674 695 629 522 529
Dangerous operation motor vehicle causing bodily harm 5 7 0 1 1
Total Offences 1,712 1,890 1,788 1,631 1,615
Selected Offences Against Police Officers
Persons Charged Violent Crime
Violent Crime Against Victims by Age and Sex*
Note: A person can be charged with multiple offences and may be included in more than one category.
1,000
1,100
1,200
1,300
1,400
1,500
1,600
1,700
1,800
1,900
2,000
2006 2007 2008 2009 2010
0
1,000
2,000
3,000
4,000
5,000
6,000
7,000
0 to 11 12 to 17 18 to 24 25 to 34 35 to 44 45+ Unk.
0
1,000
2,000
3,000
4,000
5,000
12 to 17 18 to 24 25 to 34 35 to 44 45+
OFFENCE TOTALS BY VICTIM AGE AND GENDER
2010 ANNUAL STATISTICAL REPORT19

Age Males Females Total % Total
12 to 17 230 22 252 16.1
18 to 24 377 27 404 25.8
25 to 34 288 29 317 20.2
35 to 44 287 31 318 20.3
45+ 260 17 277 17.7
Total 1,442 126 1,568 100.0
Age Males Females Total % Total
12 to 17 845 288 1,133 9.5
18 to 24 2,209 532 2,741 23.0
25 to 34 2,724 527 3,251 27.3
35 to 44 2,059 405 2,464 20.7
45+ 1,995 324 2,319 19.5
Total 9,832 2,076 11,908 100.0
Age Males Females Total % Total
12 to 17 109 2 111 12.1
18 to 24 168 1 169 18.4
25 to 34 241 3 244 26.5
35 to 44 203 4 207 22.5
45+ 187 2 189 20.5
Total 908 12 920 100.0Note: A person can be charged with multiple offences and may be included in more than one category.
Break and Enters
Non-Sexual Assaults
Sexual Assaults
Note: A person can be charged with multiple offences and may be included in more than one category.
Note: A person can be charged with multiple offences and may be included in more than one category.
0
50
100
150
200
250
300
350
400
450
12 to 17 18 to 24 25 to 34 35 to 44 45+
0
500
1,000
1,500
2,000
2,500
3,000
3,500
12 to 17 18 to 24 25 to 34 35 to 44 45+
0
50
100
150
200
250
300
12 to 17 18 to 24 25 to 34 35 to 44 45+
PERSONS CHARGED BY ACCUSED AGE AND GENDER
2010 ANNUAL STATISTICAL REPORT20

Age Males Females Total % Total
12 to 17 898 115 1,013 49.5
18 to 24 556 38 594 29.0
25 to 34 219 24 243 11.9
35 to 44 109 14 123 6.0
45+ 69 6 75 3.7
Total 1,851 197 2,048 100.0
Age Males Females Total % Total
12 to 17 737 77 814 11.8
18 to 24 2,173 237 2,410 34.9
25 to 34 1,705 208 1,913 27.7
35 to 44 835 150 985 14.3
45+ 671 118 789 11.4
Total 6,121 790 6,911 100.0
Age Males Females Total % Total
12 to 17 6 1 7 0.3
18 to 24 314 66 380 17.3
25 to 34 679 100 779 35.5
35 to 44 407 52 459 20.9
45+ 515 57 572 26.0
Total 1,921 276 2,197 100.0Note: A person can be charged with multiple offences and may be included in more than one category.
Robberies
Controlled Drugs and Substances Act
Drinking and Driving Offences
Note: A person can be charged with multiple offences and may be included in more than one category.
Note: A person can be charged with multiple offences and may be included in more than one category.
0
200
400
600
800
1,000
1,200
12 to 17 18 to 24 25 to 34 35 to 44 45+
0
500
1,000
1,500
2,000
2,500
3,000
12 to 17 18 to 24 25 to 34 35 to 44 45+
0
100
200
300
400
500
600
700
800
900
12 to 17 18 to 24 25 to 34 35 to 44 45+
PERSONS CHARGED BY ACCUSED AGE AND GENDER
2010 ANNUAL STATISTICAL REPORT21

1st Degree Murder*
2nd Degree Murder
Manslaughter
Attempted Murder
Sexual Assault
**
Other Assault
Robbery
Breaak & Enter
Motor Vehicle Theft***
Theft Over
Theft Under
Fraud
Offensive Weapons
Other
Total Non-Traffic
Traffic
Total
Reported 20 13 1 67 932 11,065 1,936 5,129 1,707 570 26,383 4,077 1,839 26,609 80,348 1,822 82,170 0
Cleared 5 12 1 47 607 8,208 823 1,641 188 77 5,790 1,669 1,720 18,966 39,754 1,783 41,537
%Clear 25.0 92.3 100.0 70.1 65.1 74.2 42.5 32.0 11.0 13.5 21.9 40.9 93.5 71.3 49.5 97.9 50.6
Reported 25 2 1 58 1,211 11,431 3,239 6,746 3,747 686 20,168 5,851 2,456 26,717 82,338 2,103 84,441 0
Cleared 6 2 1 21 936 9,248 1,290 1,628 376 166 5,391 2,449 2,299 18,775 42,588 2,047 44,635
%Clear 24.0 100.0 100.0 36.2 77.3 80.9 39.8 24.1 10.0 24.2 26.7 41.9 93.6 70.3 51.7 97.3 52.9
Reported 0 0 0 1 175 272 35 31 86 28 323 723 228 1,276 3,178 89 3,267 0
Cleared 0 0 0 1 122 188 28 20 21 18 50 723 226 1,082 2,479 89 2,568
%Clear 0.0 0.0 0.0 100.0 69.7 69.1 80.0 64.5 24.4 64.3 15.5 100.0 99.1 84.8 78.0 100.0 78.6
Reported 45 15 2 126 2,318 22,768 5,210 11,906 5,540 1,284 46,874 10,651 4,523 54,602 165,864 4,014 169,878 169,172
Cleared 11 14 2 69 1,665 17,644 2,141 3,289 585 261 11,231 4,841 4,245 38,823 84,821 3,919 88,740
%Clear 24.4 93.3 100.0 54.8 71.8 77.5 41.1 27.6 10.6 20.3 24.0 45.5 93.9 71.1 51.1 97.6 52.2
*Murder and Manslaughter relates to the number of and type of offences reported and do not necessarily indicate the number of persons murdered.
**Sexual Assaults do not include non assaultive Sexual offences.
***Includes motor cycles, snow vehicles and all attempts.
CENTRAL FIELD
AREA FIELD
OUTSIDE TORONTO
TORONTO POLICE SERVICE
CRIMINAL CODE OFFENCES REPORTED AND CLEARED
2010 ANNUAL STATISTICAL REPORT22

1st Degree Murder*
2nd Degree Murder
Manslaughter
Attempted Murder
Sexual Assault **
Other Assault
Robbery
Breaak & Enter
Motor Vehicle Theft***
Theft Over
Theft Under
Fraud
Offensive Weapons
Other
Total Non-Traffic
Traffic
Total
Reported 1 2 0 6 68 753 144 435 137 44 1,697 167 123 2,115 5,692 246 5,938
Cleared 0 2 0 5 50 598 58 108 15 5 275 52 115 1,429 2,712 239 2,951
%Clear 0.0 100.0 0.0 83.3 73.5 79.4 40.3 24.8 10.9 11.4 16.2 31.1 93.5 67.6 47.6 97.2 49.7
Reported 6 1 0 7 95 1,023 194 366 270 30 1,372 321 221 2,629 6,535 215 6,750
Cleared 2 1 0 3 75 842 77 87 22 7 439 122 206 1,952 3,835 211 4,046
%Clear 33.3 100.0 0.0 42.9 78.9 82.3 39.7 23.8 8.1 23.3 32.0 38.0 93.2 74.2 58.7 98.1 59.9
Reported 1 1 0 15 84 849 202 536 211 54 1,340 387 156 1,866 5,702 117 5,819
Cleared 1 1 0 15 63 646 140 228 26 10 253 231 154 1,253 3,021 113 3,134
%Clear 100.0 100.0 0.0 100.0 75.0 76.1 69.3 42.5 12.3 18.5 18.9 59.7 98.7 67.1 53.0 96.6 53.9
Reported 1 3 0 22 178 2,080 329 917 247 83 4,790 616 237 4,481 13,984 461 14,445
Cleared 0 3 0 11 106 1,527 86 243 16 10 818 260 220 3,100 6,400 452 6,852
%Clear 0.0 100.0 0.0 50.0 59.6 73.4 26.1 26.5 6.5 12.0 17.1 42.2 92.8 69.2 45.8 98.0 47.4
*Murder and Manslaughter relates to the number of and type of offences reported and do not necessarily indicate the number of persons murdered.
**Sexual Assaults do not include non assaultive Sexual offences.
***Includes motor cycles, snow vehicles and all attempts.
11 DIVISION
12 DIVISION
13 DIVISION
14 DIVISION
CRIMINAL CODE OFFENCES REPORTED AND CLEARED
2010 ANNUAL STATISTICAL REPORT23
1st Degree Murder*
2nd Degree Murder
Manslaughter
Attempted Murder
Sexual Assault **
Other Assault
Robbery
Breaak & Enter
Motor Vehicle Theft***
Theft Over
Theft Under
Fraud
Offensive Weapons
Other
Total Non-Traffic
Traffic
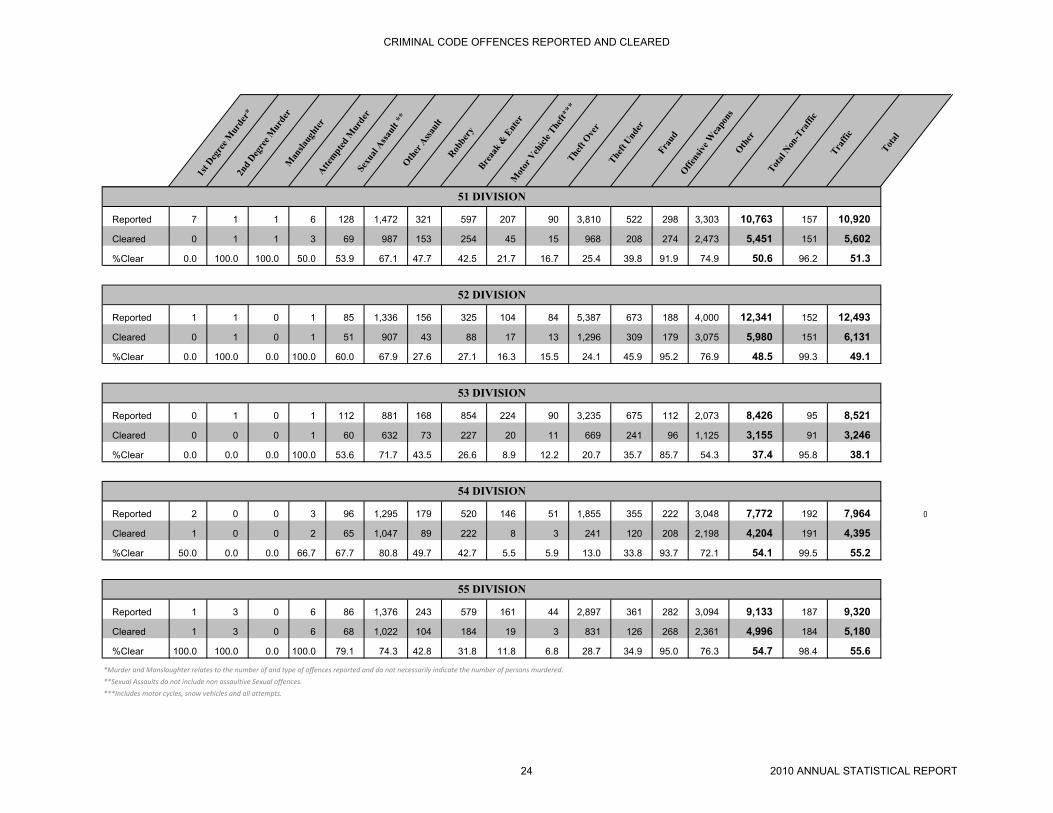
Total
Reported 7 1 1 6 128 1,472 321 597 207 90 3,810 522 298 3,303 10,763 157 10,920
Cleared 0 1 1 3 69 987 153 254 45 15 968 208 274 2,473 5,451 151 5,602
%Clear 0.0 100.0 100.0 50.0 53.9 67.1 47.7 42.5 21.7 16.7 25.4 39.8 91.9 74.9 50.6 96.2 51.3
Reported 1 1 0 1 85 1,336 156 325 104 84 5,387 673 188 4,000 12,341 152 12,493
Cleared 0 1 0 1 51 907 43 88 17 13 1,296 309 179 3,075 5,980 151 6,131
%Clear 0.0 100.0 0.0 100.0 60.0 67.9 27.6 27.1 16.3 15.5 24.1 45.9 95.2 76.9 48.5 99.3 49.1
Reported 0 1 0 1 112 881 168 854 224 90 3,235 675 112 2,073 8,426 95 8,521
Cleared 0 0 0 1 60 632 73 227 20 11 669 241 96 1,125 3,155 91 3,246
%Clear 0.0 0.0 0.0 100.0 53.6 71.7 43.5 26.6 8.9 12.2 20.7 35.7 85.7 54.3 37.4 95.8 38.1
Reported 2 0 0 3 96 1,295 179 520 146 51 1,855 355 222 3,048 7,772 192 7,964 0
Cleared 1 0 0 2 65 1,047 89 222 8 3 241 120 208 2,198 4,204 191 4,395
%Clear 50.0 0.0 0.0 66.7 67.7 80.8 49.7 42.7 5.5 5.9 13.0 33.8 93.7 72.1 54.1 99.5 55.2
Reported 1 3 0 6 86 1,376 243 579 161 44 2,897 361 282 3,094 9,133 187 9,320
Cleared 1 3 0 6 68 1,022 104 184 19 3 831 126 268 2,361 4,996 184 5,180
%Clear 100.0 100.0 0.0 100.0 79.1 74.3 42.8 31.8 11.8 6.8 28.7 34.9 95.0 76.3 54.7 98.4 55.6
*Murder and Manslaughter relates to the number of and type of offences reported and do not necessarily indicate the number of persons murdered.
**Sexual Assaults do not include non assaultive Sexual offences.
***Includes motor cycles, snow vehicles and all attempts.
55 DIVISION
51 DIVISION
52 DIVISION
53 DIVISION
54 DIVISION
CRIMINAL CODE OFFENCES REPORTED AND CLEARED
2010 ANNUAL STATISTICAL REPORT24

1st Degree Murder*
2nd Degree Murder
Manslaughter
Attempted Murder
Sexual Assault **
Other Assault
Robbery
Breaak & Enter
Motor Vehicle Theft***
Theft Over
Theft Under
Fraud
Offensive Weapons
Other
Total Non-Traffic
Traffic
Total
Reported 1 1 0 4 179 1,285 299 846 500 117 3,045 666 225 3,541 10,709 369 11,078
Cleared 0 1 0 2 144 985 186 403 89 44 910 195 213 2,368 5,540 361 5,901
%Clear 0.0 100.0 0.0 50.0 80.4 76.7 62.2 47.6 17.8 37.6 29.9 29.3 94.7 66.9 51.7 97.8 53.3
Reported 3 0 0 6 140 1,360 411 721 620 109 2,134 589 398 2,599 9,090 229 9,319
Cleared 2 0 0 4 125 1,186 191 203 75 24 576 226 381 1,892 4,885 225 5,110
%Clear 66.7 0.0 0.0 66.7 89.3 87.2 46.5 28.2 12.1 22.0 27.0 38.4 95.7 72.8 53.7 98.3 54.8
Reported 7 0 0 17 177 1,899 514 805 620 83 2,303 638 499 4,060 11,622 234 11,856
Cleared 0 0 0 4 131 1,482 222 326 58 12 596 259 448 2,896 6,434 221 6,655
%Clear 0.0 0.0 0.0 23.5 74.0 78.0 43.2 40.5 9.4 14.5 25.9 40.6 89.8 71.3 55.4 94.4 56.1
Reported 2 0 0 12 160 1,448 479 1,192 631 121 4,056 1,242 215 3,397 12,955 235 13,190
Cleared 1 0 0 5 122 1,099 193 102 58 29 732 522 202 2,219 5,284 228 5,512
%Clear 50.0 0.0 0.0 41.7 76.3 75.9 40.3 8.6 9.2 24.0 18.0 42.0 94.0 65.3 40.8 97.0 41.8
Reported 1 0 0 5 102 841 253 667 246 61 2,143 606 148 2,090 7,163 122 7,285
Cleared 0 0 0 2 82 720 70 105 14 9 638 257 133 1,414 3,444 116 3,560
%Cleared 0.0 0.0 0.0 40.0 80.4 85.6 27.7 15.7 5.7 14.8 29.8 42.4 89.9 67.7 48.1 95.1 48.9
*Murder and Manslaughter relates to the number of and type of offences reported and do not necessarily indicate the number of persons murdered.
**Sexual Assaults do not include non assaultive Sexual offences.
***Includes motor cycles, snow vehicles and all attempts.
33 DIVISION
22 DIVISION
23 DIVISION
31 DIVISION
32 DIVISION
CRIMINAL CODE OFFENCES REPORTED AND CLEARED
2010 ANNUAL STATISTICAL REPORT25

1st Degree Murder*
2nd Degree Murder
Manslaughter
Attempted Murder
Sexual Assault **
Other Assault
Robbery
Breaak & Enter
Motor Vehicle Theft***
Theft Over
Theft Under
Fraud
Offensive Weapons
Other
Total Non-Traffic
Traffic
Total
Reported 3 1 1 7 145 1,631 400 884 380 68 2,287 740 327 4,110 10,984 293 11,277
Cleared 1 1 1 2 110 1,355 139 191 22 18 571 390 303 3,040 6,144 286 6,430
%Clear 33.3 100.0 100.0 28.6 75.9 83.1 34.8 21.6 5.8 26.5 25.0 52.7 92.7 74.0 55.9 97.6 57.0
Reported 3 0 0 2 128 1,130 452 823 379 79 1,743 679 240 2,679 8,337 281 8,618
Cleared 0 0 0 1 79 858 119 108 17 17 447 262 231 1,728 3,867 278 4,145
%Clear 0.0 0.0 0.0 50.0 61.7 75.9 26.3 13.1 4.5 21.5 25.6 38.6 96.3 64.5 46.4 98.9 48.1
Reported 5 0 0 5 180 1,837 431 808 371 48 2,457 691 404 4,241 11,478 340 11,818
Cleared 2 0 0 1 143 1,563 170 190 43 13 921 338 388 3,218 6,990 332 7,322
%Cleared 40.0 0.0 0.0 20.0 79.4 85.1 39.4 23.5 11.6 27.1 37.5 48.9 96.0 75.9 60.9 97.6 62.0
*Murder and Manslaughter relates to the number of and type of offences reported and do not necessarily indicate the number of persons murdered.
**Sexual Assaults do not include non assaultive Sexual offences.
***Includes motor cycles, snow vehicles and all attempts.
43 DIVISION
41 DIVISION
42 DIVISION
CRIMINAL CODE OFFENCES REPORTED AND CLEARED
2010 ANNUAL STATISTICAL REPORT26

Year Total % Change Non-Rep
2006 53,699 -2.4 N/A
2007 56,280 4.8 N/A
2008 55,857 -0.8 N/A
2009 56,229 0.7 N/A
2010 54,911 -2.3 N/A
*Total includes 10 collisions involving other types of vehicles ie. Trains not included in these charts.
Includes Non-Reportable.
Year Collisions % Change Killed
2006 57 9.6 57
2007 49 -14.0 52
2008 51 4.1 54
2009 45 -11.8 48
2010 42 -6.7 43
Year Collisions % Change Injured
2006 11,994 7.8 16,637
2007 11,772 -1.9 16,642
2008 11,051 -6.1 15,964
2009 11,576 4.8 16,585
2010 11,883 2.7 18,291
Year Collisions % Change
2006 41,695 -2.1
2007 44,508 6.7
2008 44,836 0.7
2009 44,653 -0.4
2010 43,020 -3.7
General Note: 2010 statistics are unofficial as Toronto Traffic Data Centre and Safety Bureau has not yet officially released them as of press time.
However, any variances to these figures will be minimal. Detailed Toronto Traffic Collisions information can be found in the Transportation Services
Traffic Managemennt Centre section of the City of Toronto Website.
Property Damage Collissions
Injury Collisions and Persons Injured
Fatal Collisions and Persons Killed
Total Collisions*
52,000
53,000
54,000
55,000
56,000
57,000
2006 2007 2008 2009 2010
0
10
20
30
40
50
60
2006 2007 2008 2009 2010
Collisions Killed
0
5,000
10,000
15,000
20,000
2006 2007 2008 2009 2010
Collisions Injured
40,000
41,000
42,000
43,000
44,000
45,000
46,000
2006 2007 2008 2009 2010
TRAFFIC COLLISIONS AND OFFENCES
27 2010 ANNUAL STATISTICAL REPORT

Case Unit Dangerous Driving Drive While Disqualified Drive While Impaired Fail to Remain Over 80 Refuse Sample Total Charges
D11 20 9 87 23 113 14 266
D12 24 20 56 27 89 15 231
D13 10 6 40 4 50 20 130
D14 45 10 120 33 175 31 414
D51 11 6 46 11 47 14 135
D52 8 2 22 3 29 7 71
D53 7 0 23 6 29 11 76
D54 18 9 58 18 84 24 211
D55 18 15 47 10 63 16 169
Total - Central Field 161 77 499 135 679 152 1,703
D22 28 26 98 22 109 17 300
D23 19 14 76 15 88 23 235
D31 31 14 83 17 74 17 236
D32 26 2 62 12 71 17 190
D33 15 15 35 13 35 14 127
D41 33 20 79 21 107 21 281
D42 16 16 108 17 133 29 319
D43 53 18 109 31 120 32 363
Total - Area Field 221 125 650 148 737 170 2,051
Other Unit 14 0 6 5 11 1 37
TSV 63 13 178 49 281 43 627
Total-Other 77 13 184 54 292 44 664
Grand Total 459 215 1,333 337 1,708 366 4,418
2006 2007 2008 2009 2010Vehicles Stopped 399,419 426,485 409,429 409,274 398,526
Charges Laid** 282 344 380 490 406
Charges Laid defined as all instances where a CIPS offence is linked to a specific person.
Release type not taken into account.
R.I.D.E. Information
Criminal Code Driving
TRAFFIC COLLISIONS AND OFFENCES PERSONS CHARGED AND R.I.D.E. DATA
2010 ANNUAL STATISTICAL REPORT28
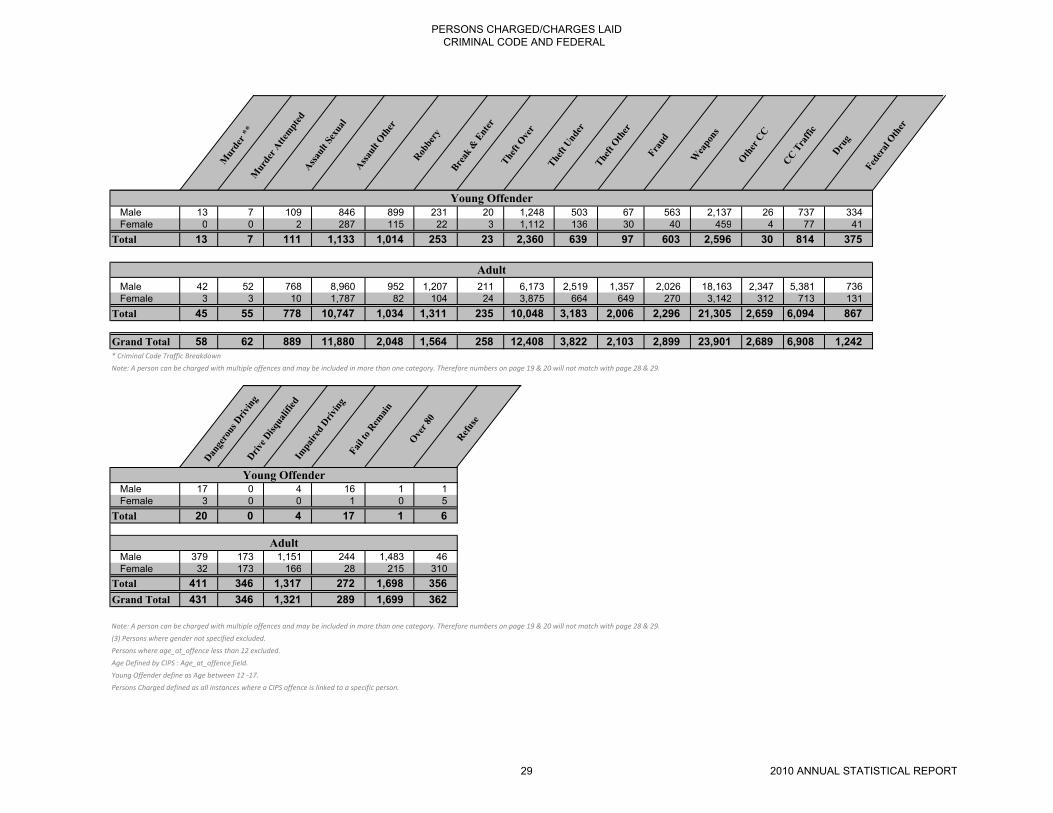
Murder **
Murder Attempted
Assault Sexual
Assault Other
Robbery
Break & Enter
Theft Over
Theft Under
Theft Other
Fraud
Weapons
Other CC
CC Traffic
Drug
Federal Other
Young Offender
Male 13 7 109 846 899 231 20 1,248 503 67 563 2,137 26 737 334
Female 0 0 2 287 115 22 3 1,112 136 30 40 459 4 77 41
Total 13 7 111 1,133 1,014 253 23 2,360 639 97 603 2,596 30 814 375
Male 42 52 768 8,960 952 1,207 211 6,173 2,519 1,357 2,026 18,163 2,347 5,381 736
Female 3 3 10 1,787 82 104 24 3,875 664 649 270 3,142 312 713 131
Total 45 55 778 10,747 1,034 1,311 235 10,048 3,183 2,006 2,296 21,305 2,659 6,094 867
Grand Total 58 62 889 11,880 2,048 1,564 258 12,408 3,822 2,103 2,899 23,901 2,689 6,908 1,242
* Criminal Code Traffic Breakdown
Note: A person can be charged with multiple offences and may be included in more than one category. Therefore numbers on page 19 & 20 will not match with page 28 & 29.
Young Offender
Adult
Dangerous Driving
Drive Disqualified
Impaired Driving
Fail to Remain
Over 80
Refuse
Young Offender
Male 17 0 4 16 1 1
Female 3 0 0 1 0 5
Total 20 0 4 17 1 6
Male 379 173 1,151 244 1,483 46
Female 32 173 166 28 215 310
Total 411 346 1,317 272 1,698 356
Grand Total 431 346 1,321 289 1,699 362
Note: A person can be charged with multiple offences and may be included in more than one category. Therefore numbers on page 19 & 20 will not match with page 28 & 29.
(3) Persons where gender not specified excluded.
Persons where age_at_offence less than 12 excluded.
Age Defined by CIPS : Age_at_offence field.
Young Offender define as Age between 12 -17.
Persons Charged defined as all instances where a CIPS offence is linked to a specific person.
Young Offender
Adult
PERSONS CHARGED/CHARGES LAID CRIMINAL CODE AND FEDERAL
2010 ANNUAL STATISTICAL REPORT29
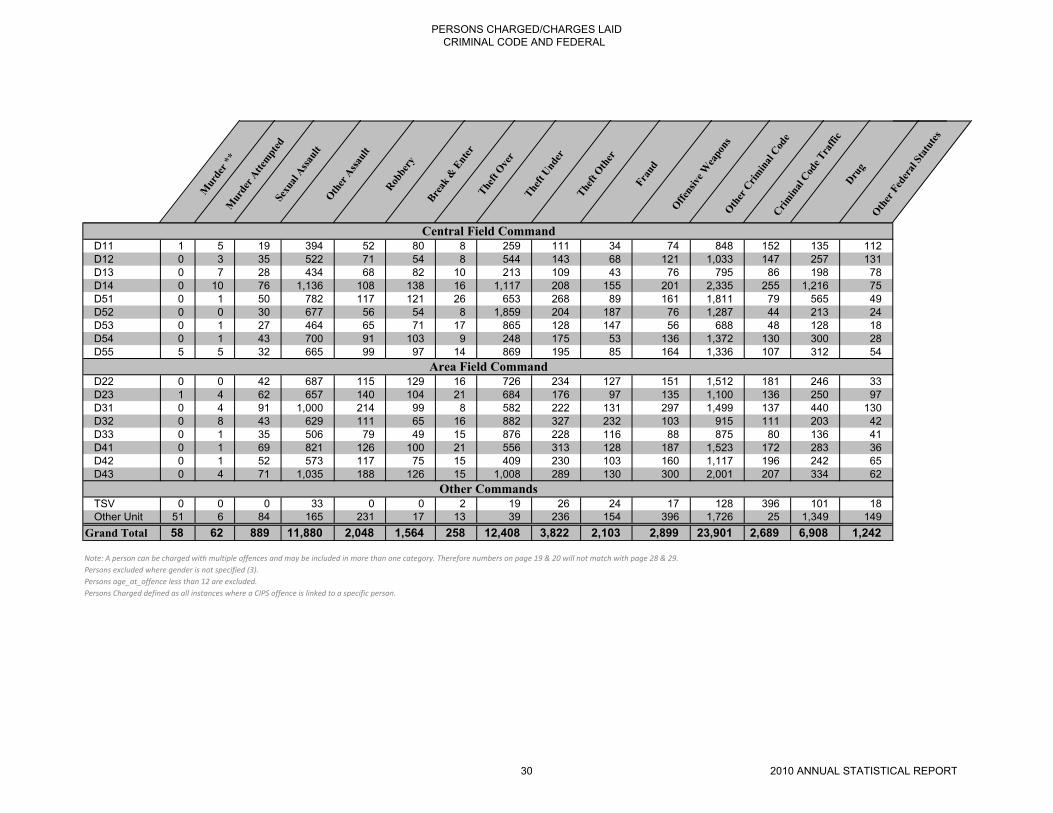
Murder **
Murder Attempted
Sexual Assault
Other Assault
Robbery
Break & Enter
Theft Over
Theft Under
Theft Other
Fraud
Offensive Weapons
Other Criminal Code
Criminal Code Traffic
Drug
Other Federal Statutes
Central Field CommandD11 1 5 19 394 52 80 8 259 111 34 74 848 152 135 112
D12 0 3 35 522 71 54 8 544 143 68 121 1,033 147 257 131
D13 0 7 28 434 68 82 10 213 109 43 76 795 86 198 78
D14 0 10 76 1,136 108 138 16 1,117 208 155 201 2,335 255 1,216 75
D51 0 1 50 782 117 121 26 653 268 89 161 1,811 79 565 49
D52 0 0 30 677 56 54 8 1,859 204 187 76 1,287 44 213 24
D53 0 1 27 464 65 71 17 865 128 147 56 688 48 128 18
D54 0 1 43 700 91 103 9 248 175 53 136 1,372 130 300 28
D55 5 5 32 665 99 97 14 869 195 85 164 1,336 107 312 54
D22 0 0 42 687 115 129 16 726 234 127 151 1,512 181 246 33
D23 1 4 62 657 140 104 21 684 176 97 135 1,100 136 250 97
D31 0 4 91 1,000 214 99 8 582 222 131 297 1,499 137 440 130
D32 0 8 43 629 111 65 16 882 327 232 103 915 111 203 42
D33 0 1 35 506 79 49 15 876 228 116 88 875 80 136 41
D41 0 1 69 821 126 100 21 556 313 128 187 1,523 172 283 36
D42 0 1 52 573 117 75 15 409 230 103 160 1,117 196 242 65
D43 0 4 71 1,035 188 126 15 1,008 289 130 300 2,001 207 334 62
TSV 0 0 0 33 0 0 2 19 26 24 17 128 396 101 18
Other Unit 51 6 84 165 231 17 13 39 236 154 396 1,726 25 1,349 149
Grand Total 58 62 889 11,880 2,048 1,564 258 12,408 3,822 2,103 2,899 23,901 2,689 6,908 1,242
Note: A person can be charged with multiple offences and may be included in more than one category. Therefore numbers on page 19 & 20 will not match with page 28 & 29.
Persons excluded where gender is not specified (3).
Persons age_at_offence less than 12 are excluded.
Persons Charged defined as all instances where a CIPS offence is linked to a specific person.
Area Field Command
Central Field Command
Other Commands
PERSONS CHARGED/CHARGES LAID CRIMINAL CODE AND FEDERAL
2010 ANNUAL STATISTICAL REPORT30

Units L.L.A. - Drunk L.L.A. - Other By-Laws H.T.A. Total
11 Division 291 343 1903 25229 27,766
12 Division 222 407 2254 16072 18,955
13 Division 146 482 857 22757 24,242
14 Division 603 2265 3639 30642 37,149
51 Division 583 2478 4252 22294 29,607
52 Division 930 2314 6100 16070 25,414
53 Division 209 443 7363 20489 28,504
54 Division 177 325 1877 24273 26,652
55 Division 289 647 3370 20336 24,642
Central Field Total 3,450 9,704 31,615 198,162 242,931
22 Division 161 361 450 22948 23920
23 Division 240 738 402 27913 29293
31 Division 248 510 887 36875 38520
32 Division 157 289 1086 26333 27865
33 Division 60 59 644 25765 26528
41 Division 179 886 2288 25730 29083
42 Division 156 620 679 28216 29671
43 Division 196 549 1253 25682 27680
Area Field Total 1,397 4,012 7,689 219,462 232,560
Traffic Services 85 319 5,026 95,057 100,487
All Other Units 225 441 991 7,934 9,591
Other Unit Total 310 760 6,017 102,991 110,078
Service Total 5,157 14,476 45,321 520,615 585,569
Selected Provincial Offences (Charges Laid)
PERSONS CHARGED/CHARGES LAID PROVINCIAL/BY-LAW
2010 ANNUAL STATISTICAL REPORT31

Type Total
Rifle 1,113
Pistol 793
Shotgun 604
Airgun 486
Revolver 463
Toy Gun 77
Antique 48
Other** 47
Replica 42
Sawed-off Shotgun 39
Submachine Gun 37
Starters Pistol 33
Sawed-off Rifle 14
Derringer 8
Machine Gun 7
Total 3,811
Type Total
Handgun 63
Rifle 18
Air Guns 18
Shotgun 7
Antique/Paintball/Flare/Other 2
Machine Gun 1
Total 109
Type Total
Residential 24
Street 4
Commercial 1
TOTAL INCIDENTS 29
Firearm Thefts - By Premise Type
Firearm Seizures
Guns Reported Stolen to Toronto Police Service
Other**: This type of firearm includes zip guns, flare guns, stun guns, paintball guns and homemade firearms.
0 10 20 30 40 50 60 70
Handgun
Rifle
Air Guns
Shotgun
Antique/Paintball/Flare/Other
Machine Gun
0 200 400 600 800 1,000 1,200
Rifle
Pistol
Shotgun
Airgun
Revolver
Toy Gun
Antique
Other**
Replica
Sawed-off Shotgun
Submachine Gun
Starters Pistol
Sawed-off Rifle
Derringer
Machine Gun
0 5 10 15 20 25 30
Residential
Street
Commercial
FIREARMS SEIZURES AND THEFTS
32 2010 ANNUAL STATISTICAL REPORT

Classification Total % Total
Crime 715 18.8
Non-Crime 3,096 81.2
Total 3,811
Type Total % Total
Pistol 258 36.1
Air Gun 150 21.0
Rifle 109 15.2
Revolver 66 9.2
Sawed-off Shotgun 33 4.6
Shotgun 30 4.2
Toy Gun 26 3.6
Sawed-off Rifle 11 1.5
Other** 9 1.3
Replica 9 1.3
Starters Pistol 6 0.8
Submachine Gun 3 0.4
Machine Gun 3 0.4
Derringer 1 0.1
Antique 1 0.1
Total 715
*Other: This type of firearm includes zip guns, flare guns, stun guns, paintball guns and homemade firearms.
Classification Total % Total
Prohibited 235 32.9
Deemed Non-Firearm* 201 28.1
Restricted 150 21.0
Non-Restricted 127 17.8
Antique 2 0.3
Total 715
*Deemed Non-Firearm: These weapons are deemed not to be firearms as defined by section 84 (3) of the Criminal Code.
This classification can include any antique firearm, air guns, nail guns, flare guns and toy guns
Crime Gun - Firearm Classification definitions appear in Appendix A at the end of this report
Where Reported Total % Total
Toronto 6 8.5
Outside Toronto 65 91.5
Total 71
Note: 71 is part of total gun seizure from 2010.
Crime Gun - Firearm Type
Gun Seizures
Crime Gun - Firearm Classification
Stolen Firearms – Recovered By Toronto Police Service
Pistol Air Gun Rifle
Revolver Sawed-off Shotgun Shotgun
Toy Gun Sawed-off Rifle Other**
Replica Starters Pistol Submachine Gun
Machine Gun Derringer
Crime Non-Crime
Prohibited
Deemed Non-Firearm*
Restricted
Non-Restricted
Antique
Toronto Outside Toronto
FIREARMS SEIZURES AND THEFTS
33 2010 ANNUAL STATISTICAL REPORT

Shotgun Pistol Revolver
Remington Smith & Wesson Smith & Wesson
Winchester Glock Colt
Cooey Beretta Iver Johnson
Browning Ruger Taurus
Ithaca Hi-Point Firearms Rossi
Mossberg Colt Ruger
Stevens SIG Sauer Enfield
Baikal Taurus Harrington & Richardson
Harrington & Richardson Walther Beretta
IGA Bryco Arminius
Shotgun Pistol Revolver
12 GA 9MM 38 SPL
12 GA x 2 3/4 45 Auto 357 MAG
12 GA x 3" 40 S&W 38 S&W
410 GA 380 Auto 22 LR
16 GA 22 LR 44 MAG
Type Total
Pistol 26
Revolver 17
Rifle 10
Sawed-off Shotgun 9
Shotgun 5
Sawed-off Rifle 4
Total 71
Savage
US Rifle
Cooey
Note: 71 is part of total gun seizure from 2010.
*Based upon seizure from TPS, received and processed by Gun & Gang unit.
*Based upon seizure from TPS, received and processed by Gun & Gang unit.
Top 10 Manufacturers by Firearm Type*
Top 5 Calibres by Firearm Type*
Rifle
Ruger
Winchester
Marlin
Browning
Lee-Enfield
Norinco
Mauser
Rifle
Types of Firearms Stolen and Recovered in Toronto
22 LR
22
7.62x54R Russian
30-06
7.62 MM
0
5
10
15
20
25
30
Pistol Revolver Rifle Sawed-off Shotgun Shotgun Sawed-off Rifle
FIREARMS SEIZURES AND THEFTS
34 2010 ANNUAL STATISTICAL REPORT

Top 20 Offences related to Firearms Seized
Unauthorized Possession Of A Firearm (1999) C.C. 91 (1)
Possession Of A Firearm Knowing Its Possession Is Unauthorized C.C. 92
Careless Storage Of A Firearm (1999) C.C. 86
Possession Of Firearm Obtained By The Commission Of An Offence C.C. 96 (1)
Possession For The Purpose Cocaine C.D.S.A. 5 (3) (A)
Possession Of A Prohibited Firearm With Ammunition (1999) C.C. 95 (1)
Possession Of Proceeds Of Crime C.C. 354 (1) (A)
Possession Of Firearm Contrary To Prohibition Order C.C. 117
Fail To Comply Recognizance C.C. 145
Careless Storage Ammunition C.C. 86
Possession Of A Restricted Firearm With Ammunition (1999) C.C. 95 (1)
Possession Of Cocaine C.D.S.A. 4 (3)
Unauthorized Possession Of A Prohibited Device (1999) C.C. 91 (2)
Weapons Dangerous C.C. 88 (1)
Possession Of Marihuana (Under) C.D.S.A. 4 (5)
Unauthorized Presence Of A Firearm In A Motor Vehicle (1999) C.C. 94 (1)
Traffic In Cocaine C.D.S.A. 5 (3) (A)
Unauthorized Possession Of A Prohibited Weapon (1999) C.C. 91 (2)
Possession Property Obtained By Crime (Under) C.C. 354
Possession For The Purpose Marihuana (Under) C.D.S.A. 5 (4)
2010 ANNUAL STATISTICAL REPORT
FIREARMS SEIZURES AND THEFTS
2010 ANNUAL STATISTICAL REPORT35

APPENDIX A:
FIREARMS CLASSIFICATION DEFINITIONS
2010 ANNUAL STATISTICAL REPORT2010 ANNUAL STATISTICAL REPORT
Ammunition means a cartridge containing a projectile designed to be discharged from a firearm and, without
restricting the generality of the foregoing, includes a caseless cartridge and a shot shell (Source: Criminal Code of
Canada S.84).
Antique Firearm – means
(a) any firearm manufactured before 1898 that was not designed to discharge rim-fire or centre-fire
ammunition and that has not been re-designed to discharge such ammunition, or
(b) any firearm that is prescribed to be an antique firearm.
(Source: Criminal Code of Canada S.84).
Automatic Firearm means a firearm that is capable of, or assembled or designed and manufactured with the
capability of, discharging projectiles in rapid succession during one pressure of the trigger. (Source: Criminal Code
of Canada S.84).
Deemed Non-Firearm - These items are firearms that do not fall within any of these other classes. They are pellet
guns, BB guns, toy guns, replica firearms (Source: Criminal Code of Canada S.84).
Handgun means a firearm that is designed, altered or intended to be aimed and fired by the action of one hand,
whether or not it has been redesigned or subsequently altered to be aimed and fired by the action of both hands
(Source: Criminal Code of Canada S.84).
Imitation Firearm means any thing that imitates a firearm, and includes a replica firearm;
Non-Restricted- This is not a defined term in the Criminal Code. It covers all the guns not otherwise prohibited or
restricted. These are mainly hunting and sporting guns (rifles and shotguns). (Source: Toronto Police Service Gun
and Gang Unit).
Prescribed means prescribed by regulations (Source: Criminal Code of Canada S.84).
Prohibited Ammunition means ammunition, or a projectile of any kind, that is prescribed to be prohibited
ammunition (Source: Criminal Code of Canada S.84).
Prohibited Firearm
(a) a handgun that,
(i) has a barrel equal to or less than 105 mm (approx. 5 7/8") in length, or
(ii) is designed or adapted to discharge a 25 or 32 calibre cartridge, but does not include any such handgun el
that is prescribed, where the handgun is for use in international sporting competitions governed by the rules of
the International Shooting Union,
(b) a firearm that is adapted from a rifle or shotgun, whether by sawing, cutting or any other alteration, and
that, as so adapted,
(i) is less than 660 mm in length (26 inches), or
(ii) is 660 mm (26 inches) or greater in length and has a barrel less than 457 mm (18 inches) in length,
2010 ANNUAL STATISTICAL REPORT2010 ANNUAL STATISTICAL REPORT

(c) an automatic firearm, whether or not it has been altered to discharge only one projectile with one pressure
of the trigger, or
(d) any firearm that is prescribed to be a prohibited firearm by Parliament.
(Source: Criminal Code of Canada S.84). This classification would include but not limited to sawed-off
shotguns and fully automatic sub-machine guns.
Prohibited Weapon - (a) a knife that has a blade that opens automatically by gravity or centrifugal force or by
hand pressure applied to a button, spring or other device in or attached to the handle
of the knife [flick knife or switchblade], or
(b) any weapon, other than a firearm, that is prescribed to be a prohibited weapon by
(Parliament
The key prohibited weapons (this list is not exhaustive) are:
(1) Tear gas, mace, or other gas designed to injure, immobilize, or otherwise
incapacitate a person;
(2) Liquid, spray or powder or other substance capable of injuring, immobilizing, or
otherwise incapacitating a person;
(3) Nunchaku, Shuriken, Manrikigusari (these items are described in the regulations);
(4) Finger ring (which is capable of projecting a blade);
(5) Cattle-prod or hand-held Taser;
(6) One-handed or short (under 500 mm) cross-bow (whether designed or modified);
(7) Constant companion – blade concealed in belt-buckle;
(8) Push dagger – blade is perpendicular to the handle [looks like an old fashioned
corkscrew];
(9) “Knife comb” or similar device (under 30 cm)
.
(10) Spiked wristband;
(11) Blowgun;
(12) Spring loaded Asp (telescoping baton);
(13) Morning Star: A spiked metal ball at the end of a stick;
(14) Brass knuckles;
(Source: Criminal Code of Canada S.84)
2010 ANNUAL STATISTICAL REPORT2010 ANNUAL STATISTICAL REPORT

Replica Firearm" means any device that is designed or intended to exactly resemble, or to resemble with near
precision, a firearm, and that itself is not a firearm, but does not include any such device that is designed or intended
to exactly resemble, or to resemble with near precision, an antique firearm;
Restricted Firearm – means,
(a) Any handgun that is a not a prohibited firearm,
(b) a firearm that
(i) is not a prohibited firearm,
(ii) has a barrel less than 470 mm (approx 18 1/2"), and
(iii) is capable of discharging centre-fire ammunition in a semi-automatic manner,
(c) a firearm that is designed or adapted to be fired when reduced to a length of less than 660 mm by
folding, telescoping or otherwise, or
(d) a firearm of any other kind that is prescribed to be a restricted weapon.
(Source: Criminal Code of Canada S.84).
This classification would include, but not limited to, a Glock 22 pistol, Smith and Wesson 44 Magnum revolver with
a 204 mm (8") barrel
Unknown - Through an exhaustive investigation and research the firearm cannot be identified. (Source: Toronto
Police Service Gun and Gang Unit).
For the purposes of sections 91 to 95, 99 to 101, 103 to 107 and 117.03 of this Criminal Code of Canada and
the provisions of the Firearms Act, the following weapons are deemed not to be firearms:
(a) any antique firearm;
(b) any device that is
(i) designed exclusively for signalling, for notifying of distress, for firing blank cartridges or for firing stud
cartridges, explosive-driven rivets or other industrial projectiles, and
(ii) intended by the person in possession of it to be used exclusively for the purpose for which it is designed;
(c) any shooting device that is
(i) designed exclusively for the slaughtering of domestic animals, the tranquillizing of animals or the
discharging of projectiles with lines attached to them, and
(ii) intended by the person in possession of it to be used exclusively for the purpose for which it is designed;
and
2010 ANNUAL STATISTICAL REPORT2010 ANNUAL STATISTICAL REPORT

(d) any other barrelled weapon, where it is proved that the weapon is not designed or adapted to discharge
(i) a shot, bullet or other projectile at a muzzle velocity exceeding 152.4 m per second or at a muzzle energy
exceeding 5.7 Joules, or
(ii) a shot, bullet or other projectile that is designed or adapted to attain a velocity exceeding 152.4 m per second or
an energy exceeding 5.7 Joules.
Notwithstanding subsection (3), an antique firearm is a firearm for the purposes of regulations made under
paragraph 117(h) of the Firearms Act and subsection 86(2) of this Act (Source: Criminal Code of Canada S.84).
2010 ANNUAL STATISTICAL REPORT2010 ANNUAL STATISTICAL REPORT