2009 annual meeting of shareholders proxy advisory firms...
TRANSCRIPT

2009 Annual Meeting of ShareholdersProxy Advisory Firms Presentation
April 3, 2009

2© 2009 – Proprietary & Confidential
Business Snapshot
Transforming Strategy
Building Shareholder Value
How We Got to This Point
The Tennebaum Proxy Contest
Agenda

3© 2009 – Proprietary & Confidential
Largest Dedicated Provider of Web-based Financial Services1
Revenue Mix 60% 40%
Business snapshot
Bill Payment& Transaction Processing
Online Banking& Account Presentation
Consumer Marketing& Other Services
Community Banks& Credit Unions
LargeBanks
Billers& CreditProviders
80%
10%
10%
1Based on Online Resources’ evaluation of publicly available industry information and other industry sources.

4© 2009 – Proprietary & Confidential
Transforming strategy
In 2004, Initiated Plan to Become Scaled Leader in Target Segments
Revenues
Clients
Employees
Total Active Users
Payments ($ annual)
Transactions (annual)
Today (YE08)
$151.6 million
1900
650
13 million
$110 billion
200 million
2004
$42.3 million
700
300
1 million
$10 billion
36 million
5© 2009 – Proprietary & Confidential
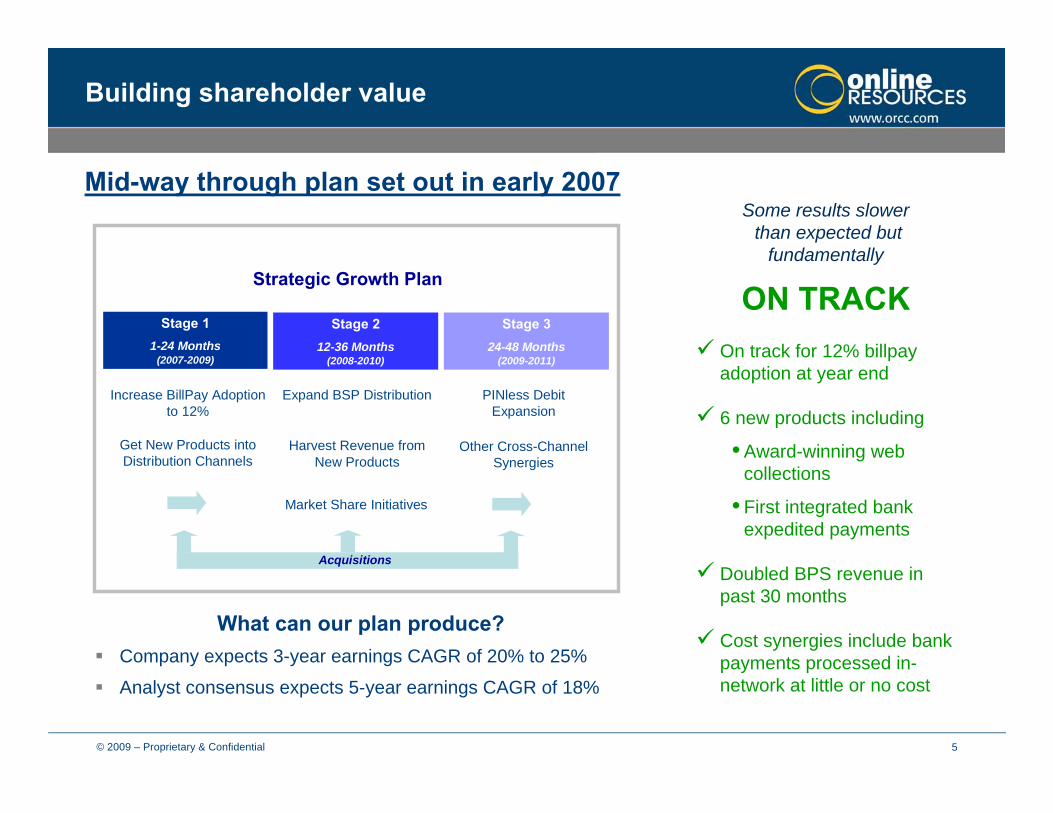
Mid-way through plan set out in early 2007Some results slower
than expected but fundamentally
ON TRACKOn track for 12% billpay adoption at year end
6 new products including
• Award-winning web collections
• First integrated bank expedited payments
Doubled BPS revenue in past 30 months
Cost synergies include bank payments processed in-network at little or no cost
Increase BillPay Adoption to 12%
Get New Products intoDistribution Channels
Stage 212-36 Months
(2008-2010)
Expand BSP Distribution
Harvest Revenue from New Products
Stage 324-48 Months
(2009-2011)
PINless Debit Expansion
Other Cross-Channel Synergies
Acquisitions
Market Share Initiatives
Strategic Growth Plan
Priority #1: Complete Our 5-Year Plan
Stage 11-24 Months
(2007-2009)
Building shareholder value
Company expects 3-year earnings CAGR of 20% to 25%
Analyst consensus expects 5-year earnings CAGR of 18%
What can our plan produce?

6© 2009 – Proprietary & Confidential
1See Appendix slide, “Tennebaum’s economic interests”
In July 2006, Online Resources acquired Princeton eCom in a highly competitive auction, with Tennenbaum Capital Partners providing the financing
Tennenbaum’s sponsoring partner, Steve Chang, who understood financial processing industries and the uneven progress of transformation, structured 7-year security to give time to achieve synergies and network-like economics
Chang left the firm 7 months later and was replaced by Michael Leitner, a telecom and M&A partner with no payments industry experience
The Princeton integration went well but more slowly than expected, and financial performance was hampered by sharply lower interest rates and a non-recurring cluster of client losses (unrelated to service provision)
Tennenbaum and Online Resources both understood preferred structure was no longer ideal, but could not reach mutually satisfactory buyout or restructuring agreement
The equity market’s collapse further polarized economic interests to the point where Tennenbaum’s interests are now severely misaligned with common shareholders1
Instead of selling its preferred security at a loss (bond value is estimated at $47-$67 million), Tennenbaum wants a quick sale of the company to fully and profitably recoup its liquidation value1
In attempt to engineer change of control, the only way it can liquidate its security before 2013, Tennenbaum feigns issues of governance and poor performance
How did we get to this point?

7© 2009 – Proprietary & Confidential
What are Tennenbaum’s economics?
Tennenbaum’s Preferred Security: In current market at our current share price, it is effectively a bond that would sell for between $47 million and $67 million¹
$46 million more$103 million$57 million
In a Company Sale,Tennebaum GetsSell the CompanySell the Security
Tennenbaum’s Common Stock: Common represents such a small portion of value that the $8.30/share cost basis is immaterial to its investment decision
$16 million($30 million)
Gain on Company Sale, Even at Zero PremiumLoss on Sale of Total Position
¹ Range reflects estimates of realizable value for preferred security obtained from three independent Investment Banks
Tennenbaum makes much more if we sell the Company

8© 2009 – Proprietary & Confidential
Tennenbaum has little incentive to increase value
Relative to Common Shareholders, Tennenbaum does not get much benefit from an increase in the value of Online Resources¹
12%9%6%3%But Tennenbaum’s return only increases by ►
122%90%69%35%Common Shareholders’ return increases by ►
60%45%30%15%If the value of Online Resources increases by ►
Even if Tennenbaum rolled its equity into a consolidating transaction, it would roll the liquidation value, not the market value of its securities, preserving its gain
Tennenbaum is acting rationally, in its own self-interest, by seeking a quick sale of the Company, but this is NOT in the best interests of ALL Shareholders
What are Tennenbaum’s economics?
1See Appendix slide, “Tennebaum’s economic interests”

9© 2009 – Proprietary & Confidential
Online Resources Board is highly independent• 9 of 10 directors are non-management
• Board has a Lead Independent Director
• All Board committees are composed entirely of independent directors
• Board has a Corporate Finance Committee to assess all strategic opportunities
Online Resources Board is strong and well balanced• Structured to include directors with variety of backgrounds and experiences
• Designed to have a balance of Board tenure and fresh perspectives
No, we have a well structured Board and processes
RiskMetrics Group’s Corporate Governance Quotient® for ORCC
Better than 92% of Russell 3000 companies
Better than 91% of Software & Services firms
Is it about governance?
BOARD TENURE0 years 10 years 20 years
10© 2009 – Proprietary & Confidential
Board does not “rubber stamp” management strategy or tactics…
Board has a strong committee structure, promoting consensus; issues not having Board support never get to Board vote
No, our Board is independent, active and responsible
Is it about governance?
Did not accept management’s proposed patent strategy
Changed risk management reporting structure to create direct Board oversight
Said no to management’s consideration of a potential business combination
Devised more stringent method of adjusting performance targets for acquisitions than management had proposed
11© 2009 – Proprietary & Confidential
No, our Board actively protects shareholder interests
Is it about governance?
Implemented 5% across-the-board reductions to annual cash base salaries, reflecting generally lower market compensation levels
2009 annual bonus plan entirely in restricted stock; used 16% premium to market price on the date of grant
2009 long-term incentive grants reduced by average of 25%, used stock price premium
Reduced total annual compensation opportunity for executive officers by 14% to 23%
Board maintains strong “pay-for-performance” compensation programs
In declining market, Board rapidly adjusted pay programs to align managements’ interests with those of shareholders
Between 46% and 56% of 2008 executive officer direct compensation was “at risk”
Executive officers earned approximately 65% of 2008 target annual incentive compensation, reflecting interest rate declines and economic slowdown
At year-end market values and assuming vesting of 2008 grants, CEO’s 2008 direct compensation was 37% of target, despite first quartile performance

12© 2009 – Proprietary & Confidential
Tennenbaum says: Board needs special committee to oversee strategic options• Corporate Finance Committee already oversees all formal offers and monitors informal contacts
• Regularly brings in industry and investment banking experts to provide perspectives on market and market changes, current and future Company value, current and future strategic opportunities
• Formal offer was received last September; Committee engaged advisors and ran full process
Tennenbaum says: CEO/Chairman role should be decoupled• Board determined three-tiered structure (CHM/CEO/COO) is “top-heavy” for a Company of our size
• With Bank clients’ sensitivity to vendor instability, this change could hurt value
• Lead independent director in place to ensure Board-driven agenda, forum for dissent
Tennenbaum says: Board should not be staggered• Board determined that given current capital structure, elimination of classes risked putting too much
control, too quickly, in hands of a large beneficial holder
No, our Board has strong governance practices
Is it about governance?

13© 2009 – Proprietary & Confidential
No, our members are independent, strong, experienced and diverse
Is it about governance?
Tennenbaum says: Online Resources’ Board lacks independence• Our Board supports value for all shareholders and on an ongoing basis, examines all options for
achieving it
• Board and management are focused on executing plan to accelerate value but remain open to alternatives if they are better for all shareholders
• Our nominees reflect a balance of Board experience & fresh perspectives
Janey Place• Highly experienced and intimately involved with large banks• Expert at driving bank online and technology strategy
Heidi Roizen• Extensive technology product management experience • Silicon Valley entrepreneur and private equity presence
Michael Heath• Strong operating experience in banks, publishing and at Online Resources• Founding Board member, acted as President during high growth period from 1995 to 1997
Introduced through candidate search
Nominated by Governance Committee
Elected in July 2008
Supported by Tennenbaum

14© 2009 – Proprietary & Confidential
Why has Tennenbaum violated Board policies and good practices?
But if it were about governance…
Board established mandatory blackout periods of two trading days following earnings releases to ensure adequate dissemination of information
Tennenbaum purchased common shares inside a black-out period
Tennenbaum lacks a “Chinese Wall” to prevent confidential Board information from being used by other areas of the firm, including its trading desk
Board established a policy of having all shareholder communications initially go through Chairman or Lead Director for consistency
Before his public letter and initiation of this proxy contest, Michael Leitner contacted numerous shareholders directly or through an investment banker, citing his Director role

15© 2009 – Proprietary & Confidential
Double-digit revenue growth for 10th consecutive year
Named one of the nation's fastest growing technology companies for 5 of the last 8 years by Deloitte
Strong financial performance against peer group¹
1 of only 2 companies in peer group that performed in the top quartile in revenue and earnings growth for at least 3 out of the last 5 years¹
Equity analysts expect Online Resources will perform in the top quartile of peer group in earnings growth for 2009 and the upcoming 5 years¹
Earnings growth dampened by cluster of client departures (not service quality related and not likely to recur) and sharp interest rate declines (adjusted for payments float interest, earnings per share would have been $0.31 instead of $0.24²)
No, we have performed well, though not flawlessly
* Incurred $160m in debt and preferred financing to acquire Princeton eCom1 Calculated assuming that the interest rate we earned in December 2007
remained constant for 2008 and 2009.¹ See Appendix slide “Growth ranking by quartile – Revenue Growth vs. Industry Peer Group”² See Appendix slide “Impact of interest rate declines”
Is it about performance?

16© 2009 – Proprietary & Confidential
In a collapsing market, our steeper share price declines are primarily because uncontrollable events and uncertainty have reduced the EV/Ebitda multiple premium we typically enjoy (5 yr. Avg. = 155% of Peers)
Yes, mostly because of what it does to Tennenbaum’s preferred security
Is it about a lower share price?
A market collapse and lower share price are the only real changes we have experienced sinceLast summer, when Tennenbaum could have proposed director candidates -- but didn’tLast fall, when Tennenbaum could have voted in favor of an acquisition offer -- but didn’t
So what has changed for Tennebaum? A lower share price has made the option value in its preferred security almost non-existent, effectively creating a bond it has little economic incentive to hold
5.0x
10.0x
15.0x
20.0x
25.0x
30.0x
Mar-04
Jun-04
Sep-04Dec-
04Mar-
05Jun
-05Sep-05Dec-
05Mar-
06Jun
-06Sep-06Dec-
06Mar-
07Jun
-07Sep-07Dec-
07Mar-
08Jun
-08Sep-08Dec-
08Mar-
09
EV / E
BITD
A
EBITDA Multiples
5.0x
10.0x
15.0x
20.0x
25.0x
30.0x
Mar-04
Jun-04
Sep-04Dec-
04Mar-
05Jun
-05Sep-05Dec-
05Mar-
06Jun
-06Sep-06Dec-
06Mar-
07Jun
-07Sep-07Dec-
07Mar-
08Jun
-08Sep-08Dec-
08Mar-
09
EV / E
BITD
A
EBITDA Multiples
(42.9%)
(6.7%)
Stock Price Performance
0
50
100
150
200
250
Mar-04
Jun-04
Sep-04
Dec-04
Mar-05
Jun-05
Sep-05
Dec-05
Mar-06
Jun-06
Sep-06
Dec-06
Mar-07
Jun-07
Sep-07
Dec-07
Mar-08
Jun-08
Sep-08
Dec-08
Mar-09
Inde
xed
to 10
0
(42.9%)
(6.7%)
Stock Price Performance
0
50
100
150
200
250
Mar-04
Jun-04
Sep-04
Dec-04
Mar-05
Jun-05
Sep-05
Dec-05
Mar-06
Jun-06
Sep-06
Dec-06
Mar-07
Jun-07
Sep-07
Dec-07
Mar-08
Jun-08
Sep-08
Dec-08
Mar-09
Inde
xed
to 10
0
Online Resources ORCC Comparables

17© 2009 – Proprietary & Confidential
Tennenbaum’s other disclosed current public company investments have not performed well
• Average share prices declined 92% since August 2007 and 67% since August 2008
What Tennenbaum would do to have an “immediate impact” on shareholder value is either generic or lacks understanding of our business
• We already have our organization focused on enhancing sales execution, client retention and increasing market share
• We already have good relationships with potential partners and talk to them regularly
• The Chair of the Corporate Finance Committee and management did explore a share buyback but determined that in the current market, it was better to conserve cash
• Proposing to explore the sale of our eCommerce Division shows that Tennenbaum does not understand where our strategic value lies
• eCommerce enables the creation of our end-to-end payments network, connecting banks and billers• Network first reduces cost of service, then creates revenue opportunities, then becomes a strategic asset• Network is the reason our number of potential acquirers is increasing, not decreasing
Our Board would have been pleased to discuss any of these suggestions with Tennenbaum, but in two years on the Board, its appointee never raised them
Could Tennenbaum do any better?
There isn’t any reason to think so

18© 2009 – Proprietary & Confidential
Adding even one of their nominees would give Tennenbaum disproportionate representation – current Board seat (1 of 10) is already proportional to 9.7% common stock ownership
Adding additional Tennenbaum nominees would be giving representation to what is effectively a bondholder, with sharply different interests than common shareholders
Tennenbaum’s nominees’ election would reduce Board diversity and narrow Board’s range of experience
Tennenbaum’s nominees seem to have already decided to support a sale (“consolidation is essential”), despite having minimal knowledge of our payments business, our plan, or our prospects
An increase in Tennenbaum’s influence would divert the Board’s attention from execution of our plan
No, additional Tennenbaum allies could harm shareholder interests
Do we need a change?

19© 2009 – Proprietary & Confidential
Tennenbaum’s economic interests are sharply different from other shareholders
Our Board has discussed Tennenbaum’s governance requests, they simply disagree that its recommendations are good for all shareholders
Online Resources has a strong, independent, experienced and diverse Board
Online Resources has the appropriate governance in place to act for all shareholders
Online Resources is performing and delivering on its strategic plans to increase value
Our scarcity value and strategic alternatives are increasing not decreasing; there will be more potential buyers for us in the future, not fewer
Tennenbaum is acting rationally in trying to engineer a quick, profitable exit from its investment – but that is not best for all shareholders
No, it’s about TENNENBAUM’S economics…
Is it about governance or performance?
Appendix

21© 2009 – Proprietary & Confidential
Sharply different from other common shareholders
Relatively small increase in investment value as value of the Company increases
Value heavily weighted toward guaranteed returns
Tennenbaum has little incentive to increase the value of Online Resources
Tennenbaum’s economic interests
(in millions, except for per share and percents) CurrentValue 15% 30% 45% 60%
Total Value of Online Resources 273$ 314$ 355$ 396$ 437$ (less) Net Debt 52$ 52$ 52$ 52$ 52$ Equity Value of Online Resources 221$ 262$ 303$ 329$ 367$
Equity Value Owned by Tennenbaum Preferred Security 103$ 103$ 103$ 103$ 103$ Equity Value Owned by Tennenbaum Common Security 11$ 15$ 19$ 22$ 25$ Equity Value Owned by Other Common Shareholders 107$ 144$ 181$ 204$ 239$
Market Capitalization 119$ 159$ 200$ 226$ 264$ Price per Outstanding Share 4.00$ 5.35$ 6.73$ 7.61$ 8.89$
Increase in Total Tennenbaum Value from Current 3.4% 6.8% 9.0% 12.2%Increase in Other Common Value from Current 33.8% 68.3% 90.2% 122.2%
If Total Value Increases:
22© 2009 – Proprietary & Confidential
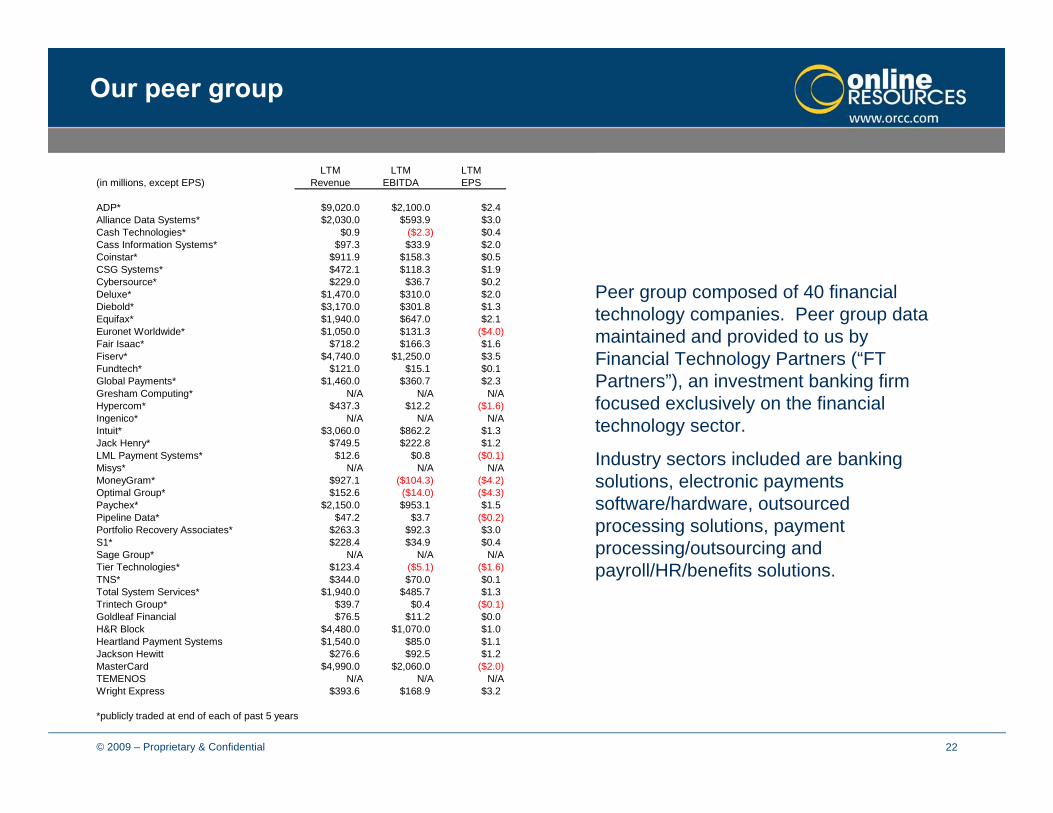
Our peer group
LTM LTM LTM(in millions, except EPS) Revenue EBITDA EPS
ADP* $9,020.0 $2,100.0 $2.4Alliance Data Systems* $2,030.0 $593.9 $3.0Cash Technologies* $0.9 ($2.3) $0.4Cass Information Systems* $97.3 $33.9 $2.0Coinstar* $911.9 $158.3 $0.5CSG Systems* $472.1 $118.3 $1.9Cybersource* $229.0 $36.7 $0.2Deluxe* $1,470.0 $310.0 $2.0Diebold* $3,170.0 $301.8 $1.3Equifax* $1,940.0 $647.0 $2.1Euronet Worldwide* $1,050.0 $131.3 ($4.0)Fair Isaac* $718.2 $166.3 $1.6Fiserv* $4,740.0 $1,250.0 $3.5Fundtech* $121.0 $15.1 $0.1Global Payments* $1,460.0 $360.7 $2.3Gresham Computing* N/A N/A N/AHypercom* $437.3 $12.2 ($1.6)Ingenico* N/A N/A N/AIntuit* $3,060.0 $862.2 $1.3Jack Henry* $749.5 $222.8 $1.2LML Payment Systems* $12.6 $0.8 ($0.1)Misys* N/A N/A N/AMoneyGram* $927.1 ($104.3) ($4.2)Optimal Group* $152.6 ($14.0) ($4.3)Paychex* $2,150.0 $953.1 $1.5Pipeline Data* $47.2 $3.7 ($0.2)Portfolio Recovery Associates* $263.3 $92.3 $3.0S1* $228.4 $34.9 $0.4Sage Group* N/A N/A N/ATier Technologies* $123.4 ($5.1) ($1.6)TNS* $344.0 $70.0 $0.1Total System Services* $1,940.0 $485.7 $1.3Trintech Group* $39.7 $0.4 ($0.1)Goldleaf Financial $76.5 $11.2 $0.0H&R Block $4,480.0 $1,070.0 $1.0Heartland Payment Systems $1,540.0 $85.0 $1.1Jackson Hewitt $276.6 $92.5 $1.2MasterCard $4,990.0 $2,060.0 ($2.0)TEMENOS N/A N/A N/AWright Express $393.6 $168.9 $3.2
*publicly traded at end of each of past 5 years
Peer group composed of 40 financial technology companies. Peer group data maintained and provided to us by Financial Technology Partners (“FT Partners”), an investment banking firm focused exclusively on the financial technology sector.
Industry sectors included are banking solutions, electronic payments software/hardware, outsourced processing solutions, payment processing/outsourcing and payroll/HR/benefits solutions.

23© 2009 – Proprietary & Confidential
Revenue growth vs. industry peer group
Slide 7
Growth ranking by quartile
Source: FT Partners data as of 1/31/2009; 49 public firms in FT industry

24© 2009 – Proprietary & Confidential Source: FT Partners data as of 1/31/2009; 49 public firms in FT industry
Core EPS growth vs. industry peer group
Slide 8
Growth ranking by quartile

25© 2009 – Proprietary & Confidential
$0
$20
$40
$60
$80
$100
$120
$140
$160
$180
Ann
ual R
even
ue (
Mill
ions
)
$0
$20
$40
$60
$80
$10 0
$12 0
$14 0
$16 0
$18 0
Ann
ual E
bitd
a (M
illio
ns)
How we performed vs. guidance
2006 200820072004 2005
Top of guidance
Bottom of guidance
Actual result
Legend
2004 2005 2005Restated for IDS
2008 2008 Adjusted
for Interest Rates
2007 2007 Restated for ITS
2006 2006 Restated
for Princeton
Annual Revenue
Annual Ebitda

26© 2009 – Proprietary & Confidential
$ 0
$1 0
$2 0
$3 0
$4 0
1Q 2Q 3Q 4Q 1Q 2Q 3Q 4Q 1Q 2Q 3Q 4Q 1Q 2Q 3Q 4Q 1Q 2Q 3Q 4Q
Qu
arte
rly R
eve
nue
(Mill
ions
)
$0
$10
$20
$30
$40
Qua
rter
ly E
bitd
a (M
illio
ns)
2004 2008200720062005
How we performed vs. guidance
Quarterly Revenue
Quarterly Ebitda
Top of guidance
Bottom of guidance
Actual result
Legend

27© 2009 – Proprietary & Confidential
Impact of EV/Ebitda multiple decline
EBITDA Multiples
5.0x
10.0x
15.0x
20.0x
25.0x
30.0x
Mar-04
Jun-04
Sep-04Dec-
04Mar-
05Jun
-05Sep-05Dec-
05Mar-
06Jun
-06Sep-06Dec-
06Mar-
07Jun
-07Sep-07Dec-
07Mar-
08Jun
-08Sep-08Dec-
08Mar-
09
EV / E
BITD
A
Online Resources ORCC Comparables
(42.9%)
(6.7%)
Stock Price Performance
0
50
100
150
200
250
Mar-04
Jun-04
Sep-04
Dec-04
Mar-05
Jun-05
Sep-05
Dec-05
Mar-06
Jun-06
Sep-06
Dec-06
Mar-07
Jun-07
Sep-07
Dec-07
Mar-08
Jun-08
Sep-08
Dec-08
Mar-09
Inde
xed
to 10
0
Online Resources ORCC Comparables
Interest Rate DeclinesMarket Collapse
Share price decline primarily due to narrowing of historic multiple premium
Comparable Company Composite includes AACC, ACIW, ACS, ADP, ADS, AFA, ASF, BAS, BCGI, BSG, CANI, CASS, CEN, CKFR, CLK, Concord EFS, CORI, CPTV, CSC, CSGS, CSTR, CTQN, CVG, CYBS, DBD, DGIN, DLX, ECHO, EDS, EEFT, eFunds, EFX, EGOV, EME, EPAY, EPIC, EPIQ, EQTXZ, EXLT, FDC, FIC, FIS, FISV, FNDT, GAXC, GEM, GFSI, GHT, GPN, GPTX, GSOF, GTK, GVHR, HEW, HPY, HRB, HYC, ICPT, ING, INTD, INTU, INTX, IPMT, JH, JKHY, JTX, KNXA, LMLP, MA, MGI, Mobius, MSY, NAP, NCOG, NEO, NTWK, OCN, OPEN, OPMR, PAYX, PEGA, PPDA, PRAA, PRGX, PTW1, PYDS, QMMI, SCAI, SDNA, SGE, SONE, SR, SVNX, SY, TEMN, TIER, TKT, TLEO, TNS, TSS, TSTF, TTP, TYL, ULTI, VVI, WSTM, WU and WXS.
Online Resources ORCC Comparables
28© 2009 – Proprietary & Confidential
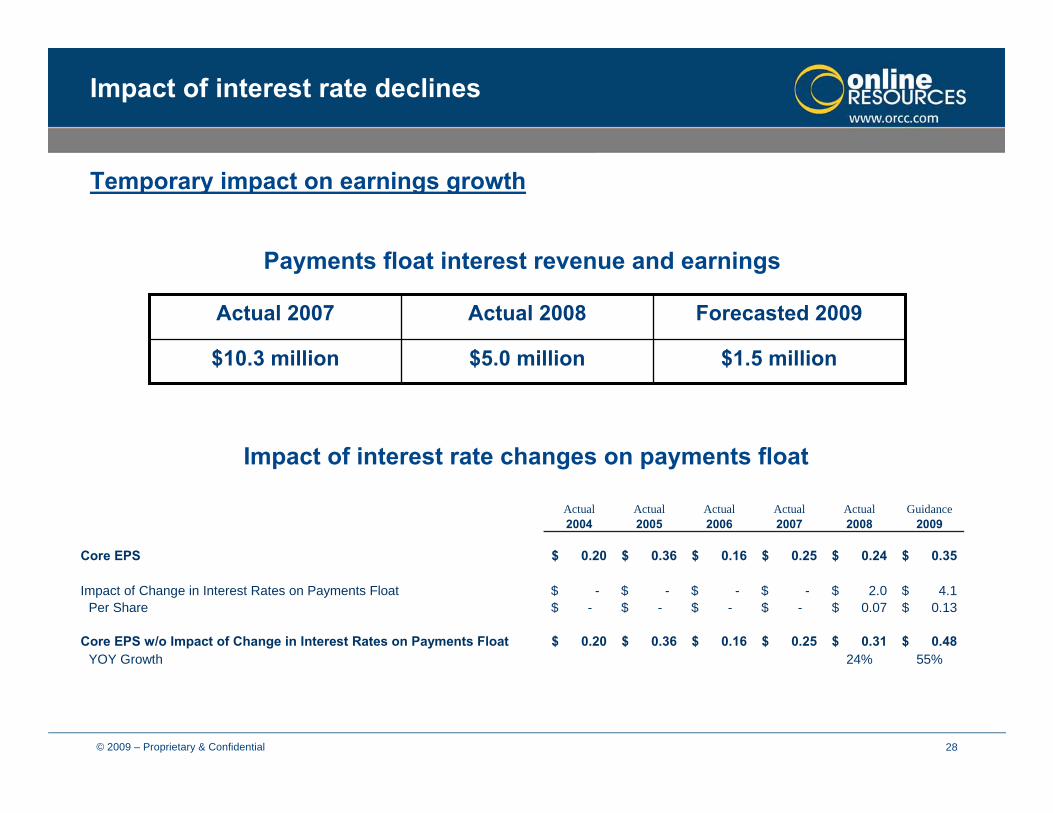
Impact of interest rate declines
Payments float interest revenue and earnings
$1.5 million$5.0 million$10.3 million
Forecasted 2009Actual 2008Actual 2007
Impact of interest rate changes on payments float
Temporary impact on earnings growth
Actual Actual Actual Actual Actual Guidance2004 2005 2006 2007 2008 2009
Core EPS 0.20$ 0.36$ 0.16$ 0.25$ 0.24$ 0.35$
Impact of Change in Interest Rates on Payments Float -$ -$ -$ -$ 2.0$ 4.1$ Per Share -$ -$ -$ -$ 0.07$ 0.13$
Core EPS w/o Impact of Change in Interest Rates on Payments Float 0.20$ 0.36$ 0.16$ 0.25$ 0.31$ 0.48$ YOY Growth 24% 55%
29© 2009 – Proprietary & Confidential
The information in this presentation from Online Resources Corporation contains statements about future events and expectations of Online Resources, which are “forward-looking statements.” Any statement that is not a statement of historical fact may be deemed to be a forward-looking statement. These statements include:
• Forecasts of growth in and penetration of Online Resources’ financial institution customer base, increases in the number and pricing of transactions being processed by financial institution customers and the industry in general, and growth in the number of consumers using online banking and bill payment services;
• Statements regarding Online Resources’ plans for achieving greater profitability and its business outlook for 2009 and beyond;
• Statements regarding Online Resources longer-term profit targets, including but limited to user adoption rates, gross margin, and net margin targets;
• Statements regarding Online Resources’ cash position and its ability to cover operating losses; and
• Other statements, including statements containing words such as “anticipate,” “believe,” “plan,” “estimate,” “expect,” “seek,” “intend,”and other similar words that signify forward-looking statements.
Such forward-looking statements involve known and unknown risks, uncertainties and other factors which may cause our actual results, performance or achievements to be materially different from any future results, performance or achievements expressed or implied by such forward-looking statements. Specifically factors that might cause such a difference include, but are not limited to the Company’s: history of losses; dependence on the marketing efforts of third parties; potential fluctuations in operating results; ability to make and successfully integrate acquisitions of new businesses; potential need for additional capital; potential inability to prevent systems failures and security breaches; potential inability to expand services and related products in the event of substantial increases in demand; competition; ability to attract and retain skilled personnel; reliance on patents and other intellectual property; exposure to the early stage of market adoption of the services it offers; exposure to the consolidation of the banking and financial services industry; and additional risks and uncertainties discussed in filings made by the company with the Securities and Exchange Commission, including those risks and uncertainties contained under the heading "Risk Factors" in the company's Form 10-K, latest 10-Q, and S-3 as filed with the Securities and Exchange Commission.
Investors, potential investors and other listeners are urged to consider these factors carefully in evaluating the forward looking statements and are cautioned not to place undue reliance on such forward-looking statements. The forward-looking statements made herein are only made as of the date of this presentation and the Company undertakes no obligation to publicly update such forward-looking statements to reflect subsequent events or circumstances.
Forward-looking statements
Disclosure

For more information, please visit www.orcc.com