2007: mid expansion slowdown or something more?
DESCRIPTION
2007: Mid Expansion Slowdown or Something More?. 2007 Economic Forecast Conference Northeastern California SBDC Chico, California January 11, 2007 John Mitchell Economist Western Region U.S. Bank. Where are we now?. 6 th Year Unemployment 4.5% Year old Housing Contraction - PowerPoint PPT PresentationTRANSCRIPT
2007: Mid Expansion Slowdown or Something
More?
2007 Economic Forecast ConferenceNortheastern California SBDC
Chico, CaliforniaJanuary 11, 2007
John MitchellEconomist Western Region
U.S. Bank
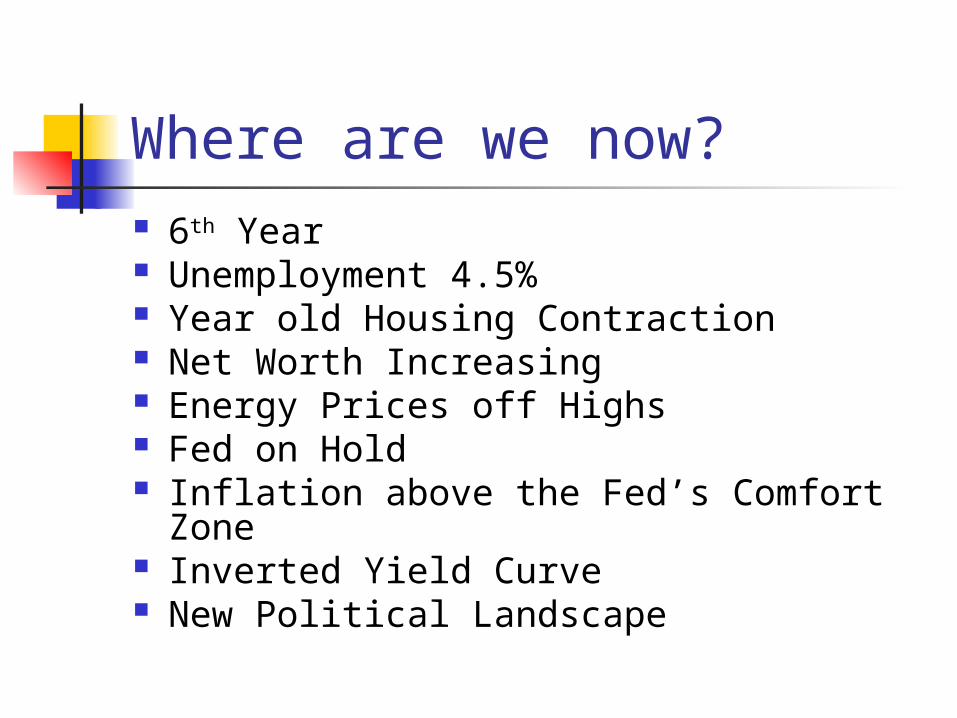
Where are we now? 6th Year Unemployment 4.5% Year old Housing Contraction Net Worth Increasing Energy Prices off Highs Fed on Hold Inflation above the Fed’s Comfort Zone Inverted Yield Curve New Political Landscape
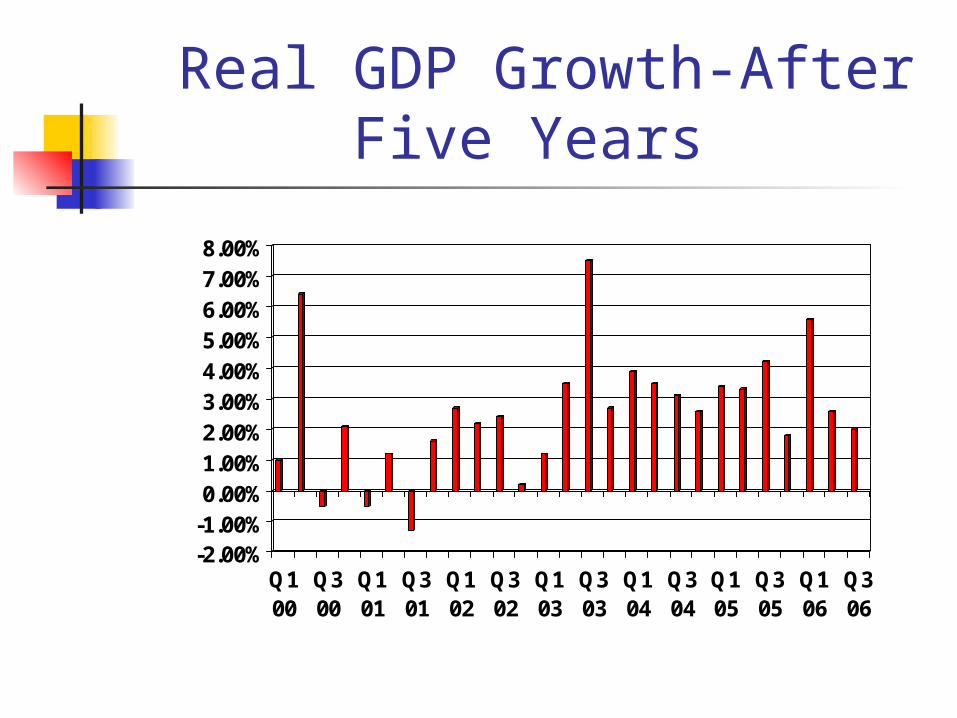
Real GDP Growth-After Five Years
-2.00%-1.00%0.00%1.00%2.00%3.00%4.00%5.00%6.00%7.00%8.00%
Q100
Q300
Q101
Q301
Q102
Q302
Q103
Q303
Q104
Q304
Q105
Q305
Q106
Q306
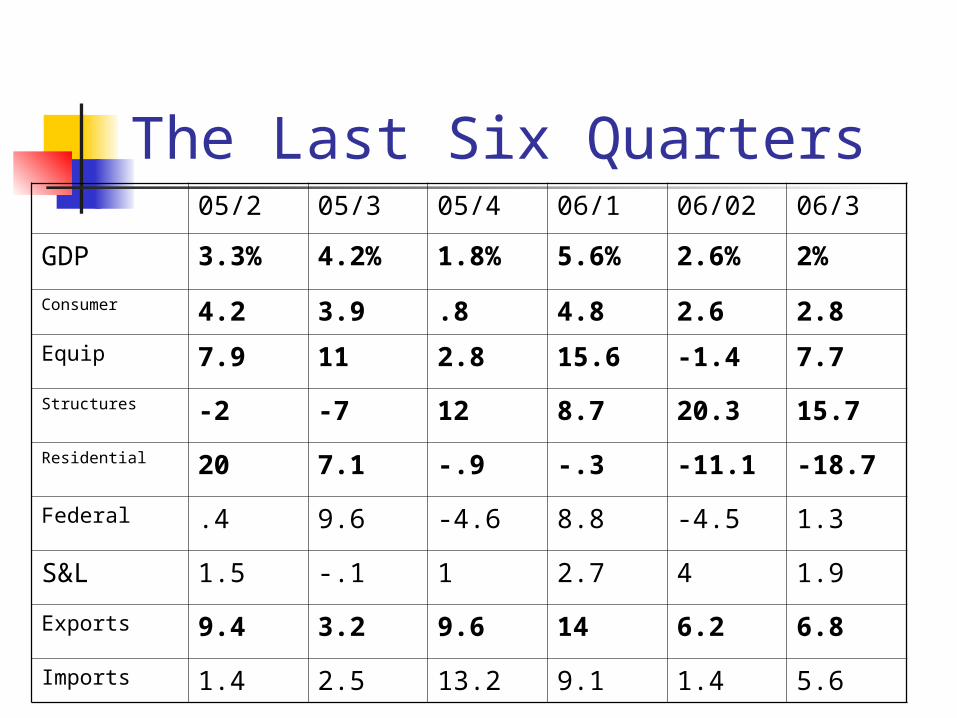
The Last Six Quarters05/2 05/3 05/4 06/1 06/02 06/3
GDP 3.3% 4.2% 1.8% 5.6% 2.6% 2%
Consumer 4.2 3.9 .8 4.8 2.6 2.8
Equip 7.9 11 2.8 15.6 -1.4 7.7
Structures -2 -7 12 8.7 20.3 15.7
Residential 20 7.1 -.9 -.3 -11.1 -18.7
Federal .4 9.6 -4.6 8.8 -4.5 1.3
S&L 1.5 -.1 1 2.7 4 1.9
Exports 9.4 3.2 9.6 14 6.2 6.8
Imports 1.4 2.5 13.2 9.1 1.4 5.6
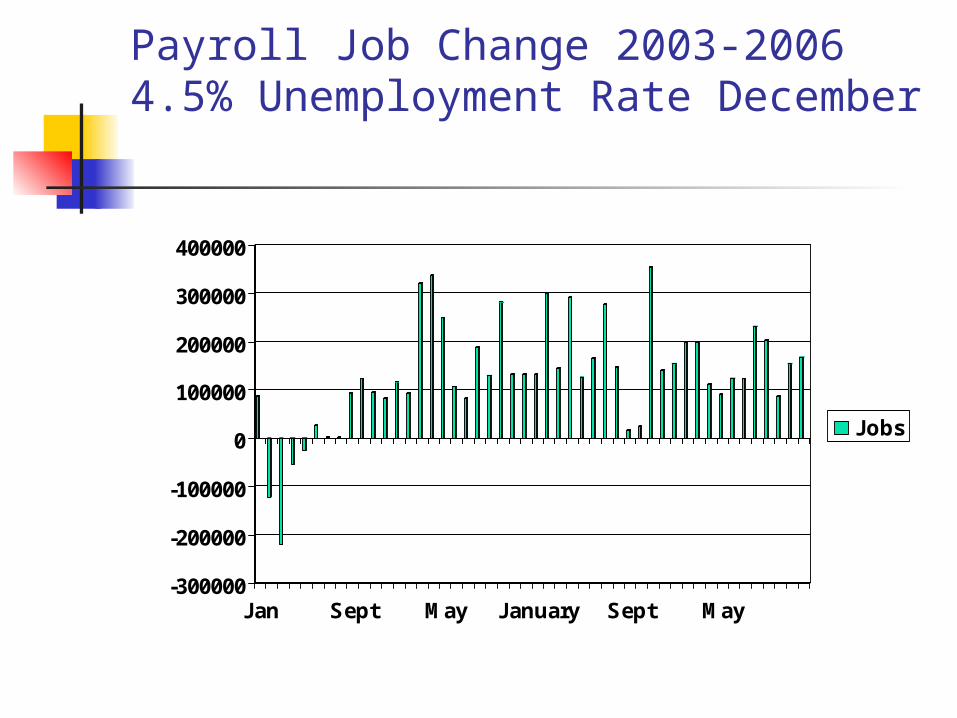
Payroll Job Change 2003-20064.5% Unemployment Rate December
-300000
-200000
-100000
0
100000
200000
300000
400000
Jan Sept May January Sept May
Jobs
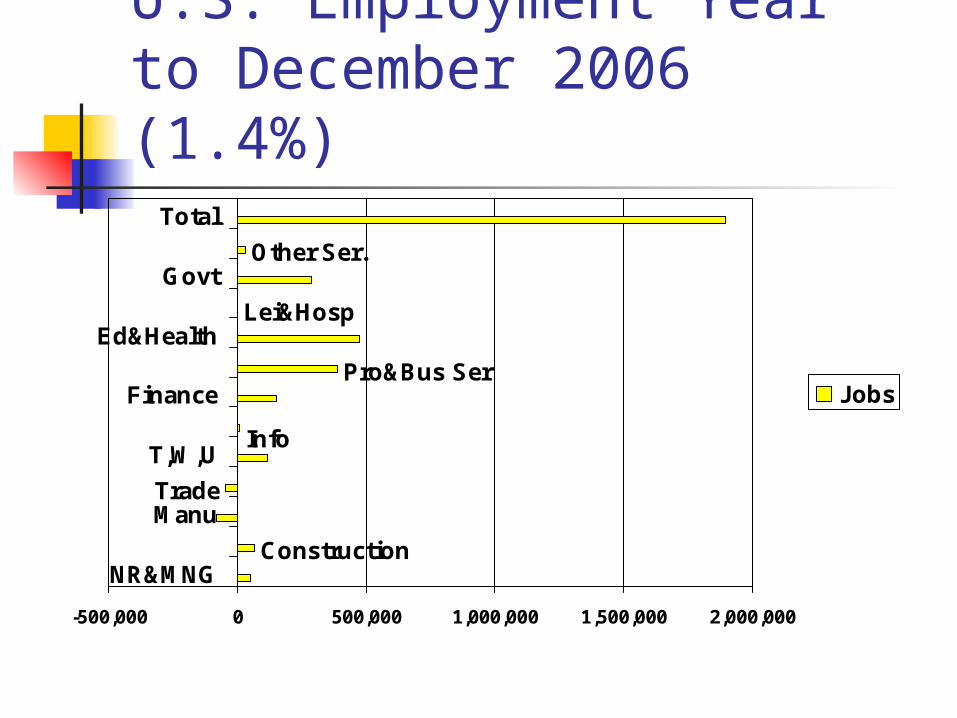
U.S. Employment Year to December 2006 (1.4%)
Construction
Trade
Pro&Bus Ser
Lei&Hosp
Other Ser.
Info
-500,000 0 500,000 1,000,000 1,500,000 2,000,000
NR&MNG
Manu
T,W,U
Finance
Ed&Health
Govt
Total
Jobs
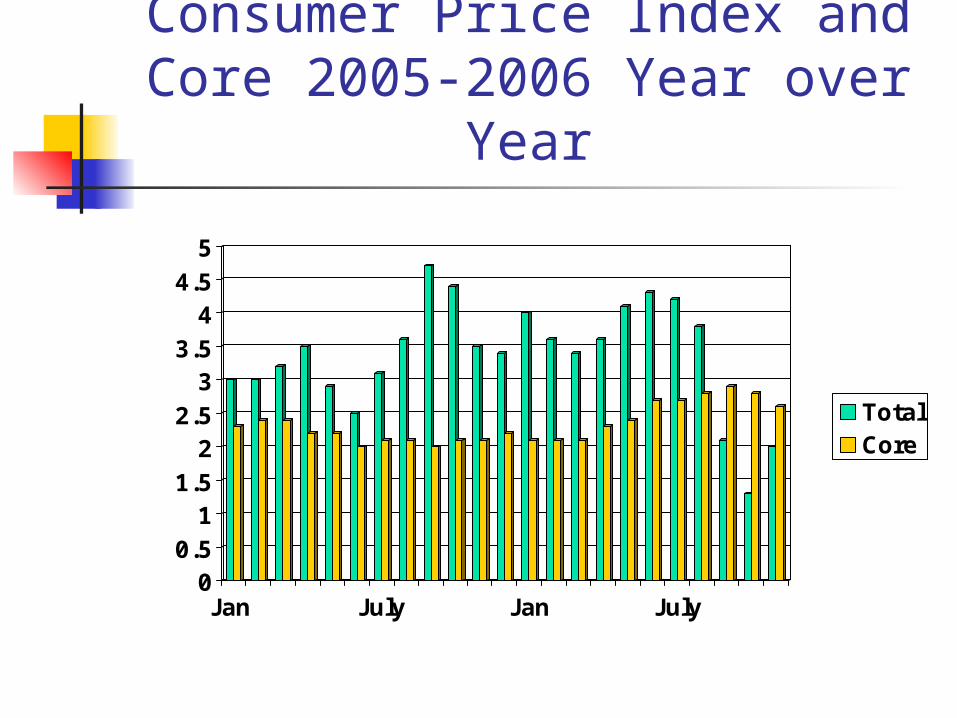
Consumer Price Index and Core 2005-2006 Year over
Year
00.5
11.5
22.5
33.5
44.5
5
Jan July Jan July
TotalCore
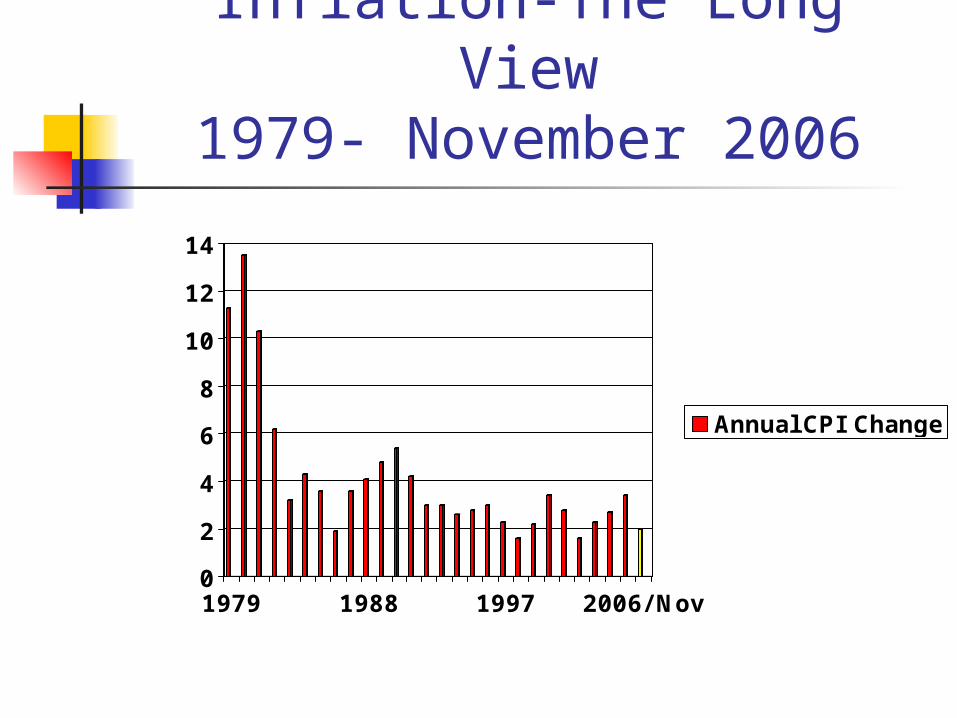
Inflation-The Long View1979- November 2006
0
2
4
6
8
10
12
14
1979 1988 1997 2006/ Nov
Annual CPI Change
Inflation Review Information Quality Redistributions that serve no
economic purpose Transactions that extend over time
involve a price level expectation! Accounting and Tax System
Distortions Managerial Attention Diversion Short Term Focus
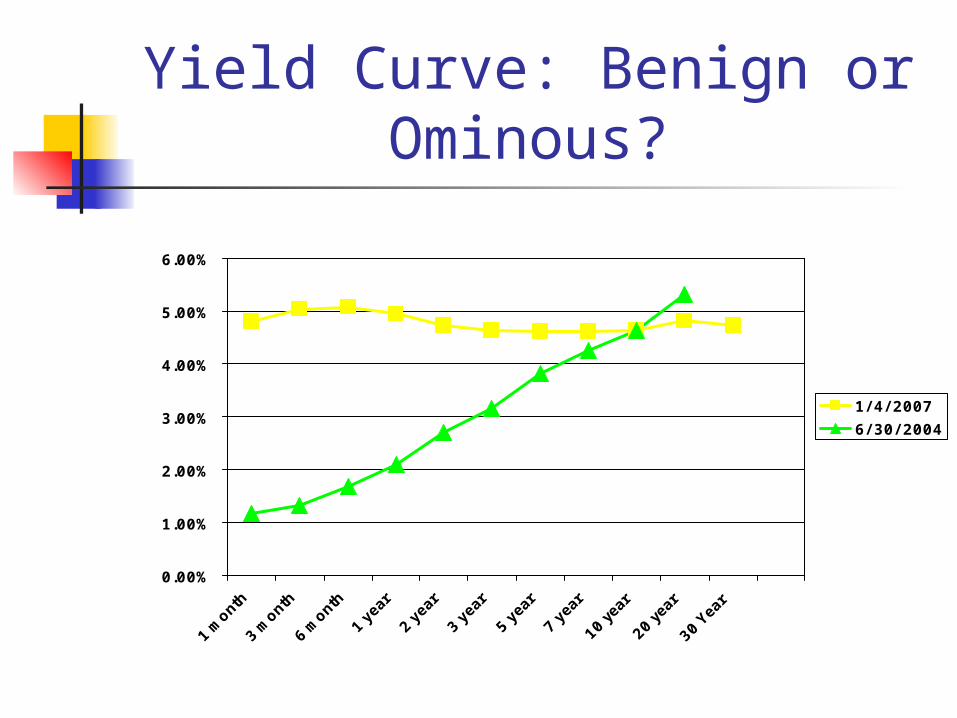
Yield Curve: Benign or Ominous?
0.00%
1.00%
2.00%
3.00%
4.00%
5.00%
6.00%
1 mon
th
3 mon
th
6 mon
th
1 ye
ar
2 ye
ar
3 ye
ar
5 ye
ar
7 ye
ar
10 yea
r
20 yea
r
30 Y
ear
1/ 4/ 2007
6/ 30/ 2004
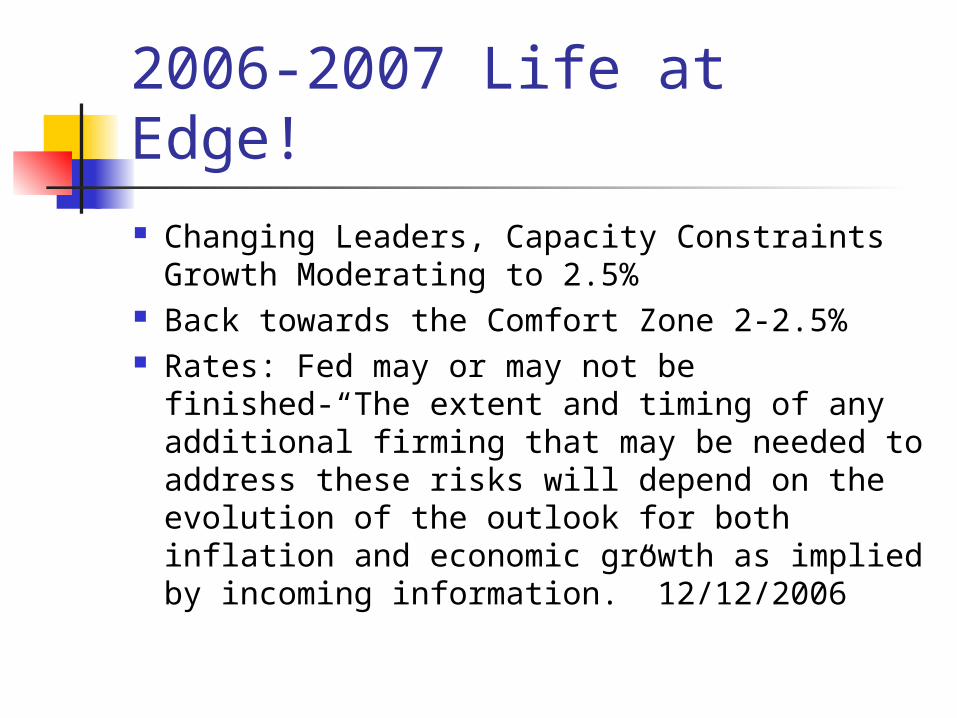
2006-2007 Life at Edge! Changing Leaders, Capacity Constraints
Growth Moderating to 2.5% Back towards the Comfort Zone 2-2.5% Rates: Fed may or may not be finished-“The
extent and timing of any additional firming that may be needed to address these risks will depend on the evolution of the outlook for both inflation and economic growth as implied by incoming information.” 12/12/2006
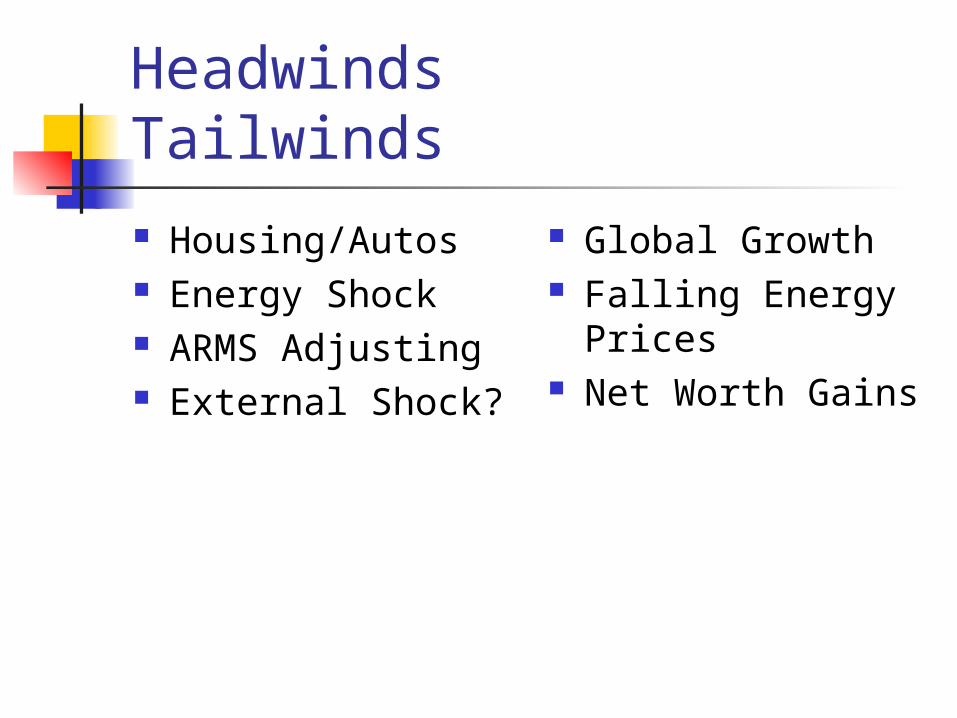
Headwinds Tailwinds Housing/Autos Energy Shock ARMS Adjusting External Shock?
Global Growth Falling Energy
Prices Net Worth Gains
2006-2007 Questions How will the housing correction play out? Will business investment and trade hold up? What does the inversion mean? What is the
bond market telling us? Will energy bite us again? How tight are labor markets? What is the speed limit? Will financial conditions remain supportive?
Housing
The Drag Not Just Construction-Mortgage,
Title, Furniture, Realtors, Appraisers etc.
Consumption Implications Wealth and Mortgage Equity Withdrawal
Adjustables Adjusting!
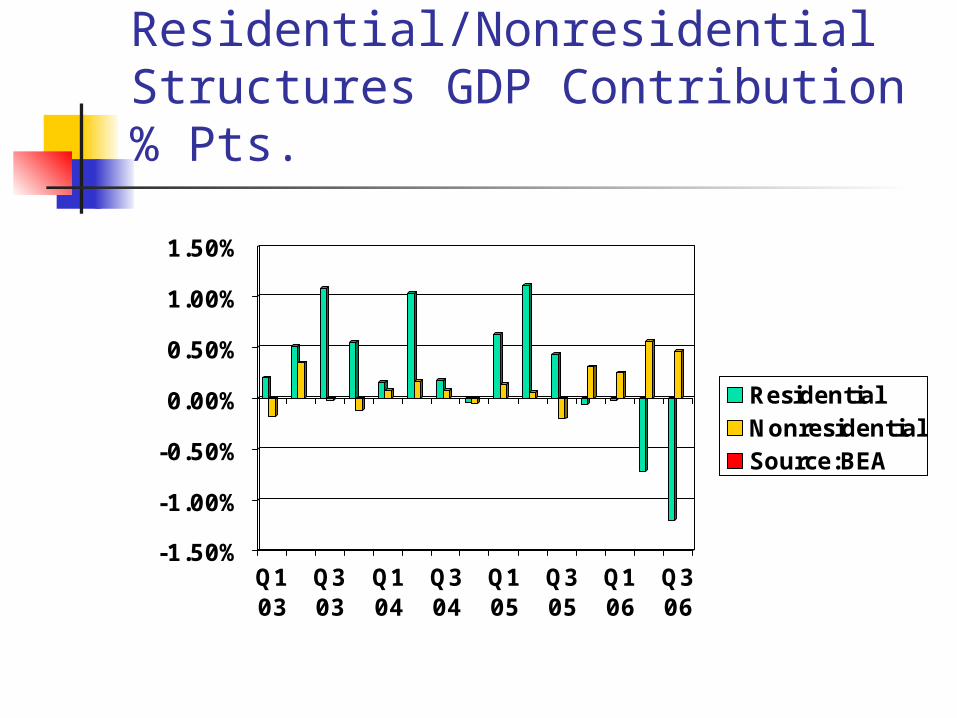
Residential/Nonresidential Structures GDP Contribution % Pts.
-1.50%
-1.00%
-0.50%
0.00%
0.50%
1.00%
1.50%
Q103
Q303
Q104
Q304
Q105
Q305
Q106
Q306
ResidentialNonresidentialSource:BEA
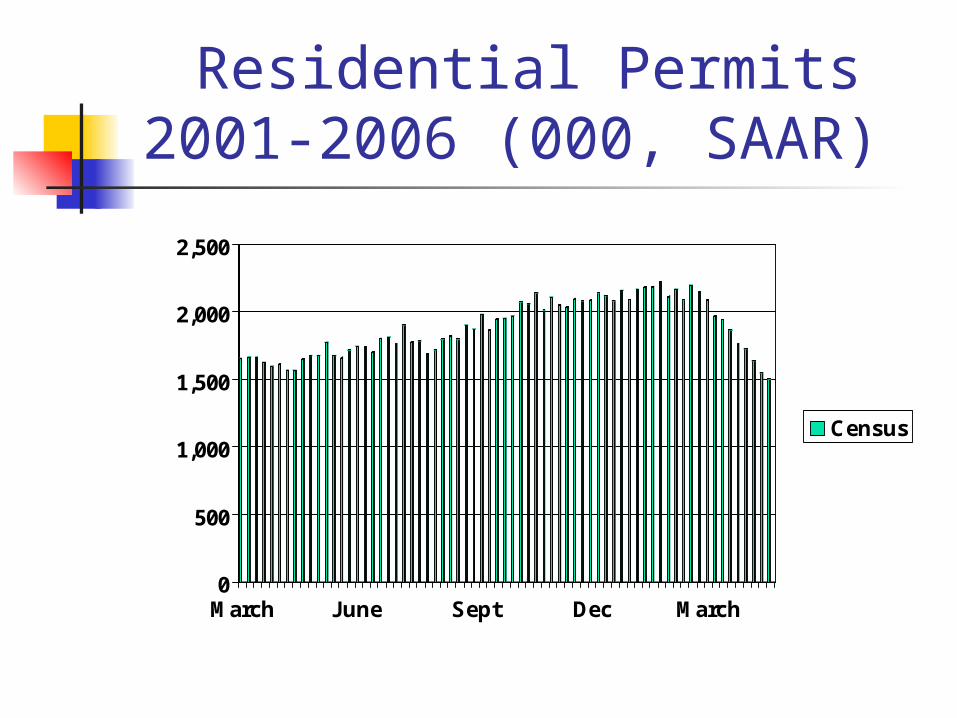
Residential Permits 2001-2006 (000, SAAR)
0
500
1,000
1,500
2,000
2,500
March June Sept Dec March
Census
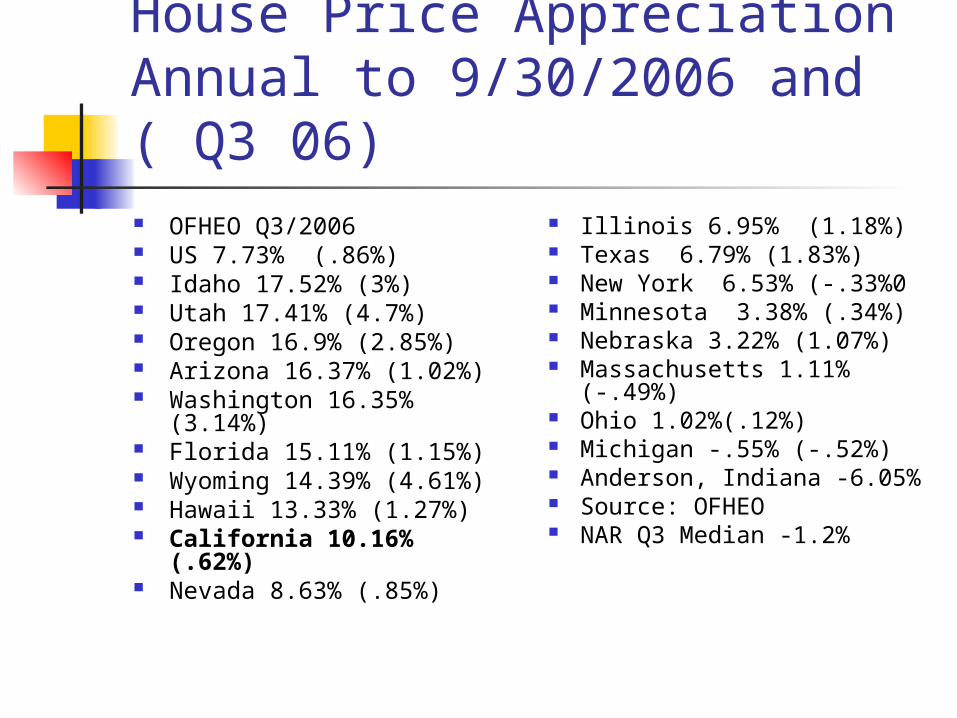
House Price Appreciation Annual to 9/30/2006 and ( Q3 06) OFHEO Q3/2006 US 7.73% (.86%) Idaho 17.52% (3%) Utah 17.41% (4.7%) Oregon 16.9% (2.85%) Arizona 16.37% (1.02%) Washington 16.35% (3.14%) Florida 15.11% (1.15%) Wyoming 14.39% (4.61%) Hawaii 13.33% (1.27%) California 10.16% (.62%) Nevada 8.63% (.85%)
Illinois 6.95% (1.18%) Texas 6.79% (1.83%) New York 6.53% (-.33%0 Minnesota 3.38% (.34%) Nebraska 3.22% (1.07%) Massachusetts 1.11%
(-.49%) Ohio 1.02%(.12%) Michigan -.55% (-.52%) Anderson, Indiana -
6.05% Source: OFHEO NAR Q3 Median -1.2%
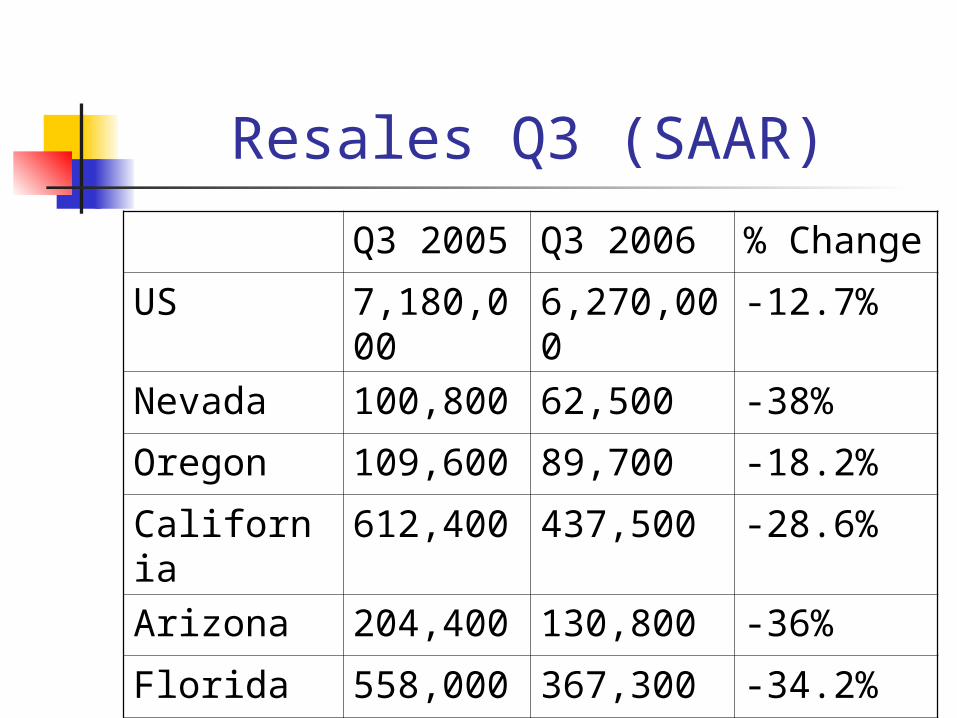
Resales Q3 (SAAR)
Q3 2005 Q3 2006 % Change
US 7,180,000
6,270,000
-12.7%
Nevada 100,800 62,500 -38%
Oregon 109,600 89,700 -18.2%
California 612,400 437,500 -28.6%
Arizona 204,400 130,800 -36%
Florida 558,000 367,300 -34.2%
Source:NAR
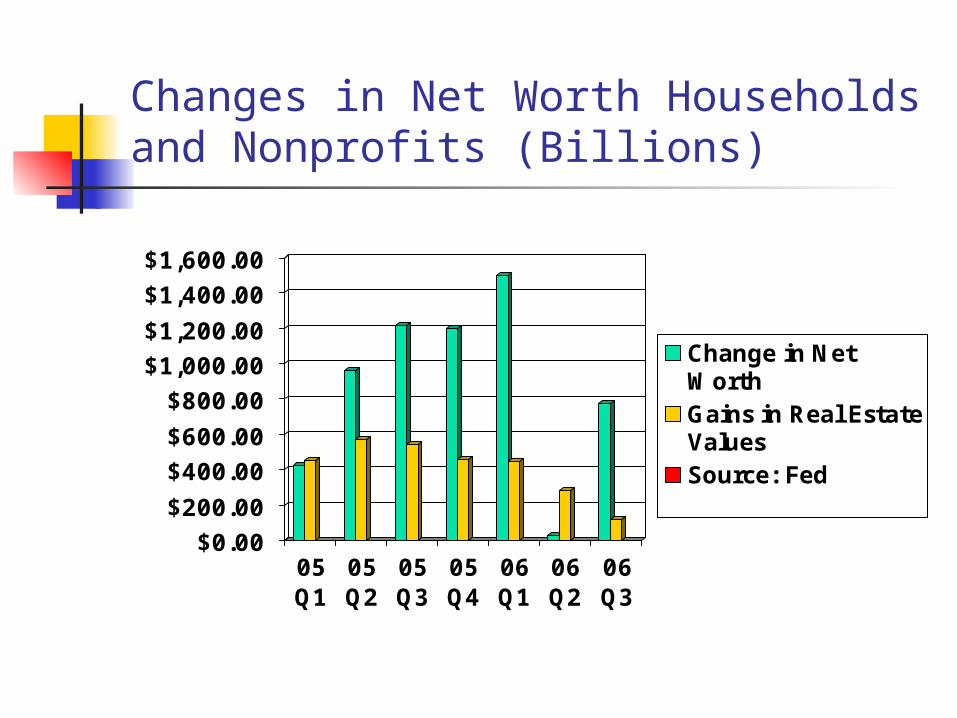
Changes in Net Worth Households and Nonprofits (Billions)
$0.00
$200.00
$400.00
$600.00
$800.00
$1,000.00
$1,200.00
$1,400.00
$1,600.00
05Q1
05Q2
05Q3
05Q4
06Q1
06Q2
06Q3
Change in NetWorthGains in Real EstateValuesSource: Fed
How does the housing drag end?
Construction Decline/Inventory Reduced
Increased Affordability: Prices, Rates, Income
Changed Expectations
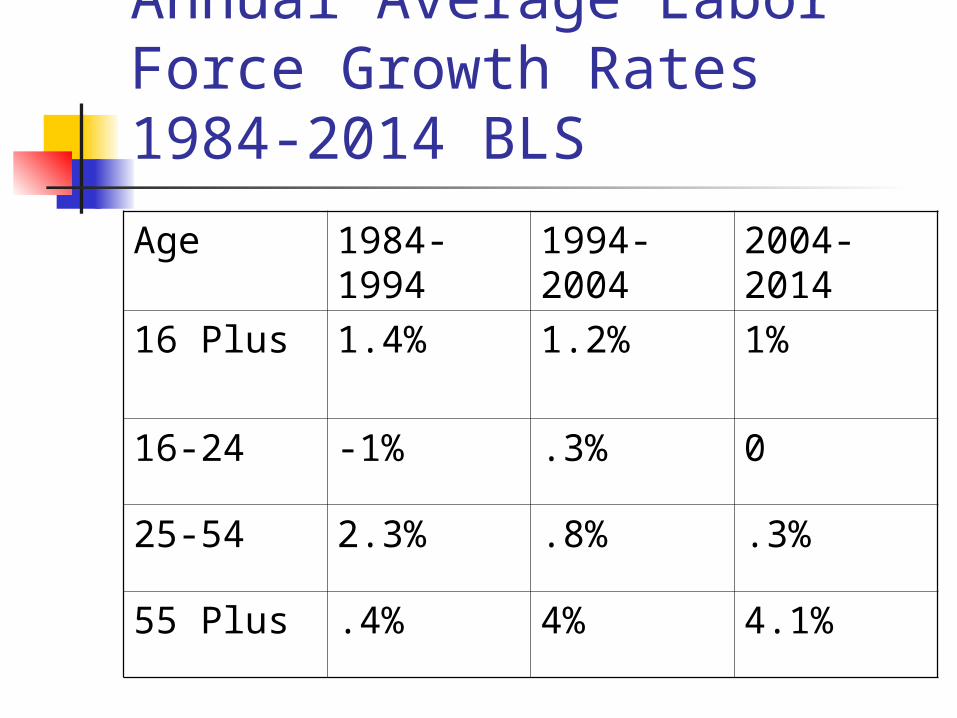
Annual Average Labor Force Growth Rates 1984-2014 BLS
Age 1984-1994
1994-2004
2004-2014
16 Plus 1.4% 1.2% 1%
16-24 -1% .3% 0
25-54 2.3% .8% .3%
55 Plus .4% 4% 4.1%
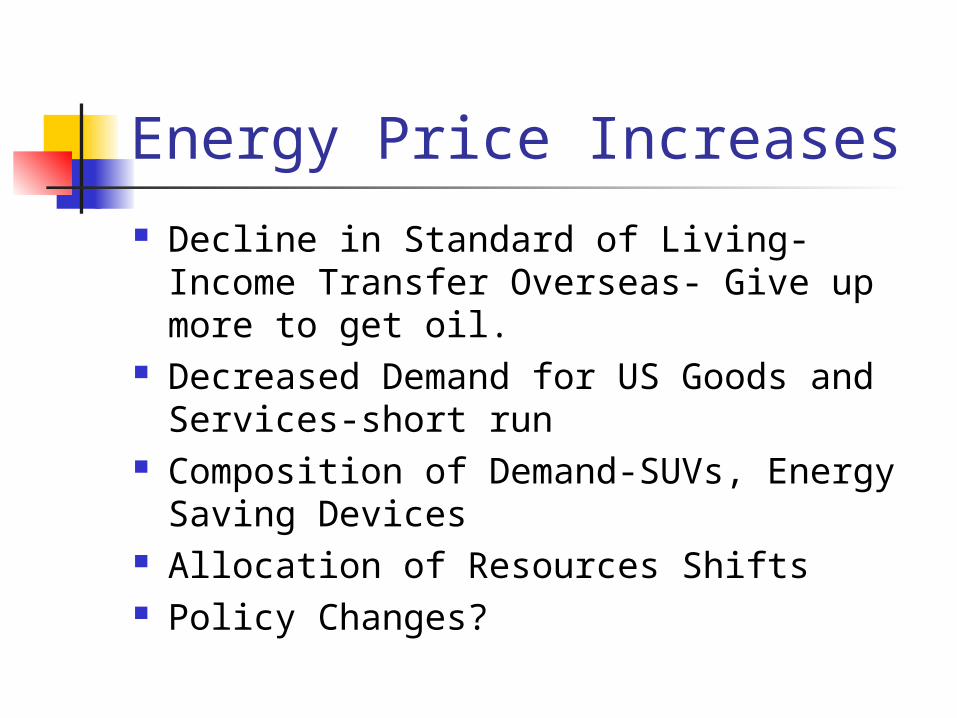
Energy Price Increases Decline in Standard of Living-Income
Transfer Overseas- Give up more to get oil.
Decreased Demand for US Goods and Services-short run
Composition of Demand-SUVs, Energy Saving Devices
Allocation of Resources Shifts Policy Changes?
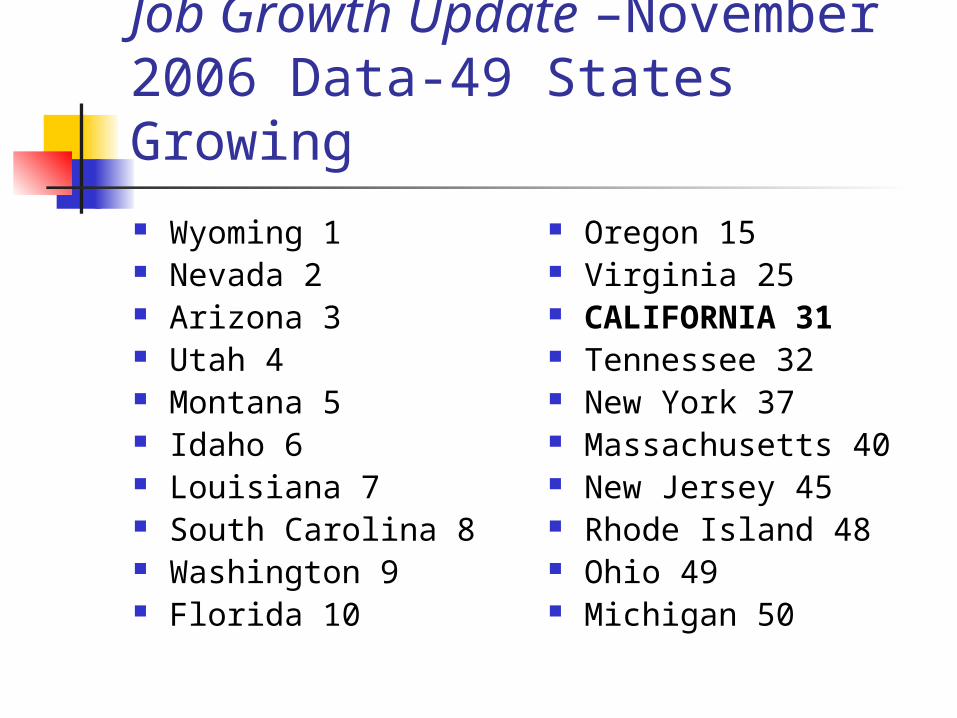
Job Growth Update –November 2006 Data-49 States Growing Wyoming 1 Nevada 2 Arizona 3 Utah 4 Montana 5 Idaho 6 Louisiana 7 South Carolina 8 Washington 9 Florida 10
Oregon 15 Virginia 25 CALIFORNIA 31 Tennessee 32 New York 37 Massachusetts 40 New Jersey 45 Rhode Island 48 Ohio 49 Michigan 50
Longer Term
Policy Changes from New Cast of Characters: Immigration? Trade? Energy? Tax? Entitlements?
354 Days from Today First Boomer Gets Social Security