2007 interim results - investis cmsfiles.investis.com/cadbury_ir/2007interimresultsam.pdf · ·...
TRANSCRIPT
2
2007 Interim Results1 August 2007
This material may be deemed to include forward-looking statements within the meaning of Section 27A of the US Securities Act of
1933 and Section 21E of the US Securities Exchange Act of 1934. These forward-looking statements are only predictions and you
should not rely unduly on them. Actual results might differ materially from those projected in any such forward-looking statements,
which involve known and unknown risks, uncertainties and other factors that may cause our or our industry’s actual results, levels of
activity, performance or achievements to be materially different from any future results, levels of activity, performance or
achievements expressed or implied by the forward-looking statements. In evaluating forward-looking statements, which are
generally identifiable by use of the words “may”, “will”, “should”, “expect”, “anticipate”, “estimate”, “believe”, “intend” or “project”
or the negative of these words or other variations on these words or comparable terminology, you should consider various factors
including the risks outlined in our Form 20-F filed with the SEC. Although we believe the expectations reflected in forward-looking
statements are reasonable we cannot guarantee future results, levels of activity, performance or achievements. This presentation
should be viewed in conjunction with our periodic interim and annual reports and registration statements filed with the Securities
and Exchange Commission, copies of which are available from Cadbury Schweppes plc, 25 Berkeley Square, London W1J 6HB, UK.

Results Overview and Operating Review
Todd StitzerChief Executive Officer

4
Today’s Agenda
• Overview
• Half Year Regional Performance Review
• Half Year Financial Review
• 2007 Full Year Outlook
• Conclusion
5
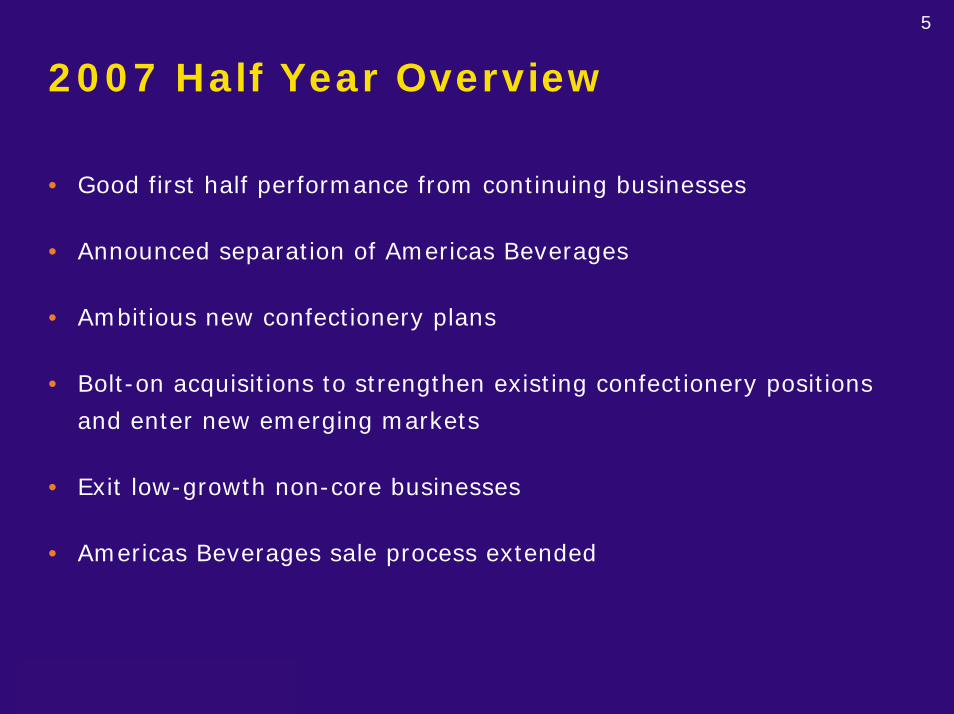
2007 Half Year Overview
• Good first half performance from continuing businesses
• Announced separation of Americas Beverages
• Ambitious new confectionery plans
• Bolt-on acquisitions to strengthen existing confectionery positions
and enter new emerging markets
• Exit low-growth non-core businesses
• Americas Beverages sale process extended
6
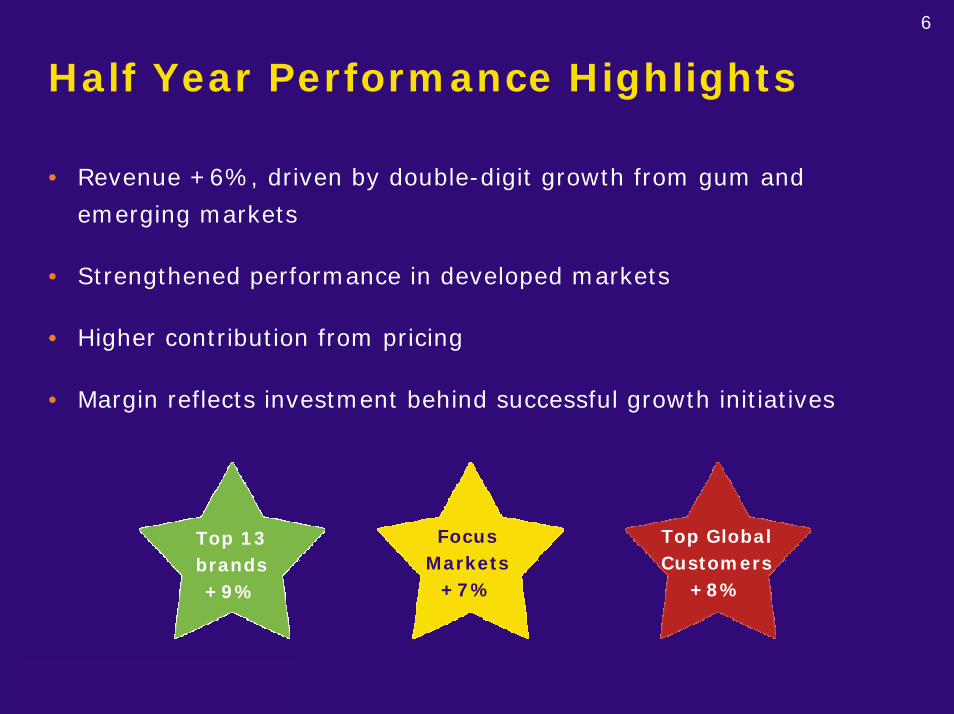
Half Year Performance Highlights
• Revenue +6%, driven by double-digit growth from gum and
emerging markets
• Strengthened performance in developed markets
• Higher contribution from pricing
• Margin reflects investment behind successful growth initiatives
Top 13brands+9%
FocusMarkets
+7%
Top GlobalCustomers
+8%
7
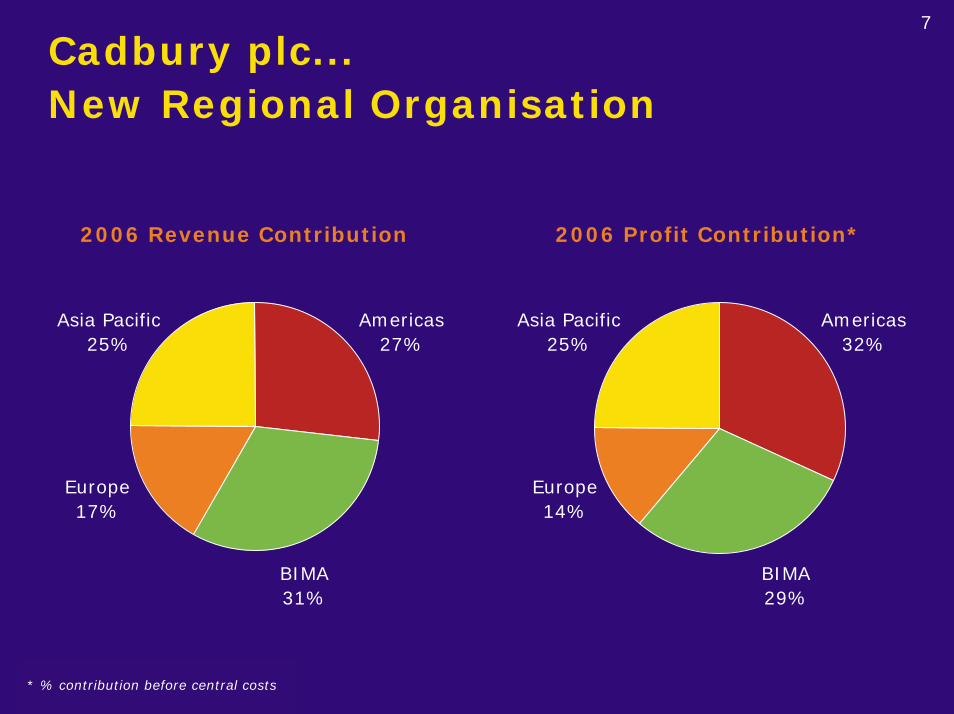
Cadbury plc...New Regional Organisation
2006 Revenue Contribution
Asia Pacific25%
Americas27%
Europe17%
BIMA31%
Asia Pacific25%
Americas32%
Europe14%
BIMA29%
2006 Profit Contribution*
* % contribution before central costs
8
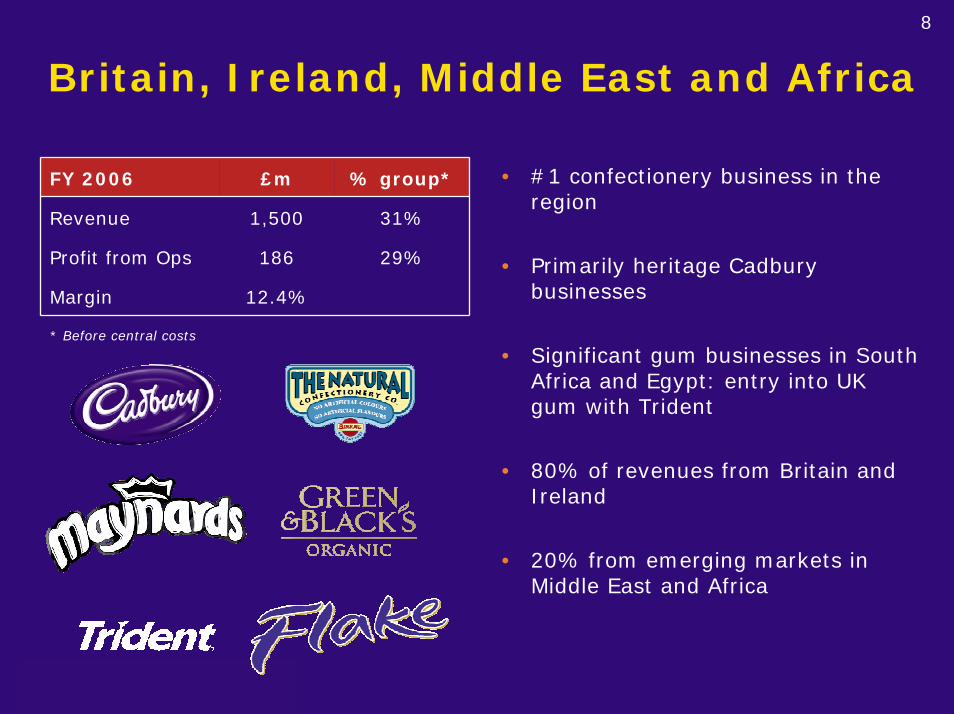
Britain, Ireland, Middle East and Africa
• #1 confectionery business in the region
• Primarily heritage Cadbury businesses
• Significant gum businesses in South Africa and Egypt: entry into UK gum with Trident
• 80% of revenues from Britain and Ireland
• 20% from emerging markets in Middle East and Africa
FY 2006 £m % group*
Revenue 1,500 31%
Profit from Ops 186 29%
Margin 12.4%
* Before central costs
9
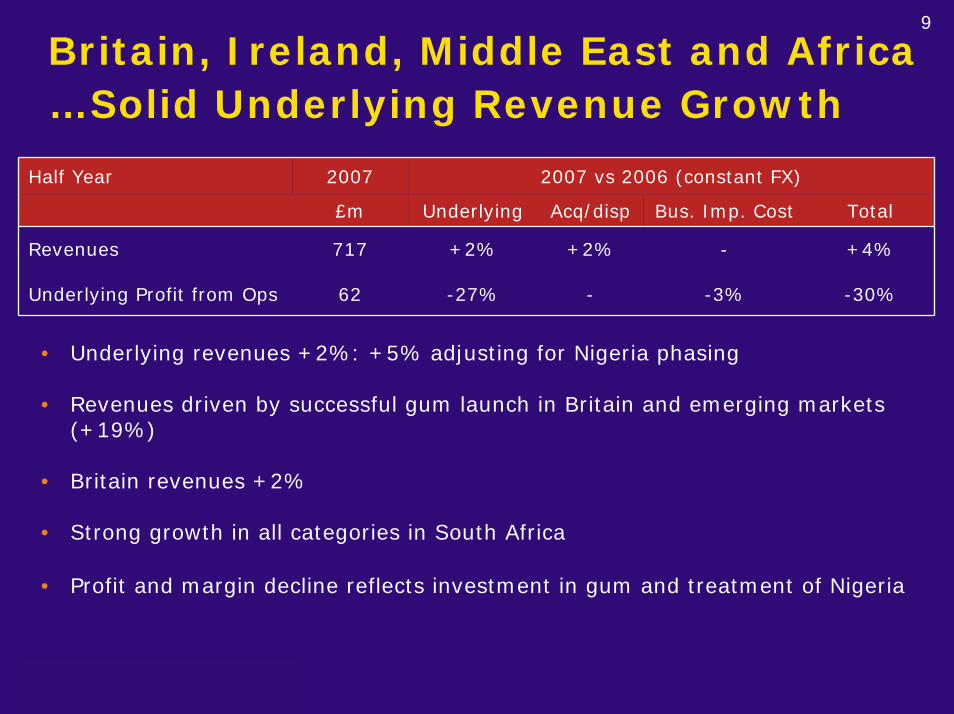
Britain, Ireland, Middle East and Africa …Solid Underlying Revenue Growth
Half Year 2007 2007 vs 2006 (constant FX)
£m Underlying Acq/disp Bus. Imp. Cost Total
Revenues 717 +2% +2% - +4%
Underlying Profit from Ops 62 -27% - -3% -30%
• Underlying revenues +2%: +5% adjusting for Nigeria phasing
• Revenues driven by successful gum launch in Britain and emerging markets (+19%)
• Britain revenues +2%
• Strong growth in all categories in South Africa
• Profit and margin decline reflects investment in gum and treatment of Nigeria
10
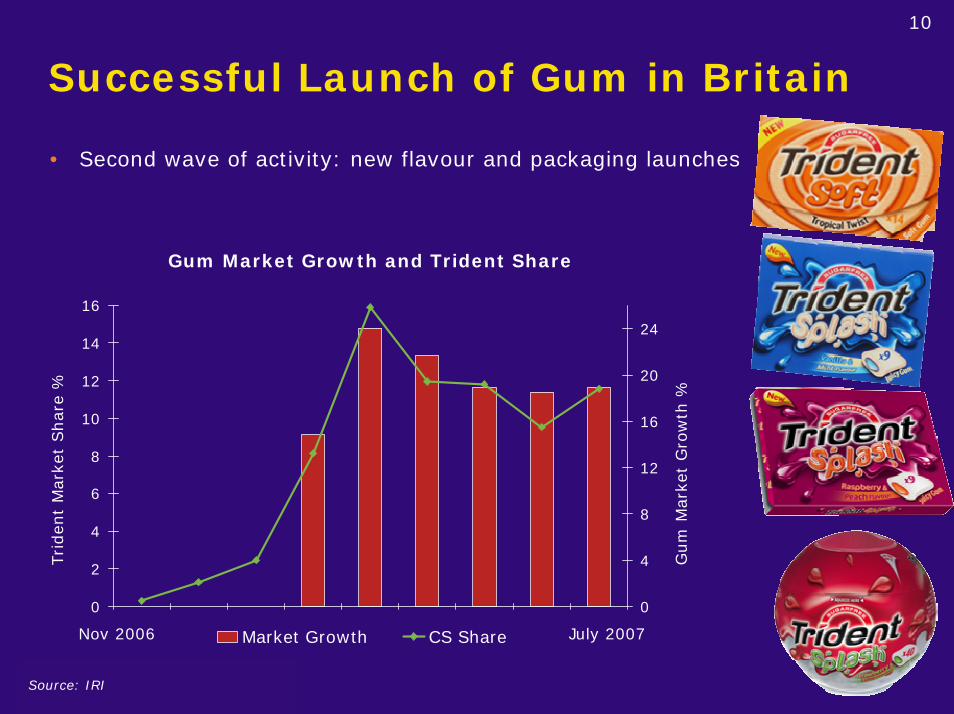
Successful Launch of Gum in Britain
• Second wave of activity: new flavour and packaging launches
Gum Market Growth and Trident Share
Nov 2006 July 2007
Gum
Mar
ket
Gro
wth
%Source: IRI
0
2
4
6
8
10
12
14
16
0
4
8
12
16
20
24
Market Growth CS Share
Triden
t M
arke
t Share
%
11
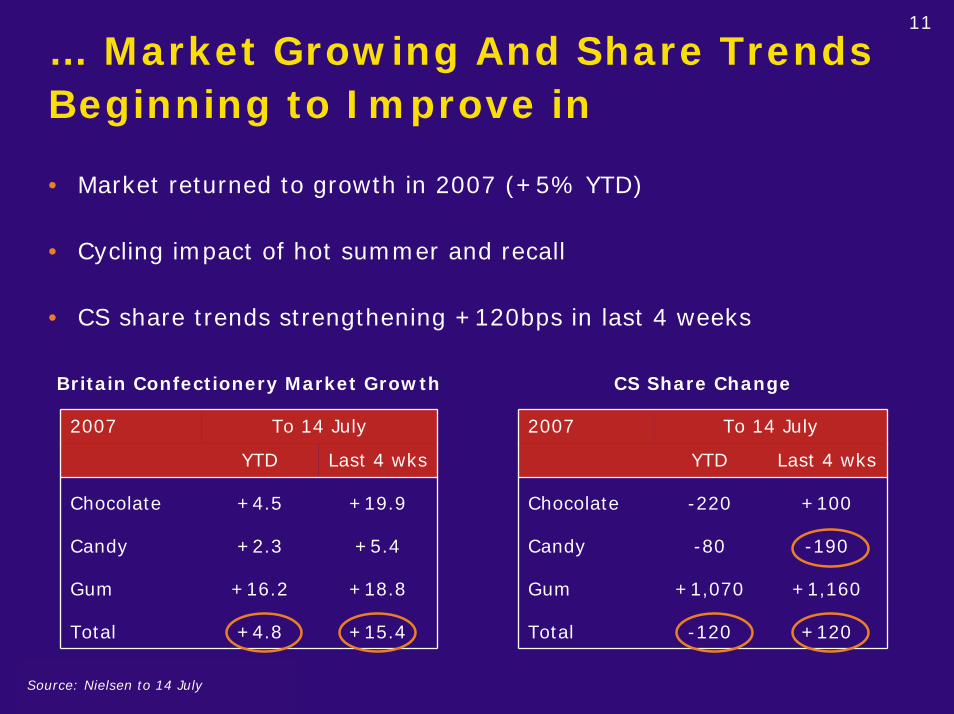
… Market Growing And Share Trends Beginning to Improve in
• Market returned to growth in 2007 (+5% YTD)
• Cycling impact of hot summer and recall
• CS share trends strengthening +120bps in last 4 weeks
Britain Confectionery Market Growth CS Share Change
2007 To 14 July
YTD Last 4 wks
+19.9
+5.4
+18.8
Total +4.8 +15.4
Gum
Chocolate +4.5
Candy +2.3
+16.2
2007 To 14 July
YTD Last 4 wks
+100
-190
+1,160
Total -120 +120
Gum
Chocolate -220
Candy -80
+1,070
Source: Nielsen to 14 July

12
Europe
• Includes all our businesses in W and E Europe, Russia and Turkey
• Largest market is France
• Revenues split 50:50 developed / emerging markets
• Top 10 brands = 65% of revenue
• Primarily gum and pocket candy
• Chocolate presence mainly in Poland and now Romania
* Before central costs
FY 2006 £m % group*
Revenue 818 17%
Profit from Ops 90 14%
Margin 11.0%
13
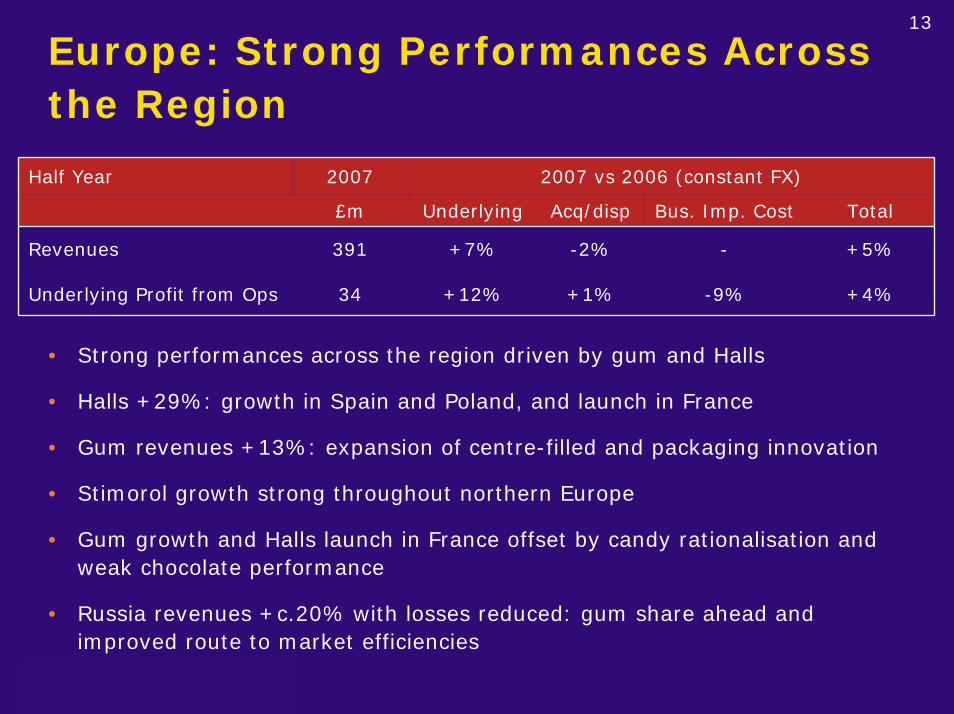
Europe: Strong Performances Across the Region
Half Year 2007 2007 vs 2006 (constant FX)
£m Underlying Acq/disp Bus. Imp. Cost Total
Revenues 391 +7% -2% - +5%
Underlying Profit from Ops 34 +12% +1% -9% +4%
• Strong performances across the region driven by gum and Halls
• Halls +29%: growth in Spain and Poland, and launch in France
• Gum revenues +13%: expansion of centre-filled and packaging innovation
• Stimorol growth strong throughout northern Europe
• Gum growth and Halls launch in France offset by candy rationalisation and weak chocolate performance
• Russia revenues +c.20% with losses reduced: gum share ahead and improved route to market efficiencies
14
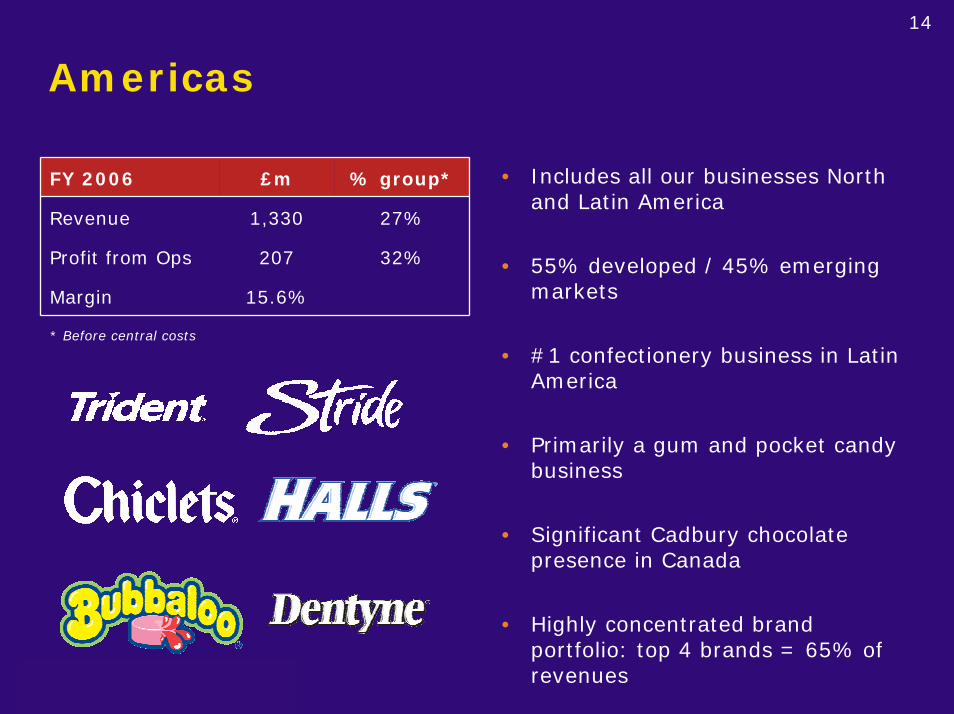
Americas
• Includes all our businesses North and Latin America
• 55% developed / 45% emerging markets
• #1 confectionery business in Latin America
• Primarily a gum and pocket candy business
• Significant Cadbury chocolate presence in Canada
• Highly concentrated brand portfolio: top 4 brands = 65% of revenues
* Before central costs
FY 2006 £m % group*
Revenue 1,330 27%
Profit from Ops 207 32%
Margin 15.6%
15
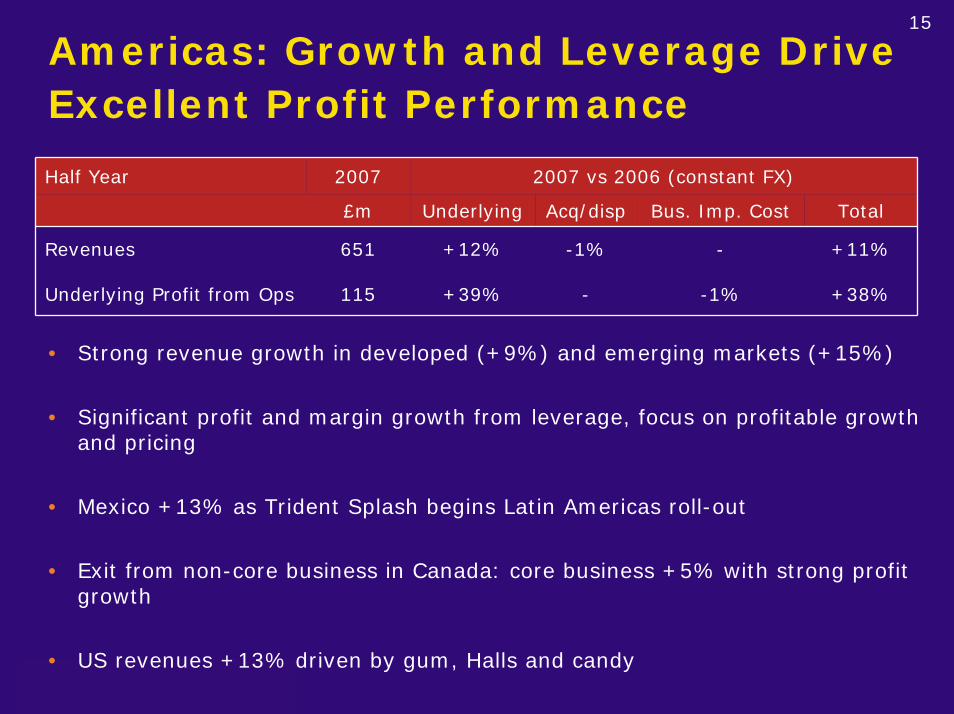
Americas: Growth and Leverage Drive Excellent Profit Performance
Half Year 2007 2007 vs 2006 (constant FX)
£m Underlying Acq/disp Bus. Imp. Cost Total
Revenues 651 +12% -1% - +11%
Underlying Profit from Ops 115 +39% - -1% +38%
• Strong revenue growth in developed (+9%) and emerging markets (+15%)
• Significant profit and margin growth from leverage, focus on profitable growth and pricing
• Mexico +13% as Trident Splash begins Latin Americas roll-out
• Exit from non-core business in Canada: core business +5% with strong profit growth
• US revenues +13% driven by gum, Halls and candy
16
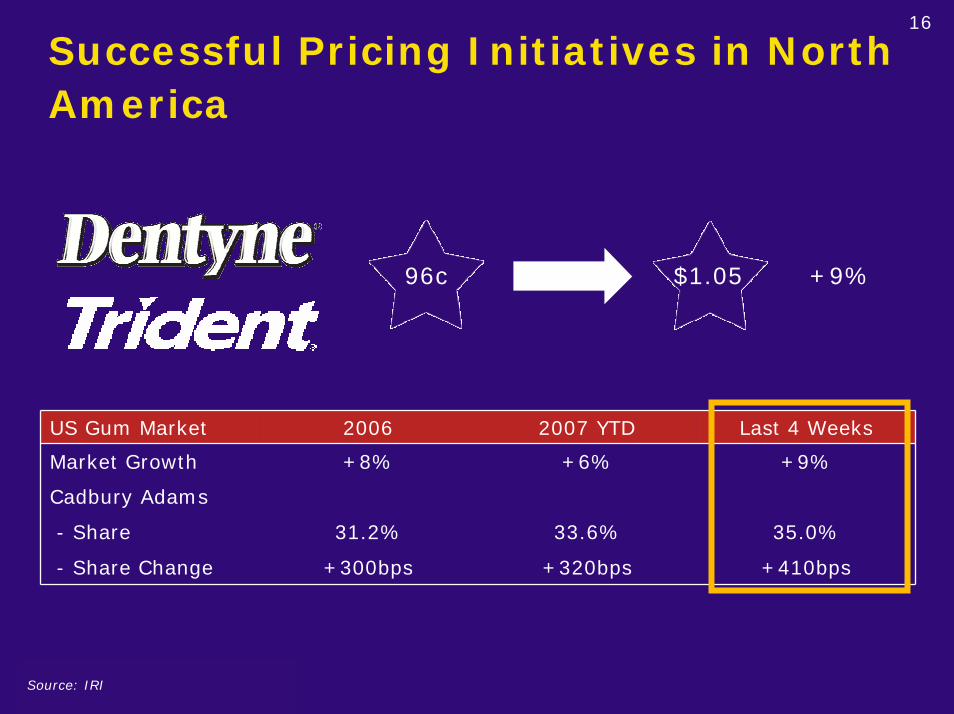
Successful Pricing Initiatives in North America
96c $1.05 +9%
US Gum Market 2006 2007 YTD Last 4 Weeks
Market Growth +8% +6% +9%
Cadbury Adams
- Share 31.2% 33.6% 35.0%
- Share Change +300bps +320bps +410bps
Source: IRI
17
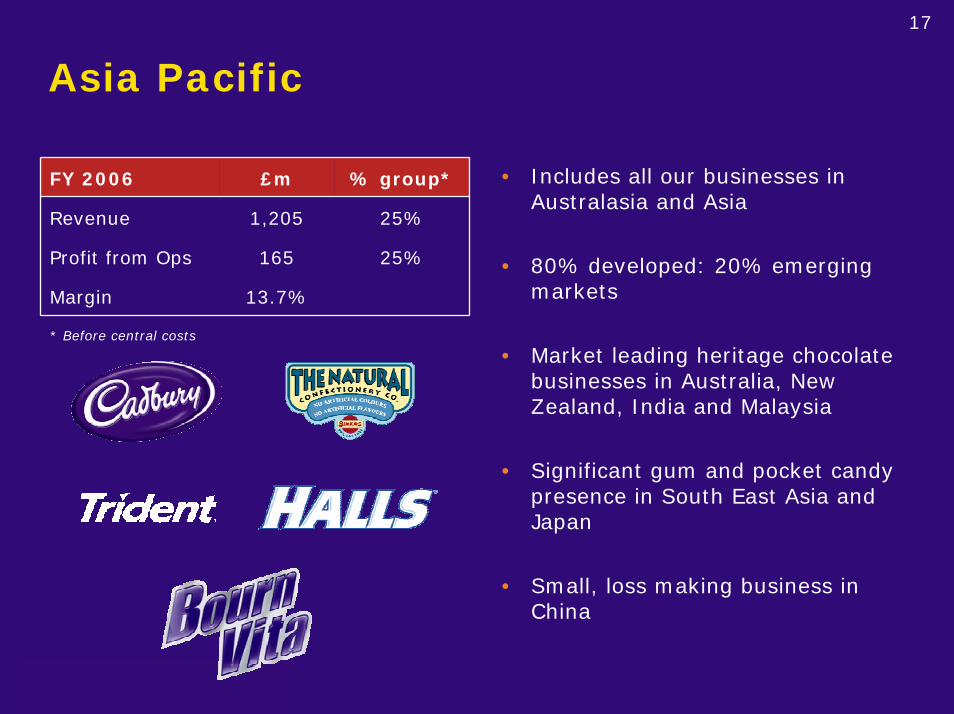
Asia Pacific
• Includes all our businesses in Australasia and Asia
• 80% developed: 20% emerging markets
• Market leading heritage chocolate businesses in Australia, New Zealand, India and Malaysia
• Significant gum and pocket candy presence in South East Asia and Japan
• Small, loss making business in China
* Before central costs
FY 2006 £m % group*
Revenue 1,205 25%
Profit from Ops 165 25%
Margin 13.7%
18
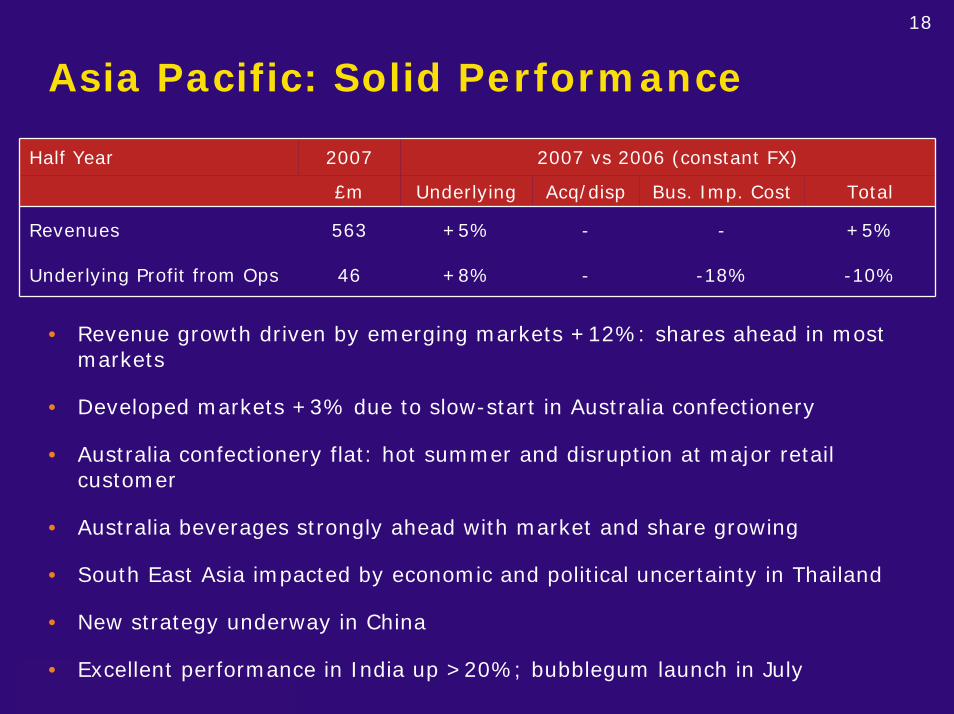
Asia Pacific: Solid Performance
Half Year 2007 2007 vs 2006 (constant FX)
£m Underlying Acq/disp Bus. Imp. Cost Total
Revenues 563 +5% - - +5%
Underlying Profit from Ops 46 +8% - -18% -10%
• Revenue growth driven by emerging markets +12%: shares ahead in most markets
• Developed markets +3% due to slow-start in Australia confectionery
• Australia confectionery flat: hot summer and disruption at major retail customer
• Australia beverages strongly ahead with market and share growing
• South East Asia impacted by economic and political uncertainty in Thailand
• New strategy underway in China
• Excellent performance in India up >20%; bubblegum launch in July

Financial Review
Ken HannaChief Financial Officer
20
Agenda
• Americas Beverages update
• Underlying revenue growth and margin analyses
• Income statement
• Cash flow
• Outlook 2007

21
Americas Beverages Update
• Performance in line with expectations; revenue growth +5%
• YTD CSD share up 70 bps; non-CSD share up 20 bps
• Investing behind new product launches
- Snapple super premium and mainstream teas
- Accelerade
• Price increases to cover higher input costs
• Trading margin down reflecting launch investments
• Sale process ongoing – extended timetable due to debt market volatility
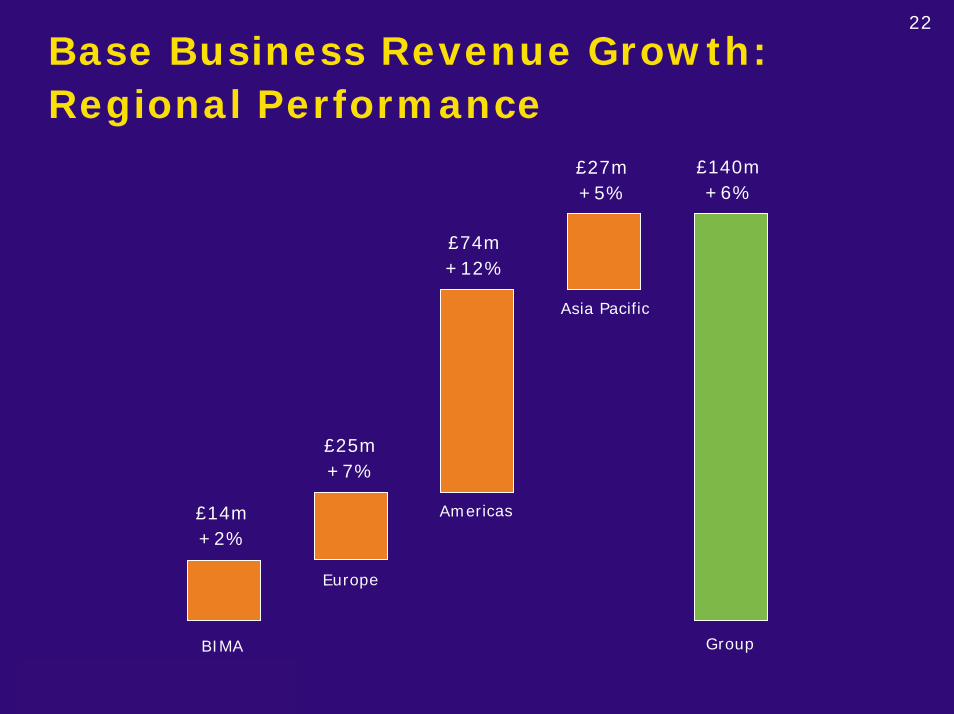
22
Base Business Revenue Growth: Regional Performance
£140m+6%
£27m+5%
£74m+12%
Asia Pacific
£25m+7%
Americas£14m+2%
Europe
GroupBIMA
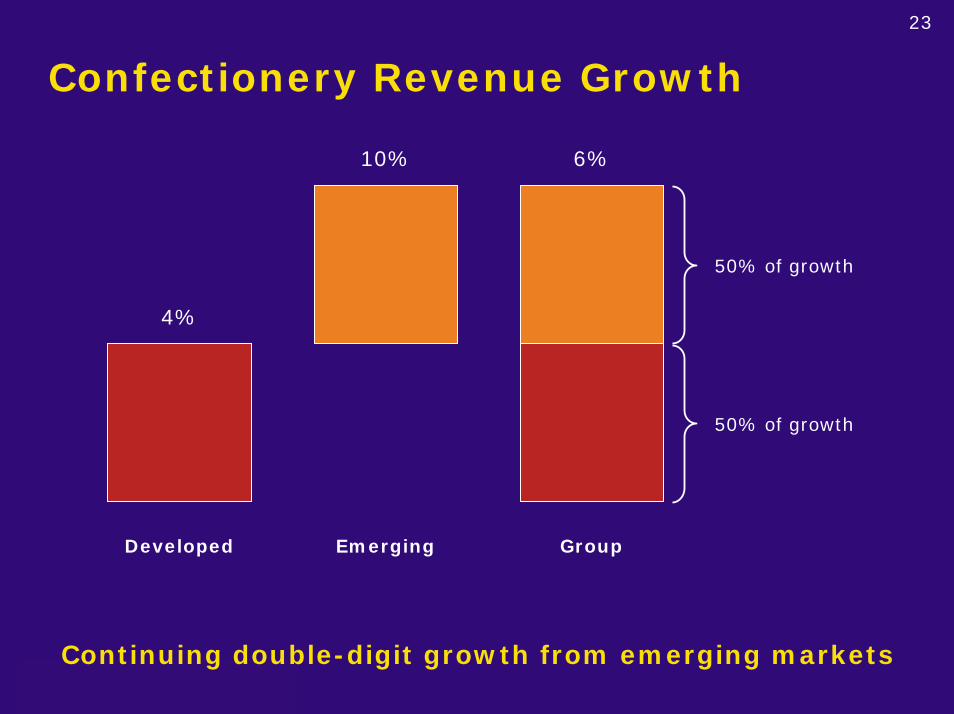
23
Confectionery Revenue Growth
10% 6%
50% of growth
4%
50% of growth
Developed Emerging Group
Continuing double-digit growth from emerging markets
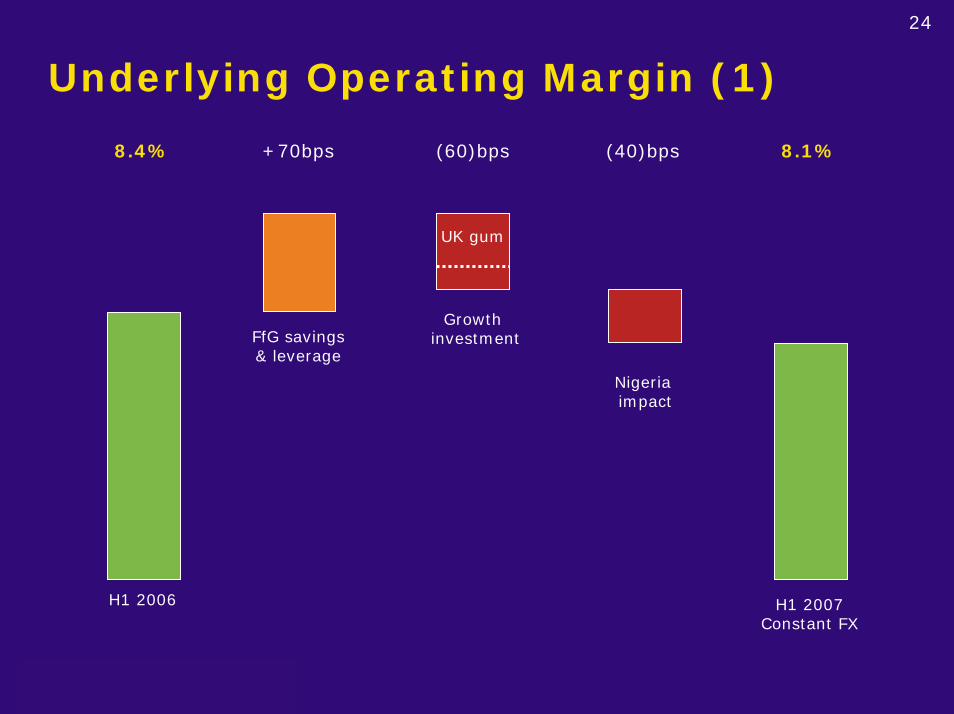
24
Underlying Operating Margin (1)
8.4% +70bps (60)bps (40)bps 8.1%
UK gum
GrowthinvestmentFfG savings
& leverage
Nigeriaimpact
H1 2006 H1 2007 Constant FX
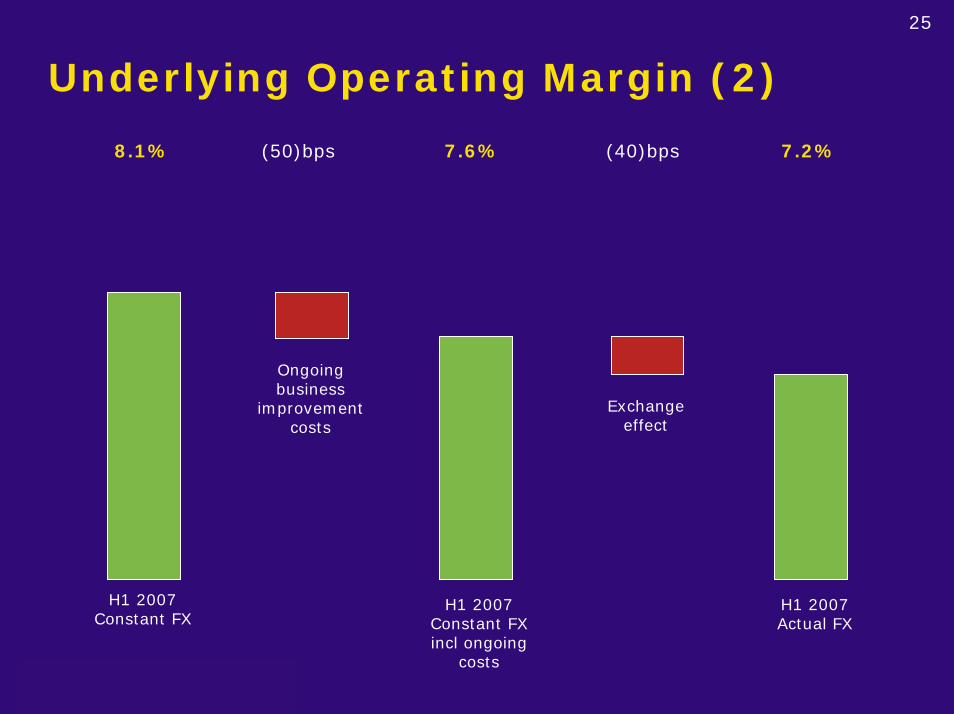
25
Underlying Operating Margin (2)
8.1% (50)bps 7.6% (40)bps 7.2%
Ongoing business
improvement costs
Exchange effect
H1 2007Constant FX
H1 2007 Constant FXincl ongoing
costs
H1 2007 Actual FX
26
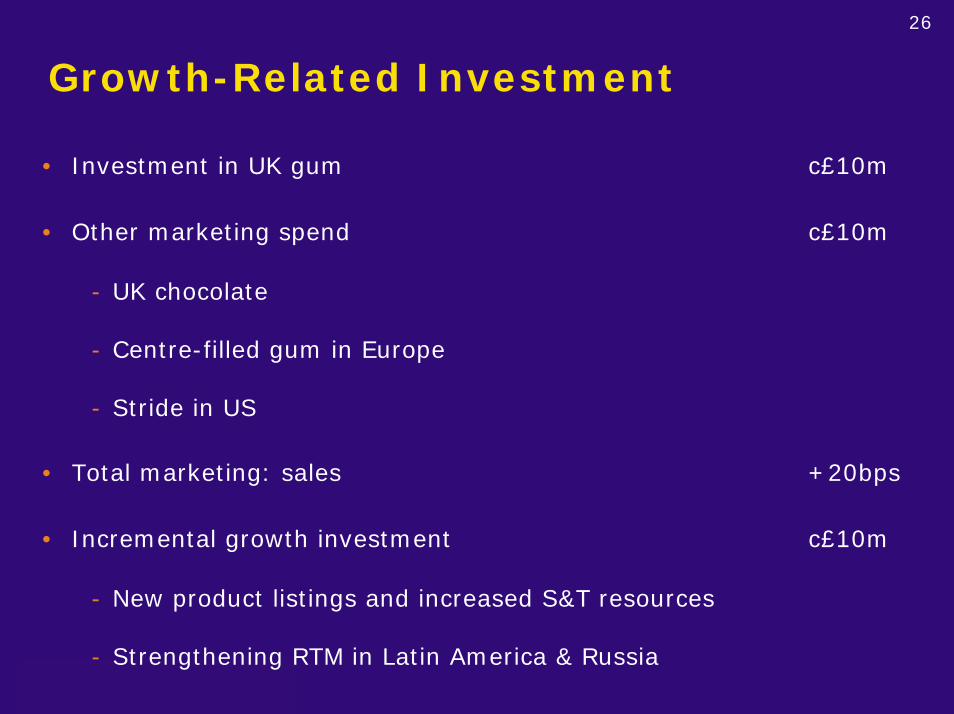
Growth-Related Investment
• Investment in UK gum c£10m
• Other marketing spend c£10m
- UK chocolate
- Centre-filled gum in Europe
- Stride in US
• Total marketing: sales +20bps
• Incremental growth investment c£10m
- New product listings and increased S&T resources
- Strengthening RTM in Latin America & Russia
27
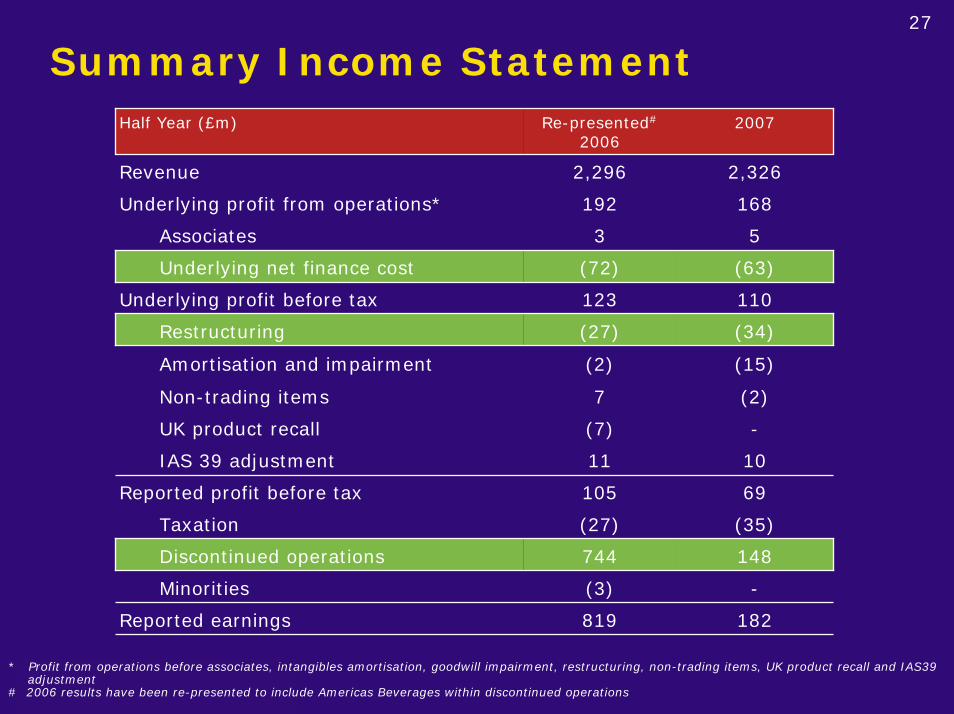
Summary Income StatementHalf Year (£m) Re-presented#
20062007
Revenue 2,296 2,326
Underlying profit from operations* 192 168
Associates 3 5
Underlying net finance cost (72) (63)
Underlying profit before tax 123 110
Restructuring (27) (34)
Amortisation and impairment (2) (15)
Non-trading items 7 (2)
UK product recall (7) -
IAS 39 adjustment 11 10
Reported profit before tax 105 69
Taxation (27) (35)
Discontinued operations 744 148
Minorities (3) -
Reported earnings 819 182
* Profit from operations before associates, intangibles amortisation, goodwill impairment, restructuring, non-trading items, UK product recall and IAS39 adjustment
# 2006 results have been re-presented to include Americas Beverages within discontinued operations
28
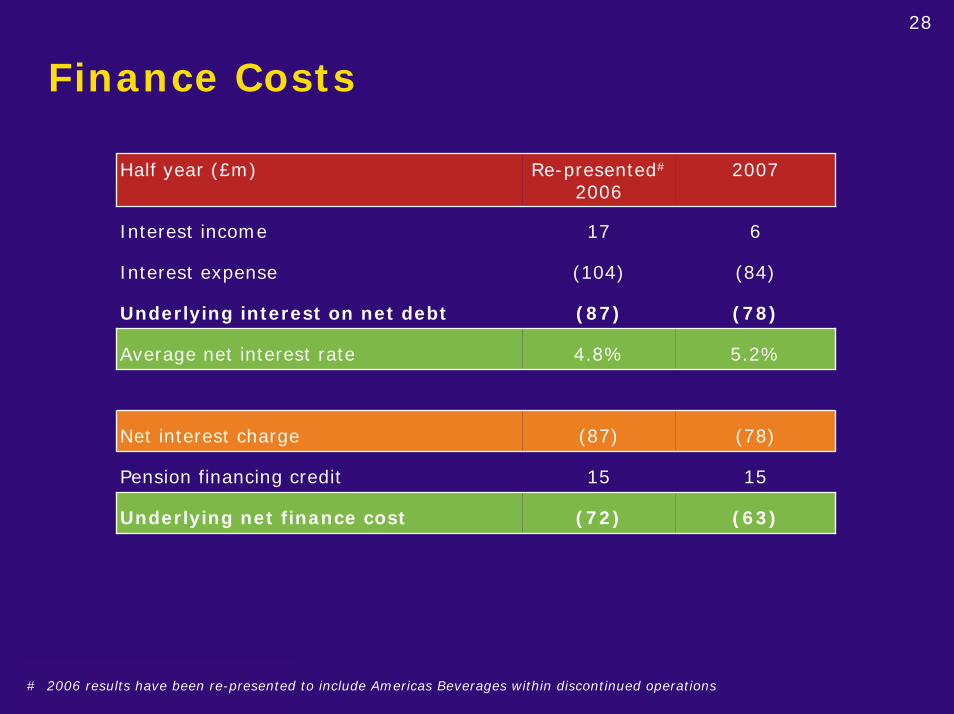
Finance Costs
Half year (£m) Re-presented#
20062007
Interest income 17 6
Interest expense (104) (84)
Underlying interest on net debt (87) (78)
Average net interest rate 4.8% 5.2%
Net interest charge (87) (78)
Pension financing credit 15 15
Underlying net finance cost (72) (63)
# 2006 results have been re-presented to include Americas Beverages within discontinued operations
29
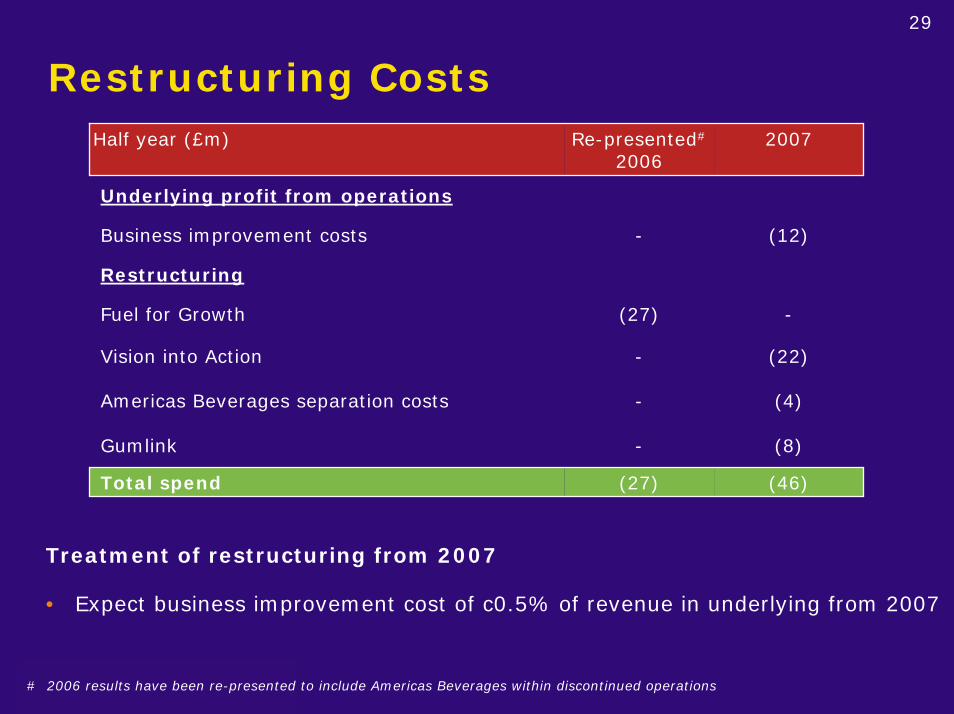
Restructuring CostsHalf year (£m) Re-presented#
20062007
Underlying profit from operations
Business improvement costs - (12)
Restructuring
Vision into Action - (22)
Americas Beverages separation costs - (4)
Fuel for Growth (27) -
Gumlink - (8)
Total spend (27) (46)
Treatment of restructuring from 2007
• Expect business improvement cost of c0.5% of revenue in underlying from 2007
# 2006 results have been re-presented to include Americas Beverages within discontinued operations
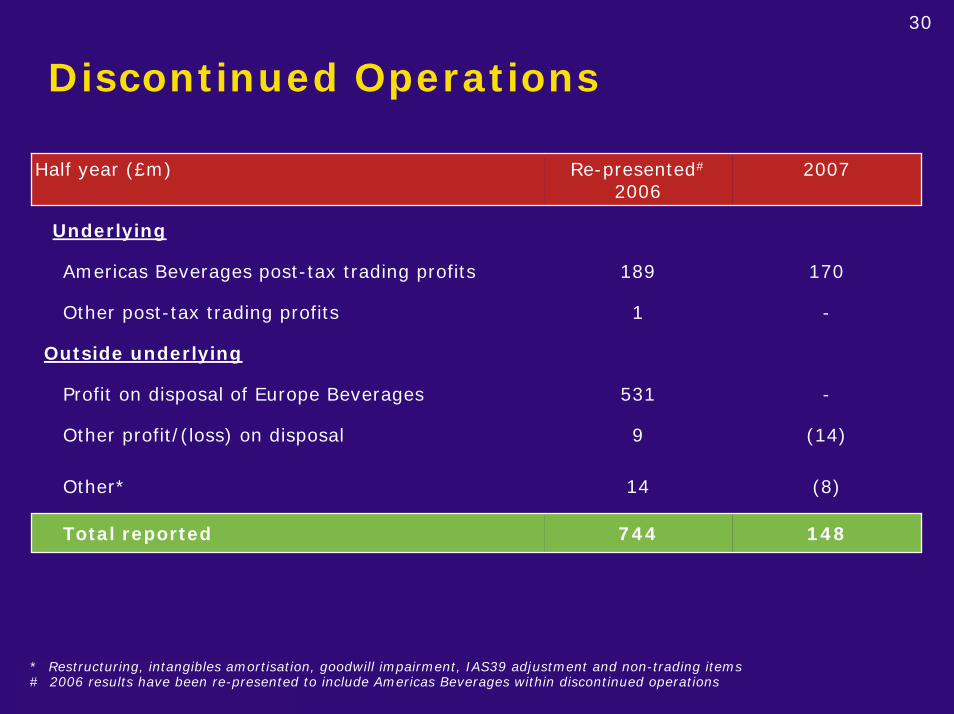
30
Discontinued Operations
Half year (£m) Re-presented#
20062007
Underlying
Americas Beverages post-tax trading profits 189 170
Other profit/(loss) on disposal 9 (14)
Other post-tax trading profits 1 -
Outside underlying
Other* 14 (8)
531
Total reported 744 148
Profit on disposal of Europe Beverages -
* Restructuring, intangibles amortisation, goodwill impairment, IAS39 adjustment and non-trading items# 2006 results have been re-presented to include Americas Beverages within discontinued operations
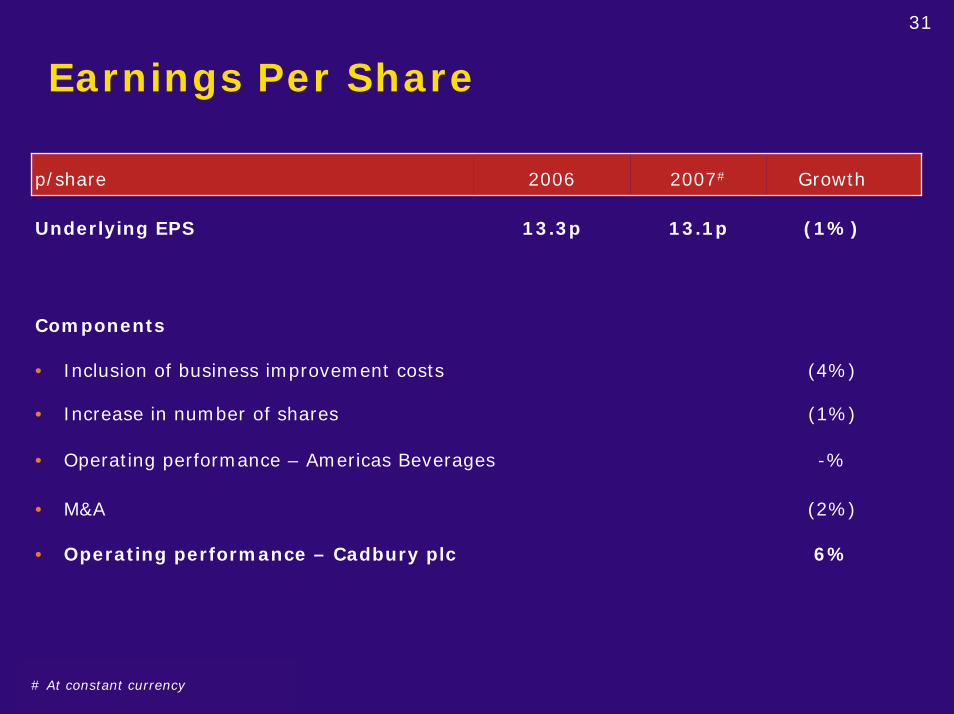
31
Earnings Per Share
p/share 2006 2007# Growth
Underlying EPS 13.3p 13.1p
• Operating performance – Americas Beverages -%
Components
• Inclusion of business improvement costs (4%)
• M&A (2%)
• Increase in number of shares (1%)
• Operating performance – Cadbury plc 6%
(1%)
# At constant currency
32
Dividends
• H1 dividend 5p/share
• Profile remains approx one third interim and two thirds final
• Full year dividend per share at level consistent with current
expectations for existing CS Group
• Share consolidation expected as part of return of capital following
beverages disposal
• Full year dividend – likely to be on a smaller number of shares
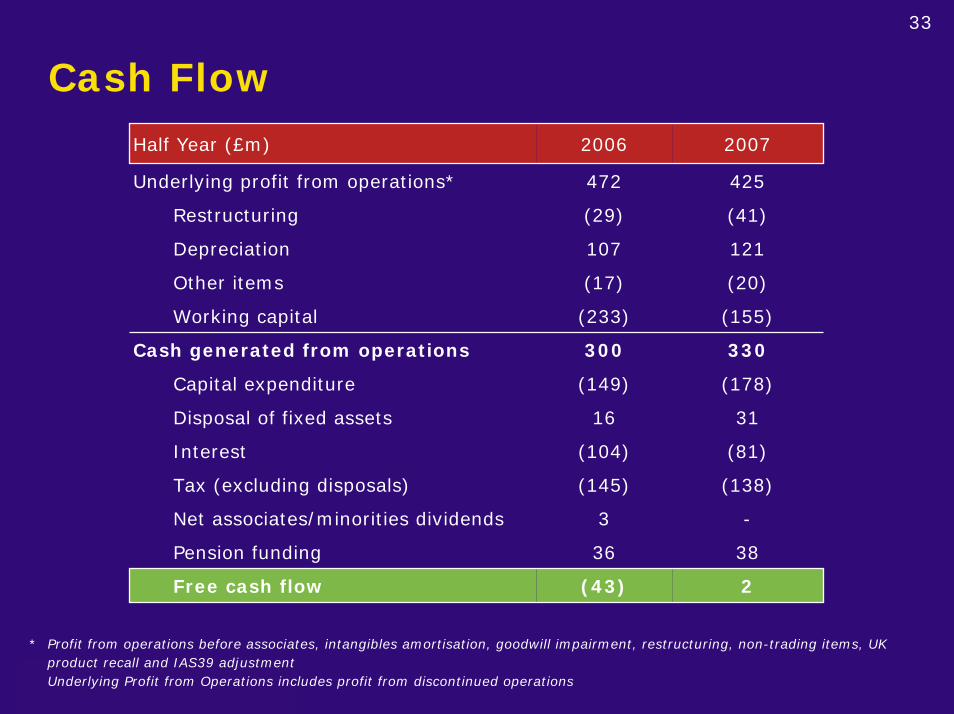
33
Cash FlowHalf Year (£m) 2006 2007
Underlying profit from operations* 472 425
Restructuring (29) (41)
Depreciation 107 121
Other items (17) (20)
Working capital (233) (155)
Tax (excluding disposals) (145) (138)
Net associates/minorities dividends 3 -
Cash generated from operations 300 330
Capital expenditure (149) (178)
Disposal of fixed assets 16 31
Interest (104) (81)
Pension funding 36 38
Free cash flow (43) 2
* Profit from operations before associates, intangibles amortisation, goodwill impairment, restructuring, non-trading items, UK product recall and IAS39 adjustmentUnderlying Profit from Operations includes profit from discontinued operations
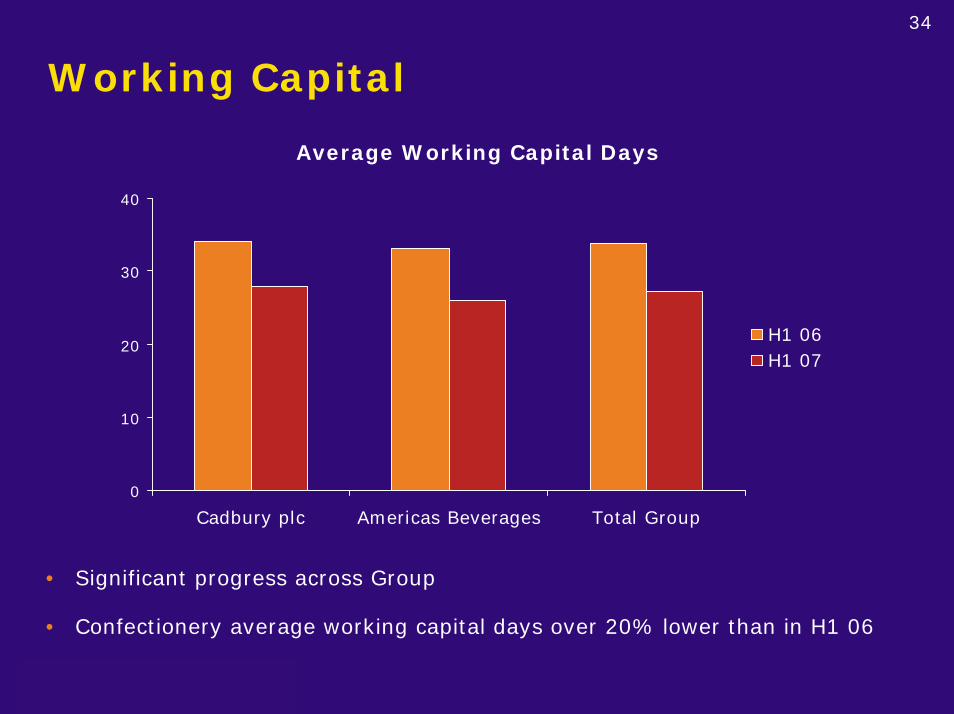
34
Working Capital
0
10
20
30
40
Cadbury plc Americas Beverages Total Group
H1 06H1 07
• Significant progress across Group
• Confectionery average working capital days over 20% lower than in H1 06
Average Working Capital Days
35
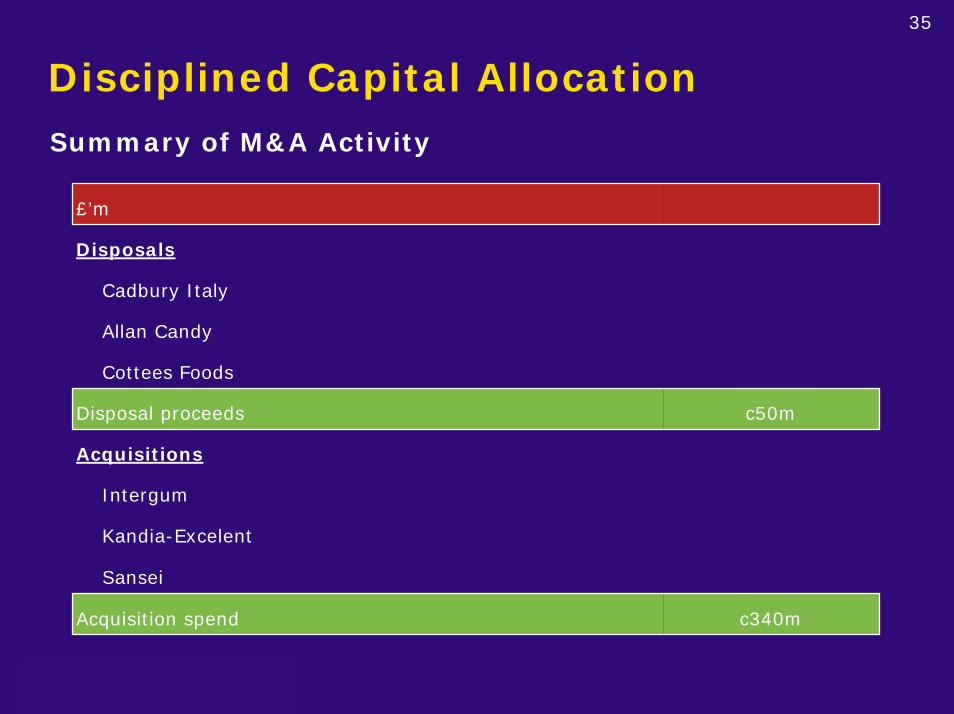
Disciplined Capital AllocationSummary of M&A Activity
£’m
Disposals
Cadbury Italy
Allan Candy
Intergum
Kandia-Excelent
Sansei
Cottees Foods
Disposal proceeds
Acquisitions
Acquisition spend
c50m
c340m
36
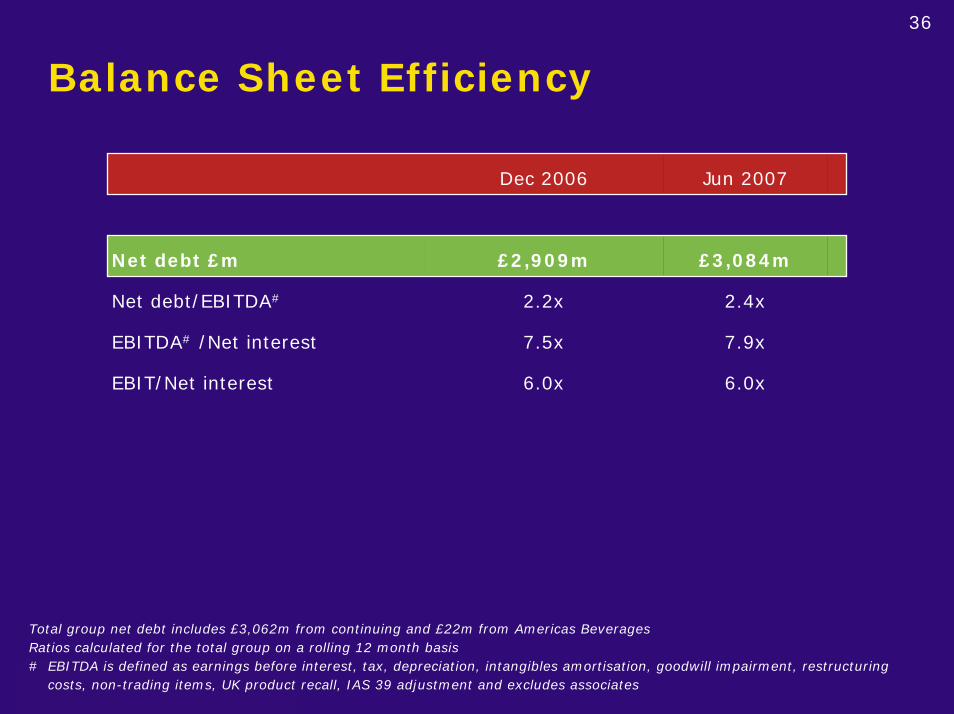
Balance Sheet Efficiency
Dec 2006 Jun 2007
£2,909m
2.2x
7.5x
EBIT/Net interest 6.0x 6.0x
Net debt £m £3,084m
EBITDA# /Net interest 7.9x
Net debt/EBITDA# 2.4x
Total group net debt includes £3,062m from continuing and £22m from Americas BeveragesRatios calculated for the total group on a rolling 12 month basis# EBITDA is defined as earnings before interest, tax, depreciation, intangibles amortisation, goodwill impairment, restructuring
costs, non-trading items, UK product recall, IAS 39 adjustment and excludes associates
37
2007 Outlook
• Regional overview
• Dairy costs
- Two thirds liquid; one third powdered
- Average 20% cost increase
- Pricing actions anticipated
38
BIMA - 2007 Factors
• UK business
- Full year of gum launch
- Lapping recall and hot summer in H2 06
- Sheffield flood
• Nigeria lapping full year accounting correction in H2 06
• Continuing strong momentum from Africa/Middle East
39
Europe - 2007 Factors
• Strong gum category momentum
• Good momentum and improving results in Russia
• Integrating Intergum and Kandia acquisitions
40
Americas - 2007 Factors
• Strong performance in H1
• Excellent category and share momentum
• Significant competitor activity in H2 behind new launches
41
Asia Pacific - 2007 Factors
• Making good progress
• Withdrawal from co-packing arrangement
• Aggressive ANZ retailer environment
• Political & economic uncertainty in Thailand
• Strong momentum from other emerging markets
42
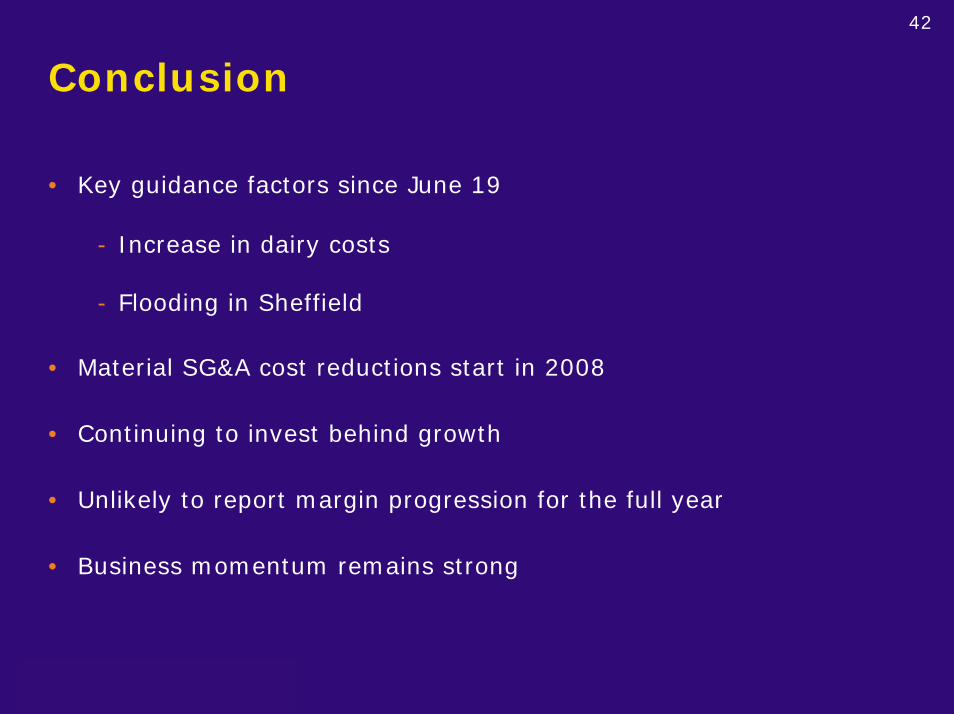
Conclusion
• Key guidance factors since June 19
- Increase in dairy costs
- Flooding in Sheffield
• Material SG&A cost reductions start in 2008
• Continuing to invest behind growth
• Unlikely to report margin progression for the full year
• Business momentum remains strong

Supplementary Information
44
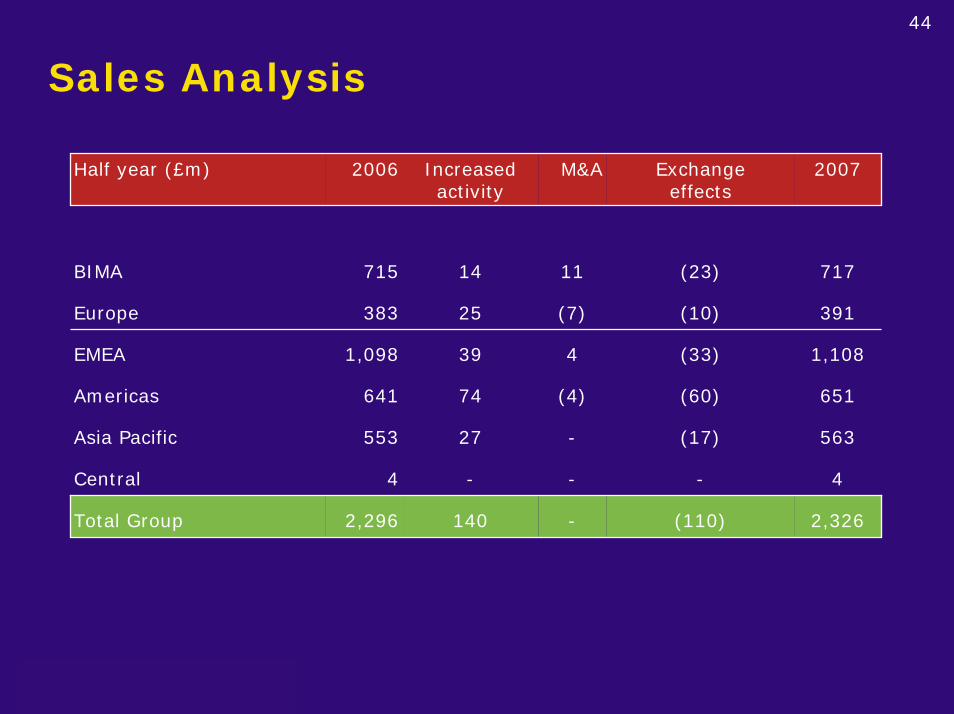
Sales Analysis
Half year (£m) 2006 Increasedactivity
M&A Exchange effects
2007
BIMA 715 14 11 (23) 717
Europe 383 25 (7) (10) 391
EMEA 1,098 39 4 (33) 1,108
Americas 641 74 (4) (60) 651
Asia Pacific 553 27 - (17) 563
Central 4 - - - 4
Total Group 2,296 140 - (110) 2,326
45
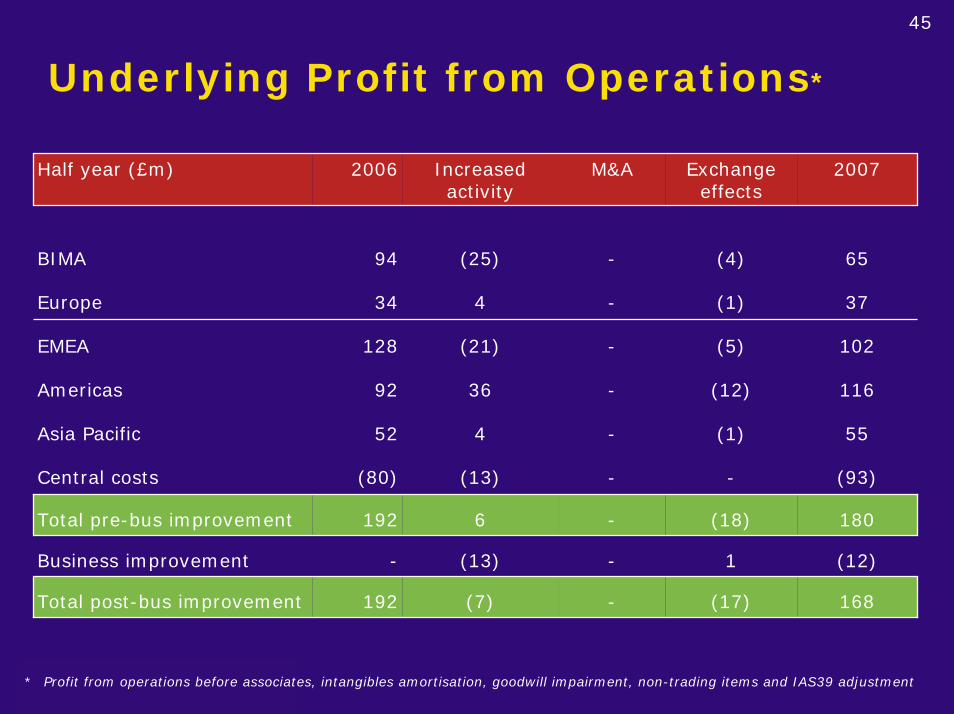
Underlying Profit from Operations*
Half year (£m) 2006 Increased activity
M&A Exchange effects
2007
BIMA 94 (25) - (4) 65
Europe 34 4 - (1) 37
EMEA 128 (21) - (5) 102
Americas 92 36 - (12) 116
Total pre-bus improvement 192 6 - (18) 180
Business improvement - (13) - 1 (12)
Asia Pacific 52 4 - (1) 55
Central costs (80) (13) - - (93)
Total post-bus improvement 192 (7) - (17) 168
* Profit from operations before associates, intangibles amortisation, goodwill impairment, non-trading items and IAS39 adjustment
46
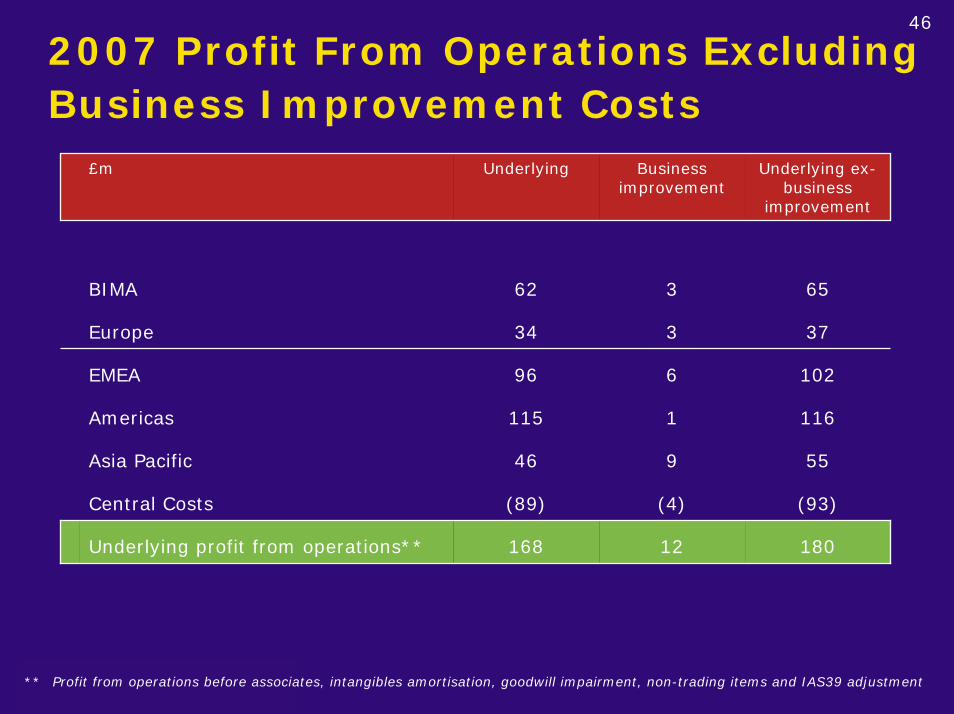
2007 Profit From Operations Excluding Business Improvement Costs
£m Underlying Business improvement
Underlying ex-business
improvement
Europe 34 3 37
BIMA 62 3 65
EMEA 96 6 102
Americas 115 1 116
Asia Pacific 46 9 55
Central Costs (89) (4) (93)
Underlying profit from operations** 168 12 180
** Profit from operations before associates, intangibles amortisation, goodwill impairment, non-trading items and IAS39 adjustment
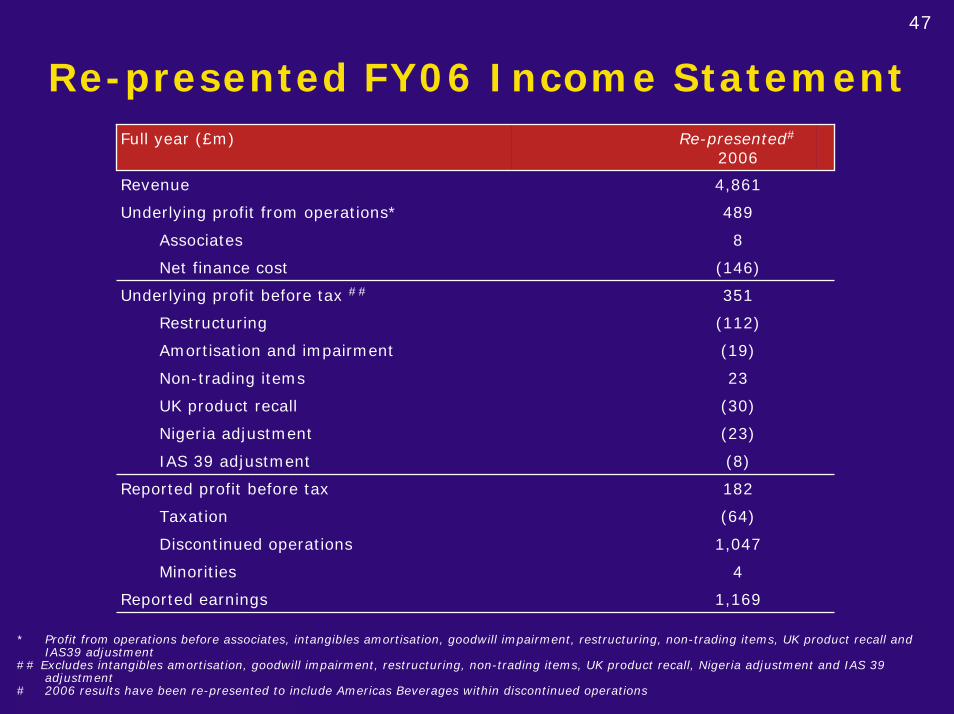
47
Re-presented FY06 Income StatementFull year (£m) Re-presented#
2006
Revenue 4,861
Non-trading items 23
UK product recall (30)
Underlying profit from operations* 489
Associates 8
Net finance cost (146)
Underlying profit before tax ## 351
Restructuring (112)
Amortisation and impairment (19)
Nigeria adjustment (23)
IAS 39 adjustment (8)
Reported profit before tax 182
Taxation (64)
Discontinued operations 1,047
Minorities 4
Reported earnings 1,169
* Profit from operations before associates, intangibles amortisation, goodwill impairment, restructuring, non-trading items, UK product recall and IAS39 adjustment
## Excludes intangibles amortisation, goodwill impairment, restructuring, non-trading items, UK product recall, Nigeria adjustment and IAS 39 adjustment
# 2006 results have been re-presented to include Americas Beverages within discontinued operations
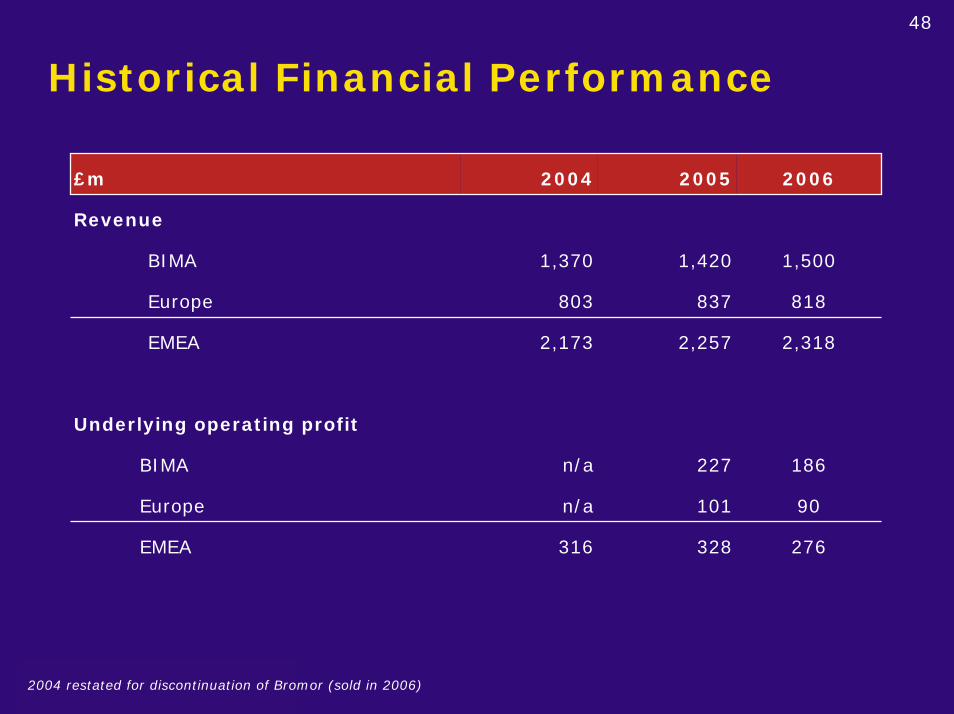
48
Historical Financial Performance
£m 2004 2005 2006
Revenue
BIMA 1,370 1,420 1,500
BIMA
Europe n/a 101 90
EMEA
803
EMEA 2,173 2,257 2,318
n/a 227 186
316 328 276
Europe 837 818
Underlying operating profit
2004 restated for discontinuation of Bromor (sold in 2006)
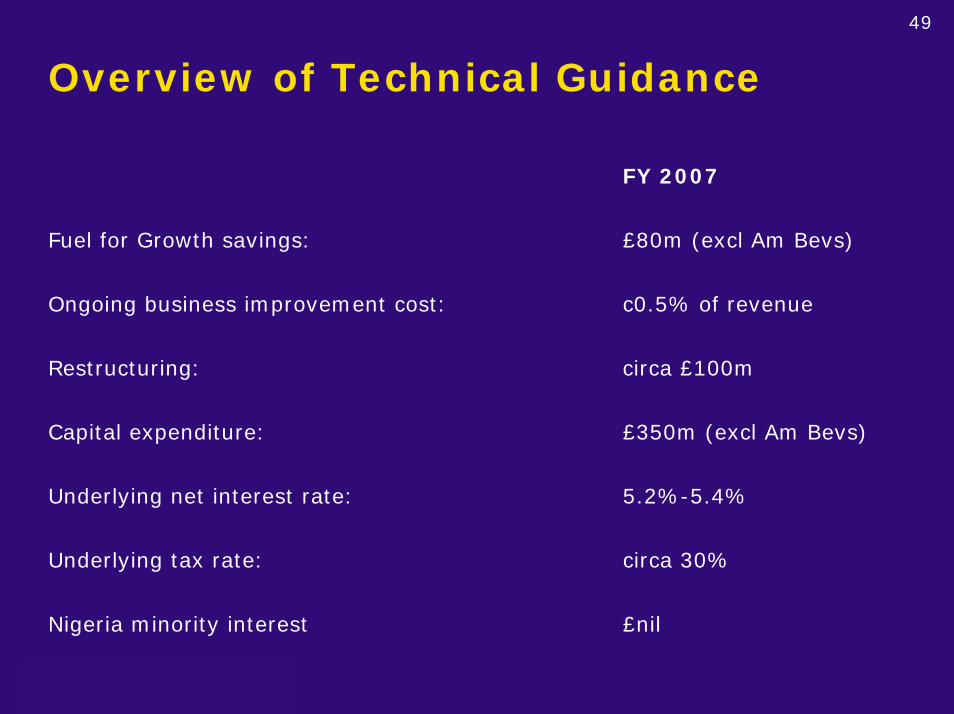
49
Overview of Technical Guidance
FY 2007
Fuel for Growth savings: £80m (excl Am Bevs)
Ongoing business improvement cost: c0.5% of revenue
Restructuring: circa £100m
Capital expenditure: £350m (excl Am Bevs)
Underlying net interest rate: 5.2%-5.4%
Underlying tax rate: circa 30%
Nigeria minority interest £nil

50
M&A Activity – Non-Core DisposalsCompleted
Cadbury Italy February 2007
Allan Candy (Canada) June 2007
Announced
Piasten (Germany) June 2005
Holland House Cooking Wines (US) December 2005
Grandma’s Molasses (US) January 2006
Europe Beverages Division February 2006
Slush Puppie (US) April 2006
Syria Beverages April 2006
Bromor (S. Africa) August 2006
Cottees Foods (Australia) July 2007
Monkhill (UK)
Americas Beverages (US)
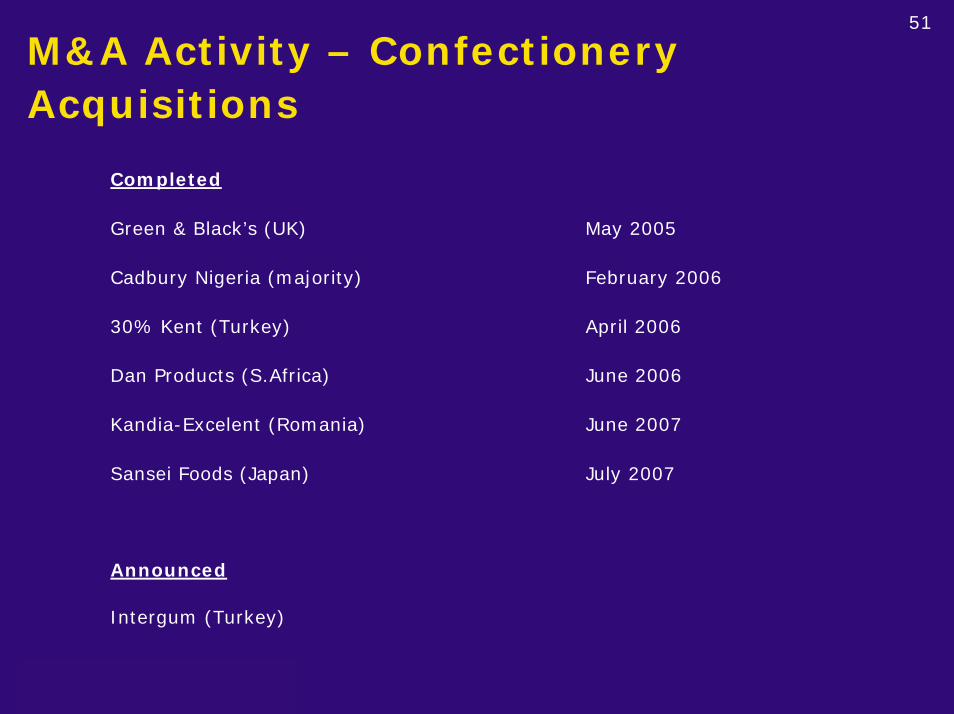
51
M&A Activity – Confectionery Acquisitions
Completed
Sansei Foods (Japan) July 2007
Intergum (Turkey)
Green & Black’s (UK) May 2005
Cadbury Nigeria (majority) February 2006
30% Kent (Turkey) April 2006
Dan Products (S.Africa) June 2006
Announced
Kandia-Excelent (Romania) June 2007
52
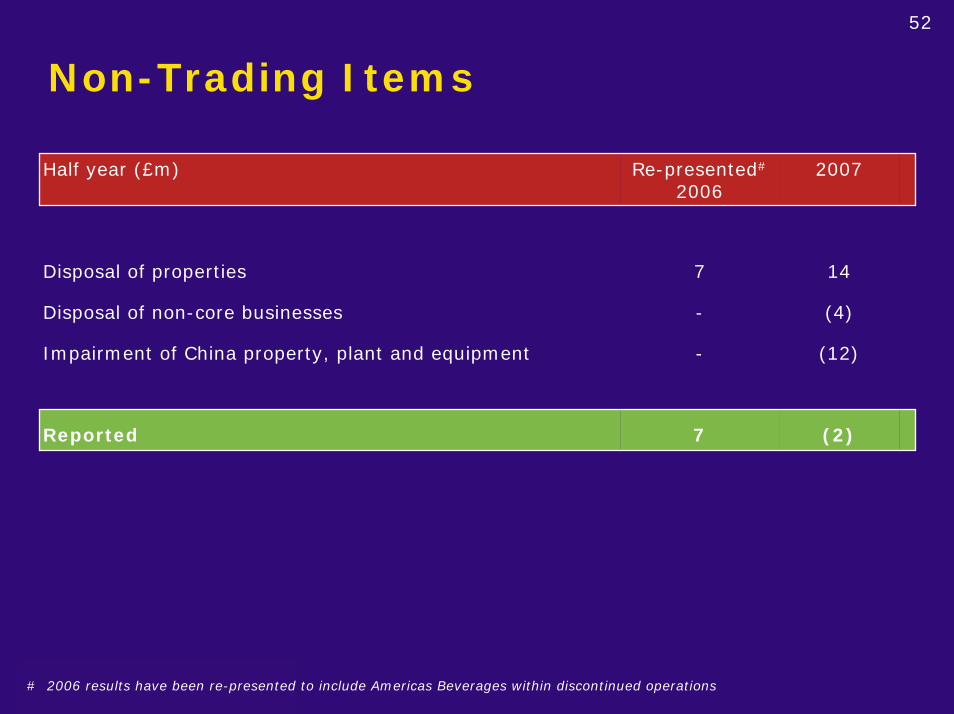
Non-Trading Items
Half year (£m) Re-presented#
20062007
Disposal of properties 7 14
Impairment of China property, plant and equipment - (12)
-
Reported 7 (2)
Disposal of non-core businesses (4)
# 2006 results have been re-presented to include Americas Beverages within discontinued operations
53
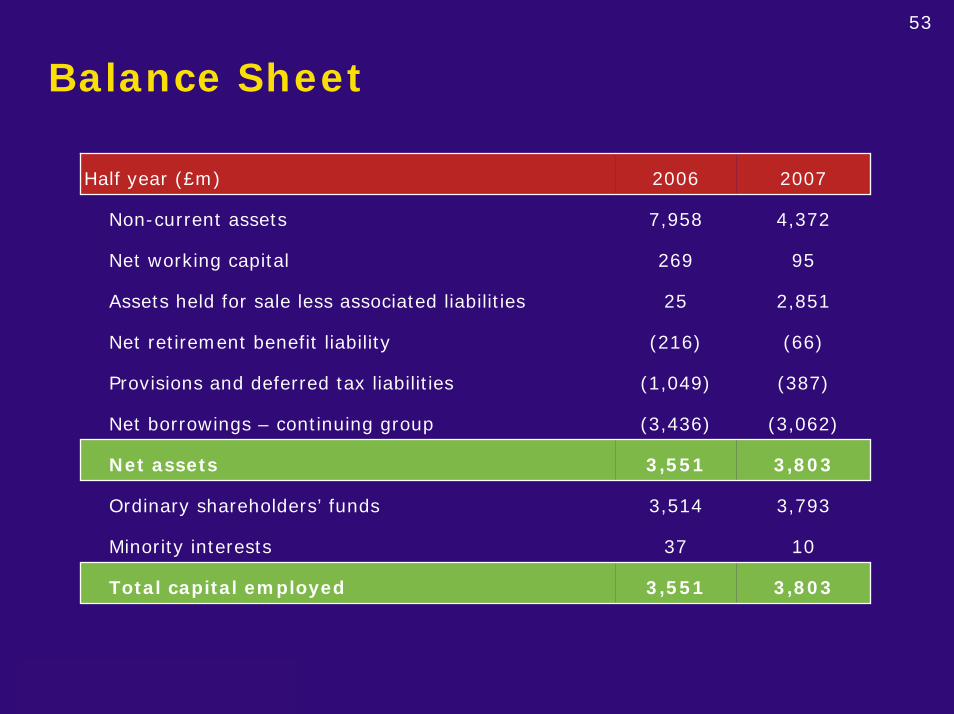
Balance Sheet
Half year (£m) 2006 2007
Non-current assets 7,958
269
25
Net retirement benefit liability (216) (66)
Provisions and deferred tax liabilities (1,049) (387)
Net borrowings – continuing group (3,436) (3,062)
Net assets 3,551 3,803
Ordinary shareholders’ funds 3,514 3,793
Minority interests 37 10
Total capital employed 3,551 3,803
4,372
Net working capital 95
Assets held for sale less associated liabilities 2,851
54
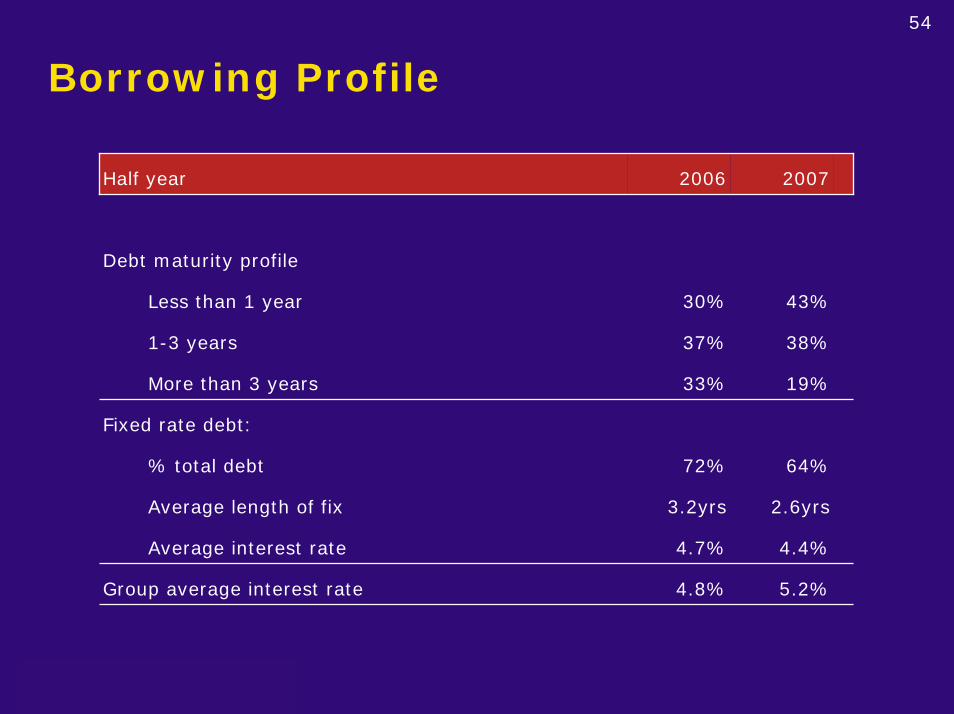
Borrowing Profile
Half year 2006 2007
30%
37%
33%
72%
3.2yrs
Average interest rate 4.7% 4.4%
Group average interest rate 4.8% 5.2%
More than 3 years 19%
Fixed rate debt:
% total debt 64%
Average length of fix 2.6yrs
Debt maturity profile
Less than 1 year 43%
1-3 years 38%
55
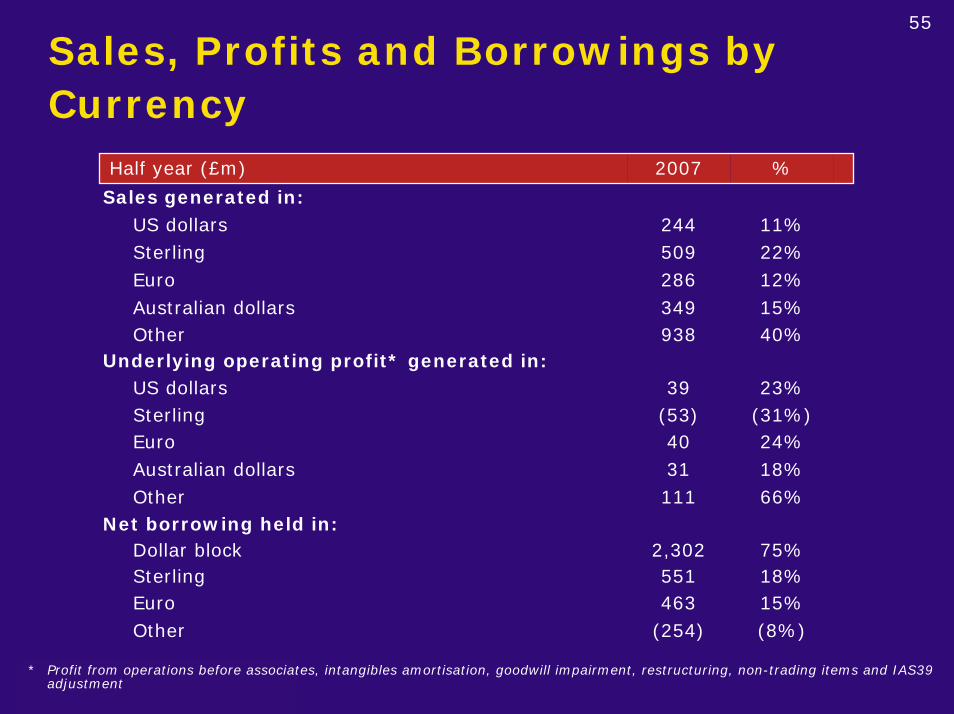
Sales, Profits and Borrowings by Currency
Half year (£m) 2007 %
Sales generated in:US dollars 244 11%Sterling 509 22%
Australian dollars 349 15%
Australian dollars 31 18%
Other (254) (8%)
Other 111 66%
Other 938 40%
Euro 286 12%
39(53)40
2,302551
Euro 463 15%
Euro 24%
Net borrowing held in:Dollar block 75%Sterling 18%
Underlying operating profit* generated in:US dollars 23%Sterling (31%)
* Profit from operations before associates, intangibles amortisation, goodwill impairment, restructuring, non-trading items and IAS39 adjustment
56
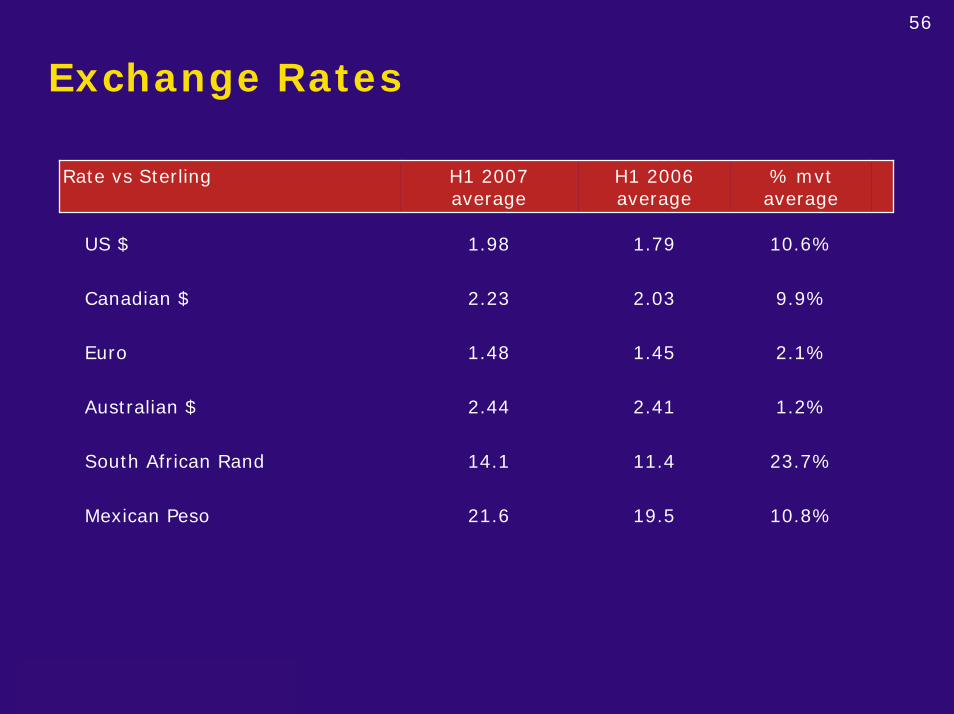
Exchange Rates
Rate vs Sterling H1 2007average
H1 2006average
% mvtaverage
US $ 1.98 1.79
2.03
1.45
2.41
South African Rand 14.1 11.4 23.7%
Mexican Peso 21.6 19.5 10.8%
10.6%
Canadian $ 2.23 9.9%
Euro 1.48 2.1%
Australian $ 2.44 1.2%

Closing Remarks
Todd StitzerChief Executive Officer
58
Summary and Conclusion
• Separation of beverages to focus on confectionery
• Significant under-exploited confectionery potential
• Step change in margins by reconfiguring confectionery business
model
• Focus on delivering aggressive SG&A reductions in 2008
• Revenues continue to benefit from investment in growth