2006 waste characterization study - solid waste systemopala.org/pdfs/solid_waste/2006 final waste...
TRANSCRIPT

Final Report
2006 Waste Characterization Study City and County of Honolulu April 2007


2006 Waste Characterization Study 4/3/07
Table of Contents
Table of Contents List of Tables List of Figures
Executive Summary
Section 1. Introduction and Overview.................................................................... .1-1 1.1 Project Background.................................................................................. 1-1 1.2 Purpose/Objectives .................................................................................. 1-1 1.3 Existing Conditions.................................................................................. 1-2
Section 2. Methodology............................................................................................. 2-1 2.1 Sampling Methodology............................................................................ 2-1 2.2 Sorting Activities ..................................................................................... 2-4 2.3 Data Analysis ........................................................................................... 2-4 2.3.1 Composition Development ...................................................................... 2-4 2.3.2 Solid Waste Weight Calculations ............................................................ 2-5
Section 3. Results and Findings ............................................................................... 3-1 3.1 General..................................................................................................... 3-1 3.2 H-POWER Results................................................................................... 3-1 3.3 Waimanalo Gulch Landfill Results.......................................................... 3-4 3.4 Aggregate Overall Results ....................................................................... 3-6 3.5 Residential Waste Results ........................................................................ 3-8 3.6 Commercial Waste Results .................................................................... 3-12 3.7 Convenience Center Waste Results ....................................................... 3-14 3.8 HI-5 Recyclables Results ....................................................................... 3-17 Appendix A - Material Categories Appendix B - Calculation of Waste Rerouted to Waimanalo Gulch Landfill from H-POWER Due to Closure
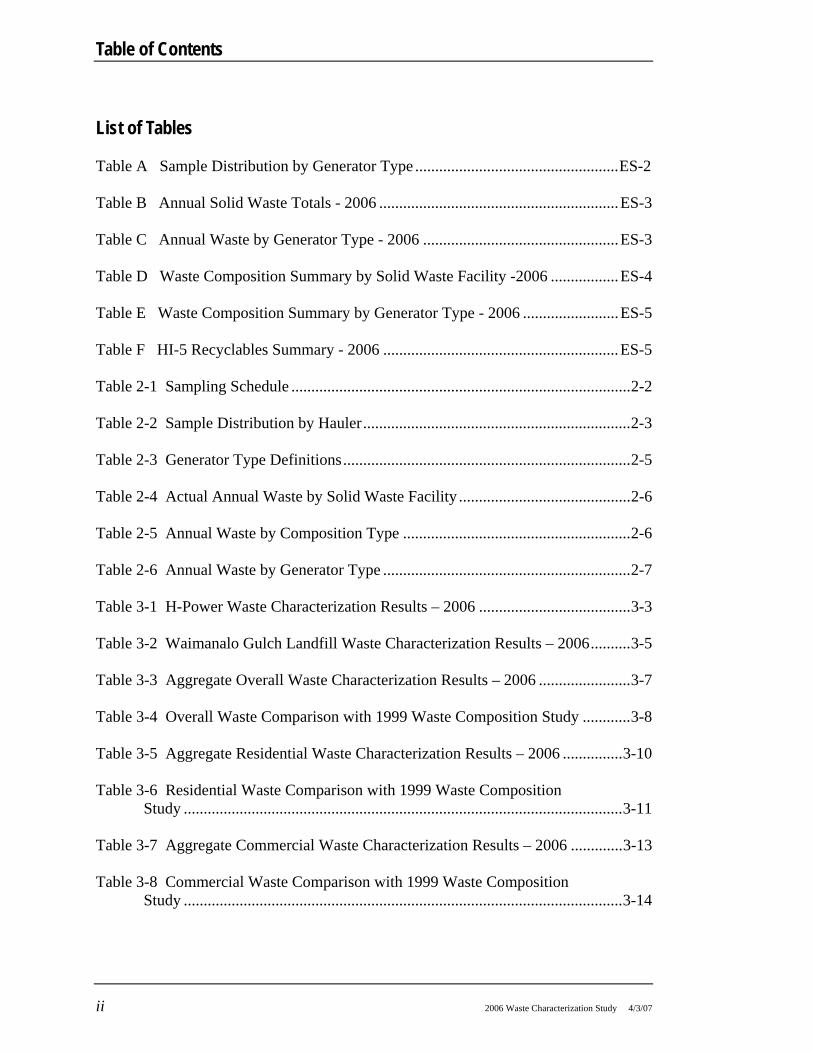
Table of Contents
ii 2006 Waste Characterization Study 4/3/07
List of Tables Table A Sample Distribution by Generator Type ...................................................ES-2 Table B Annual Solid Waste Totals - 2006 ............................................................ES-3 Table C Annual Waste by Generator Type - 2006 .................................................ES-3 Table D Waste Composition Summary by Solid Waste Facility -2006 .................ES-4 Table E Waste Composition Summary by Generator Type - 2006 ........................ES-5 Table F HI-5 Recyclables Summary - 2006 ...........................................................ES-5 Table 2-1 Sampling Schedule .....................................................................................2-2 Table 2-2 Sample Distribution by Hauler...................................................................2-3 Table 2-3 Generator Type Definitions........................................................................2-5 Table 2-4 Actual Annual Waste by Solid Waste Facility ...........................................2-6 Table 2-5 Annual Waste by Composition Type .........................................................2-6 Table 2-6 Annual Waste by Generator Type ..............................................................2-7 Table 3-1 H-Power Waste Characterization Results – 2006 ......................................3-3 Table 3-2 Waimanalo Gulch Landfill Waste Characterization Results – 2006..........3-5 Table 3-3 Aggregate Overall Waste Characterization Results – 2006 .......................3-7 Table 3-4 Overall Waste Comparison with 1999 Waste Composition Study ............3-8 Table 3-5 Aggregate Residential Waste Characterization Results – 2006 ...............3-10 Table 3-6 Residential Waste Comparison with 1999 Waste Composition
Study ..............................................................................................................3-11 Table 3-7 Aggregate Commercial Waste Characterization Results – 2006 .............3-13 Table 3-8 Commercial Waste Comparison with 1999 Waste Composition
Study ..............................................................................................................3-14

Table of Contents
2006 Waste Characterization Study 4/3/07 iii
List of Tables (continued) Table 3-9 Convenience Center Waste Characterization Results – 2006.................. 3-16 Table 3-10 Convenience Center Waste Comparison with 1999 Waste
Composition Study........................................................................................ 3-17 Table 3-11 Number of HI-5 Containers in Waste Stream – 2006............................ 3-18 List of Figures Figure 3-1: H-Power Waste Composition Summary - 2006...................................... 3-2 Figure 3-2: Waimanalo Gulch Landfill Waste Composition Summary - 2006 ......... 3-4 Figure 3-3: Aggregate Overall Waste Composition Summary - 2006....................... 3-6 Figure 3-4: Aggregate Residential Waste Composition Summary - 2006................. 3-9 Figure 3-5: Aggregate Commercial Waste Composition Summary - 2006............. 3-12 Figure 3-6: Convenience Center Waste Composition Summary - 2006.................. 3-15
This report has been prepared for the use of the client for the specific purposes identified in the report. The conclusions, observations and recommendations contained herein attributed to R. W. Beck, Inc. (R. W. Beck) constitute the opinions of R. W. Beck. To the extent that statements, information and opinions provided by the client or others have been used in the preparation of this report, R. W. Beck has relied upon the same to be accurate, and for which no assurances are intended and no representations or warranties are made. R. W. Beck makes no certification and gives no assurances except as explicitly set forth in this report.
Copyright 2006, R. W. Beck, Inc. All rights reserved.


2006 Waste Characterization Study 4/3/07
EXECUTIVE SUMMARY
The City and County of Honolulu, Department of Environmental Services, Refuse Division (Refuse Division) has retained R. W. Beck, Inc. to complete an update of its Integrated Solid Waste Management Plan (ISWMP). An updated waste characterization was necessary to obtain detailed statistical information for use in developing the various program components of the ISWMP. This report has been prepared to present the results of the 2006 Waste Characterization Study.
The purpose of this 2006 Waste Characterization Study is to provide an estimate of the composition and quantities of solid waste material currently generated and disposed of on the island of O‘ahu. Waste stream compositions for the energy recovery facility, H-POWER, and Waimanalo Gulch Landfill will be characterized and presented as part of this report. Additionally, compositions will be developed for each generator type. The three generator types used for this study include residential, commercial, and convenience center.
The Refuse Division has identified several objectives for an updated waste characterization. The data obtained in this Study will be used to evaluate the current solid waste management system and assess the effectiveness of previously implemented policies and programs. In addition, the results will be used to compare alternative collection and disposal strategies while identifying potential improvements to current recycling programs. The types and quantities of specific materials within the various waste streams directly affect the environmental and economic impacts of these considerations.
Currently, all municipal solid waste generated in Honolulu is transported to either the H-POWER waste-to-energy facility or Waimanalo Gulch Landfill (Landfill). The typical waste streams of these solid waste facilities are very different as the Landfill receives primarily materials which cannot be processed at H-POWER. Periodically throughout the year, a portion of the waste destined for H-POWER is rerouted to the Landfill because of closure due to maintenance or capacity limitations.
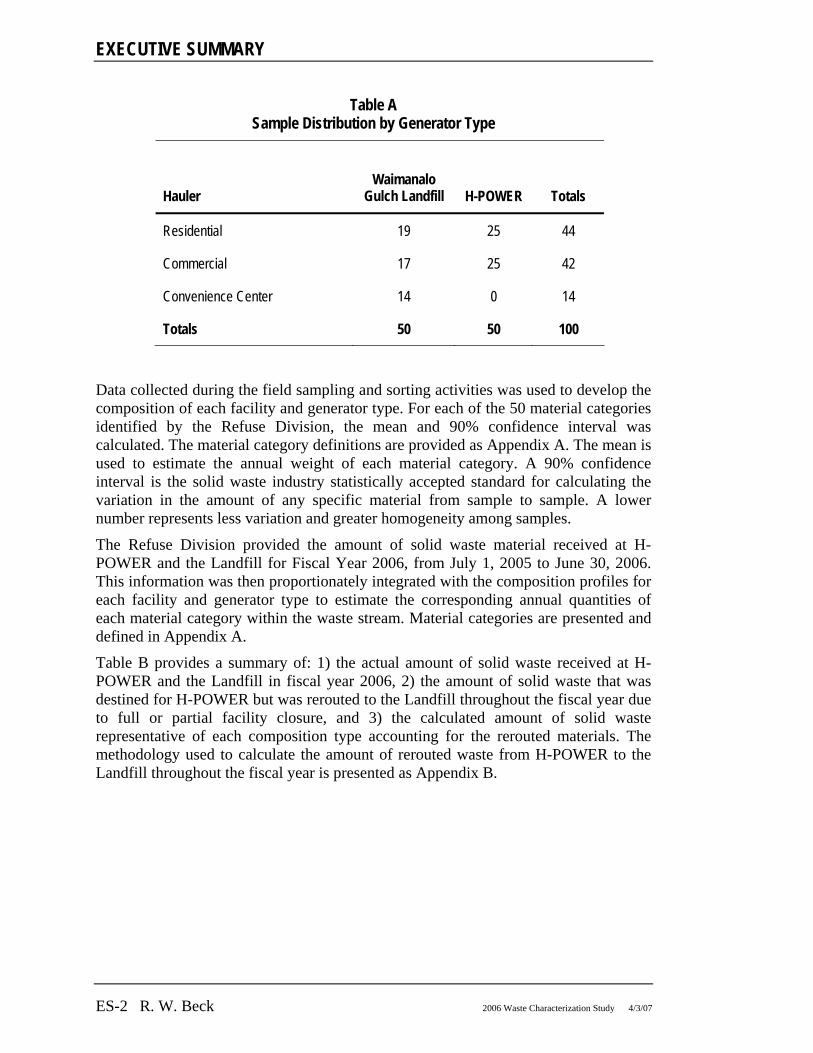
In order to develop meaningful, statistically accurate composition profiles of the unique waste streams, R. W. Beck collected and sorted waste material within a total of 100 samples between the dates of September 11, 2006 to September 21, 2006. Sampling activities were completed during dates when no waste was being rerouted to the Landfill from H-POWER because of closure. Waste materials received at each facility during designated sampling periods were representative of the typical waste stream. Table A presents the number of samples collected at each solid waste facility by generator type.
EXECUTIVE SUMMARY
ES-2 R. W. Beck 2006 Waste Characterization Study 4/3/07
Table A Sample Distribution by Generator Type
Hauler Waimanalo
Gulch Landfill H-POWER Totals
Residential 19 25 44
Commercial 17 25 42
Convenience Center 14 0 14
Totals 50 50 100
Data collected during the field sampling and sorting activities was used to develop the composition of each facility and generator type. For each of the 50 material categories identified by the Refuse Division, the mean and 90% confidence interval was calculated. The material category definitions are provided as Appendix A. The mean is used to estimate the annual weight of each material category. A 90% confidence interval is the solid waste industry statistically accepted standard for calculating the variation in the amount of any specific material from sample to sample. A lower number represents less variation and greater homogeneity among samples.
The Refuse Division provided the amount of solid waste material received at H-POWER and the Landfill for Fiscal Year 2006, from July 1, 2005 to June 30, 2006. This information was then proportionately integrated with the composition profiles for each facility and generator type to estimate the corresponding annual quantities of each material category within the waste stream. Material categories are presented and defined in Appendix A.
Table B provides a summary of: 1) the actual amount of solid waste received at H-POWER and the Landfill in fiscal year 2006, 2) the amount of solid waste that was destined for H-POWER but was rerouted to the Landfill throughout the fiscal year due to full or partial facility closure, and 3) the calculated amount of solid waste representative of each composition type accounting for the rerouted materials. The methodology used to calculate the amount of rerouted waste from H-POWER to the Landfill throughout the fiscal year is presented as Appendix B.

EXECUTIVE SUMMARY
2006 Waste Characterization Study 4/3/07 R. W. Beck ES-3
Table B Annual Solid Waste Totals - 2006
Actual Waste Received (tons / %)
Amount of Rerouted Waste
(tons)
Waste Representative of Each Composition Type
(tons / %)
H-POWER 602,520 64.1% + 153,801 756,321 80.4% Waimanalo Gulch Landfill 337,667 35.9% - 153,801 183,866 19.6% Total Waste 940,187 100% 0 940,187 100%
The waste tonnages representative of each composition type will be used to calculate each specific material category amount. This is necessary so that the tonnage of rerouted material is not misrepresented as Landfill-type waste.
The amount of waste by generator type was also estimated for each solid waste facility based on the annual weight data provided by the Refuse Division. Table C presents the annual waste associated with each composition type by generator type.
Table C Annual Waste by Generator Type - 2006
Waste Representative of Each Composition Type (tons)
Generator Type H-POWER Waimanalo Gulch Landfill
Overall
Residential 371,649 40,367 412,016
Commercial 384,389 114,300 498,689
Convenience Center 283 29,199 29,482
Total Waste 756,321 183,866 940,187
As shown in the table, a majority of the residential waste is representative of H-POWER. The approximately 40,367 tons of residential waste which is disposed of at the Landfill represents bulky item collection. Commercial waste disposed of at the Landfill includes sludge and autofluff, as well as other non-combustible or bulky materials which are not desirable for energy recovery at H-POWER. Approximately 99% of the convenience center waste stream is disposed of at the Landfill because it is largely comprised of materials which are not suitable for curbside residential waste collection.
EXECUTIVE SUMMARY
ES-4 R. W. Beck 2006 Waste Characterization Study 4/3/07
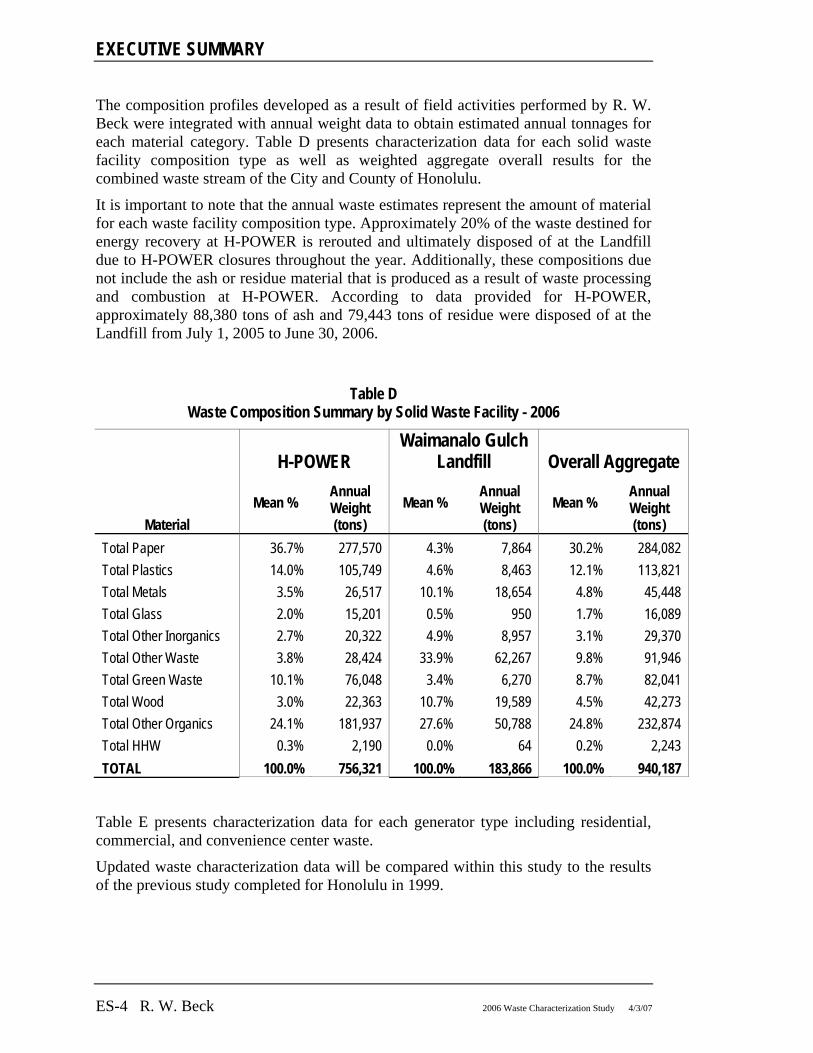
The composition profiles developed as a result of field activities performed by R. W. Beck were integrated with annual weight data to obtain estimated annual tonnages for each material category. Table D presents characterization data for each solid waste facility composition type as well as weighted aggregate overall results for the combined waste stream of the City and County of Honolulu.
It is important to note that the annual waste estimates represent the amount of material for each waste facility composition type. Approximately 20% of the waste destined for energy recovery at H-POWER is rerouted and ultimately disposed of at the Landfill due to H-POWER closures throughout the year. Additionally, these compositions due not include the ash or residue material that is produced as a result of waste processing and combustion at H-POWER. According to data provided for H-POWER, approximately 88,380 tons of ash and 79,443 tons of residue were disposed of at the Landfill from July 1, 2005 to June 30, 2006.
Table D Waste Composition Summary by Solid Waste Facility - 2006
H-POWER Waimanalo Gulch
Landfill Overall Aggregate
Material Mean %
Annual Weight (tons)
Mean % Annual Weight (tons)
Mean % Annual Weight (tons)
Total Paper 36.7% 277,570 4.3% 7,864 30.2% 284,082 Total Plastics 14.0% 105,749 4.6% 8,463 12.1% 113,821 Total Metals 3.5% 26,517 10.1% 18,654 4.8% 45,448 Total Glass 2.0% 15,201 0.5% 950 1.7% 16,089 Total Other Inorganics 2.7% 20,322 4.9% 8,957 3.1% 29,370 Total Other Waste 3.8% 28,424 33.9% 62,267 9.8% 91,946 Total Green Waste 10.1% 76,048 3.4% 6,270 8.7% 82,041 Total Wood 3.0% 22,363 10.7% 19,589 4.5% 42,273 Total Other Organics 24.1% 181,937 27.6% 50,788 24.8% 232,874 Total HHW 0.3% 2,190 0.0% 64 0.2% 2,243 TOTAL 100.0% 756,321 100.0% 183,866 100.0% 940,187
Table E presents characterization data for each generator type including residential, commercial, and convenience center waste.
Updated waste characterization data will be compared within this study to the results of the previous study completed for Honolulu in 1999.

EXECUTIVE SUMMARY
2006 Waste Characterization Study 4/3/07 R. W. Beck ES-5
Table E Waste Composition Summary by Generator Type - 2006
Residential Commercial Convenience
Center
Material Mean %
Annual Weight (tons)
Mean % Annual Weight (tons)
Mean % Annual Weight (tons)
Total Paper 31.9% 131,285 32.3% 161,257 5.2% 1,546 Total Plastics 11.6% 47,889 14.1% 70,372 5.7% 1,677 Total Metals 4.8% 19,977 3.3% 16,615 18.5% 5,462 Total Glass 2.0% 8,173 1.3% 6,572 0.8% 245 Total Other Inorganics 1.2% 4,984 1.7% 8,608 7.2% 2,124 Total Other Waste 4.6% 18,789 11.4% 56,991 21.6% 6,376 Total Green Waste 17.0% 69,913 2.4% 12,152 10.9% 3,201 Total Wood 4.8% 19,938 4.2% 21,011 24.6% 7,248 Total Other Organics 22.0% 90,721 28.6% 142,670 5.4% 1,604 Total HHW 0.1% 346 0.5% 2,441 0.0% 0 TOTAL 100.0% 412,016 100.0% 498,689 100.0% 29,482
Table F presents an estimate of the quantity of HI-5 bottles/containers by weight and number of containers. It is important to note that the HI-5 material estimates represent the amount of material for each waste facility composition type. A portion of the material within the H-POWER waste stream will be rerouted and disposed of at the Landfill due to H-POWER closure.
Table F HI-5 Recyclables Summary - 2006
Plastic (PET) Aluminum Glass
(tons) (No. of Containers) (tons)
(No. of Containers) (tons)
(No. of Containers)
H-POWER Total 2689 89,275,000 2548 152,880,000 3756 18,029,000 Waimanalo Gulch Landfill Total 166 5,511,000 90 5,400,000 413 1,982,000 Overall Total 2843 94,388,000 2626 157,560,000 4158 19,958,000


2006 Waste Characterization Study 4/3/07
Section 1 Introduction and Overview
1.1 Project Background The City and County of Honolulu, Department of Environmental Services, Refuse Division (Refuse Division) has retained R. W. Beck, Inc. to complete an update of its Integrated Solid Waste Management Plan (ISWMP). An updated waste characterization was necessary to obtain detailed statistical information for use in developing the various program components of the ISWMP. This report has been prepared to present the results of the 2006 Waste Characterization Study.
A previous Waste Composition Study was completed in May 1999 by R.M. Towill Corporation and Cascadia Consulting Group. Because of evolving solid waste management policies and programs and potential changes in the solid waste stream, it is common for municipalities to complete waste characterization studies every 5-6 years. The 2006 Waste Characterization Study will provide updated data to facilitate development of the updated ISWMP and assist the Refuse Division with future solid waste management decisions and improvements. This report has been prepared to present the results of the 2006 Waste Characterization Study.
1.2 Purpose/Objectives The purpose of this 2006 Waste Characterization Study is to provide an estimate of the composition and quantities of solid waste material currently generated and disposed of on the island of O‘ahu. Waste stream compositions for the energy recovery facility, H-POWER, and Waimanalo Gulch Landfill will be characterized and presented as part of this report. Additionally, compositions will be developed for each generator type.
The Refuse Division has identified several objectives for an updated waste characterization. The data obtained in this Study will be used to evaluate the current solid waste management system and assess the effectiveness of previously implemented policies and programs. In addition, the results will be used to compare alternative collection and disposal strategies while identifying potential improvements to current recycling programs. The types and quantities of specific materials within the various waste streams directly affect the environmental and economic impacts of these considerations.

SECTION 1
1-2 R. W. Beck 2006 Waste Characterization Study 4/3/07
1.3 Existing Conditions Most all of the residential solid waste generated within the City and County of Honolulu is collected by the Refuse Division. A limited amount of waste is also collected by the Refuse Division from multi-family households and small commercial businesses. Automatic and manually loaded refuse trucks are used to serve each of the seven districts: Honolulu, Ewa, Koolaupoko, Wahiawa, Waianae, Waialua, and Koolauloa. Private haulers compete to provide collection services for other generators such as commercial and industrial facilities, military bases, and some multi-family dwellings, such as condominiums.
The Refuse Division operates three solid waste transfer stations in Kapaa, Keehi, and Kawailoa. These transfer stations serve to consolidate waste from refuse collection trucks into large transfer trailers for more efficient and economical transport to H-POWER or the landfill disposal facility. At least one additional private transfer station is operated by Honolulu Disposal Service.
The Refuse Division also operates six convenience centers throughout the County where residents can drop off up to two loads of waste material per day. There are convenience centers located in Waimanalo, Ewa, Waipahu, Wahiawa, Waianae, and Laie. Only residential waste is accepted at the convenience centers. Refuse is separated in order for it to be delivered to the appropriate disposal site:
• Burnable refuse belongs in the "Combustible" bin, which is sent on to the H-POWER waste-to-energy plant.
• Non-burnable refuse goes into the "Noncombustible" bin, which is disposed at the landfill.
• Yard waste goes into the "Green Waste" bin, which is delivered to mulching and composting operator.
• Large appliances, tires and auto batteries are put off to the side for separate collection and delivery to recycling facilities.
All municipal solid waste generated on O‘ahu, except hazardous wastes and construction and demolition materials, is currently transported to the waste-to-energy facility, H-POWER, or the Waimanalo Gulch Landfill. From July 1, 2005 to June 30, 2006, there were a total of approximately 940,200 tons of solid waste disposed on the island, with H-POWER receiving 602,500 tons, or 64% by weight, for energy recovery. Construction and demolition materials and other specific materials are collected and disposed of separately within the private PVT Landfill located in Nanakuli.
H-POWER (an acronym for Honolulu Program of Waste Energy Recovery) is located in Campbell Industrial Park, and is a waste-to-energy facility operated by Covanta Energy since 1990. H-POWER uses combustion technology to convert combustible solid waste material into energy for the City and reduce the volume of solid waste by approximately 90%. The ash waste that is produced by the combustion process is transferred for disposal to an ash monofill area at the Waimanalo Gulch Landfill.

Introduction and Overview
2006 Waste Characterization Study 4/3/07 R. W. Beck 1-3
From July 1, 2005 to June 30, 2006, H-POWER received an average of 2,160 tons of waste each day. This waste was used to generate enough electricity to power approximately 60,000 homes on the island. H-POWER uses magnetic recovery of ferrous metals from the waste stream and eddy current separators extract non-ferrous metals from the ash. Approximately 18,600 tons of ferrous metals (i.e. tin cans) and 2,100 tons of non-ferrous metals (i.e. aluminum) were recycled last year from H-POWER according to information provided by facility staff.
Noncombustible and bulky waste materials are collected separately and landfilled at the Waimanalo Gulch Landfill. Last year, approximately 337,700 tons of solid waste material was disposed of at the Landfill. Although a majority of the waste disposed of at the Landfill is unsuitable for combustion, a portion is actually destined for H-POWER but is rerouted to the Landfill due to either H-POWER equipment maintenance or capacity limitations. Bulky item pickup is free for City and County residences and includes furniture, appliances, and mattresses. These materials are disposed at the Landfill and are quantified in Section 2 of this report.


2006 Waste Characterization Study 4/3/07
Section 2 Methodology
The purpose of this study was to estimate the quantities and types of solid waste material that are being collected throughout the City and County of Honolulu and used for energy recovery or disposed at the Landfill. The 2006 Waste Characterization Study was designed to develop solid waste compositions for the H-POWER waste-to-energy facility, Waimanalo Gulch Landfill, and combined. Additionally, the Refuse Division identified the need for composition profiles of each generator type.
Prior to engaging in any field work, it was important for R. W. Beck to understand the current solid waste management system of the City and County of Honolulu. Discussions with Refuse Division staff quickly concluded that typical waste streams of H-POWER and Waimanalo Gulch Landfill, are very different. R. W. Beck, Inc. prepared a Field Sampling Plan that was designed to develop statistically accurate methods for collecting, sorting, and analyzing samples from each of the two facilities. This sampling would provide the foundation for the waste characterization results. The Field Sampling Plan was submitted to the Refuse Division prior to performing any field activities and was approved prior to undertaking the field work. This section will provide a detailed description of the sampling, sorting, and data analysis methodology that was used by R. W. Beck, Inc.
2.1 Sampling Methodology R. W. Beck, Inc. determined that the preferred approach for obtaining accurate characterization data while minimizing impacts to daily collection and operations would be to perform the field sampling and sorting activities at H-POWER and Waimanalo Gulch Landfill. However as identified in the Field Sampling Plan, a significant portion of the waste received at H-POWER originates from the transfer stations and arrives in transfer trailers. These loads are often considerably compacted and sorting the material is often difficult. As a result, the sorting time is longer and the data can be less useful. Therefore, we coordinated with the Refuse Division to collect and sort a number of samples at the Keehi Transfer Station. These samples were collected from refuse trucks before the waste was loaded into the transfer trailers. All of this material was eventually used for energy recovery at H-POWER and so the data obtained from transfer station sampling was integrated with the H-POWER field sampling.
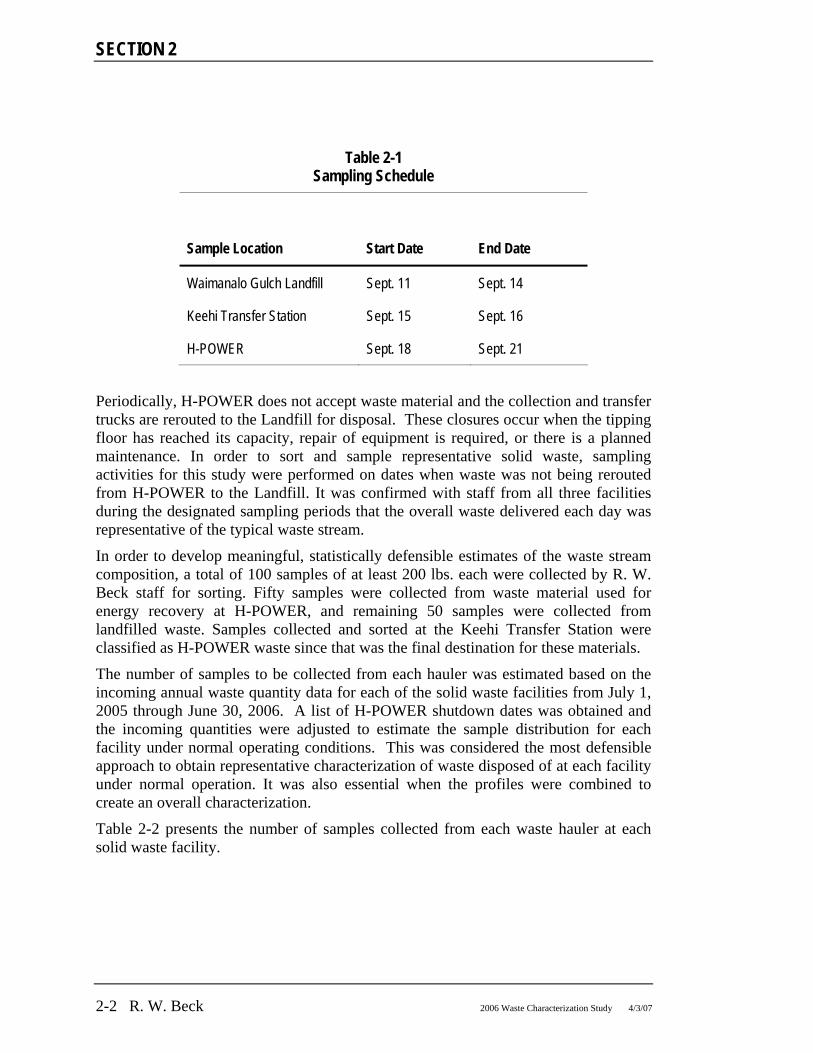
Field activities including sample collection and sorting were completed by R. W. Beck between the dates of September 11, 2006 to September 21, 2006. The dates for which sampling/sorting activities were completed at each facility are presented in Table 2-1 below.
SECTION 2
2-2 R. W. Beck 2006 Waste Characterization Study 4/3/07
Table 2-1 Sampling Schedule
Sample Location Start Date End Date
Waimanalo Gulch Landfill Sept. 11 Sept. 14
Keehi Transfer Station Sept. 15 Sept. 16
H-POWER Sept. 18 Sept. 21
Periodically, H-POWER does not accept waste material and the collection and transfer trucks are rerouted to the Landfill for disposal. These closures occur when the tipping floor has reached its capacity, repair of equipment is required, or there is a planned maintenance. In order to sort and sample representative solid waste, sampling activities for this study were performed on dates when waste was not being rerouted from H-POWER to the Landfill. It was confirmed with staff from all three facilities during the designated sampling periods that the overall waste delivered each day was representative of the typical waste stream.
In order to develop meaningful, statistically defensible estimates of the waste stream composition, a total of 100 samples of at least 200 lbs. each were collected by R. W. Beck staff for sorting. Fifty samples were collected from waste material used for energy recovery at H-POWER, and remaining 50 samples were collected from landfilled waste. Samples collected and sorted at the Keehi Transfer Station were classified as H-POWER waste since that was the final destination for these materials.
The number of samples to be collected from each hauler was estimated based on the incoming annual waste quantity data for each of the solid waste facilities from July 1, 2005 through June 30, 2006. A list of H-POWER shutdown dates was obtained and the incoming quantities were adjusted to estimate the sample distribution for each facility under normal operating conditions. This was considered the most defensible approach to obtain representative characterization of waste disposed of at each facility under normal operation. It was also essential when the profiles were combined to create an overall characterization.
Table 2-2 presents the number of samples collected from each waste hauler at each solid waste facility.

Methodology
2006 Waste Characterization Study 4/3/07 R. W. Beck 2-3
Table 2-2 Sample Distribution by Hauler
Hauler Waimanalo
Gulch Landfill
Keehi Transfer Station H-POWER Totals
ENV-Refuse Division 19 14 11 44
Convenience Center 14 -- 0 14
Honolulu Disposal Service 0 -- 16 16
Hawaii Metal Recycling 0 -- 0 0
Rolloffs Hawaii 7 -- 5 12
Other Commercial Haulers* 6 -- 4 10
Self-Hauls 4 -- 0 4
Totals 50 14 36 100 * - Includes Aloha Waste Services, Island Recycling, KNG Group, NCNS, and Perry Management
The sampling procedure took place in the following manner:
1. A randomly selected truck was identified by the field supervisor for sampling. This approach is often referred to as the “Nth truck” method, and was chosen to obtain unbiased results by providing a representative distribution of truck types and collection locations.
2. The R.W. Beck field supervisor interviewed the selected haulers prior to sampling their waste loads to determine the hauler name, vehicle type, waste origin, waste type (i.e. residential, industrial/commercial/institutional, military, or mixed), and final solid waste location (i.e. Landfill or H-POWER).
3. For each truck to be sampled, the R.W. Beck field supervisor asked the front-end loader operator to take a “grab” sample of waste material dumped from the selected truck and transfer the sample to a pre-designated sorting area. Samples were collected from various portions of the waste piles to reduce redundancy and achieve statistically representative results.
4. The sort team collected a minimum of 200 pounds from a randomly selected portion of the waste pile from each sampled load.
Sampling was completed using widely-accepted solid waste characterization methods and previous industry experience to maintain accuracy and reliability.

SECTION 2
2-4 R. W. Beck 2006 Waste Characterization Study 4/3/07
2.2 Sorting Activities
Waste material within each sample was manually sorted by the sort team into predetermined categories that were recommended by the Refuse Division. Definitions for the material categories are presented as Appendix A. These categories include those evaluated during the 1999 Waste Composition Study and add a few additional.
The sorting procedure of waste samples generally took place in the following manner:
1. The material within each sample was placed onto a table for efficiency and safety of the sort team.
2. All of the waste material within each sample was physically sorted by our trained crew (4 staff) into containers specifically designated for each predetermined category.
3. After all of the material within a sample had been sorted, the project team weighed each container and recorded the data on specially designed forms.
4. The sort team sub-sorted the deposit and non-deposit containers for each sample and recorded the data separately. This data would be used later for determining the HI 5 results.
Each sorter was responsible for certain types of waste which did not change throughout the sorting period. This method is designed to reduce the potential for error and increase sorting efficiency. Any unique characteristics of the sample, such as significant moisture or hazardous materials, were noted on the data form. The data obtained from sorting provided a basis for characterizing each of the waste streams.
2.3 Data Analysis Waste characterization data analysis is typically comprised of two steps: 1) the development of composition profiles, and 2) the integration of annual weight data. This section describes the methodology used specifically for this study to complete the data analysis.
2.3.1 Composition Development Data collected during the field sampling and sorting activities was used to calculate a mean and a 90% confidence interval for each material category. The mean is used to estimate the annual weight of each material category. A 90% confidence interval is the solid waste industry statistically accepted standard for calculating the variation in the amount of any specific material from sample to sample. A narrower interval represents less variation and greater homogeneity among samples. The data analysis involved the following activities:
1. Gathered data from the sort was entered into the project waste composition statistical model designed specifically for analyzing waste composition data.

Methodology
2006 Waste Characterization Study 4/3/07 R. W. Beck 2-5
2. Representative samples for each facility and generator type (i.e. H-POWER, Residential, etc.) were defined and grouped together for analysis.
3. Sort results were calculated and depicted by the mean and the 90% confidence interval by weight for each material category.
Waste compositions were developed by solid waste facility location as well as by generator type. The overall composition results were calculated based on the weighted aggregate of the material for each facility.
Three generator types were identified and defined by the Refuse Division for waste stream characterization: Residential, Commercial, and Convenience Center. For the purposes of this study, all waste collected by the Refuse Division within its refuse trucks is classified as residential waste. Table 2-3 provides a summary of the generator types used for this study.
Table 2-3 Generator Type Definitions
Generator Type Hauler
Residential Refuse Division Refuse Trucks, including Bulky Item Collection Commercial Private Haulers serving Commercial, Industrial, and Military facilities,
Other City and County vehicles, various haulers from Eleemosynary facilities, and self-haul vehicles.
Convenience Center Refuse Division Roll-Off Trucks
Other City and County waste consists primarily of sludge generated by the City wastewater treatment plants but also includes waste from the Parks, Road Maintenance, Fire, Police, and other City departments. Eleemosynary facilities are non-profit organizations including schools and charities that are not charged for waste disposal. Self-haul waste is delivered to the solid waste facility in various types of vehicles.
During the waste-to-energy process at H-POWER, ash and residue are generated as by-products. It is important to note that although these materials are disposed of at the Landfill, they are not included in the composition profiles or the tonnages calculated in the subsequent section.
2.3.2 Solid Waste Weight Calculations This section provides a description of the weight calculations performed in order to accurately integrate the composition data. For each composition profile, an estimated annual weight will be provided for all of the specific material categories (i.e. Deposit PET bottles/containers). The Refuse Division will be able to use this information for future programs and policy decisions with the goal of improving solid waste management for Honolulu.
SECTION 2
2-6 R. W. Beck 2006 Waste Characterization Study 4/3/07
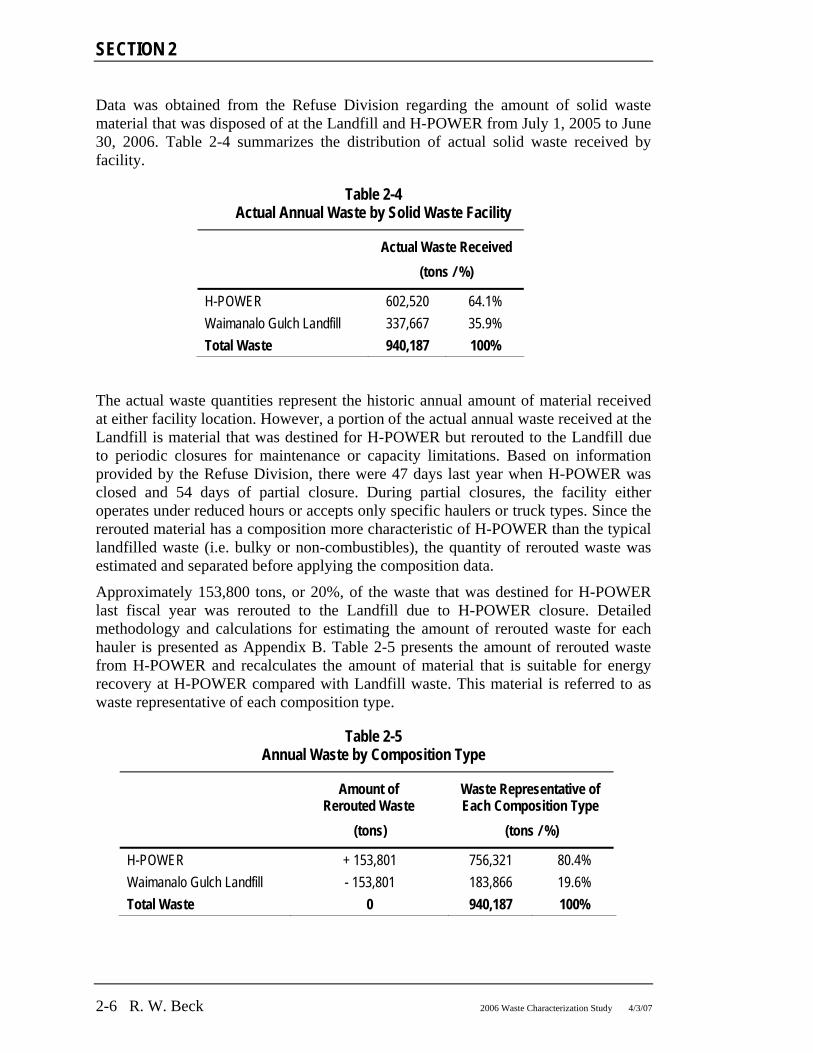
Data was obtained from the Refuse Division regarding the amount of solid waste material that was disposed of at the Landfill and H-POWER from July 1, 2005 to June 30, 2006. Table 2-4 summarizes the distribution of actual solid waste received by facility.
Table 2-4 Actual Annual Waste by Solid Waste Facility
Actual Waste Received (tons / %)
H-POWER 602,520 64.1% Waimanalo Gulch Landfill 337,667 35.9% Total Waste 940,187 100%
The actual waste quantities represent the historic annual amount of material received at either facility location. However, a portion of the actual annual waste received at the Landfill is material that was destined for H-POWER but rerouted to the Landfill due to periodic closures for maintenance or capacity limitations. Based on information provided by the Refuse Division, there were 47 days last year when H-POWER was closed and 54 days of partial closure. During partial closures, the facility either operates under reduced hours or accepts only specific haulers or truck types. Since the rerouted material has a composition more characteristic of H-POWER than the typical landfilled waste (i.e. bulky or non-combustibles), the quantity of rerouted waste was estimated and separated before applying the composition data.
Approximately 153,800 tons, or 20%, of the waste that was destined for H-POWER last fiscal year was rerouted to the Landfill due to H-POWER closure. Detailed methodology and calculations for estimating the amount of rerouted waste for each hauler is presented as Appendix B. Table 2-5 presents the amount of rerouted waste from H-POWER and recalculates the amount of material that is suitable for energy recovery at H-POWER compared with Landfill waste. This material is referred to as waste representative of each composition type.
Table 2-5 Annual Waste by Composition Type
Amount of Rerouted Waste
(tons)
Waste Representative of Each Composition Type
(tons / %)
H-POWER + 153,801 756,321 80.4% Waimanalo Gulch Landfill - 153,801 183,866 19.6% Total Waste 0 940,187 100%

Methodology
2006 Waste Characterization Study 4/3/07 R. W. Beck 2-7
The waste tonnages by composition type will be used to calculate each specific material category amount. This is necessary so that the tonnage of rerouted material is not misrepresented as Landfill-type waste. For example, there is a significant amount of large, bulky furniture and non-combustible material such as sludge and autofluff within the Landfill waste stream. Multiplying the actual amount of waste disposed at the Landfill by the Landfill composition would overestimate the tonnage of this material.
The amount of waste by generator type was also estimated for each solid waste facility based on the annual weight data provided by the Refuse Division. Table 2-6 presents the annual waste representative of each composition type by generator type.
Table 2-6 Annual Waste by Generator Type
Waste Representative of Each Composition Type (tons)
Generator Type H-POWER Waimanalo Gulch Landfill
Overall
Residential 371,649 40,367 412,016
Commercial 384,389 114,300 498,689
Convenience Center 283 29,199 29,482
Total Waste 756,321 183,866 940,187

2006 Waste Characterization Study 4/3/07
Section 3 Results and Findings
3.1 General The purpose of this waste characterization study was to obtain current composition data for the distinctive waste streams of Waimanalo Gulch Landfill and H-POWER The compositions for each of the two solid waste facilities were combined based on the proportionate waste quantities to develop an overall aggregate composition.
The results are based on field work performed by R. W. Beck, Inc. from September 11 through September 21, 2006. The waste tonnages presented herein are based on detailed reports provided by the Refuse Division for all waste received from July 1, 2005 through June 30, 2006.
Data obtained during sampling and sorting activities was also classified by generator type and used to prepare composition profiles for residential, commercial, and convenience center waste streams. These results can be used to obtain a more detailed summary of the various waste streams.
3.2 H-POWER Results A majority of the solid waste generated on O‘ahu is used for fuel at the H-POWER waste-to-energy facility. Although approximately 602,520 tons of waste were received at H-POWER last year, there were an estimated 756,321 tons of waste with the same composition initially destined for the facility. Approximately 153,800 tons of H-POWER destined was rerouted to the Landfill because of closure due to maintenance or capacity limitations.
Approximately 49% of the H-POWER material is residential waste with the remaining 51% consisting of commercial waste as defined in this study. There is a small amount of convenience center waste received at H-POWER.
During the processing of waste at H-POWER prior to combustion, a significant amount of residue material is removed from the waste stream. The residue is not desirable for combustion and consists of an indeterminate mixture of fines typically smaller than 3 inches, including dirt, paper, plastic, mixed cullet, organics, etc. The material is periodically loaded onto transfer trailers, weighed at H-POWER, and transported to the Landfill for disposal. Based on data obtained from H-POWER, approximately 79,443 tons of residue was disposed of at the Landfill from July 1, 2005 to June 30, 2006.
Ash is a by-product of the combustion process. The ash is also periodically loaded onto transfer trailers and transported to the Landfill. However this material is disposed

SECTION 3
3-2 R. W. Beck 2006 Waste Characterization Study 4/3/07
of in an ash monofill area of the landfill. Approximately 88,380 tons of ash were transported from H-POWER to the Landfill last year.
Figure 3-1 presents a summary of the waste composition results based on September 2006 sampling at H-POWER and the Keehi Transfer Station. R. W. Beck sorted a total of 50 samples to develop the H-POWER composition.
Figure 3-1 H-Power Waste Composition Summary - 2006
Total Plastics, 14.0%
Total Paper, 36.7%Total Other
Organics, 24.1%
Total Wood, 3.0%
Total Glass, 2.0%Total Other
Inorganics, 2.7%Total Metals, 3.5%
Total Other Waste, 3.8%
Total Green Waste, 10.1%
Total HHW, 0.3%
The largest portion of the waste stream consists of the materials listed below:
• Total Paper (36.7%)
• Total Other Organics (24.1%)
• Total Plastics (14.0%)
• Total Green Waste (10.1%)
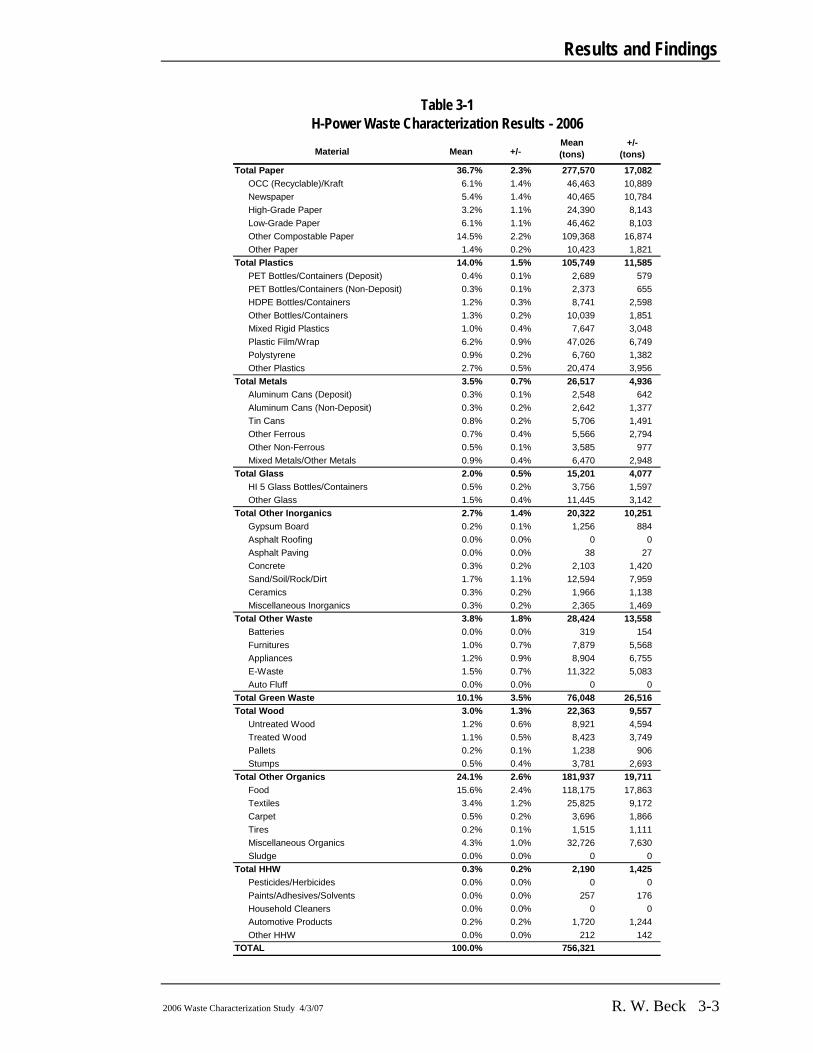
Table 3-1 presents detailed waste characterization results for the H-POWER material composition. For each material category shown, the mean and 90% confidence interval is presented along with the corresponding estimated annual tonnages. The weight data represents the total amount of waste with H-POWER composition. However as previously mentioned, approximately 20% of the materials listed are rerouted to the Landfill due to facility closure for equipment maintenance or capacity limitations.
Results and Findings
2006 Waste Characterization Study 4/3/07 R. W. Beck 3-3
Material Mean +/-Mean (tons)
+/- (tons)
Total Paper 36.7% 2.3% 277,570 17,082OCC (Recyclable)/Kraft 6.1% 1.4% 46,463 10,889Newspaper 5.4% 1.4% 40,465 10,784High-Grade Paper 3.2% 1.1% 24,390 8,143Low-Grade Paper 6.1% 1.1% 46,462 8,103Other Compostable Paper 14.5% 2.2% 109,368 16,874Other Paper 1.4% 0.2% 10,423 1,821
Total Plastics 14.0% 1.5% 105,749 11,585PET Bottles/Containers (Deposit) 0.4% 0.1% 2,689 579PET Bottles/Containers (Non-Deposit) 0.3% 0.1% 2,373 655HDPE Bottles/Containers 1.2% 0.3% 8,741 2,598Other Bottles/Containers 1.3% 0.2% 10,039 1,851Mixed Rigid Plastics 1.0% 0.4% 7,647 3,048Plastic Film/Wrap 6.2% 0.9% 47,026 6,749Polystyrene 0.9% 0.2% 6,760 1,382Other Plastics 2.7% 0.5% 20,474 3,956
Total Metals 3.5% 0.7% 26,517 4,936Aluminum Cans (Deposit) 0.3% 0.1% 2,548 642Aluminum Cans (Non-Deposit) 0.3% 0.2% 2,642 1,377Tin Cans 0.8% 0.2% 5,706 1,491Other Ferrous 0.7% 0.4% 5,566 2,794Other Non-Ferrous 0.5% 0.1% 3,585 977Mixed Metals/Other Metals 0.9% 0.4% 6,470 2,948
Total Glass 2.0% 0.5% 15,201 4,077HI 5 Glass Bottles/Containers 0.5% 0.2% 3,756 1,597Other Glass 1.5% 0.4% 11,445 3,142
Total Other Inorganics 2.7% 1.4% 20,322 10,251Gypsum Board 0.2% 0.1% 1,256 884Asphalt Roofing 0.0% 0.0% 0 0Asphalt Paving 0.0% 0.0% 38 27Concrete 0.3% 0.2% 2,103 1,420Sand/Soil/Rock/Dirt 1.7% 1.1% 12,594 7,959Ceramics 0.3% 0.2% 1,966 1,138Miscellaneous Inorganics 0.3% 0.2% 2,365 1,469
Total Other Waste 3.8% 1.8% 28,424 13,558Batteries 0.0% 0.0% 319 154Furnitures 1.0% 0.7% 7,879 5,568Appliances 1.2% 0.9% 8,904 6,755E-Waste 1.5% 0.7% 11,322 5,083Auto Fluff 0.0% 0.0% 0 0
Total Green Waste 10.1% 3.5% 76,048 26,516Total Wood 3.0% 1.3% 22,363 9,557
Untreated Wood 1.2% 0.6% 8,921 4,594Treated Wood 1.1% 0.5% 8,423 3,749Pallets 0.2% 0.1% 1,238 906Stumps 0.5% 0.4% 3,781 2,693
Total Other Organics 24.1% 2.6% 181,937 19,711Food 15.6% 2.4% 118,175 17,863Textiles 3.4% 1.2% 25,825 9,172Carpet 0.5% 0.2% 3,696 1,866Tires 0.2% 0.1% 1,515 1,111Miscellaneous Organics 4.3% 1.0% 32,726 7,630Sludge 0.0% 0.0% 0 0
Total HHW 0.3% 0.2% 2,190 1,425Pesticides/Herbicides 0.0% 0.0% 0 0Paints/Adhesives/Solvents 0.0% 0.0% 257 176Household Cleaners 0.0% 0.0% 0 0Automotive Products 0.2% 0.2% 1,720 1,244Other HHW 0.0% 0.0% 212 142
TOTAL 100.0% 756,321
Table 3-1H-Power Waste Characterization Results - 2006
SECTION 3
3-4 R. W. Beck 2006 Waste Characterization Study 4/3/07
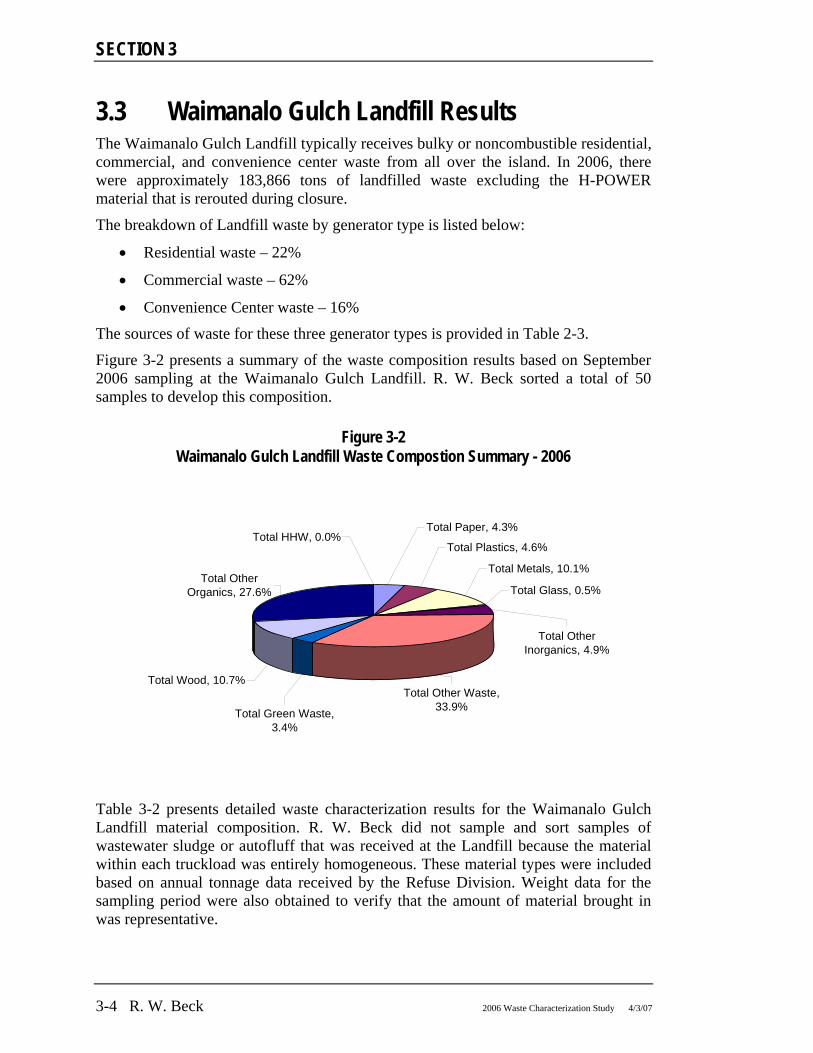
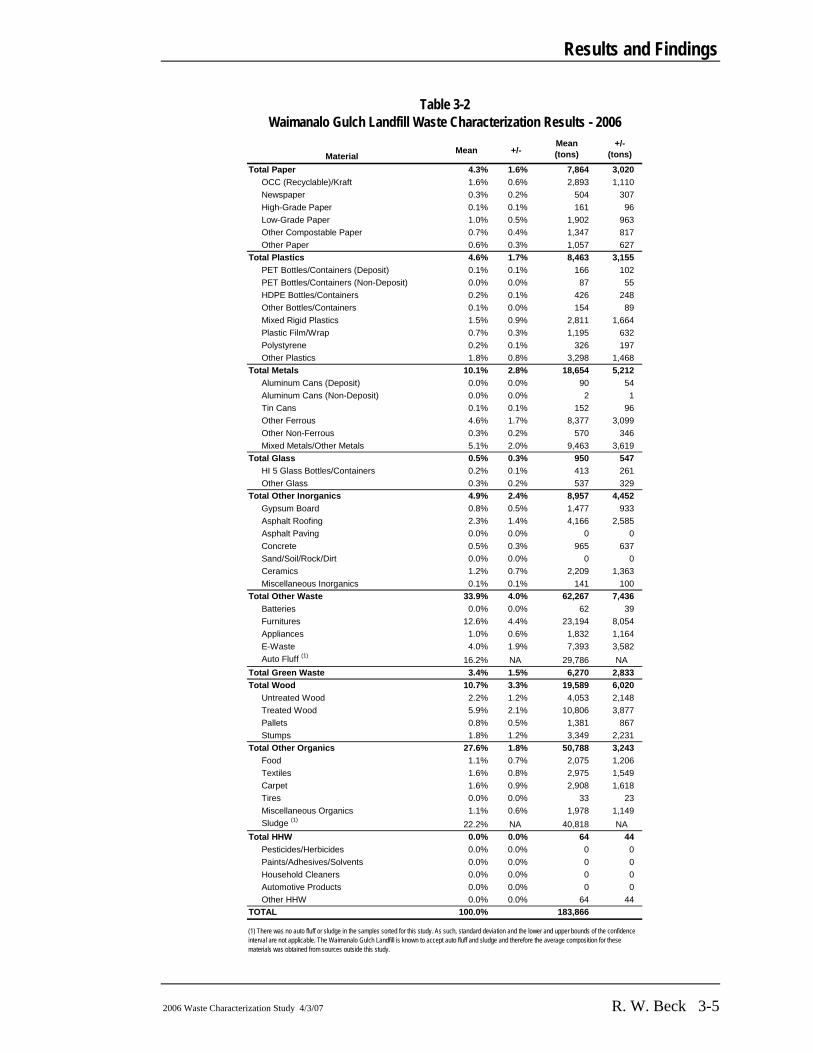
3.3 Waimanalo Gulch Landfill Results The Waimanalo Gulch Landfill typically receives bulky or noncombustible residential, commercial, and convenience center waste from all over the island. In 2006, there were approximately 183,866 tons of landfilled waste excluding the H-POWER material that is rerouted during closure.
The breakdown of Landfill waste by generator type is listed below:
• Residential waste – 22%
• Commercial waste – 62%
• Convenience Center waste – 16%
The sources of waste for these three generator types is provided in Table 2-3.
Figure 3-2 presents a summary of the waste composition results based on September 2006 sampling at the Waimanalo Gulch Landfill. R. W. Beck sorted a total of 50 samples to develop this composition.
Figure 3-2 Waimanalo Gulch Landfill Waste Compostion Summary - 2006
Total Other Waste, 33.9%
Total Wood, 10.7%
Total Other Organics, 27.6%
Total Green Waste, 3.4%
Total HHW, 0.0%Total Paper, 4.3%
Total Plastics, 4.6%
Total Metals, 10.1%
Total Other Inorganics, 4.9%
Total Glass, 0.5%
Table 3-2 presents detailed waste characterization results for the Waimanalo Gulch Landfill material composition. R. W. Beck did not sample and sort samples of wastewater sludge or autofluff that was received at the Landfill because the material within each truckload was entirely homogeneous. These material types were included based on annual tonnage data received by the Refuse Division. Weight data for the sampling period were also obtained to verify that the amount of material brought in was representative.
Results and Findings
2006 Waste Characterization Study 4/3/07 R. W. Beck 3-5
Material Mean +/-Mean (tons)
+/- (tons)
Total Paper 4.3% 1.6% 7,864 3,020OCC (Recyclable)/Kraft 1.6% 0.6% 2,893 1,110Newspaper 0.3% 0.2% 504 307High-Grade Paper 0.1% 0.1% 161 96Low-Grade Paper 1.0% 0.5% 1,902 963Other Compostable Paper 0.7% 0.4% 1,347 817Other Paper 0.6% 0.3% 1,057 627
Total Plastics 4.6% 1.7% 8,463 3,155PET Bottles/Containers (Deposit) 0.1% 0.1% 166 102PET Bottles/Containers (Non-Deposit) 0.0% 0.0% 87 55HDPE Bottles/Containers 0.2% 0.1% 426 248Other Bottles/Containers 0.1% 0.0% 154 89Mixed Rigid Plastics 1.5% 0.9% 2,811 1,664Plastic Film/Wrap 0.7% 0.3% 1,195 632Polystyrene 0.2% 0.1% 326 197Other Plastics 1.8% 0.8% 3,298 1,468
Total Metals 10.1% 2.8% 18,654 5,212Aluminum Cans (Deposit) 0.0% 0.0% 90 54Aluminum Cans (Non-Deposit) 0.0% 0.0% 2 1Tin Cans 0.1% 0.1% 152 96Other Ferrous 4.6% 1.7% 8,377 3,099Other Non-Ferrous 0.3% 0.2% 570 346Mixed Metals/Other Metals 5.1% 2.0% 9,463 3,619
Total Glass 0.5% 0.3% 950 547HI 5 Glass Bottles/Containers 0.2% 0.1% 413 261Other Glass 0.3% 0.2% 537 329
Total Other Inorganics 4.9% 2.4% 8,957 4,452Gypsum Board 0.8% 0.5% 1,477 933Asphalt Roofing 2.3% 1.4% 4,166 2,585Asphalt Paving 0.0% 0.0% 0 0Concrete 0.5% 0.3% 965 637Sand/Soil/Rock/Dirt 0.0% 0.0% 0 0Ceramics 1.2% 0.7% 2,209 1,363Miscellaneous Inorganics 0.1% 0.1% 141 100
Total Other Waste 33.9% 4.0% 62,267 7,436Batteries 0.0% 0.0% 62 39Furnitures 12.6% 4.4% 23,194 8,054Appliances 1.0% 0.6% 1,832 1,164E-Waste 4.0% 1.9% 7,393 3,582Auto Fluff (1) 16.2% NA 29,786 NA
Total Green Waste 3.4% 1.5% 6,270 2,833Total Wood 10.7% 3.3% 19,589 6,020
Untreated Wood 2.2% 1.2% 4,053 2,148Treated Wood 5.9% 2.1% 10,806 3,877Pallets 0.8% 0.5% 1,381 867Stumps 1.8% 1.2% 3,349 2,231
Total Other Organics 27.6% 1.8% 50,788 3,243Food 1.1% 0.7% 2,075 1,206Textiles 1.6% 0.8% 2,975 1,549Carpet 1.6% 0.9% 2,908 1,618Tires 0.0% 0.0% 33 23Miscellaneous Organics 1.1% 0.6% 1,978 1,149Sludge (1) 22.2% NA 40,818 NA
Total HHW 0.0% 0.0% 64 44Pesticides/Herbicides 0.0% 0.0% 0 0Paints/Adhesives/Solvents 0.0% 0.0% 0 0Household Cleaners 0.0% 0.0% 0 0Automotive Products 0.0% 0.0% 0 0Other HHW 0.0% 0.0% 64 44
TOTAL 100.0% 183,866
Table 3-2Waimanalo Gulch Landfill Waste Characterization Results - 2006
(1) There was no auto fluff or sludge in the samples sorted for this study. As such, standard deviation and the lower and upper bounds of the confidence interval are not applicable. The Waimanalo Gulch Landfill is known to accept auto fluff and sludge and therefore the average composition for these materials was obtained from sources outside this study.
SECTION 3
3-6 R. W. Beck 2006 Waste Characterization Study 4/3/07
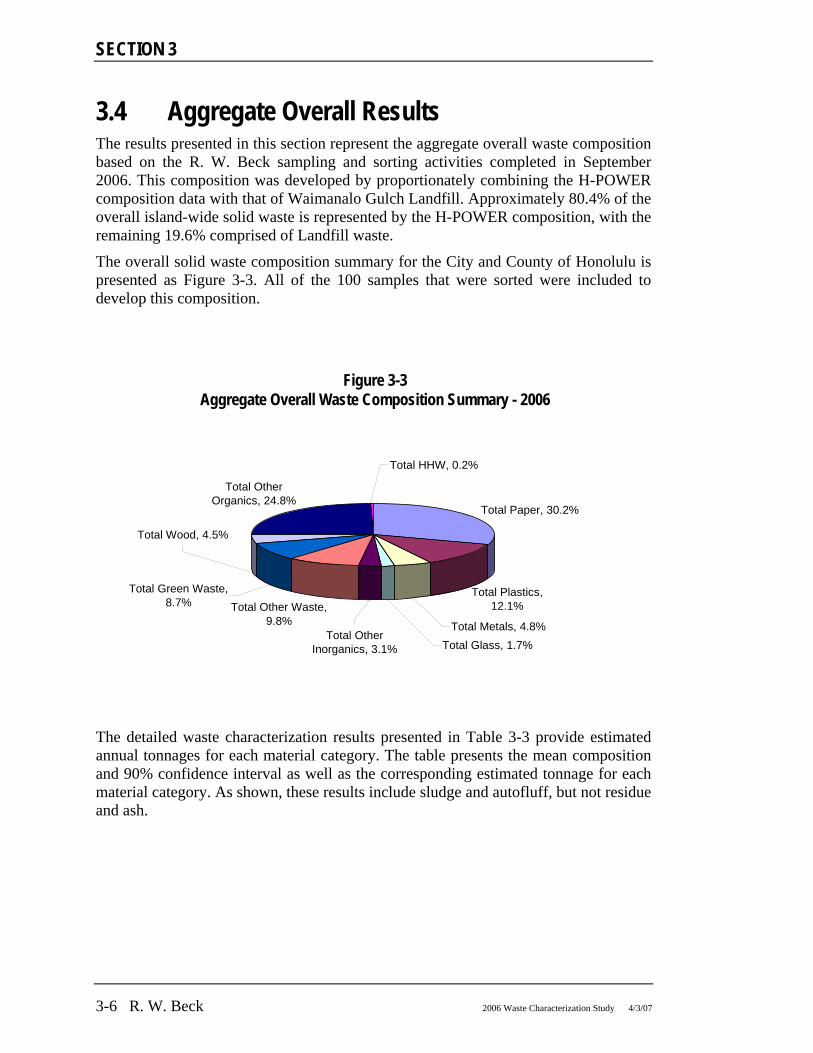
3.4 Aggregate Overall Results The results presented in this section represent the aggregate overall waste composition based on the R. W. Beck sampling and sorting activities completed in September 2006. This composition was developed by proportionately combining the H-POWER composition data with that of Waimanalo Gulch Landfill. Approximately 80.4% of the overall island-wide solid waste is represented by the H-POWER composition, with the remaining 19.6% comprised of Landfill waste.
The overall solid waste composition summary for the City and County of Honolulu is presented as Figure 3-3. All of the 100 samples that were sorted were included to develop this composition.
Figure 3-3 Aggregate Overall Waste Composition Summary - 2006
Total Other Waste, 9.8%
Total Plastics, 12.1%
Total Paper, 30.2%
Total HHW, 0.2%
Total Other Organics, 24.8%
Total Green Waste, 8.7%
Total Wood, 4.5%
Total Metals, 4.8%Total Glass, 1.7%
Total Other Inorganics, 3.1%
The detailed waste characterization results presented in Table 3-3 provide estimated annual tonnages for each material category. The table presents the mean composition and 90% confidence interval as well as the corresponding estimated tonnage for each material category. As shown, these results include sludge and autofluff, but not residue and ash.

Results and Findings
2006 Waste Characterization Study 4/3/07 R. W. Beck 3-7
Material Mean +/-Mean (tons)
+/- (tons)
Total Paper 30.2% 1.8% 284,082 17,040OCC (Recyclable)/Kraft 5.2% 1.1% 49,166 10,747Newspaper 4.3% 1.1% 40,757 10,589High-Grade Paper 2.6% 0.9% 24,420 7,993Low-Grade Paper 5.1% 0.9% 48,151 8,012Other Compostable Paper 11.7% 1.8% 110,142 16,582Other Paper 1.2% 0.2% 11,446 1,896
Total Plastics 12.1% 1.3% 113,821 11,808PET Bottles/Containers (Deposit) 0.3% 0.1% 2,843 578PET Bottles/Containers (Non-Deposit) 0.3% 0.1% 2,449 646HDPE Bottles/Containers 1.0% 0.3% 9,128 2,562Other Bottles/Containers 1.1% 0.2% 10,142 1,818Mixed Rigid Plastics 1.1% 0.4% 10,479 3,431Plastic Film/Wrap 5.1% 0.7% 47,989 6,654Polystyrene 0.8% 0.1% 7,056 1,371Other Plastics 2.5% 0.4% 23,734 4,156
Total Metals 4.8% 0.8% 45,448 7,151Aluminum Cans (Deposit) 0.3% 0.1% 2,626 632Aluminum Cans (Non-Deposit) 0.3% 0.1% 2,630 1,351Tin Cans 0.6% 0.2% 5,830 1,467Other Ferrous 1.5% 0.4% 14,103 4,160Other Non-Ferrous 0.4% 0.1% 4,148 1,020Mixed Metals/Other Metals 1.7% 0.5% 16,111 4,660
Total Glass 1.7% 0.4% 16,089 4,039HI 5 Glass Bottles/Containers 0.4% 0.2% 4,158 1,589Other Glass 1.3% 0.3% 11,930 3,102
Total Other Inorganics 3.1% 1.2% 29,370 11,020Gypsum Board 0.3% 0.1% 2,760 1,280Asphalt Roofing 0.5% 0.3% 4,261 2,609Asphalt Paving 0.0% 0.0% 38 27Concrete 0.3% 0.2% 3,078 1,535Sand/Soil/Rock/Dirt 1.3% 0.8% 12,525 7,811Ceramics 0.4% 0.2% 4,214 1,772Miscellaneous Inorganics 0.3% 0.2% 2,496 1,445
Total Other Waste 9.8% 1.6% 91,946 15,278Batteries 0.0% 0.0% 381 156Furnitures 3.4% 1.0% 31,555 9,795Appliances 1.1% 0.7% 10,728 6,734E-Waste 2.0% 0.7% 18,820 6,161Auto Fluff (1) 3.2% NA 30,462 NA
Total Green Waste 8.7% 2.8% 82,041 26,182Total Wood 4.5% 2.3% 42,273 21,884
Untreated Wood 1.4% 0.5% 13,017 5,004Treated Wood 2.1% 0.6% 19,428 5,371Pallets 0.3% 0.1% 2,644 1,248Stumps 0.8% 0.4% 7,185 3,473
Total Other Organics 24.8% 2.1% 232,874 19,621Food 12.7% 1.9% 119,645 17,575Textiles 3.1% 1.0% 28,726 9,136Carpet 0.7% 0.3% 6,650 2,454Tires 0.2% 0.1% 1,540 1,090Miscellaneous Organics 3.7% 0.8% 34,569 7,578Sludge (1) 4.4% NA 41,744 NA
Total HHW 0.2% 0.1% 2,243 1,399Pesticides/Herbicides 0.0% 0.0% 0 0Paints/Adhesives/Solvents 0.0% 0.0% 256 172Household Cleaners 0.0% 0.0% 0 0Automotive Products 0.2% 0.1% 1,711 1,221Other HHW 0.0% 0.0% 277 147
TOTAL 100.0% 940,187
Table 3-3Aggregate Overall Waste Characterization Results - 2006
(1) There was no auto fluff or sludge in the samples sorted for this study. As such, standard deviation and the lower and upper bounds of the confidence interval are not applicable. The Waimanalo Gulch Landfill is known to accept auto fluff and sludge and therefore the average composition for these materials was obtained from sources outside this study.
SECTION 3
3-8 R. W. Beck 2006 Waste Characterization Study 4/3/07
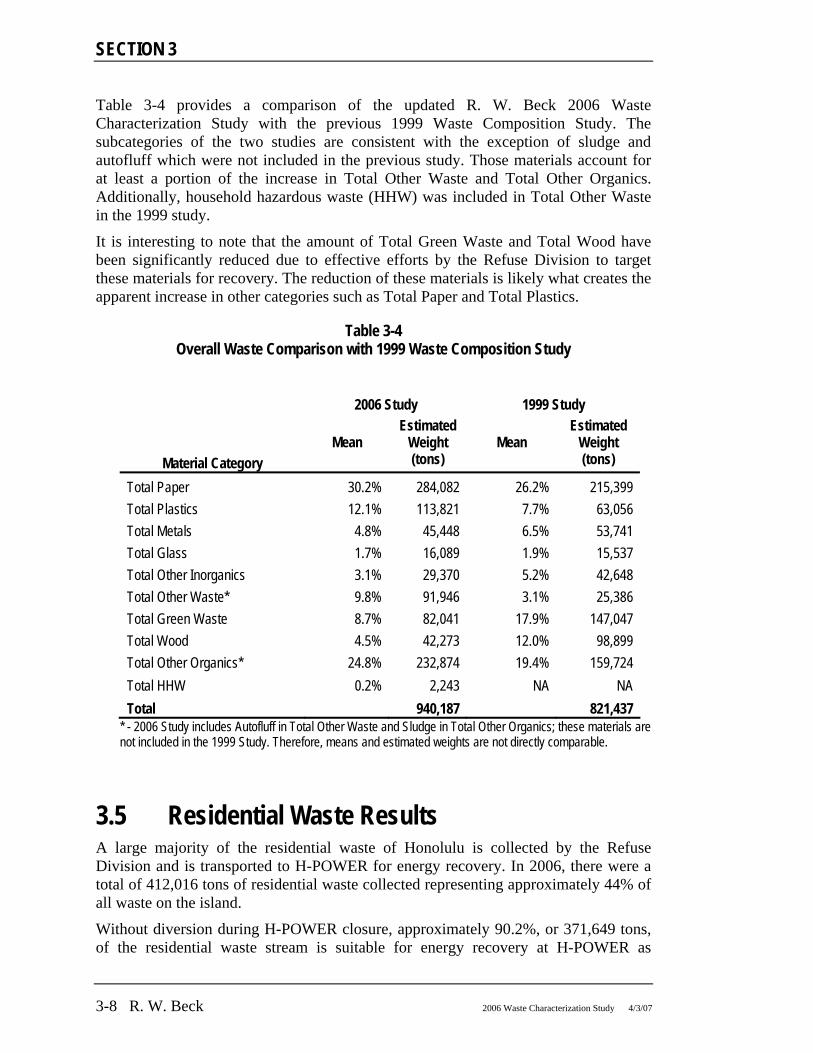
Table 3-4 provides a comparison of the updated R. W. Beck 2006 Waste Characterization Study with the previous 1999 Waste Composition Study. The subcategories of the two studies are consistent with the exception of sludge and autofluff which were not included in the previous study. Those materials account for at least a portion of the increase in Total Other Waste and Total Other Organics. Additionally, household hazardous waste (HHW) was included in Total Other Waste in the 1999 study.
It is interesting to note that the amount of Total Green Waste and Total Wood have been significantly reduced due to effective efforts by the Refuse Division to target these materials for recovery. The reduction of these materials is likely what creates the apparent increase in other categories such as Total Paper and Total Plastics.
Table 3-4 Overall Waste Comparison with 1999 Waste Composition Study
2006 Study 1999 Study
Material Category Mean
Estimated Weight (tons)
Mean Estimated
Weight (tons)
Total Paper 30.2% 284,082 26.2% 215,399 Total Plastics 12.1% 113,821 7.7% 63,056 Total Metals 4.8% 45,448 6.5% 53,741 Total Glass 1.7% 16,089 1.9% 15,537 Total Other Inorganics 3.1% 29,370 5.2% 42,648 Total Other Waste* 9.8% 91,946 3.1% 25,386 Total Green Waste 8.7% 82,041 17.9% 147,047 Total Wood 4.5% 42,273 12.0% 98,899 Total Other Organics* 24.8% 232,874 19.4% 159,724 Total HHW 0.2% 2,243 NA NA Total 940,187 821,437
* - 2006 Study includes Autofluff in Total Other Waste and Sludge in Total Other Organics; these materials are not included in the 1999 Study. Therefore, means and estimated weights are not directly comparable.
3.5 Residential Waste Results A large majority of the residential waste of Honolulu is collected by the Refuse Division and is transported to H-POWER for energy recovery. In 2006, there were a total of 412,016 tons of residential waste collected representing approximately 44% of all waste on the island.
Without diversion during H-POWER closure, approximately 90.2%, or 371,649 tons, of the residential waste stream is suitable for energy recovery at H-POWER as

Results and Findings
2006 Waste Characterization Study 4/3/07 R. W. Beck 3-9
presented earlier in Table 2-6. The remaining 40,367 tons of residential waste that is disposed of at the Landfill represents bulky item collection.
Figure 3-4 presents the summary of weighted aggregate residential waste from H-POWER and the Landfill. A total of 44 samples were evaluated to characterize the aggregate residential waste stream.
The four most predominant materials represent 82.5% of the entire residential waste stream: Paper, Other Organics, Green Waste, and Plastics.
Figure 3-4Aggregate Residential Waste Composition Summary - 2006
Total Metals, 4.8%Total Glass, 2.0%Total Other Waste ,
4.6% Total Other Inorganics, 1.2%
Total Green Waste, 17.0%
Total Wood, 4.8%
Total Other Organics, 22.0%
Total Plastics, 11.6%
Total Paper, 31.9%
Total HHW, 0.1%
Table 3-5 presents detailed waste characterization results for the residential waste stream of the City and County of Honolulu.

SECTION 3
3-10 R. W. Beck 2006 Waste Characterization Study 4/3/07
Material Mean +/-Mean (tons)
+/- (tons)
Total Paper 31.9% 2.4% 131,285 9,986OCC (Recyclable)/Kraft 6.1% 2.3% 25,048 9,327Newspaper 6.7% 2.0% 27,423 8,376High-Grade Paper 1.9% 0.8% 7,756 3,099Low-Grade Paper 6.1% 1.6% 25,031 6,677Other Compostable Paper 10.1% 2.4% 41,480 10,039Other Paper 1.1% 0.4% 4,546 1,513
Total Plastics 11.6% 2.1% 47,889 8,772PET Bottles/Containers (Deposit) 0.2% 0.1% 915 319PET Bottles/Containers (Non-Deposit) 0.3% 0.1% 1,423 504HDPE Bottles/Containers 0.8% 0.3% 3,350 1,314Other Bottles/Containers 0.9% 0.2% 3,717 857Mixed Rigid Plastics 1.3% 1.0% 5,503 4,190Plastic Film/Wrap 4.3% 1.1% 17,668 4,673Polystyrene 0.8% 0.2% 3,231 1,009Other Plastics 2.9% 0.9% 12,082 3,726
Total Metals 4.8% 1.2% 19,977 5,114Aluminum Cans (Deposit) 0.2% 0.1% 762 382Aluminum Cans (Non-Deposit) 0.3% 0.3% 1,113 1,142Tin Cans 0.8% 0.2% 3,141 913Other Ferrous 1.8% 0.9% 7,275 3,719Other Non-Ferrous 0.4% 0.1% 1,543 605Mixed Metals/Other Metals 1.5% 0.7% 6,142 2,866
Total Glass 2.0% 0.8% 8,173 3,478HI 5 Glass Bottles/Containers 0.6% 0.4% 2,289 1,472Other Glass 1.4% 0.7% 5,884 2,789
Total Other Inorganics 1.2% 0.7% 4,984 3,088Gypsum Board 0.0% 0.0% 75 68Asphalt Roofing 0.4% 0.4% 1,494 1,609Asphalt Paving 0.0% 0.0% 0 0Concrete 0.0% 0.0% 53 59Sand/Soil/Rock/Dirt 0.5% 0.5% 1,941 2,040Ceramics 0.3% 0.2% 1,160 886Miscellaneous Inorganics 0.1% 0.1% 261 324
Total Other Waste 4.6% 1.8% 18,789 7,367Batteries 0.0% 0.0% 91 72Furnitures 2.4% 1.1% 9,975 4,737Appliances 0.4% 0.3% 1,527 1,309E-Waste 1.7% 1.1% 7,195 4,404Auto Fluff 0.0% NA 0 NA
Total Green Waste 17.0% 7.0% 69,913 28,821Total Wood 4.8% 2.7% 19,938 11,246
Untreated Wood 0.7% 0.5% 2,765 1,868Treated Wood 2.3% 1.4% 9,507 5,619Pallets 0.0% 0.0% 0 0Stumps 1.9% 1.8% 7,665 7,320
Total Other Organics 22.0% 4.0% 90,721 16,582Food 13.7% 3.4% 56,634 14,129Textiles 3.1% 1.7% 12,901 6,933Carpet 1.1% 0.8% 4,491 3,363Tires 0.0% 0.0% 31 33Miscellaneous Organics 4.0% 1.6% 16,664 6,590Sludge 0.0% NA 0 NA
Total HHW 0.1% 0.1% 346 353Pesticides/Herbicides 0.0% 0.0% 0 0Paints/Adhesives/Solvents 0.0% 0.0% 0 0Household Cleaners 0.0% 0.0% 0 0Automotive Products 0.0% 0.0% 0 0Other HHW 0.1% 0.1% 346 353
TOTAL 100.0% 412,016
Table 3-5Aggregate Residential Waste Characterization Results - 2006
Results and Findings
2006 Waste Characterization Study 4/3/07 R. W. Beck 3-11
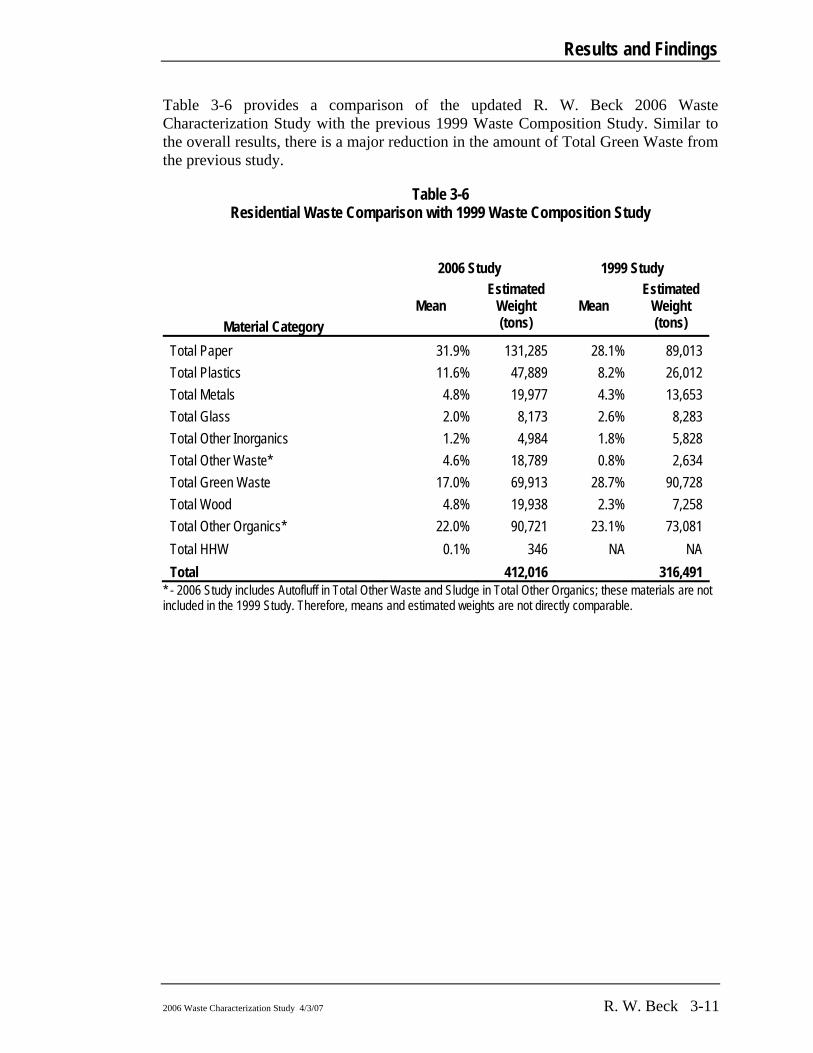
Table 3-6 provides a comparison of the updated R. W. Beck 2006 Waste Characterization Study with the previous 1999 Waste Composition Study. Similar to the overall results, there is a major reduction in the amount of Total Green Waste from the previous study.
Table 3-6 Residential Waste Comparison with 1999 Waste Composition Study
2006 Study 1999 Study
Material Category Mean
Estimated Weight (tons)
Mean Estimated
Weight (tons)
Total Paper 31.9% 131,285 28.1% 89,013 Total Plastics 11.6% 47,889 8.2% 26,012 Total Metals 4.8% 19,977 4.3% 13,653 Total Glass 2.0% 8,173 2.6% 8,283 Total Other Inorganics 1.2% 4,984 1.8% 5,828 Total Other Waste* 4.6% 18,789 0.8% 2,634 Total Green Waste 17.0% 69,913 28.7% 90,728 Total Wood 4.8% 19,938 2.3% 7,258 Total Other Organics* 22.0% 90,721 23.1% 73,081 Total HHW 0.1% 346 NA NA Total 412,016 316,491
* - 2006 Study includes Autofluff in Total Other Waste and Sludge in Total Other Organics; these materials are not included in the 1999 Study. Therefore, means and estimated weights are not directly comparable.

SECTION 3
3-12 R. W. Beck 2006 Waste Characterization Study 4/3/07
3.6 Commercial Waste Results Private haulers compete on Honolulu for solid waste collection services for commercial, industrial, and military facilities. In 2006, there were a total of 498,689 tons of commercial waste collected representing approximately 53% of all waste on the island. Self-haul, Other City & County, and Eleemosynary waste was included within the commercial waste stream.
Without diversion during H-POWER closure, approximately 77.1%, or 384,389 tons, of the commercial waste stream is suitable for energy recovery at H-POWER as presented earlier in Table 2-6. Notably, approximately 35.7% and 26.1% of the commercial waste received at the Landfill consists of wastewater sludge and autofluff, respectively.
Figure 3-5 presents the summary of weighted aggregate commercial waste from H-POWER and the Landfill. A total of 13 samples were collected at the Landfill from various private haulers. Waste from commercial, industrial, and military facilities was sampled, along with that of Eleemosynary organizations. Four self-haul samples were also collected at the Landfill and included as commercial waste. These samples were proportionately combined with the 25 samples collected at H-POWER from various private haulers to characterize the aggregate commercial waste stream. Samples collected at H-POWER included waste from commercial, industrial, and military facilities and Eleemosynary organizations. No samples were collected from Other City & County vehicles as a majority of this waste material is wastewater sludge.
The three most predominant materials represent 74.2% of the entire commercial waste stream: Paper, Other Organics, and Plastics.
Figure 3-5 Aggregate Commercial Waste Composition Summary - 2006
Total Other Organics, 28.6%
Total HHW, 0.5%
Total Paper, 32.3%
Total Plastics, 14.1%
Total Wood, 4.2%
Total Green Waste, 2.4%
Total Other Inorganics, 1.7%
Total Other Waste , 11.4%
Total Glass, 1.3%
Total Metals, 3.3%

Results and Findings
2006 Waste Characterization Study 4/3/07 R. W. Beck 3-13
Material Mean +/-Mean (tons)
+/- (tons)
Total Paper 32.3% 3.2% 161,257 16,179OCC (Recyclable)/Kraft 5.9% 2.4% 29,426 11,828Newspaper 1.6% 1.1% 8,167 5,378High-Grade Paper 4.0% 2.6% 19,917 12,961Low-Grade Paper 3.9% 1.2% 19,321 6,174Other Compostable Paper 15.7% 3.5% 78,451 17,701Other Paper 1.2% 0.4% 5,975 1,935
Total Plastics 14.1% 2.4% 70,372 11,992PET Bottles/Containers (Deposit) 0.4% 0.1% 1,813 640PET Bottles/Containers (Non-Deposit) 0.2% 0.1% 1,082 678HDPE Bottles/Containers 1.4% 0.7% 6,970 3,694Other Bottles/Containers 1.2% 0.5% 5,993 2,343Mixed Rigid Plastics 1.1% 0.8% 5,721 3,771Plastic Film/Wrap 6.3% 1.5% 31,665 7,270Polystyrene 0.9% 0.3% 4,368 1,739Other Plastics 2.6% 0.9% 12,760 4,272
Total Metals 3.3% 1.0% 16,615 4,758Aluminum Cans (Deposit) 0.3% 0.1% 1,461 593Aluminum Cans (Non-Deposit) 0.1% 0.1% 498 470Tin Cans 0.3% 0.2% 1,579 895Other Ferrous 0.7% 0.5% 3,720 2,417Other Non-Ferrous 0.5% 0.2% 2,427 1,191Mixed Metals/Other Metals 1.4% 0.9% 6,929 4,255
Total Glass 1.3% 0.7% 6,572 3,666HI 5 Glass Bottles/Containers 0.4% 0.3% 1,777 1,591Other Glass 1.0% 0.5% 4,795 2,576
Total Other Inorganics 1.7% 1.2% 8,608 5,931Gypsum Board 0.5% 0.4% 2,277 2,143Asphalt Roofing 0.4% 0.5% 2,070 2,714Asphalt Paving 0.0% 0.0% 51 62Concrete 0.3% 0.3% 1,508 1,393Sand/Soil/Rock/Dirt 0.1% 0.2% 715 767Ceramics 0.3% 0.3% 1,406 1,312Miscellaneous Inorganics 0.1% 0.1% 582 576
Total Other Waste 11.4% 2.8% 56,991 13,883Batteries 0.1% 0.0% 250 200Furnitures 3.5% 2.5% 17,414 12,379Appliances 0.1% 0.2% 692 922E-Waste 1.8% 1.3% 8,829 6,455Auto Fluff (1) 6.0% NA 29,806 NA
Total Green Waste 2.4% 1.8% 12,152 9,128Total Wood 4.2% 2.4% 21,011 12,049
Untreated Wood 2.1% 1.7% 10,336 8,416Treated Wood 1.6% 0.9% 7,879 4,560Pallets 0.6% 0.5% 2,796 2,431Stumps 0.0% 0.0% 0 0
Total Other Organics 28.6% 3.7% 142,670 18,453Food 12.4% 3.6% 61,882 17,716Textiles 3.4% 2.3% 17,121 11,587Carpet 0.4% 0.3% 2,111 1,697Tires 0.4% 0.5% 2,027 2,490Miscellaneous Organics 3.8% 1.8% 18,874 8,805Sludge (1) 8.2% NA 40,655 NA
Total HHW 0.5% 0.5% 2,441 2,742Pesticides/Herbicides 0.0% 0.0% 0 0Paints/Adhesives/Solvents 0.0% 0.0% 127 144Household Cleaners 0.0% 0.0% 0 0Automotive Products 0.5% 0.6% 2,302 2,749Other HHW 0.0% 0.0% 13 19
TOTAL 100.0% 498,689
Table 3-7Aggregate Commercial Waste Characterization Results - 2006
(1) There was no auto fluff or sludge in the samples sorted for this study. As such, standard deviation and the lower and upper bounds of the confidence interval are not applicable. The Waimanalo Gulch Landfill is known to accept auto fluff and sludge and therefore the average composition for these materials was obtained from sources outside this study.

SECTION 3
3-14 R. W. Beck 2006 Waste Characterization Study 4/3/07
Table 3-7 presents detailed waste characterization results for the commercial waste stream of the City and County of Honolulu.
Table 3-8 provides a commercial waste comparison of the updated R. W. Beck 2006 Waste Characterization Study with the previous 1999 Waste Composition Study. The amount of Total Other Waste and Total Other Organics are larger due to the inclusion of autofluff and sludge, respectively.
Table 3-8 Commercial Waste Comparison with 1999 Waste Composition Study
2006 Study 1999 Study
Material Category Mean
Estimated Weight (tons)
Mean Estimated
Weight (tons)
Total Paper 32.3% 161,257 26.0% 124,445 Total Plastics 14.1% 70,372 7.5% 35,794 Total Metals 3.3% 16,615 7.7% 36,977 Total Glass 1.3% 6,572 1.5% 7,087 Total Other Inorganics 1.7% 8,608 7.4% 35,588 Total Other Waste* 11.4% 56,991 3.6% 17,191 Total Green Waste 2.4% 12,152 10.8% 51,778 Total Wood 4.2% 21,011 17.8% 84,964 Total Other Organics* 28.6% 142,670 17.6% 83,946 Total HHW 0.5% 2,441 NA NA Total 498,689 477,770
* - 2006 Study includes Autofluff in Total Other Waste and Sludge in Total Other Organics; these materials are not included in the 1999 Study. Therefore, means and estimated weights are not directly comparable.
3.7 Convenience Center Waste Results The City and County of Honolulu operate 6 convenience centers located around the island for residents to drop off waste. Almost all (99%) of the waste collected at the convenience centers is transported to the Landfill for disposal. This waste is mostly bulky or non-combustible. Recyclables collected at the convenience centers are sold to commercial recyclers on the island. In 2006, there were a total of 29,482 tons of waste from convenience centers, representing approximately 3% of all waste on the island.
Figure 3-6 presents the summary of convenience center waste from the Landfill. A total of 14 samples were collected at the Landfill from City and County roll-off trucks. During the September 2006 sampling period, R. W. Beck did not identify any convenience center waste disposed of at H-POWER.

Results and Findings
2006 Waste Characterization Study 4/3/07 R. W. Beck 3-15
The three most predominant materials represent 64.7% of the entire convenience center waste stream: Wood, Problem Materials, and Metals.
Figure 3-6 Convenience Center Waste Composition Summary - 2006
Total Metals, 18.5%
Total Plastics, 5.7%Total Paper, 5.2%
Total HHW, 0.0%
Total Glass, 0.8%
Total Other Inorganics, 7.2%Total Other Waste ,
21.6%Total Green Waste,
10.9%
Total Wood, 24.6%
Total Other Organics, 5.4%
Table 3-9 presents detailed waste characterization results for the convenience center waste stream of the City and County of Honolulu.

SECTION 3
3-16 R. W. Beck 2006 Waste Characterization Study 4/3/07
Material Mean +/-Mean (tons)
+/- (tons)
Total Paper 5.2% 3.5% 1,546 1,019OCC (Recyclable)/Kraft 2.3% 1.6% 669 460Newspaper 0.1% 0.1% 20 29High-Grade Paper 0.1% 0.1% 20 29Low-Grade Paper 2.3% 2.5% 687 733Other Compostable Paper 0.1% 0.1% 32 40Other Paper 0.4% 0.5% 118 151
Total Plastics 5.7% 3.4% 1,677 1,010PET Bottles/Containers (Deposit) 0.0% 0.0% 8 13PET Bottles/Containers (Non-Deposit) 0.1% 0.1% 19 29HDPE Bottles/Containers 0.2% 0.3% 70 95Other Bottles/Containers 0.0% 0.0% 9 11Mixed Rigid Plastics 0.9% 0.9% 269 270Plastic Film/Wrap 1.4% 1.6% 417 485Polystyrene 0.2% 0.3% 65 84Other Plastics 2.8% 2.8% 820 819
Total Metals 18.5% 6.6% 5,462 1,954Aluminum Cans (Deposit) 0.0% 0.1% 11 17Aluminum Cans (Non-Deposit) 0.0% 0.0% 1 2Tin Cans 0.0% 0.0% 4 6Other Ferrous 8.7% 5.3% 2,551 1,572Other Non-Ferrous 0.1% 0.2% 44 59Mixed Metals/Other Metals 9.7% 6.6% 2,850 1,944
Total Glass 0.8% 1.1% 245 318HI 5 Glass Bottles/Containers 0.2% 0.3% 68 91Other Glass 0.6% 0.9% 177 275
Total Other Inorganics 7.2% 7.0% 2,124 2,049Gypsum Board 2.5% 3.3% 742 982Asphalt Roofing 2.4% 3.2% 699 930Asphalt Paving 0.0% 0.0% 0 0Concrete 0.1% 0.1% 15 24Sand/Soil/Rock/Dirt 0.0% 0.0% 0 0Ceramics 2.3% 3.0% 667 891Miscellaneous Inorganics 0.0% 0.0% 0 0
Total Other Waste 21.6% 7.9% 6,376 2,333Batteries 0.0% 0.0% 4 6Furnitures 15.8% 10.6% 4,673 3,131Appliances 1.3% 2.0% 373 581E-Waste 4.5% 4.2% 1,326 1,230Auto Fluff 0.0% 0.0% 0 0
Total Green Waste 10.9% 5.5% 3,201 1,615Total Wood 24.6% 10.0% 7,248 2,940
Untreated Wood 7.9% 7.8% 2,325 2,294Treated Wood 12.3% 8.0% 3,640 2,357Pallets 1.2% 1.7% 351 494Stumps 3.2% 4.6% 932 1,359
Total Other Organics 5.4% 5.2% 1,604 1,526Food 0.6% 0.7% 163 211Textiles 2.5% 2.7% 734 787Carpet 2.3% 3.0% 685 872Tires 0.0% 0.0% 0 0Miscellaneous Organics 0.1% 0.1% 22 29Sludge 0.0% 0.0% 0 0
Total HHW 0.0% 0.0% 0 0Pesticides/Herbicides 0.0% 0.0% 0 0Paints/Adhesives/Solvents 0.0% 0.0% 0 0Household Cleaners 0.0% 0.0% 0 0Automotive Products 0.0% 0.0% 0 0Other HHW 0.0% 0.0% 0 0
TOTAL 100.0% 29,482
Table 3-9Convenience Center Waste Characterization Results - 2006

Results and Findings
2006 Waste Characterization Study 4/3/07 R. W. Beck 3-17
Table 3-10 provides a comparison for convenience center waste of the updated R. W. Beck 2006 Waste Characterization Study with the previous 1999 Waste Composition Study. As shown in the table, the amount of Total Metals has significantly increased since 1999.
Table 3-10 Convenience Center Waste Comparison with 1999 Waste Composition Study
2006 Study 1999 Study
Material Category Mean
Estimated Weight (tons)
Mean Estimated
Weight (tons)
Total Paper 5.24% 1,546 7.10% 1,940 Total Plastics 5.69% 1,677 4.60% 1,250 Total Metals 18.53% 5,462 11.40% 3,110 Total Glass 0.83% 245 0.60% 168 Total Other Inorganics 7.20% 2,124 4.50% 1,233 Total Other Waste* 21.63% 6,376 20.50% 5,561 Total Green Waste 10.86% 3,201 16.70% 4,541 Total Wood 24.58% 7,248 24.60% 6,678 Total Other Organics* 5.44% 1,604 9.90% 2,696 Total HHW 0.00% 0 NA NA Total 29,482 27,176 * - 2006 Study includes Autofluff in Total Other Waste and Sludge in Total Other Organics; these materials are not included in the 1999 Study. Therefore, means and estimated weights are not directly comparable.
3.8 HI-5 Recyclables Results This section will provide the Refuse Division with a summary of the HI-5 deposit material currently being disposed of on the island. Recovery of this material is desirable for both environmental and economic considerations.
Table 3-11 presents an estimate of the quantity of HI-5 bottles/containers by weight and number of containers. This calculation is based on composition results obtained during the R. W. Beck field sampling activities completed in September 2006.

SECTION 3
3-18 R. W. Beck 2006 Waste Characterization Study 4/3/07
Table 3-11 Number of HI-5 Containers in Waste Stream - 2006
Plastic (PET) Aluminum Glass
(tons) (No. of Containers) (tons)
(No. of Containers) (tons)
(No. of Containers)
H-Power Total 2689 89,275,000 2548 152,880,000 3756 18,029,000 Residential 820 27,224,000 715 42,900,000 2138 10,262,000 Commercial 1751 58,133,000 1429 85,740,000 1573 7,550,000 Convenience Center 0 0 0 0 1 5,000 Waimanalo Gulch Landfill Total 166 5,511,000 90 5,400,000 413 1,982,000 Residential 96 3,187,000 47 2,820,000 151 725,000 Commercial 63 2,092,000 32 1,920,000 204 979,000 Convenience Center 8 266,000 11 660,000 67 322,000 Overall Total 2843 94,388,000 2626 157,560,000 4158 19,958,000 Residential 915 30,378,000 762 45,720,000 2289 10,987,000 Commercial 1813 60,192,000 1461 87,660,000 1777 8,530,000 Convenience Center 8 266,000 11 660,000 68 326,000
It is important to note that the HI-5 material estimates represent the amount of material for each waste facility composition type. A portion of the material within the H-POWER waste stream will be rerouted and disposed of at the Landfill due to H-POWER closure. The estimates provided may not add together exactly due to rounding during data integration.
2006 Waste Characterization Study
Page A-1
Appendix A Material Category Definitions
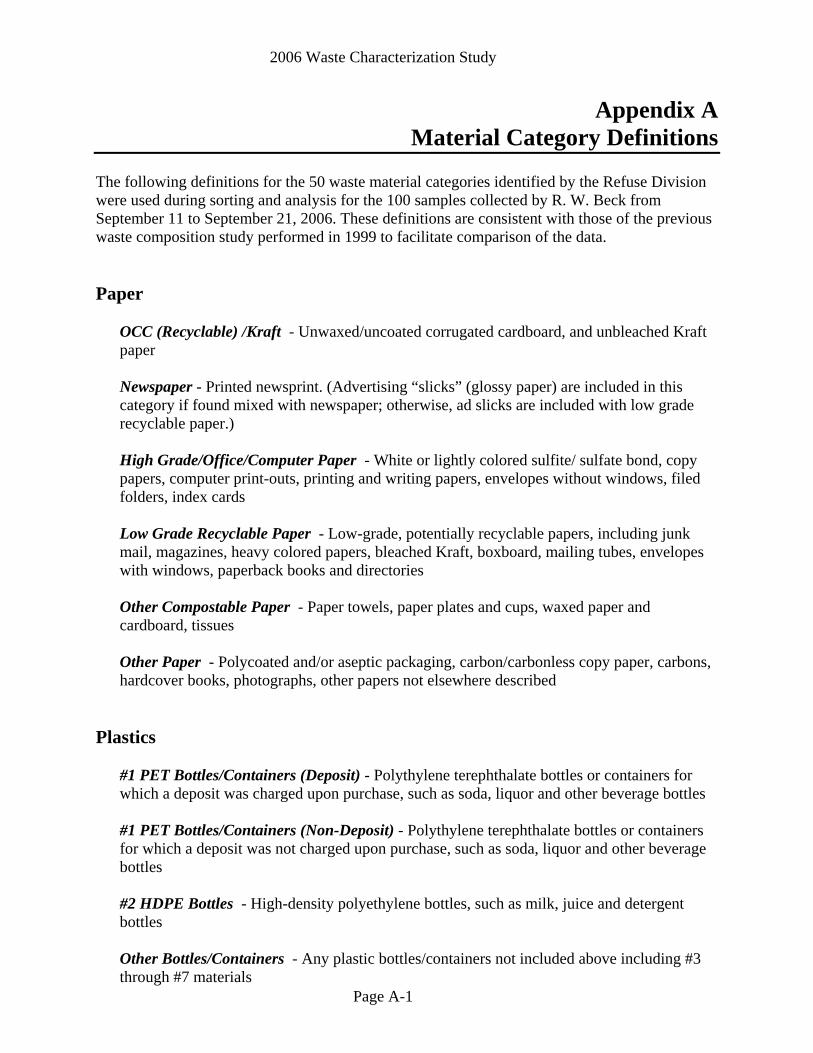
The following definitions for the 50 waste material categories identified by the Refuse Division were used during sorting and analysis for the 100 samples collected by R. W. Beck from September 11 to September 21, 2006. These definitions are consistent with those of the previous waste composition study performed in 1999 to facilitate comparison of the data. Paper
OCC (Recyclable) /Kraft - Unwaxed/uncoated corrugated cardboard, and unbleached Kraft paper Newspaper - Printed newsprint. (Advertising “slicks” (glossy paper) are included in this category if found mixed with newspaper; otherwise, ad slicks are included with low grade recyclable paper.) High Grade/Office/Computer Paper - White or lightly colored sulfite/ sulfate bond, copy papers, computer print-outs, printing and writing papers, envelopes without windows, filed folders, index cards Low Grade Recyclable Paper - Low-grade, potentially recyclable papers, including junk mail, magazines, heavy colored papers, bleached Kraft, boxboard, mailing tubes, envelopes with windows, paperback books and directories Other Compostable Paper - Paper towels, paper plates and cups, waxed paper and cardboard, tissues Other Paper - Polycoated and/or aseptic packaging, carbon/carbonless copy paper, carbons, hardcover books, photographs, other papers not elsewhere described
Plastics
#1 PET Bottles/Containers (Deposit) - Polythylene terephthalate bottles or containers for which a deposit was charged upon purchase, such as soda, liquor and other beverage bottles #1 PET Bottles/Containers (Non-Deposit) - Polythylene terephthalate bottles or containers for which a deposit was not charged upon purchase, such as soda, liquor and other beverage bottles #2 HDPE Bottles - High-density polyethylene bottles, such as milk, juice and detergent bottles Other Bottles/Containers - Any plastic bottles/containers not included above including #3 through #7 materials

2006 Waste Characterization Study
Page A-2
Mixed Rigid Plastics - All other plastic materials that hold a shape; rigid plastic products, such as toys and baskets Plastic Film/Wrap - Film packaging and products, such as plastic garbage bags, bread bags and shrink wrap Mixed Plastic and other Materials Predominately plastic, with other materials attached, such as disposable razors, pens, lighters, toys and 3-ring binders
Metals
Aluminum Cans (Deposit) - Aluminum beverage cans and bi-metal cans made mostly of aluminum for which a deposit was charged upon purchase Aluminum Cans (Non-Deposit) - Aluminum beverage cans and bi-metal cans made mostly of aluminum for which a deposit was not charged upon purchase Tin Cans - Tinned steel food containers, including bi-metal cans made mostly of steel Other Ferrous Metals - All other materials composed of ferrous and alloyed ferrous scrap Other Non-Ferrous Metals - All other materials composed of metals not derived from iron, including copper, brass, bronze, aluminum bronze, lead, pewter, zinc, and other metals to which a magnet will not adhere Mixed Metals / Other Materials - Materials composed both of ferrous and nonferrous metals and/or have contaminants (such as wood or plastic) attached; small appliances, tools, white goods
Glass
HI-5 Glass Bottles/Containers - All glass bottles or containers, of any color, for which a deposit was charged upon purchase including beverage bottles Other Glass - All other glass, such as light bulbs, window glass, mirrors, glassware, and bottles/containers for which a deposit was not charged upon purchase

2006 Waste Characterization Study
Page A-3
Other Inorganics
Gypsum Wallboard - New or demolition gypsum wallboard Asphalt Roofing - Asphalt shingles, tar paper or built-up roofing Asphalt Paving - Asphalt paving Concrete - Portland cement mixtures (set or unset) Sand/Soil/Rock/Dirt - Sand, soil, rock, and dirt and mixed unidentifiable fines Ceramics - Finished ceramic or porcelain products, such as sinks, toilets, dishes and planters Miscellaneous Inorganics - Any other inorganic materials, such as ash, brick, kitty litter
Other Waste
Batteries – Includes vehicle batteries as well as smaller batteries such as AA, AAA, and 9 volt Furniture - Furniture (composed of any material) and mattresses Appliances – Large appliances including refrigerators, televisions, stereos, radios, computers E-Waste – Includes Brown Goods such as microwaves, stereos, VCRs, DVD players, radios, audio/visual equipment; Computer-related Electronics such as processors, mice, keyboards, laptops, disk drives, printers, modems, and fax machines; and Other Small Consumer Electronics such as personal digital assistants (PDAs), cell phones, phone systems, phone answering machines, computer games and other electronic toys, portable CD players, camcorders, and digital cameras. Autofluff – Fine mixed waste material (less than 1”) generated by the process of pulverizing automobiles including wire, foam, mixed metal, etc.
Green Waste – Includes leaves, grass clippings, garden wastes and brush up to four inches in
diameter Wood
Untreated Wood - Unpainted dimensional lumber Treated Wood - Lumber and wood products which have been painted or treated; or those with adhering concrete or other contaminants

2006 Waste Characterization Study
Page A-4
Pallets – Identifying wood pallets and crates Stumps - Stumps of trees and shrubs, with any adhering soil, and other natural wood, such as logs or branches that are greater than four inches in diameter
Other Organics
Food - Food wastes and scraps, including bone, rinds, etc. Excludes the weight of food containers, except when container weight is not appreciable compared to the food inside or container can’t be opened in the field (such as a new can of food) Textiles - Fabric materials, including natural and synthetic textiles such as cotton, wood, silk, woven nylon, rayon, polyester and other materials; without non-textile attachments Carpet - General category of flooring applications consisting of various natural or synthetic fibers bonded to a backing material; also includes shoes, belts and handbags Tires - Vehicle tires of all types Miscellaneous Organics - All other organics, such as diapers, personal hygiene products, animal feces, animal bedding, sawdust, wax, soap, cigarette butts, fur, hair and vacuum cleaner bags Sludge – Solid sludge material generated by water and wastewater treatment plants
Household Hazardous Waste (HHW)
Pesticides/Herbicides – Containers with a measurable amount of chemical pesticides or herbicides that are potentially harmful to the environment. These materials may cause handling problems or other hazards if improperly disposed of in the waste stream. Paints/Adhesives/Solvents – Containers with a measurable amount of liquid paint, adhesives, or other solvents. This does not include dried paint, empty paint cans, or empty aerosol containers. Household Cleaners – Containers with a measurable amount of liquid cleaners, disinfectants, or other chemical materials that may be harmful to the environment or cause other hazards if improperly disposed of in the waste stream. Automotive Products – Containers with a measurable amount of vehicle or equipment fluid that may be harmful to the environment or cause other hazards if improperly disposed of in the waste stream. Includes used oil filters. Other HHW – Other HHW materials not classified within any of the above categories which may be harmful to the environment or cause other hazards if improperly disposed of in the waste stream. Examples include medicines, fluorescent light bulbs, and medical waste such as sharps.
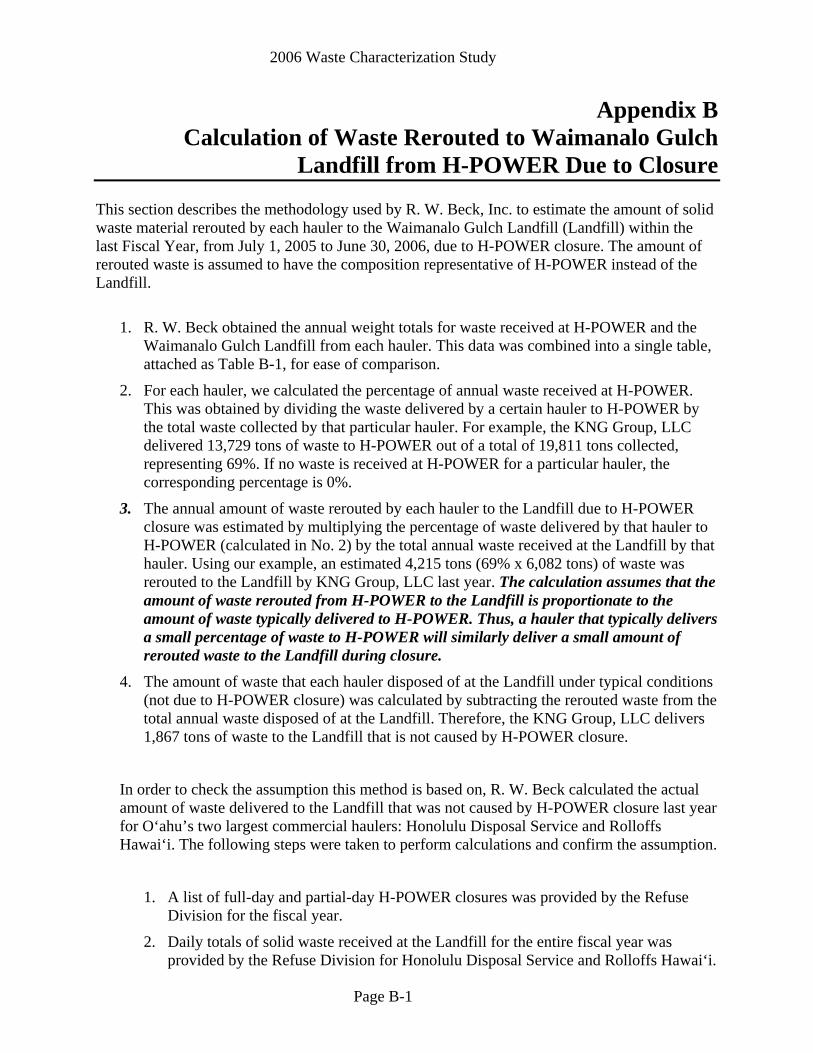
2006 Waste Characterization Study
Page B-1
Appendix B Calculation of Waste Rerouted to Waimanalo Gulch
Landfill from H-POWER Due to Closure This section describes the methodology used by R. W. Beck, Inc. to estimate the amount of solid waste material rerouted by each hauler to the Waimanalo Gulch Landfill (Landfill) within the last Fiscal Year, from July 1, 2005 to June 30, 2006, due to H-POWER closure. The amount of rerouted waste is assumed to have the composition representative of H-POWER instead of the Landfill.
1. R. W. Beck obtained the annual weight totals for waste received at H-POWER and the Waimanalo Gulch Landfill from each hauler. This data was combined into a single table, attached as Table B-1, for ease of comparison.
2. For each hauler, we calculated the percentage of annual waste received at H-POWER. This was obtained by dividing the waste delivered by a certain hauler to H-POWER by the total waste collected by that particular hauler. For example, the KNG Group, LLC delivered 13,729 tons of waste to H-POWER out of a total of 19,811 tons collected, representing 69%. If no waste is received at H-POWER for a particular hauler, the corresponding percentage is 0%.
3. The annual amount of waste rerouted by each hauler to the Landfill due to H-POWER closure was estimated by multiplying the percentage of waste delivered by that hauler to H-POWER (calculated in No. 2) by the total annual waste received at the Landfill by that hauler. Using our example, an estimated 4,215 tons (69% x 6,082 tons) of waste was rerouted to the Landfill by KNG Group, LLC last year. The calculation assumes that the amount of waste rerouted from H-POWER to the Landfill is proportionate to the amount of waste typically delivered to H-POWER. Thus, a hauler that typically delivers a small percentage of waste to H-POWER will similarly deliver a small amount of rerouted waste to the Landfill during closure.
4. The amount of waste that each hauler disposed of at the Landfill under typical conditions (not due to H-POWER closure) was calculated by subtracting the rerouted waste from the total annual waste disposed of at the Landfill. Therefore, the KNG Group, LLC delivers 1,867 tons of waste to the Landfill that is not caused by H-POWER closure.
In order to check the assumption this method is based on, R. W. Beck calculated the actual amount of waste delivered to the Landfill that was not caused by H-POWER closure last year for O‘ahu’s two largest commercial haulers: Honolulu Disposal Service and Rolloffs Hawai‘i. The following steps were taken to perform calculations and confirm the assumption.
1. A list of full-day and partial-day H-POWER closures was provided by the Refuse Division for the fiscal year.
2. Daily totals of solid waste received at the Landfill for the entire fiscal year was provided by the Refuse Division for Honolulu Disposal Service and Rolloffs Hawai‘i.

2006 Waste Characterization Study
Page B-2
R. W. Beck calculated the average daily amount of waste received at the Landfill for each hauler on days when no full-day or partial-day closure occurred. The average daily waste received at the Landfill from Honolulu Disposal Service was found to be 32.3 tons/day; and 29.9 tons/day from Rolloffs Hawai‘i.
3. The annual waste received at the Landfill not caused by H-POWER closure was estimated by multiplying the average daily landfilled waste by 363 days. The total for Honolulu Disposal Service was 11,725 tons; and 10,854 tons for Rolloffs Hawai‘i.
4. The calculated totals based on average daily waste for Honolulu Disposal Service and Rolloffs Hawai‘i were compared to those calculated based on H-POWER percentage and confirmed to be within 1%.

2006 WASTE CHARACTERIZATION STUDY
Table B-1 Appendix BCalculation of Waste Rerouted to Waimanalo Gulch Landfill from H-POWER Due to Closure
Hauler NameWGL Total
(tons)
H-POWER Total (tons)
HP Percent
WGL Total due to
Reroute
WGL Total
typical
H-POWER
Total (tons)
HP Percent
WGL Total due to
Reroute
WGL Total
typical
WGL Total due to
Reroute
WGL Total
typical1-800-GOT-JUNK? 0 0% 0 024 HOUR QUALITY CLEA 3 0% 0 33 POINT RESTORATION 1 0% 0 1A & L LANDSCAPING & 2 0% 0 2A 1 A LECTRICIAN INC 1 0% 0 1A-1 EXTRACTION INC 0 0% 0 0A-AMERICAN SELF STOR 4 0% 0 4ABAMONGA CARE HOME 2 0% 0 2ABC SALES INC 2 0% 0 2ABC SEATING INC 20 0% 0 20ABRAHAM HOLDINGS LLC 2 0% 0 2ACCESS LOGISTICS LIM 9 0% 0 9ACE AUTO GLASS INC 1 0% 0 1ADMOR DISTRIBUTORS 36 0% 0 36AKAMAI IMPROVEMENTS 2 0% 0 2ALEXANDER BROTHERS L 3 0% 0 3ALL ROLLOFF SERVICES 3 0% 0 3ALL TREE SERVICES 13 0% 0 13ALL-AMERICAN MOVING 13 0% 0 13ALLIANCE TRUCKING 331 0% 0 331ALLIED BUILDERS SYST 0 0% 0 0ALOHA DUMP RUNS HAWA 4 0% 0 4ALOHA INTERNATIONAL 72 160 69% 49 22ALOHA STATE SERVICES 5 0% 0 5ALOHA WASTE SERVICES 2017 6,033 75% 1,512 505AMAZON CONSTRUCTION 1072 0% 0 1,072AMERICAN PIPING & BO 50 0% 0 50ANTHONY MOORE 1 0% 0 1ASIAN FOOD TRADING C 21 0% 0 21B K FLOORING 9 0% 0 9B&C TRUCKING CO 1005 0% 0 1,005BALDWIN-SANDERS PIAN 8 0% 0 8BARNEY'S ROLLOFF SER 284 1,913 87% 247 37
Commercial Residential Convenience Center
Page TB-1

2006 WASTE CHARACTERIZATION STUDY
Table B-1 Appendix BCalculation of Waste Rerouted to Waimanalo Gulch Landfill from H-POWER Due to Closure
Hauler NameWGL Total
(tons)
H-POWER Total (tons)
HP Percent
WGL Total due to
Reroute
WGL Total
typical
H-POWER
Total (tons)
HP Percent
WGL Total due to
Reroute
WGL Total
typical
WGL Total due to
Reroute
WGL Total
typical
Commercial Residential Convenience Center
BEKINS HAWAIIAN MOVE 16 0% 0 16BETTER HOME APPLIANC 5 0% 0 5BISHOP MUSEUM BUILDI 1 0% 0 1BO WAH TRADING CO 1 0% 0 1BRIAN R HIRAHARA 1 0% 0 1BUSINESS WORKS OF HA 6 0% 0 6C&C-DEPT OF PARKS & 444 674 60% 268 177C&C-EMERGENCY MED SV 0 0% 0 0C&C-HONOLULU FIRE DE 7 0% 0 7C&C-HONOLULU POLICE 11 21 65% 7 4C&C-PUBLIC BLDG & EL 2 0% 0 2C&C-ROAD MAINTENANCE 1102 75 6% 70 1032C&C-WWM 29951 0% 0 29,951C&S WHOLESALE GROCER 227 0% 0 227CENTRAL BOEKI HAWAII 0 0% 0 0CHOICE FENCE 4 0% 0 4CHUCK E CHEESE 1 0% 0 1CIRCUIT CITY 30 0% 0 30CITY WIDE TRANSPORTA 50 0% 0 50CLEAN ISLANDS COUNCI 0 0% 0 0COASTAL WINDOWS INC 10 0% 0 10CO-HA BUILDERS INC 2 0% 0 2COLORTYME 12 0% 0 12COMMERCIAL SHELVING 1 0% 0 1COMMONWEALTH BRANDS 2 0% 0 2CONCRETE CORING CO 27 0% 0 27CONTEMPORARY LANDSCA 2 0% 0 2CORNERSTONE MECHANIC 1 0% 0 1CORY CARPETS 2 0% 0 2COYNE MATTRESS CO LT 5 0% 0 5CREATIVE FURNITURE O 5 0% 0 5CRITCHFIELD PACIFIC 0 0% 0 0DAE HAN EXPRESS 4 0% 0 4
Page TB-2
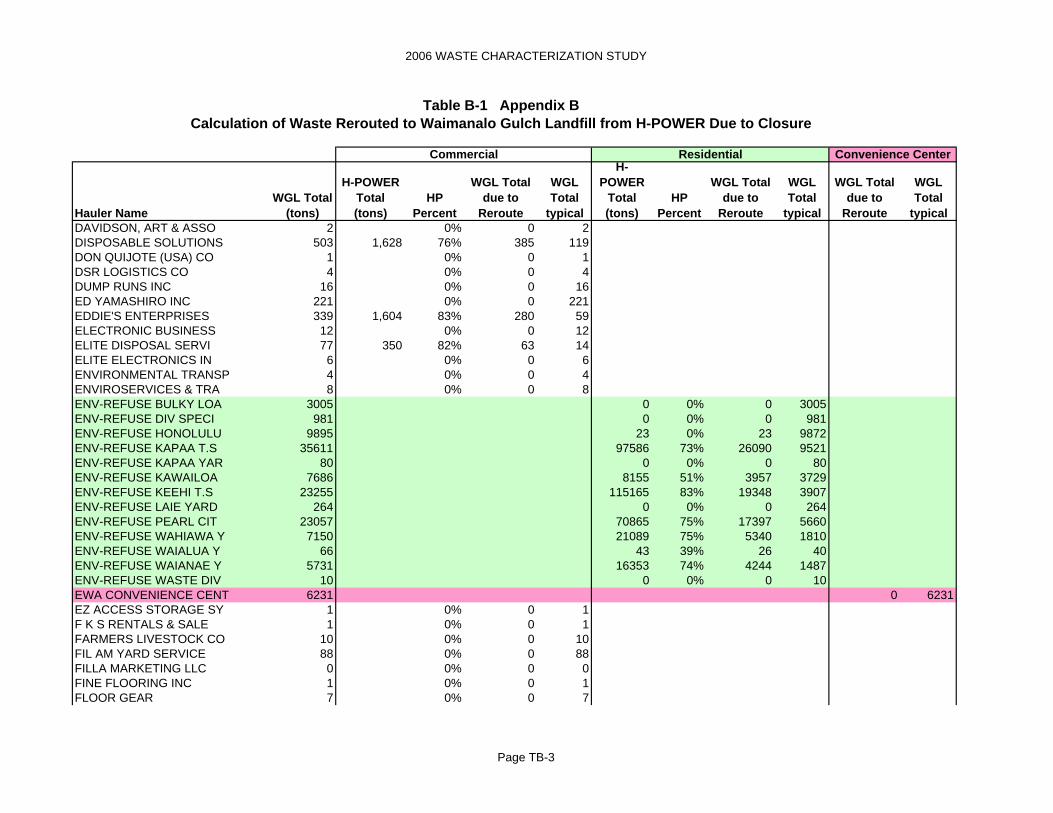
2006 WASTE CHARACTERIZATION STUDY
Table B-1 Appendix BCalculation of Waste Rerouted to Waimanalo Gulch Landfill from H-POWER Due to Closure
Hauler NameWGL Total
(tons)
H-POWER Total (tons)
HP Percent
WGL Total due to
Reroute
WGL Total
typical
H-POWER
Total (tons)
HP Percent
WGL Total due to
Reroute
WGL Total
typical
WGL Total due to
Reroute
WGL Total
typical
Commercial Residential Convenience Center
DAVIDSON, ART & ASSO 2 0% 0 2DISPOSABLE SOLUTIONS 503 1,628 76% 385 119DON QUIJOTE (USA) CO 1 0% 0 1DSR LOGISTICS CO 4 0% 0 4DUMP RUNS INC 16 0% 0 16ED YAMASHIRO INC 221 0% 0 221EDDIE'S ENTERPRISES 339 1,604 83% 280 59ELECTRONIC BUSINESS 12 0% 0 12ELITE DISPOSAL SERVI 77 350 82% 63 14ELITE ELECTRONICS IN 6 0% 0 6ENVIRONMENTAL TRANSP 4 0% 0 4ENVIROSERVICES & TRA 8 0% 0 8ENV-REFUSE BULKY LOA 3005 0 0% 0 3005ENV-REFUSE DIV SPECI 981 0 0% 0 981ENV-REFUSE HONOLULU 9895 23 0% 23 9872ENV-REFUSE KAPAA T.S 35611 97586 73% 26090 9521ENV-REFUSE KAPAA YAR 80 0 0% 0 80ENV-REFUSE KAWAILOA 7686 8155 51% 3957 3729ENV-REFUSE KEEHI T.S 23255 115165 83% 19348 3907ENV-REFUSE LAIE YARD 264 0 0% 0 264ENV-REFUSE PEARL CIT 23057 70865 75% 17397 5660ENV-REFUSE WAHIAWA Y 7150 21089 75% 5340 1810ENV-REFUSE WAIALUA Y 66 43 39% 26 40ENV-REFUSE WAIANAE Y 5731 16353 74% 4244 1487ENV-REFUSE WASTE DIV 10 0 0% 0 10EWA CONVENIENCE CENT 6231 0 6231EZ ACCESS STORAGE SY 1 0% 0 1F K S RENTALS & SALE 1 0% 0 1FARMERS LIVESTOCK CO 10 0% 0 10FIL AM YARD SERVICE 88 0% 0 88FILLA MARKETING LLC 0 0% 0 0FINE FLOORING INC 1 0% 0 1FLOOR GEAR 7 0% 0 7
Page TB-3

2006 WASTE CHARACTERIZATION STUDY
Table B-1 Appendix BCalculation of Waste Rerouted to Waimanalo Gulch Landfill from H-POWER Due to Closure
Hauler NameWGL Total
(tons)
H-POWER Total (tons)
HP Percent
WGL Total due to
Reroute
WGL Total
typical
H-POWER
Total (tons)
HP Percent
WGL Total due to
Reroute
WGL Total
typical
WGL Total due to
Reroute
WGL Total
typical
Commercial Residential Convenience Center
FULFILLMENT WERKS 2 0% 0 2FURNITURE SER&INSTAL 11 0% 0 11GENERAL TRADES & SER 215 0% 0 215GEORGE YOSHIOKA CARP 9 0% 0 9GIMA PEST CONTROL 1 0% 0 1GLASSWARE DECORATORS 0 0% 0 0GMI 2954 3,777 56% 1,658 1,296GOLDEN COIN FOOD IND 0 0% 0 0GOODWILL - RECYCLING 2441 0% 0 2,441GREEN MAGIC 4 0% 0 4GUO TING HUANG 1 0% 0 1H TANAKA TRUCKING 19 0% 0 19HAN KOOK MOVING COMP 1 0% 0 1HAWAII BIO-WASTE SYS 6 0% 0 6HAWAII COFFEE CO 1 0% 0 1HAWAII MEGA COR INC 2 0% 0 2HAWAII METAL RECYCLI 29853 0% 0 29,853HAWAII MOVERS INC 30 0% 0 30HAWAII STAR BAKERY I 1 0% 0 1HAWAII STATE & LIGHT 7 0% 0 7HAWAII TRANSFER CO, 145 0% 0 145HAWAIIAN EARTH PRODU 3 0% 0 3HAWAIIAN EARTH PRODU 47 0% 0 47HAWAIIAN ELECTRIC CO 2 0% 0 2HAWAIIAN ISLES VENDI 2 0% 0 2HAWAIIAN KING CANDIE 1 0% 0 1HAWAIIAN STEAM 136 0% 0 136HAZTECH ENVIRONMENTA 6 0% 0 6HELPING HANDS HAWAII 46 0% 0 46HENRY'S EQUIPMENT RE 60 0% 0 60HERC PRODUCTS INC 1 0% 0 1HING MAU INC 1 0% 0 1HOLLAND, MICHAEL 13 0% 0 13
Page TB-4
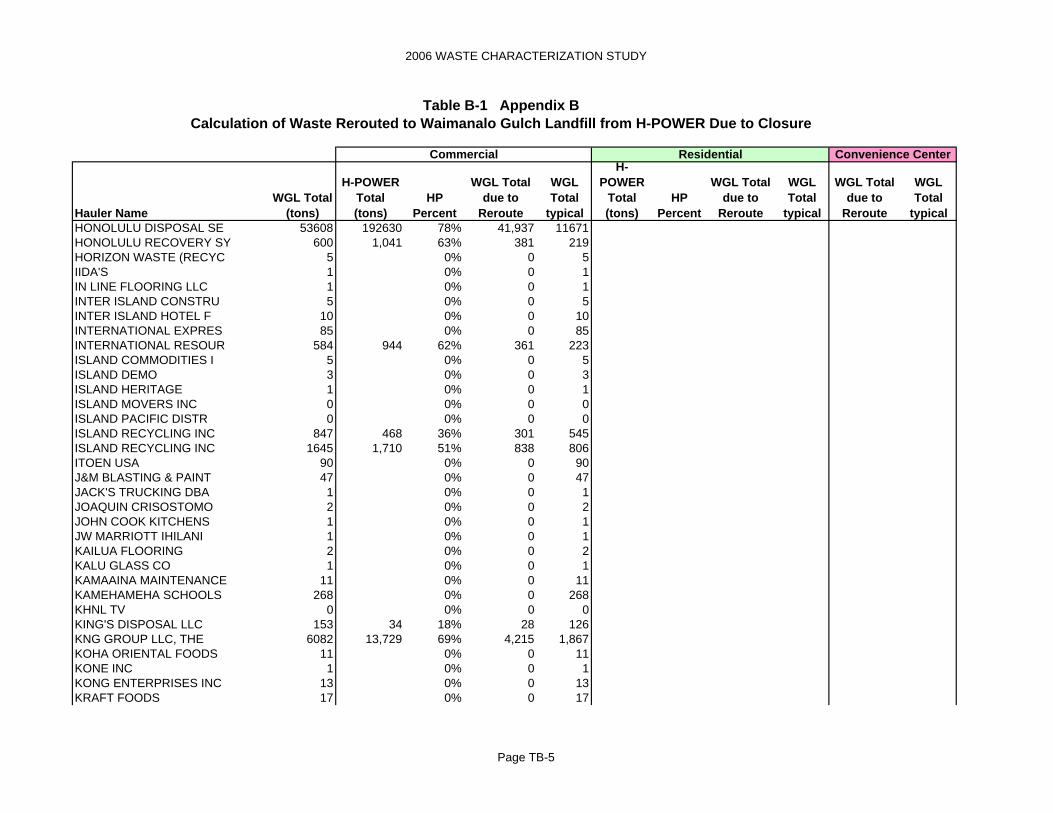
2006 WASTE CHARACTERIZATION STUDY
Table B-1 Appendix BCalculation of Waste Rerouted to Waimanalo Gulch Landfill from H-POWER Due to Closure
Hauler NameWGL Total
(tons)
H-POWER Total (tons)
HP Percent
WGL Total due to
Reroute
WGL Total
typical
H-POWER
Total (tons)
HP Percent
WGL Total due to
Reroute
WGL Total
typical
WGL Total due to
Reroute
WGL Total
typical
Commercial Residential Convenience Center
HONOLULU DISPOSAL SE 53608 192630 78% 41,937 11671HONOLULU RECOVERY SY 600 1,041 63% 381 219HORIZON WASTE (RECYC 5 0% 0 5IIDA'S 1 0% 0 1IN LINE FLOORING LLC 1 0% 0 1INTER ISLAND CONSTRU 5 0% 0 5INTER ISLAND HOTEL F 10 0% 0 10INTERNATIONAL EXPRES 85 0% 0 85INTERNATIONAL RESOUR 584 944 62% 361 223ISLAND COMMODITIES I 5 0% 0 5ISLAND DEMO 3 0% 0 3ISLAND HERITAGE 1 0% 0 1ISLAND MOVERS INC 0 0% 0 0ISLAND PACIFIC DISTR 0 0% 0 0ISLAND RECYCLING INC 847 468 36% 301 545ISLAND RECYCLING INC 1645 1,710 51% 838 806ITOEN USA 90 0% 0 90J&M BLASTING & PAINT 47 0% 0 47JACK'S TRUCKING DBA 1 0% 0 1JOAQUIN CRISOSTOMO 2 0% 0 2JOHN COOK KITCHENS 1 0% 0 1JW MARRIOTT IHILANI 1 0% 0 1KAILUA FLOORING 2 0% 0 2KALU GLASS CO 1 0% 0 1KAMAAINA MAINTENANCE 11 0% 0 11KAMEHAMEHA SCHOOLS 268 0% 0 268KHNL TV 0 0% 0 0KING'S DISPOSAL LLC 153 34 18% 28 126KNG GROUP LLC, THE 6082 13,729 69% 4,215 1,867KOHA ORIENTAL FOODS 11 0% 0 11KONE INC 1 0% 0 1KONG ENTERPRISES INC 13 0% 0 13KRAFT FOODS 17 0% 0 17
Page TB-5

2006 WASTE CHARACTERIZATION STUDY
Table B-1 Appendix BCalculation of Waste Rerouted to Waimanalo Gulch Landfill from H-POWER Due to Closure
Hauler NameWGL Total
(tons)
H-POWER Total (tons)
HP Percent
WGL Total due to
Reroute
WGL Total
typical
H-POWER
Total (tons)
HP Percent
WGL Total due to
Reroute
WGL Total
typical
WGL Total due to
Reroute
WGL Total
typical
Commercial Residential Convenience Center
KTM SERVICES INC 17 0% 0 17LAIE CONVENIENCE CEN 612 0 612LAMUG, ROBERTO B 2 0% 0 2LANDSCAPE SERVICES C 3 0% 0 3LANDSCAPING LIKE FAT 2 0% 0 2LASER IMAGING PRODUC 0 0% 0 0LENOX METALS LLC 42 0% 0 42LIGGETT VECTOR BRAND 1 0% 0 1LION'S CLEANING & MA 1 0% 0 1LOOMIS FARGO 2 0% 0 2LOUIS VUITTON 4 0% 0 4LS YARD SERVICE 4 0% 0 4M SHIROMA PAINTING C 1 0% 0 1MANN STEPHEN H 2 0% 0 2MARIO MONI CO LLC 1 0% 0 1MARTIN WAREHOUSING & 17 0% 0 17MARUKAI HAWAII INC 1 0% 0 1MATTHEW MIYATA ULTIM 3 0% 0 3MATTRESS WAREHOUSE , 48 0% 0 48MAUNALOA MACADAMIA N 17 0% 0 17MCA GENERAL REPAIRS 0 0% 0 0MCCALLISTER BEDS & F 21 0% 0 21MEMBRERE YARD SERVIC 3 0% 0 3MERCHANDISE INTERNAT 1 0% 0 1METRO SAMOA INC 0 0% 0 0MID TOWN RADIO SALES 27 0% 0 27MIKOSHI TRADING HAWA 14 0% 0 14MILILANI TOWN ASSOCI 23 0% 0 23MORRIS CARPET 7 0% 0 7NABISCO INC 1 0% 0 1NAKOA COMPANIES, INC 19 0% 0 19NATIONAL CARPET & DR 6 0% 0 6NCNS 2414 2,823 54% 1,301 1,112
Page TB-6
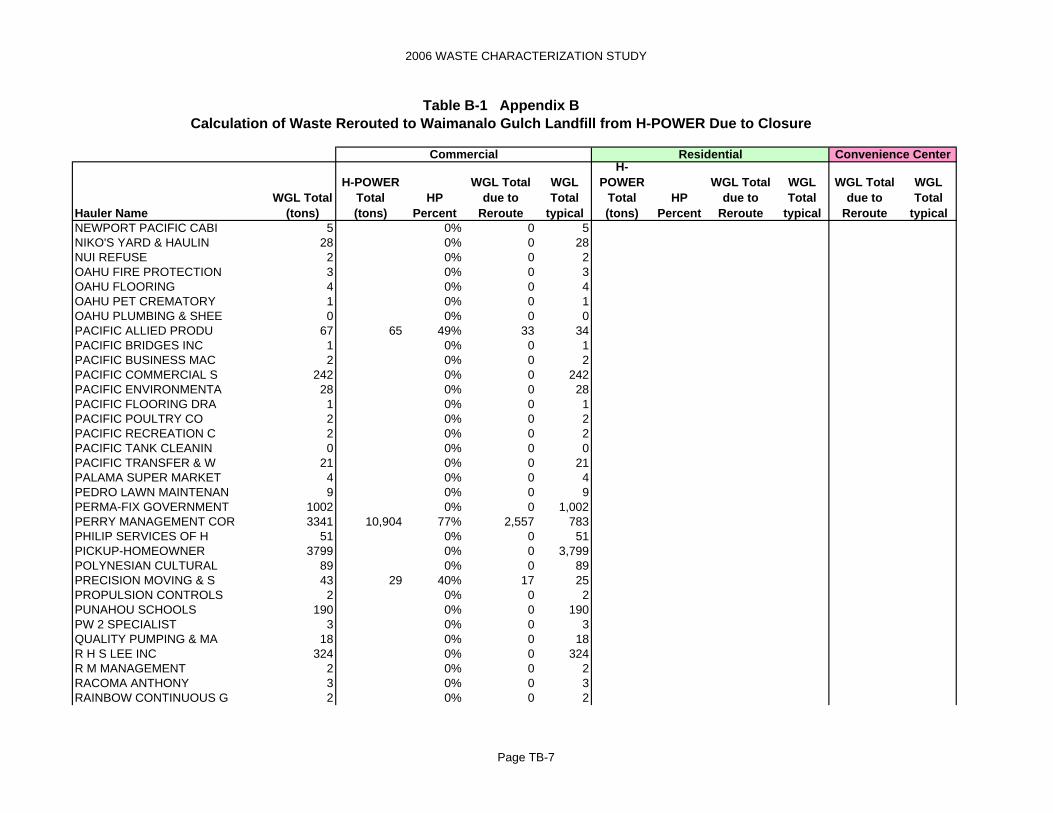
2006 WASTE CHARACTERIZATION STUDY
Table B-1 Appendix BCalculation of Waste Rerouted to Waimanalo Gulch Landfill from H-POWER Due to Closure
Hauler NameWGL Total
(tons)
H-POWER Total (tons)
HP Percent
WGL Total due to
Reroute
WGL Total
typical
H-POWER
Total (tons)
HP Percent
WGL Total due to
Reroute
WGL Total
typical
WGL Total due to
Reroute
WGL Total
typical
Commercial Residential Convenience Center
NEWPORT PACIFIC CABI 5 0% 0 5NIKO'S YARD & HAULIN 28 0% 0 28NUI REFUSE 2 0% 0 2OAHU FIRE PROTECTION 3 0% 0 3OAHU FLOORING 4 0% 0 4OAHU PET CREMATORY 1 0% 0 1OAHU PLUMBING & SHEE 0 0% 0 0PACIFIC ALLIED PRODU 67 65 49% 33 34PACIFIC BRIDGES INC 1 0% 0 1PACIFIC BUSINESS MAC 2 0% 0 2PACIFIC COMMERCIAL S 242 0% 0 242PACIFIC ENVIRONMENTA 28 0% 0 28PACIFIC FLOORING DRA 1 0% 0 1PACIFIC POULTRY CO 2 0% 0 2PACIFIC RECREATION C 2 0% 0 2PACIFIC TANK CLEANIN 0 0% 0 0PACIFIC TRANSFER & W 21 0% 0 21PALAMA SUPER MARKET 4 0% 0 4PEDRO LAWN MAINTENAN 9 0% 0 9PERMA-FIX GOVERNMENT 1002 0% 0 1,002PERRY MANAGEMENT COR 3341 10,904 77% 2,557 783PHILIP SERVICES OF H 51 0% 0 51PICKUP-HOMEOWNER 3799 0% 0 3,799POLYNESIAN CULTURAL 89 0% 0 89PRECISION MOVING & S 43 29 40% 17 25PROPULSION CONTROLS 2 0% 0 2PUNAHOU SCHOOLS 190 0% 0 190PW 2 SPECIALIST 3 0% 0 3QUALITY PUMPING & MA 18 0% 0 18R H S LEE INC 324 0% 0 324R M MANAGEMENT 2 0% 0 2RACOMA ANTHONY 3 0% 0 3RAINBOW CONTINUOUS G 2 0% 0 2
Page TB-7

2006 WASTE CHARACTERIZATION STUDY
Table B-1 Appendix BCalculation of Waste Rerouted to Waimanalo Gulch Landfill from H-POWER Due to Closure
Hauler NameWGL Total
(tons)
H-POWER Total (tons)
HP Percent
WGL Total due to
Reroute
WGL Total
typical
H-POWER
Total (tons)
HP Percent
WGL Total due to
Reroute
WGL Total
typical
WGL Total due to
Reroute
WGL Total
typical
Commercial Residential Convenience Center
RAINBOW ROOF MAINTEN 0 0% 0 0RAMOS, ROMMEL S 2 0% 0 2RANDY'S CARPET 0 0% 0 0RELIABLE HAULING & R 218 0% 0 218RELIABLE SERVICE & G 22 0% 0 22RENT-A-CENTER DILLIN 6 0% 0 6RENT-A-CENTER-WAHIAW 0 0% 0 0RENT-A-CENTER-WAIANA 1 0% 0 1RENT-A-CENTER-WAIPAH 1 0% 0 1RESTAURANT EQUIPMENT 10 0% 0 10REY'S CONSTRUCTION 2 0% 0 2ROBERTS TOUR & TRANS 0 0% 0 0ROLLOFFS HAWAII 30059 54,913 65% 19,426 10,633ROSS' APPLIANCES & F 180 0% 0 180RRR RECYCLING SERVIC 74 218 75% 55 19S & D INC 1 0% 0 1S & S DELIVERY INC 14 0% 0 14S M P ENTERPRISES IN 1 0% 0 1S W & SONS INC 1 0% 0 1SALVATION ARMY 2159 0% 0 2,159SAN CONSTRUCTION LLC 22 0% 0 22SCALE - HOMEOWNER 423 0% 0 423SCALE-ELEEMOSYNARY 358 0% 0 358SCHRADER REALTY 1 0% 0 1SCOTTY'S CLEANING 1 0% 0 1SD SYSTEMS INC 231 653 74% 171 60SEDAN-ELEEMOSYNARY 7 0% 0 7SEDAN-HOMEOWNER 0SERTA MATTRESS CO 5 0% 0 5SHAFERS ROOFING 3 0% 0 3SHERATON MOANA SURF 1 0% 0 1SHIMMON RICHARD K 1 0% 0 1SHINCO MANAGEMENT IN 77 0% 0 77
Page TB-8

2006 WASTE CHARACTERIZATION STUDY
Table B-1 Appendix BCalculation of Waste Rerouted to Waimanalo Gulch Landfill from H-POWER Due to Closure
Hauler NameWGL Total
(tons)
H-POWER Total (tons)
HP Percent
WGL Total due to
Reroute
WGL Total
typical
H-POWER
Total (tons)
HP Percent
WGL Total due to
Reroute
WGL Total
typical
WGL Total due to
Reroute
WGL Total
typical
Commercial Residential Convenience Center
SHIROKIYA 2 0% 0 2SHRED-IT 2 0% 0 2SIMMONS CO 5 0% 0 5SRG FIRE SERVICES 1 0% 0 1STATE- DLNR-WATER & 5 0% 0 5STATE-CENTRAL SERVIC 104 0% 0 104STATE-DOE-FACILITIES 9 0% 0 9STATE-DOE-OPERATIONS 47 0% 0 47STATE-HARBORS DIV-OA 263 449 63% 166 97STATE-HIGHWAYS DIVIS 80 21 21% 17 63STATE-HOUSING & COMM 275 0% 0 275STATE-MALUHIA HOSPIT 0 0% 0 0STATE-PARKS DIVISION 19 0% 0 19STATE-SURPLUS PROPER 4 0% 0 4STERLING'S CARPET 4 0% 0 4SUGARLAND FARMS INC 95 0% 0 95SUN INDUSTRIES INC 3 0% 0 3TAJIRI DEMOLITION & 210 0% 0 210TG HAULAWAY LLC 36 84 70% 25 11THE CHERRY COMPANY L 1 0% 0 1THE OFFICE DOCTOR IN 5 0% 0 5THE STORAGE ROOM 56 0% 0 56THURSTON PACIFIC INC 14 0% 0 14TNT EQUIPMENT RENTAL 52 0% 0 52TOM'S SEAFOOD LLC 1 0% 0 1TONYS LANDSCAPE & TR 5 0% 0 5TR SYSTEMS LLC 923 2,274 71% 656 266UH-CAMPUS OPERATIONS 388 1,123 74% 289 100UH-WINDWARD COMM COL 1 0% 0 1UNITEK SOLVENT SERVI 2691 0% 0 2,691UNIVERSAL MANUFACTUR 43 0% 0 43US-AAFES HAWAII ATTN 2 0% 0 2US-DIR OF RESOURCE M 3 0% 0 3
Page TB-9

2006 WASTE CHARACTERIZATION STUDY
Table B-1 Appendix BCalculation of Waste Rerouted to Waimanalo Gulch Landfill from H-POWER Due to Closure
Hauler NameWGL Total
(tons)
H-POWER Total (tons)
HP Percent
WGL Total due to
Reroute
WGL Total
typical
H-POWER
Total (tons)
HP Percent
WGL Total due to
Reroute
WGL Total
typical
WGL Total due to
Reroute
WGL Total
typical
Commercial Residential Convenience Center
US-DRMO HI OFFICER I 51 0% 0 51US-FISH & WILDLIFE S 0 0% 0 0US-HOMELAND SECURITY 0 0% 0 0US-NAVFAC HAWAII 2 0% 0 2US-NAVY SPINTCOM 1 0% 0 1VAKAUTA, ALEKISIO F 1 0% 0 1VIDEO VEND INC 7 0% 0 7W D I CO 10 0% 0 10W GAYLORD & SONS MOV 40 0% 0 40WAHIAWA CONVENIENCE 5940 0 5940WAHINE BUILDERS 3 0% 0 3WAIANAE COAST COMPRE 2 0% 0 2WAIANAE CONVENIENCE 5812 0 5812WAIMANALO CONVENIENC 110 0 110WAIPAHU CONVENIENCE 10493 0 10493WATERHOUSE INC 0 0% 0 0WAYNES CARPET HUT 286 0% 0 286WEBCO HAWAII INC 14 0% 0 14WESTPAC INTERNATIONA 109 168 61% 66 43WOOD SHAVINGS & SUPP 1566 0% 0 1,566WORLD WIDE MOVING & 11 0% 0 11YAMATO TRANSPORT USA 2 0% 0 2YAN MING REN 0 0% 0 0YOUNG, D W SERVICES 0 0% 0 0
Total actual waste disposed of at WGL 191,677 116,791 29,199Total typical waste at WGL with no H-Power Diversions 114,298 40,367 29,199Total diverted waste to WGL during H-Power closure 77,379 76,424 0
Page TB-10