2006 annual report bache commodity indexsm built for commodity investors the bache commodity indexsm...
TRANSCRIPT
1
The Bache Commodity Indexsm
2006 Annual Report
Bache’s Global Commodities Group
The Bache Commodity Indexsm
Built for Commodity Investors The Bache Commodity Indexsm (BCIsm) is a transparent, fully investable commodity index. Our unique method of constructing the index is expected to result in lower turnover and lower risk than other commodity indexes, while maintaining the potential returns. Predictable, Consistent Exposure The BCIsm is designed so that the Index does not become dominated by a single commodity sector or by several commodities within a commodity sector. This is accomplished by employing upper and lower bounds on investment in each sector and each commodity, and by rebalancing the BCIsm each day to maintain the desired exposure to each commodity market. BCIsm Benefits from Multiple Sources of Return The BCIsm is designed to capture more sources of return to investing in commodities than are available with existing commodity indexes. In our historical tests1, our asset allocation and roll methods contributed an additional 45% to the total return over a 15-year period. Momentum means greater return, less risk Commodity markets have historically exhibited short-term momentum. Our view is that using momentum to decide which positions to reduce and which to increase is more profitable than holding fixed positions. By tactically reducing the risk of different commodities, the BCIsm holds an average of 30% less exposure than a fully invested strategy. As a result, the volatility of the BCIsm is expected to be roughly 30% less than equivalent indexes. Diversification, inflation hedge for portfolios Like other commodity indexes on the market, the BCIsm offers positive returns, may offer some inflation protection, and diversification benefits. Unlike other indexes, the BCIsm offers these benefits while potentially diminishing the downside risk that can occur with commodity investing.
21 See disclosure on page 16
Table of Contents
1. Performance Summary1 2. Index Changes Implemented in 2006 3. Return Attribution1 4. Economic Environment for Commodities 5. Global Forecasts for 2007 6. Summary
Appendices 1. BCIsm Components 2. Weights of BCIsm Commodities and Sub-indices 3. Rolling schedule of BCIsm commodities 4. Monthly Pro Forma BCIsm Returns 1991-20061
This report was prepared by Alternative Investment Analytics LLC under the direction of Bache Commodities Limited. Bache Commodities Limited is authorised and regulated by the Financial Services Authority.
31 See disclosure on page 16
2006 Annual Report
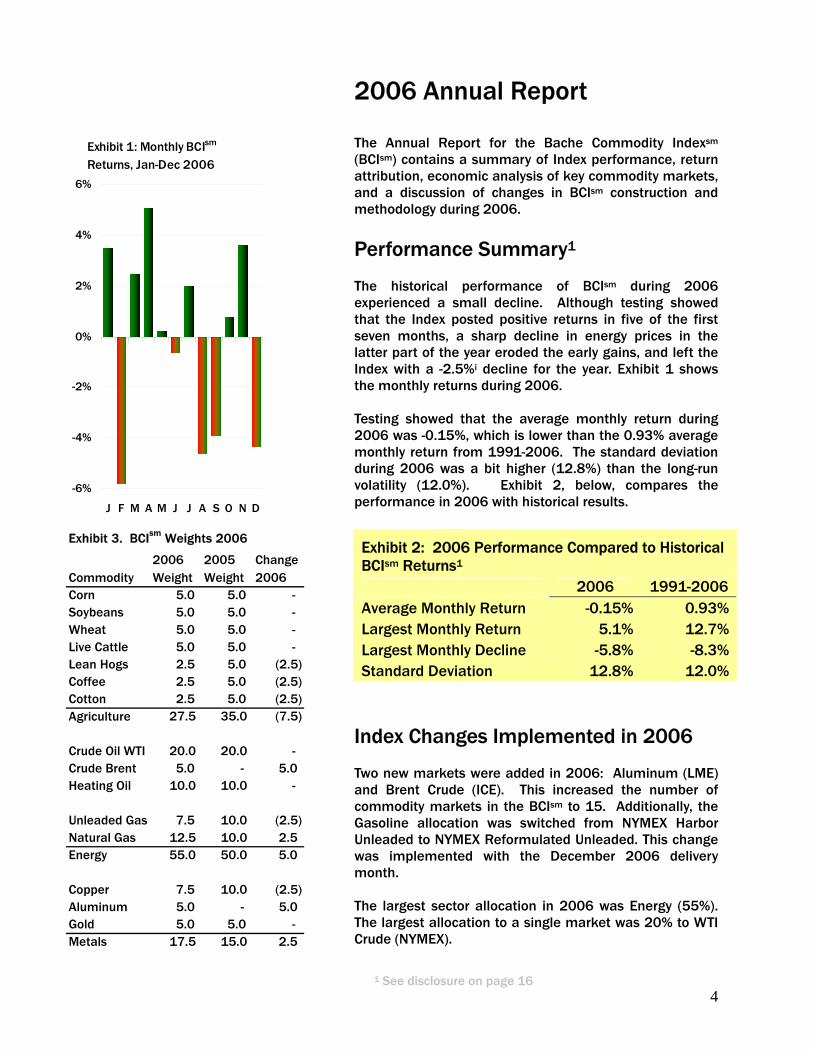
Exhibit 1: Monthly BCIsm
Returns, Jan-Dec 2006
-6%
-4%
-2%
0%
2%
4%
6%
J F M A M J J A S O N D
The Annual Report for the Bache Commodity Indexsm (BCIsm) contains a summary of Index performance, return attribution, economic analysis of key commodity markets, and a discussion of changes in BCIsm construction and methodology during 2006.
Performance Summary1
The historical performance of BCIsm during 2006 experienced a small decline. Although testing showed that the Index posted positive returns in five of the first seven months, a sharp decline in energy prices in the latter part of the year eroded the early gains, and left the Index with a -2.5%i decline for the year. Exhibit 1 shows the monthly returns during 2006. Testing showed that the average monthly return during 2006 was -0.15%, which is lower than the 0.93% average monthly return from 1991-2006. The standard deviation during 2006 was a bit higher (12.8%) than the long-run volatility (12.0%). Exhibit 2, below, compares the performance in 2006 with historical results.
Commodity2006 Weight
2005 Weight
Change 2006
Corn 5.0 5.0 - Soybeans 5.0 5.0 - Wheat 5.0 5.0 - Live Cattle 5.0 5.0 - Lean Hogs 2.5 5.0 (2.5)Coffee 2.5 5.0 (2.5)Cotton 2.5 5.0 (2.5)Agriculture 27.5 35.0 (7.5)
Crude Oil WTI 20.0 20.0 - Crude Brent 5.0 - 5.0 Heating Oil 10.0 10.0 -
Unleaded Gas 7.5 10.0 (2.5)Natural Gas 12.5 10.0 2.5 Energy 55.0 50.0 5.0
Copper 7.5 10.0 (2.5)Aluminum 5.0 - 5.0 Gold 5.0 5.0 - Metals 17.5 15.0 2.5
Exhibit 3. BCIsm Weights 2006Exhibit 2: 2006 Performance Compared to Historical BCIsm Returns1
2006 1991-2006 Average Monthly Return -0.15% 0.93% Largest Monthly Return 5.1% 12.7% Largest Monthly Decline -5.8% -8.3% Standard Deviation 12.8% 12.0%
Index Changes Implemented in 2006 Two new markets were added in 2006: Aluminum (LME) and Brent Crude (ICE). This increased the number of commodity markets in the BCIsm to 15. Additionally, the Gasoline allocation was switched from NYMEX Harbor Unleaded to NYMEX Reformulated Unleaded. This change was implemented with the December 2006 delivery month. The largest sector allocation in 2006 was Energy (55%). The largest allocation to a single market was 20% to WTI Crude (NYMEX).
41 See disclosure on page 16
A change in the minimum allowable allocation to a commodity market was implemented at the start of 2006. The smallest allocation was reduced to 2.5% from 5.0%. This change allowed for greater diversification in the Index.
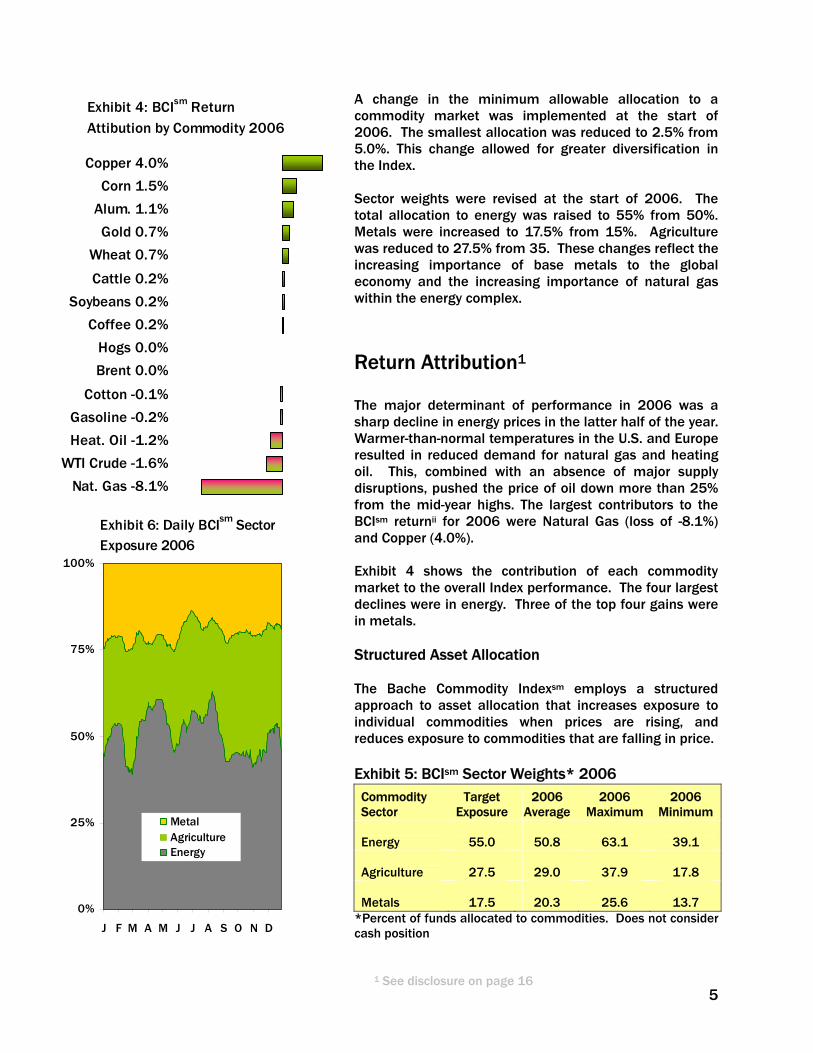
Exhibit 4: BCIsm Return Attibution by Commodity 2006
Copper 4.0%
Corn 1.5%
Alum. 1.1%
Gold 0.7%
Wheat 0.7%
Cattle 0.2%
Soybeans 0.2%
Coffee 0.2%
Hogs 0.0%
Brent 0.0%
Cotton -0.1%
Gasoline -0.2%
Heat. Oil -1.2%
WTI Crude -1.6%
Nat. Gas -8.1%
Sector weights were revised at the start of 2006. The total allocation to energy was raised to 55% from 50%. Metals were increased to 17.5% from 15%. Agriculture was reduced to 27.5% from 35. These changes reflect the increasing importance of base metals to the global economy and the increasing importance of natural gas within the energy complex.
Return Attribution1
The major determinant of performance in 2006 was a sharp decline in energy prices in the latter half of the year. Warmer-than-normal temperatures in the U.S. and Europe resulted in reduced demand for natural gas and heating oil. This, combined with an absence of major supply disruptions, pushed the price of oil down more than 25% from the mid-year highs. The largest contributors to the BCIsm returnii for 2006 were Natural Gas (loss of -8.1%) and Copper (4.0%).
Exhibit 6: Daily BCIsm Sector Exposure 2006
0%
25%
50%
75%
100%
J F M A M J J A S O N D
MetalAgricultureEnergy
Exhibit 4 shows the contribution of each commodity market to the overall Index performance. The four largest declines were in energy. Three of the top four gains were in metals. Structured Asset Allocation The Bache Commodity Indexsm employs a structured approach to asset allocation that increases exposure to individual commodities when prices are rising, and reduces exposure to commodities that are falling in price. Exhibit 5: BCIsm Sector Weights* 2006
Commodity Sector
Target Exposure
2006 Average
2006 Maximum
2006 Minimum
Energy
55.0
50.8
63.1
39.1
Agriculture
27.5
29.0
37.9
17.8
Metals
17.5
20.3
25.6
13.7 *Percent of funds allocated to commodities. Does not consider cash position
51 See disclosure on page 16
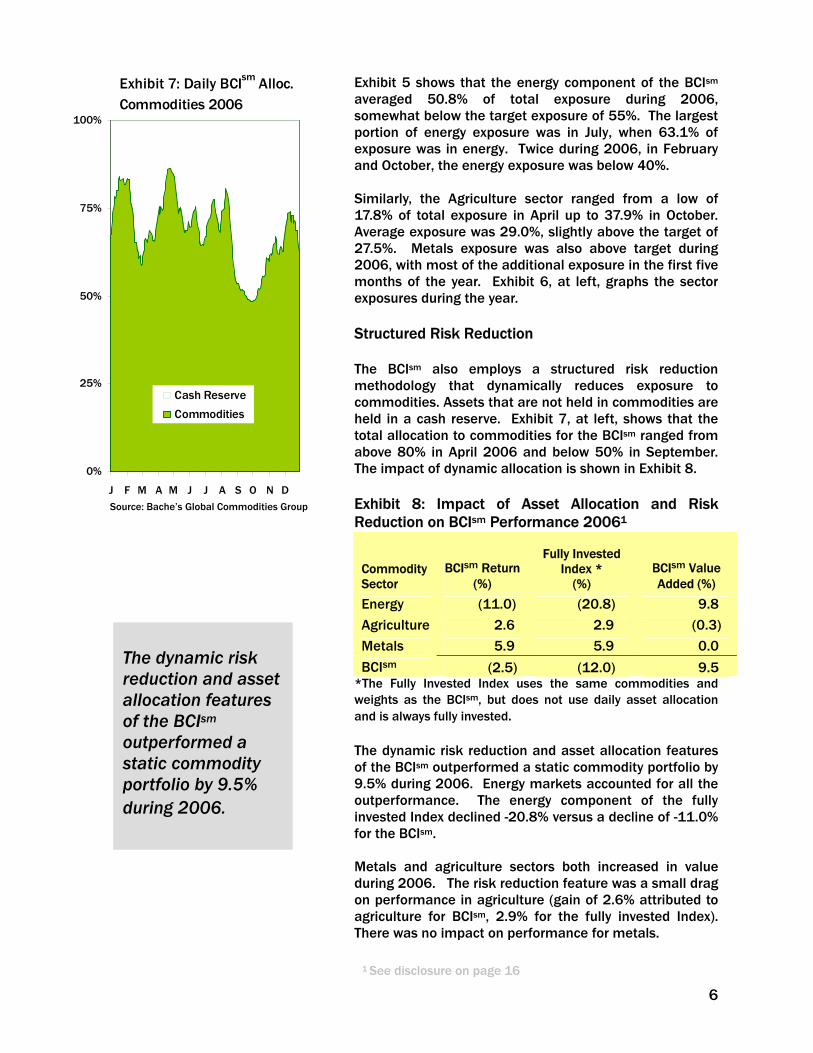
Exhibit 7: Daily BCIsm Alloc. Commodities 2006
0%
25%
50%
75%
100%
J F M A M J J A S O N D
Cash Reserve
Commodities
Exhibit 5 shows that the energy component of the BCIsm averaged 50.8% of total exposure during 2006, somewhat below the target exposure of 55%. The largest portion of energy exposure was in July, when 63.1% of exposure was in energy. Twice during 2006, in February and October, the energy exposure was below 40%. Similarly, the Agriculture sector ranged from a low of 17.8% of total exposure in April up to 37.9% in October. Average exposure was 29.0%, slightly above the target of 27.5%. Metals exposure was also above target during 2006, with most of the additional exposure in the first five months of the year. Exhibit 6, at left, graphs the sector exposures during the year. Structured Risk Reduction The BCIsm also employs a structured risk reduction methodology that dynamically reduces exposure to commodities. Assets that are not held in commodities are held in a cash reserve. Exhibit 7, at left, shows that the total allocation to commodities for the BCIsm ranged from above 80% in April 2006 and below 50% in September. The impact of dynamic allocation is shown in Exhibit 8. Exhibit 8: Impact of Asset Allocation and Risk Reduction on BCIsm Performance 20061
Source: Bache’s Global Commodities Group G
Commodity Sector
BCIsm Return (%)
Fully Invested
Index * (%)
BCIsm Value Added (%)
Energy (11.0) (20.8) 9.8
Agriculture 2.6 2.9 (0.3)
Metals 5.9 5.9 0.0
BCIsm (2.5) (12.0) 9.5
The dynamic risk reduction and asset allocation features of the BCIsm
outperformed a static commodity portfolio by 9.5% during 2006.
*The Fully Invested Index uses the same commodities and weights as the BCIsm, but does not use daily asset allocation and is always fully invested. The dynamic risk reduction and asset allocation features of the BCIsm outperformed a static commodity portfolio by 9.5% during 2006. Energy markets accounted for all the outperformance. The energy component of the fully invested Index declined -20.8% versus a decline of -11.0% for the BCIsm. Metals and agriculture sectors both increased in value during 2006. The risk reduction feature was a small drag on performance in agriculture (gain of 2.6% attributed to agriculture for BCIsm, 2.9% for the fully invested Index). There was no impact on performance for metals.
6
1 See disclosure on page 16
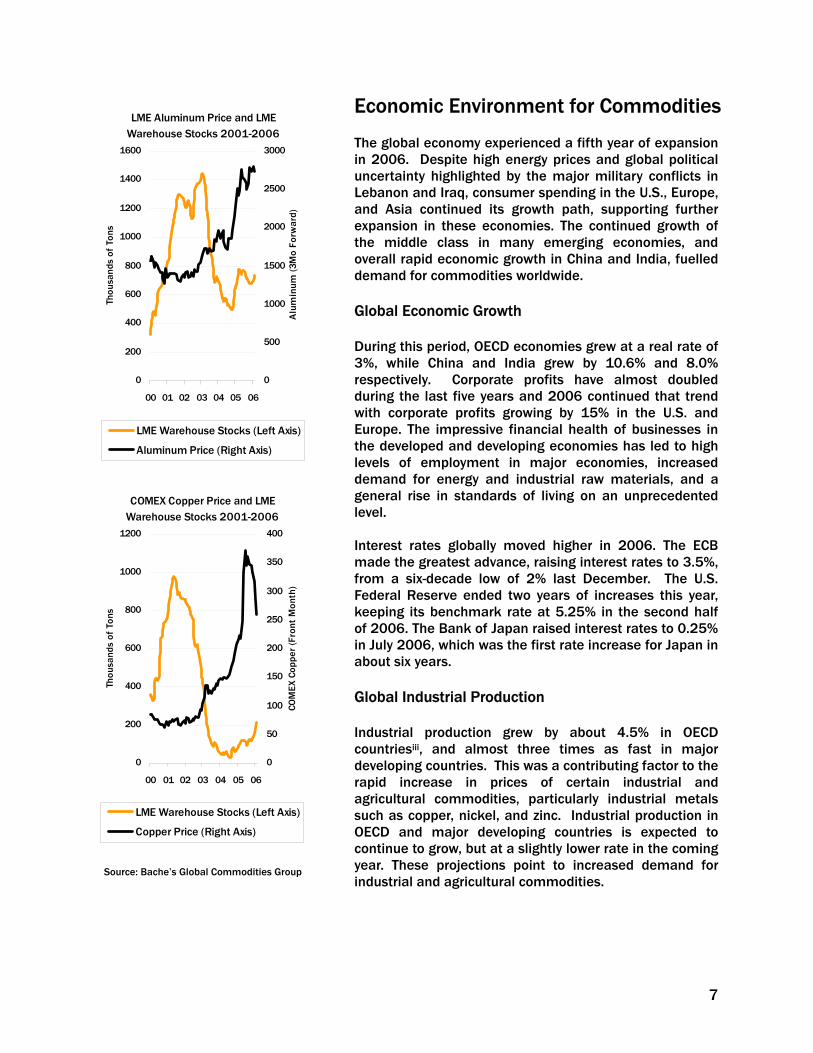
Economic Environment for Commodities LME Aluminum Price and LME
Warehouse Stocks 2001-2006
1000
1200
1400
1600
ons 2000
2500
3000
rwar
d
The global economy experienced a fifth year of expansion in 2006. Despite high energy prices and global political uncertainty highlighted by the major military conflicts in Lebanon and Iraq, consumer spending in the U.S., Europe, and Asia continued its growth path, supporting further expansion in these economies. The continued growth of the middle class in many emerging economies, and overall rapid economic growth in China and India, fuelled demand for commodities worldwide.
)
0
200
400
600
800
00 01 02 03 04 05 06
Thou
sand
s of
T
0
500
1000
1500
Alu
min
um (3
Mo
Fo Global Economic Growth During this period, OECD economies grew at a real rate of 3%, while China and India grew by 10.6% and 8.0% respectively. Corporate profits have almost doubled during the last five years and 2006 continued that trend with corporate profits growing by 15% in the U.S. and Europe. The impressive financial health of businesses in the developed and developing economies has led to high levels of employment in major economies, increased demand for energy and industrial raw materials, and a general rise in standards of living on an unprecedented level.
LME Warehouse Stocks (Left Axis)
Aluminum Price (Right Axis)
COMEX Copper Price and LME Warehouse Stocks 2001-2006
800
1000
1200
Ton
s
250
300
350
400
ront
Mon
th)
Interest rates globally moved higher in 2006. The ECB made the greatest advance, raising interest rates to 3.5%, from a six-decade low of 2% last December. The U.S. Federal Reserve ended two years of increases this year, keeping its benchmark rate at 5.25% in the second half of 2006. The Bank of Japan raised interest rates to 0.25% in July 2006, which was the first rate increase for Japan in about six years.
0
200
400
600
00 01 02 03 04 05 06
Thou
sand
s of
0
50
100
150
200
COM
EX C
oppe
r (F
LME Warehouse Stocks (Left Axis)
Copper Price (Right Axis)
Global Industrial Production Industrial production grew by about 4.5% in OECD countriesiii, and almost three times as fast in major developing countries. This was a contributing factor to the rapid increase in prices of certain industrial and agricultural commodities, particularly industrial metals such as copper, nickel, and zinc. Industrial production in OECD and major developing countries is expected to continue to grow, but at a slightly lower rate in the coming year. These projections point to increased demand for industrial and agricultural commodities.
Source: Bache’s Global Commodities Group
7
In addition to continued demand for metals, industrial demand for corn and sugar will increase as production for alternative fuels continues to rise. Demand for livestock is projected to increase, driven by increased wealth in developing economies.
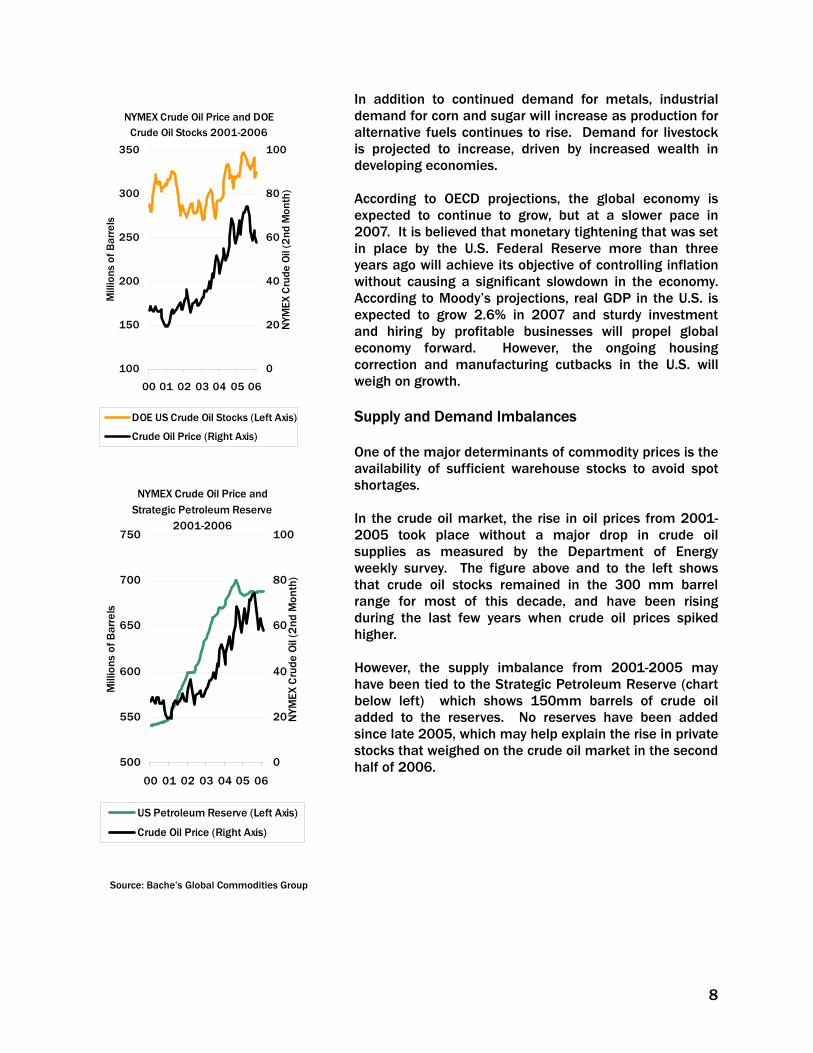
NYMEX Crude Oil Price and Strategic Petroleum Reserve
2001-2006
650
700
750
s of
Bar
rels
60
80
100
e O
il (2
nd M
onth
)
500
550
600
00 01 02 03 04 05 06
Mill
ion
0
20
40
NYM
EX C
rud
US Petroleum Reserve (Left Axis)
Crude Oil Price (Right Axis)
NYMEX Crude Oil Price and DOE Crude Oil Stocks 2001-2006
250
300
350
ons
of B
arre
ls
60
80
100
ude
Oil
(2nd
Mon
th)
According to OECD projections, the global economy is expected to continue to grow, but at a slower pace in 2007. It is believed that monetary tightening that was set in place by the U.S. Federal Reserve more than three years ago will achieve its objective of controlling inflation without causing a significant slowdown in the economy. According to Moody’s projections, real GDP in the U.S. is expected to grow 2.6% in 2007 and sturdy investment and hiring by profitable businesses will propel global economy forward. However, the ongoing housing correction and manufacturing cutbacks in the U.S. will weigh on growth.
100
150
200
00 01 02 03 04 05 06
Mill
i
0
20
40N
YMEX
Cr
DOE US Crude Oil Stocks (Left Axis)
Crude Oil Price (Right Axis)
Supply and Demand Imbalances One of the major determinants of commodity prices is the availability of sufficient warehouse stocks to avoid spot shortages. In the crude oil market, the rise in oil prices from 2001-2005 took place without a major drop in crude oil supplies as measured by the Department of Energy weekly survey. The figure above and to the left shows that crude oil stocks remained in the 300 mm barrel range for most of this decade, and have been rising during the last few years when crude oil prices spiked higher. However, the supply imbalance from 2001-2005 may have been tied to the Strategic Petroleum Reserve (chart below left) which shows 150mm barrels of crude oil added to the reserves. No reserves have been added since late 2005, which may help explain the rise in private stocks that weighed on the crude oil market in the second half of 2006.
Source: Bache’s Global Commodities Group
8
A multi-year decline in metals warehouse stocks appears to be easing, with both aluminum and copper stocks finishing 2006 near the highest level in two years. Charts comparing warehouse stocks of copper and aluminum to the prices of the metals can be found on page 7 of this report.
2006 Commodity News Highlights Crude Ends Four-Year Rally Crude oil ended a four-year rally in 2006. Oil was unchanged in 2006 at $61 per barrel in New York after increasing 40% in 2005, and 36% in 2004. Oil reached a record high of $78.40 in New York in mid-July on during fighting between Israel and Hezbollah militants. Gold Sets 26-year High The dollar’s weakness versus the euro in 2006 helped drive up gold prices by 23%. Gold ended the year at $636 after reaching a 26-year high of $732 an ounce in May on demand from investors. Copper Gains for Fifth Straight Year Copper gained 44% in London in 2006, a fifth consecutive annual increase, to end the year at $2.85/lb. This growth attracted investment from hedge funds and pension funds. Continued demand from China also helped support prices. Copper had gained 41% in 2005, 39% in 2004 and 49% in 2003. Corn Boosted by Ethanol Demand Corn prices surged 78% in 2006, driven by record demand for the use of the grain in ethanol and strong overseas demand for U.S. supplies. Ethanol use is seen to have jumped more than a third in 2006.
Global Markets and Corporate Profitability Global equity markets displayed robust growth during 2006, with many major indices hitting all-time or multi-year highs. During this period, the MSCI World Index earned a total rate of return of 17.9%, which followed a gain of 7.9% in 2005. Most major market indicators experienced double-digit gains in 2006. In the U.S., the S&P 500 gained 14%, the Dow Jones Industrial Average rose 16%, and the NASDAQ increased 9.5%. In Europe, the DJ Stoxx 600 index gained 18%. In Asia, the MSCI Asia-Pacific increased 15%. Emerging markets also continued to experience strong growth, with the MSCI Emerging Markets Index climbing 15%. Equity markets are often used as a leading indicator for future economic growth. Performance of global equities in 2006 portends continued economic expansion and a continued demand for energy and industrial materials. Currency Markets The dollar continued to weaken this year, falling 8.1% against a Bloomberg-calculated basket of six currencies such as the euro and the yen in 2006, the fourth decline in five years. At the same time, the dollar gained 1.1% against the yen in 2006.iv The euro increased 12.6% against the yen and 11.4% against the dollar this year, supported by expectations that the ECB would outpace the U.S. Federal Reserve and the Bank of Japan in raising rates.
Global Forecasts for 2007 U.S. short-term interest rates steadily increased from 4.4% to 5% during 2006, while long-term rates moved between 4.5% and 5.3% during the same period. Starting in July 2006, an inverted yield curve has prevailed in the U.S., which has led some to speculate that the chances of a significant economic slowdown have significantly increased.
Source: Bache Global Commodities
9
Such an economic scenario may reduce the upward pressure on prices of energy products and industrial commodities next year. However, there is no consensus among economists that similar to previous instances, the currently observed inverted yield curve is foretelling a slow-down in economic activity. It is argued that a glut of global savings in both private and public sectors have put downward pressure on long-term rates, leading to an inverted yield curve. According to OECD projections, the global economy is expected to continue to grow, but at a slower pace in 2007. It is believed that monetary tightening that was set in place by the U.S. Federal Reserve more than three years ago will achieve its objective of controlling inflation without causing a significant slowdown in the economy.
Summary The Bache Commodity Indexsm is a transparent, fully investable commodity index with a structured risk reduction methodology that dynamically increases exposure to individual commodities when prices are rising, and reduces exposure to commodities that are falling in price. In addition, assets that are not held in commodities are held in a cash reserve. This unique method of constructing the Index is expected to result in lower expected turnover and lower expected risk than other existing commodity indexes, while maintaining the potential returns. Our testing showed that in 2006, the BCIsm experienced a 2.5% decline for the year1 however, the dynamic risk reduction and asset allocation features outperformed a static portfolio by 9.5%.
1 See disclosure on page 16
10
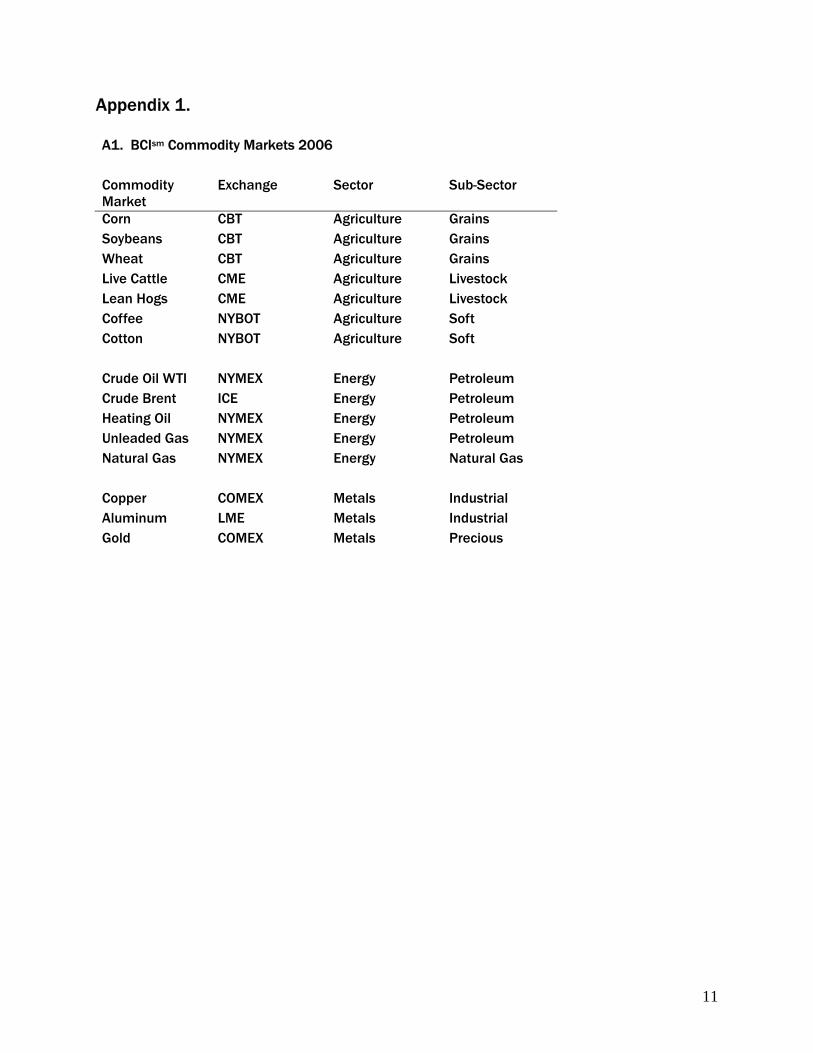
Appendix 1. A1. BCIsm Commodity Markets 2006 Commodity Market
Exchange Sector Sub-Sector
Corn CBT Agriculture Grains Soybeans CBT Agriculture Grains Wheat CBT Agriculture Grains Live Cattle CME Agriculture Livestock Lean Hogs CME Agriculture Livestock Coffee NYBOT Agriculture Soft Cotton NYBOT Agriculture Soft Crude Oil WTI NYMEX Energy Petroleum Crude Brent ICE Energy Petroleum Heating Oil NYMEX Energy Petroleum Unleaded Gas NYMEX Energy Petroleum Natural Gas NYMEX Energy Natural Gas Copper COMEX Metals Industrial Aluminum LME Metals Industrial Gold COMEX Metals Precious
11
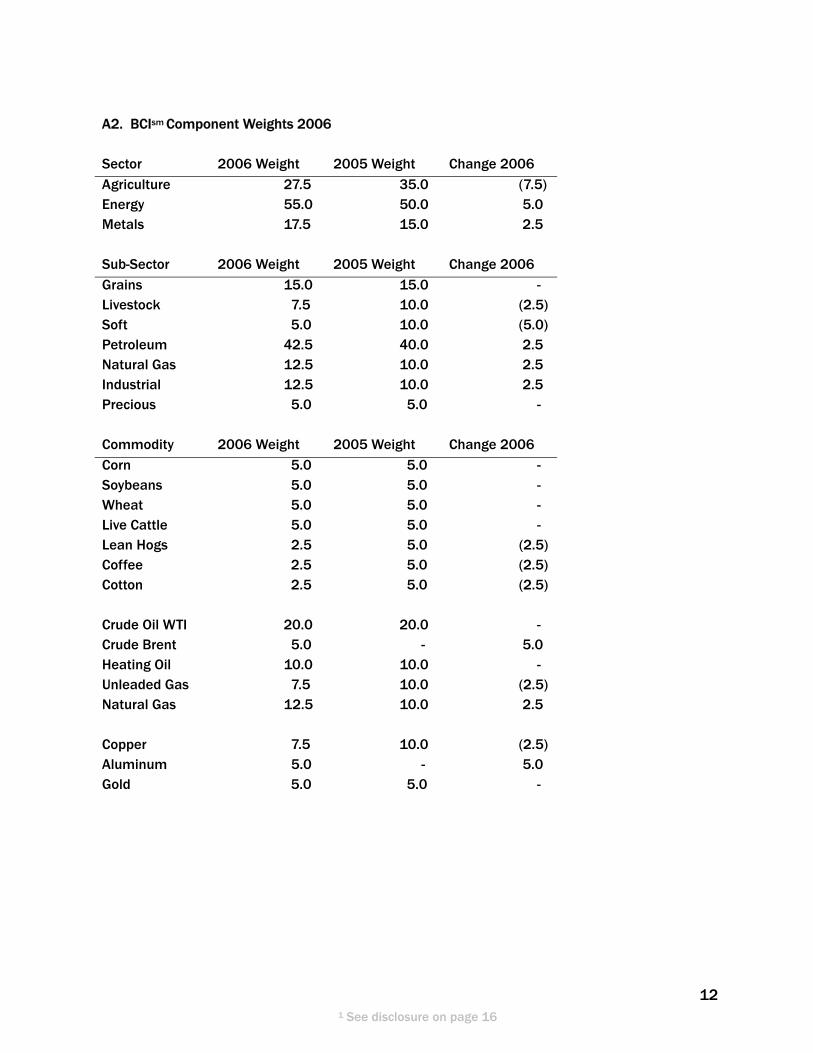
12
A2. BCIsm Component Weights 2006 Sector 2006 Weight 2005 Weight Change 2006 Agriculture 27.5 35.0 (7.5) Energy 55.0 50.0 5.0 Metals 17.5 15.0 2.5
Sub-Sector 2006 Weight 2005 Weight Change 2006 Grains 15.0 15.0 - Livestock 7.5 10.0 (2.5) Soft 5.0 10.0 (5.0) Petroleum 42.5 40.0 2.5 Natural Gas 12.5 10.0 2.5 Industrial 12.5 10.0 2.5 Precious 5.0 5.0 -
Commodity 2006 Weight 2005 Weight Change 2006 Corn 5.0 5.0 - Soybeans 5.0 5.0 - Wheat 5.0 5.0 - Live Cattle 5.0 5.0 - Lean Hogs 2.5 5.0 (2.5) Coffee 2.5 5.0 (2.5) Cotton 2.5 5.0 (2.5) Crude Oil WTI 20.0 20.0 - Crude Brent 5.0 - 5.0 Heating Oil 10.0 10.0 - Unleaded Gas 7.5 10.0 (2.5) Natural Gas 12.5 10.0 2.5 Copper 7.5 10.0 (2.5) Aluminum 5.0 - 5.0 Gold 5.0 5.0 -
1 See disclosure on page 16
13
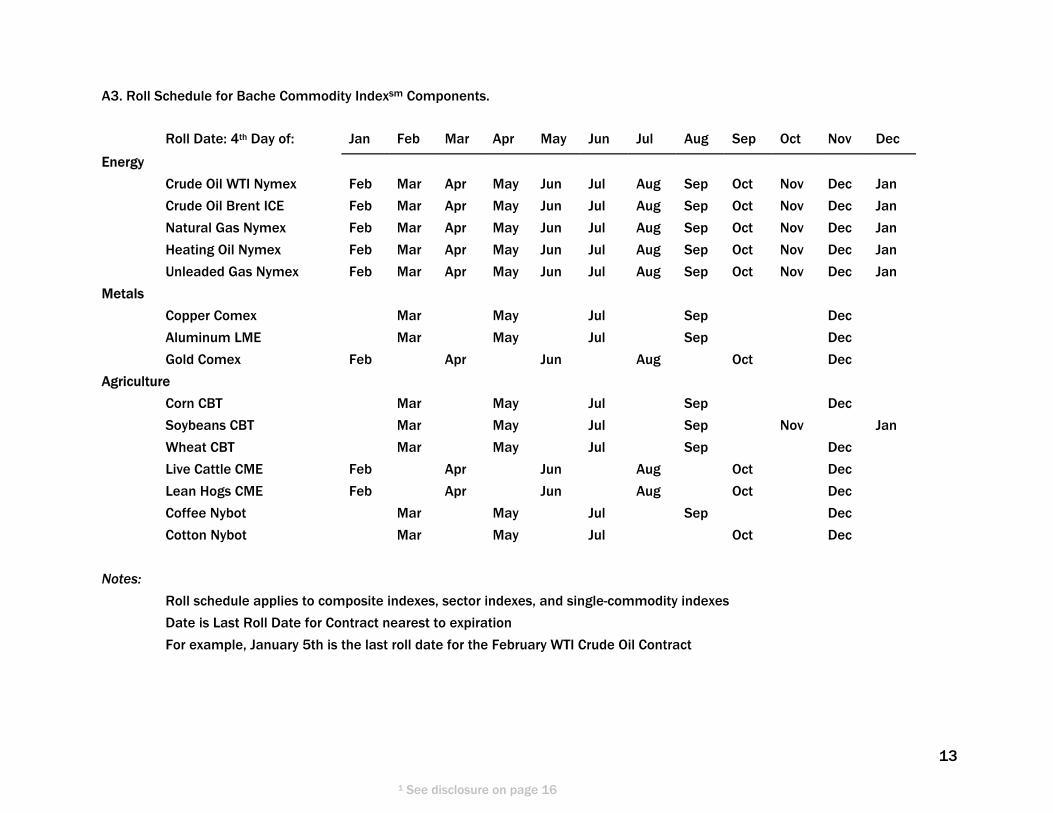
A3. Roll Schedule for Bache Commodity Indexsm Components.
Roll Date: 4th Day of: Jan Feb Mar Apr May Jun Jul Aug Sep Oct Nov Dec
Energy
Crude Oil WTI Nymex Feb Mar Apr May Jun Jul Aug Sep Oct Nov Dec Jan
Crude Oil Brent ICE Feb Mar Apr May Jun Jul Aug Sep Oct Nov Dec Jan
Natural Gas Nymex Feb Mar Apr May Jun Jul Aug Sep Oct Nov Dec Jan
Heating Oil Nymex Feb Mar Apr May Jun Jul Aug Sep Oct Nov Dec Jan
Unleaded Gas Nymex Feb Mar Apr May Jun Jul Aug Sep Oct Nov Dec Jan
Metals
Copper Comex Mar May Jul Sep Dec
Aluminum LME Mar May Jul Sep Dec
Gold Comex Feb Apr Jun Aug Oct Dec
Agriculture
Corn CBT Mar May Jul Sep Dec
Soybeans CBT Mar May Jul Sep Nov Jan
Wheat CBT Mar May Jul Sep Dec
Live Cattle CME Feb Apr Jun Aug Oct Dec
Lean Hogs CME Feb Apr Jun Aug Oct Dec
Coffee Nybot Mar May Jul Sep Dec
Cotton Nybot Mar May Jul Oct Dec
Notes:
Roll schedule applies to composite indexes, sector indexes, and single-commodity indexes
Date is Last Roll Date for Contract nearest to expiration
For example, January 5th is the last roll date for the February WTI Crude Oil Contract
1 See disclosure on page 16
14
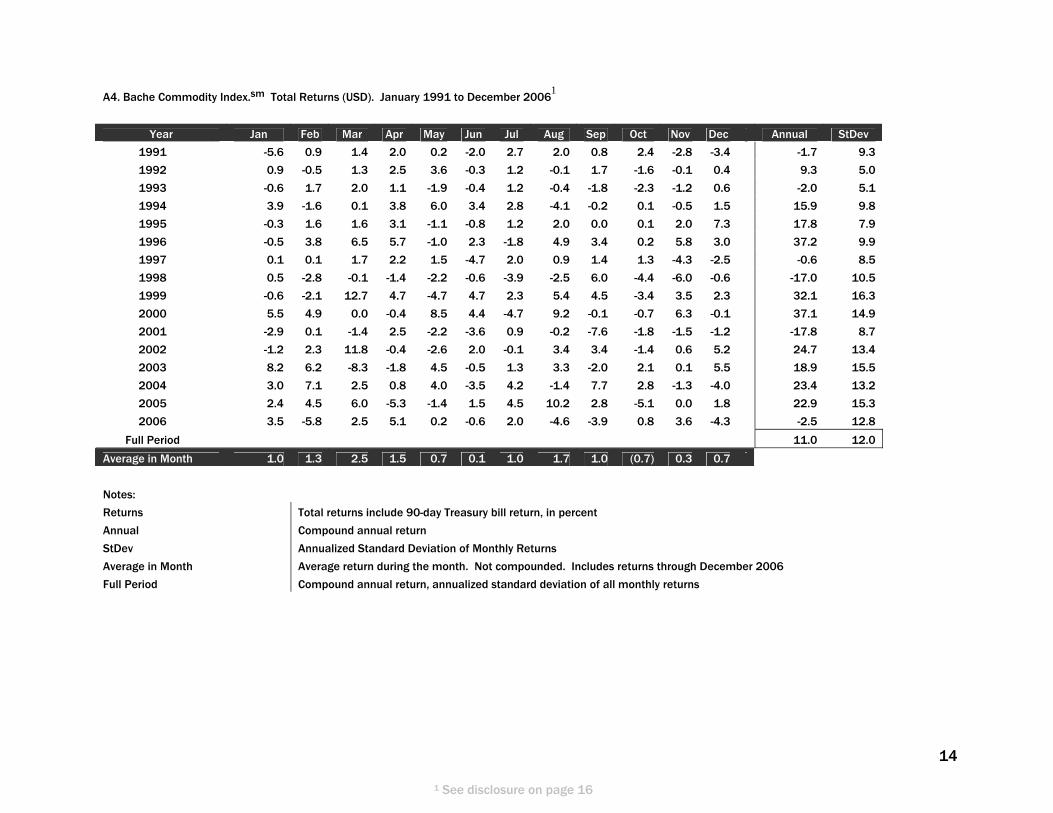
A4. Bache Commodity Index.sm Total Returns (USD). January 1991 to December 2006
1
Year Jan Feb Mar Apr May Jun Jul Aug Sep Oct Nov Dec Annual StDev
1991 -5.6 0.9 1.4 2.0 0.2 -2.0 2.7 2.0 0.8 2.4 -2.8 -3.4 -1.7 9.3
1992 0.9 -0.5 1.3 2.5 3.6 -0.3 1.2 -0.1 1.7 -1.6 -0.1 0.4 9.3 5.0
1993 -0.6 1.7 2.0 1.1 -1.9 -0.4 1.2 -0.4 -1.8 -2.3 -1.2 0.6 -2.0 5.1
1994 3.9 -1.6 0.1 3.8 6.0 3.4 2.8 -4.1 -0.2 0.1 -0.5 1.5 15.9 9.8
1995 -0.3 1.6 1.6 3.1 -1.1 -0.8 1.2 2.0 0.0 0.1 2.0 7.3 17.8 7.9
1996 -0.5 3.8 6.5 5.7 -1.0 2.3 -1.8 4.9 3.4 0.2 5.8 3.0 37.2 9.9
1997 0.1 0.1 1.7 2.2 1.5 -4.7 2.0 0.9 1.4 1.3 -4.3 -2.5 -0.6 8.5
1998 0.5 -2.8 -0.1 -1.4 -2.2 -0.6 -3.9 -2.5 6.0 -4.4 -6.0 -0.6 -17.0 10.5
1999 -0.6 -2.1 12.7 4.7 -4.7 4.7 2.3 5.4 4.5 -3.4 3.5 2.3 32.1 16.3
2000 5.5 4.9 0.0 -0.4 8.5 4.4 -4.7 9.2 -0.1 -0.7 6.3 -0.1 37.1 14.9
2001 -2.9 0.1 -1.4 2.5 -2.2 -3.6 0.9 -0.2 -7.6 -1.8 -1.5 -1.2 -17.8 8.7
2002 -1.2 2.3 11.8 -0.4 -2.6 2.0 -0.1 3.4 3.4 -1.4 0.6 5.2 24.7 13.4
2003 8.2 6.2 -8.3 -1.8 4.5 -0.5 1.3 3.3 -2.0 2.1 0.1 5.5 18.9 15.5
2004 3.0 7.1 2.5 0.8 4.0 -3.5 4.2 -1.4 7.7 2.8 -1.3 -4.0 23.4 13.2
2005 2.4 4.5 6.0 -5.3 -1.4 1.5 4.5 10.2 2.8 -5.1 0.0 1.8 22.9 15.3
2006 3.5 -5.8 2.5 5.1 0.2 -0.6 2.0 -4.6 -3.9 0.8 3.6 -4.3 -2.5 12.8
Full Period 11.0 12.0
Average in Month 1.0 1.3 2.5 1.5 0.7 0.1 1.0 1.7 1.0 (0.7) 0.3 0.7
Notes:
Returns Total returns include 90-day Treasury bill return, in percent
Annual Compound annual return
StDev Annualized Standard Deviation of Monthly Returns
Average in Month Average return during the month. Not compounded. Includes returns through December 2006
Full Period Compound annual return, annualized standard deviation of all monthly returns
1 See disclosure on page 16
15
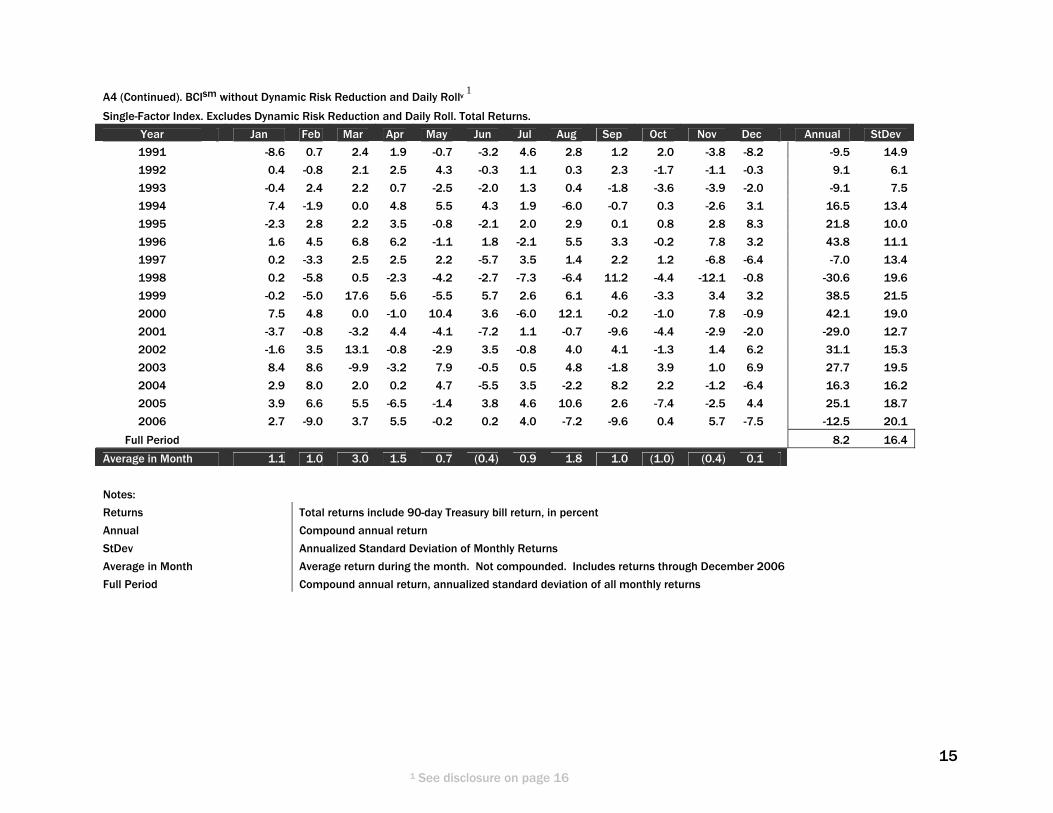
A4 (Continued). BCIsm without Dynamic Risk Reduction and Daily Rollv
1
Single-Factor Index. Excludes Dynamic Risk Reduction and Daily Roll. Total Returns.
Year Jan Feb Mar Apr May Jun Jul Aug Sep Oct Nov Dec Annual StDev
1991 -8.6 0.7 2.4 1.9 -0.7 -3.2 4.6 2.8 1.2 2.0 -3.8 -8.2 -9.5 14.9
1992 0.4 -0.8 2.1 2.5 4.3 -0.3 1.1 0.3 2.3 -1.7 -1.1 -0.3 9.1 6.1
1993 -0.4 2.4 2.2 0.7 -2.5 -2.0 1.3 0.4 -1.8 -3.6 -3.9 -2.0 -9.1 7.5
1994 7.4 -1.9 0.0 4.8 5.5 4.3 1.9 -6.0 -0.7 0.3 -2.6 3.1 16.5 13.4
1995 -2.3 2.8 2.2 3.5 -0.8 -2.1 2.0 2.9 0.1 0.8 2.8 8.3 21.8 10.0
1996 1.6 4.5 6.8 6.2 -1.1 1.8 -2.1 5.5 3.3 -0.2 7.8 3.2 43.8 11.1
1997 0.2 -3.3 2.5 2.5 2.2 -5.7 3.5 1.4 2.2 1.2 -6.8 -6.4 -7.0 13.4
1998 0.2 -5.8 0.5 -2.3 -4.2 -2.7 -7.3 -6.4 11.2 -4.4 -12.1 -0.8 -30.6 19.6
1999 -0.2 -5.0 17.6 5.6 -5.5 5.7 2.6 6.1 4.6 -3.3 3.4 3.2 38.5 21.5
2000 7.5 4.8 0.0 -1.0 10.4 3.6 -6.0 12.1 -0.2 -1.0 7.8 -0.9 42.1 19.0
2001 -3.7 -0.8 -3.2 4.4 -4.1 -7.2 1.1 -0.7 -9.6 -4.4 -2.9 -2.0 -29.0 12.7
2002 -1.6 3.5 13.1 -0.8 -2.9 3.5 -0.8 4.0 4.1 -1.3 1.4 6.2 31.1 15.3
2003 8.4 8.6 -9.9 -3.2 7.9 -0.5 0.5 4.8 -1.8 3.9 1.0 6.9 27.7 19.5
2004 2.9 8.0 2.0 0.2 4.7 -5.5 3.5 -2.2 8.2 2.2 -1.2 -6.4 16.3 16.2
2005 3.9 6.6 5.5 -6.5 -1.4 3.8 4.6 10.6 2.6 -7.4 -2.5 4.4 25.1 18.7
2006 2.7 -9.0 3.7 5.5 -0.2 0.2 4.0 -7.2 -9.6 0.4 5.7 -7.5 -12.5 20.1
Full Period 8.2 16.4
Average in Month 1.1 1.0 3.0 1.5 0.7 (0.4) 0.9 1.8 1.0 (1.0) (0.4) 0.1
Notes:
Returns Total returns include 90-day Treasury bill return, in percent
Annual Compound annual return
StDev Annualized Standard Deviation of Monthly Returns
Average in Month Average return during the month. Not compounded. Includes returns through December 2006
Full Period Compound annual return, annualized standard deviation of all monthly returns
1 See disclosure on page 16
Endnotes i BCIsm Returns quoted in this report are for the total return version of the index, which includes the return to a 3-Month Treasury Bill yield in addition to the return attributable to changes in the underlying futures contracts ii Return Attribution figures reflect the contribution of each commodity market to the BCIsm Total Return Return Attribution is determined by the change in commodity price, the effect of commodity rolls, the Treasury bill collateral return, and the weight of each commodity in the BCIsm. iii Source OECD iv Source Bloomberg LP v The BCIsm without Dynamic Risk Reduction and Daily Roll index calculated using the same weights and roll schedule as the BCIsm, but assumes that rolls take place at the end of the BCsm roll period (rather than the daily roll methodology actually employed by the BCIsm) and is also calculated without the dynamic risk reduction feature of the BCIsm. As such, the comparison index is always fully invested. The returns presented in this document were determined based on the pro forma calculations of the historical performance of the BCIsm. Because the BCIsm was not actually being calculated and published during these prior periods, and no actual trading was conducted in accordance with the BCIsm, these returns could be considered to be hypothetical performance results. Hypothetical performance results have many inherent limitations, some of which are described below. No representation is being made that any trading program or strategy will or is likely to achieve profits or losses similar to those shown. In fact, there are frequently sharp differences between hypothetical performance results and the actual results subsequently achieved.
One of the limitations of hypothetical performance results is that they are necessarily prepared with the benefit of hindsight and, if the BCIsm were actually being calculated and published during these periods, it might have been based on different criteria and a different methodology. Moreover, the market conditions that existed during prior periods will most likely not be repeated and this difference could adversely affect performance. There are numerous factors related to the markets in general or the implementation of any investment strategy, which cannot be fully accounted for in the preparation of hypothetical results and all of which can adversely affect actual trading results, including but not limited to market liquidity, general levels of interest rates and the effect on the relevant markets of political, economic or other external events. In addition, hypothetical performance results do not involve financial risk, and no hypothetical performance results can completely account for the impact of financial risk in actual performance.
The hypothetical performance results shown were derived from a model based on an asset allocation strategy and daily roll strategy. The hypothetical performance reflects the historical contract daily return plus daily interest on the funds hypothetically committed to the investment. The hypothetical performance returns are estimates using current and historical futures price data as described. Historical results should not and cannot be viewed as an indicator of future results. For a more complete description of the BCIsm, reference is made to The Guide to the Bache Commodity Indexsm.
The hypothetical performance results do not reflect any management fees, transaction costs or expenses which would reduce your actual return. Indexes are unmanaged and one cannot invest directly in an index. Past performance is no guarantee of future results.
The comments, opinions, and estimates contained in this document are based on, or derived from publicly available information from sources that Bache’s Global Commodities Group believes to be reliable. We do not guarantee their accuracy. This information is provided for informational purposes only and sets forth our views as of this date. The underlying assumptions, and these views are subject to change. There is no guarantee that the views expressed will be realized. Bache Commodities Group from time to time, issues reports based on fundamentals, such as expected trends in supply and demand,
16
as well as reports based on technical factors, such as price and volume movements. Since such reports rely upon different criteria, there may be instances when their conclusions are not in concert. Information for inclusion in, or for use in, the calculation of the Index is obtained from sources whose accuracy is believed to be reliable but which may be subject to errors in data sources. ©Copyright 2008 Bache Commodities. The Rock logo, BCIsm, Bache Commodity Indexsm are service marks of Bache Commodities Limited and its affiliates. Bache Commodities Limited is authorised and regulated by the Financial Services Authority. The methodology of, and intellectual property rights in, the Bache Commodity Indexsm are proprietary to, and owned by, PFDS Holdings, LLC and may be covered by one or more pending patent applications.
17