2005 interim results - santos - home · 2005 interim results 25 august 2005 2 disclaimer &...
TRANSCRIPT
1
1
Delivering GrowthDelivering Growth2005 Interim Results2005 Interim Results
25 August 200525 August 2005
2
Disclaimer & Important NoticeDisclaimer & Important Notice
This presentation contains forward looking statements that are sThis presentation contains forward looking statements that are subject to ubject to risk factors associated with the oil and gas industry. It is belrisk factors associated with the oil and gas industry. It is believed that the ieved that the expectations reflected in these statements are reasonable, but texpectations reflected in these statements are reasonable, but they may hey may be affected by a range of variables which could cause actual resbe affected by a range of variables which could cause actual results or ults or trends to differ materially, including but not limited to: pricetrends to differ materially, including but not limited to: price fluctuations, fluctuations, actual demand, currency fluctuations, geotechnical factors, drilactual demand, currency fluctuations, geotechnical factors, drilling and ling and production results, gas commercialisation, development progress,production results, gas commercialisation, development progress,operating results, engineering estimates, reserve estimates, losoperating results, engineering estimates, reserve estimates, loss of market, s of market, industry competition, environmental risks, physical risks, legisindustry competition, environmental risks, physical risks, legislative, fiscal lative, fiscal and regulatory developments, economic and financial markets condand regulatory developments, economic and financial markets conditions in itions in various countries, approvals and cost estimates.various countries, approvals and cost estimates.
All references to dollars, cents or $ in this document are to AuAll references to dollars, cents or $ in this document are to Australian stralian currency, unless otherwise stated.currency, unless otherwise stated.
2
3
AgendaAgenda
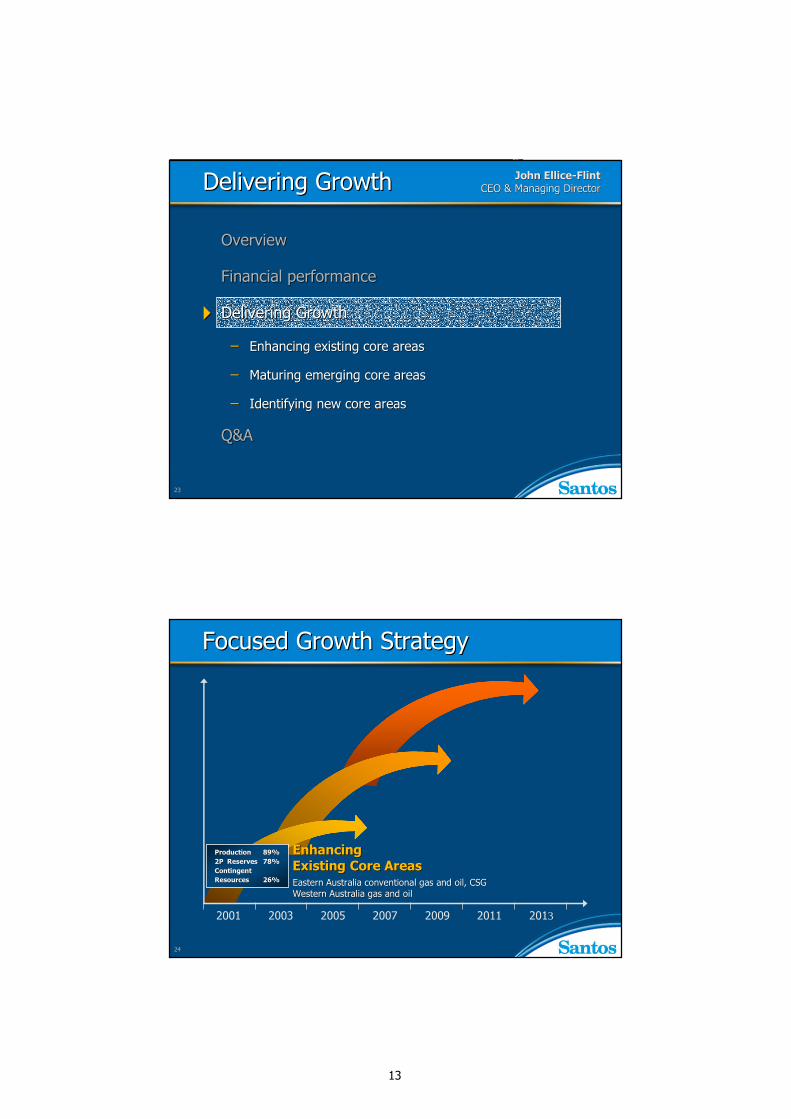
OverviewOverview
Financial performance Financial performance
Delivering Growth Delivering Growth
Enhancing existing core areasEnhancing existing core areas
Maturing emerging core areasMaturing emerging core areas
Identifying new core areasIdentifying new core areas
Q&AQ&A
4
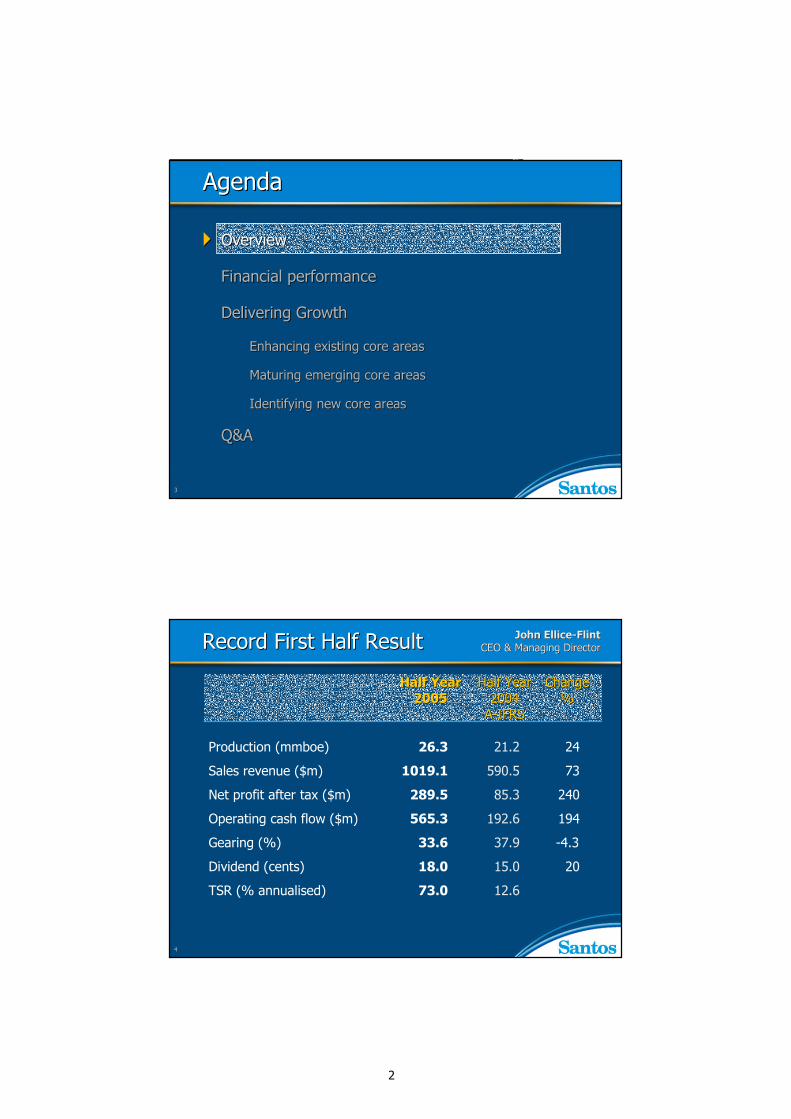
Record First Half ResultRecord First Half Result
Production (mmboe) 26.3 21.2 24
Sales revenue ($m) 1019.1 590.5 73
Net profit after tax ($m) 289.5 85.3 240
Operating cash flow ($m) 565.3 192.6 194
Gearing (%) 33.6 37.9 -4.3
Dividend (cents) 18.0 15.0 20
TSR (% annualised) 73.0 12.6
Half Year Half Year Half YearHalf Year ChangeChange20052005 20042004 %%
AA--IFRSIFRS
John ElliceJohn Ellice--FlintFlintCEO & Managing DirectorCEO & Managing Director
3
5
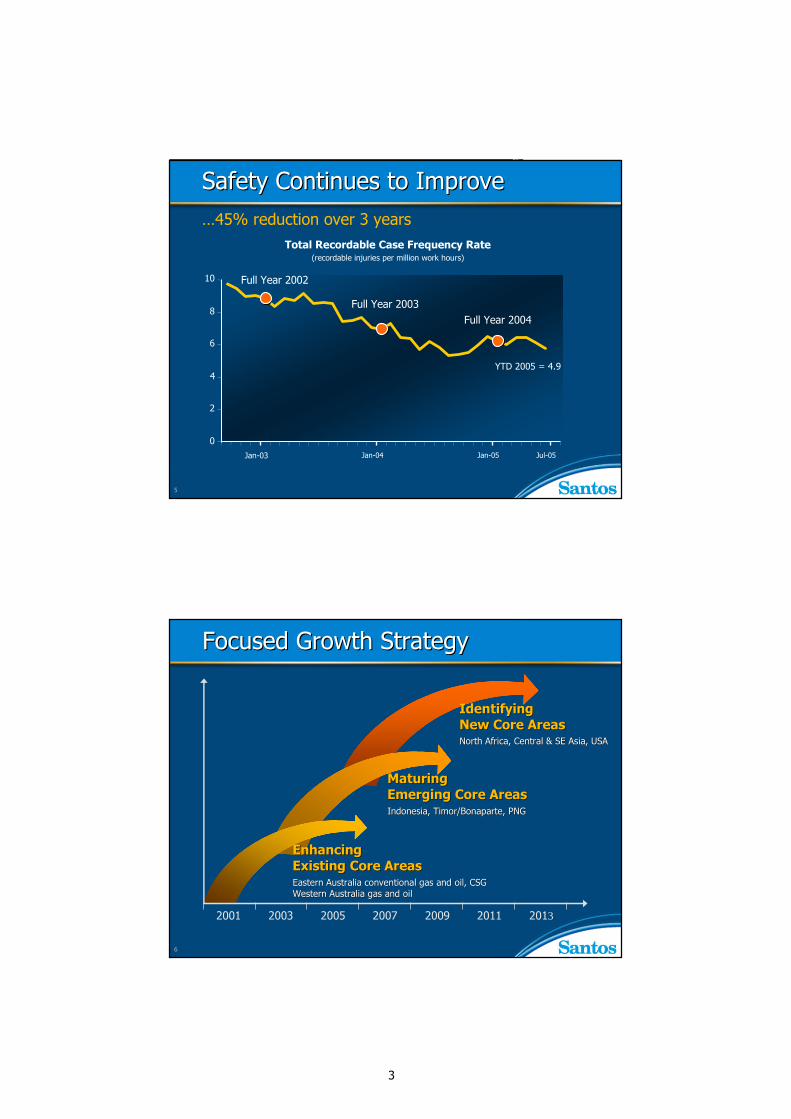
Safety Continues to ImproveSafety Continues to Improve…45% reduction over 3 years
Total Recordable Case Frequency Rate(recordable injuries per million work hours)
0
2
4
6
8
10
Jan-03 Jan-04 Jan-05 Jul-05
Full Year 2002
Full Year 2003Full Year 2004
YTD 2005 = 4.9
6
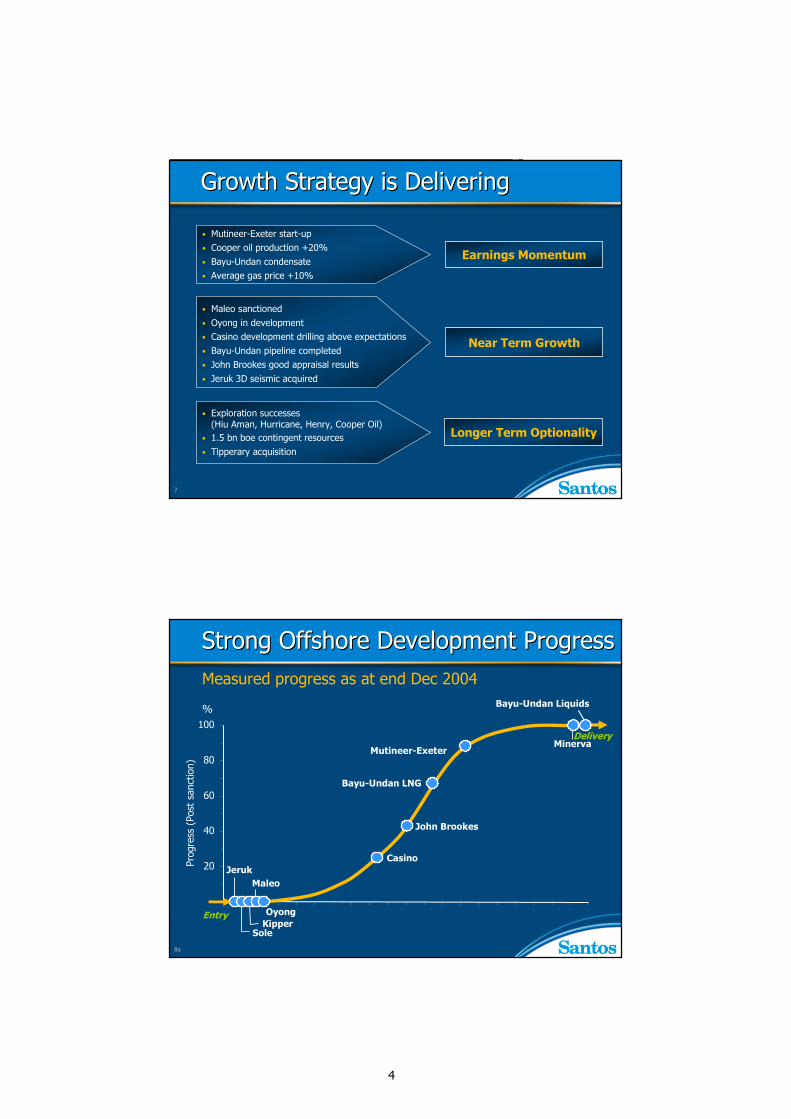
Focused Growth StrategyFocused Growth Strategy
2001 2005 2007 2009 2011 20132003
Identifying Identifying New Core AreasNew Core AreasNorth Africa, Central & SE Asia, USANorth Africa, Central & SE Asia, USA
Maturing Maturing Emerging Core AreasEmerging Core AreasIndonesia, Timor/Bonaparte, PNGIndonesia, Timor/Bonaparte, PNG
Enhancing Enhancing Existing Core AreasExisting Core AreasEastern Australia conventional gas and oil, CSGEastern Australia conventional gas and oil, CSGWestern Australia gas and oil Western Australia gas and oil
4
7
Growth Strategy is DeliveringGrowth Strategy is Delivering
• Mutineer-Exeter start-up• Cooper oil production +20%• Bayu-Undan condensate• Average gas price +10%
Earnings Momentum
• Maleo sanctioned• Oyong in development• Casino development drilling above expectations• Bayu-Undan pipeline completed• John Brookes good appraisal results• Jeruk 3D seismic acquired
Near Term Growth
• Exploration successes(Hiu Aman, Hurricane, Henry, Cooper Oil)
• 1.5 bn boe contingent resources• Tipperary acquisition
Longer Term Optionality
8a
Measured progress as at end Dec 2004
Maleo
Mutineer-Exeter
20
40
60
80
100
Prog
ress
(Po
st s
anct
ion)
%
Strong Offshore Development ProgressStrong Offshore Development Progress
Delivery
Entry
Jeruk
Sole
Minerva
Bayu-Undan Liquids
John Brookes
Casino
Bayu-Undan LNG
KipperOyong
5
8b
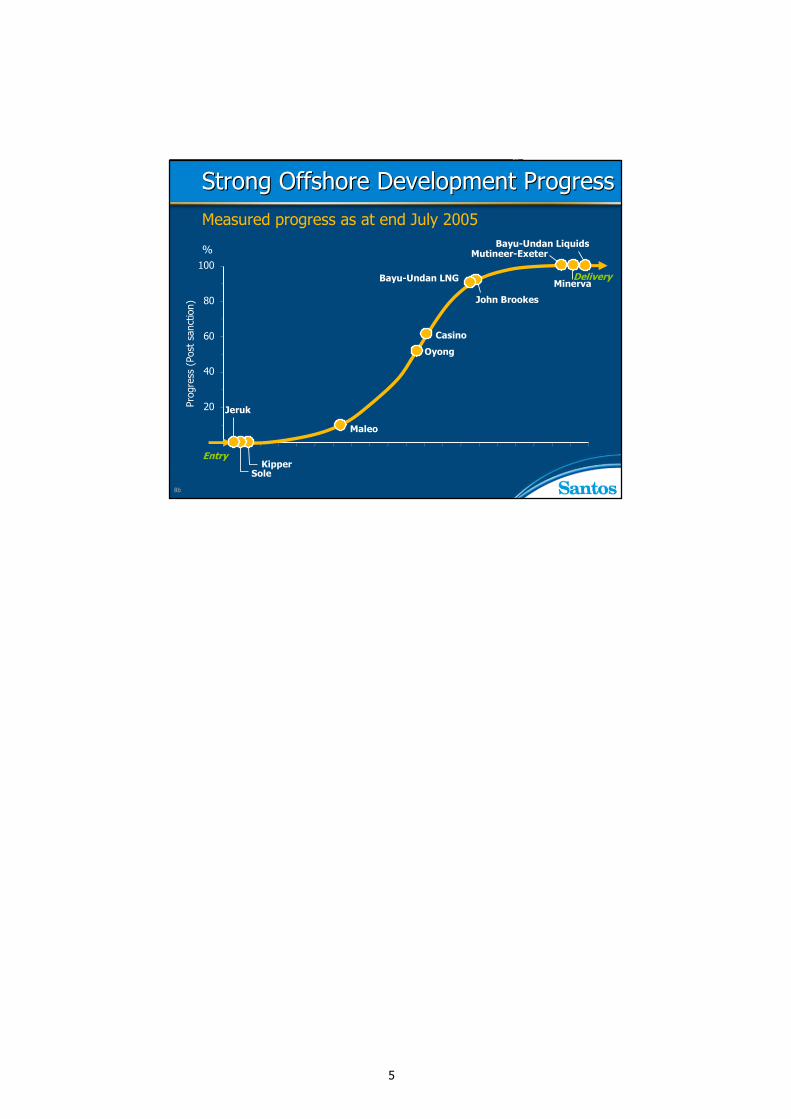
Measured progress as at end July 2005
20
40
60
80
100
Prog
ress
(Po
st s
anct
ion)
%
Strong Offshore Development ProgressStrong Offshore Development Progress
Delivery
Entry
Jeruk
Minerva
Bayu-Undan Liquids
John Brookes
Casino
Maleo
Sole
Oyong
Bayu-Undan LNG
Kipper
Mutineer-Exeter
6
9
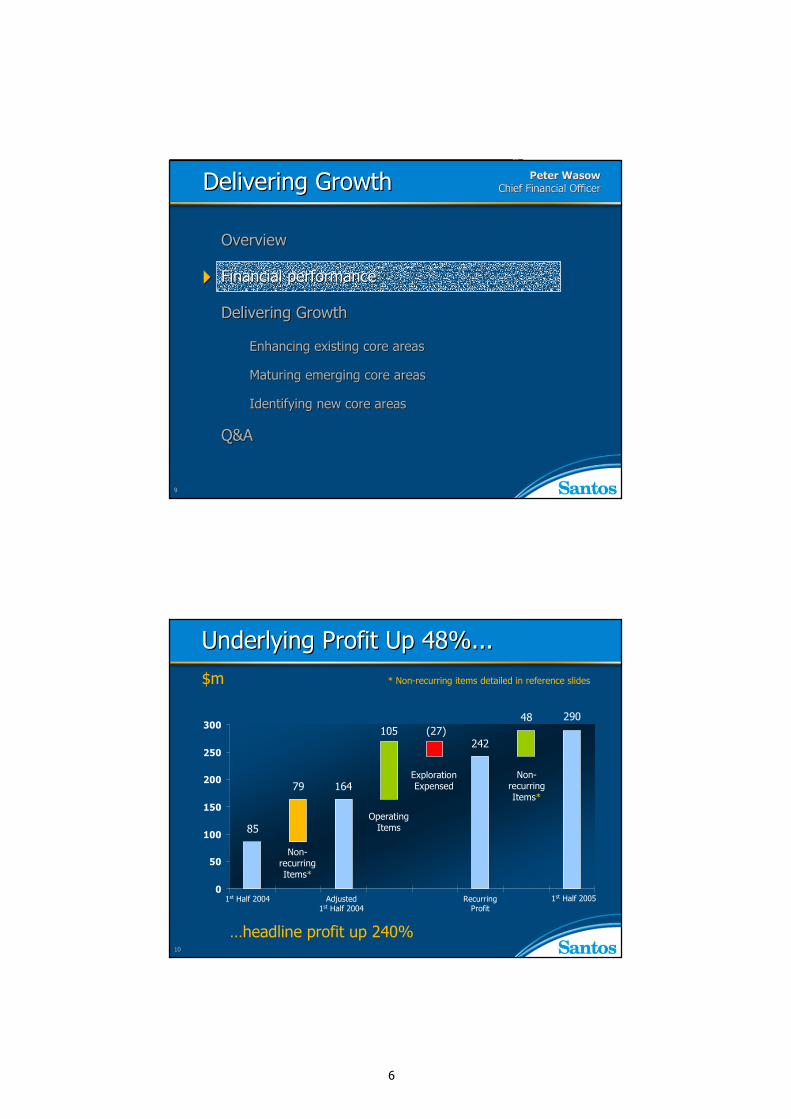
Delivering GrowthDelivering Growth Peter WasowPeter WasowChief Financial OfficerChief Financial Officer
OverviewOverview
Financial performanceFinancial performance
Delivering Growth Delivering Growth
Enhancing existing core areasEnhancing existing core areas
Maturing emerging core areasMaturing emerging core areas
Identifying new core areasIdentifying new core areas
Q&AQ&A
10
0
50
100
150
200
250
300
1st Half 2005
Underlying Profit Up 48%...Underlying Profit Up 48%...
1st Half 2004
$m
Adjusted 1st Half 2004
Recurring Profit
85
79 164
105 (27)242
48 290
Non-recurring Items*
Operating Items
Exploration Expensed
Non-recurring Items*
…headline profit up 240%
* Non-recurring items detailed in reference slides
7
11
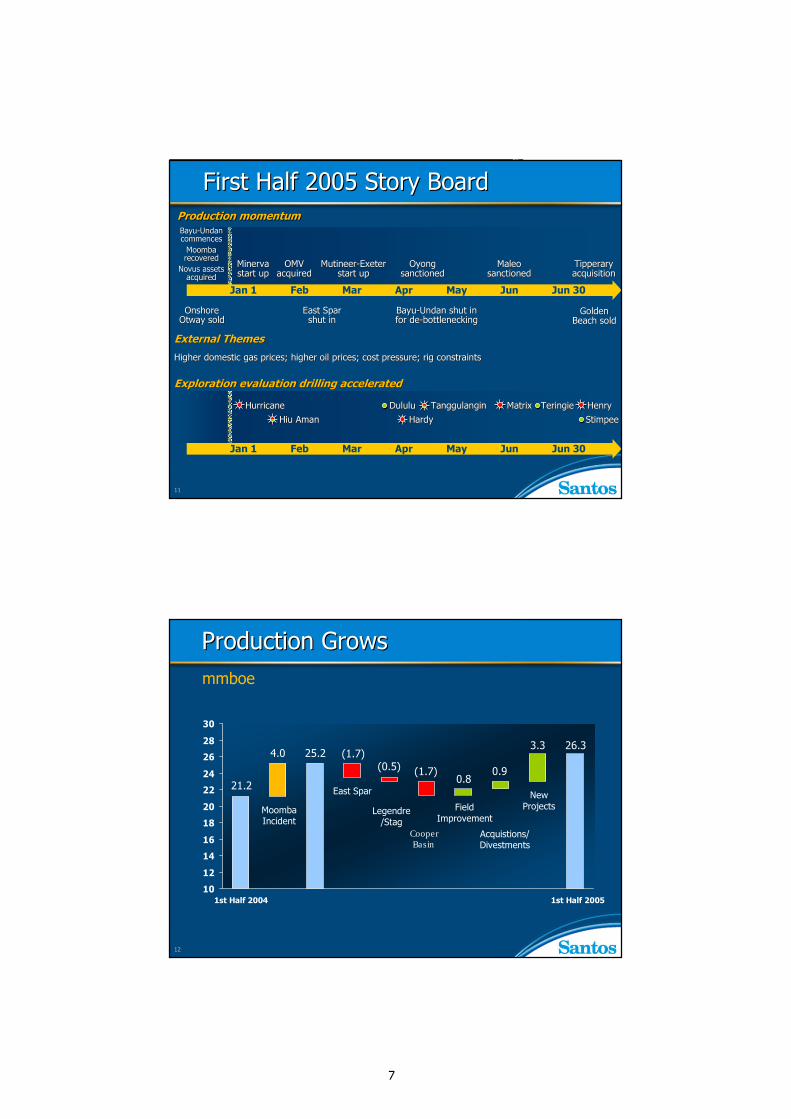
First Half 2005 Story BoardFirst Half 2005 Story Board
External ThemesExternal Themes
Higher domestic gas prices; higher oil prices; cost pressure; riHigher domestic gas prices; higher oil prices; cost pressure; rig constraintsg constraints
BayuBayu--UndanUndancommencescommences
MoombaMoombarecoveredrecovered
Novus assets Novus assets acquiredacquired
Onshore Onshore Otway soldOtway sold
MinervaMinervastart upstart up
OMVOMVacquiredacquired
MutineerMutineer--ExeterExeterstart upstart up
East SparEast Sparshut inshut in
OyongOyongsanctionedsanctioned
MaleoMaleosanctionedsanctioned
BayuBayu--Undan shut inUndan shut infor defor de--bottleneckingbottlenecking
TipperaryTipperaryacquisitionacquisition
Production momentumProduction momentum
Golden Golden Beach soldBeach sold
Feb Mar Apr May Jun Jun 30Jan 1
StimpeeStimpeeHurricaneHurricane
Hiu AmanHiu AmanDululuDululu
HardyHardyTanggulanginTanggulangin MatrixMatrix TeringieTeringie HenryHenry
Exploration evaluation drilling acceleratedExploration evaluation drilling accelerated
Jan 1 Feb Mar Apr May Jun Jun 30
12
10
12
14
16
18
20
22
24
26
28
30
Production GrowsProduction Growsmmboe
1st Half 2005
26.33.3
21.2
4.0
0.8(0.5)
25.2
1st Half 2004
(1.7)
East Spar
Moomba Incident
Legendre /Stag
Field Improvement
0.9
Acquistions/ Divestments
New Projects
(1.7)
CooperBasin
8
13
400
500
600
700
800
900
1000
1100
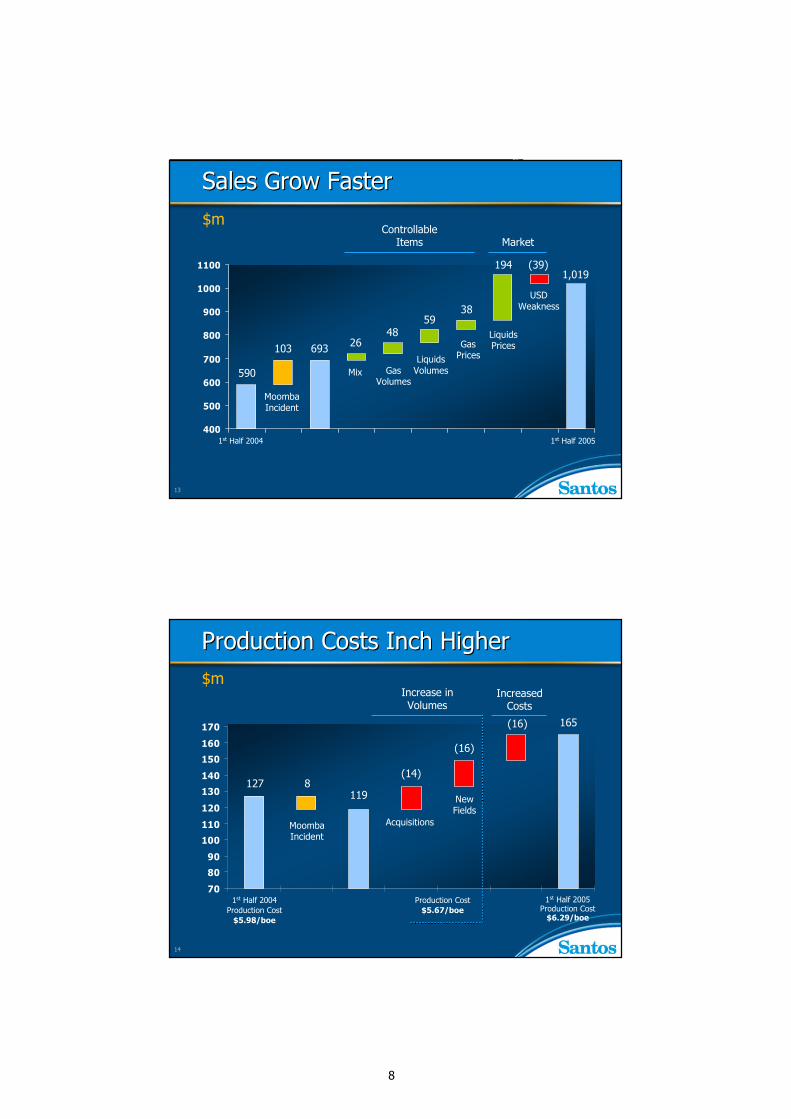
Sales Grow FasterSales Grow Faster
1st Half 2005
$m
590
1,019
Gas Volumes
Moomba Incident
Gas Prices
103 26Liquids Prices693
1st Half 2004
USD Weakness
5938
(39)194
Liquids Volumes
Controllable Items
48
Mix
Market
14
70
80
90
100
110
120
130
140
150
160
170
1st Half 2005Production Cost
$6.29/boe
Production Costs Inch HigherProduction Costs Inch Higher
1st Half 2004Production Cost
$5.98/boe
127
165
Moomba Incident
(16)
Acquisitions
$m
8119
(14)
(16)
New Fields
Increase in Volumes
Increased Costs
Production Cost$5.67/boe
9
15
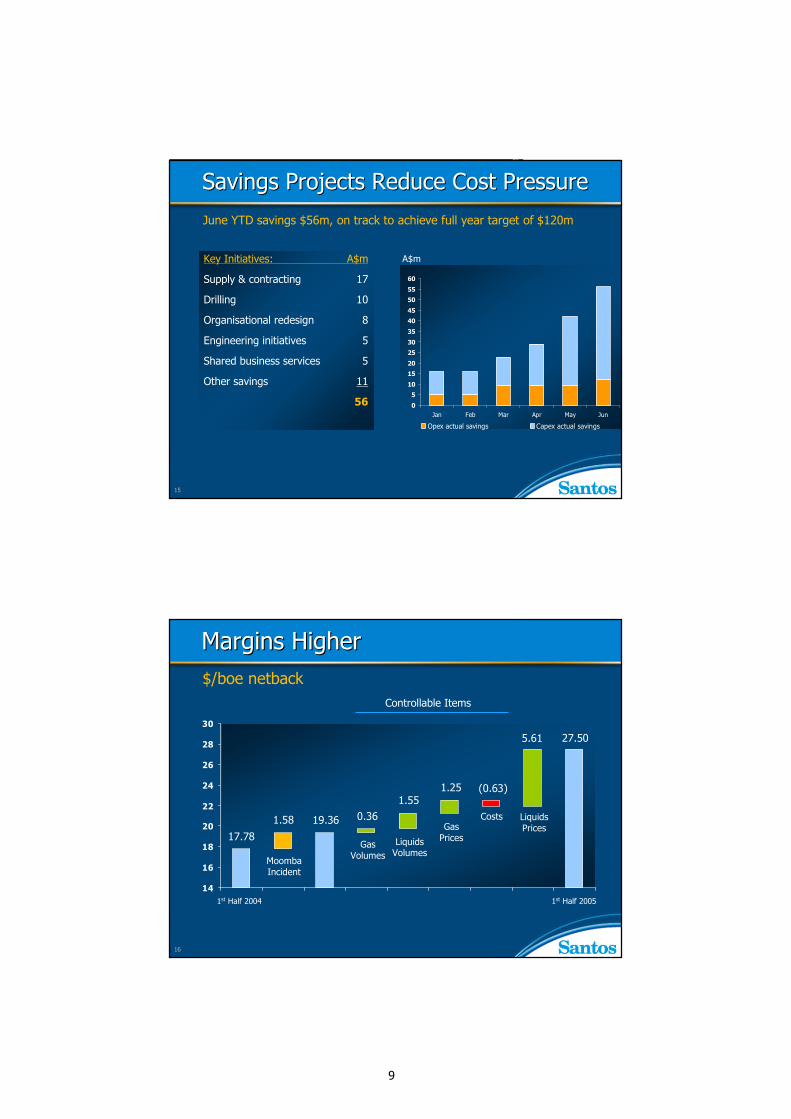
Key Initiatives: A$m
Supply & contracting 17
Drilling 10
Organisational redesign 8
Engineering initiatives 5
Shared business services 5
Other savings 11
56 0
5
10
15
20
25
30
35
40
45
50
55
60
Jan Feb Mar Apr May Jun
Opex actual savings Capex actual savings
Savings Projects Reduce Cost PressureSavings Projects Reduce Cost PressureJune YTD savings $56m, on track to achieve full year target of $120m
A$m
16
14
16
18
20
22
24
26
28
30
(0.63)
$/boe netback
Margins HigherMargins Higher
1st Half 2004 1st Half 2005
17.78
Moomba Incident
1.58 19.36
5.61
1.551.25
27.50
0.36
Gas Volumes
Liquids Prices
Liquids Volumes
Gas Prices
Costs
Controllable Items
10
17
0
100
200
300
400
500
600
700
800
900
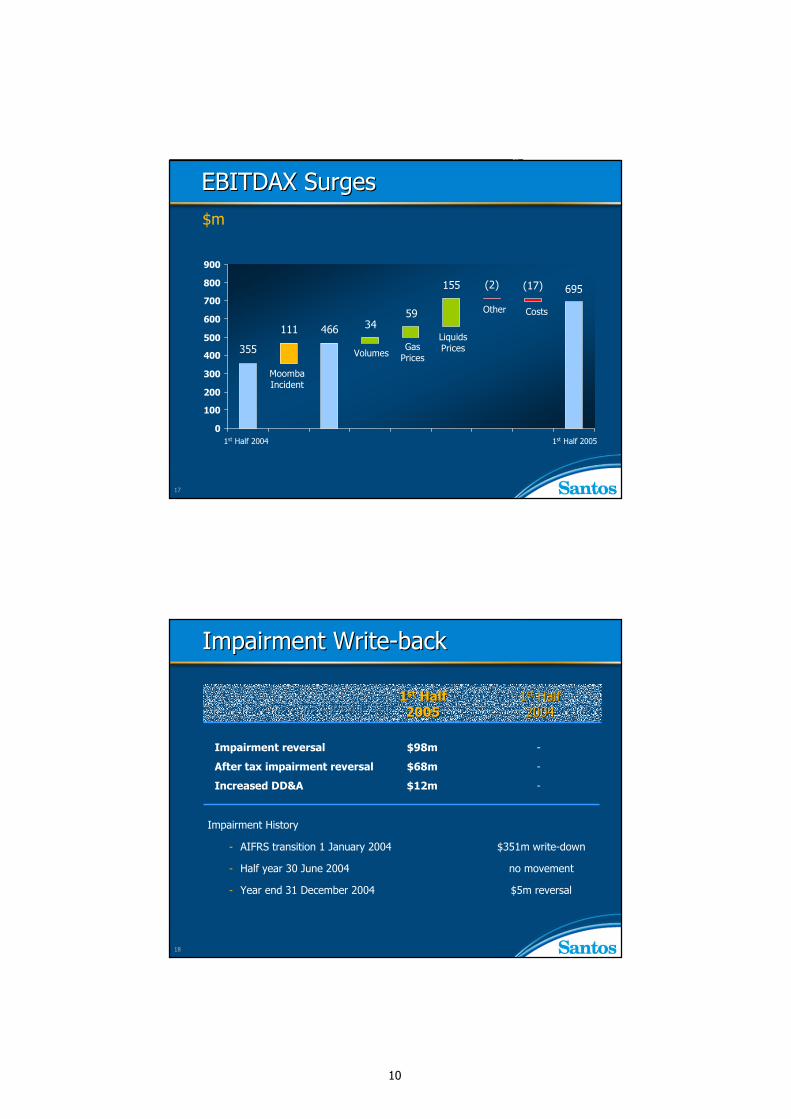
$m
EBITDAX SurgesEBITDAX Surges
1st Half 2004 1st Half 2005
355
695(2)155
34
Volumes
111 466
(17)
Moomba Incident
Gas Prices
Other Costs59
Liquids Prices
18
Impairment WriteImpairment Write--backback
11stst HalfHalf 11stst HalfHalf20052005 20042004
Impairment reversal $98m -
After tax impairment reversal $68m -
Increased DD&A $12m -
Impairment History
- AIFRS transition 1 January 2004 $351m write-down
- Half year 30 June 2004 no movement
- Year end 31 December 2004 $5m reversal
11
19
0
25
50
75
100
125
150
175
200
225
250
275
300
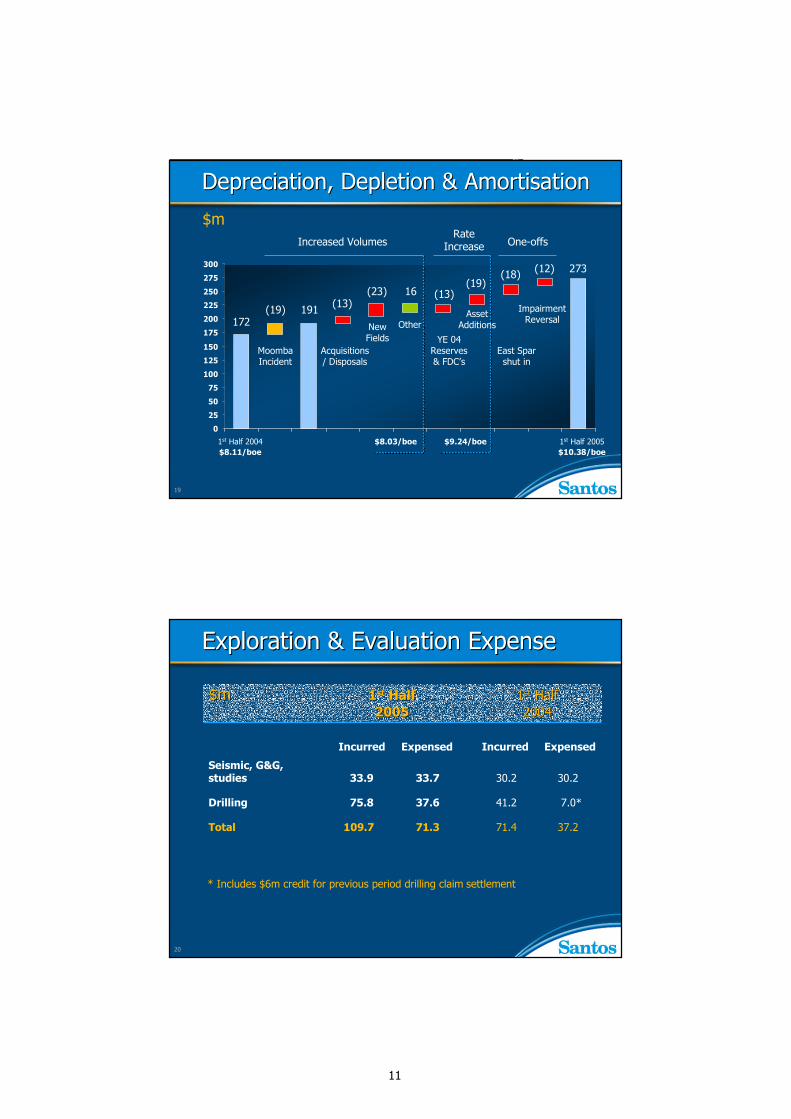
Depreciation, Depletion & AmortisationDepreciation, Depletion & Amortisation
$m
1st Half 2005$10.38/boe
Increased Volumes
172
273
(19)
(23)
Moomba Incident
(13)
1st Half 2004$8.11/boe
New Fields
16
Acquisitions / Disposals
191
(18)
(13)(19)
(12)
East Spar shut in
Impairment Reversal
YE 04 Reserves & FDC’s
$8.03/boe $9.24/boe
Rate Increase One-offs
OtherAsset
Additions
20
Exploration & Evaluation ExpenseExploration & Evaluation Expense
$m$m 11stst HalfHalf 11stst HalfHalf20052005 20042004
37.2 71.4 71.3 109.7 Total
7.0*41.2 37.6 75.8 Drilling
30.2 30.2 33.7 33.9 Seismic, G&G, studies
ExpensedIncurredExpensedIncurred
* Includes $6m credit for previous period drilling claim settlement
12
21
0
50
100
150
200
250
300
350
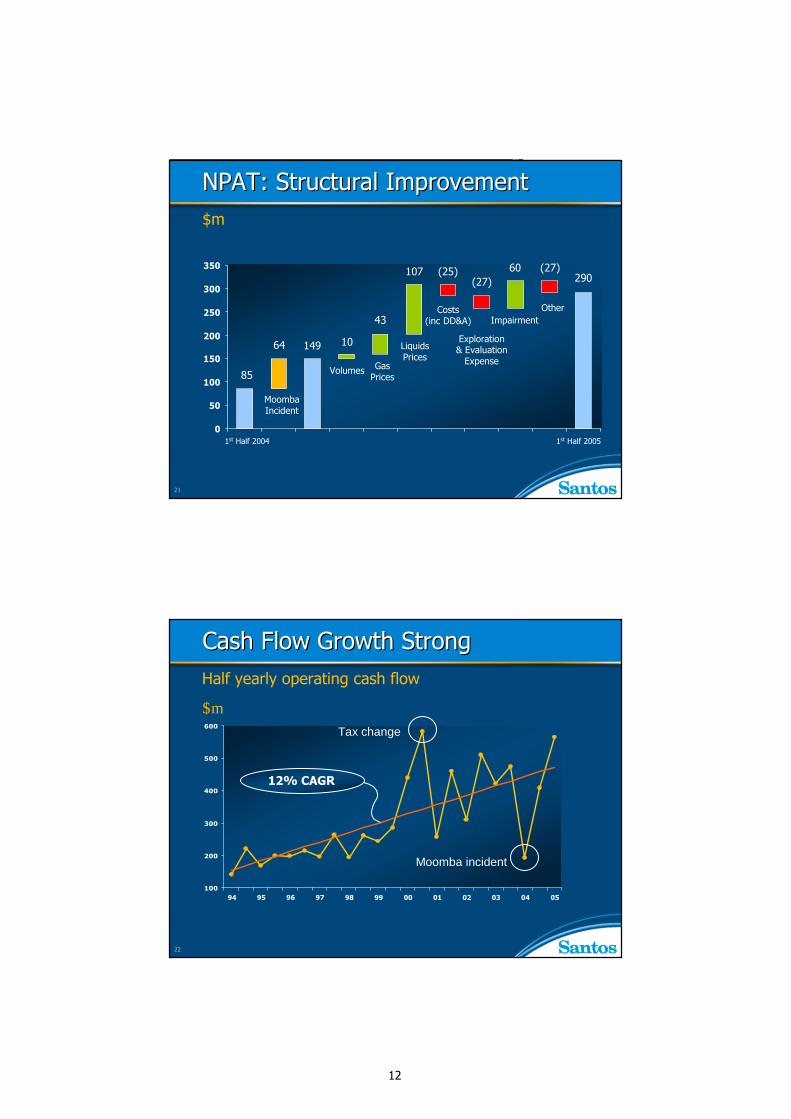
NPAT: Structural ImprovementNPAT: Structural Improvement$m
149
85
(25)
1st Half 20051st Half 2004
10
43
64
60(27)
(27)290
Moomba Incident
Volumes Gas Prices
Costs (inc DD&A) Impairment
Exploration & Evaluation
Expense
Other
107
Liquids Prices
22
100
200
300
400
500
600
Cash Flow Growth StrongCash Flow Growth StrongHalf yearly operating cash flow
Tax change
Moomba incident
94 95 96 97 98 99 00 01 02 03 04 05
12% CAGR
$m
13
23
Delivering GrowthDelivering Growth John ElliceJohn Ellice--FlintFlintCEO & Managing DirectorCEO & Managing Director
OverviewOverview
Financial performance Financial performance
Delivering GrowthDelivering Growth
–– Enhancing existing core areasEnhancing existing core areas
–– Maturing emerging core areasMaturing emerging core areas
–– Identifying new core areasIdentifying new core areas
Q&AQ&A
24
Focused Growth StrategyFocused Growth Strategy
2001 2005 2007 2009 2011 20132003
Enhancing Enhancing Existing Core AreasExisting Core AreasEastern Australia conventional gas and oil, CSGEastern Australia conventional gas and oil, CSGWestern Australia gas and oil Western Australia gas and oil
ProductionProduction 89%89%2P Reserves2P Reserves 78%78%ContingentContingentResourcesResources 26%26%
15
27
500km
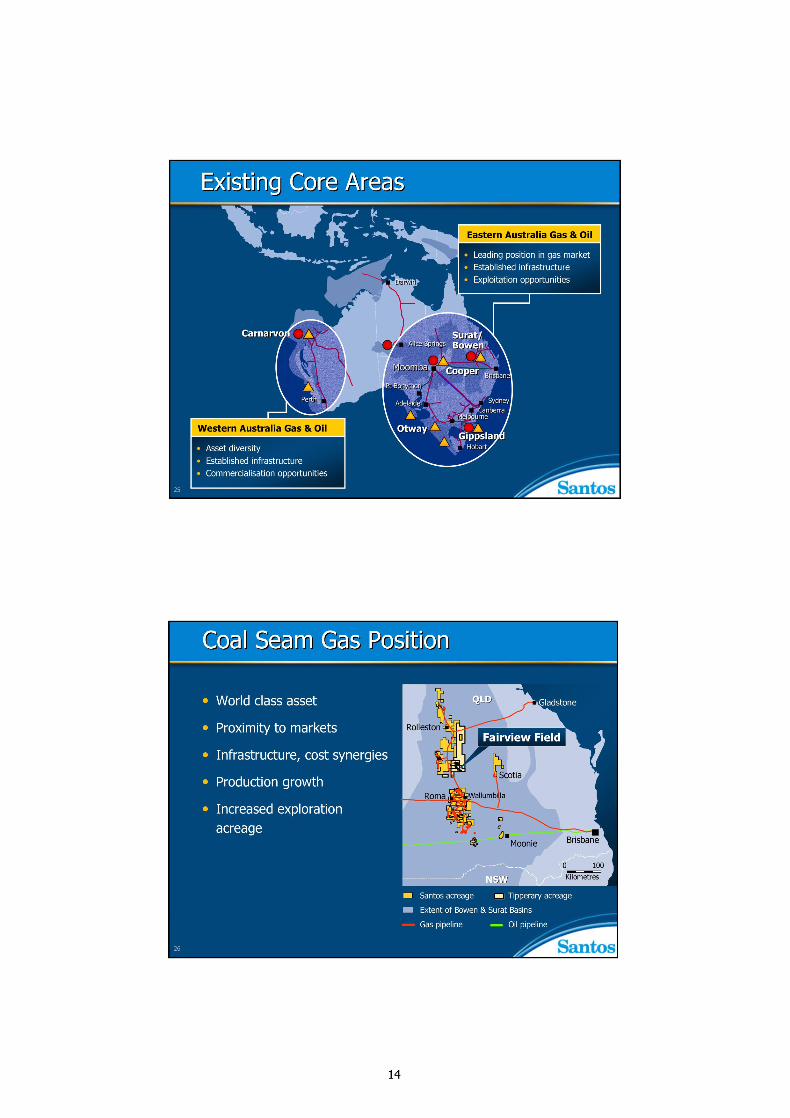
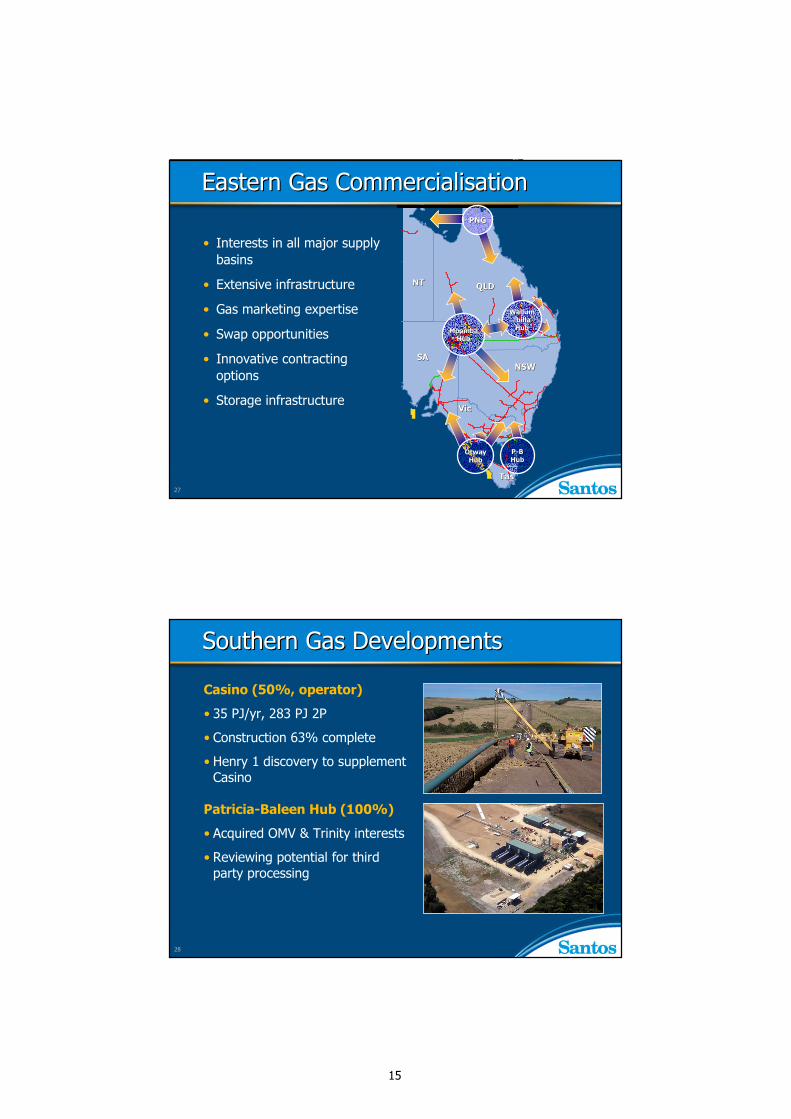
• Interests in all major supply basins
• Extensive infrastructure
• Gas marketing expertise
• Swap opportunities
• Innovative contracting options
• Storage infrastructure
Eastern Gas CommercialisationEastern Gas Commercialisation
NSWNSW
QLDQLD
SASA
NTNT
VicVic
MoombaMoombaHubHub
TasTas
WallumWallum--billabillaHubHub
PNGPNG
PP--B B HubHub
Otway Otway HubHub
28
Southern Gas DevelopmentsSouthern Gas Developments
Casino (50%, operator)
• 35 PJ/yr, 283 PJ 2P
• Construction 63% complete
• Henry 1 discovery to supplement Casino
Patricia-Baleen Hub (100%)
• Acquired OMV & Trinity interests
• Reviewing potential for third party processing
16
29
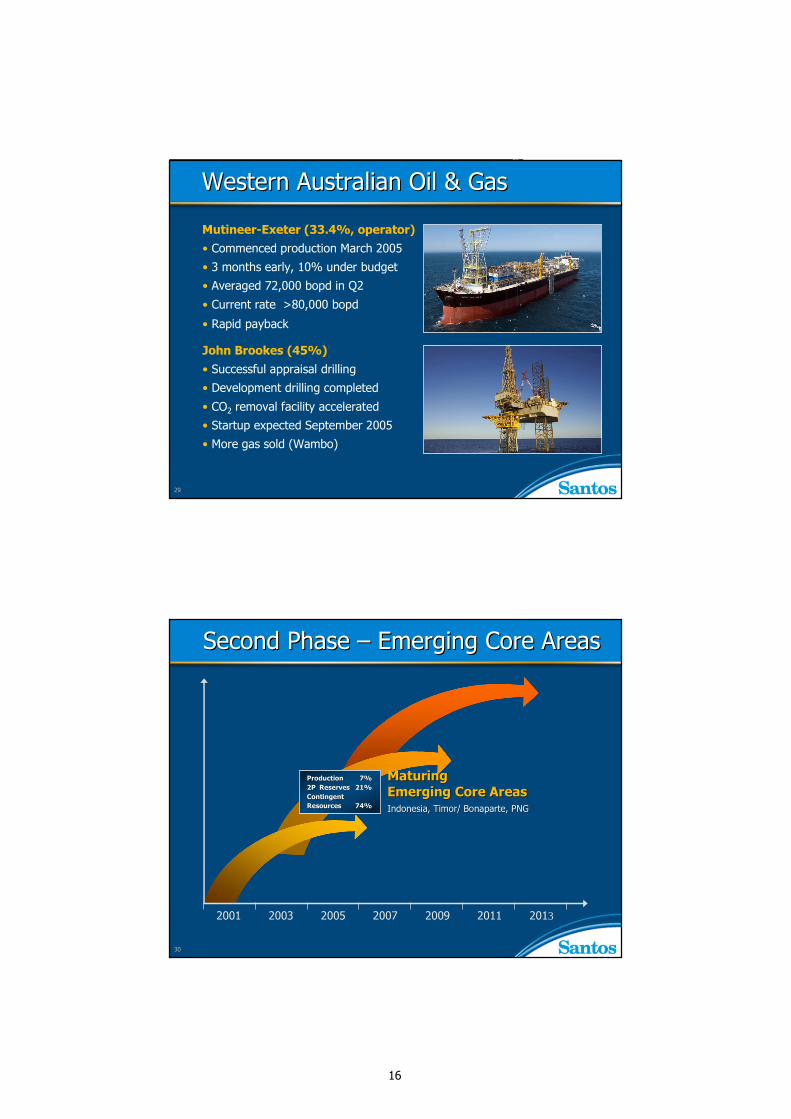
Western Australian Oil & GasWestern Australian Oil & Gas
Mutineer-Exeter (33.4%, operator)• Commenced production March 2005
• 3 months early, 10% under budget
• Averaged 72,000 bopd in Q2
• Current rate >80,000 bopd
• Rapid payback
John Brookes (45%)• Successful appraisal drilling
• Development drilling completed
• CO2 removal facility accelerated
• Startup expected September 2005
• More gas sold (Wambo)
30
Second Phase Second Phase –– Emerging Core AreasEmerging Core Areas
2001 2005 2007 2009 2011 20132003
Maturing Maturing Emerging Core AreasEmerging Core AreasIndonesia, Timor/ Bonaparte, PNGIndonesia, Timor/ Bonaparte, PNG
ProductionProduction 7%7%2P Reserves2P Reserves 21%21%ContingentContingentResourcesResources 74%74%
17
31 0 1000
DarwinDarwin
East JavaEast Java
BrowseBrowse
Timor SeaTimor Sea
KuteiKutei
West NatunaWest Natuna
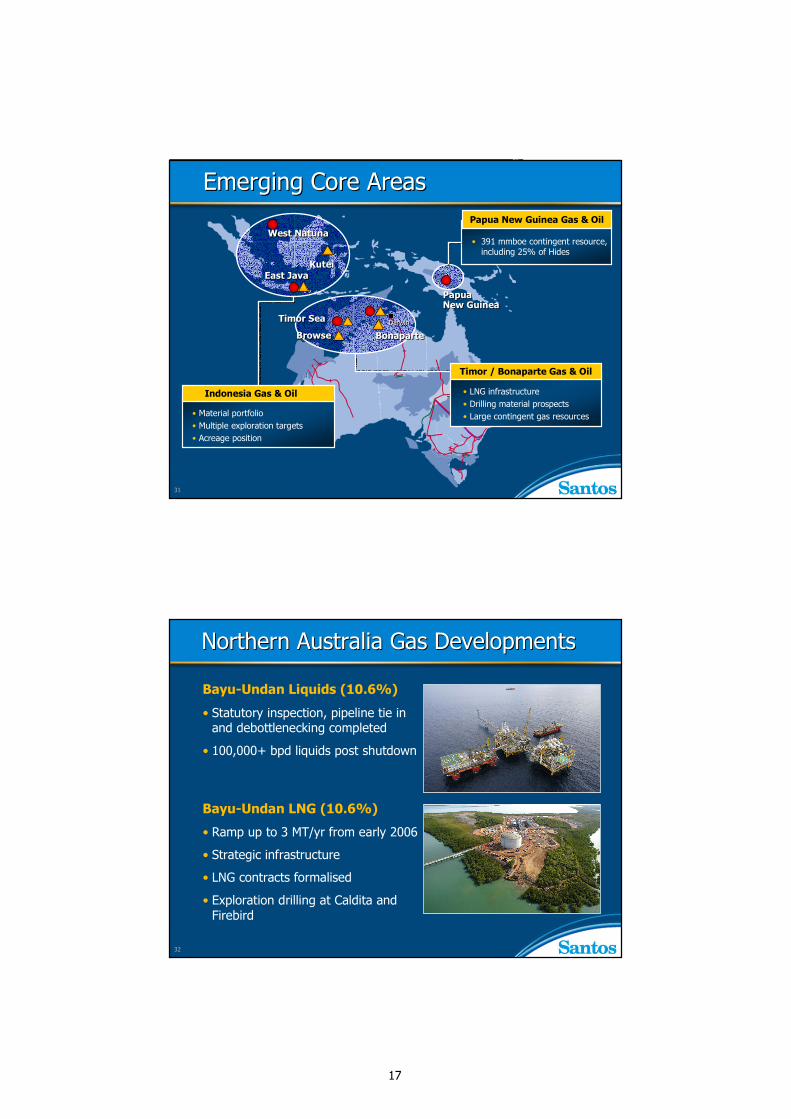
Emerging Core AreasEmerging Core Areas
• LNG infrastructure• Drilling material prospects• Large contingent gas resources
Timor / Bonaparte Gas & Oil
• Material portfolio• Multiple exploration targets• Acreage position
Indonesia Gas & Oil
Papua New GuineaPapua New Guinea
• 391 mmboe contingent resource, including 25% of Hides
Papua New Guinea Gas & Oil
BonaparteBonaparte
32
Bayu-Undan Liquids (10.6%)
• Statutory inspection, pipeline tie in and debottlenecking completed
• 100,000+ bpd liquids post shutdown
Bayu-Undan LNG (10.6%)
• Ramp up to 3 MT/yr from early 2006
• Strategic infrastructure
• LNG contracts formalised
• Exploration drilling at Caldita and Firebird
Northern Australia Gas DevelopmentsNorthern Australia Gas Developments
18
33
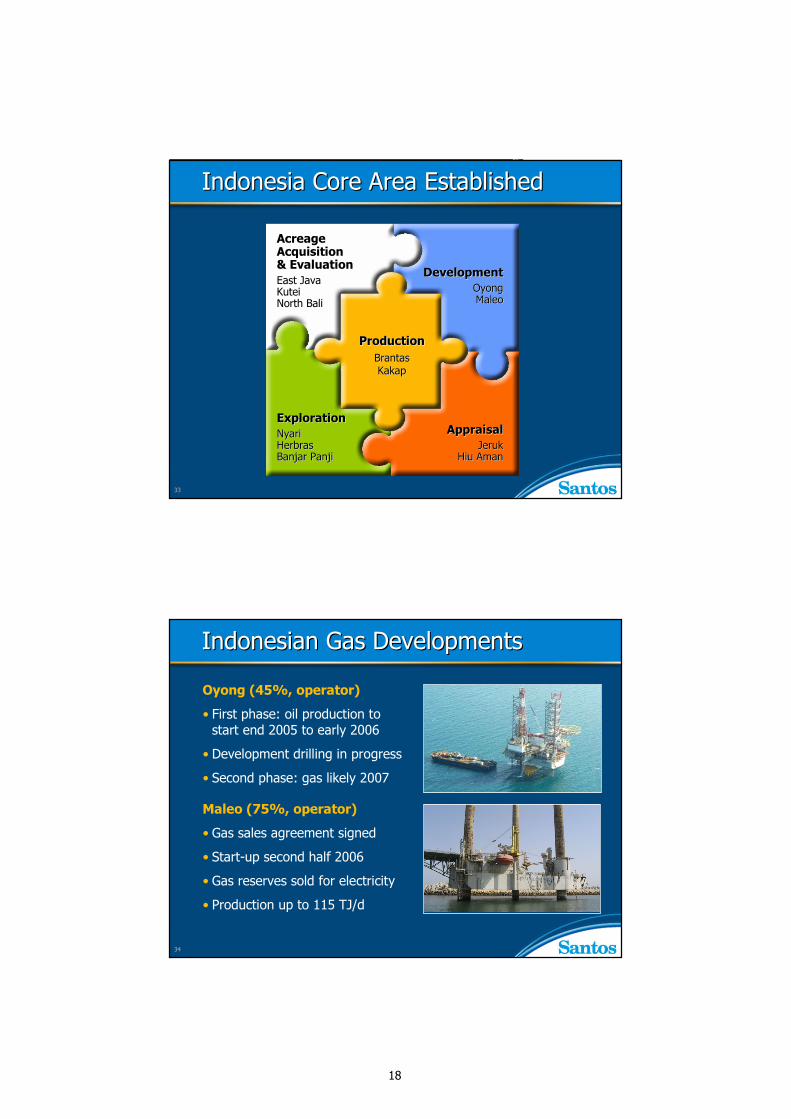
Indonesia Core Area EstablishedIndonesia Core Area Established
Acreage Acreage Acquisition Acquisition & Evaluation& EvaluationEast JavaEast JavaKuteiKuteiNorth BaliNorth Bali
ExplorationExplorationNyariNyariHerbrasHerbrasBanjar PanjiBanjar Panji
AppraisalAppraisalJerukJeruk
Hiu AmanHiu Aman
DevelopmentDevelopmentOyongOyongMaleoMaleo
ProductionProductionBrantasBrantasKakapKakap
34
Indonesian Gas DevelopmentsIndonesian Gas Developments
Oyong (45%, operator)
• First phase: oil production to start end 2005 to early 2006
• Development drilling in progress
• Second phase: gas likely 2007
Maleo (75%, operator)
• Gas sales agreement signed
• Start-up second half 2006
• Gas reserves sold for electricity
• Production up to 115 TJ/d
19
35
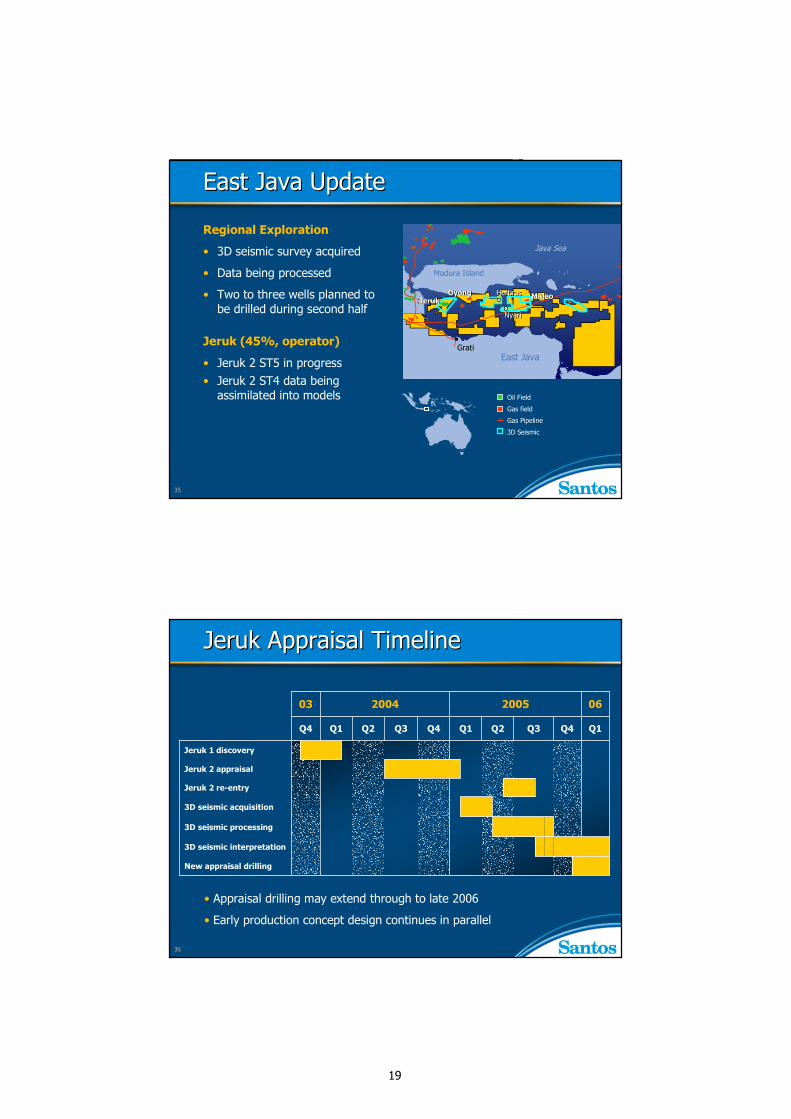
East Java UpdateEast Java Update
Regional Exploration
• 3D seismic survey acquired
• Data being processed
• Two to three wells planned to be drilled during second half
Jeruk (45%, operator)
• Jeruk 2 ST5 in progress• Jeruk 2 ST4 data being
assimilated into models Oil Field
Gas field
Gas Pipeline
3D Seismic
Madura Island
East Java
JerukJerukOyongOyong MaleoMaleo
Java Sea
Grati
NyariNyari
HerbrasHerbras
36
0620052004
New appraisal drilling
3D seismic interpretation
3D seismic processing
3D seismic acquisition
Jeruk 2 re-entry
Jeruk 2 appraisal
Jeruk 1 discovery
Q1Q4Q3Q2Q1Q4Q3Q2Q1Q4
03
Jeruk Appraisal TimelineJeruk Appraisal Timeline
• Appraisal drilling may extend through to late 2006
• Early production concept design continues in parallel
20
37
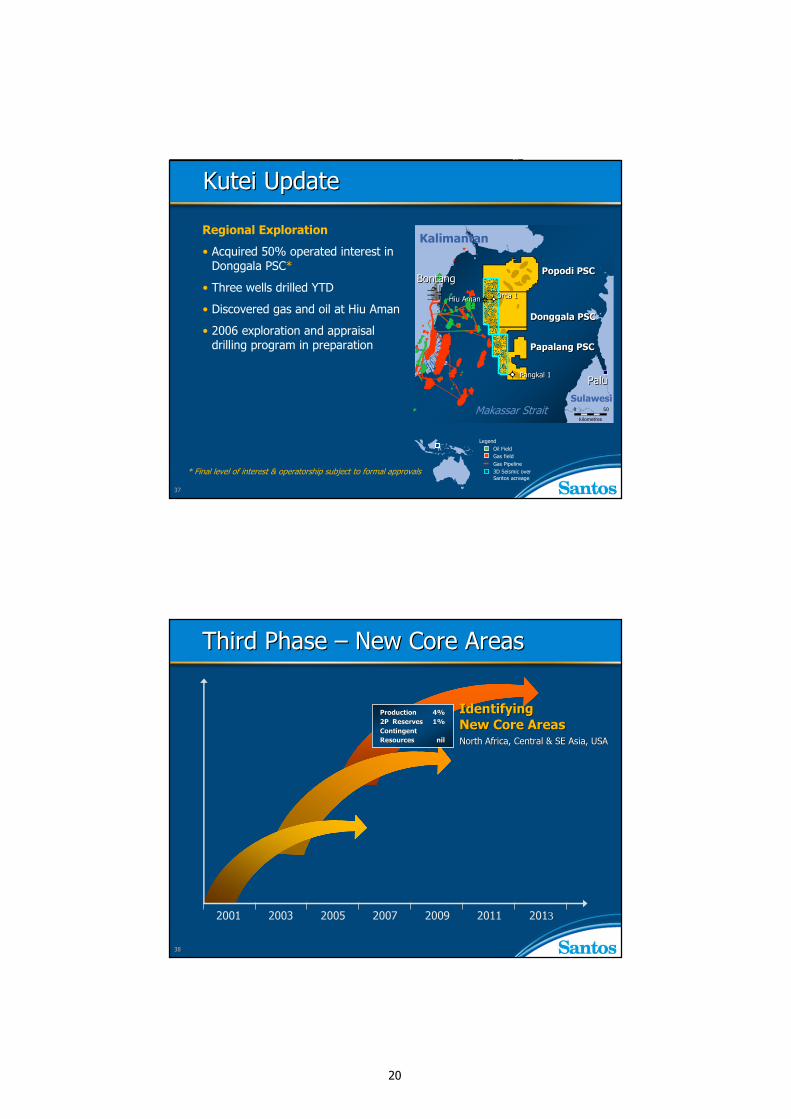
Kutei UpdateKutei Update
Regional Exploration
• Acquired 50% operated interest in Donggala PSC*
• Three wells drilled YTD
• Discovered gas and oil at Hiu Aman
• 2006 exploration and appraisal drilling program in preparation
LegendOil FieldGas fieldGas Pipeline3D Seismic over Santos acreage
PaluPalu
BontangBontang
Sulawesi
Kalimantan
Makassar Strait
Papalang PSC Papalang PSC
Popodi PSCPopodi PSC
Donggala PSC Donggala PSC
Pangkal 1Pangkal 1
Hiu AmanHiu Aman Orca 1Orca 1
50
kilometres
0
* Final level of interest & operatorship subject to formal approvals
38
Third Phase Third Phase –– New Core AreasNew Core Areas
2001 2005 2007 2009 2011 20132003
Identifying Identifying New Core AreasNew Core AreasNorth Africa, Central & SE Asia, USANorth Africa, Central & SE Asia, USA
ProductionProduction 4%4%2P Reserves2P Reserves 1%1%ContingentContingentResourcesResources nilnil
21
39
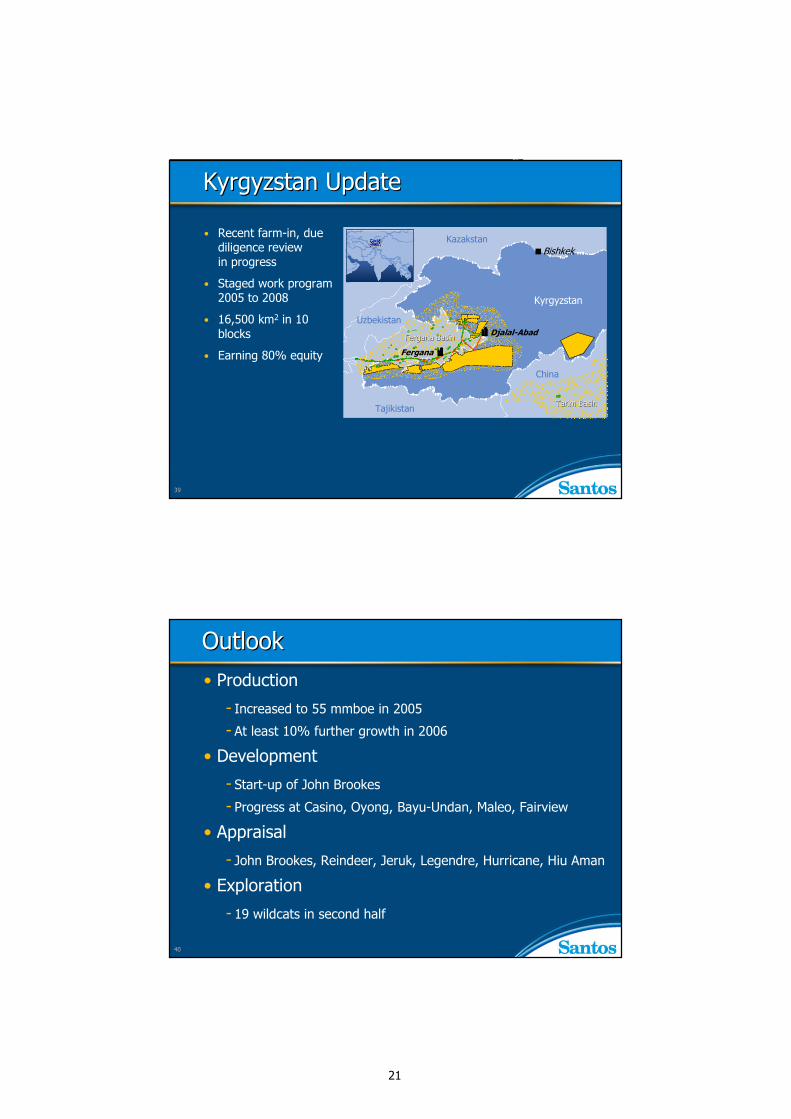
Kyrgyzstan UpdateKyrgyzstan Update
• Recent farm-in, due diligence review in progress
• Staged work program 2005 to 2008
• 16,500 km2 in 10 blocks
• Earning 80% equity
Kyrgyzstan
China
KazakstanBishkek
Djalal-AbadFergana BasinFergana Basin
TarimTarim BasinBasinTajikistan
Uzbekistan
Fergana
40
OutlookOutlook• Production
- Increased to 55 mmboe in 2005
- At least 10% further growth in 2006
• Development
- Start-up of John Brookes
- Progress at Casino, Oyong, Bayu-Undan, Maleo, Fairview
• Appraisal
- John Brookes, Reindeer, Jeruk, Legendre, Hurricane, Hiu Aman
• Exploration
- 19 wildcats in second half
22
41
Delivering GrowthDelivering Growth John ElliceJohn Ellice--FlintFlintCEO & Managing DirectorCEO & Managing Director
OverviewOverview
Financial performance Financial performance
Delivering Growth Delivering Growth
Enhancing existing core areasEnhancing existing core areas
Maturing emerging core areasMaturing emerging core areas
Identifying new core areasIdentifying new core areas
Q&AQ&A
442
23
43
Reference slides
44
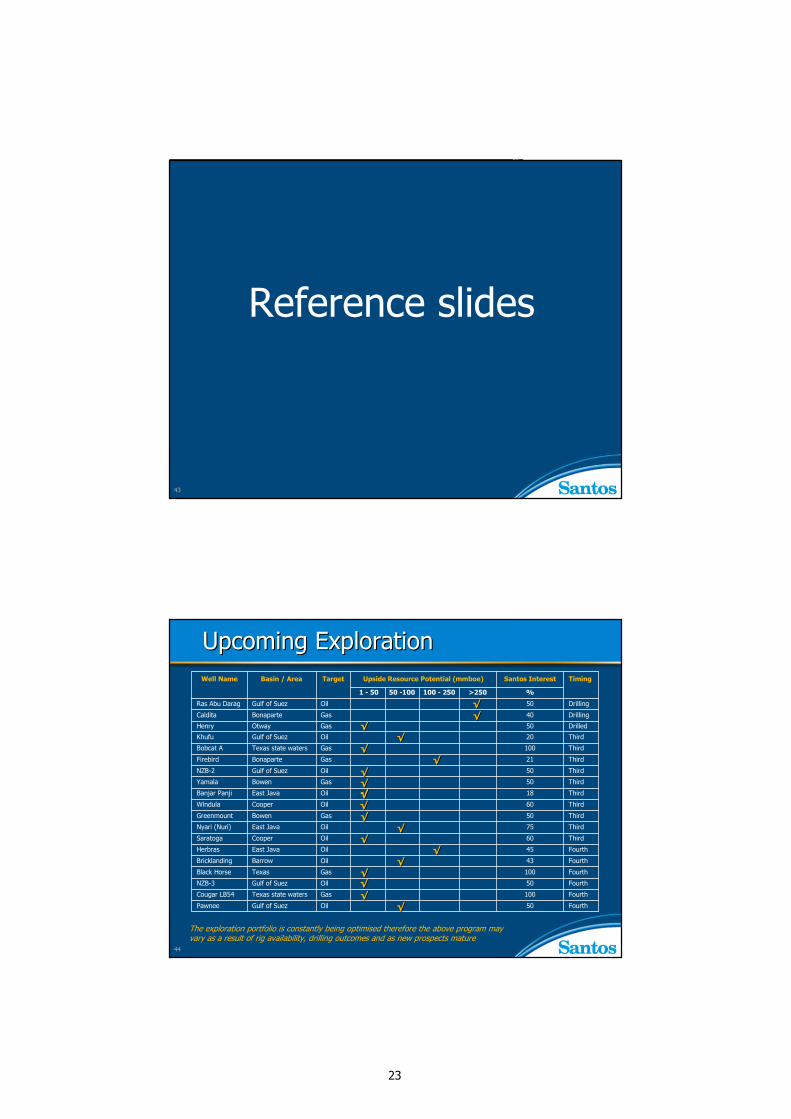
Drilling50OilGulf of SuezRas Abu Darag
Fourth50OilGulf of SuezPawnee
Fourth100GasTexas state watersCougar LB54
Fourth50OilGulf of SuezNZB-3
Fourth100GasTexasBlack Horse
Fourth43OilBarrowBricklanding
Fourth45OilEast JavaHerbras
Third60OilCooperSaratoga
Third75OilEast JavaNyari (Nuri)
Third50GasBowenGreenmount
Third 60OilCooperWindula
Third18OilEast JavaBanjar Panji
Third 50GasBowenYamala
Third 50OilGulf of SuezNZB-2
Third21GasBonaparteFirebird
Third100GasTexas state watersBobcat A
Third20OilGulf of SuezKhufu
Drilled50GasOtwayHenry
Drilling40GasBonaparteCaldita
%>250100 - 25050 -1001 - 50
TimingSantos InterestUpside Resource Potential (mmboe)TargetBasin / AreaWell Name
Upcoming ExplorationUpcoming Exploration
√√
√√
√√
√√
√√
√√√√√√√√
√√√√
√√
√√
√√
√√
√√
√√√√
√√
√√
The exploration portfolio is constantly being optimised therefore the above program may vary as a result of rig availability, drilling outcomes and as new prospects mature
24
45
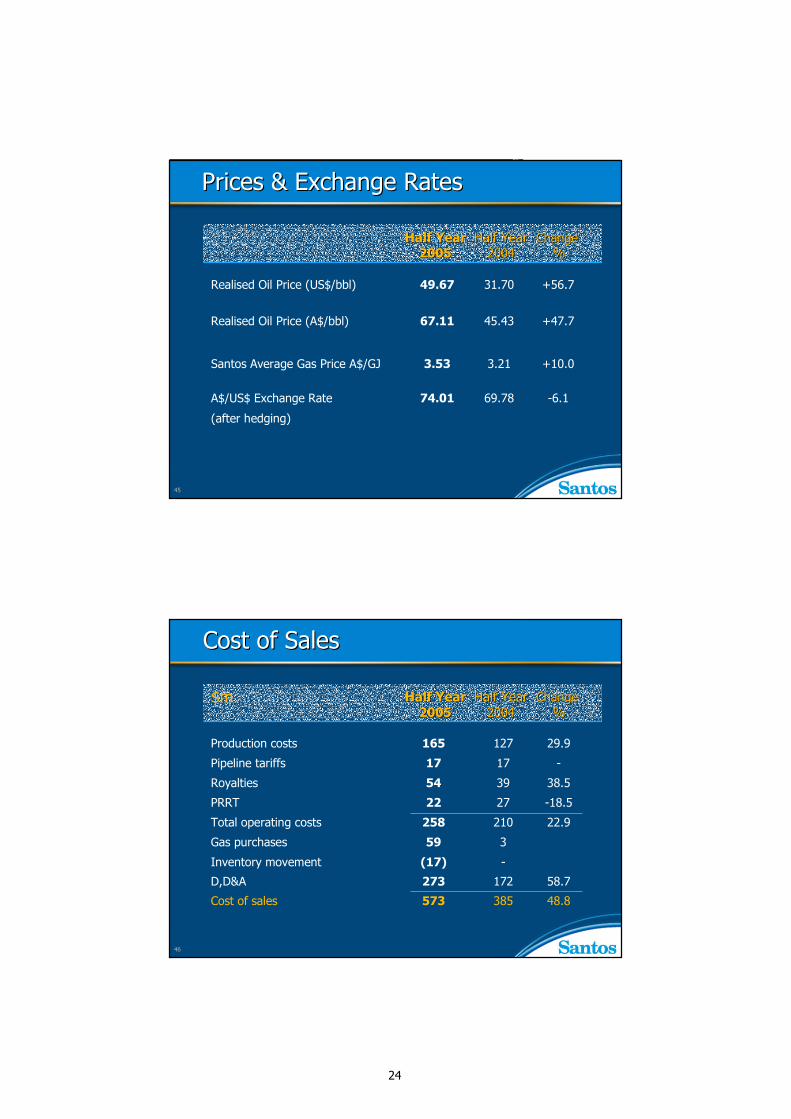
Prices & Exchange Rates Prices & Exchange Rates
-6.169.7874.01A$/US$ Exchange Rate
(after hedging)
+10.03.213.53Santos Average Gas Price A$/GJ
+47.745.4367.11Realised Oil Price (A$/bbl)
+56.731.7049.67Realised Oil Price (US$/bbl)
Half Year Half Year Half Year Half Year ChangeChange20052005 20042004 %%
46
Half Year Half Year Half Year Half Year ChangeChange20052005 20042004 %%
Cost of SalesCost of Sales
48.8385573Cost of sales
58.7172273D,D&A
-(17)Inventory movement
359Gas purchases
22.9210258Total operating costs
-18.52722PRRT
38.53954Royalties
-1717Pipeline tariffs
29.9127165Production costs
$m
25
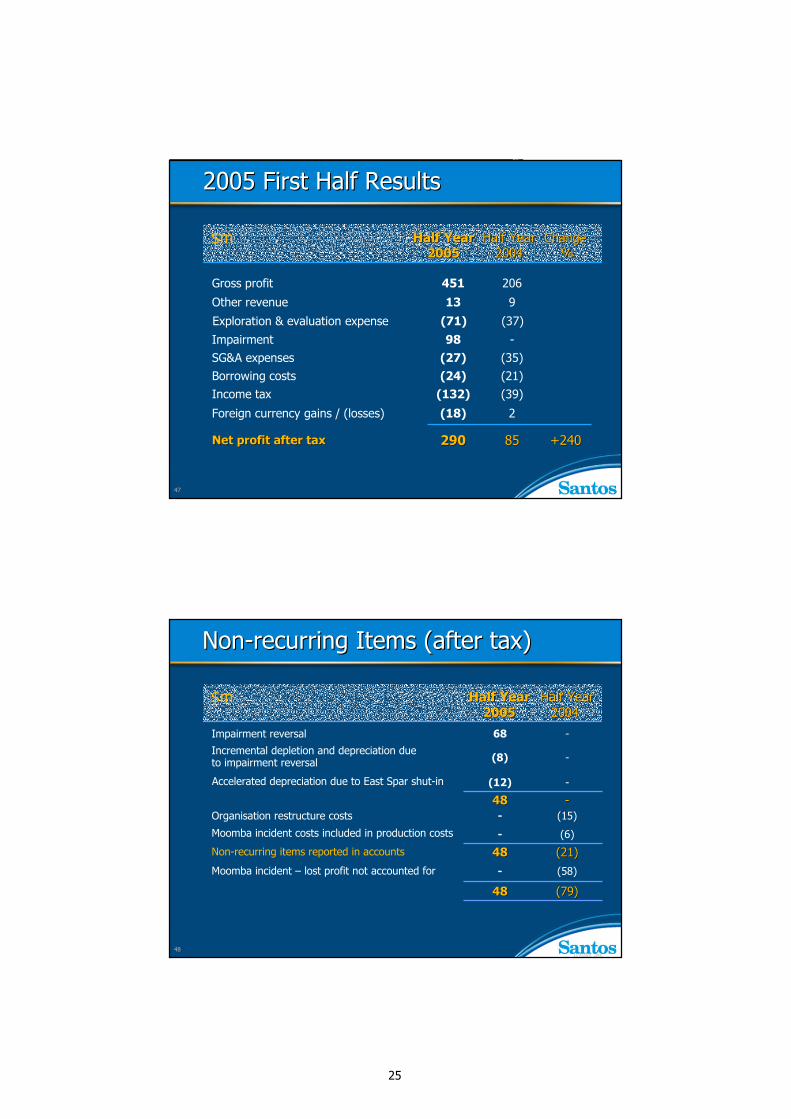
47
2005 First Half Results2005 First Half Results
Half Year Half Year Half Year Half Year ChangeChange20052005 20042004 %%
+240+2408585290290Net profit after taxNet profit after tax
2(18)Foreign currency gains / (losses)
(39)(132)Income tax(21)(24)Borrowing costs(35)(27)SG&A expenses
-98Impairment
913Other revenue
206451Gross profit
(37)(71)Exploration & evaluation expense
$m
4815 August, 2000
Non-recurring items reported in accounts
NonNon--recurring Items (after tax)recurring Items (after tax)
Half Year Half Year Half Year Half Year 20052005 20042004
Moomba incident – lost profit not accounted for
(15)-
Moomba incident costs included in production costs
Organisation restructure costs
-(12)
-(8)Incremental depletion and depreciation due to impairment reversal
-68Impairment reversal
Accelerated depreciation due to East Spar shut-in
--4848
(6)-
4848 (21)(21)(58)-
4848 (79)(79)
$m
26
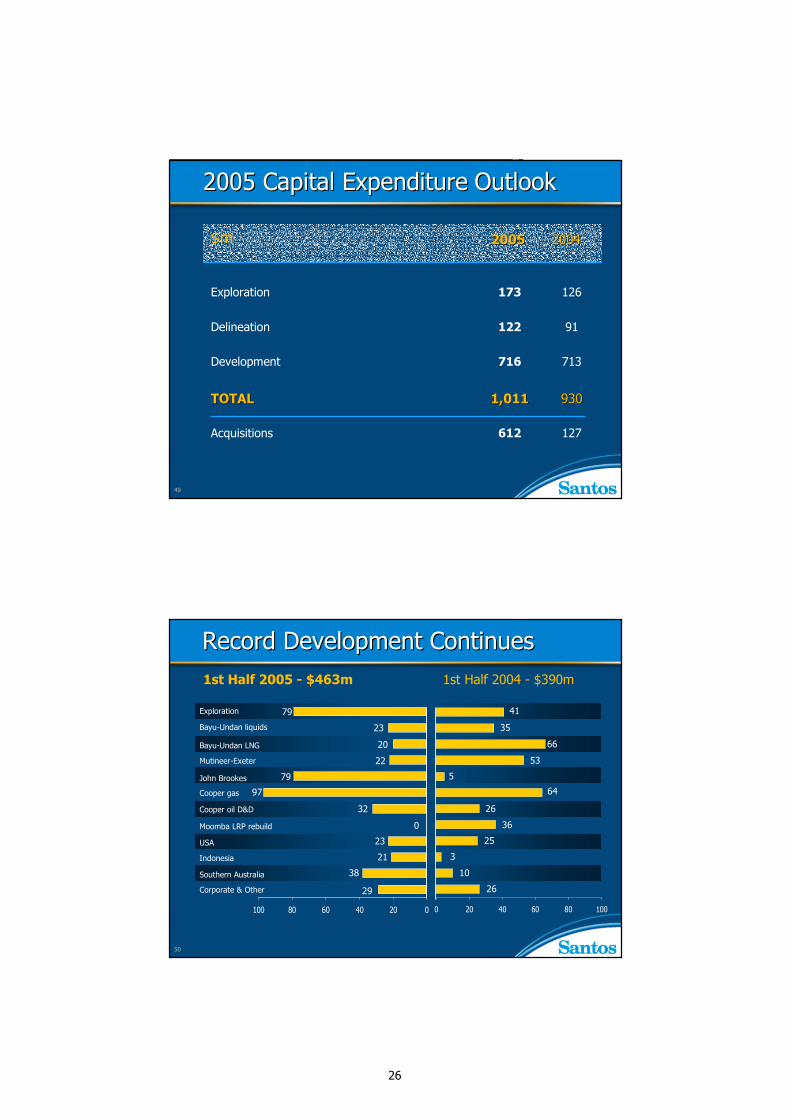
49
20052005 20042004
127612Acquisitions
9309301,0111,011TOTALTOTAL
713716Development
91122Delineation
126173Exploration
2005 Capital Expenditure2005 Capital Expenditure OutlookOutlook
$m
50
Record Development ContinuesRecord Development Continues1st Half 2004 - $390m1st Half 2005 - $463m
100 80 60 40 20 0
Exploration
Bayu-Undan liquids
Bayu-Undan LNG
Mutineer-Exeter
Cooper gas
Cooper oil D&D
Moomba LRP rebuild
USA
Southern Australia
Corporate & Other
20
22
79
97
32
0
23
21
38
29
66
53
5
64
26
36
25
3
10
26
John Brookes
Indonesia
35
4179
23
0 20 40 60 80 100
27
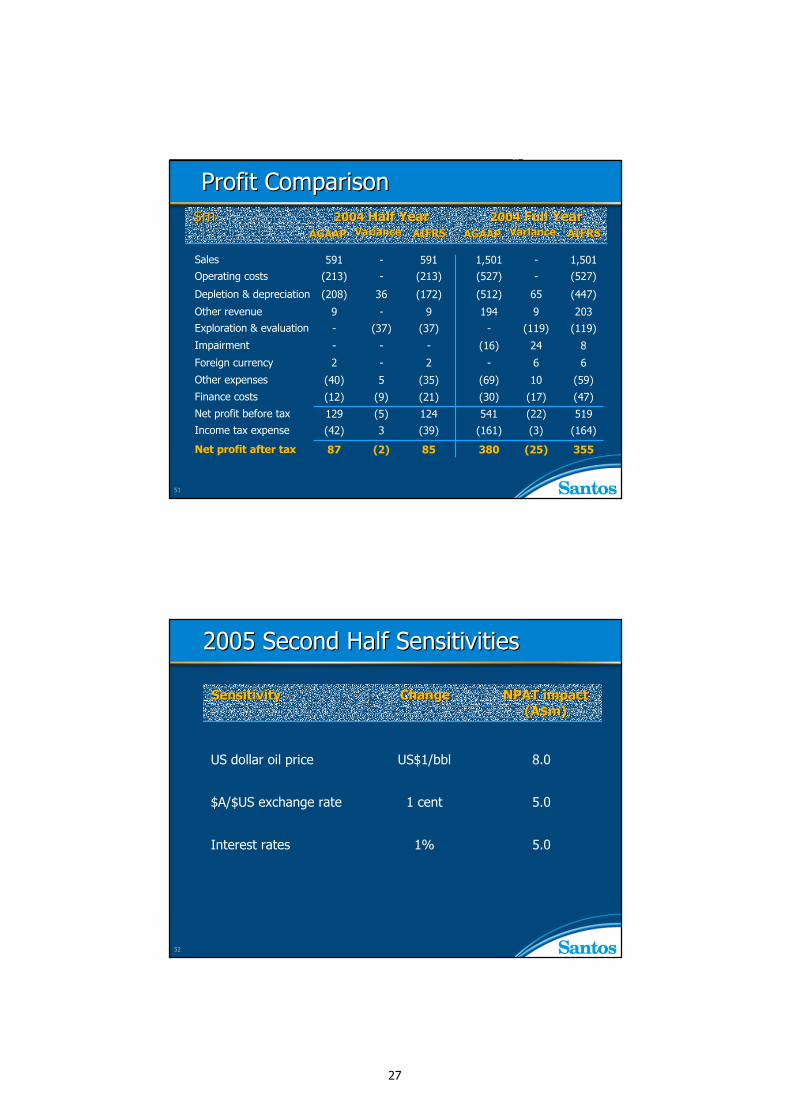
51
Profit Comparison Profit Comparison 2004 2004 Half Year Half Year
AGAAPAGAAP VarianceVariance AIFRSAIFRS2004 2004 Full Year Full Year
AGAAPAGAAP VarianceVariance AIFRSAIFRS
Sales
Operating costs
Depletion & depreciation
Other revenueExploration & evaluation
Impairment
Foreign currency
Finance costs
Other expenses
Net profit after tax
Income tax expense
Net profit before tax
591 - 591(213) - (213)
(208) 36 (172)
9 - 9
- (37) (37)
- - -
2 - 2
(40) 5 (35)
(12) (9) (21)
129 (5) 124
(42) 3 (39)
87 (2) 85
1,501 - 1,501(527) - (527)
(512) 65 (447)
194 9 203
- (119) (119)
(16) 24 8
- 6 6
(69) 10 (59)
(30) (17) (47)
541 (22) 519
(161) (3) (164)
380 (25) 355
$m$m
52
2005 Second Half Sensitivities 2005 Second Half Sensitivities
ChangeChange NPAT impactNPAT impact((A$mA$m))
SensitivitySensitivity
5.01%Interest rates
5.01 cent$A/$US exchange rate
8.0US$1/bblUS dollar oil price