2 q16 earnings-presentation-finl
TRANSCRIPT

the beautiful door
August 2016
2Q16 Earnings Presentation

2
SAFE HARBOR / FORWARD LOOKING STATEMENT
This investor presentation contains forward-looking information and other forward-looking statements within the meaning of applicable Canadian and/or U.S. securities laws, including our discussion of improvements in the housing market and related markets and the effects of our pricing and other strategies. When used in this Investor Presentation, such forward-looking statements may be identified by the use of such words as “may,” might, “could,” “will,” would,” “should,” “expect,” “believes,” “outlook,” “predict,” “forecast,” “framework,” “objective,” “remain,” “anticipate,” “estimate,” “potential,” “continue,” “plan,” “project,” “targeting,” or the negative of these terms or other similar terminology. Forward-looking statements involve significant known and unknown risks, uncertainties and other factors that may cause the actual results, performance or achievements of Masonite, or industry results, to be materially different from any future plans, goals, targets, objectives, results, performance or achievements expressed or implied by such forward-looking statements. As a result, such forward-looking statements should not be read as guarantees of future performance or results, should not be unduly relied upon, and will not necessarily be accurate indications of whether or not such results will be achieved. Factors that could cause actual results to differ materially from the results discussed in the forward-looking statements include, but are not limited to, our ability to successfully implement our business strategy; general economic, market and business conditions; levels of residential new construction, residential repair, renovation and remodeling and non-residential building construction activity; the United Kingdom referendum to exit the European Union; competition; our ability to manage our operations including integrating our recent acquisitions and companies or assets we acquire in the future; our ability to generate sufficient cash flows to fund our capital expenditure requirements and to meet our debt service obligations, including our obligations under our senior notes and our senior secured asset-backed credit facility; labor relations (i.e., disruptions, strikes or work stoppages), labor costs, and availability of labor; increases in the costs of raw materials or any shortage in supplies; our ability to keep pace with technological developments; the actions by, and the continued success of, certain key customers; our ability to maintain relationships with certain customers; new contractual commitments; our ability to generate the benefits of our restructuring activities; retention of key management personnel; environmental and other government regulations; limitations on operating our business as a result of covenant restrictions under our existing and future indebtedness, including our senior notes and senior secured asset-based credit facility; and other factors publicly disclosed by the company from time to time.
NON-GAAP FINANCIAL MEASURES
Our management reviews net sales and Adjusted EBITDA (as defined below) to evaluate segment performance and allocate resources. Net assets are not allocated to the reportable segments. Adjusted EBITDA is a non-GAAP financial measure which does not have a standardized meaning under GAAP and is unlikely to be comparable to similar measures used by other companies. Adjusted EBITDA should not be considered as an alternative to either net income or operating cash flows determined in accordance with GAAP. Additionally, Adjusted EBITDA is not intended to be a measure of free cash flow for management's discretionary use, as it does not include certain cash requirements such as interest payments, tax payments and debt service requirements. Beginning with the third quarter of 2015, we revised our calculation of Adjusted EBITDA to separately exclude loss (gain) on disposal of subsidiaries. The revision to this definition had no impact on our reported Adjusted EBITDA for the three and six months ended June 28, 2015. Adjusted EBITDA (as revised) is defined as net income (loss) attributable to Masonite adjusted to exclude the following items: depreciation; amortization; share based compensation expense; loss (gain) on disposal of property, plant and equipment; registration and listing fees; restructuring costs; asset impairment; loss (gain) on disposal of subsidiaries; interest expense (income), net; loss on extinguishment of debt; other expense (income), net; income tax expense (benefit); loss (income) from discontinued operations, net of tax; and net income (loss) attributable to non-controlling interest. This definition of Adjusted EBITDA is differs from the definitions of EBITDA contained in the indenture governing the 2023 Notes and the credit agreement governing the ABL Facility. Adjusted EBITDA, as calculated under our ABL Facility or senior notes would also include, among other things, additional add-backs for amounts related to: cost savings projected by us in good faith to be realized as a result of actions taken or expected to be taken prior to or during the relevant period; fees and expenses in connection with certain plant closures and layoffs; and the amount of any restructuring charges, integration costs or other business optimization expenses or reserve deducted in the relevant period in computing consolidated net income, including any one-time costs incurred in connection with acquisitions. The tables in the appendix to this presentation reconcile Adjusted EBITDA to net income (loss) attributable to Masonite for the periods indicated. We are not providing a quantitative reconciliation of our Adjusted EBITDA outlook to the corresponding GAAP information because the GAAP measures that we exclude from our Adjusted EBITDA outlook are difficult to predict and are primarily dependent on future uncertainties. Adjusted EPS for the quarter ended July 3, 2016 and June 28, 2015 is diluted earnings per common share attributable to Masonite (EPS) less asset impairment charges, loss (gain) on disposal of subsidiaries and loss on extinguishment of debt, net of related tax expense (benefit). Management uses this measure to evaluate the overall performance of the Company and believes this measure provides investors with helpful supplemental information regarding the underlying performance of the Company from period to period. This measure may be inconsistent with similar measures presented by other companies.
Safe Harbor / Non-GAAP Financial Measures

3
Company & Industry Update
the beautiful door
4
Company & Industry Update 2Q Overview
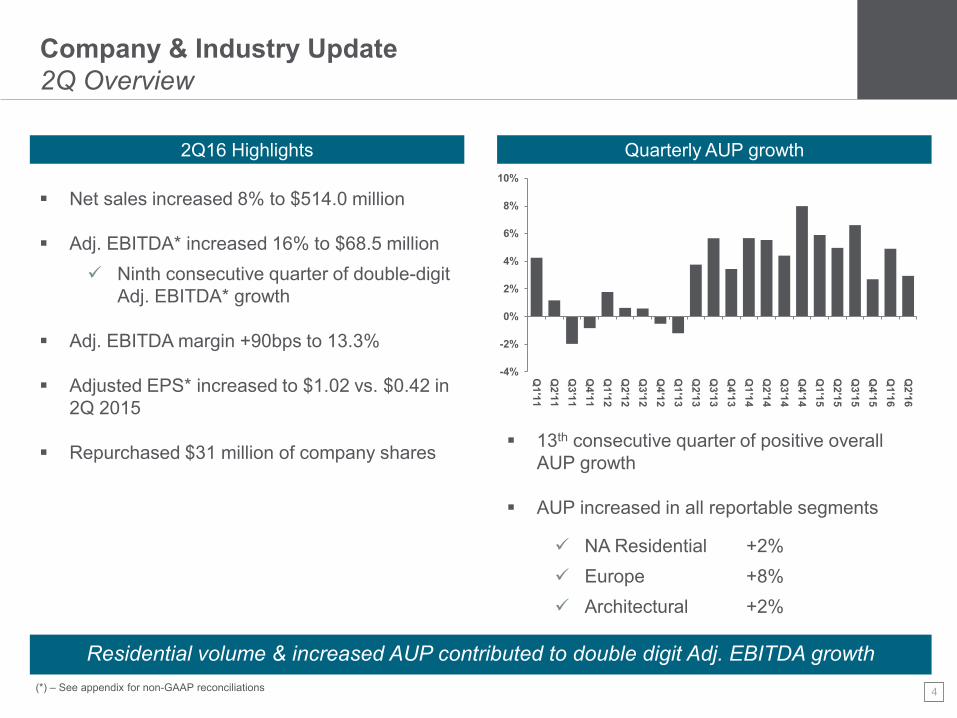
Residential volume & increased AUP contributed to double digit Adj. EBITDA growth
Quarterly AUP growth 2Q16 Highlights
Net sales increased 8% to $514.0 million
Adj. EBITDA* increased 16% to $68.5 million
Ninth consecutive quarter of double-digit Adj. EBITDA* growth
Adj. EBITDA margin +90bps to 13.3%
Adjusted EPS* increased to $1.02 vs. $0.42 in
2Q 2015
Repurchased $31 million of company shares
13th consecutive quarter of positive overall AUP growth
AUP increased in all reportable segments
NA Residential +2%
Europe +8%
Architectural +2%
(*) – See appendix for non-GAAP reconciliations
-4%
-2%
0%
2%
4%
6%
8%
10%
Q1'1
1
Q2'1
1
Q3'1
1
Q4'1
1
Q1'1
2
Q2'1
2
Q3'1
2
Q4'1
2
Q1'1
3
Q2'1
3
Q3'1
3
Q4'1
3
Q1'1
4
Q2'1
4
Q3'1
4
Q4'1
4
Q1'1
5
Q2'1
5
Q3'1
5
Q4'1
5
Q1'1
6
Q2'1
6

5
Company & Industry Update Segment Overview
North American Residential
(*) – Source: U.S. Census Bureau
($ in millions) 2Q16 2Q15 Diff
Net Sales $348.2 $304.9 +14%
Adj. EBITDA $55.7 $46.7 +19%
Margin 16.0% 15.3% +70bps
U.S. housing starts and completions* increased 0.2% and 5%, respectively, in 2Q16
Double digit volume growth in retail and wholesale channels
AUP experienced offsetting dynamics
Headwind from higher relative growth in interior vs. exterior
Tailwind from increased pre-hung units
Strong performance from new products
Heritage and Vista Grande continue to outpace expectations
Negative Fx due to declines in Mexican Peso
and Canadian Dollar

6
Company & Industry Update Segment Overview
Europe
($ in millions) 2Q16 2Q15 Diff
Net Sales $82.2 $77.1 +7%
Adj. EBITDA $12.8 $8.1 +59%
Margin 15.6% 10.4% +520bps
“Brexit”-related uncertainty driving some slowdown in new residential construction activity in 2Q
Demographics suggest UK still needs ~200K houses per year
RRR demand remains robust, with DSI
delivering 15% volume growth
Net sales and Adj. EBITDA impacted by decline in Pound Sterling vs. Euro and US dollar
Portfolio optimization driving continued Adj. EBITDA margin expansion
Integrations of PDS and National Hickman continue

7
Company & Industry Update Segment Overview
Architectural
($ in millions) 2Q16 2Q15 Diff
Net Sales $77.6 $76.0 +2%
Adj. EBITDA $7.7 $8.2 -6%
Margin 9.9% 10.8% -90bps
Volume flat in 2Q
Implementation of new Door Configurator and ERP platform created production backlog at one facility during the quarter
Tight labor market and new employees contributing to lower productivity at the plants
Market strength in Office and Healthcare
sectors. Hospitality demand strong but at lower end of product range
USA Wood Door growth demonstrates value proposition of value-added services offerings
8
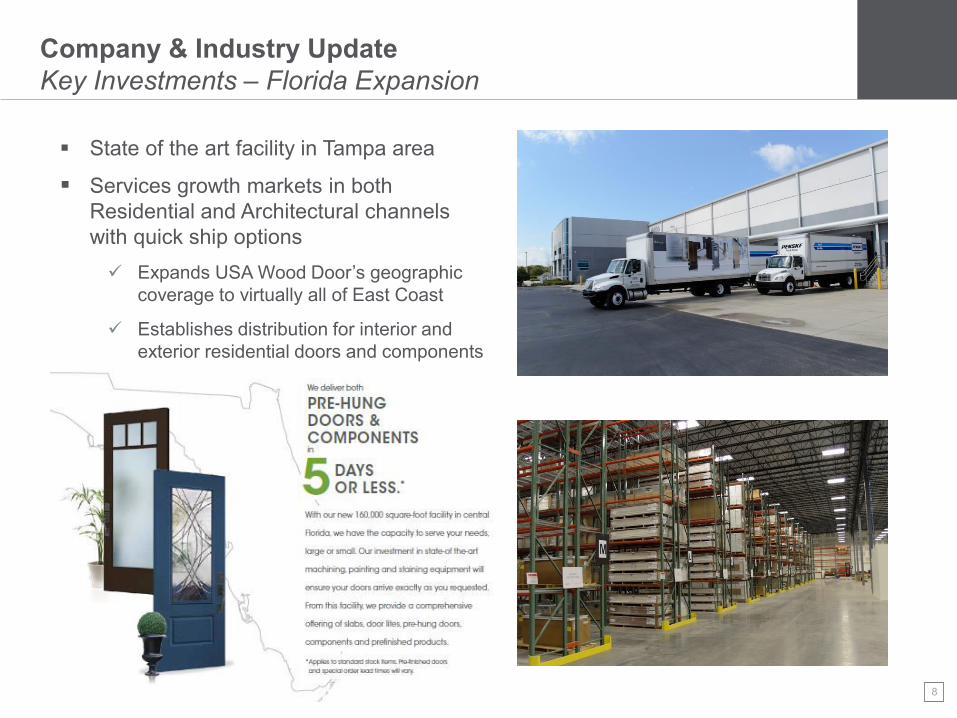
Company & Industry Update Key Investments – Florida Expansion
State of the art facility in Tampa area
Services growth markets in both Residential and Architectural channels with quick ship options
Expands USA Wood Door’s geographic coverage to virtually all of East Coast
Establishes distribution for interior and exterior residential doors and components
9
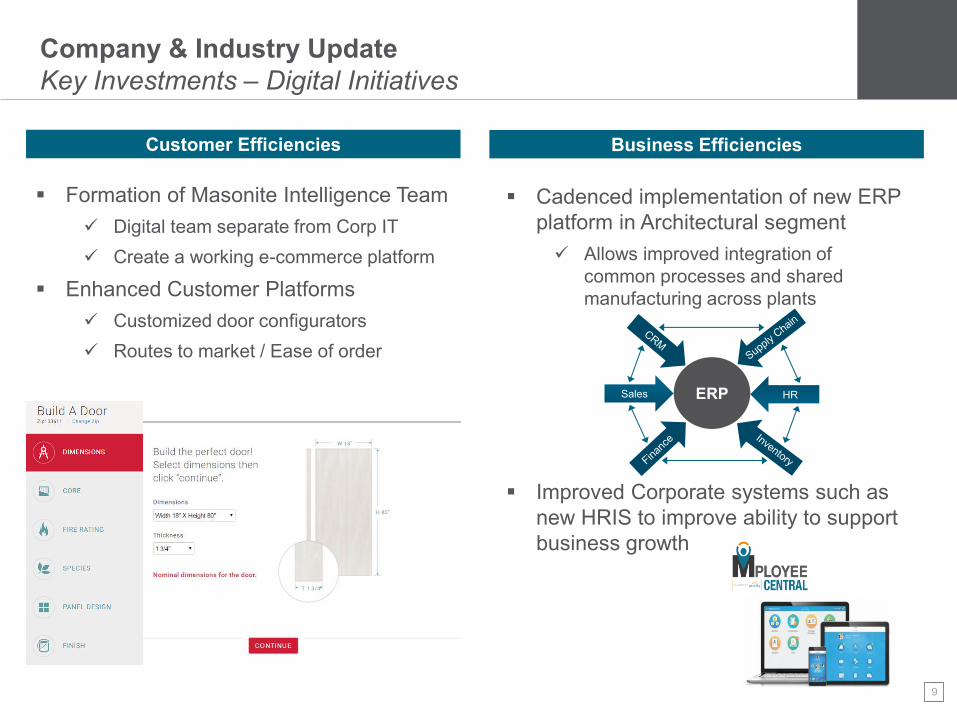
Company & Industry Update Key Investments – Digital Initiatives
Formation of Masonite Intelligence Team
Digital team separate from Corp IT
Create a working e-commerce platform
Enhanced Customer Platforms
Customized door configurators
Routes to market / Ease of order
Cadenced implementation of new ERP platform in Architectural segment
Allows improved integration of common processes and shared manufacturing across plants
Improved Corporate systems such as new HRIS to improve ability to support business growth
Customer Efficiencies Business Efficiencies
ERP Sales HR

10
the beautiful door
Financial Overview

11
$59.1
$68.5
2Q15 2Q16
$476.4
$514.0
2Q15 2Q16
Financial Overview 2Q16 Net Sales and Adjusted EBITDA
Adj. EBITDA Quarterly Drivers Net Sales
($ in millions) ($ in millions)
2Q15 2Q16 2Q15 2Q16
+16% +8%
+10% Excluding impact of F(x):
Strong volume growth in North American residential segment
“Brexit” concerns in UK housing market
Fx negatively impacted quarterly results
Weaker CAD vs. USD Weaker GBP vs. Euro
and USD
12
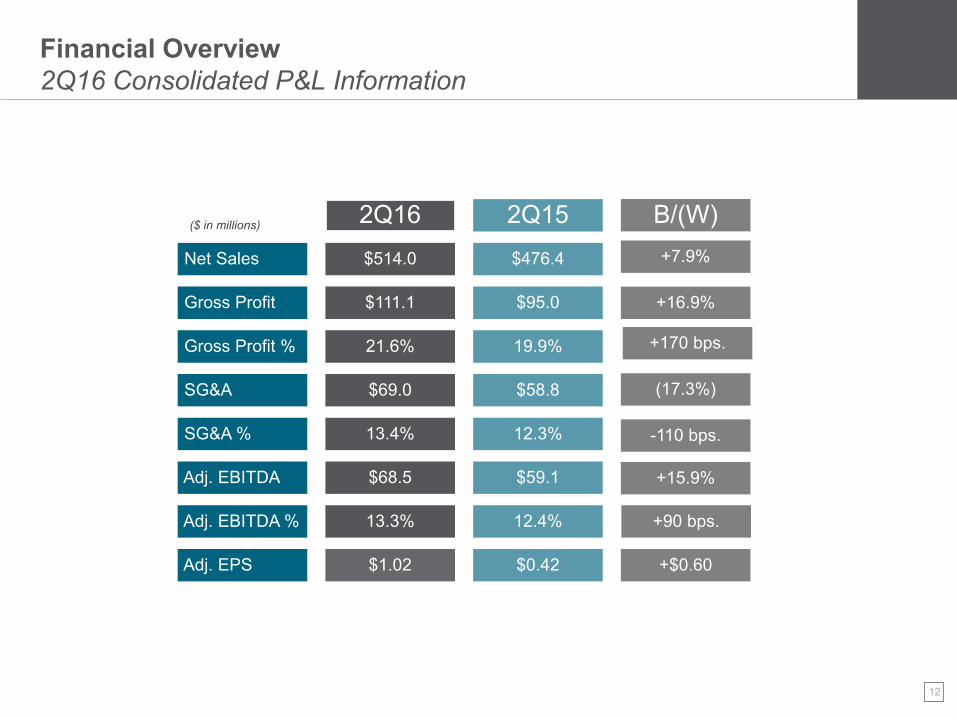
Financial Overview 2Q16 Consolidated P&L Information
Net Sales
Gross Profit
Gross Profit %
SG&A
SG&A %
Adj. EBITDA
Adj. EBITDA %
Adj. EPS
2Q16
$514.0
$111.1
21.6%
$69.0
13.4%
$68.5
13.3%
$1.02
2Q15
$476.4
$95.0
19.9%
$58.8
12.3%
$59.1
12.4%
$0.42
B/(W)
+7.9%
+16.9%
+170 bps.
(17.3%)
-110 bps.
+15.9%
+90 bps.
+$0.60
($ in millions)

13
Financial Overview Segment Sales Walk
2Q15 Net Sales
Forex
Volume*
AUP
Other
2Q16 Net Sales
NA Residential
$304.9
($5.1)
$42.5
$6.2
($0.3)
$348.2
Europe
$77.1
($2.4)
$1.1
$6.1
$0.3
$82.2
Architectural
$76.0
($0.4)
($0.1)
$1.7
$0.4
$77.6
C&O
$18.5
($0.1)
($13.4)
--
$1.0
$6.0
($ in millions)
+16% ex Fx +10% ex Fx +3% ex Fx
(*) – Includes the incremental impact of recent acquisitions and dispositions
Reflects removal of S. Africa

14
Financial Overview 2016 Viewpoints
Headwinds
Continued U.S. housing market growth
Expect mid to high-single digit growth in U.S. housing completions
Expect mid-single digit growth in the U.S. RRR market
New product investments driving higher AUP
Benign commodities market
Tightening labor market in U.S.
Increased hiring costs
Lower productivity from new recent employee hires
“Brexit” risk impact in UK housing market
Weak currencies including Pound Sterling and
Mexican Peso impact negatively impact costs
Tailwinds

15
Financial Overview Liquidity, Credit and Debt Profile
Credit & Debt (millions of USD)
TTM Adj. EBITDA $234.1 $170.2
TTM Interest Expense $28.5 $39.5
Total Debt $471.0 $468.2
Net Debt* $408.6 $331.9
2Q16 2Q15
Six months ended 7/3/2016
Six months ended 6/28/2015
Unrestricted cash $62.4 $136.3
Total available liquidity $228.8 $278.3
Cash flow from operations $57.0 $40.2
Capital expenditures $38.1 $17.9
Liquidity & Cash Flow (millions of USD)
(*) – Net debt equals total debt less cash
16
Summary / Q&A
the beautiful door
17
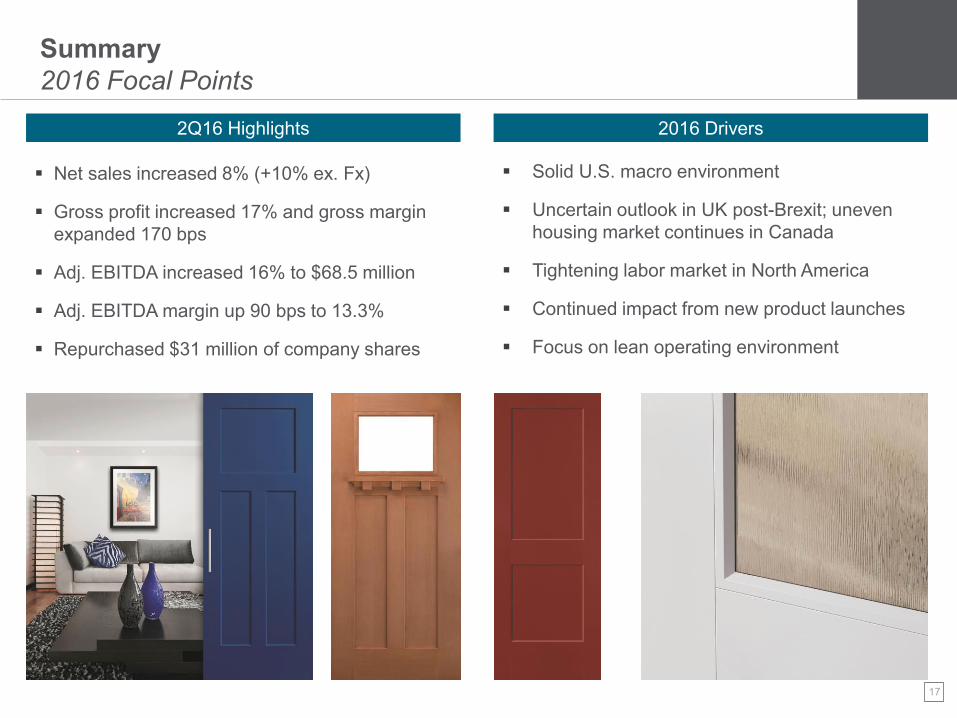
Summary 2016 Focal Points
2Q16 Highlights 2016 Drivers
Net sales increased 8% (+10% ex. Fx)
Gross profit increased 17% and gross margin expanded 170 bps
Adj. EBITDA increased 16% to $68.5 million
Adj. EBITDA margin up 90 bps to 13.3%
Repurchased $31 million of company shares
Solid U.S. macro environment
Uncertain outlook in UK post-Brexit; uneven housing market continues in Canada
Tightening labor market in North America
Continued impact from new product launches
Focus on lean operating environment

18
Summary Masonite’s Profitable Growth Agenda
Beneficial Tailwinds
Market Recovery
Consolidation
Optimized Portfolio
Leveraging Improved Cost Structure & Capabilities
Strategic Focus
Unparalleled Customer Experience
New product innovation
Digital innovation in routes to market
MVantage Lean Enterprise
Automation, Efficiency, Speed, Simplicity

the beautiful door
Appendix

20
Reconciliation of Adjusted EBITDA to Net Income (loss) Attributable to Masonite
(In thousands)
North
American
Residential Europe Architectural
Corporate &
Other Total
Adjusted EBITDA 55,666$ 12,839$ 7,672$ (7,661)$ 68,516$
Less (plus):
Depreciation 8,126 2,480 2,076 2,131 14,813
Amortization 1,225 2,393 2,064 836 6,518
Share based compensation expense - - - 4,782 4,782
Loss (gain) on disposal of property, plant and equipment 199 (1) 62 - 260
Restructuring costs - - - (103) (103)
Loss(gain) on disposal of subsidiaries - (1,431) - - (1,431)
Interest expense (income), net - - - 6,933 6,933
Other expense (income), net - 22 - (823) (801)
Income tax expense (benefit) - - - 2,855 2,855
Loss (income) from discontinued operations, net of tax - - - 184 184
Net income (loss) attributable to non-controlling interest 858 - - 293 1,151
Net income (loss) attributable to Masonite 45,258$ 9,376$ 3,470$ (24,749)$ 33,355$
(In thousands)
North
American
Residential Europe Architectural
Corporate &
Other Total
Adjusted EBITDA 46,713$ 8,053$ 8,185$ (3,894)$ 59,057$
Less (plus):
Depreciation 7,925 1,882 2,020 2,583 14,410
Amortization 1,091 924 2,074 886 4,975
Share based compensation expense - - - 3,106 3,106
Loss (gain) on disposal of property, plant and equipment 317 5 9 19 350
Restructuring costs 3 467 - 518 988
Loss(gain) on disposal of subsidiaries - - - - -
Interest expense (income), net - - - 6,787 6,787
Other expense (income), net - 45 - (680) (635)
Income tax expense (benefit) - - - 15,013 15,013
Loss (income) from discontinued operations, net of tax - - - 240 240
Net income (loss) attributable to non-controlling interest 823 - - (442) 381
Net income (loss) attributable to Masonite 36,554$ 4,730$ 4,082$ (31,924)$ 13,442$
Three Months Ended July 3, 2016
Three Months Ended June 28, 2015

21
Reconciliation of Adjusted EBITDA to Net Income (loss) Attributable to Masonite
(In thousands)
July 3,
2016
April 3,
2016
January 3,
2016
September 27,
2015
June 28,
2015
March 29,
2015
December 28,
2014
September 28,
2014
Adjusted EBITDA 68,516$ 58,241$ 56,840$ 50,512$ 59,057$ 37,788$ 37,722$ 35,597$
Less (plus):
Depreciation 14,813 14,570 14,890 14,554 14,410 15,306 14,798 15,842
Amortization 6,518 6,464 7,481 6,258 4,975 5,011 5,549 4,889
Share based compensation expense 4,782 3,728 6,261 1,490 3,106 2,379 2,270 2,255
Loss (gain) on disposal of property, plant
and equipment 260 132 786 291 350 (56) 1,457 236
Registration and listing fees — — — — — — — —
Restructuring costs (103) 19 1,195 1,139 988 2,356 (57) 9,913
Asset impairment — — — 9,439 — — 18,202 —Loss (gain) on disposal of subsidiaries (1,431) — 30,263 29,721 — — — —Interest expense (income), net 6,933 7,232 7,165 7,179 6,787 11,753 10,491 10,447
Loss on extinguishment of debt — — — — — 28,046 — —Other expense (income), net (801) 786 1,782 (1,720) (635) (1,184) (1,670) (404)
Income tax expense (benefit) 2,855 6,210 (599) (2,510) 15,013 3,264 1,131 2,004
Loss (income) from discontinued
operations, net of tax 184 188 247 192 240 229 194 124
Net income (loss) attributable to non-
controlling interest 1,151 1,084 1,583 762 381 1,736 1,724 258
Net income (loss) attributable to Masonite 33,355$ 17,828$ (14,214)$ (16,283)$ 13,442$ (31,052)$ (16,367)$ (9,967)$
Three Months Ended

22
Reconciliation of Adjusted Net Income (loss) Attributable to Masonite to Net Income (loss) Attributable to Masonite
(In thousands) July 3, 2016 June 28, 2015
Net income (loss) attributable to Masonite 33,355$ 13,442$
Add: Loss (gain) on dispoal of subsidiaries (1,431) -
Adjusted net income (loss) attributable to Masonite 31,924$ 13,442$
Diluted earnings (loss) per common share attributable to Masonite ("EPS") 1.06$ 0.42$
Diluted adjusted earnings (loss) per common share attributable to Masonite
("Adjusted EPS") 1.02$ 0.42$
Shares used in computing diluted EPS 31,331,664 31,693,824
Incremental shares issuable under share compensation plans and warrants - -
Shares used in computing diluted Adjusted EPS 31,331,664 31,693,824
Three Months Ended

23
the beautiful door