2. consumer´s demand analysis structure ffactors influencing an individual demand tthe impact of...
TRANSCRIPT

2. Consumer´s demand analysis
Structure Factors influencing an individual demand The impact of disposable income change:
- income consumption curve, Engel curves- income elasticity of demand
The impact of the change of price of selected goods on the quantity demanded:- price consumption curve and demand derivation- substitution and income effect, Giffen paradox, price elasticity
of demand The impact of the change of price of other goods on
the quantity demanded:- cross substitution effect, cross income effect- cross elasticity of demand
Relationship between demand elasticities, substitution elasticity
Derivation of market demand

Characteristics of an individual demand
Individual demand = demand of the sole consumer......depends on:
disposable incomeprice of the selected goodsprice of other goodsconsumer´s preferences and expectations

The impact of the change of disposable income on the individual demand
all other factors remain the samethe change of disposable income moves
the budget line... and the consumer´s equilibrium...
...↑I → BL (+consumer´s equi.) moves rightwards, ↓I → BL (+consumer´s equi.) moves leftwards
ICC (Income Consumption Curve) = set of the consumer´s equilibria upon different levels of disposable income (or: IEP – Income Epansion Path)

Income consumption curve – standard path
X
Y
E1
E2
E3
ICC
Growing income induces the growth of consumption of all „normal“ goods
I1I2
I3
IC1
IC2
IC3

What is „normal“ goods? ...if the growth of disposable income induces the growth of
consumption of specific goods, we can say it is a „normal goods“, and...
...if the decrease of disposable income induces the decrease of consumption of specific goods, so...
...↑I → ↑Q or ↓I → ↓Q essential goods – a subset of normal goods = if the
growth/decrease of disposable income is relatively higher than the growth/decrease of the consumption: ↑I > ↑Q or ↓I > ↓Q
luxury goods – a subset of normal goods = if the growth/decrease of disposable income is relatively smaller than the growth/decrease of the consumption: ↑I < ↑Q or ↓I < ↓Q
the opposite of normal goods = inferior goods – the growth of disposable income induces the decrease of the consumption, and vice versa: ↑I → ↓ Q or ↓I → ↑ Q
it depends on consumer´s preferences which goods is normal, or inferior
Application: EKC – Environmental Kuznets Curve
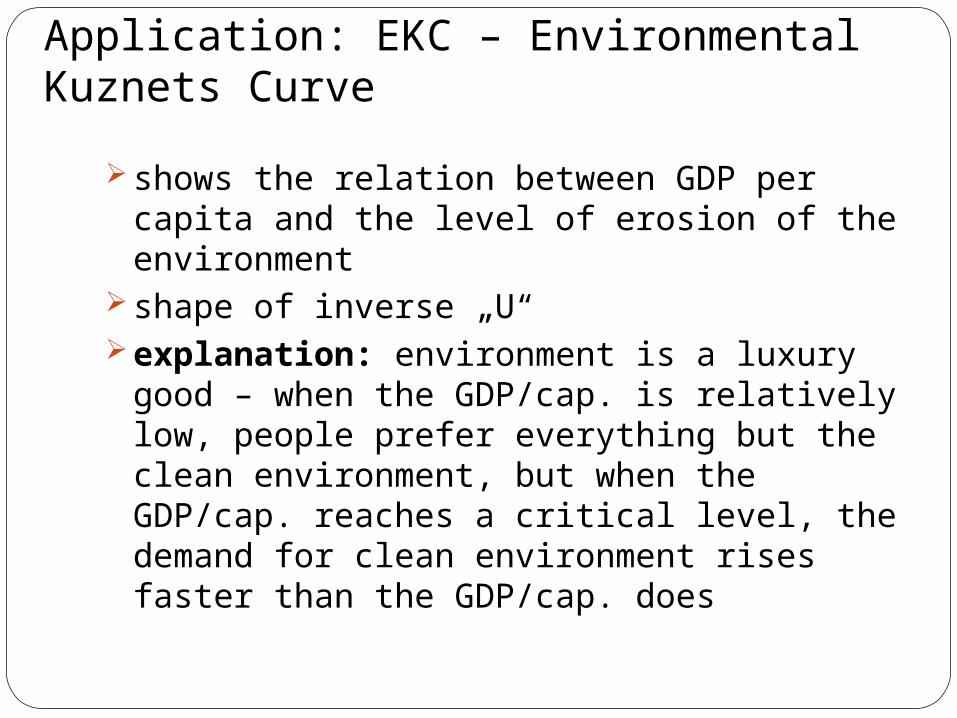
shows the relation between GDP per capita and the level of erosion of the environment
shape of inverse „U“explanation: environment is a luxury good
– when the GDP/cap. is relatively low, people prefer everything but the clean environment, but when the GDP/cap. reaches a critical level, the demand for clean environment rises faster than the GDP/cap. does

Application: EKC – Environmental Kuznets Curve
GDP/cap.
level of environment erosion
EKC
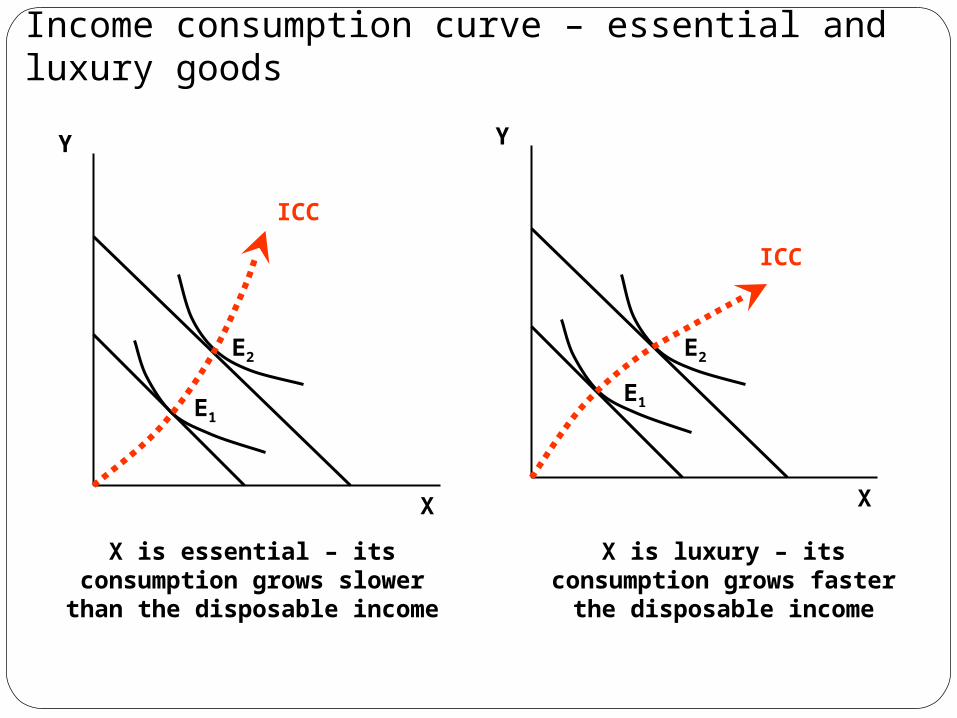
Income consumption curve – essential and luxury goods
X
Y
E1
E2
ICC
X is essential – its consumption grows slower than the disposable
income
X
Y
E1
E2
ICC
X is luxury – its consumption grows faster the disposable
income

Income consumption curve – inferior goods
X
Y
E1
E2
ICC
X is inferior – consumption decreases while disposable income rises
Engel Curve - EC
shows the relation between the volume of goods consumption and the disposable income

Engel curve - derivation
X
E1
E2
E3
ICC
Y
I3I2I1
X3X2X1
X1
X2
X3
I1 I2 I3 I
X
EC

Engel curve for essential, luxury and inferior goods
I
X
I
X
I
XEC
EC
EC
X is essential – its consumption grows
slower than the disposable income
X is luxury – its consumption grows faster the disposable
income
X is inferior – consumption decreases while disposable income
rises

Engel Expenditure Curve - EEC
represents the relation between the disposable income and total consumer´s expenditures on specific goods...
... the relation between P.Q and I
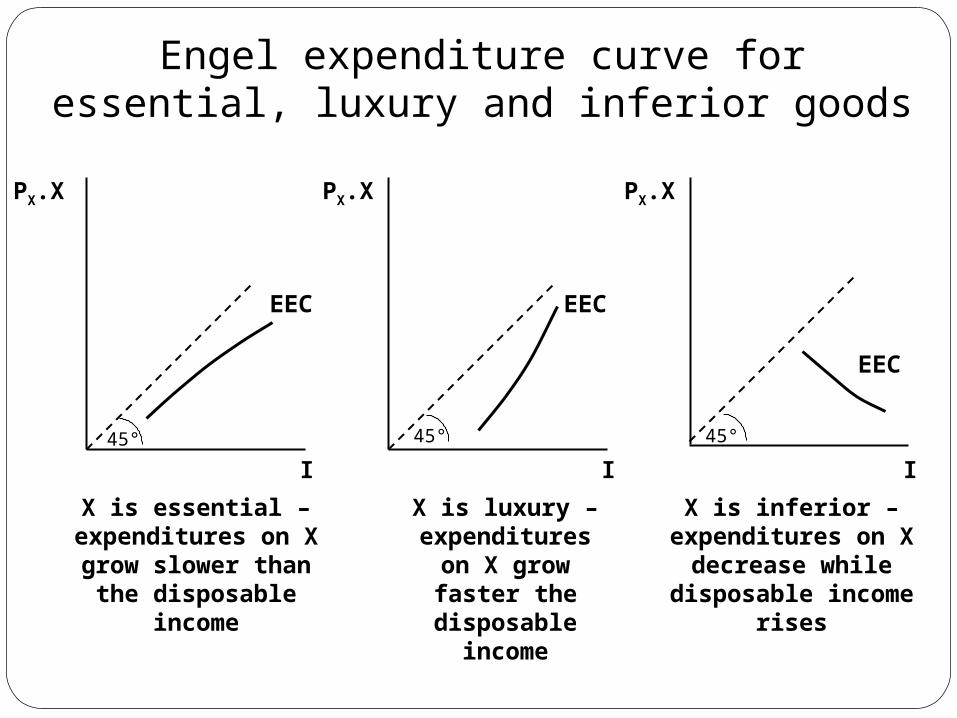
Engel expenditure curve for essential, luxury and inferior goods
I
PX.X
I I
EEC EEC
EEC
PX.X PX.X
45° 45°45°
X is essential – expenditures on X
grow slower than the disposable income
X is luxury – expenditures on X
grow faster the disposable
income
X is inferior – expenditures on X
decrease while disposable income
rises

Income elasticity of demand ...reflects the sensitivity of consumer´s
reaction to the change of disposable income and his/her consumption
it is a relative change of quantity demanded induced with the change of disposable income

Income elasticity of demandeID = (ΔX/X)/(ΔI/I) or eID = (∂X/∂I/X/I)eID> 0 for normal goods, eID < 0 for inferior goodseID > 1 for luxury goods, 0 < eID < 1 for essential
goodssum of income elasticities of all consumed goods
multiplied with the ratio of each good in the commodity cage must equal to 1 → μX.eIDX + μY.eIDY = 1, where:
μX... ratio of X, μY...ratio of Y→ if we buy a luxury good, we cannot avoid buying
an inferior good either
The impact of the change of price of specific goods on the quantity demanded
we suppose the change of price of X, while everything else remains unchanged (price of Y and disposable income)
if the price of X changes, the BL changes its slope (BL rotates clock-wise, or anticlock-wise)
PCC (Price Consumption Curve)

Price consumption curve
PCC = set of consumer´s equilibria upon different prices of specific good
E1
E2
E3
PCC
X
Y
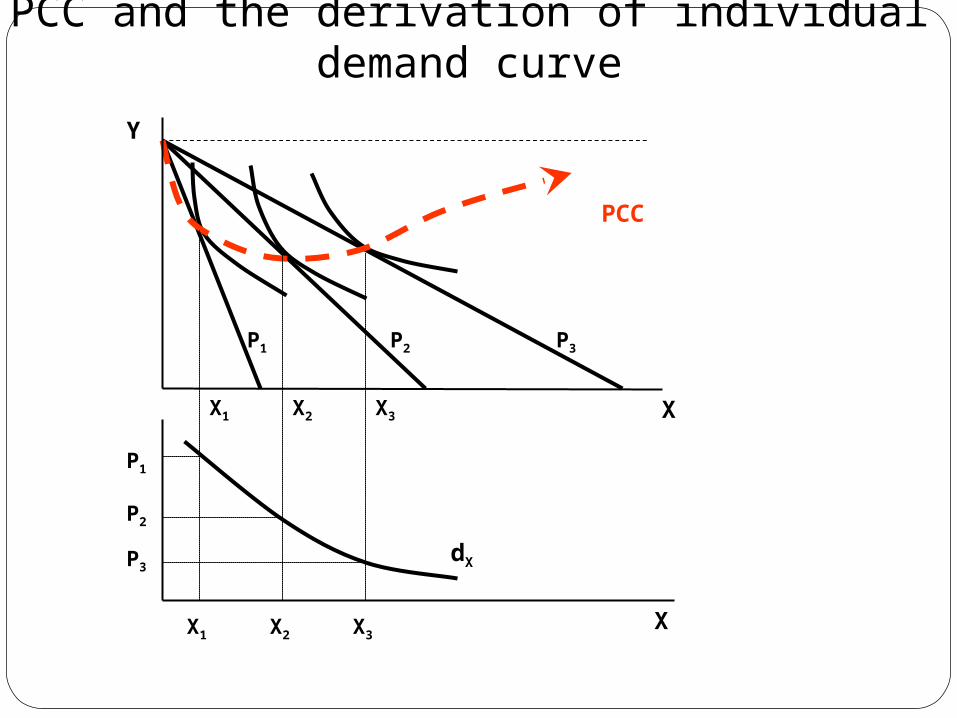
PCC and the derivation of individual demand curve
PCC
X
Y
X1 X3X2
X1 X2 X3
P1
P2
P3
P1 P2 P3
X
dX

Substitution and income effect – Hicks approach
Substitution Effect (SE) = change of quantity demanded resulting from the substitution of relatively more expensive good with the relatively cheaper good – SE is always negative, which means: ↓P → ↑X and vice versa, consumer moves along the original IC
Income Effect (IE) = change of quantity demanded resulting from the change of real disposable income – IE is negative for normal goods (↓P → ↑X and vice versa), and positive for inferior goods (↓P→↓X and vice versa), consumer moves to another IC
Note: IE increases the consumption of normal goods and decreases the consumption of inferior goods (in case of growing real income)
Total Effect (TE) = sum of SE + IE

Hicks decomposition on SE and IE – X is normal good
X
Y
U1
U2
SE IE
A
TE
B
C
Shift from A to B – substitution effect, the level of total utility remains constant
Shift from B to C – income effect, shift to higher IC (higher level of total utility)
Shift from A to C – total effect, sum of SE and IE

Hicks decomposition on SE and IE – X is inferior good
X
Y
U1
U2
SE IE
A
TE
B
C
Income effect counterworks the substitution effect – total effect still induces the growth of X consumption but not as
much as in the case of normal good

Giffen good (Giffen paradox)
it is a subset of inferior goods the decrease of price induces the decrease of
quantity demanded and vice versa → individual demand curve has a positive slope
goods with relatively high ratio on total consumer´s expenditures; fulfils basic needs; there are no close substitutes
an important role of consumer´s expectations i.e. basic food, fuel etc. during a crisis

Hicks decomposition on SE and IE – X is Giffen good
X
Y
U1
U2
SE
IE
A
TE
B
C
Income effect counterworks the substitution effect, and IE>SE – total effect implies that if the price of X decreases, the quantity of X demanded
is decreasing

Slutsky approach to the SE and IE
different approach to the substitution effect resulting from the change of price of goods
Hicks SE – consumer is able to reach the constant level of total utility after the relative prices change
Slutsky SE – consumer is able to reach the former commodity cage after the change of relative prices
Slutsky´s SE includes some of the Hicks´s IE
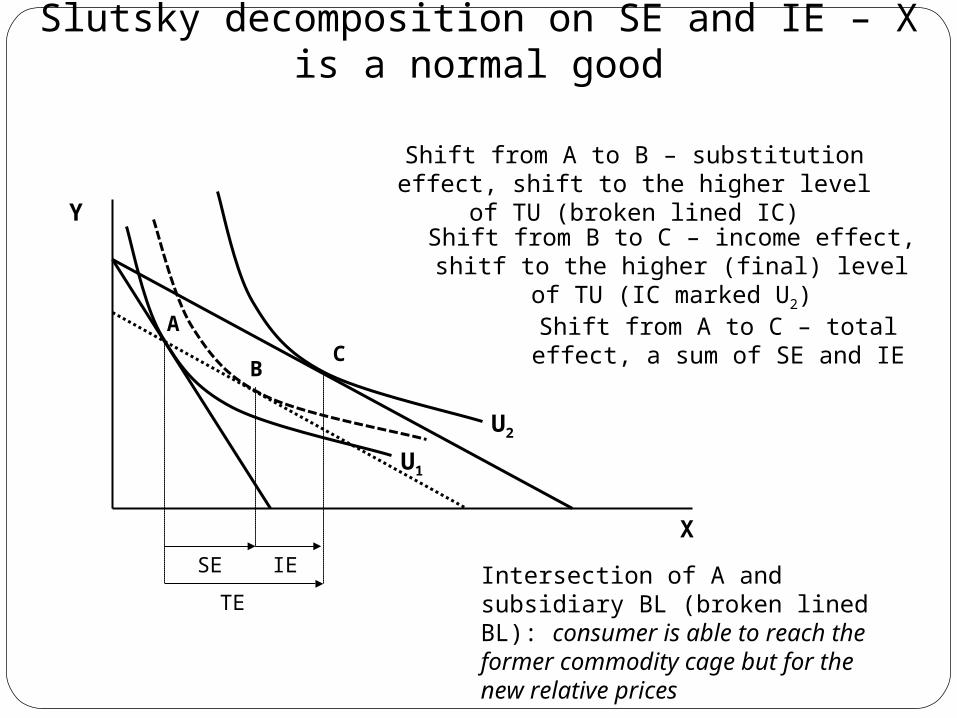
Slutsky decomposition on SE and IE – X is a normal good
X
U1
U2
SE IE
A
TE
BC
Y
Shift from A to B – substitution effect, shift to the higher level of TU (broken lined IC)
Shift from B to C – income effect, shitf to the higher (final) level of TU (IC marked U2)
Shift from A to C – total effect, a sum of SE and IE
Intersection of A and subsidiary BL (broken lined BL): consumer is able to reach the former commodity cage but for the new relative prices
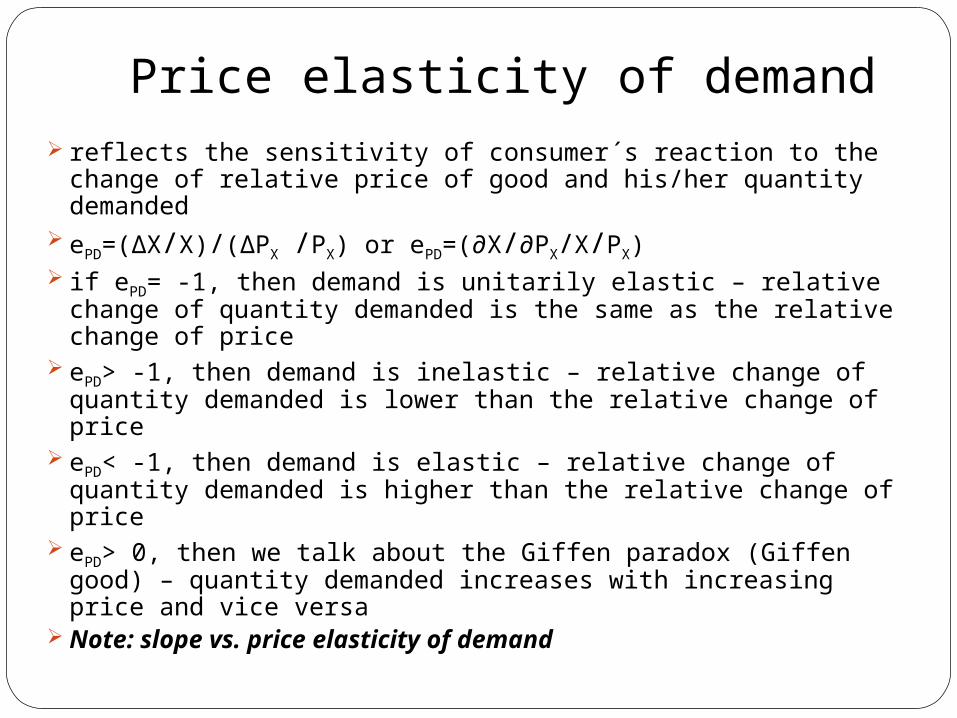
Price elasticity of demand reflects the sensitivity of consumer´s reaction to the change
of relative price of good and his/her quantity demanded ePD=(ΔX/X)/(ΔPX /PX) or ePD=(∂X/∂PX/X/PX) if ePD= -1, then demand is unitarily elastic – relative change of
quantity demanded is the same as the relative change of price
ePD> -1, then demand is inelastic – relative change of quantity demanded is lower than the relative change of price
ePD< -1, then demand is elastic – relative change of quantity demanded is higher than the relative change of price
ePD> 0, then we talk about the Giffen paradox (Giffen good) – quantity demanded increases with increasing price and vice versa
Note: slope vs. price elasticity of demand
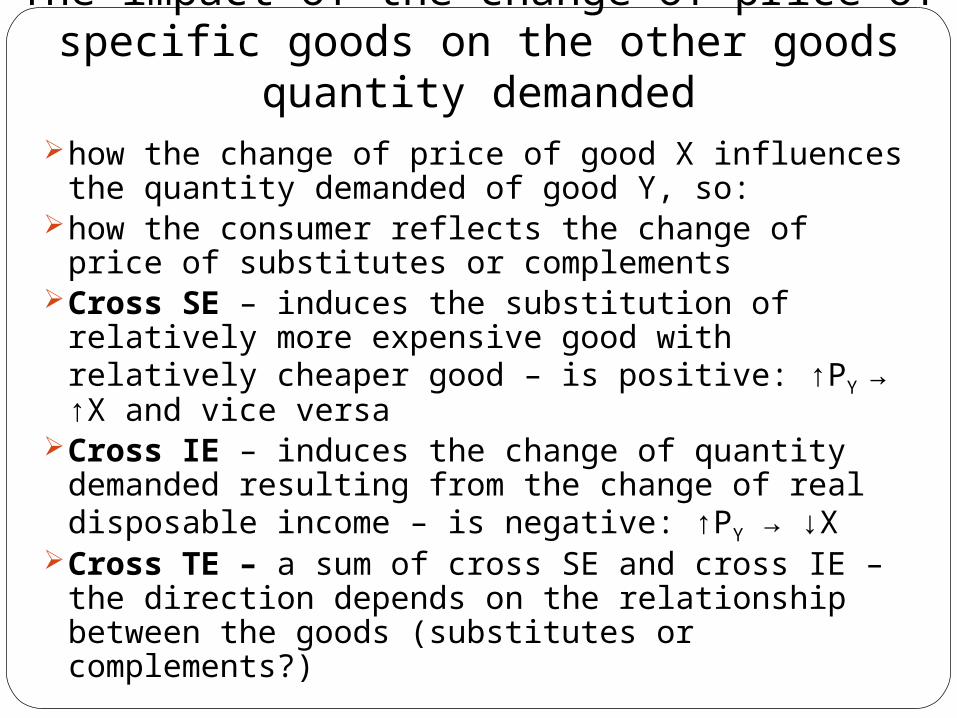
The impact of the change of price of specific goods on the other goods quantity
demandedhow the change of price of good X influences the
quantity demanded of good Y, so:how the consumer reflects the change of price of
substitutes or complementsCross SE – induces the substitution of relatively
more expensive good with relatively cheaper good – is positive: ↑PY → ↑X and vice versa
Cross IE – induces the change of quantity demanded resulting from the change of real disposable income – is negative: ↑PY → ↓X
Cross TE – a sum of cross SE and cross IE – the direction depends on the relationship between the goods (substitutes or complements?)

Decomposition on cross SE and IE - complements
X
Y
U1
U2
SE
IE
A
B
C
TE
Shift from A to B – cross SE
Shift from B to C – cross IE
Shift from A to C – cross TE, a sum of cross SE and IE
In the case of complements the cross IE outweighs the cross SE – i.e. if the diesel gets
cheaper (good Y), the demand for cars with diesel engines (good X) increases
X
U1
U2
SE
IE
A
B
C
TE
Y
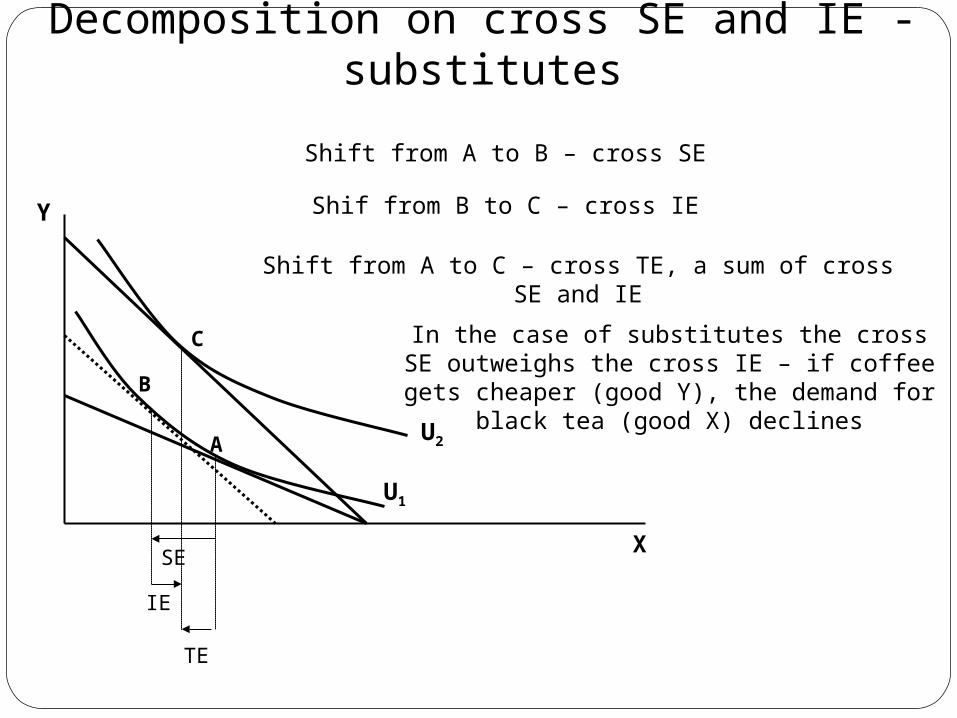
In the case of substitutes the cross SE outweighs the cross IE – if coffee gets cheaper (good Y), the
demand for black tea (good X) declines
Decomposition on cross SE and IE - substitutes
Shift from A to B – cross SE
Shif from B to C – cross IE
Shift from A to C – cross TE, a sum of cross SE and IE

Task:
What are the cross effects in the case of perfect complements and/or perfect
substitutes?

Cross elasticity of demand
reflects the relative change of quantity demand of specific good (godd X) reulsting from the relative change of price of the other good (good Y)
eCD=(ΔX/X)/(ΔPY /PY) or eCD=(∂X/∂PY/X/PY) if eCD > 0, then X and Y are substitutes if eCD < 0, then X and Y are complements for the sum of all three kinds of elasticities
stands:eID + ePD + eCD = 0 ... why?

Elasticity of substitution
reflects the relative change of the ratio of substitution of goods with each other...
...a variable that implies the shape of indifference curves
σ = Δ(Y/X) : Δ(MRSC)
Y/X MRSC
σ = ∞ for perfect substitutesσ = 0 for perfect complements

Derivation of market demand
market demand is the horizontal sum of all individual demands (demands of all consumers) for the specific good

Derivation of market demand
4 8
6
3
Q
P
15
Individual demands of „green“ and „red“ consumer
P
6
3
8 23
Market demand = demand of „green“ consumer + demand of „red“ consumer
DT
DR
DG