1q 2021 earnings release and supplemental information
TRANSCRIPT

1Q 2021 Earnings Release and Supplemental Information
Quarter Ended March 31, 2021
CyrusOne Investor RelationsMichael Schafer
Vice President, Capital Markets & Investor Relations
972-350-0060

1Q 2021 Earnings Release and Supplemental Information
Quarter Ended March 31, 2021
Table of Contents
Earnings Release…………………………………………………………………………………………... 3
Company Profile and Analyst Coverage…………………………………………………………………. 9
Summary of Financial Data……………………………………………………………………………….. 10
Condensed Consolidated Statements of Operations…………………………………………………... 11
Condensed Consolidated Balance Sheets………………………………………………………………. 12
Condensed Consolidated Statements of Operations (5 quarters)…………………………………….. 13
Condensed Consolidated Balance Sheets (5 quarters)………………………………………………... 14
Condensed Consolidated Statements of Cash Flow…………………………………………………… 15
Reconciliation of Net Income (Loss) to Net Operating Income (NOI) and to Adjusted EBITDA….. 16
Reconciliation of Net Income (Loss) to FFO and Normalized FFO…………………………………… 17
Market Cap Summary, Reconciliation of Net Debt and Interest Summary………………………….. 18
Debt Schedule and Debt Covenants…………………………………………………………………….. 19
Colocation Square Footage (CSF) and CSF Leased…………………………………………………... 20
2021 Guidance……………………………………………………………………………………………... 21
Data Center Portfolio………………………………………………………………………………………. 22
Gross Square Feet (GSF) Under Development and Land Available for Future Development…….. 24
Leasing Statistics - Lease Signings and New MRR Signed - Existing vs. New Customers……….. 25
Customer Sector Diversification………………………………………………………………………….. 26
Lease Distribution………………………………………………………………………………………….. 27
Lease Expirations………………………………………………………………………………………….. 28

3
CyrusOne Reports First Quarter 2021 Earnings
Signed $35.4 Million in Annualized GAAP Revenue and 28 Megawatts in 1Q’21
DALLAS (April 28, 2021) - CyrusOne Inc. (NASDAQ: CONE), a premier global data center REIT, today announced first quarter 2021 earnings. Highlights
Category 1Q’21* vs. 1Q’20 Revenue $298.6 million 21% Net income $18.2 million 24% Adjusted EBITDA $140.3 million 6% Normalized FFO $120.2 million 8% Net income per diluted common share $0.15 15% Normalized FFO per diluted common share $1.00 3%
*Includes the following electricity rate impacts at our Texas data centers as a result of Winter Storm Uri:
− $27.8 million positive impact to Revenue (Metered Power Reimbursements) − $(3.7) million negative impact to Net income, Adjusted EBITDA, and Normalized FFO − $(0.03) negative impact to Net income per diluted common share and
Normalized FFO per diluted common share
• Leased 28 megawatts (“MW”) and 156,000 colocation square feet (“CSF”) in the first quarter, totaling $35.4 million in annualized GAAP revenue
• Backlog of approximately $113 million in annualized GAAP revenue as of the end of the first quarter representing approximately $955 million in total contract value
• Settled a forward sale agreement entered into in 2020, resulting in net proceeds of approximately $95 million, which were used to pay down a portion of amounts outstanding on the Company’s unsecured revolving credit facility
− The Company has approximately $385 million in remaining available forward equity
• Subsequent to the end of the quarter, executed an agreement to acquire a 12-acre site in Frankfurt, providing 63 MW of power capacity to support our continued growth in one of the strongest data center markets in Europe
“Our bookings for the quarter included strong results from our U.S. portfolio and a significant contribution from our hyperscale customers,” said Bruce W. Duncan, president and chief executive officer of CyrusOne. “We are excited to announce the execution of an agreement to acquire an additional development site in Frankfurt, which will give us more product in one of our strongest markets to support our customers as they expand in Europe. We remain well positioned for continued growth with a $113 million revenue backlog, capacity across our markets, and $1.6 billion in available liquidity, including nearly $400 million in available forward equity.” First Quarter 2021 Financial Results Revenue was $298.6 million for the first quarter, compared to $245.9 million for the same period in 2020, an increase of 21%. The increase in revenue was driven in part by $27.8 million in metered power reimbursements as a result of electricity rate impacts at our Texas data centers from Winter Storm Uri. Other drivers included a 7% increase in occupied CSF and additional interconnection services. Net income was $18.2 million for the first quarter, compared to net income of $14.7 million in the same period in 2020, an increase of 24%. Net income for the first quarter included a $15.4 million gain associated with a change in fair value on the undesignated portion of the Company’s net investment hedge compared to a $5.1 million gain in the first quarter of 2020. The Company recognized a $2.4 million gain during the first quarter of 2021 on its marketable equity investment in GDS Holdings Limited, compared to a $14.7 million gain in the first quarter of 2020. Additionally, in the first quarter of 2020, the Company had a $(3.4) million loss on the early extinguishment of debt associated with the amendment of its senior unsecured credit agreement. Net income per diluted common share1 was $0.15 in the first quarter of 2021, compared to net income per diluted common share of $0.13 in the same period in 2020.
4
Net operating income (“NOI”)2 was $162.8 million for the first quarter, compared to $153.3 million in the same period in 2020, an increase of 6%. Adjusted EBITDA3 was $140.3 million for the first quarter, compared to $132.2 million in the same period in 2020, an increase of 6%. Normalized Funds From Operations (“Normalized FFO”)4 was $120.2 million for the first quarter, compared to $111.8 million in the same period in 2020, an increase of 8%. Normalized FFO per diluted common share was $1.00 in the first quarter of 2021, compared to $0.97 in the same period in 2020, an increase of 3%. Net income, Adjusted EBITDA, and Normalized FFO were each negatively impacted by $(3.7) million as a result of higher electricity rates at our Texas data centers from Winter Storm Uri, while Net income per diluted common share and Normalized FFO per diluted common share were each negatively impacted by $(0.03) as a result. Leasing Activity CyrusOne leased approximately 28 MW of power and 156,000 CSF in the first quarter, representing approximately $2.9 million in monthly recurring rent, inclusive of the monthly impact of installation charges. The leasing for the quarter represents approximately $35.4 million in annualized GAAP revenue5, excluding estimates for pass-through power. The weighted average lease term of the new leases, based on square footage, is 116 months (9.7 years), and the weighted average remaining lease term of CyrusOne’s portfolio is 52 months (taking into consideration the impact of the backlog). Recurring rent churn percentage6 for the first quarter was 1.8%, compared to 1.0% for the same period in 2020. Portfolio Development and Percentage CSF Leased In the first quarter, the Company completed construction on 78,000 CSF and 14 MW of power capacity in the New York Metro area and Frankfurt. Percentage CSF leased7 as of the end of the first quarter was 85% for stabilized properties8 and 82% overall. In addition, the Company has development projects underway in Frankfurt, Dublin, Paris, London, Northern Virginia, Phoenix, the New York Metro area, Cincinnati, and San Antonio that are expected to add approximately 380,000 CSF and 100 MW of power capacity plus 279,000 square feet of powered shell. Balance Sheet and Liquidity As of March 31, 2021, the Company had gross asset value9 totaling approximately $8.8 billion, an increase of approximately 13% over gross asset value as of March 31, 2020. CyrusOne had $3.37 billion of long-term debt10, $241 million of cash and cash equivalents, and approximately $1.01 billion available under its unsecured revolving credit facility as of March 31, 2021. Net debt10 was $3.16 billion as of March 31, 2021, representing approximately 28% of the Company's total enterprise value as of March 31, 2021 of $11.5 billion. This represented approximately 4.9x Adjusted EBITDA for the last quarter annualized (after further adjusting net debt to reflect the pro forma impact of settlement of the forward sale agreements). Available liquidity11 was $1.63 billion as of March 31, 2021. During the first quarter of 2021, the Company settled a forward sale agreement entered into in 2020, resulting in net proceeds of approximately $95 million, which were used to pay down a portion of amounts outstanding on the Company’s unsecured revolving credit facility. The Company has approximately $385 million in remaining available forward equity (no portion of these forward sale agreements has been settled as of April 28, 2021). As of March 31, 2021, there was approximately $151 million in remaining availability under the ATM equity program. Dividend On February 17, 2021, the Company announced a dividend of $0.51 per share of common stock for the first quarter of 2021. The dividend was paid on April 9, 2021, to stockholders of record at the close of business on March 26, 2021. Additionally, today the Company is announcing a dividend of $0.51 per share of common stock for the second quarter of 2021. The dividend will be paid on July 9, 2021, to stockholders of record at the close of business on June 25, 2021.

5
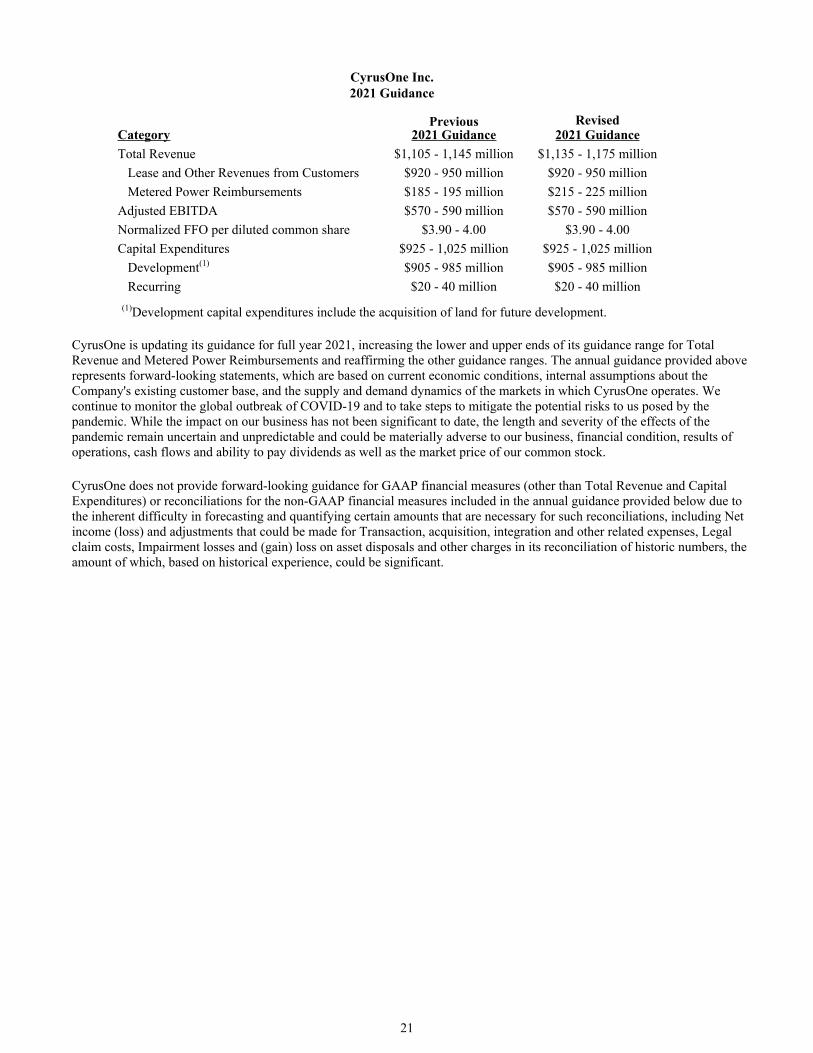
Guidance CyrusOne is updating its guidance for full year 2021, increasing the lower and upper ends of its guidance range for Total Revenue and Metered Power Reimbursements and reaffirming the other guidance ranges. The annual guidance provided below represents forward-looking statements, which are based on current economic conditions, internal assumptions about the Company's existing customer base, and the supply and demand dynamics of the markets in which CyrusOne operates. We continue to monitor the global outbreak of COVID-19 and to take steps to mitigate the potential risks to us posed by the pandemic. While the impact on our business has not been significant to date, the length and severity of the effects of the pandemic remain uncertain and unpredictable and could be materially adverse to our business, financial condition, results of operations, cash flows and ability to pay dividends as well as the market price of our common stock. CyrusOne does not provide forward-looking guidance for GAAP financial measures (other than Total Revenue and Capital Expenditures) or reconciliations for the non-GAAP financial measures included in the annual guidance provided below due to the inherent difficulty in forecasting and quantifying certain amounts that are necessary for such reconciliations, including Net income (loss) and adjustments that could be made for Transaction, acquisition, integration and other related expenses, Legal claim costs, Impairment losses and (gain) loss on asset disposals and other charges in its reconciliation of historic numbers, the amount of which, based on historical experience, could be significant.
Category Previous 2021 Guidance Revised 2021 Guidance Total Revenue $1,105 - 1,145 million $1,135 - 1,175 million Lease and Other Revenues from Customers $920 - 950 million $920 - 950 million Metered Power Reimbursements $185 - 195 million $215 - 225 million Adjusted EBITDA $570 - 590 million $570 - 590 million Normalized FFO per diluted common share $3.90 - 4.00 $3.90 - 4.00 Capital Expenditures $925 - 1,025 million $925 - 1,025 million Development(1) $905 - 985 million $905 - 985 million Recurring $20 - 40 million $20 - 40 million (1)Development capital expenditures include the acquisition of land for future development.
Upcoming Conferences and Events (All Virtual)
• RBC Capital Markets Global Datacenter, Cloud and Broadband Infrastructure Conference on May 25 • NAREIT’s REITweek Investor Conference on June 8-10 • CyrusOne Investor Meeting on June 16
Conference Call Details CyrusOne will host a conference call on April 29, 2021, at 11:00 AM Eastern Time (10:00 AM Central Time) to discuss its results for the first quarter 2021. A live webcast of the conference call will be available in the “Investors / Events & Presentations” section of the Company's website at http://investor.cyrusone.com/events.cfm. The presentation to be made during the call is now available in this location. The U.S. conference call dial-in number is 1-844-492-3731, and the international dial-in number is 1-412-542-4121. A replay will be available one hour after the conclusion of the earnings call on April 29, 2021, through May 13, 2021. The U.S. toll-free replay dial-in number is 1-877-344-7529 and the international replay dial-in number is 1-412-317-0088. The replay access code is 10153912.
Safe Harbor This release and the documents incorporated by reference herein contain certain forward-looking statements within the meaning of Section 27A of the Securities Act of 1933, as amended, and Section 21E of the Securities Exchange Act of 1934, as amended. We intend such forward- looking statements to be covered by the safe harbor provisions for forward-looking statements contained in the Private Securities Litigation Reform Act of 1995 and include this statement for purposes of complying with these safe harbor provisions. All statements, other than statements of historical facts, are statements that could be deemed forward-looking statements. These statements are based on current expectations, estimates, forecasts, and projections about the industries in which we operate and the beliefs and assumptions of our management. Words such as "expects," "anticipates," "predicts," "projects," "intends," "plans," "believes," "seeks," "estimates," "continues," "endeavors," "strives," "may," variations of such words and similar expressions are intended to identify such forward-looking statements. In addition, any statements that refer to projections of our future financial performance, our anticipated growth and trends in our and our customers’ respective businesses and industries, and other characterizations of future events or circumstances are forward-looking statements. Readers are cautioned these forward-looking statements are based on current expectations and assumptions that are subject to risks and uncertainties, which could cause our actual results to differ materially and adversely from those reflected in the forward-looking statements. Factors that could cause or contribute to such differences include, but are not limited to, (i) the potential widespread and highly uncertain impact of public health outbreaks, epidemics and pandemics, such as the COVID-19 pandemic; (ii) loss of key customers; (iii) indemnification and liability provisions as well as service level commitments in our contracts with customers imposing significant costs on us in the event of

6
losses; (iv) economic downturn, natural disaster or oversupply of data centers in the limited geographic areas that we serve; (v) risks related to the development of our properties including, without limitation, obtaining applicable permits, power and connectivity, and our ability to successfully lease those properties; (vi) weakening in the fundamentals for data center real estate, including but not limited to, increased competition, falling market rents, decreases in or slowed growth of global data, e-commerce and demand for outsourcing of data storage and cloud-based applications; (vii) loss of access to key third-party service providers and suppliers; (viii) risks of loss of power or cooling which may interrupt our services to our customers; (ix) inability to identify and complete acquisitions and operate acquired properties; (x) our failure to obtain necessary outside financing on favorable terms, or at all; (xi) restrictions in the instruments governing our indebtedness; (xii) risks related to environmental, social and governance matters; (xiii) unknown or contingent liabilities related to our acquisitions; (xiv) significant competition in our industry; (xv) recent turnover, or the further loss of, any of our key personnel; (xvi) risks associated with real estate assets and the industry; (xvii) failure to maintain our status as a REIT (as defined below) or to comply with the highly technical and complex REIT provisions of the Internal Revenue Code of 1986, as amended; (xviii) REIT distribution requirements could adversely affect our ability to execute our business plan; (xix) insufficient cash available for distribution to stockholders; (xx) future offerings of debt may adversely affect the market price of our common stock; (xxi) increases in market interest rates will increase our borrowing costs and may drive potential investors to seek higher dividend yields and reduce demand for our common stock; (xxii) market price and volume of stock could be volatile; (xxiii) risks related to regulatory changes impacting our customers and demand for colocation space in particular geographies; (xxiv) our international activities, including those conducted as a result of land acquisitions and with respect to leased land and buildings, are subject to special risks different from those faced by us in the United States; (xxv) the continuing uncertainty about the future relationship between the United Kingdom and the European Union following the United Kingdom’s withdrawal from the European Union; (xxvi) expanded and widened price increases in certain selective materials for data center development capital expenditures due to international trade negotiations; (xxvii) a failure to comply with anti-corruption laws and regulations; (xxviii) legislative or other actions relating to taxes; (xxix) any significant security breach or cyber-attack on us or our key partners or customers; (xxx) the ongoing trade conflict between the United States and the People’s Republic of China; (xxxi) increased operating costs and capital expenditures at our facilities, including those resulting from higher utilization by our customers, general market conditions and inflation, exceeding revenue growth; and (xxxii) other factors affecting the real estate and technology industries generally. More information on potential risks and uncertainties is available in our recent filings with the Securities and Exchange Commission (SEC), including CyrusOne’s Form 10-K report, Form 10-Q reports, and Form 8-K reports. We disclaim any obligation other than as required by law to publicly update or revise any forward-looking statement to reflect changes in underlying assumptions or factors or for new information, data or methods, future events or other changes. Use of Non-GAAP Financial Measures and Other Metrics
This press release contains certain non-GAAP financial measures that management believes are helpful in understanding the Company’s business, as further discussed within this press release. These financial measures, which include Funds From Operations, Normalized Funds From Operations, Normalized Funds From Operations per Diluted Common Share, Adjusted EBITDA, Net Operating Income, and Net Debt should not be construed as being more important than, or a substitute for, comparable GAAP financial measures. Detailed reconciliations of these non-GAAP financial measures to comparable GAAP financial measures have been included in the tables that accompany this release and are available in the Investor Relations section of www.cyrusone.com. Management uses FFO, Normalized FFO, Normalized FFO per Diluted Common Share, Adjusted EBITDA, and NOI, which are non-GAAP financial measures commonly used in the real estate investments trusts (REIT) industry, as supplemental performance measures. Management uses these measures as supplemental performance measures because, when compared period over period, they capture trends in occupancy rates, rental rates and operating costs. The Company also believes that, as widely recognized measures of the performance of REITs, these measures are used by investors as a basis to evaluate REITs. Other REITs may not calculate these measures in the same manner, and, as presented, they may not be comparable to others. Therefore, FFO, Normalized FFO, NOI, and Adjusted EBITDA should be considered only as supplements to net income (loss) presented in accordance with GAAP as measures of our performance. FFO, Normalized FFO, NOI, and Adjusted EBITDA should not be used as measures of our liquidity or as indicative of funds available to fund our cash needs, including our ability to pay dividends or make distributions. These measures also should not be used as supplements to or substitutes for cash flow from operating activities computed in accordance with GAAP. The Company believes that Net Debt provides a useful measure of liquidity and financial health.
1Net income (loss) per diluted common share is defined as Net income (loss) divided by the weighted average diluted common shares outstanding for the period, which were 120.5 million for the first quarter of 2021 and 115.1 million for the first quarter of 2020.
2We use Net Operating Income ("NOI"), which is a non-GAAP financial measure commonly used in the REIT industry, as a supplemental performance measure. We use NOI as a supplemental performance measure because, when compared period over period, it captures trends in occupancy rates, rental rates and operating expenses. We also believe that, as a widely recognized measure of the performance of REITs, NOI is used by investors as a basis to evaluate REITs.
We calculate NOI as Net income, adjusted for Sales and marketing expenses, General and administrative expenses, Depreciation and amortization expenses, Transaction, acquisition, integration and other related expenses, Interest expense, net, Gain on marketable equity investment, Loss on early extinguishment of debt, Impairment losses and loss (gain) on asset disposals, Foreign currency and derivative gains, net, Other expense and Income tax benefit. Amortization of deferred leasing costs is presented in Depreciation and amortization

7
expenses, which is excluded from NOI. Sales and marketing expenses are not property-specific, rather these expenses support our entire portfolio. As a result, we have excluded these Sales and marketing expenses from our NOI calculation, consistent with the treatment of General and administrative expenses, which also support our entire portfolio. Because the calculation of NOI excludes various expenses, the utility of NOI as a measure of our performance is limited. Other REITs may not calculate NOI in the same manner. Accordingly, our NOI may not be comparable to others. Therefore, NOI should be considered only as a supplement to Net income presented in accordance with GAAP as a measure of our performance. NOI should not be used as a measure of our liquidity or as indicative of funds available to fund our cash needs, including our ability to pay dividends and make distributions. NOI also should not be used as a supplement to or substitute for cash flow from operating activities computed in accordance with GAAP.
3Adjusted EBITDA, which is a non-GAAP financial measure, is defined as Net income (loss) as defined by GAAP adjusted for Interest expense, net; Income tax (benefit) expense; Depreciation and amortization expenses; Impairment losses and (gain) loss on asset disposals; Transaction, acquisition, integration and other related expenses; Legal claim costs; Stock-based compensation expense; Cash severance and management transition costs; Severance-related stock compensation costs; Loss on early extinguishment of debt; New accounting standards and regulatory compliance and the related system implementation costs; Gain on marketable equity investment; Foreign currency and derivative losses (gains), net; Other expense (income); and other items as appropriate. Other companies may not calculate Adjusted EBITDA in the same manner. Accordingly, the Company’s Adjusted EBITDA as presented may not be comparable to others.
4We use funds from operations ("FFO") and normalized funds from operations ("Normalized FFO"), which are non-GAAP financial measures commonly used in the REIT industry, as supplemental performance measures. We use FFO and Normalized FFO as supplemental performance measures because, when compared period over period, they capture trends in occupancy rates, rental rates and operating costs. We also believe that, as widely recognized measures of the performance of REITs, FFO and Normalized FFO are used by investors as a basis to evaluate REITs.
We calculate FFO as Net income (loss) computed in accordance with GAAP before Real estate depreciation and amortization and Impairment losses and loss (gain) on asset disposals. While it is consistent with the definition of FFO promulgated by the National Association of Real Estate Investment Trusts ("NAREIT"), our computation of FFO may differ from the methodology for calculating FFO used by other REITs. Accordingly, our FFO may not be comparable to others.
We calculate Normalized FFO as FFO adjusted for Loss on early extinguishment of debt; Gain on marketable equity investment; Foreign currency and derivative (gains) losses, net; Amortization of tradenames; Transaction, acquisition, integration and other related expenses; Cash severance and management transition costs; Severance-related stock compensation costs; and Legal claim costs. We believe our Normalized FFO calculation provides a comparable measure between different periods. Other REITs may not calculate Normalized FFO in the same manner, accordingly, our Normalized FFO may not be comparable to others.
In addition, because FFO and Normalized FFO exclude Real estate depreciation and amortization, and capture neither the changes in the value of our properties that result from use or from market conditions, nor the level of capital expenditures and leasing commissions necessary to maintain the operating performance of our properties, all of which have real economic effect and could materially impact our results from operations, the utility of FFO and Normalized FFO as measures of our performance is limited. Therefore, FFO and Normalized FFO should be considered only as supplements to Net income (loss) presented in accordance with GAAP as measures of our performance. FFO and Normalized FFO should not be used as measures of our liquidity or as indicative of funds available to fund our cash needs, including our ability to pay dividends or make distributions. FFO and Normalized FFO also should not be used as supplements to or substitutes for cash flow from operating activities computed in accordance with GAAP.
5Annualized GAAP revenue is equal to monthly recurring rent, defined as average monthly contractual rent during the term of the lease plus the monthly impact of installation charges, multiplied by 12. It can be shown both inclusive and exclusive of the Company’s estimate of customer reimbursements for metered power.
6Recurring rent churn percentage is calculated as any reduction in recurring rent due to customer terminations, service reductions or net pricing decreases as a percentage of rent at the beginning of the period, excluding any impact from metered power reimbursements or other usage-based billing.
7Percentage CSF leased is calculated by dividing CSF under signed leases for colocation space (whether or not the lease has commenced billing) by total CSF. Percentage CSF leased differs from percentage CSF occupied presented in the Data Center Portfolio table because the leased rate includes CSF for signed leases that have not commenced billing.
8Stabilized properties include data halls that have been in service for at least 24 months or are at least 85% leased.
9Gross asset value is defined as total assets plus accumulated depreciation.

8
10Long-term debt and net debt exclude adjustments for deferred financing costs and bond discounts / premiums. Net debt, which is a non-GAAP financial measure, provides a useful measure of liquidity and financial health. The Company defines net debt as long-term debt and finance lease liabilities, offset by cash and cash equivalents.
11Liquidity is calculated as cash, cash equivalents, and temporary cash investments on hand, plus the undrawn capacity on CyrusOne’s revolving credit facility, plus the pro forma impact of the net proceeds from the settlement of the forward sale agreements.
About CyrusOne CyrusOne (NASDAQ: CONE) is a premier global REIT specializing in design, construction and operation of more than 50 high-performance data centers worldwide. The Company provides mission-critical facilities that ensure the continued operation of IT infrastructure for approximately 1,000 customers, including approximately 200 Fortune 1000 companies.
A leader in hybrid-cloud and multi-cloud deployments, CyrusOne offers colocation, hyperscale, and build-to-suit environments that help customers enhance the strategic connection of their essential data infrastructure and support achievement of sustainability goals. CyrusOne data centers offer world-class flexibility, enabling clients to modernize, simplify, and rapidly respond to changing demand. Combining exceptional financial strength with a broad global footprint, CyrusOne provides customers with long-term stability and strategic advantage at scale.
# # #
Investor Relations Michael Schafer Vice President, Capital Markets & Investor Relations 972-350-0060 [email protected]
9
Company Profile CyrusOne (NASDAQ: CONE) specializes in highly reliable enterprise-class, carrier-neutral data center properties. The Company provides mission-critical data center facilities that protect and ensure the continued operation of IT infrastructure for approximately 1,000 customers, including approximately 200 Fortune 1000 companies. CyrusOne's data center offerings provide the flexibility, reliability, and security that enterprise customers require and are delivered through a tailored, customer service-focused platform designed to foster long-term relationships. CyrusOne is committed to full transparency in communication, management, and service delivery throughout its more than 50 data centers worldwide.
• Best-in-Class Sales Force • Flexible Solutions that Scale as Customers Grow • Massively Modular® Engineering with Data Hall Builds in 10-14 Weeks • Focus on Operational Excellence and Superior Customer Service • Proven Leading-Edge Technology Delivering Power Densities up to 900 Watts per Square Foot • National IX Replicates Enterprise Data Center Architecture
Corporate Headquarters Senior Management 2850 N. Harwood St., Ste. 2200 Bruce W. Duncan, President & Chief Executive Officer Brent Behrman, EVP of Sales Dallas, Texas 75201 Katherine Motlagh, EVP & Chief Financial Officer Matt Pullen, EVP & Managing Director, Europe Phone: (972) 350-0060 John Hatem, EVP & Chief Operating Officer Robert M. Jackson, EVP General Counsel & Secretary Website: www.cyrusone.com
Analyst Coverage
Firm Analyst Phone Number BofA Securities Michael J. Funk (646) 855-5664 Barclays Tim Long (212) 526 4043 Berenberg Capital Markets Nate Crossett (646) 949-9030 BMO Capital Markets Ari Klein (212) 885-4103 Citi Mike Rollins (212) 816-1116 Cowen and Company Colby Synesael (646) 562-1355 Credit Suisse Sami Badri (212) 538-1727 Deutsche Bank Matthew Niknam (212) 250-4711 Evercore ISI John Belton, CFA (212) 446-5656 Green Street David Guarino (949) 640-8780 Jefferies Jonathan Petersen (212) 284-1705 J.P. Morgan Richard Choe (212) 622-6708 KeyBanc Capital Markets Jordan Sadler (917) 368-2280
Mizuho Securities Omotayo Okusanya, CFA (646) 949-9672 MoffettNathanson Nick Del Deo, CFA (212) 519-0025 Morgan Stanley Simon Flannery (212) 761-6432 RBC Capital Markets Jonathan Atkin (415) 633-8589 Raymond James Frank G. Louthan IV (404) 442-5867 Stifel Erik Rasmussen (212) 271-3461 TD Securities Inc. Jonathan Kelcher, CFA (416) 307-9931 Truist Greg Miller (212) 303-4169 UBS John C. Hodulik, CFA (212) 713-4226 Wells Fargo Eric Luebchow (312) 630-2386 William Blair Jim Breen, CFA (617) 235-7513 Wolfe Research Jeff Kvaal (646) 582-9350
CyrusOne Inc.Summary of Financial Data
(Dollars in millions, except per share amounts)
Three Months March 31, December 31, March 31, Growth % 2021 2020 2020 Yr/YrRevenue $ 298.6 $ 268.4 $ 245.9 21 %Net operating income 162.8 158.1 153.3 6 %Net income 18.2 19.0 14.7 24 %Funds from Operations ("FFO") - Nareit defined 137.7 135.1 120.4 14 %Normalized Funds from Operations ("Normalized FFO") 120.2 114.3 111.8 8 %Weighted average number of common shares outstanding - diluted for Normalized FFO 120.5 120.6 115.1 5 %Net income per share - basic $ 0.15 $ 0.15 $ 0.13 15 %Net income per share - diluted $ 0.15 $ 0.15 $ 0.13 15 %Normalized FFO per diluted common share $ 1.00 $ 0.94 $ 0.97 3 %Adjusted EBITDA $ 140.3 $ 135.9 $ 132.2 6 %Adjusted EBITDA as a % of Revenue 47.0 % 50.6 % 53.8 % (6.8) pts
As of March 31, December 31, March 31, Growth % 2021 2020 2020 Yr/YrBalance Sheet DataGross investment in real estate $ 7,166.0 $ 7,033.4 $ 6,260.9 14 %Accumulated depreciation (1,867.5) (1,767.9) (1,469.5) 27 %Total investment in real estate, net 5,298.5 5,265.5 4,791.4 11 %Cash and cash equivalents 240.9 271.4 57.3 n/mMarket value of common equity 8,298.1 8,810.4 7,102.1 17 %Long-term debt 3,372.7 3,446.1 3,084.0 9 %Net debt 3,160.4 3,203.8 3,056.1 3 %Total enterprise value 11,458.5 12,014.2 10,158.2 13 %Net debt to LQA Adjusted EBITDA(a) 4.9x 5.0x 5.4x (0.5)x
Dividend ActivityDividends per share $ 0.51 $ 0.51 $ 0.50 2 %
Portfolio StatisticsData centers 53 53 48 10 %Stabilized CSF (000) 4,422 4,398 4,035 10 %Stabilized CSF % leased 85 % 87 % 88 % (3) ptsTotal CSF (000) 4,743 4,665 4,215 13 %Total CSF % leased 82 % 84 % 86 % (4) ptsTotal GSF (000) 8,139 8,038 7,243 12 %
(a) Adjusted to reflect the pro forma impact of the net proceeds from the settlement of the forward sale agreements.
10

CyrusOne Inc.Condensed Consolidated Statements of Operations
(Dollars in millions, except per share amounts)(Unaudited)
Three Months Ended March 31, Change 2021 2020 $ %Revenue(a) $ 298.6 $ 245.9 $ 52.7 21 %Operating expenses:
Property operating expenses 135.8 92.6 43.2 47 %Sales and marketing 3.8 4.7 (0.9) (19) %General and administrative 23.0 26.9 (3.9) (14) %Depreciation and amortization 121.4 108.1 13.3 12 %Transaction, acquisition, integration and other related expenses 0.1 0.5 (0.4) (80) %Impairment losses and loss (gain) on asset disposals 0.5 (0.1) 0.6 n/m
Total operating expenses 284.6 232.7 232.7 22 %Operating income 14.0 13.2 (180.0) 6 %Interest expense, net (15.1) (16.0) 0.9 (6) %Gain on marketable equity investment 2.4 14.7 (12.3) (84) %Loss on early extinguishment of debt — (3.4) 3.4 (100) %Foreign currency and derivative gains, net 15.4 5.1 10.3 n/mOther expense (0.1) (0.1) — — %Net income before income taxes 16.6 13.5 (177.7) 23 %Income tax benefit 1.6 1.2 0.4 33 %Net income $ 18.2 $ 14.7 $ 3.5 24 %Net income per share - basic $ 0.15 $ 0.13 $ 0.02 15 %Net income per share - diluted $ 0.15 $ 0.13 $ 0.02 15 %
(a) Revenue includes metered power reimbursements of $73.1 million and $34.8 million for the three months ended March 31, 2021
and 2020, respectively.
11
CyrusOne Inc.Condensed Consolidated Balance Sheets
(Dollars in millions)(Unaudited)
March 31, December 31, Change 2021 2020 $ %AssetsInvestment in real estate:Land $ 207.3 $ 208.8 $ (1.5) (1) %Buildings and improvements 2,046.6 2,035.2 11.4 1 %Equipment 3,596.5 3,538.9 57.6 2 %Gross operating real estate 5,850.4 5,782.9 67.5 1 %
Less accumulated depreciation (1,867.5) (1,767.9) (99.6) 6 %Net operating real estate 3,982.9 4,015.0 (32.1) (1) %Construction in progress, including land under development 1,053.3 982.2 71.1 7 %Land held for future development 262.3 268.3 (6.0) (2) %
Total investment in real estate, net 5,298.5 5,265.5 33.0 1 %Cash and cash equivalents 240.9 271.4 (30.5) (11) %Rent and other receivables (net of allowance for doubtful accounts of $2.1 and $3.5 as of March 31, 2021 and December 31, 2020, respectively) 389.8 334.2 55.6 17 %Restricted cash 1.4 1.5 (0.1) (7) %Operating lease right-of-use assets, net 239.7 211.4 28.3 13 %Equity investments 22.9 67.1 (44.2) (66) %Goodwill 455.1 455.1 — — %Intangible assets (net of accumulated amortization of $257.2 and $249.3 as of March 31, 2021 and December 31, 2020, respectively) 149.2 157.8 (8.6) (5) %Other assets 114.3 133.4 (19.1) (14) %Total assets $ 6,911.8 $ 6,897.4 $ 14.4 — %Liabilities and equityDebt $ 3,337.4 $ 3,409.0 $ (71.6) (2) %Finance lease liabilities 28.6 29.1 (0.5) (2) %Operating lease liabilities 277.9 249.1 28.8 12 %Construction costs payable 137.5 133.0 4.5 3 %Accounts payable and accrued expenses 168.9 151.3 17.6 12 %Dividends payable 62.0 63.3 (1.3) (2) %Deferred revenue and prepaid rents 183.2 174.1 9.1 5 %Deferred tax liability 48.2 53.0 (4.8) (9) %Other liabilities 53.3 77.3 (24.0) (31) %Total liabilities 4,297.0 4,339.2 (42.2) (1) %Stockholders' equityPreferred stock, $0.01 par value, 100,000,000 authorized; no shares issued or outstanding — — — n/mCommon stock, $0.01 par value, 500,000,000 shares authorized and 122,535,975 and 120,442,521 shares issued and outstanding at March 31, 2021 and December 31, 2020, respectively 1.2 1.2 — — %Additional paid in capital 3,628.6 3,537.3 91.3 3 %Accumulated deficit (1,010.2) (966.6) (43.6) 5 %Accumulated other comprehensive loss (4.8) (13.7) 8.9 (65) %Total stockholders’ equity 2,614.8 2,558.2 56.6 2 %Total liabilities and equity $ 6,911.8 $ 6,897.4 $ 14.4 — %
12
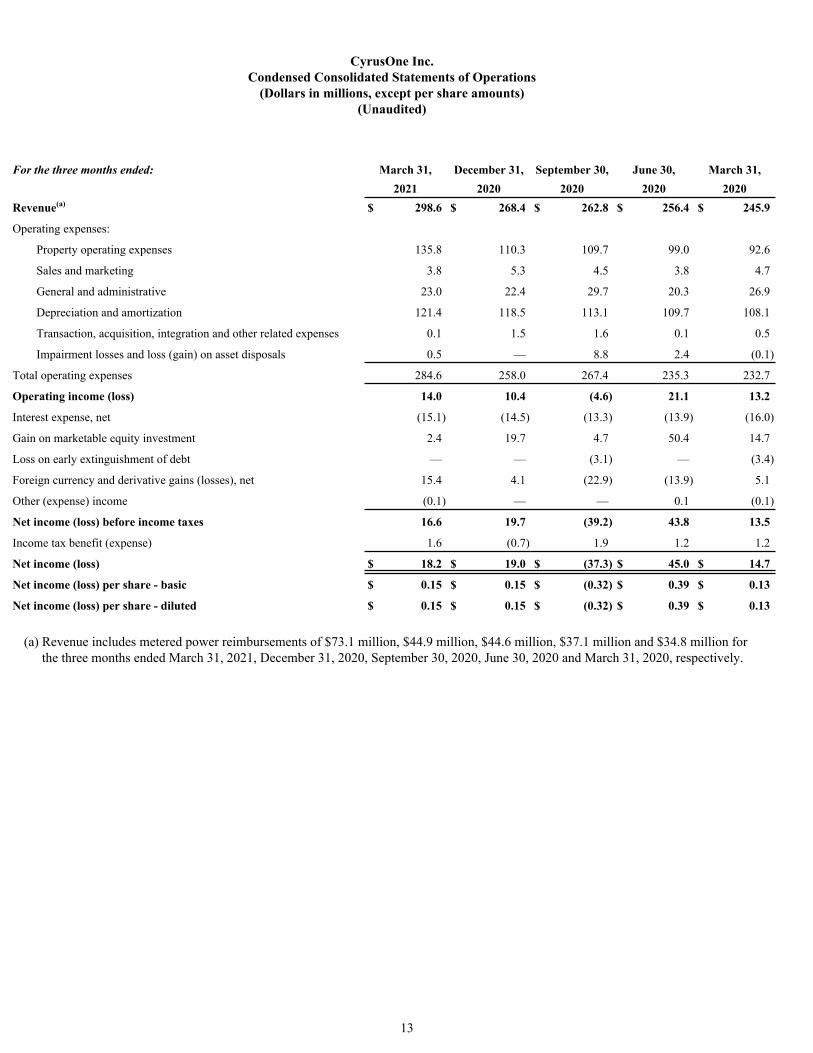
CyrusOne Inc.Condensed Consolidated Statements of Operations
(Dollars in millions, except per share amounts)(Unaudited)
For the three months ended: March 31, December 31, September 30, June 30, March 31, 2021 2020 2020 2020 2020Revenue(a) $ 298.6 $ 268.4 $ 262.8 $ 256.4 $ 245.9
Operating expenses:
Property operating expenses 135.8 110.3 109.7 99.0 92.6
Sales and marketing 3.8 5.3 4.5 3.8 4.7
General and administrative 23.0 22.4 29.7 20.3 26.9
Depreciation and amortization 121.4 118.5 113.1 109.7 108.1
Transaction, acquisition, integration and other related expenses 0.1 1.5 1.6 0.1 0.5
Impairment losses and loss (gain) on asset disposals 0.5 — 8.8 2.4 (0.1)
Total operating expenses 284.6 258.0 267.4 235.3 232.7
Operating income (loss) 14.0 10.4 (4.6) 21.1 13.2
Interest expense, net (15.1) (14.5) (13.3) (13.9) (16.0)
Gain on marketable equity investment 2.4 19.7 4.7 50.4 14.7
Loss on early extinguishment of debt — — (3.1) — (3.4)
Foreign currency and derivative gains (losses), net 15.4 4.1 (22.9) (13.9) 5.1
Other (expense) income (0.1) — — 0.1 (0.1)
Net income (loss) before income taxes 16.6 19.7 (39.2) 43.8 13.5
Income tax benefit (expense) 1.6 (0.7) 1.9 1.2 1.2
Net income (loss) $ 18.2 $ 19.0 $ (37.3) $ 45.0 $ 14.7
Net income (loss) per share - basic $ 0.15 $ 0.15 $ (0.32) $ 0.39 $ 0.13
Net income (loss) per share - diluted $ 0.15 $ 0.15 $ (0.32) $ 0.39 $ 0.13
(a) Revenue includes metered power reimbursements of $73.1 million, $44.9 million, $44.6 million, $37.1 million and $34.8 million for the three months ended March 31, 2021, December 31, 2020, September 30, 2020, June 30, 2020 and March 31, 2020, respectively.
13
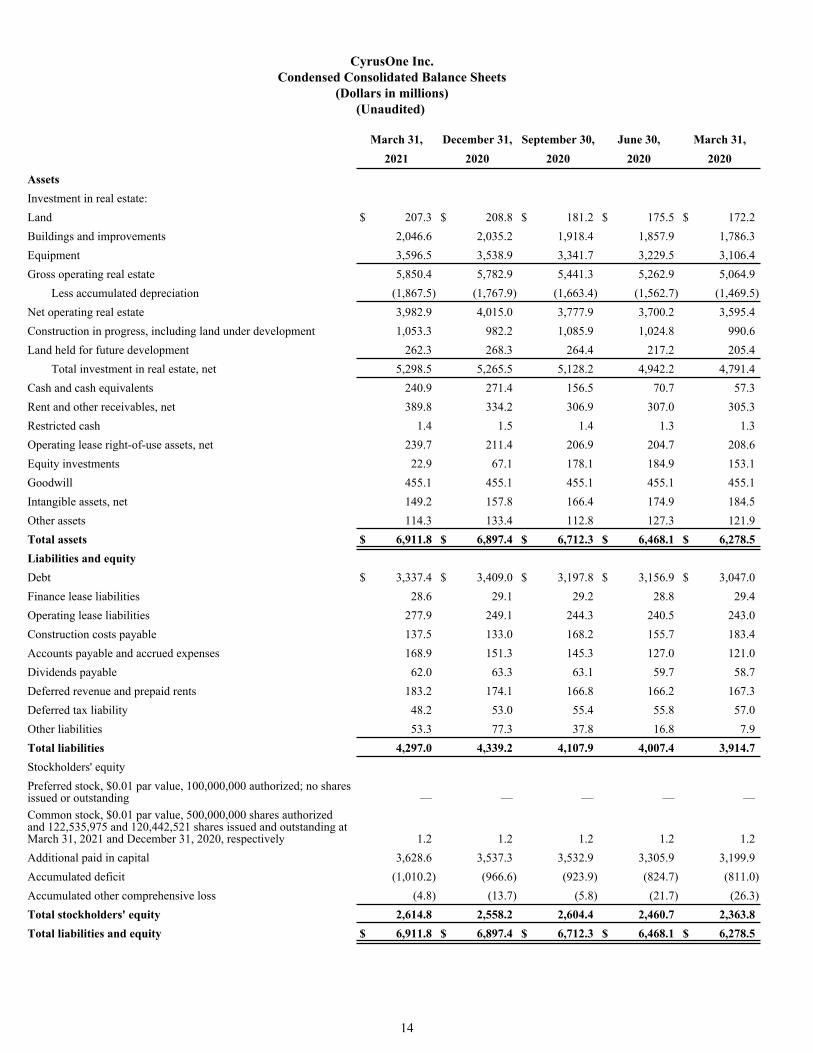
CyrusOne Inc.Condensed Consolidated Balance Sheets
(Dollars in millions)(Unaudited)
March 31, December 31, September 30, June 30, March 31,2021 2020 2020 2020 2020
AssetsInvestment in real estate:Land $ 207.3 $ 208.8 $ 181.2 $ 175.5 $ 172.2 Buildings and improvements 2,046.6 2,035.2 1,918.4 1,857.9 1,786.3 Equipment 3,596.5 3,538.9 3,341.7 3,229.5 3,106.4 Gross operating real estate 5,850.4 5,782.9 5,441.3 5,262.9 5,064.9
Less accumulated depreciation (1,867.5) (1,767.9) (1,663.4) (1,562.7) (1,469.5) Net operating real estate 3,982.9 4,015.0 3,777.9 3,700.2 3,595.4 Construction in progress, including land under development 1,053.3 982.2 1,085.9 1,024.8 990.6 Land held for future development 262.3 268.3 264.4 217.2 205.4
Total investment in real estate, net 5,298.5 5,265.5 5,128.2 4,942.2 4,791.4 Cash and cash equivalents 240.9 271.4 156.5 70.7 57.3 Rent and other receivables, net 389.8 334.2 306.9 307.0 305.3 Restricted cash 1.4 1.5 1.4 1.3 1.3 Operating lease right-of-use assets, net 239.7 211.4 206.9 204.7 208.6 Equity investments 22.9 67.1 178.1 184.9 153.1 Goodwill 455.1 455.1 455.1 455.1 455.1 Intangible assets, net 149.2 157.8 166.4 174.9 184.5 Other assets 114.3 133.4 112.8 127.3 121.9 Total assets $ 6,911.8 $ 6,897.4 $ 6,712.3 $ 6,468.1 $ 6,278.5 Liabilities and equityDebt $ 3,337.4 $ 3,409.0 $ 3,197.8 $ 3,156.9 $ 3,047.0 Finance lease liabilities 28.6 29.1 29.2 28.8 29.4 Operating lease liabilities 277.9 249.1 244.3 240.5 243.0 Construction costs payable 137.5 133.0 168.2 155.7 183.4 Accounts payable and accrued expenses 168.9 151.3 145.3 127.0 121.0 Dividends payable 62.0 63.3 63.1 59.7 58.7 Deferred revenue and prepaid rents 183.2 174.1 166.8 166.2 167.3 Deferred tax liability 48.2 53.0 55.4 55.8 57.0 Other liabilities 53.3 77.3 37.8 16.8 7.9 Total liabilities 4,297.0 4,339.2 4,107.9 4,007.4 3,914.7 Stockholders' equityPreferred stock, $0.01 par value, 100,000,000 authorized; no shares issued or outstanding — — — — — Common stock, $0.01 par value, 500,000,000 shares authorized and 122,535,975 and 120,442,521 shares issued and outstanding at March 31, 2021 and December 31, 2020, respectively 1.2 1.2 1.2 1.2 1.2 Additional paid in capital 3,628.6 3,537.3 3,532.9 3,305.9 3,199.9 Accumulated deficit (1,010.2) (966.6) (923.9) (824.7) (811.0) Accumulated other comprehensive loss (4.8) (13.7) (5.8) (21.7) (26.3) Total stockholders' equity 2,614.8 2,558.2 2,604.4 2,460.7 2,363.8 Total liabilities and equity $ 6,911.8 $ 6,897.4 $ 6,712.3 $ 6,468.1 $ 6,278.5
14

CyrusOne Inc.Condensed Consolidated Statements of Cash Flows
(Dollars in millions)(Unaudited)
Three Months Ended March
31, 2021
Three Months Ended March
31, 2020Cash flows from operating activities:Net income $ 18.2 $ 14.7 Adjustments to reconcile net income to net cash provided by operating activities:Depreciation and amortization 121.4 108.1 Provision for bad debt expense (1.1) (0.1) Gain on marketable equity investment (2.4) (14.7) Foreign currency and derivative gains, net (15.4) (5.1) Proceeds from swap terminations — 2.9 Impairment losses and loss (gain) on asset disposals 0.5 (0.1) Loss on early extinguishment of debt — 3.4 Interest expense amortization, net 1.6 2.0 Stock-based compensation expense 4.4 3.7 Deferred income tax benefit (2.6) (2.0) Operating lease cost 5.2 6.2 Other (income) expense (0.1) 0.3
Change in operating assets and liabilities:Rent and other receivables, net and other assets (43.4) (29.4) Accounts payable and accrued expenses 18.4 (1.2) Deferred revenue and prepaid rents 8.5 3.2 Operating lease liabilities (6.5) (5.6) Net cash provided by operating activities 106.7 86.3 Cash flows from investing activities:Investments in real estate (175.4) (196.5) Proceeds from sale of equity investments 46.6 — Equity investments — (3.3) Proceeds from the sale of real estate assets 4.4 — Net cash used in investing activities (124.4) (199.8) Cash flows from financing activities:Issuance of common stock, net 95.8 0.6 Dividends paid (63.0) (58.4) Proceeds from revolving credit facility 90.3 244.4 Repayments of revolving credit facility (124.2) (623.1) Proceeds from Euro bond — 550.6 Proceeds from unsecured term loan — 1,100.0 Repayments of unsecured term loan — (1,100.0) Payment of deferred financing costs — (13.6) Payments on finance lease liabilities (0.7) (0.7) Tax payment upon exercise of equity awards (8.9) (6.3) Net cash (used in) provided by financing activities (10.7) 93.5 Effect of exchange rate changes on cash, cash equivalents and restricted cash (2.2) 0.9 Net decrease in cash, cash equivalents and restricted cash (30.6) (19.1) Cash, cash equivalents and restricted cash at beginning of period 272.9 77.7 Cash, cash equivalents and restricted cash at end of period $ 242.3 $ 58.6
Supplemental disclosure of cash flow information:Cash paid for interest, including amounts capitalized of $4.9 million and $6.0 million in 2021 and 2020, respectively $ 12.8 $ 8.3 Non-cash investing and financing activities:Construction costs payable 137.5 183.4 Dividends payable 62.0 58.7
15

CyrusOne Inc.Reconciliation of Net Income to Net Operating Income
(Dollars in millions)(Unaudited)
Three Months Ended
March 31, Change
2021 2020 $ %Net income $ 18.2 $ 14.7 $ 3.5 24 %Sales and marketing expenses 3.8 4.7 (0.9) (19) %General and administrative expenses 23.0 26.9 (3.9) (14) %Depreciation and amortization expenses 121.4 108.1 13.3 12 %Transaction, acquisition, integration and other related expenses 0.1 0.5 (0.4) (80) %Interest expense, net 15.1 16.0 (0.9) (6) %Gain on marketable equity investment (2.4) (14.7) 12.3 (84) %Loss on early extinguishment of debt — 3.4 (3.4) (100) %Impairment losses and loss (gain) on asset disposals 0.5 (0.1) 0.6 n/mForeign currency and derivative gains, net (15.4) (5.1) (10.3) n/mOther expense 0.1 0.1 — — %Income tax benefit (1.6) (1.2) (0.4) 33 %Net Operating Income $ 162.8 $ 153.3 $ 9.5 6 %
CyrusOne Inc.Net Operating Income and Reconciliation of Net Income (Loss) to Adjusted EBITDA
(Dollars in millions)(Unaudited)
Three Months Ended Three Months Ended March 31, Change March 31, December 31, September 30, June 30, March 31, 2021 2020 $ % 2021 2020 2020 2020 2020Net Operating IncomeRevenue $ 298.6 $ 245.9 $ 52.7 21% $ 298.6 $ 268.4 $ 262.8 $ 256.4 $ 245.9 Property operating expenses 135.8 92.6 43.2 47% 135.8 110.3 109.7 99.0 92.6 Net Operating Income (NOI) $ 162.8 $ 153.3 $ 9.5 6% $ 162.8 $ 158.1 $ 153.1 $ 157.4 $ 153.3 NOI as a % of Revenue 54.5 % 62.3 % 54.5 % 58.9 % 58.3 % 61.4 % 62.3 %Reconciliation of Net Income (Loss) to Adjusted EBITDA:Net income (loss) $ 18.2 $ 14.7 $ 3.5 24% $ 18.2 $ 19.0 $ (37.3) $ 45.0 $ 14.7 Interest expense, net 15.1 16.0 (0.9) (6)% 15.1 14.5 13.3 13.9 16.0 Income tax (benefit) expense (1.6) (1.2) (0.4) 33% (1.6) 0.7 (1.9) (1.2) (1.2) Depreciation and amortization expenses 121.4 108.1 13.3 12% 121.4 118.5 113.1 109.7 108.1 Impairment losses and loss (gain) on asset disposals 0.5 (0.1) 0.6 n/m 0.5 — 8.8 2.4 (0.1) EBITDA (Nareit definition)(a) $ 153.6 $ 137.5 $ 16.1 12% $ 153.6 $ 152.7 $ 96.0 $ 169.8 $ 137.5
Transaction, acquisition, integration and other related expenses 0.1 0.5 (0.4) (80)% 0.1 1.5 1.6 0.1 0.5 Legal claim costs — 0.1 (0.1) (100)% — — 0.1 0.1 0.1 Stock-based compensation expense 4.4 3.5 0.9 26% 4.4 4.4 4.2 3.4 3.5 Cash severance and management transition costs (0.1) 6.8 (6.9) n/m (0.1) 0.9 6.4 — 6.8 Severance-related stock compensation costs — 0.1 (0.1) (100)% — 0.2 2.6 — 0.1 Loss on early extinguishment of debt — 3.4 (3.4) (100)% — — 3.1 — 3.4 Gain on marketable equity investment (2.4) (14.7) 12.3 (84)% (2.4) (19.7) (4.7) (50.4) (14.7) Foreign currency and derivative (gains) losses, net (15.4) (5.1) (10.3) n/m (15.4) (4.1) 22.9 13.9 (5.1) Other expense (income) 0.1 0.1 — —% 0.1 — — (0.1) 0.1 Adjusted EBITDA $ 140.3 $ 132.2 $ 8.1 6% $ 140.3 $ 135.9 $ 132.2 $ 136.8 $ 132.2 Adjusted EBITDA as a % of Revenue 47.0 % 53.8 % 47.0 % 50.6 % 50.3 % 53.4 % 53.8 %
(a) We calculate Earnings Before Interest, Taxes, Depreciation and Amortization for Real Estate (EBITDAre) as GAAP Net income (loss) plus Interest expense, net, Income tax (benefit) expense, Depreciation and amortization expenses and Impairment losses and loss (gain) on asset disposals. While it is consistent with the definition of EBITDAre promulgated by the National Association of Real Estate Investment Trusts ("Nareit"), our computation of EBITDAre may differ from the methodology for calculating EBITDAre used by other REITs. Accordingly, our EBITDAre may not be comparable to others.
16
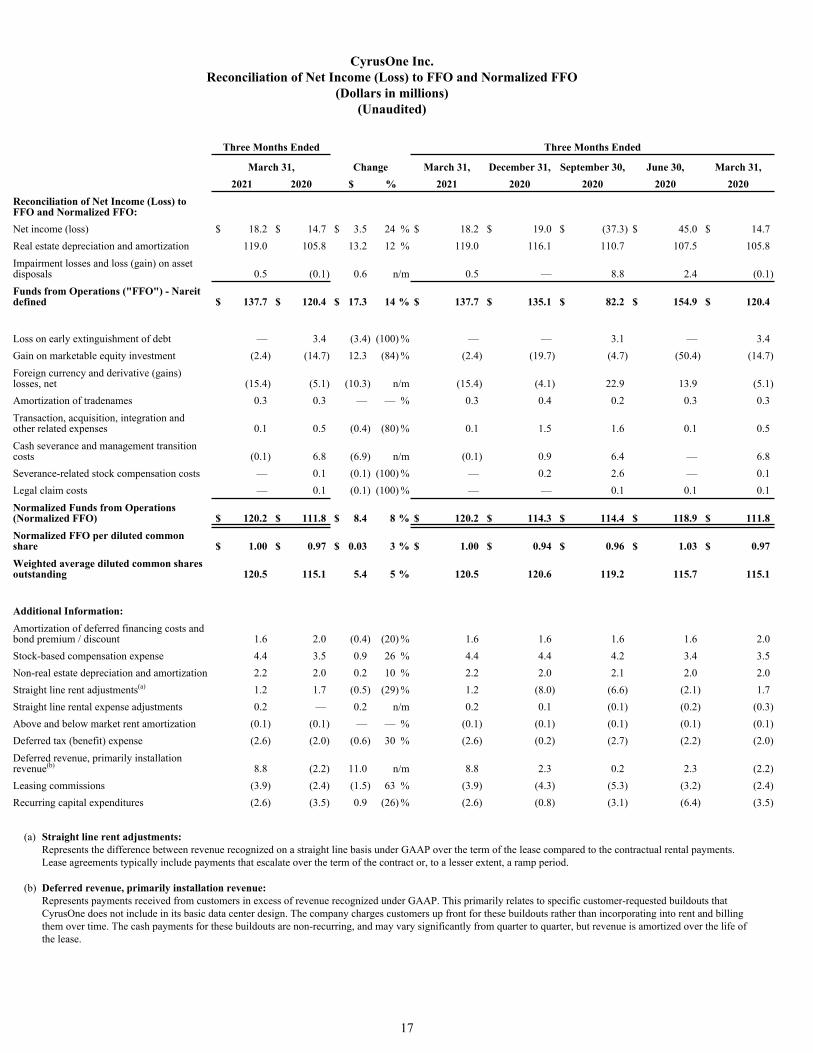
CyrusOne Inc.Reconciliation of Net Income (Loss) to FFO and Normalized FFO
(Dollars in millions)(Unaudited)
Three Months Ended Three Months Ended
March 31, Change March 31, December 31, September 30, June 30, March 31,2021 2020 $ % 2021 2020 2020 2020 2020
Reconciliation of Net Income (Loss) to FFO and Normalized FFO:Net income (loss) $ 18.2 $ 14.7 $ 3.5 24 % $ 18.2 $ 19.0 $ (37.3) $ 45.0 $ 14.7 Real estate depreciation and amortization 119.0 105.8 13.2 12 % 119.0 116.1 110.7 107.5 105.8 Impairment losses and loss (gain) on asset disposals 0.5 (0.1) 0.6 n/m 0.5 — 8.8 2.4 (0.1) Funds from Operations ("FFO") - Nareit defined $ 137.7 $ 120.4 $ 17.3 14 % $ 137.7 $ 135.1 $ 82.2 $ 154.9 $ 120.4
Loss on early extinguishment of debt — 3.4 (3.4) (100) % — — 3.1 — 3.4 Gain on marketable equity investment (2.4) (14.7) 12.3 (84) % (2.4) (19.7) (4.7) (50.4) (14.7) Foreign currency and derivative (gains) losses, net (15.4) (5.1) (10.3) n/m (15.4) (4.1) 22.9 13.9 (5.1) Amortization of tradenames 0.3 0.3 — — % 0.3 0.4 0.2 0.3 0.3 Transaction, acquisition, integration and other related expenses 0.1 0.5 (0.4) (80) % 0.1 1.5 1.6 0.1 0.5 Cash severance and management transition costs (0.1) 6.8 (6.9) n/m (0.1) 0.9 6.4 — 6.8 Severance-related stock compensation costs — 0.1 (0.1) (100) % — 0.2 2.6 — 0.1 Legal claim costs — 0.1 (0.1) (100) % — — 0.1 0.1 0.1 Normalized Funds from Operations (Normalized FFO) $ 120.2 $ 111.8 $ 8.4 8 % $ 120.2 $ 114.3 $ 114.4 $ 118.9 $ 111.8 Normalized FFO per diluted common share $ 1.00 $ 0.97 $ 0.03 3 % $ 1.00 $ 0.94 $ 0.96 $ 1.03 $ 0.97 Weighted average diluted common shares outstanding 120.5 115.1 5.4 5 % 120.5 120.6 119.2 115.7 115.1
Additional Information:Amortization of deferred financing costs and bond premium / discount 1.6 2.0 (0.4) (20) % 1.6 1.6 1.6 1.6 2.0 Stock-based compensation expense 4.4 3.5 0.9 26 % 4.4 4.4 4.2 3.4 3.5 Non-real estate depreciation and amortization 2.2 2.0 0.2 10 % 2.2 2.0 2.1 2.0 2.0 Straight line rent adjustments(a) 1.2 1.7 (0.5) (29) % 1.2 (8.0) (6.6) (2.1) 1.7 Straight line rental expense adjustments 0.2 — 0.2 n/m 0.2 0.1 (0.1) (0.2) (0.3) Above and below market rent amortization (0.1) (0.1) — — % (0.1) (0.1) (0.1) (0.1) (0.1) Deferred tax (benefit) expense (2.6) (2.0) (0.6) 30 % (2.6) (0.2) (2.7) (2.2) (2.0) Deferred revenue, primarily installation revenue(b) 8.8 (2.2) 11.0 n/m 8.8 2.3 0.2 2.3 (2.2) Leasing commissions (3.9) (2.4) (1.5) 63 % (3.9) (4.3) (5.3) (3.2) (2.4) Recurring capital expenditures (2.6) (3.5) 0.9 (26) % (2.6) (0.8) (3.1) (6.4) (3.5)
(a) Straight line rent adjustments:Represents the difference between revenue recognized on a straight line basis under GAAP over the term of the lease compared to the contractual rental payments. Lease agreements typically include payments that escalate over the term of the contract or, to a lesser extent, a ramp period.
(b) Deferred revenue, primarily installation revenue:Represents payments received from customers in excess of revenue recognized under GAAP. This primarily relates to specific customer-requested buildouts that CyrusOne does not include in its basic data center design. The company charges customers up front for these buildouts rather than incorporating into rent and billing them over time. The cash payments for these buildouts are non-recurring, and may vary significantly from quarter to quarter, but revenue is amortized over the life of the lease.
17
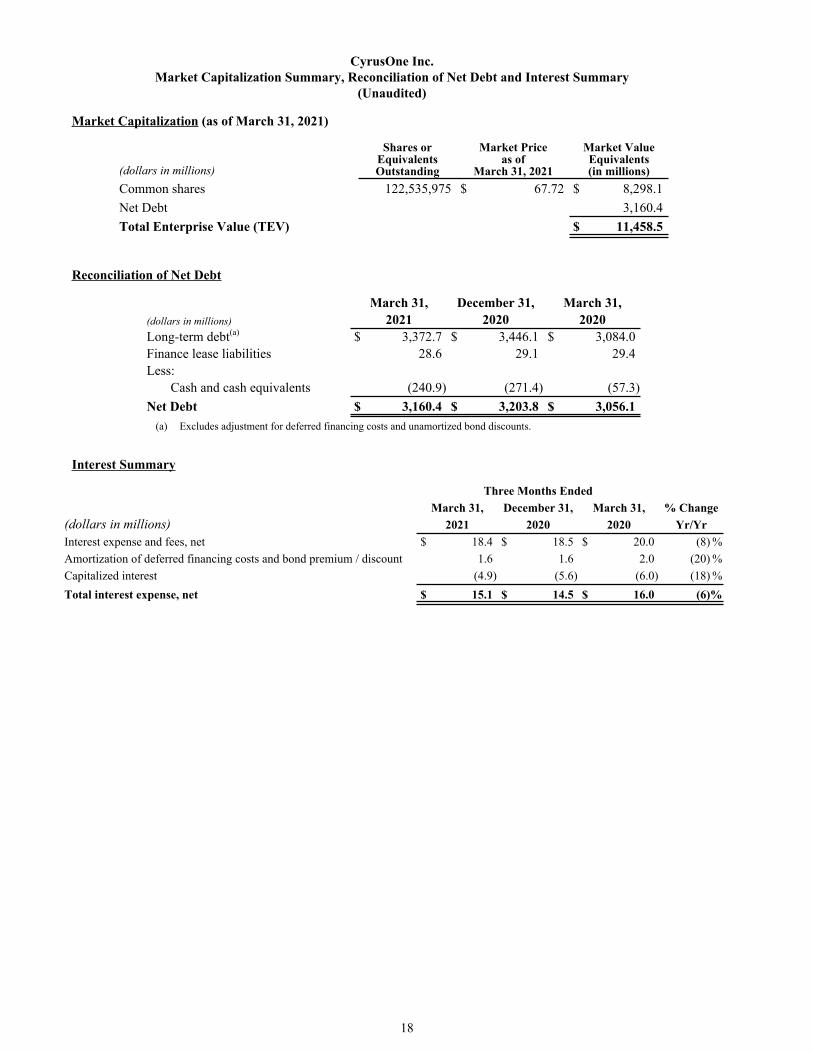
CyrusOne Inc.Market Capitalization Summary, Reconciliation of Net Debt and Interest Summary
(Unaudited)
Market Capitalization (as of March 31, 2021)
(dollars in millions)
Shares orEquivalentsOutstanding
Market Priceas of
March 31, 2021
Market ValueEquivalents(in millions)
Common shares 122,535,975 $ 67.72 $ 8,298.1 Net Debt 3,160.4 Total Enterprise Value (TEV) $ 11,458.5
Reconciliation of Net Debt
March 31, December 31, March 31,(dollars in millions) 2021 2020 2020Long-term debt(a) $ 3,372.7 $ 3,446.1 $ 3,084.0 Finance lease liabilities 28.6 29.1 29.4 Less:
Cash and cash equivalents (240.9) (271.4) (57.3) Net Debt $ 3,160.4 $ 3,203.8 $ 3,056.1
(a) Excludes adjustment for deferred financing costs and unamortized bond discounts.
Interest Summary
Three Months EndedMarch 31, December 31, March 31, % Change
(dollars in millions) 2021 2020 2020 Yr/YrInterest expense and fees, net $ 18.4 $ 18.5 $ 20.0 (8) %Amortization of deferred financing costs and bond premium / discount 1.6 1.6 2.0 (20) %Capitalized interest (4.9) (5.6) (6.0) (18) %Total interest expense, net $ 15.1 $ 14.5 $ 16.0 (6) %
18

CyrusOne Inc.Debt Schedule and Debt Covenants
(Unaudited)
Debt Schedule (as of March 31, 2021)
(dollars in millions)Long-term debt: Amount Interest Rate Maturity DateRevolving credit facility - EUR(a)(b) 351.8 EURIBOR + 100 bps(c) March 2025(d)
Revolving credit facility - GBP(a)(e) 34.5 GBP LIBOR + 100 bps(f) March 2025(d)
Term loan(g) 800.0 USD LIBOR + 120 bps(h) March 2025(i)
2.900% USD senior notes due 2024 600.0 2.900% November 20241.450% EUR senior notes due 2027(j) 586.4 1.450% January 20273.450% USD senior notes due 2029 600.0 3.450% November 20292.150% USD senior notes due 2030 400.0 2.150% November 2030Total long-term debt(k) $ 3,372.7 2.08%(l)
Weighted average term of debt(d)(i): 5.7 years(a) Revolving credit facility includes 0.20% facility fee on entire revolving credit facility commitment of $1.4 billion.(b) Amount outstanding is USD-equivalent of €300 million.(c) Interest rate as of March 31, 2021: 1.00%.(d) Assuming exercise of 12-month extension option.(e) Amount outstanding is USD-equivalent of £25 million.(f) Interest rate as of March 31, 2021: 1.06%.(g) $500 million of $800 million synthetically converted into €451 million pursuant to a USD-EUR cross currency swap; $300 million swapped pursuant to
USD floating to fixed interest rate swap. (h) Interest rate as of March 31, 2021: 1.31%; weighted average interest rate pursuant to swaps: 1.37%. (i) Assumes exercise of two 12-month extension options on $100 million tranche.(j) Amount outstanding is USD-equivalent of €500 million.(k) Excludes adjustment for deferred financing costs and unamortized bond discounts.(l) Weighted average interest rate calculated using interest rate on swapped amount.
Debt Covenants - Senior Notes (as of March 31, 2021)
Ratios Requirement March 31, 2021Total Outstanding Indebtedness to Total Assets ≤ 60% 40%Secured Indebtedness to Total Assets ≤ 40% 0%Consolidated EBITDA to Interest Expense ≥ 1.50x 7.02xTotal Unencumbered Assets to Unsecured Indebtedness ≥ 150% 249%
19

CyrusOne Inc.Colocation Square Footage (CSF) and CSF Leased
(Unaudited)
As of March 31, 2021 As of December 31, 2020 As of March 31, 2020
Market
Colocation Space (CSF)(a)
(000)CSF
Leased(b)
Colocation Space (CSF)(a)
(000)CSF
Leased(b)
Colocation Space (CSF)(a)
(000)CSF
Leased(b)
Northern Virginia 1,166 93 % 1,166 93 % 1,113 96 %
Dallas 621 66 % 621 70 % 621 71 %
Phoenix 581 97 % 581 95 % 509 100 %
San Antonio 434 97 % 434 97 % 300 100 %
Cincinnati 402 68 % 402 71 % 402 75 %
New York Metro 345 66 % 290 79 % 245 73 %
Houston 308 57 % 308 62 % 308 63 %
Chicago 203 80 % 203 79 % 203 78 %
Austin 106 77 % 106 76 % 106 78 %
Raleigh-Durham 94 94 % 94 94 % 94 96 %
Council Bluffs, Iowa 42 15 % 42 15 % — — %
Total - Domestic 4,300 81 % 4,246 83 % 3,901 85 %
Frankfurt 252 90 % 229 99 % 144 99 %
London 148 83 % 148 83 % 128 81 %
Amsterdam 39 100 % 39 100 % 39 100 %
Singapore 3 20 % 3 20 % 3 20 %
Total - International 443 88 % 419 93 % 314 91 %
Total - Portfolio 4,743 82 % 4,665 84 % 4,215 86 %
Stabilized Properties(c) 4,422 85 % 4,398 87 % 4,035 88 %
(a) CSF represents the GSF at an operating facility that is currently leased or readily available for lease as colocation space, where customerslocate their servers and other IT equipment. May not sum to total due to rounding.
(b) CSF Leased is calculated by dividing CSF under signed leases for colocation space (whether or not the lease has commenced billing) by total CSF.(c) Stabilized properties include data halls that have been in service for at least 24 months or are at least 85% leased.
20
CyrusOne Inc.2021 Guidance
CategoryPrevious
2021 GuidanceRevised
2021 GuidanceTotal Revenue $1,105 - 1,145 million $1,135 - 1,175 million Lease and Other Revenues from Customers $920 - 950 million $920 - 950 million Metered Power Reimbursements $185 - 195 million $215 - 225 millionAdjusted EBITDA $570 - 590 million $570 - 590 millionNormalized FFO per diluted common share $3.90 - 4.00 $3.90 - 4.00Capital Expenditures $925 - 1,025 million $925 - 1,025 million Development(1) $905 - 985 million $905 - 985 million Recurring $20 - 40 million $20 - 40 million (1)Development capital expenditures include the acquisition of land for future development.
CyrusOne is updating its guidance for full year 2021, increasing the lower and upper ends of its guidance range for Total Revenue and Metered Power Reimbursements and reaffirming the other guidance ranges. The annual guidance provided above represents forward-looking statements, which are based on current economic conditions, internal assumptions about the Company's existing customer base, and the supply and demand dynamics of the markets in which CyrusOne operates. We continue to monitor the global outbreak of COVID-19 and to take steps to mitigate the potential risks to us posed by the pandemic. While the impact on our business has not been significant to date, the length and severity of the effects of the pandemic remain uncertain and unpredictable and could be materially adverse to our business, financial condition, results of operations, cash flows and ability to pay dividends as well as the market price of our common stock.
CyrusOne does not provide forward-looking guidance for GAAP financial measures (other than Total Revenue and Capital Expenditures) or reconciliations for the non-GAAP financial measures included in the annual guidance provided below due to the inherent difficulty in forecasting and quantifying certain amounts that are necessary for such reconciliations, including Net income (loss) and adjustments that could be made for Transaction, acquisition, integration and other related expenses, Legal claim costs, Impairment losses and (gain) loss on asset disposals and other charges in its reconciliation of historic numbers, the amount of which, based on historical experience, could be significant.
21
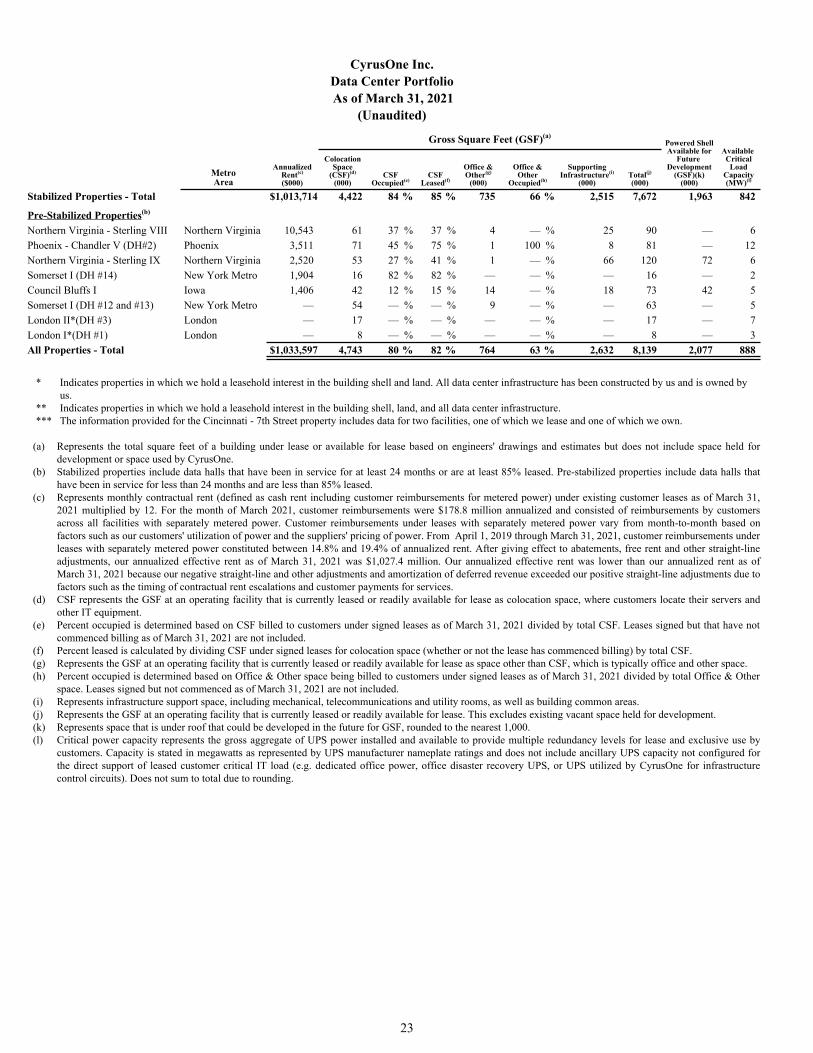
CyrusOne Inc.Data Center Portfolio
As of March 31, 2021 (Unaudited)
Gross Square Feet (GSF)(a) Powered Shell
Available for Future
Development (GSF)(k)
(000)
Available Critical
Load Capacity (MW)(l)Stabilized Properties(b)
MetroArea
AnnualizedRent(c)
($000)
ColocationSpace
(CSF)(d)
(000)CSF
Occupied(e)CSF
Leased(f)
Office & Other(g)
(000)Office & Other
Occupied(h)
Supporting Infrastructure(i)
(000)Total(j) (000)
Dallas - Carrollton Dallas $ 93,984 428 73 % 73 % 83 45 % 133 644 — 60 Northern Virginia - Sterling V Northern Virginia 70,081 383 99 % 99 % 11 100 % 145 539 231 69 Northern Virginia - Sterling VI Northern Virginia 58,912 272 100 % 100 % 35 — % — 307 — 57 Frankfurt II Frankfurt 39,452 90 100 % 100 % 9 100 % 72 171 10 35 Northern Virginia - Sterling II Northern Virginia 37,457 159 100 % 100 % 9 100 % 55 223 — 30 Somerset I New York Metro 37,343 153 85 % 86 % 27 99 % 149 329 28 23 Chicago - Aurora I Chicago 33,069 113 98 % 98 % 34 100 % 223 371 27 52 San Antonio III San Antonio 32,444 132 100 % 100 % 9 100 % 43 184 — 24 Phoenix - Chandler VI Phoenix 27,761 148 100 % 100 % 6 100 % 32 187 169 24 Dallas - Lewisville* Dallas 27,677 114 74 % 74 % 11 57 % 54 180 — 21 Totowa - Madison** New York Metro 26,743 51 86 % 86 % 22 86 % 59 133 — 12 Cincinnati - North Cincinnati Cincinnati 26,024 65 99 % 99 % 45 79 % 53 163 62 12 Houston - Houston West I Houston 25,451 112 61 % 61 % 11 100 % 37 161 3 32 Frankfurt I Frankfurt 24,122 53 97 % 97 % 8 91 % 57 118 — 18 Cincinnati - 7th Street*** Cincinnati 23,512 197 46 % 46 % 6 61 % 175 378 46 17 Austin III Austin 23,089 62 68 % 68 % 15 81 % 21 98 67 11 Phoenix - Chandler I Phoenix 20,907 74 99 % 100 % 35 12 % 39 147 31 12 Houston - Houston West II Houston 20,722 80 71 % 71 % 4 97 % 55 139 11 12 Phoenix - Chandler II Phoenix 20,410 74 100 % 100 % 6 53 % 26 105 — 12 Raleigh-Durham I Raleigh-Durham 20,018 94 88 % 94 % 16 95 % 82 192 235 14 Frankfurt III Frankfurt 19,843 109 79 % 100 % 16 82 % 100 225 — 40 Phoenix - Chandler III Phoenix 19,278 68 100 % 100 % 2 — % 30 101 — 12 San Antonio I San Antonio 19,044 44 99 % 99 % 6 83 % 46 96 11 12 Northern Virginia - Sterling III Northern Virginia 18,950 79 100 % 100 % 7 100 % 34 120 — 15 Wappingers Falls I** New York Metro 18,493 37 62 % 62 % 20 86 % 15 72 — 7 Northern Virginia - Sterling IV Northern Virginia 17,893 81 100 % 100 % 7 100 % 34 122 — 15 San Antonio II San Antonio 16,079 64 100 % 100 % 11 100 % 41 117 — 12 Phoenix - Chandler V Phoenix 15,959 72 100 % 100 % 1 95 % 16 89 13 12 Northern Virginia - Sterling I Northern Virginia 15,706 78 91 % 91 % 6 63 % 49 132 — 12 Austin II Austin 15,413 44 90 % 90 % 2 100 % 22 68 — 7 London II* London 14,599 64 100 % 100 % 10 100 % 93 166 4 21 London I* London 13,917 30 100 % 100 % 12 56 % 58 100 9 12 Phoenix - Chandler IV Phoenix 12,323 73 100 % 100 % 3 100 % 27 103 — 12 San Antonio IV San Antonio 12,055 60 100 % 100 % 12 100 % 27 99 — 12 Florence Cincinnati 10,871 53 99 % 99 % 47 87 % 40 140 — 9 Houston - Galleria Houston 9,502 63 38 % 38 % 23 21 % 25 112 — 11 Cincinnati - Hamilton* Cincinnati 9,116 47 65 % 65 % 1 100 % 35 83 — 9 San Antonio V San Antonio 8,109 134 65 % 90 % 7 100 % 38 179 1 15 Houston - Houston West III Houston 7,900 53 49 % 49 % 10 13 % 32 95 209 6 Chicago - Aurora II (DH #1) Chicago 7,591 77 56 % 57 % 45 1 % 14 136 272 16 London - Great Bridgewater** London 7,365 10 91 % 91 % — — % 1 11 — 1 London III* London 6,730 20 100 % 100 % 2 100 % 45 67 1 6 Norwalk I** New York Metro 5,429 13 98 % 98 % 10 65 % 41 63 83 3 Stamford - Riverbend** New York Metro 5,423 20 23 % 23 % — — % 8 28 — 5 Cincinnati - Mason Cincinnati 4,778 34 100 % 100 % 26 98 % 17 78 — 4 Amsterdam I Amsterdam 4,392 39 100 % 100 % 15 100 % 40 94 207 4 Dallas - Allen (DH #1) Dallas 3,567 79 17 % 20 % — — % 58 137 204 6 Chicago - Lombard Chicago 2,539 14 62 % 62 % 4 45 % 12 30 29 2 Totowa - Commerce** New York Metro 802 — — % — % 20 44 % 6 26 — — Cincinnati - Blue Ash* Cincinnati 493 6 36 % 36 % 7 100 % 2 15 — 1 Singapore - Inter Business Park** Singapore 373 3 20 % 20 % — — % — 3 — 1 Stabilized Properties - Total $ 1,013,714 4,422 84 % 85 % 735 66 % 2,515 7,672 1,963 842
22
CyrusOne Inc.Data Center PortfolioAs of March 31, 2021
(Unaudited)
Gross Square Feet (GSF)(a)Powered Shell Available for
Future Development
(GSF)(k) (000)
Available Critical
Load Capacity (MW)(l)
MetroArea
AnnualizedRent(c)
($000)
ColocationSpace
(CSF)(d)
(000)CSF
Occupied(e)CSF
Leased(f)
Office & Other(g)
(000)
Office & Other
Occupied(h)
Supporting Infrastructure(i)
(000)Total(j) (000)
Stabilized Properties - Total $ 1,013,714 4,422 84 % 85 % 735 66 % 2,515 7,672 1,963 842
Pre-Stabilized Properties(b)
Northern Virginia - Sterling VIII Northern Virginia 10,543 61 37 % 37 % 4 — % 25 90 — 6 Phoenix - Chandler V (DH#2) Phoenix 3,511 71 45 % 75 % 1 100 % 8 81 — 12 Northern Virginia - Sterling IX Northern Virginia 2,520 53 27 % 41 % 1 — % 66 120 72 6 Somerset I (DH #14) New York Metro 1,904 16 82 % 82 % — — % — 16 — 2 Council Bluffs I Iowa 1,406 42 12 % 15 % 14 — % 18 73 42 5 Somerset I (DH #12 and #13) New York Metro — 54 — % — % 9 — % — 63 — 5 London II*(DH #3) London — 17 — % — % — — % — 17 — 7 London I*(DH #1) London — 8 — % — % — — % — 8 — 3 All Properties - Total $ 1,033,597 4,743 80 % 82 % 764 63 % 2,632 8,139 2,077 888
* Indicates properties in which we hold a leasehold interest in the building shell and land. All data center infrastructure has been constructed by us and is owned by us.
** Indicates properties in which we hold a leasehold interest in the building shell, land, and all data center infrastructure.*** The information provided for the Cincinnati - 7th Street property includes data for two facilities, one of which we lease and one of which we own.
(a) Represents the total square feet of a building under lease or available for lease based on engineers' drawings and estimates but does not include space held for development or space used by CyrusOne.
(b) Stabilized properties include data halls that have been in service for at least 24 months or are at least 85% leased. Pre-stabilized properties include data halls that have been in service for less than 24 months and are less than 85% leased.
(c) Represents monthly contractual rent (defined as cash rent including customer reimbursements for metered power) under existing customer leases as of March 31, 2021 multiplied by 12. For the month of March 2021, customer reimbursements were $178.8 million annualized and consisted of reimbursements by customers across all facilities with separately metered power. Customer reimbursements under leases with separately metered power vary from month-to-month based on factors such as our customers' utilization of power and the suppliers' pricing of power. From April 1, 2019 through March 31, 2021, customer reimbursements under leases with separately metered power constituted between 14.8% and 19.4% of annualized rent. After giving effect to abatements, free rent and other straight-line adjustments, our annualized effective rent as of March 31, 2021 was $1,027.4 million. Our annualized effective rent was lower than our annualized rent as of March 31, 2021 because our negative straight-line and other adjustments and amortization of deferred revenue exceeded our positive straight-line adjustments due to factors such as the timing of contractual rent escalations and customer payments for services.
(d) CSF represents the GSF at an operating facility that is currently leased or readily available for lease as colocation space, where customers locate their servers and other IT equipment.
(e) Percent occupied is determined based on CSF billed to customers under signed leases as of March 31, 2021 divided by total CSF. Leases signed but that have not commenced billing as of March 31, 2021 are not included.
(f) Percent leased is calculated by dividing CSF under signed leases for colocation space (whether or not the lease has commenced billing) by total CSF. (g) Represents the GSF at an operating facility that is currently leased or readily available for lease as space other than CSF, which is typically office and other space.(h) Percent occupied is determined based on Office & Other space being billed to customers under signed leases as of March 31, 2021 divided by total Office & Other
space. Leases signed but not commenced as of March 31, 2021 are not included.(i) Represents infrastructure support space, including mechanical, telecommunications and utility rooms, as well as building common areas.(j) Represents the GSF at an operating facility that is currently leased or readily available for lease. This excludes existing vacant space held for development.(k) Represents space that is under roof that could be developed in the future for GSF, rounded to the nearest 1,000.(l) Critical power capacity represents the gross aggregate of UPS power installed and available to provide multiple redundancy levels for lease and exclusive use by
customers. Capacity is stated in megawatts as represented by UPS manufacturer nameplate ratings and does not include ancillary UPS capacity not configured for the direct support of leased customer critical IT load (e.g. dedicated office power, office disaster recovery UPS, or UPS utilized by CyrusOne for infrastructure control circuits). Does not sum to total due to rounding.
23

CyrusOne Inc.GSF Under Development
As of March 31, 2021 (Dollars in millions) (Unaudited)
GSF Under Development(a) Under Development Costs(b)
Facilities Metro Area
Estimated Completion
Date
Colocation Space(CSF) (000)
Office & Other (000)
SupportingInfrastructure
(000)
Powered Shell(c)
(000) Total (000)
Critical Load MW Capacity(d)
Actual to
Date(e)
Estimated Costs to
Completion(f) TotalSan Antonio V San Antonio 2Q'21 — 8 — — 8 6.0 $ 15 $10-12 $25-27 Cincinnati - North Cincinnati Cincinnati 2Q'21 3 — — — 3 2.0 — 9-12 9-12 Dublin I Dublin 2Q'21 76 19 32 78 204 12.0 81 25-42 106-123 London III London 2Q'21 19 — — — 19 6.0 16 15-20 31-36 Northern Virginia - Sterling VIII Northern Virginia 2Q'21 — — — — — 6.0 14 6-9 20-23 Paris I(g) Paris 2Q'21 26 4 15 201 246 6.0 38 14-27 52-65 Norwalk I New York 2Q'21 4 — — — 4 2.0 1 7-8 8-9Frankfurt III (DH #4) Frankfurt 3Q'21 15 3 15 — 33 4.0 7 6-8 13-15 Phoenix - Chandler VII Phoenix 3Q'21 62 10 38 — 110 15.0 — 70-80 70-80 Phoenix - Chandler V Phoenix 3Q'21 — — — — — 3.0 — 11-14 11-14Northern Virginia - Sterling IX Northern Virginia 3Q'21 102 8 4 — 114 21.0 6 80-94 86-100 Frankfurt IV Frankfurt 4Q'22 73 11 39 — 122 17.0 2 118-137 120-139 Total 380 62 142 279 864 100.0 $ 180 $371-463 $551-643
(a) Represents GSF at a facility for which, as of March 31, 2021, activities have commenced or are expected to commence in the next 2 quarters to prepare the space for its intended use. Estimates and timing are subject to change. May not sum to total due to rounding.
(b) London development costs are GBP-denominated and shown as USD-equivalent based on an exchange rate of 1.38 as of March 31, 2021. Dublin, Frankfurt and Paris development costs are EUR-denominated and shown as USD-equivalent based on an exchange rate of 1.17 as of March 31, 2021.
(c) Represents GSF under construction that, upon completion, will be powered shell available for future development into GSF. (d) Critical power capacity represents the gross aggregate of UPS power installed and available to provide multiple redundancy levels for lease and exclusive use by
customers. Capacity is stated in megawatts as represented by UPS manufacturer nameplate ratings and does not include ancillary UPS capacity not configured for the direct support of leased customer critical IT load.
(e) Actual to date is the cash investment as of March 31, 2021. There may be accruals above this amount for work completed, for which cash has not yet been paid.(f) Represents management’s estimate of the total costs required to complete the current GSF under development. There may be an increase in costs if customers require
greater power density. (g) Paris I is 100% pre-leased, with development planned in phases through mid-2026 to align with customer commitments.
Capital Expenditures - Investment in Real Estate(a) Three Months Ended(dollars in millions) March 31, 2021Capital expenditures - investment in real estate $172.8
(a) Excludes recurring capital expenditures.
CyrusOne Inc.Land Available for Future Development (Acres)
As of March 31, 2021 (Unaudited)
As ofMarket March 31, 2021Amsterdam 8 Austin 22 Chicago 23 Cincinnati 98 Council Bluffs, Iowa 10 Dallas 57 Dublin 15 Frankfurt 2 Houston 20 London 33 Northern Virginia 24 Phoenix 96 Quincy, Washington 48 San Antonio 12 Santa Clara 23
Total Available(a) 490 Book Value of Total Available $ 262.3 million
(a) Does not sum to total due to rounding.
24
CyrusOne Inc.Leasing Statistics - Lease Signings
As of March 31, 2021 (Unaudited)
PeriodNumber
of Leases(a)Total CSF Signed(b)
Total kW Signed(c)
Total MRRSigned (000)(d)
Weighted AverageLease Term(e)
1Q'21 414 156,000 28,493 $2,947 116Prior 4Q Avg. 414 154,000 25,155 $3,268 88
4Q'20 383 162,000 31,321 $4,112 1173Q'20 415 15,000 3,756 $894 54
2Q'20(f) 396 150,000 21,956 $3,070 841Q'20 460 289,000 43,586 $4,994 98
(a) Number of leases represents each agreement with a customer. A lease agreement could include multiple spaces, and a customer could have multiple leases.(b) CSF represents the GSF at an operating facility that is leased as colocation space, where customers locate their servers and other IT equipment.(c) Represents maximum contracted kW that customers may draw during lease period, and subject to full build out of projects subject to additional conditions.
Additionally, we can develop flexible solutions for our customers at multiple resiliency levels, and the kW signed is unadjusted for this factor.(d) Monthly recurring rent is defined as the average monthly contractual rent during the term of the lease. It includes the monthly impact of installation charges of
approximately $0.3 million in 1Q'20 and $0.2 million in 2Q'20, 3Q'20, 4Q'20 and 1Q'21.(e) Calculated on a CSF-weighted basis.(f) Includes exercise of previously disclosed (in 3Q’19) paid reservation for 4.5 MW and 30,000 CSF totaling approximately $5.5 million in annualized GAAP revenue in
2Q’20.
CyrusOne Inc.
New MRR Signed - Existing vs. New CustomersAs of March 31, 2021(Dollars in thousands)
(Unaudited)
(a) Monthly recurring rent is defined as the average monthly contractual rent during the term of the lease. It includes the monthly impact of installation charges of approximately $0.3 million in 1Q'20, $0.2 million in 4Q'19, 2Q'20, 3Q'20, 4Q'20, and 1Q'21, and $0.1 million in 2Q'19 and 3Q'19.
(b) 3Q'19 leasing statistics updated from those reported in 3Q'19-1Q'20 earnings materials to remove the prior inclusion of the paid reservation that was exercised in 2Q'20 and included in the 2Q'20 leasing results (30,000 CSF, 4.5 MW, and approximately $0.5 million in monthly recurring rent).
25
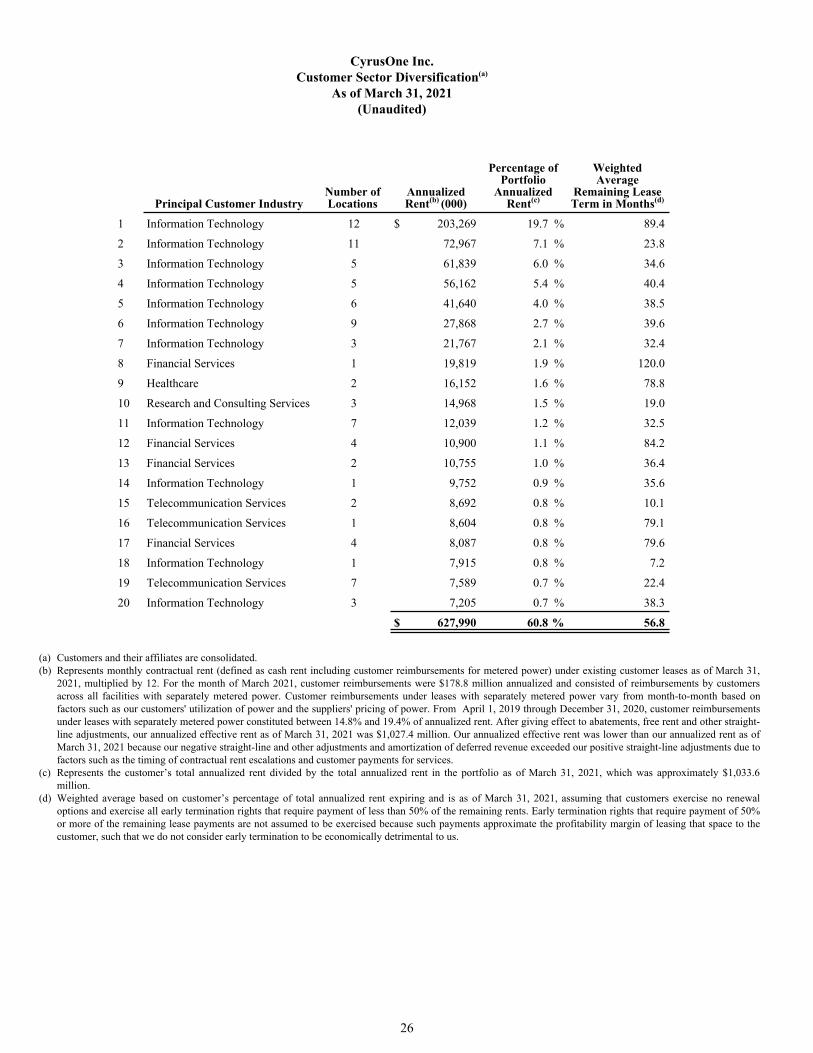
CyrusOne Inc.Customer Sector Diversification(a)
As of March 31, 2021 (Unaudited)
Principal Customer IndustryNumber ofLocations
Annualized Rent(b) (000)
Percentage of Portfolio
Annualized Rent(c)
Weighted Average
Remaining Lease Term in Months(d)
1 Information Technology 12 $ 203,269 19.7 % 89.4
2 Information Technology 11 72,967 7.1 % 23.8
3 Information Technology 5 61,839 6.0 % 34.6
4 Information Technology 5 56,162 5.4 % 40.4
5 Information Technology 6 41,640 4.0 % 38.5
6 Information Technology 9 27,868 2.7 % 39.6
7 Information Technology 3 21,767 2.1 % 32.4
8 Financial Services 1 19,819 1.9 % 120.0
9 Healthcare 2 16,152 1.6 % 78.8
10 Research and Consulting Services 3 14,968 1.5 % 19.0
11 Information Technology 7 12,039 1.2 % 32.5
12 Financial Services 4 10,900 1.1 % 84.2
13 Financial Services 2 10,755 1.0 % 36.4
14 Information Technology 1 9,752 0.9 % 35.6
15 Telecommunication Services 2 8,692 0.8 % 10.1
16 Telecommunication Services 1 8,604 0.8 % 79.1
17 Financial Services 4 8,087 0.8 % 79.6
18 Information Technology 1 7,915 0.8 % 7.2
19 Telecommunication Services 7 7,589 0.7 % 22.4
20 Information Technology 3 7,205 0.7 % 38.3
$ 627,990 60.8 % 56.8
(a) Customers and their affiliates are consolidated.(b) Represents monthly contractual rent (defined as cash rent including customer reimbursements for metered power) under existing customer leases as of March 31,
2021, multiplied by 12. For the month of March 2021, customer reimbursements were $178.8 million annualized and consisted of reimbursements by customers across all facilities with separately metered power. Customer reimbursements under leases with separately metered power vary from month-to-month based on factors such as our customers' utilization of power and the suppliers' pricing of power. From April 1, 2019 through December 31, 2020, customer reimbursements under leases with separately metered power constituted between 14.8% and 19.4% of annualized rent. After giving effect to abatements, free rent and other straight-line adjustments, our annualized effective rent as of March 31, 2021 was $1,027.4 million. Our annualized effective rent was lower than our annualized rent as of March 31, 2021 because our negative straight-line and other adjustments and amortization of deferred revenue exceeded our positive straight-line adjustments due to factors such as the timing of contractual rent escalations and customer payments for services.
(c) Represents the customer’s total annualized rent divided by the total annualized rent in the portfolio as of March 31, 2021, which was approximately $1,033.6 million.
(d) Weighted average based on customer’s percentage of total annualized rent expiring and is as of March 31, 2021, assuming that customers exercise no renewal options and exercise all early termination rights that require payment of less than 50% of the remaining rents. Early termination rights that require payment of 50% or more of the remaining lease payments are not assumed to be exercised because such payments approximate the profitability margin of leasing that space to the customer, such that we do not consider early termination to be economically detrimental to us.
26
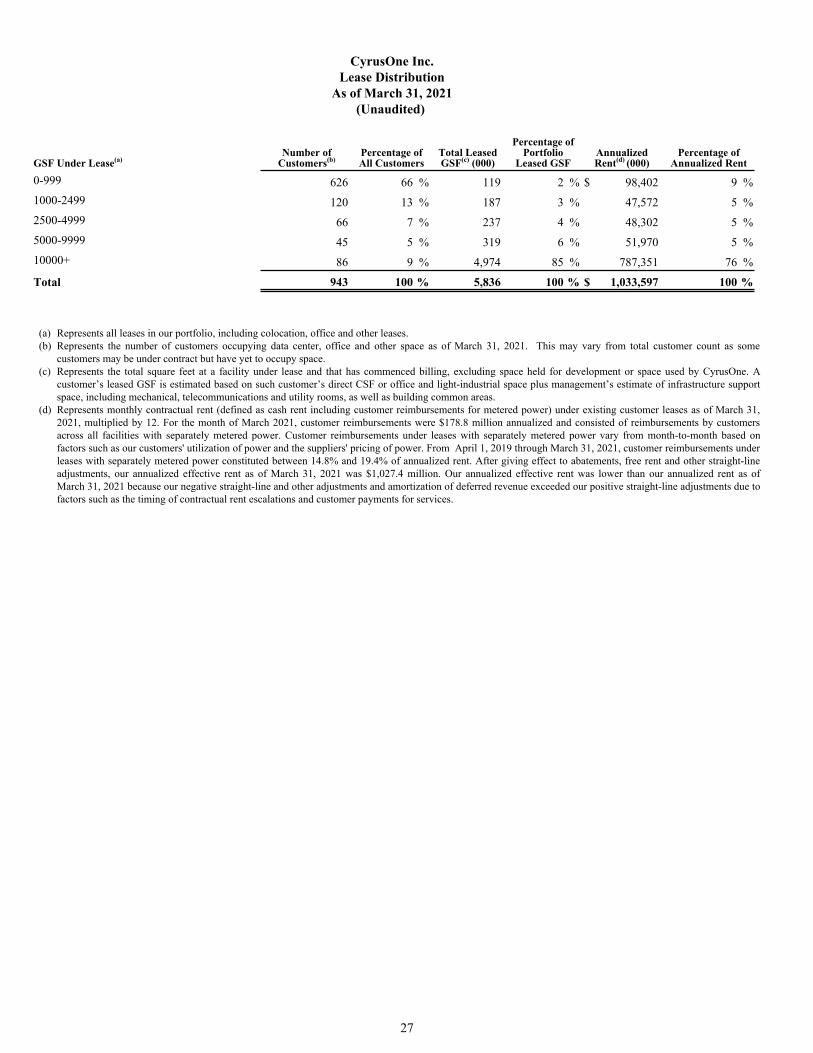
CyrusOne Inc.Lease Distribution
As of March 31, 2021 (Unaudited)
GSF Under Lease(a)Number of
Customers(b)Percentage ofAll Customers
Total Leased GSF(c) (000)
Percentage ofPortfolio
Leased GSFAnnualizedRent(d) (000)
Percentage ofAnnualized Rent
0-999 626 66 % 119 2 % $ 98,402 9 %1000-2499 120 13 % 187 3 % 47,572 5 %2500-4999 66 7 % 237 4 % 48,302 5 %5000-9999 45 5 % 319 6 % 51,970 5 %10000+ 86 9 % 4,974 85 % 787,351 76 %
Total 943 100 % 5,836 100 % $ 1,033,597 100 %
(a) Represents all leases in our portfolio, including colocation, office and other leases.(b) Represents the number of customers occupying data center, office and other space as of March 31, 2021. This may vary from total customer count as some
customers may be under contract but have yet to occupy space.(c) Represents the total square feet at a facility under lease and that has commenced billing, excluding space held for development or space used by CyrusOne. A
customer’s leased GSF is estimated based on such customer’s direct CSF or office and light-industrial space plus management’s estimate of infrastructure support space, including mechanical, telecommunications and utility rooms, as well as building common areas.
(d) Represents monthly contractual rent (defined as cash rent including customer reimbursements for metered power) under existing customer leases as of March 31, 2021, multiplied by 12. For the month of March 2021, customer reimbursements were $178.8 million annualized and consisted of reimbursements by customers across all facilities with separately metered power. Customer reimbursements under leases with separately metered power vary from month-to-month based on factors such as our customers' utilization of power and the suppliers' pricing of power. From April 1, 2019 through March 31, 2021, customer reimbursements under leases with separately metered power constituted between 14.8% and 19.4% of annualized rent. After giving effect to abatements, free rent and other straight-line adjustments, our annualized effective rent as of March 31, 2021 was $1,027.4 million. Our annualized effective rent was lower than our annualized rent as of March 31, 2021 because our negative straight-line and other adjustments and amortization of deferred revenue exceeded our positive straight-line adjustments due to factors such as the timing of contractual rent escalations and customer payments for services.
27
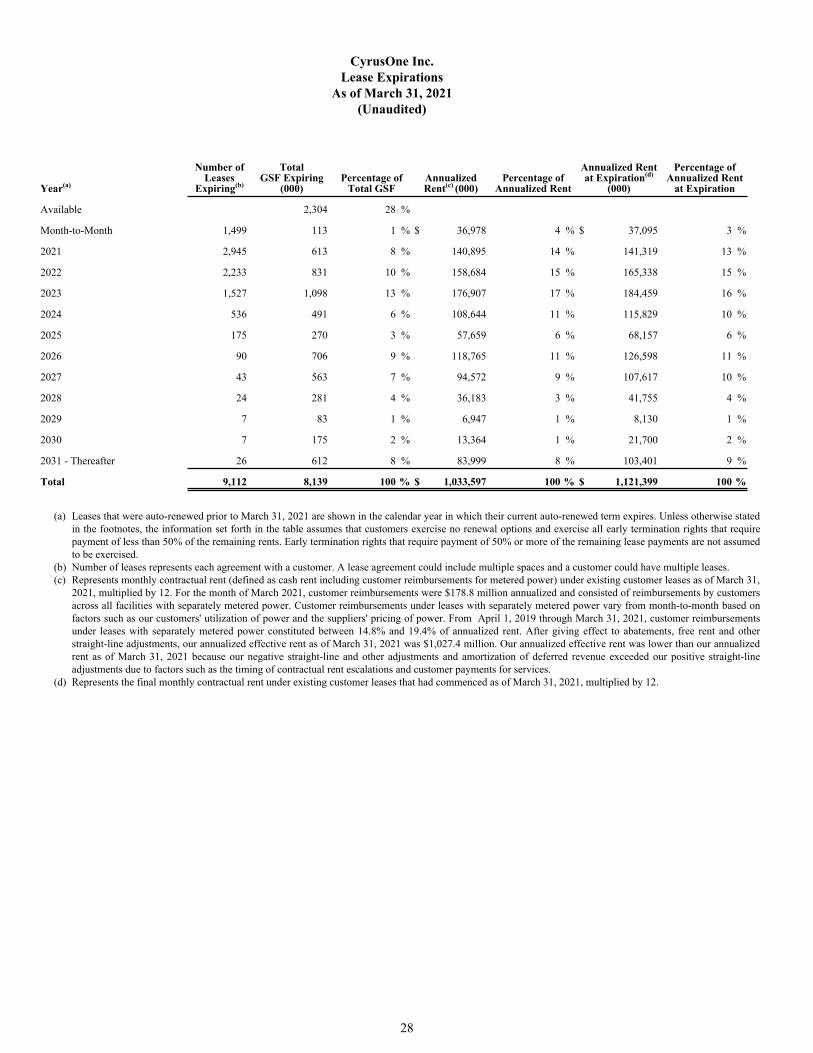
CyrusOne Inc.Lease Expirations
As of March 31, 2021 (Unaudited)
Year(a)
Number of Leases
Expiring(b)
TotalGSF Expiring
(000)Percentage of
Total GSFAnnualized Rent(c) (000)
Percentage ofAnnualized Rent
Annualized Rent at Expiration(d)
(000)
Percentage ofAnnualized Rent
at Expiration
Available 2,304 28 %
Month-to-Month 1,499 113 1 % $ 36,978 4 % $ 37,095 3 %
2021 2,945 613 8 % 140,895 14 % 141,319 13 %
2022 2,233 831 10 % 158,684 15 % 165,338 15 %
2023 1,527 1,098 13 % 176,907 17 % 184,459 16 %
2024 536 491 6 % 108,644 11 % 115,829 10 %
2025 175 270 3 % 57,659 6 % 68,157 6 %
2026 90 706 9 % 118,765 11 % 126,598 11 %
2027 43 563 7 % 94,572 9 % 107,617 10 %
2028 24 281 4 % 36,183 3 % 41,755 4 %
2029 7 83 1 % 6,947 1 % 8,130 1 %
2030 7 175 2 % 13,364 1 % 21,700 2 %
2031 - Thereafter 26 612 8 % 83,999 8 % 103,401 9 %
Total 9,112 8,139 100 % $ 1,033,597 100 % $ 1,121,399 100 %
(a) Leases that were auto-renewed prior to March 31, 2021 are shown in the calendar year in which their current auto-renewed term expires. Unless otherwise stated in the footnotes, the information set forth in the table assumes that customers exercise no renewal options and exercise all early termination rights that require payment of less than 50% of the remaining rents. Early termination rights that require payment of 50% or more of the remaining lease payments are not assumed to be exercised.
(b) Number of leases represents each agreement with a customer. A lease agreement could include multiple spaces and a customer could have multiple leases.(c) Represents monthly contractual rent (defined as cash rent including customer reimbursements for metered power) under existing customer leases as of March 31,
2021, multiplied by 12. For the month of March 2021, customer reimbursements were $178.8 million annualized and consisted of reimbursements by customers across all facilities with separately metered power. Customer reimbursements under leases with separately metered power vary from month-to-month based on factors such as our customers' utilization of power and the suppliers' pricing of power. From April 1, 2019 through March 31, 2021, customer reimbursements under leases with separately metered power constituted between 14.8% and 19.4% of annualized rent. After giving effect to abatements, free rent and other straight-line adjustments, our annualized effective rent as of March 31, 2021 was $1,027.4 million. Our annualized effective rent was lower than our annualized rent as of March 31, 2021 because our negative straight-line and other adjustments and amortization of deferred revenue exceeded our positive straight-line adjustments due to factors such as the timing of contractual rent escalations and customer payments for services.
(d) Represents the final monthly contractual rent under existing customer leases that had commenced as of March 31, 2021, multiplied by 12.
28