1q 2017 earnings presentation
TRANSCRIPT
Color
Scheme
234 93 46
109 179 63
235 235 235
0 75 141
253 185 36
Accent
Color
31 179 179
192 0 0
1Q17 Earnings Results Presentation
April 21, 2017
“This presentation contains forward-looking statements. These statements are made under the “safe harbor” provisions established
by the U.S. Private Securities Litigation Reform Act of 1995. Forward-looking statements involve inherent risks and uncertainties.
The forward-looking statements in this presentation reflect the expectations of the Bank’s management and are based on currently
available data; however, actual experience with respect to these factors is subject to future events and uncertainties, which could
materially impact the Bank’s expectations. A number of factors could cause actual performance and results to differ materially from
those contained in any forward-looking statement, including but not limited to the following: the anticipated growth of the Bank’s
credit portfolio, including its trade finance portfolio; the continuation of the Bank’s preferred creditor status; the impact of increasing
interest rates and of the macroeconomic environment in the Region on the Bank’s financial condition; the execution of the Bank’s
strategies and initiatives, including its revenue diversification strategy; the adequacy of the Bank’s allowance for credit losses; the
need for additional provisions for credit losses; the Bank’s ability to achieve future growth, the Bank’s ability to reduce its liquidity
levels and increase its leverage; the Bank’s ability to maintain its investment-grade credit ratings; the availability and mix of future
sources of funding for the Bank’s lending operations; potential trading losses; the possibility of fraud; and the adequacy of the
Bank’s sources of liquidity to replace large deposit withdrawals.”
2
Financial Performance Overview
Stronger than usual seasonality in credit demand in most of the Region during
1Q17, with abundant liquidity available
Overall economic performance of the Region appears to have hit bottom; base
case scenario points to moderate recovery in 2017
WTO trade leading indicators (container shipping throughput, world export
orders and GDP estimates) are up in the early months of 2017
Pacific Alliance countries remain growth focus for Bladex amidst stiff
competition. Making headway in Mexico, where economy remains strong
LatAm debt capital markets have rebounded with significant appetite for strong
names
Environment Highlights
3
Financial Performance Overview
Profit of $23.5 MM up 76% vs. previous quarter (stable YoY), on lower provisions for expected
credit losses (“ECL”) and enhanced efficiency
Fees & other income up +31% YoY and -22% QoQ on improved and more diversified client
demand in L/C business. No closings in the loan structuring and syndication business during the
quarter, with several transactions slated for completion in 2Q, and during the second half of the
year
Resilient NIM at 2.02% (-3bps QoQ and -4bps YoY) despite shorter tenors, and de-risking
measures over the last several quarters, mitigated by increased market rates (LIBOR) and stable
funding spreads
Average loan portfolio (-9% QoQ and -11% YoY) reflects both stronger than usual seasonality in
market demand in most of the Region, and continued efforts to reduce risk concentrations.
Deposit balances reached $3.2B, up +14% QoQ and +4% YoY, representing 53% of total liabilities
Non-performing loan portfolio (NPL) was stable at $65.4 MM QoQ compared to $28.0 MM as of
1Q16. 1Q17 provisions for ECL reflect ongoing protracted restructuring proceedings
Reserve coverage ratio increased to 1.89% (+16 bps QoQ; +49 bps YoY) on incremental
provisions for ECL and lower Commercial Portfolio balances
Bladex Board of Directors declared a $0.385/share quarterly dividend, representing an attractive
yield (5.5%)
1Q17 Results Highlights
4
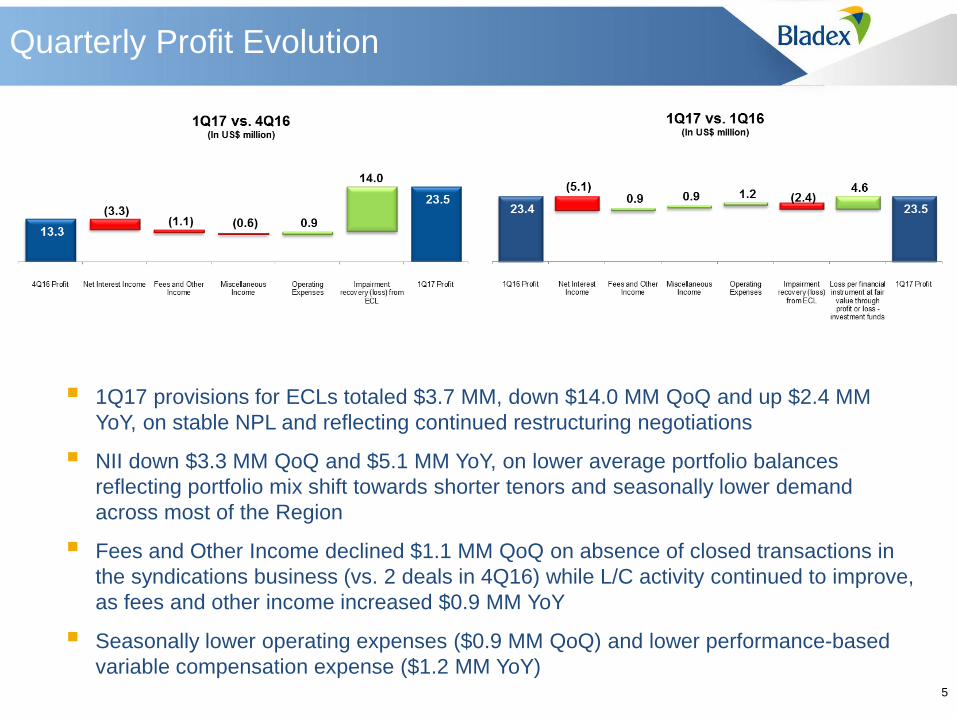
1Q17 provisions for ECLs totaled $3.7 MM, down $14.0 MM QoQ and up $2.4 MM
YoY, on stable NPL and reflecting continued restructuring negotiations
NII down $3.3 MM QoQ and $5.1 MM YoY, on lower average portfolio balances
reflecting portfolio mix shift towards shorter tenors and seasonally lower demand
across most of the Region
Fees and Other Income declined $1.1 MM QoQ on absence of closed transactions in
the syndications business (vs. 2 deals in 4Q16) while L/C activity continued to improve,
as fees and other income increased $0.9 MM YoY
Seasonally lower operating expenses ($0.9 MM QoQ) and lower performance-based
variable compensation expense ($1.2 MM YoY) 5
Quarterly Profit Evolution
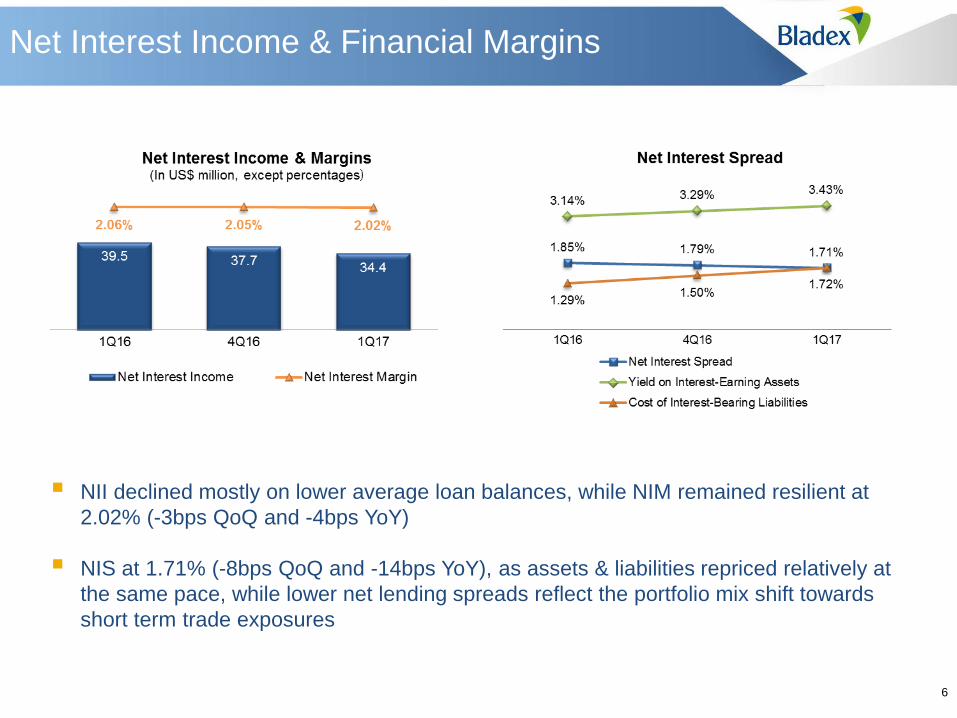
NII declined mostly on lower average loan balances, while NIM remained resilient at
2.02% (-3bps QoQ and -4bps YoY)
NIS at 1.71% (-8bps QoQ and -14bps YoY), as assets & liabilities repriced relatively at
the same pace, while lower net lending spreads reflect the portfolio mix shift towards
short term trade exposures
6
Net Interest Income & Financial Margins
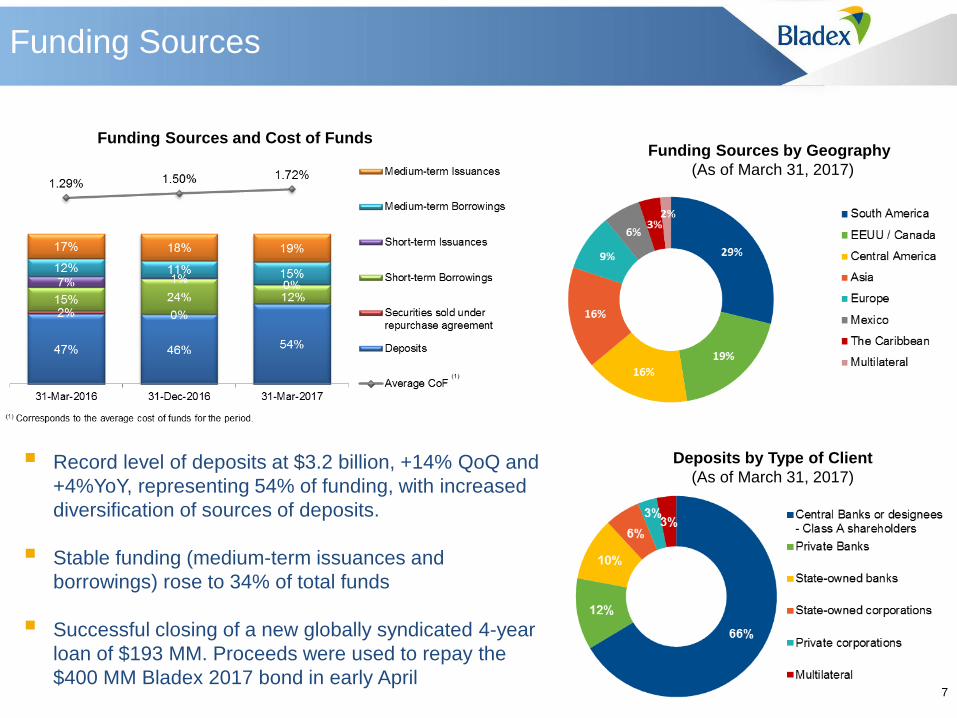
Record level of deposits at $3.2 billion, +14% QoQ and
+4%YoY, representing 54% of funding, with increased
diversification of sources of deposits.
Stable funding (medium-term issuances and
borrowings) rose to 34% of total funds
Successful closing of a new globally syndicated 4-year
loan of $193 MM. Proceeds were used to repay the
$400 MM Bladex 2017 bond in early April
Funding Sources and Cost of Funds
Deposits by Type of Client
(As of March 31, 2017)
Funding Sources by Geography
(As of March 31, 2017)
Funding Sources
7
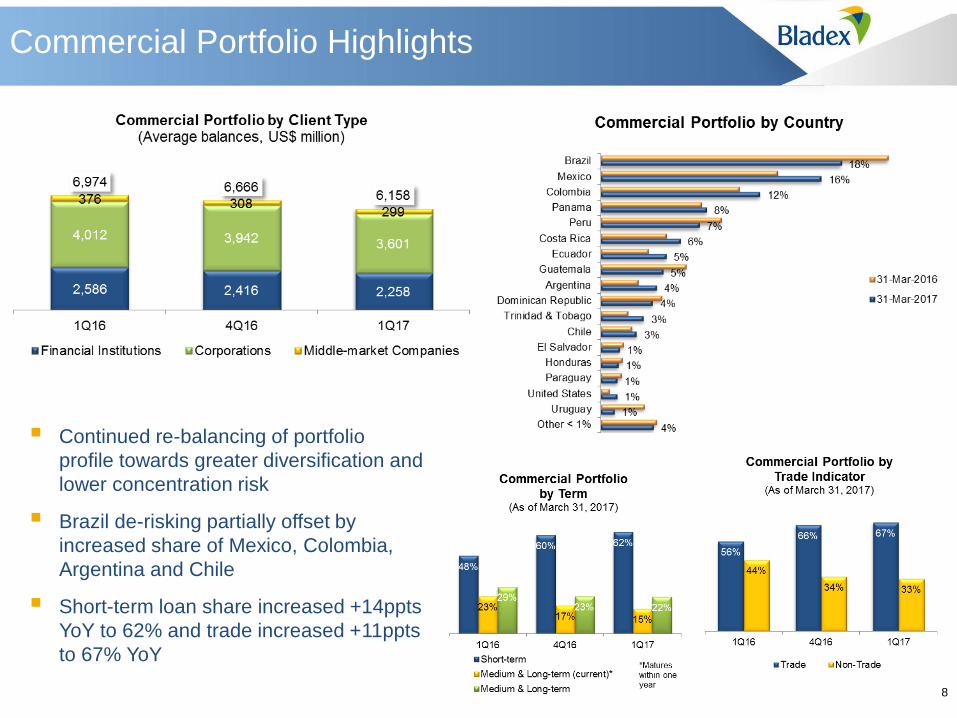
Continued re-balancing of portfolio
profile towards greater diversification and
lower concentration risk
Brazil de-risking partially offset by
increased share of Mexico, Colombia,
Argentina and Chile
Short-term loan share increased +14ppts
YoY to 62% and trade increased +11ppts
to 67% YoY
8
Commercial Portfolio Highlights
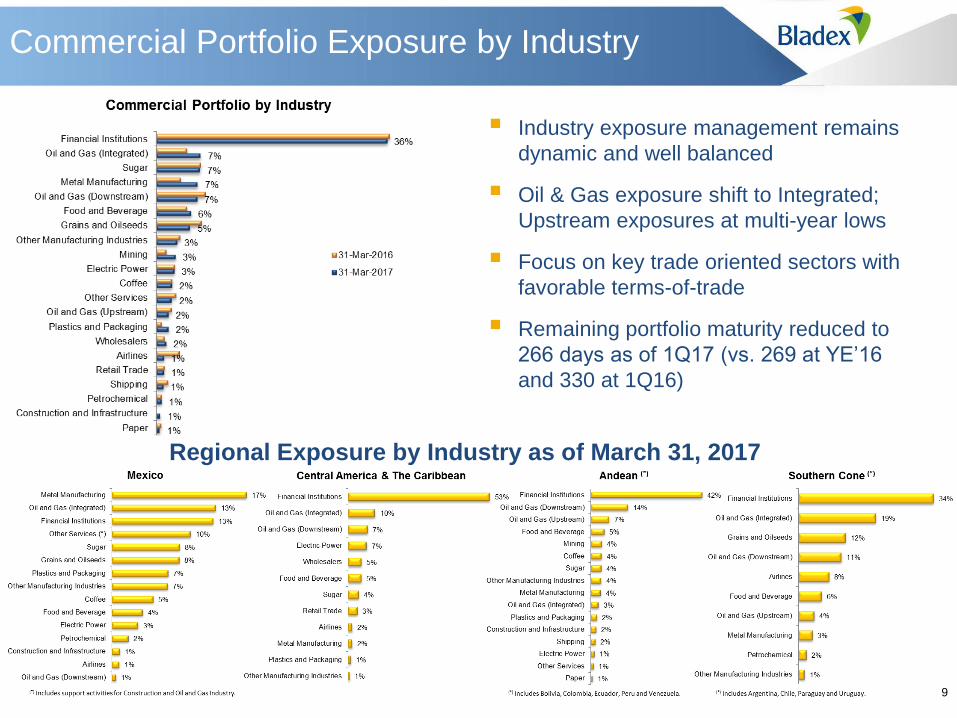
Industry exposure management remains
dynamic and well balanced
Oil & Gas exposure shift to Integrated;
Upstream exposures at multi-year lows
Focus on key trade oriented sectors with
favorable terms-of-trade
Remaining portfolio maturity reduced to
266 days as of 1Q17 (vs. 269 at YE’16
and 330 at 1Q16)
Regional Exposure by Industry as of March 31, 2017
9
Commercial Portfolio Exposure by Industry
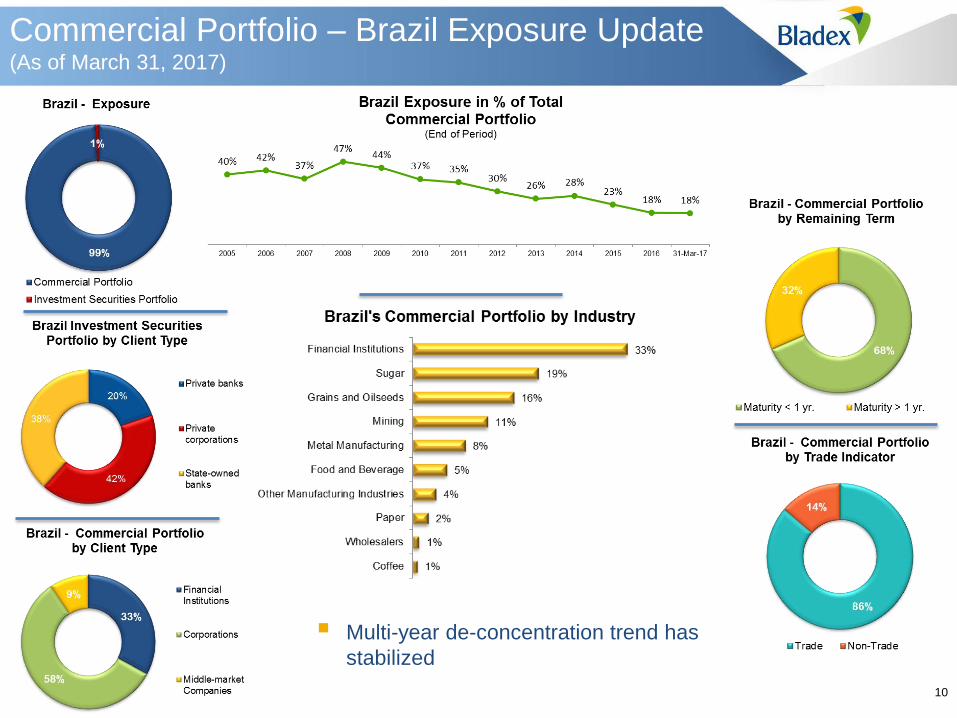
Multi-year de-concentration trend has
stabilized
10
Commercial Portfolio – Brazil Exposure Update (As of March 31, 2017)
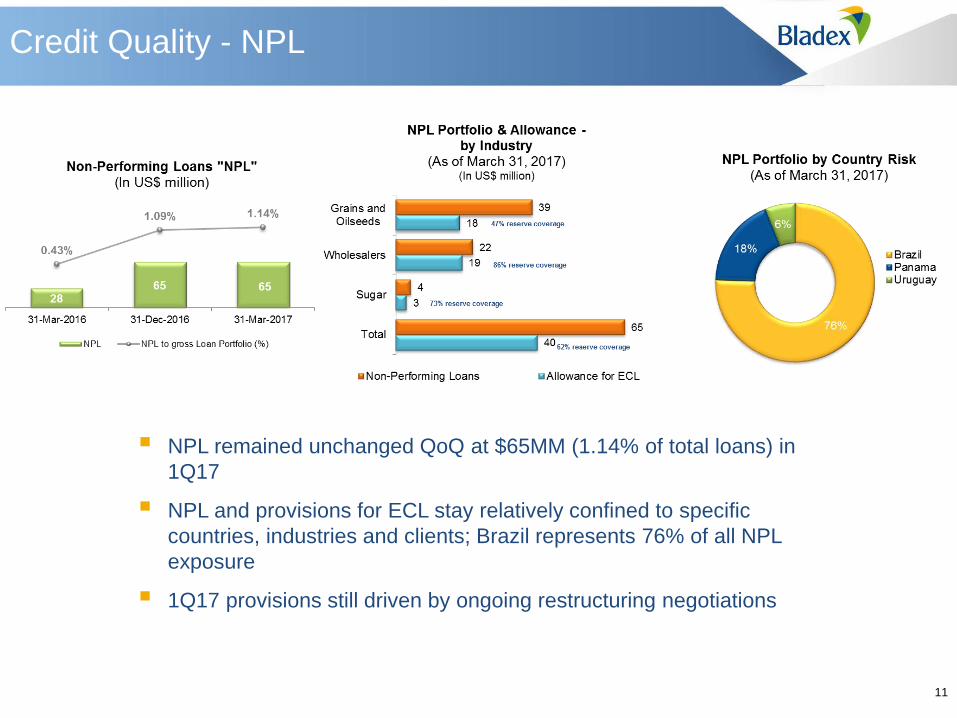
NPL remained unchanged QoQ at $65MM (1.14% of total loans) in
1Q17
NPL and provisions for ECL stay relatively confined to specific
countries, industries and clients; Brazil represents 76% of all NPL
exposure
1Q17 provisions still driven by ongoing restructuring negotiations
11
Credit Quality - NPL

IFRS Rule 9 - Stage 1: Collectively assessed performing exposures based on 12-
month ECL; IFRS Rule 9 - Stage 2: Performing exposures assessed based on
lifetime ECL; IFRS Rule 9 - Stage 3: Credit-impaired financial assets (“NPL”) based
on lifetime ECL
Total allowance for ECL on loans of
$109.9MM, an increase of $3.9MM QoQ,
explained by:
- (+) Higher provision for NPL (Stage 3)
reflecting ongoing restructurings
- (+) Higher provision for performing loans
on lifetime expected losses (Stage 2)
- (-) Lower requirement for performing
loans on 12-month expected losses
(Stage 1), on decreased loan balances
12
Credit Quality - Allowances
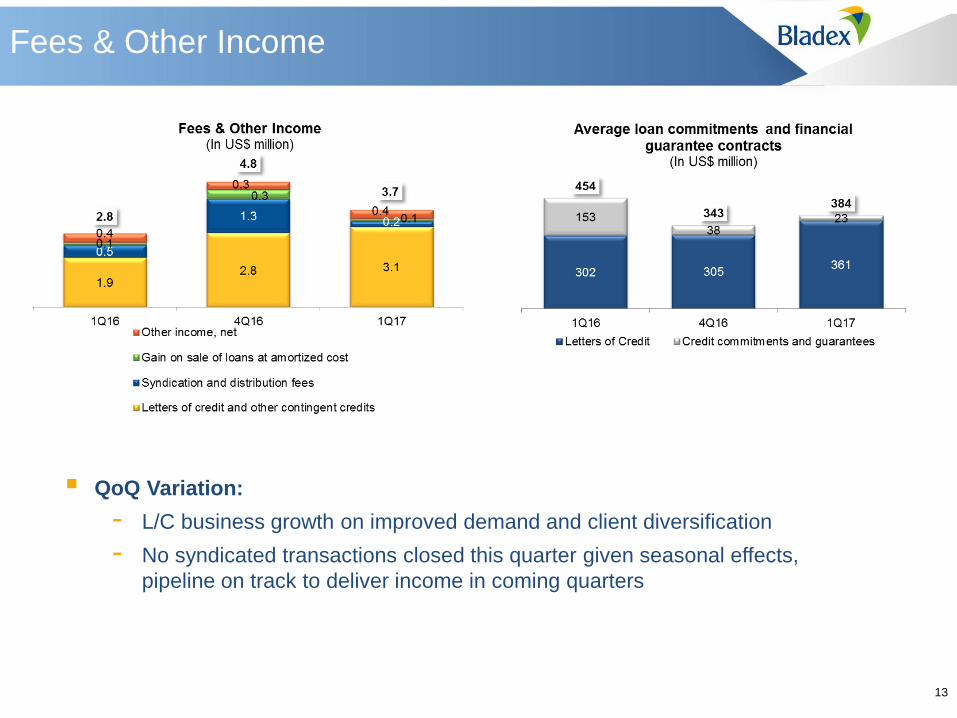
QoQ Variation:
- L/C business growth on improved demand and client diversification
- No syndicated transactions closed this quarter given seasonal effects,
pipeline on track to deliver income in coming quarters
13
Fees & Other Income
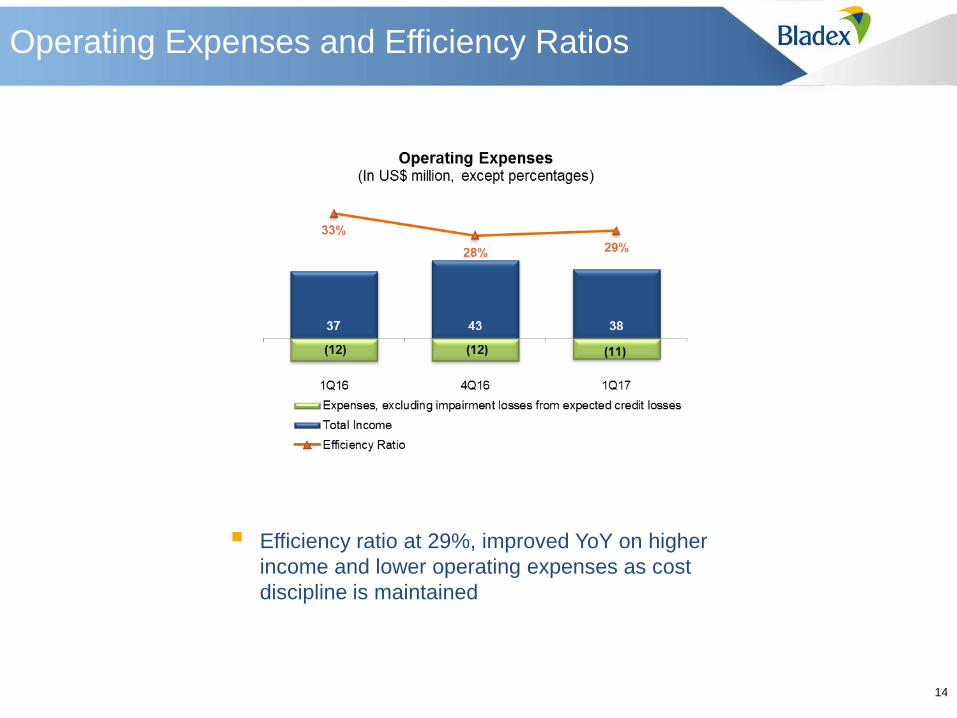
Efficiency ratio at 29%, improved YoY on higher
income and lower operating expenses as cost
discipline is maintained
14
Operating Expenses and Efficiency Ratios
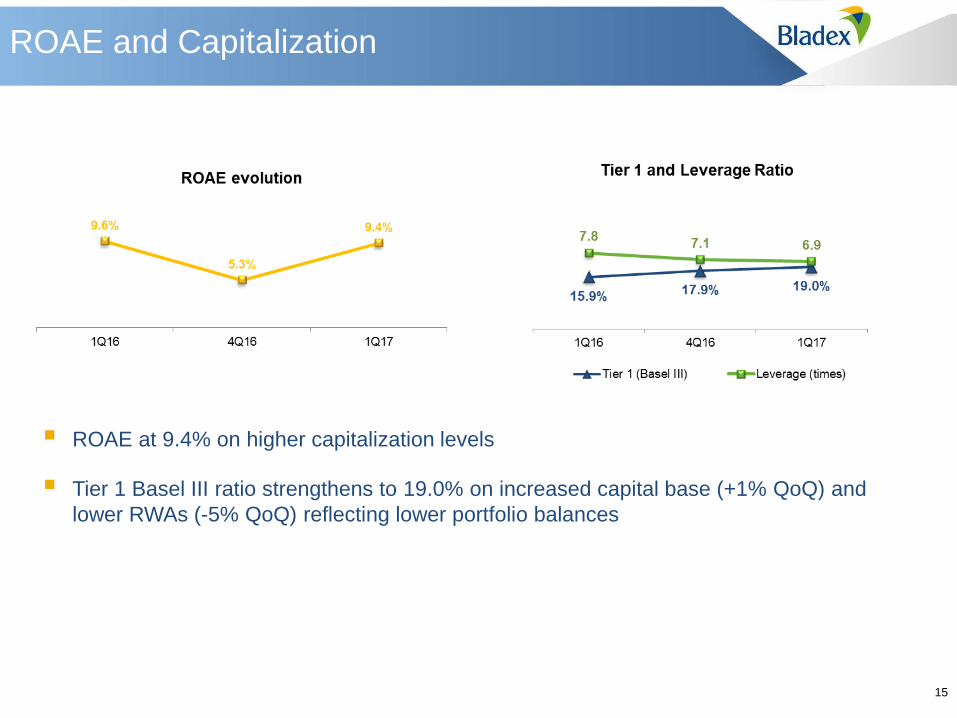
ROAE at 9.4% on higher capitalization levels
Tier 1 Basel III ratio strengthens to 19.0% on increased capital base (+1% QoQ) and
lower RWAs (-5% QoQ) reflecting lower portfolio balances
15
ROAE and Capitalization
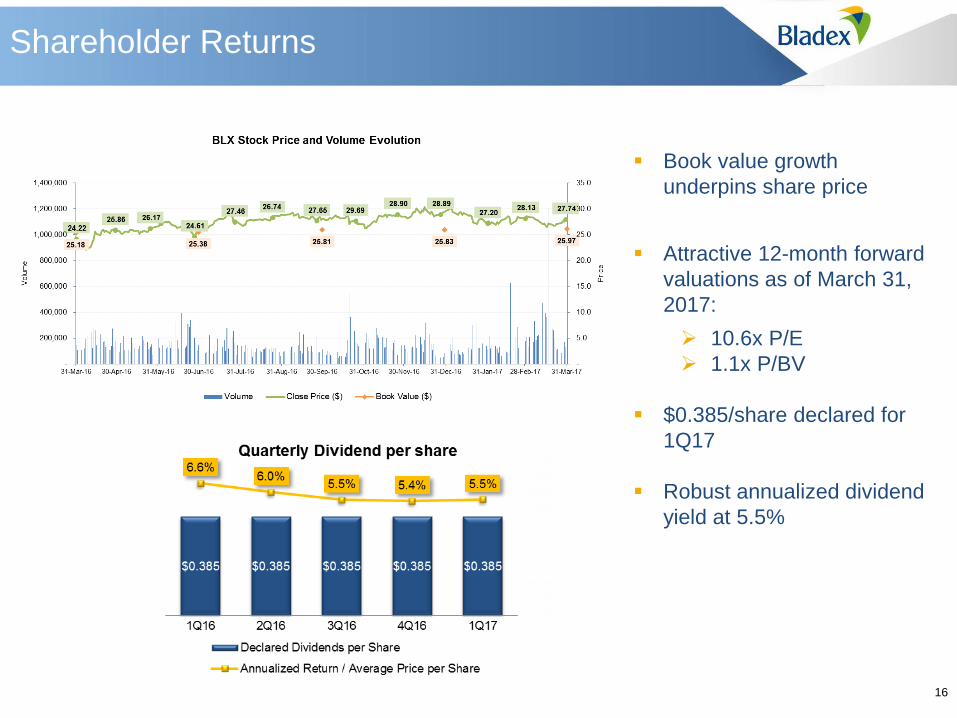
Book value growth
underpins share price
Attractive 12-month forward
valuations as of March 31,
2017:
10.6x P/E
1.1x P/BV
$0.385/share declared for
1Q17
Robust annualized dividend
yield at 5.5%
16
Shareholder Returns
Thank You
17
Appendix
18
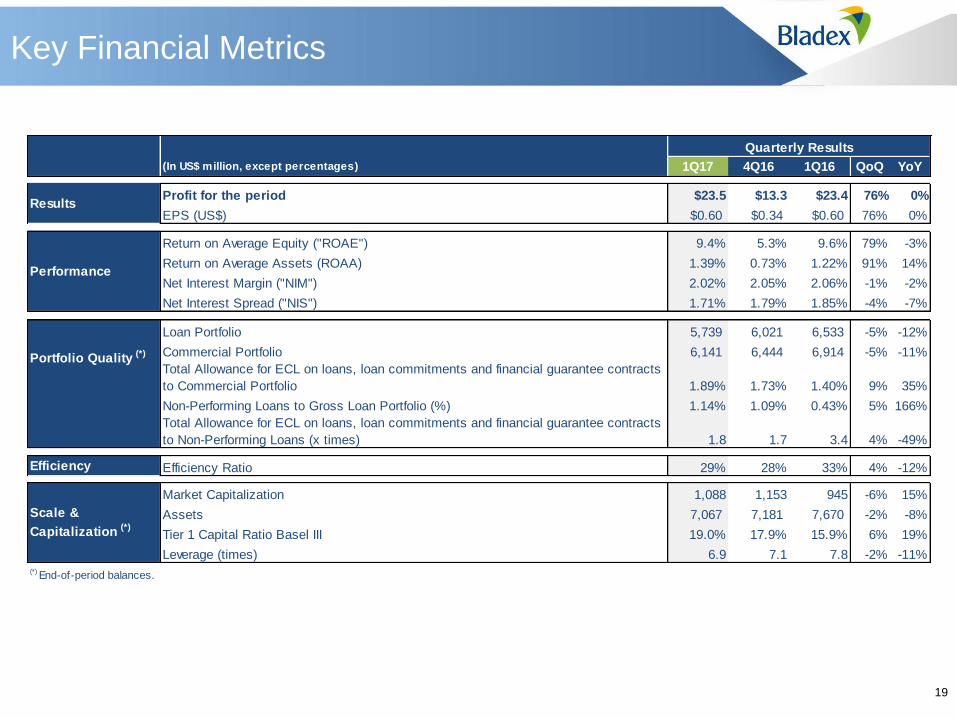
Key Financial Metrics
19
Quarterly Results Year to Date Results
(In US$ million, except percentages) 1Q17 4Q16 1Q16 QoQ YoY
Profit for the period $23.5 $13.3 $23.4 76% 0%
EPS (US$) $0.60 $0.34 $0.60 76% 0%
Return on Average Equity ("ROAE") 9.4% 5.3% 9.6% 79% -3%
Return on Average Assets (ROAA) 1.39% 0.73% 1.22% 91% 14%
Net Interest Margin ("NIM") 2.02% 2.05% 2.06% -1% -2%
Net Interest Spread ("NIS") 1.71% 1.79% 1.85% -4% -7%
Loan Portfolio 5,739 6,021 6,533 -5% -12%
Commercial Portfolio 6,141 6,444 6,914 -5% -11%
Total Allowance for ECL on loans, loan commitments and financial guarantee contracts
to Commercial Portfolio 1.89% 1.73% 1.40% 9% 35%
Non-Performing Loans to Gross Loan Portfolio (%) 1.14% 1.09% 0.43% 5% 166%
Total Allowance for ECL on loans, loan commitments and financial guarantee contracts
to Non-Performing Loans (x times) 1.8 1.7 3.4 4% -49%
Efficiency Ratio 29% 28% 33% 4% -12%
Market Capitalization 1,088 1,153 945 -6% 15%
Assets 7,067 7,181 7,670 -2% -8%
Tier 1 Capital Ratio Basel III 19.0% 17.9% 15.9% 6% 19%
Leverage (times) 6.9 7.1 7.8 -2% -11%(*) End-of-period balances.
Results
Performance
Portfolio Quality (*)
Efficiency
Scale &
Capitalization (*)