1985 - timing technological transitions
TRANSCRIPT
Technology In Soaery, Vol . 7, pp. 127-141(1985)
0160-791X/85 $3 .00 + .00Printed in the USA . All rights reserved .
Copyright 0 1986 Pergamon Press Ltd .
Timing Technological TransitionsRichard N. Foster
ABSTRACT Technological discontinuities are among the most disruptive challenges facingcorporations, and they are on the increase . Empirically, it appears that few corporations areable to survive discontinuities . They either lose market share, money or their indepen-dence. Despite the importance of the discontinuity problem for top management, few havedone much to better anticipate and deal with these increasingly frequent events . They actas ifthey assume that there is nothing that can be done . The problem appears to be one ofmisplacedfaith in some conventional assumptions about what it taker to succeed. The au-thor examines these assumptions, particularly those dealing with the supposed advantages ofdefenders, andpinpoints their errors. This knowledge then leads to positive solutions thathopefully, in turn, will lead to increased success for some of our most important companies .
When the transistor replaced the vacuum tube in the mid-1950s, every one of thetop ten producers of vacuum-rube components was caught flat-footed . Six of themdiscounted the importance of the new development and held aloof from solid-statetechnology, while the other four tried to change horses, but failed . Not one of theten is a force in today's $10 billion semiconductor industry .
This familiar scenario is not confined to high-technology industries . Consider tirecords. Sixty years ago they were made of cotton . Then-in the mid-1940s-the leadshifted to rayon and the American Viscose Company became the leading supplierof cord . Early in the 1960s, however, Du Pont's nylon tire cords captured the topposition. The lead shifted yet again in the late 1970s, when Celanese took controlwith its polyester fibers . Each time a new technology superseded the old, industryleadership changed hands .
Few companies, it seems, are able to make a successful transition to a profitablenew technology . Typically, technology leaders wake up too late to the threat of anew technology .
How do technologies mature? Why is the process so often accompanied by man-agement paralysis and competitive dislocation? And what steps can companies taketo improve their ability to anticipate and manage transitions between technologies,reducing the chances of such dislocation in the face of future technological change?These are the questions that will be explored here .
Richard N. Foster u a Director ofMcKmsey & Company and beads the f rm i Technologypractice. He is the author ofa book on successfully managing through technological dis-continuities, which will be published in early 1986 .
127
128
Richard N. Foster
Technological Limits and Potential
Technological improvement in any field is ultimately limited by the laws of nature .The number of transistors that can be placed on a silicon chip is limited by thecrystal structure of silicon, the ultimate strength of a fiber by the strength of itsintermolecular bonds .
Most industries are far from these ultimate natural barriers, and much more likelyto come up against practical technological limits . The efficiency of today's car en-gines, for instance, is limited by the ability of existing engine alloys to withstandheat; hence, researchers are investigating the possibility of using ceramics in theirplace .
The mission of research and development is to advance toward the limit -bothpractical and theoretical-of a particular technology . How much improvement ispossible is determined by the difference between the current state of the art andthe technical limit. This difference can be called the technical potential. As thestate of the art nears its technical limits, each increment of research effort producesless improvement since the most effective ideas presumably have already been used .Said another way, as the limits of technology are approached, the returns from fur-ther R&D diminish . Many companies don't understand where the limits of theirtechnologies lie, and finding out can be a complicated business . But the payoff canbe great .
In the late 1960s, for example, IBM investigated the limits of computer tech-nology.' Thorough evaluation at the Watson Research Labs confirmed the prevalentassumption that these limits were ultimately set by the accuracy with which com-puter circuits could be printed by photolithography . It also disclosed, however, thatthe state of the art of component design, device design, and -most particularly-chip "package" design all posed more restrictive practical limits . To get aroundthese limits, the scientists changed the existing design in what became known asthe "multiple stacked array" concept on which IBM's 4300 Series computers weftbased-a major market success of the 1970s that would have been impossible with .out thorough understanding of technological limits .
The role of technology in corporate strategy is directly related to technologicalpotential. If the potential is high-i .e., if the state of the art is remote from thetechnical limit (a situation typical of "high-tech" industries)- technology is likelyto be an important element in the strategy of the business . If the technological po .tential is low, then other business functions are likely to loom larger .
The S-Curve Phenomenon
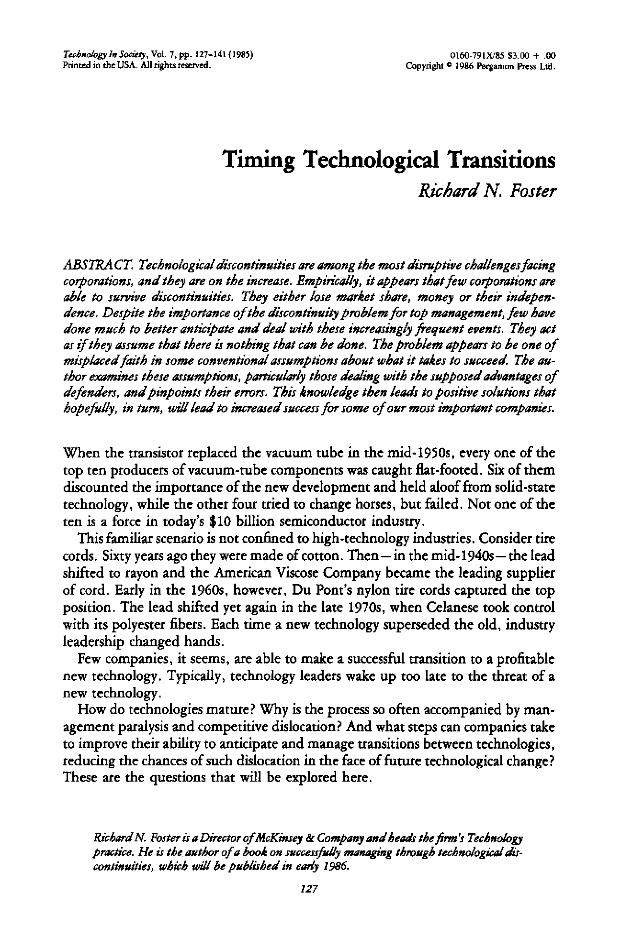
Of necessity, all R&D work is carried out in the context of technical limits . Earlyin an R&D program, knowledge bases need to be built, lines of inquiry must bedrawn and tested, and technical problems surfaced . Researchers need to investigateand discard unworkable approaches . Thus, until this knowledge has been acquired ..the pace of progress toward technological limits is usually slow . But then it pick,up, typically reaching a maximum when something like half the technical potentialhas been realized . At this point, the technology begins to be constrained by its lim .
TechnicalPerformance
Research Effort
Timing Technological Tmnsitions
129
Region of MaximumRate of Progress
FIGURE 1. The S-curve phenomenon .
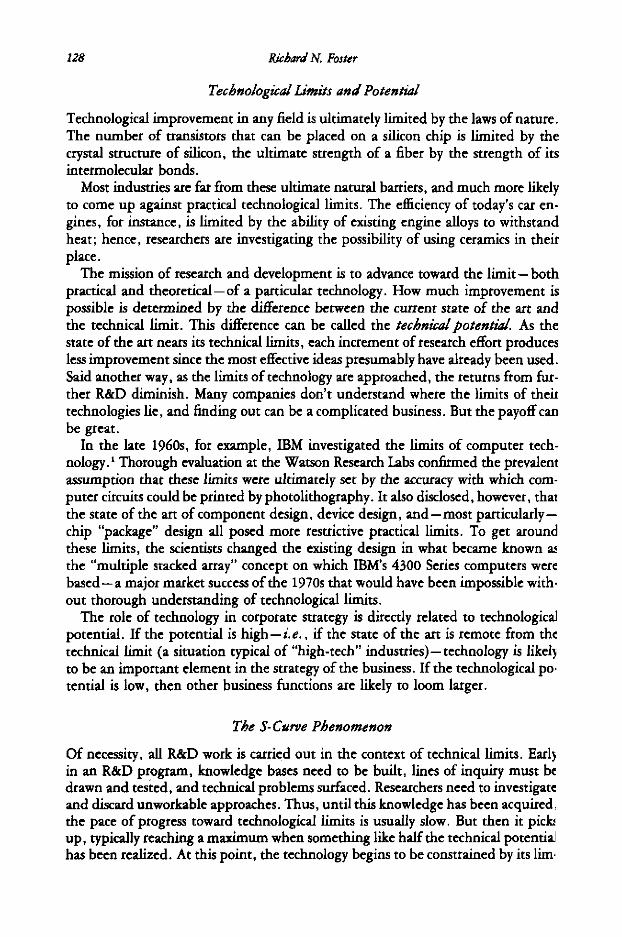
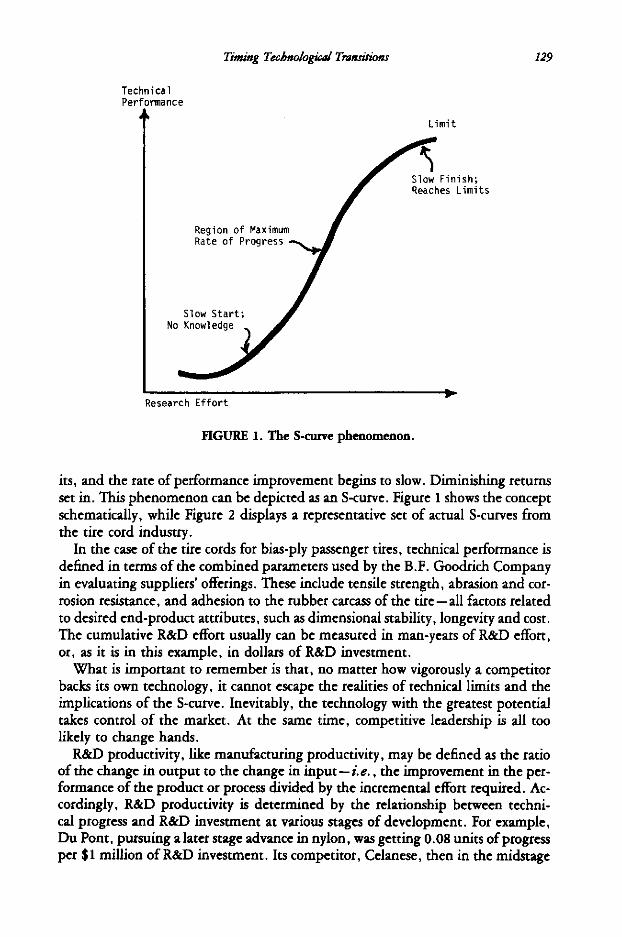
its, and the rate of performance improvement begins to slow . Diminishing returnsset in. This phenomenon can be depicted as an S-curve . Figure 1 shows the conceptschematically, while Figure 2 displays a representative set of actual S-curves fromthe tire cord industry .
In the case of the tire cords for bias-ply passenger tires, technical performance isdefined in terms of the combined parameters used by the B.F. Goodrich Companyin evaluating suppliers' offerings . These include tensile strength, abrasion and cor-rosion resistance, and adhesion to the rubber carcass of the tire-all factors relatedto desired end-product attributes, such as dimensional stability, longevity and cost .The cumulative R&D effort usually can be measured in man-years of R&D effort,or, as it is in this example, in dollars of R&D investment .
What is important to remember is that, no matter how vigorously a competitorbacks its own technology, it cannot escape the realities of technical limits and theimplications of the S-curve. Inevitably, the technology with the greatest potentialtakes control of the market . At the same time, competitive leadership is all toolikely to change hands .
R&D productivity, like manufacturing productivity, may be defined as the ratioof the change in output to the change in input-i .e . , the improvement in the per-formance of the product or process divided by the incremental effort required . Ac-cordingly, R&D productivity is determined by the relationship between techni-cal progress and R&D investment at various stages of development . For example,Du Pont, pursuing a later stage advance in nylon, was getting 0 .08 units of progressper $1 million of R&D investment . Its competitor, Celanese, then in the midstage
Limit
Slow Finish ;Reaches Limits
130
Richard N. Foster
RelativePerformance16-
Cumulative R&D EffortMillions of Constant Dollars
*An index used by tire cord customers to evaluate tire cordperformance when compared to the performance of cotton,which has a performance rating of 1 .0 .
FIGURE 2. S-curves in tire cord technologySource: McKinsey analysis .
of polyester development, was getting 0 .33 units of improvement per $1 million ofeffort, four times as much as Du Pont . 2 Also, polyester tire cord was already superiorto nylon, so Celanese was making faster progress on a better product . No companycan withstand such competition for long . As Celanese's victory over the redoubt-able Du Pont demonstrated, in technological contests the attacker often has a de-cisive economic advantage .
Sometimes, of course, market factors can actually cancel the day of reckoning .The end objective, after all, is not R&D productivity, but R&D return : the profitearned on the R&D investment . R&D productivity is only one of the two variablesdetermining R&D return ; the other is the profit made from a given technical ad-vance. This variable, which can be called the R&D yield, is a function of the com-petitive structure of the industry : supply/demand conditions, relative power ofcustomers and suppliers, company strategies, substitute products, external influ-ences, and so on .
0 - Introduction
Stage 2
Nylon 3
At Nylon
Super 2 Super 3 Rayon
Rayon
(Commercial Nylon Introduction-4ilitary Nylon Introduction
I50
75
100
125
150
Timing Technological Transitions
131
Decisions about which technology to work on and when to invest in it should bemade on the basis of returns, and should involve both productivity and yield . Ex-amining returns in terms of technological progress (productivity) and the economicvalue of that progress (yield) has organizational advantages, too . R&D productivityis determined largely by the R&D strategy and the efficiency of the R&D depart-ment in pursuing that strategy . Thus, controlling and improving R&D productivityis largely within the power of the R&D department. Yield, on the other hand, isthe result of market conditions and competitor strategies, subjects that are the tra-ditional responsibilities of the business units . R&D productivity and yield ultimatelyneed to be coupled, of course, but this is best done after they have been examinedindependently .
Breaking down returns into productivity and yield also provides a more precisesense of the sources of low returns . For returns to be high, both productivity andyield need to be substantial . If either is low, their product will be low . If productiv-ity is high and yield is low or negative, as it might be if there is a prospect for con-tinued overcapacity in the industry, then returns will be low or negative . Accord-ingly, projects in this area should not be pursued, despite substantial technicalpotential and high productivity . Nor do projects make sense where yield is substan-tial, but the technology is mature . The low productivity of the mature technologyindicates that little technical progress can be made . Investments in manufacturing,logistics, or marketing might be more productive . Companies that manage theirtechnology well have recognized these pitfalls, and learned to avoid them .
The Impact ofDiscontinuitiesBy focusing R&D on improving the performance of current technology, companieslimit themselves to evolutionary progress along a single S-curve until rapidly dimin-ishing returns signal the imminent approach of technical limits. In failing to inves-tigate the potential of new technologies, they often miss opportunities to exploitpowerful competitive leverage .
Such opportunities, however, are not always easy to grasp . Almost by definition,the S-curves of different technologies are not linked . The gaps that separate themare often both substantial and strategically important, and to manage the transi-tion is a difficult and delicate task .
The tire and cord technologies discussed previously, for example, are linked tobias-ply tires -a construction technology that has its own S-curve and its own tech-nological potential, which happens to be significantly less than that of the newerradial construction . Goodyear dung to its bias-ply construction, which was beatenout by the Michelin-backed radials, just as Du Pont, sticking to nylon, was bestedby Celanese . It is easier to detect a technological discontinuity from afar than it iswhen you are right in the middle of one .
One reason why it is so difficult to detect a technological discontinuity from theinside is that an existing competitor has more to lose with the introduction of a newtechnology, while a new entrant has little to lose and a great deal to gain . In tirecords, Du Pont felt it needed to protect its existing nylon plant assets . Celanese hadno such need; it only felt a need to utilize its new polyester facilities . The need to
132
Richard N. Foster
protect its assets may have helped Du Pont believe that polyester had little marketpotential . History shows that this was wishful thinking .
This blindness to the advantages of new technology has affected almost all indus-tries at one time or another . In electronics, the dramatic discontinuity seen in theshift from vacuum tubes to transistors was followed by a succession of further dis-continuities as transistors gave way to SSI, to LSI, and then to microprocessors . Inmetal packaging, the move from three-piece to two-piece cans represents an impor-tant discontinuity (the retort pouch may be another) . In each case, a technologicaldiscontinuity led to a competitive dislocation-and technology leaders becamelosers .
The essence of managing technology well, it seems, is the ability to make smoothand timely transitions to new technologies with superior performance improvementpotential-in other words, to cross discontinuities effectively . In many cases, thisability may be the only key to the problems of declining R&D productivity and de-teriorating competitive position . Superior operational efficiency in R&D can rarely,if ever, compensate for an inferior technical strategy .
Technological Myopia
Strategic errors, however, are not always to blame when a technology leader is over-taken by a competitor . Incorrect perceptions of technical limits, inability to mea-sure technological progress, faulty interpretation of market signals, and unrealisticfaith in "understanding customer needs" tend to mask the deterioration that sets inwhen an existing technology matures and the superior potential of an alternativebegins to affect the competitive balance .
Managements unaccustomed to thinking in terms of technological limits andsystematically measuring changes in technical performance almost always grosslyoverestimate the improvement potential of existing technology . It is tempting toassume that the rapid progress that occurs midway through the S-curve will con-tinue and, unless technical performance per se is carefully monitored, the gap be-tween reality and expectation is typically perceived too late-on a 10- or 20-yearS-curve, perhaps five to seven years too late .
Knowing when to investigate new technologies is certainly important . On a sym-metrical S-curve, half the potential for improving the technology typically remainsto be exploited when R&D productivity has reached its maximum . At the mid-point, the bugs are out of the system, cash flow has turned positive, and the busi-ness has begun to make a decent profit . It may seem economically perverse to begininvesting in a new technology when there is still a lot of potential left in the old .But since it can easily take five or 10 years to develop a new technology, this is oftenthe best time to begin the move by shifting the focus of R&D .
Managers intent on lowering break-even points and improving profits are nor-mally inclined to build bigger plants and spread their overhead over more products .They segment markets to squeeze maximum profit out of customer groups . Theywork to reduce fixed and overhead costs . All these measures help to maximize prof-its. And increasing profits tend, in turn, to justify further investment-especiallywhen decisions are based on accounting and financial criteria alone . Only when ag-
Timing Technological Transitions
133
gregate financial measures have been broken down into their components, is it pos-sible to distinguish between technological progress and economic returns, and gainreal insight into the underlying forces at work .
While R&D concentrates on extracting marginal improvements from old tech-nology, windows of opportunity open up for competitors . And, when a competitordoes move in with a new technology, the company's response is typically to increaseits investment in the old . But, in choosing to defend an existing technology, ratherthan displace it with a new one, management only increases the inherent economicadvantage of the attacker by enabling him to develop his product or process un-hampered by entrenched competitors .
When the first steamships were launched in the mid-19th century, establishedsailing-ship builders set about improving their design technology, and were build-ing vessels that carried more sail, had faster hulls, and required smaller crews . Butthe result was only a brief reprieve for a mature technology, not an escape from theS-curve . Thanks to the far greater technological potential of steamships, sails even-tually disappeared from the world's shipping lanes .
Sylvania, for another example, was hamstrung by this sailing-ship phenomenonwhen transistors made their commercial debut . Despite announced plans to moveinto solid-state technology, it kept on pouring R&D effort into increasingly sophis-ticated vacuum-tube designs, bringing out complex multi-functional units as lateas 1968 . Some evidence suggests that, despite Sylvania's public comments to thecontrary, the company still believed that the vacuum-tube had a future . For exam-ple, Sylvania was an active member of the Electron Tube Information Committee,which was established to explain the advantages of vacuum-tubes and the disad-vantages of solid-state devices to the public . In its efforts to wrest incremental per-formance improvement from its outmoded vacuum-tube technology, Sylvania gotaboard the solid-state S-curve too late with too little effort to become a force in thenew market .
Misreading Market Signals
The tendency to discount signs of market penetration by new competitors is an-other costly common error . New products are typically introduced in market nicheswhere they can be highly competitive -niches apparently too small or insufficientlyrelated to the core market to provoke an immediate competitive reaction from theindustry leader. Yet, even in a growing market, when the defending producer'ssales begin to level off, management often misreads this as a sign of predictablemarket maturation. And, as the substitution process gathers momentum, the com-pany's sales actually begin to sag . Finally, as the challenger penetrates deeply intoits heartland markets, sales collapse and profits swiftly deteriorate -almost beforethe defender realizes that the battle has begun . It is already too late .
Consider the pattern of substitution cases already mentioned . Polyester tire cordswent from a 20 to an 80% share of the bias-ply tire market in 10 years. Radials re-peated that market performance against bias-ply tires in four years, and steel tirecords took three years to go from 20 to 80% of the radial tire market . And, in elec-
134
RicbardN. Foster
tronics, transistors took seven years to displace vacuum tubes . In each case competi-tive leadership changed hands .
Part of the problem of recognizing a technological discontinuity is the problemof correctly defining the market . The more mature the product, the more narrowlythe market tends to be defined . In the mid-1960s, all tires were bias-ply tires . Hence,by definition, tire-cord makers measured their market performance in terms of theirshare of the bias-ply tire market . When radial tires entered, the leading tire cordmanufacturers should have redefined the market to include tires of any kind, ratherthan dismissing the radials as "niche fillers ." Too many businessmen fail to recog-nize that any new product-and particularly one based on new technology-po-tentially redefines the served market .
A final strategic pitfall in technology management is management's tendency towait for market research cues before committing funds to a new technology . Thereare three dangers in this perversion of the marketing concept . First, customers arerarely the best judges of potential utility of products that might require them to dothings differently ; change is painful . Second, the same market cues are available toall qualified suppliers, and the customer, once given the whip hand, can often playsuppliers off against one another to advantage, as Boeing has learned to do in theaerospace industry with its materials suppliers . Third, sustained competitive successdemands the ability to meet a market need in a unique way . In many businesses itis easy to copy a competitor's market research, but far less easy to copy its technol-ogy and harder still to copy its methods of developing new technology . Thus, acompany is far more likely to win a real competitive edge by superior technologicalprowess if the technical potential exists than through any unique knowledge ofmarket needs .
The Culture Trap
The most serious and most elusive impediments to effective technology manage-ment, however, are the fundamental cultural weaknesses that underlie the strategicerrors being discussed .
A company's product and production technology is an integral part of its cor-porate culture . Technology directs and conditions management's intuitive strategicresponses to opportunities ("can we make a profit on this?") . It conditions the as-sumptions on which the strategy of the business is based . When the technologychanges, the whole corporate culture frequently must change as well . And this is adifficult and painful process .
For electrical engineers designing vacuum tubes in the mid- 1950s, the transitionto solid-state technology was a real culture shock . To design solid-state devices, theyneeded to learn an entirely new technical discipline involving a different mathe-matics . Expert vacuum-tube designers don't necessarily become good solid-statedesigners . But, because there were enough similarities between the two fields, somevacuum-tube producers assumed that making the transition would not be particu-larly difficult .
Sometimes a cultural preference for established technology is explicitly built intothe management system; several major corporations still give top R&D priority to
Timing Technological Transitions
135
the defense of their existing product lines . The more doggedly they champion apolicy of unyielding technological defense, the more vulnerable to new technologythey become. Many R&D vice presidents, having earned their titles by successfullyguiding their companies into new technologies, are not disposed to abandon theirfavorites easily . Indeed, they often inadvertently block the investigation of new andthreatening technologies in the name of defending existing product lines .
Traditionally different industries have met technological challenges in differentways . Some observers see the emerging biochemical industry as a wave of the fu-ture. If they are correct, how well could established chemical manufacturers copewith the new technological environment? Consider just a few of the differences .
• The chemical business operates large plants whose capacities range from 100million to one billion pounds a year . Biochemical plants might be small,with typical annual capacities of perhaps from one million to 100 millionpounds .
•
Whereas chemical plants usually produce a single product, biochemicalproducts could be produced in multiproduct facilities .
•
Chemical processes are typically high-temperature operations . Biochemicalprocesses will probably take place at low temperatures, where the energyminimization experience of the chemical industry becomes much less rele-vant. Biochemical processes will require far tighter processes controls andheavier instrumentation than most chemical processes ; thus capital require-ments may well differ .
•
Biological sterility, generally unnecessary in the chemical industry, is an im-portant requirement in some biochemical processes .
Clearly, to capitalize on the opportunities in biochemicals, established chemicalcompanies would have to do many things differently . As centralized operations be-come decentralized, strategies, as well as organizational structures, might need tobe altered. Management systems might require revision with more authority givento people close to the market and the competition . With shrinking plant size, therole of the plant manager would diminish . New skills and staff needs would de-velop. New employees, coming from different colleges, universities and disciplines,would move in different cultural circles, and might even speak a different sociallanguage. All this would lead to changes in culture, shared values, and manage-ment style . The company emerging from such a metamorphosis might resemble itsformer self in little but name . This transition might be closer than some think .Presently about $1 billion is being spent on biotechnology R&D with perhaps 20%of this going to chemical applications . If the productivity of this work is five to tentimes that of conventional chemical R&D, not an uncommon ratio in other transi-tions, then the total technical programs expected from biochemical research couldbe on a par with the technical programs expected from all other chemical research .
Cultural barriers to successful technological transitions arc particularly difficult toovercome because they are qualitative rather than quantitative . Many managers areaccustomed to dealing with strategic issues by creating new research programs ordeveloping new measurement systems ; few have experience in changing the entirenature of their companies . But nothing less than that may be called for .
136
Richard N. Foster
Detecting Decay
Rather than wait passively for a competitive threat to develop, it is necessary for far-sighted management to head off technological decay by addressing the strategicand cultural issues as quickly as they can be detected and identified . A good way tobegin is to assess the company's proximity to its technical limits . Typically, certaintell-tale symptoms tend to signal the onset of technological decay :
•
A feeling among top managers that the company's R&D productivity is de-clining . Managements that don't measure technological progress have to relyon "gut feel" to know when the S-curve has flattened out . Unfortunately, bythe time the flattening can be felt, the game may be lost .
•
A trend toward missed R&D deadlines. Often interpreted as a sign that theR&D department is losing effectiveness, this may mean that the technologyis approaching its limits, thus making performance improvement more diffi-cult to achieve .
• A shift in the company or industry from product- to process-oriented R&D .As a technology approaches its limits, process improvements typically replaceproduct improvements as the chief source of technological innovation . Manyof our so-called "smokestack" industries are in this situation now . Paradox-ically, the best corrective action is a move into unfamiliar product technolo-gies or markets, a risky proposition at best .
•
An apparent loss ofproductivity in the R&D department . There is no roomfor creativity in a technology that is bumping up against its limits .
•
Dissension among the R&D staff A particularly frustrating assignment - forexample, dosing a small gap between the "state of the art" and the techno-logical limit-may turn scientists into pessimists . If the mood of the R&Dpeople is bad, the limits of the technology are probably dose .
•
A shift in the sources of sales growth toward narrower market segments . Aswe have seen, the final stages of a typical substitution pattern are often dom-inated by product-line proliferation to meet the needs of small market seg-ments . While this is usually a mandatory economic strategy, it does indicateincreasing maturity, and should, therefore, be taken as a signal to look fornew "S-curves" that could supersede the present technology .
•
A tendency for significant variations among competitors in R&D spendingto produce ever less significant results . When there is no market advantageto spending more, nor a market disadvantage to spending less, the technol-ogy has virtually reached its limits .
•
Dissatisfaction with the performance ofa "new broom "R&D manager. Some-times a chief executive, frustrated at his company's declining R&D perfor-mance, will replace the senior executive with a new, more vibrant R&Dmanager who is expected to shake the department up and get it going again .He will fail too, if the technology is close to its limits .
•
A trend among smaller, weaker competitors in the industry to invest R&Deffort in radical new approaches. A small company, particularly if it is finan-cially hard pressed, is more likely than an entrenched and profitable pro-ducer to invest in a really innovative solution to a customer's problem .
Timing Technological Tmnritions
137
Toward Effective Action
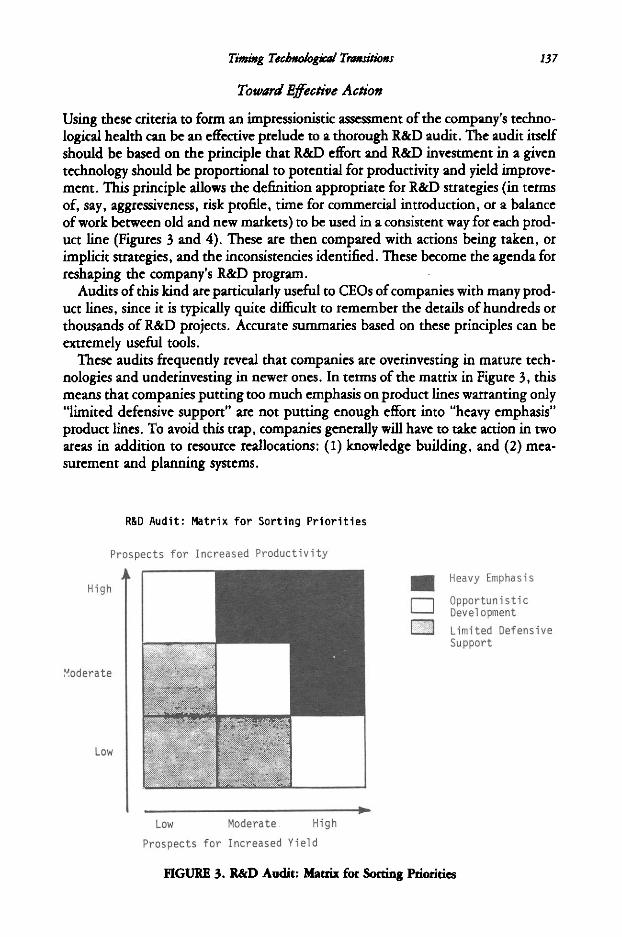
Using these criteria to form an impressionistic assessment of the company's techno-logical health can be an effective prelude to a thorough R&D audit . The audit itselfshould be based on the principle that R&D effort and R&D investment in a giventechnology should be proportional to potential for productivity and yield improve-ment . This principle allows the definition appropriate for R&D strategies (in termsof, say, aggressiveness, risk profile, time for commercial introduction, or a balanceof work between old and new markets) to be used in a consistent way for each prod-uct line (Figures 3 and 4) . These are then compared with actions being taken, orimplicit strategies, and the inconsistencies identified . These become the agenda forreshaping the company's R&D program .
Audits of this kind are particularly useful to CEOs of companies with many prod-uct lines, since it is typically quite difficult to remember the details of hundreds orthousands of R&D projects . Accurate summaries based on these principles can beextremely useful tools .
These audits frequently reveal that companies are overinvesting in mature tech-nologies and underinvesting in newer ones . In terms of the matrix in Figure 3, thismeans that companies putting too much emphasis on product lines warranting only"limited defensive support" are not putting enough effort into "heavy emphasis"product lines . To avoid this trap, companies generally will have to take action in twoareas in addition to resource reallocations : (1) knowledge building, and (2) mea-surement and planning systems .
R&D Audit : Matrix for Sorting Priorities
Prospects for Increased Productivity
High
Moderate
Low
Low
Moderate .
HighProspects for Increased Yield
0
FIGURE 3 . R&D Audit : Matrix for Sorting Priorities
Heavy EmphasisOpportunisticDevelopmentLimited DefensiveSupport
138
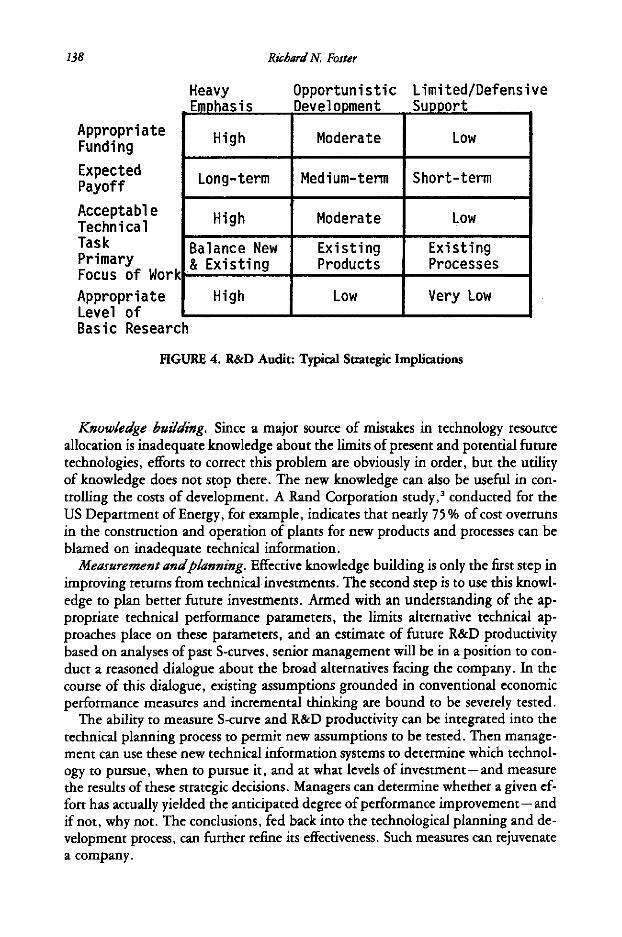
AppropriateFunding
ExpectedPayoff
AcceptableTechnicalTaskPrimaryFocus of Work
AppropriateLevel ofBasic Research
Heavy
Richard N. Foster
Opportunistic Limited/Defensivert
FIGURE 4. R&D Audit: Typical Strategic Implications
Knowledge building. Since a major source of mistakes in technology resourceallocation is inadequate knowledge about the limits of present and potential futuretechnologies, efforts to correct this problem are obviously in order, but the utilityof knowledge does not stop there . The new knowledge can also be useful in con-trolling the costs of development. A Rand Corporation study,' conducted for theUS Department of Energy, for example, indicates that nearly 75 % of cost overrunsin the construction and operation of plants for new products and processes can beblamed on inadequate technical information .
Measurement andplanning . Effective knowledge building is only the first step inimproving returns from technical investments . The second step is to use this knowl-edge to plan better future investments . Armed with an understanding of the ap-propriate technical performance parameters, the limits alternative technical ap-proaches place on these parameters, and an estimate of future R&D productivitybased on analyses of past S-curves, senior management will be in a position to con-duct a reasoned dialogue about the broad alternatives facing the company . In thecourse of this dialogue, existing assumptions grounded in conventional economicperformance measures and incremental thinking are bound to be severely tested .
The ability to measure S-curve and R&D productivity can be integrated into thetechnical planning process to permit new assumptions to be tested . Then manage-ment can use these new technical information systems to determine which technol-ogy to pursue, when to pursue it, and at what levels of investment -and measurethe results of these strategic decisions . Managers can determine whether a given ef-fort has actually yielded the anticipated degree of performance improvement -andif not, why not . The conclusions, fed back into the technological planning and de-velopment process, can further refine its effectiveness . Such measures can rejuvenatea company .
High Moderate Low
Long-term Medium-term Short-term
High Moderate Low
Balance New& Existing
ExistingProducts
ExistingProcesses
High Low Very Low
Timing Technological Transitions
139
Tuning in to Change
Radical technological change cuts away the company's base of technical and perhapsstrategic intuition . Leading through the resulting maze of shifting organizationalpriorities requires new management priorities as well .
In most US corporations today, the CEO is the final arbiter of technological choice .It is he who finally decides to reallocate resources from old to new technologies . It ishe who controls the pace of S-curve transitions, determining the rate of R&D fundstransfer, the rate at which capital spending is shifted to new technologies, the redi-rection of marketing efforts-even the reallocation of managers .
The chief executive, in fact, it the corporate manager of technology . Unfortu-nately, the job is difficult . Confronted by an R&D program composed of dozensor hundreds of individual projects, small and large, the CEO is likely to be baffledby the task of assessing the relative value of each and relating it to the company'sobjectives, particularly in areas of rapid technological change . Yet if he cannot as-sure himself that R&D will be effectively focused on the technical alternatives withthe greatest potential, he may be compromising the company's future .
The executive best qualified to aid the CEO is obviously the vice president incharge of R&D . But in too many US corporations this executive busies himself withmore functional tasks-within boundaries implicitly set by the chief executive-than with basic issues of technological choice . In a recent Conference Board survey 4
only one CEO in four named the R&D VP as a member of his inner circle . Some-thing will need to change here . Until the R&D vice president earns the CEO's fullconfidence, strategic changes in technology will be painful, and future competitive-ness in doubt .
Had such an executive been at Sylvania in the mid- 1950s, he might have recruitedmore solid-state engineers . Were he in charge of R&D at a major chemical companytoday, he might be busy hiring biochemists, setting them up in an independent fa-cility, and holding down investments in incremental improvement of conventionalproduct or process technologies .
The R&D VP will need to become well tuned to overall competitive strategy andcorporate options, and he may need to become more knowledgeable about cor-porate finance . He should establish a better working relationship with the top stra-tegic planner and with the company's financial officers so that he can better empa-thize with their problems . In short, he will need to think like a CEO .
The Need to Anticipate
Since the shift to a new technology may take a decade or more to complete, mostcompanies need to do a better job of anticipating technological development rela-tively far in advance . In short, they need a distant early warning capability .
In the mid-1930s, for example, Mervin Kelly, then research director of Bell Lab-oratories, projected telephone switching needs ahead to the early 1960s . He foundthat, with the current mechanical relay technology, an impossibly huge number ofswitches would be needed to support the future telephone network . This meantthat a new technology would be needed . Kelly hypothesized that it might emerge
140
RicbardN. Foster
from the new science of quantum mechanics . Accordingly, after World War II, helaunched an R&D project to develop a quantum-mechanical amplifier . Bell Lab-oratories developed the first transistors in 1947; by 1955, transistors were an item ofcommerce. The whole process had taken 20 years (with 10 years out for the war) .'
Development activities must be planned, funded, started, supported, and oftencompleted before existing measurement systems can accurately predict their ulti-mate economic benefits for the company . But the rewards of anticipating future re-quirements are exceeded only by the costs of ignoring them .
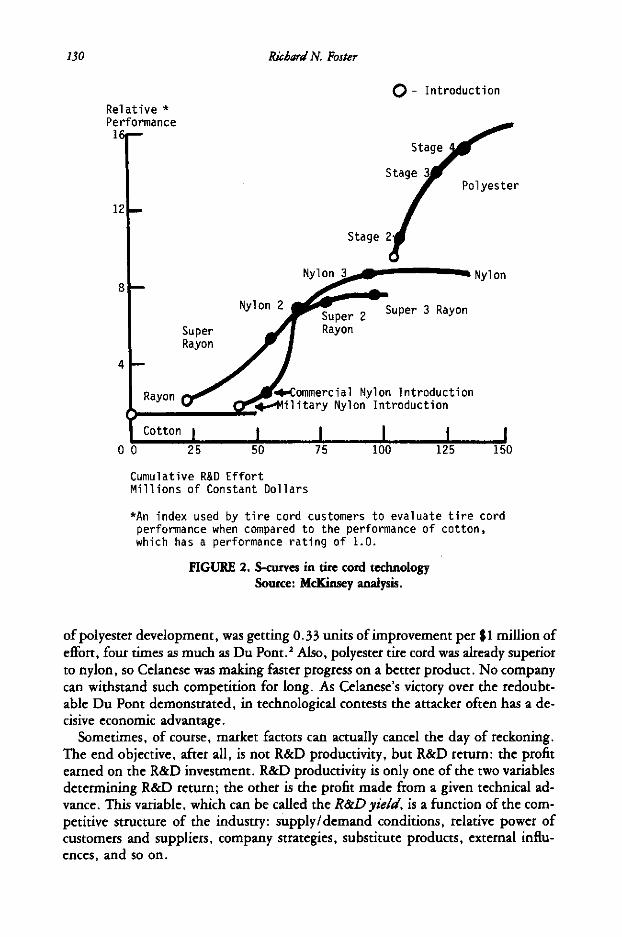
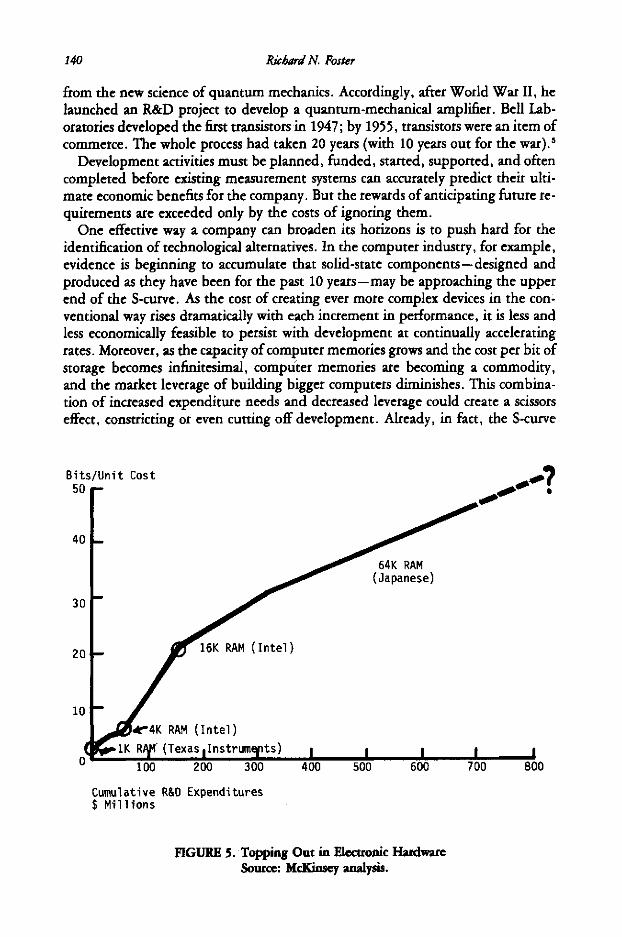
One effective way a company can broaden its horizons is to push hard for theidentification of technological alternatives . In the computer industry, for example,evidence is beginning to accumulate that solid-state components -designed andproduced as they have been for the past 10 years -may be approaching the upperend of the S-curve. As the cost of creating ever more complex devices in the con-ventional way rises dramatically with each increment in performance, it is less andless economically feasible to persist with development at continually acceleratingrates. Moreover, as the capacity of computer memories grows and the cost per bit ofstorage becomes infinitesimal, computer memories are becoming a commodity,and the market leverage of building bigger computers diminishes . This combina-tion of increased expenditure needs and decreased leverage could create a scissorseffect, constricting or even cutting off development . Already, in fact, the S-curve
*4K RAM (Intel)1K R{,M ( Texas 1 lnstrumyts )
I100
200
300
400
Cumulative R&D Expenditures$ Millions
FIGURE 5 . Topping Out in Electronic HardwareSource: McKinsey analysis.
Timing Technological Transitions
141
for random access memory chips (DRAMs) is exhibiting the classic phenomenon ofdiminishing returns (Figure 5), and many companies have already dropped out ofthe game .
As a result, it seems that the leverage in computer development is shifting fromhardware to software, where no such diminishing returns are in sight . Monumentalchanges will accompany the transition . Manufacturing, always important in thecomputer hardware industry, may lose its place in the sun . Software manufacturersmay already be beginning to embrace a strategy of creating only a few copies ofeach new design for distribution through telecommunications networks to the cus-tomers' own computers . With such an arrangement, the manufacturing processwould take place, in a sense, on the customers' premises . The marketing managerwould become a total business manager, controlling not only the sales of the prod-uct, but its manufacture and distribution as well .
Who would be most likely to survive such fundamental changes -the large hard-ware manufacturers, like IBM, Siemens, and Fujitsu, where manufacturing is anentrenched and powerful corporate function, or the smaller companies that nowdominate the software industry? It may be hard to imagine anyone challengingIBM's preeminent position in the computer industry . But it was just as hard toimagine in 1955 that a little company called Texas Instruments would be a domi-nant force in electronics 10 years later . In the history of technological change, how-ever, such revolutions are not rare . Companies that anticipate them, by continuallyinvestigating new alternatives and responding boldly to new challenges, are hand-somely rewarded .
Notes
1. Robert W. Keyes, "Physical Limits in Semiconductor Electronics," Science, Match 18, 1977, pp . 1230-1235 .2 . McKinley analysis based on industry interviews .3 . Merrow, E.W. et d., "Understanding Cost Growth and Performance : Shortfalls in Pioneer Process Plants,"
RAND Corporation Report R-2569 (1981) .4. "Who Is Top Management?," The Conference Board, Report no . 821 (1982) .5 . Based on conversations with Bell Laboratories executives . For more on the development of the transistor, see
Jeremy Bemstein, Three Degrees Above Zero (New York: Charles Scribnei s Sons, 1984), especially p . 119-